Embed Size (px)
Citation preview

www.washcluster.info 1
WASH BASELINE BARANGAY ASSESSMENT
TYPHOON HAIYAN, PHILIPPINES
Phase I : Interim Technical Report
April 2014
Phase I Wash Baseline Assessment - Philippines - April 2014
http://philippines.humanitarianresponse.info/ 2
CONTENTS
Figures and Tables ............................................................................................................................................................. 3
Geographic Classifications ................................................................................................................................................ 3
Acronyms and Abbreviations ............................................................................................................................................ 4
Acknowledgements ............................................................................................................................................................ 5
1. INTRODUCTION ...................................................................................................................................................... 6
1.1 Context .................................................................................................................................................................. 6
1.2 Assessment Objectives ......................................................................................................................................... 6
2. METHODOLOGY ..................................................................................................................................................... 7
2.1 Blanket assessment methodology ....................................................................................................................... 7
2.1.1 Selection of Municipalities for Assessment ............................................................................................................... 7
2.1.2 Selection of Barangays within Municipalities ............................................................................................................ 7
2.1.3 Geographic Information Systems and Mapping ........................................................................................................ 9
2.1.4 Questionnaire Tool Design ....................................................................................................................................... 9
2.2 Mixed-method Data Collection............................................................................................................................ 10
2.2.1 Key Informant Interview .......................................................................................................................................... 10
2.2.2 Data Representativeness, Extrapolation and Limitations ....................................................................................... 12
3. KEY FINDINGS ...................................................................................................................................................... 13
3.1 Water Access ....................................................................................................................................................... 14
3.2 Local WASH Committees .................................................................................................................................... 15
3.3 Sanitation Access and Open Defecation Practices .......................................................................................... 16
3.4 WASH Emergency Assistance ............................................................................................................................ 17
4. WASH INTENTION SURVEY................................................................................................................................. 19
4.1 Water and Sanitation ........................................................................................................................................... 19
4.2 WASH Software .................................................................................................................................................... 20
4.3 Vector Control ...................................................................................................................................................... 20
4.4 Waste Management ............................................................................................................................................. 20
5. TECHNICAL DESCRIPTIONS ............................................................................................................................... 21
5.1 Demographics ...................................................................................................................................................... 21
5.2 Water Supply Systems ........................................................................................................................................ 24
Phase I Wash Baseline Assessment - Philippines - April 2014
http://philippines.humanitarianresponse.info/ 3
4.3 Sanitation .............................................................................................................................................................. 28
4.4 Emergency Assistance Post Haiyan .................................................................................................................. 29
6. BASELINE RESULTS ............................................................................................................................................ 31
7. CONTACT DETAILS AND ANNEXES ................................................................................................................... 35
FIGURES AND TABLES
Figure 1: REACH enumerators conducting their interviews with visual aids to display the different water supply systems to the key informant
Figure 2: Communal toilets provided during the emergency phase and at present still implemented by some WASH Partners
Figure 3: Example of freely available online information for DRR approaches, example area used Palo area, Leyte province
Map 1: Municipalities targeted by Phase I Wash Cluster Assessment
Map 2: Map of poverty incidence in 2012 (left), map of poverty threshold (right).
Map 3: April 2014 Population numbers per municipality
Map 4: Municipalities reporting land tenure an issue for latrine construction
Table 1: Target municipalities with the number of Barangays assessed
Table 2: Key findings for water access
Table 3: Level I and Unprotected Water Sources access per province
Table 4: Sanitation gaps and hygiene practices at present
Table 5: Summary of the KI feedback at provincial level regarding humanitarian assistance
Table 6: Intentions of WASH actors on their upcoming programmes
Table 7: Temporal and Urban/Rural differences in Water Treatment at HH level
Table 8: Bacterial analysis of different source of drinking water
Table 9: Contradictory terminology utilized to identify water sources in water analysis campaigns
Table 10: Municipality breakdown of availability to infrastructure - Part 1
Table 11: Municipality breakdown of availability to infrastructure - Part 2
Table 12: Municipality breakdown of sanitation conditions
Table 13: Municipality breakdown of assistance reportedly to be received
GEOGRAPHIC CLASSIFICATIONS
Region: Highest form of governance below the national level
Province: Composed of several municipalities and composite cities
City: Maybe classified as composite or highly urbanized; also consisting of several barangays;
population of not less than 150,000. Composite cities are under the Provincial Government
while highly urbanized cities are reporting directly to the region.
Phase I Wash Baseline Assessment - Philippines - April 2014
http://philippines.humanitarianresponse.info/ 4
Municipality: Consisting of a group of Barangays, it serves primarily as a general purpose government for
the coordination and delivery of basic, regular and direct services and effective governance of
the inhabitants within its territorial jurisdiction.
Barangay: A Barangay is the basic political unit of the Philippines and it serves as the primary planning
and implementing unit of government policies, plans, programs, projects, and activities in the
community, and as a forum wherein the collective views of the people may be expressed,
crystallized and considered, and where disputes may be amicably settled. As provided by law,
it should have a population of at least two thousand (2,000) inhabitants as certified by the
National Statistics Office.
ACRONYMS AND ABBREVIATIONS
DPWH Department of Public Works and Highways
DOH Department of Health
DROMIC Disaster Response Operations Monitoring and Information Centre
DRR Disaster Risk Reduction
GIS Geographical Information Systems
GoP Government of Philippines
HH Household
HLP Housing Land and Property
KII Key Informant Interview
LI Level One Water Supply System (Point source systems)
LII Level Two Water Supply System (Communal systems)
LIII Level Three Water Supply System (Piped water systems)
LWUA Local Water Utilities Administration
MGB Mines and Geosciences Bureau
NBZ No Build Zone
NDRRMC National Disaster Risk Reduction and Management Council
NDZ No Dwelling Zone
NEDA National Economic and Development Authority
NSCB National Statistical Coordination Board
NWRB National Water Resources Board
ODK Open Data Kit
PDO Planning and Development Office (provincial/city/municipal)
PAR Philippines Area of Responsibility
i-RAT Inter Agency Rapid Assessment Team (Global WASH Cluster)
WASH Water, Sanitation and Hygiene
WSS Water Supply System
Phase I Wash Baseline Assessment - Philippines - April 2014
http://philippines.humanitarianresponse.info/ 5
ACKNOWLEDGEMENTS
On behalf of the Philippines National WASH cluster, I would like convey my sincere thanks and gratitude to everyone who facilitated and contributed to the completion of this survey. Special thanks are offered to the Rapid Assessment Team (RAT) who led the conduct of this study in close coordination with WASH Cluster Coordinators and Information Managers. This was made possible by the immediate response of the Global WASH Cluster to our request for the deployment of the Inter-agency RAT team. Special thanks too to the REACH group for the deployment of their specialists and their team of local survey enumerators and supporting staff for their enthusiasm and good work. Their professionalism and tireless efforts in provision of technical support particularly during the initial design phase, data collection and subsequent analytical stages of the report have been invaluable. I also extend my appreciation to UNICEF and World Vision for facilitating the institutional and financial arrangements that made this project possible in record time. I would also like to express gratitude to the different cluster partners such as ACTED, OXFAM GB and IFRC for hosting the two RAT members and providing them with all necessary logistic and administration support during their stay in the field and for the others who contributed in the cluster’s intention survey. Finally, I would like to thank the Regional Director of Health, WASH Focal Points at the regional, provincial, city and municipal level and the Barangay Captains, for their warm welcome and cooperation in developing the questionnaire, facilitating the local arrangements and responding in the survey. This baseline provides valuable data moving forward in the response for both coordination and programmatic design. This is the first time that the WASH Cluster engaged the RATs and the REACH team to help re-establish the new baseline post –Typhoon and past the initial phase of the humanitarian response. This is also the first time that the Philippine WASH Cluster managed to use technology to gather relatively good data over a large geographic expanse in a relatively short period of time. The survey has demonstrated the potential to collect quality information in a timely method over an expansive geographic area and the WASH Cluster looks forward to building on this experience to inform future emergencies. We hope that the cluster partners will find this report useful and relevant. This is only Phase I, covering 30 municipalities across Cebu, Leyte and Western Samar. Phase II is underway and the intention of the cluster is to fully cover all the barangays of all target municipalities. This is part of our modest efforts to inform our partners of the current status, needs, responses and gaps that still remain to be addressed. Rory Villaluna National WASH Cluster Coordinator 4 May 2014
Phase I Wash Baseline Assessment - Philippines - April 2014
http://philippines.humanitarianresponse.info/ 6
1. Introduction
This document has been designed in conjunction with the Philippines WASH Cluster and the Inter-Agency Rapid
Assessment Team (i-RAT) to provide a technical guide to better inform, assist and support WASH actors in the
Central Philippines for current and future interventions using baseline data collected by the REACH team.
1.1 CONTEXT
At 10:00 on 6 November Typhoon Haiyan (named Yolanda locally) entered the Philippines Area of Responsibility
(PAR). The typhoon intensified as it entered the Eastern Visayas region, first making landfall over Guiuan on 8
November at 04:40. By 08:00 on 8 November the typhoon had made landfall six times across the Central
Philippines. Continuing to weaken over the West Philippine Sea, Typhoon Haiyan left the PAR on 9 November at
15:30.
On 5 December, the Government of the Philippines (GoP) through its Disaster Response Operations Monitoring
and Information Centre (DROMIC) reported that a total of 13,067,342 individuals across 10,701 Barangays in the
Central Philippines were affected by Typhoon Haiyan. Of the affected population, a total of 4,000,965 individuals
were displaced by Haiyan; with 94,310 displaced to formal evacuation centres, and 3,906,654 displaced in other
locations (26/11/2013). DROMIC currently reports 1,127,041 houses as having been damaged, of which 548,793
were totally destroyed by the typhoon (DSWD 17/12/13).
Through standing partnerships within the WASH cluster, REACH and the WASH Rapid Assessment Team
(RAT) jointly conducted a 9 day WASH baseline assessment across 30 municipalities by collecting and mapping
data across Central Philippines. The present report will provide a quick overview of the assessment undertaken,
explain the technical terminology, and how best to utilise and build upon the WASH sector findings. A second
phase of the assessment covering an additional 50 municipalities commenced on 2 May.
Further data analysis will be included in the report issued after Phase 2 considering rural/urban and
coastal/inland comparisons. This baseline data will now be linked with the Cluster 3W data to facilitate a more in
depth gap analysis.
1.2 ASSESSMENT OBJECTIVES
The overall objective of the assessment (Phase 1):
To conduct a WASH baseline assessment across 30 municipalities affected by Typhoon Haiyan in order to
inform response planning and the allocation of resources.
The specific objectives are:
1. The completion of an assessment that provides information for WASH infrastructure, sanitation, assistance
and updated demographic information for the Central Philippines in the aftermath of Typhoon Haiyan;
2. The dissemination of WASH related data in a digestible format (raw data, aggregated data and maps) for
both field and international level to support a planned and coordinated early recovery response orientated
for WASH needs in the Central Philippines.
Phase I Wash Baseline Assessment - Philippines - April 2014
http://philippines.humanitarianresponse.info/ 7
2. Methodology
This section describes the methodology that was developed and implemented during Phase I of the WASH
baseline. The assessment methodology below outlines (a) the "blanket" strategy designed specifically for the
assessment; (b) the data collection process, including an overview of data collection methods and tools; and (c)
the representativeness and limitations of the data collected.
2.1 BLANKET ASSESSMENT METHODOLOGY
In order to give a complete picture of the WASH situation in the Philippines affected regions 5 months after
typhoon Haiyan, a key informant network was developed to conduct blanket coverage assessment of all
barangays in the target municipalities, 1181 and 30, respectively. Obtaining full coverage creates a complete and
representative picture of the WASH situation (needs/gaps) per municipality or individually at barangay level.
Rather than using a statistically significant sampled approach where results are displayed solely as percentages,
full coverage across all barangays makes it possible to use both relative numbers and percentages, therefore
aiding later planning and interventions. The blanket approach ensures that different municipalities and barangays
can be identified individually as there is an independent data set for all target areas. All data will be analysed as
an aggregate to municipality level1 in section 3, however all barangay data can be found in annex 1.
2.1.1 Selection of Municipalities for Assessment
The selection of the municipalities for Phase I was based on affected population, presence of WASH partners
involved in the WASH emergency response and existing assessment data. Sample size was limited by the time
available to feed into the 6-month review, and is limited to Leyte, Samar and Cebu Provinces. The remaining
Haiyan affected municipalities that have been covered to some extent by the WASH response have been
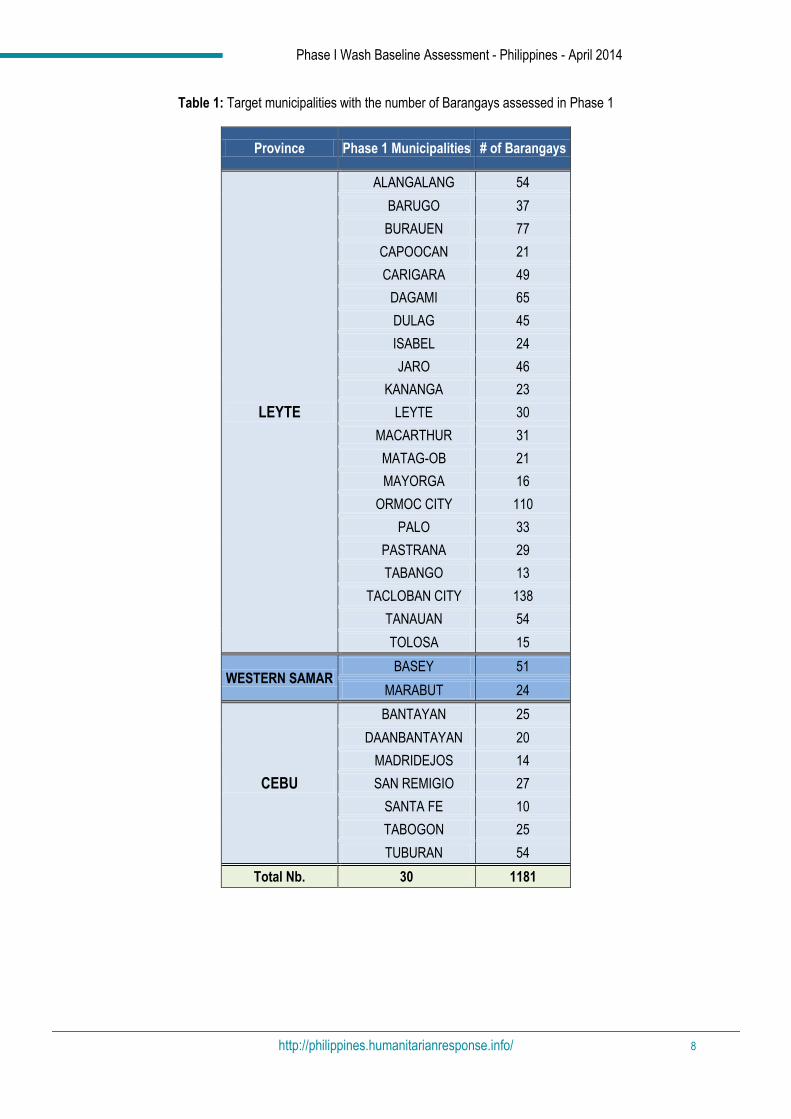
included in Phase 2. Table 1 below provides a list of the 30 municipalities selected for the Phase 1 assessment
and the corresponding number of barangays assessed.
2.1.2 Selection of Barangays within Municipalities
In all selected municipalities, every barangay was assessed producing a complete dataset per municipality.. In
total 1181 barangays were collected over a 9 day period with 100% coverage as agreed upon by the WASH
Cluster and RAT team.
1 In addition to barangay level, and the provision of the raw dataset
Phase I Wash Baseline Assessment - Philippines - April 2014
http://philippines.humanitarianresponse.info/ 8
Table 1: Target municipalities with the number of Barangays assessed in Phase 1
Province Phase 1 Municipalities # of Barangays
LEYTE
ALANGALANG 54
BARUGO 37
BURAUEN 77
CAPOOCAN 21
CARIGARA 49
DAGAMI 65
DULAG 45
ISABEL 24
JARO 46
KANANGA 23
LEYTE 30
MACARTHUR 31
MATAG-OB 21
MAYORGA 16
ORMOC CITY 110
PALO 33
PASTRANA 29
TABANGO 13
TACLOBAN CITY 138
TANAUAN 54
TOLOSA 15
WESTERN SAMAR BASEY 51
MARABUT 24
CEBU
BANTAYAN 25
DAANBANTAYAN 20
MADRIDEJOS 14
SAN REMIGIO 27
SANTA FE 10
TABOGON 25
TUBURAN 54
Total Nb. 30 1181
Phase I Wash Baseline Assessment - Philippines - April 2014
http://philippines.humanitarianresponse.info/ 9
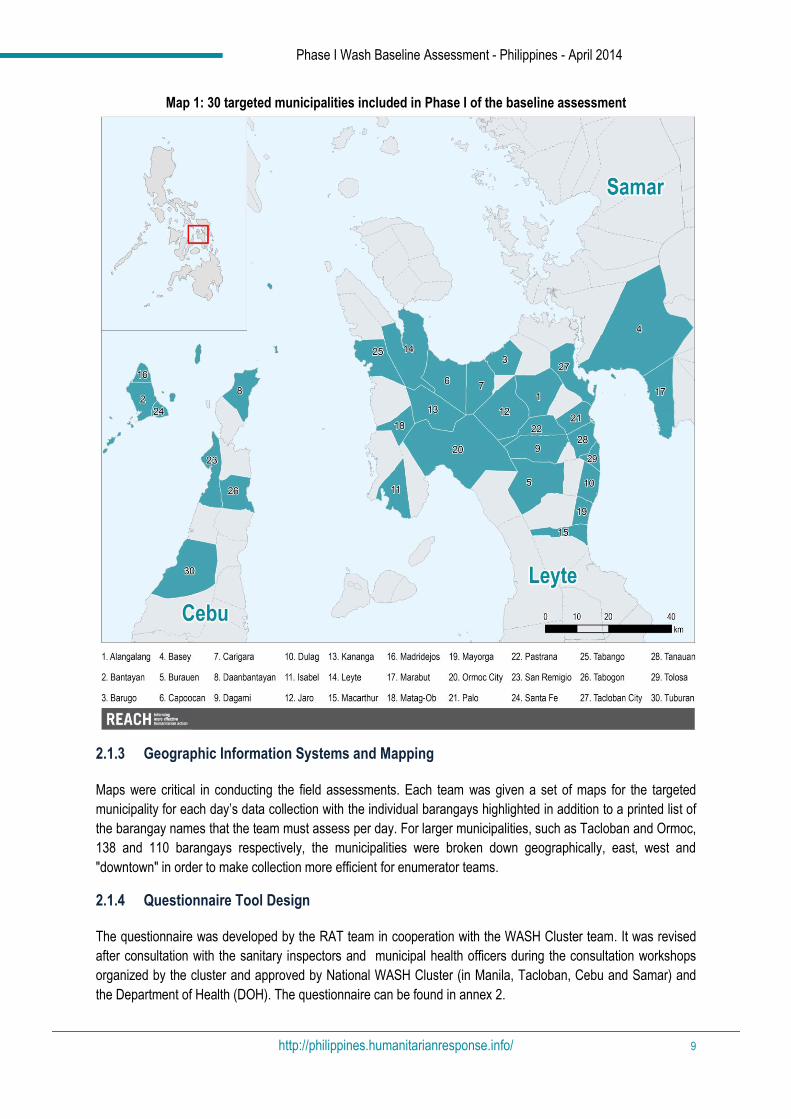
Map 1: 30 targeted municipalities included in Phase I of the baseline assessment
2.1.3 Geographic Information Systems and Mapping
Maps were critical in conducting the field assessments. Each team was given a set of maps for the targeted
municipality for each day’s data collection with the individual barangays highlighted in addition to a printed list of
the barangay names that the team must assess per day. For larger municipalities, such as Tacloban and Ormoc,
138 and 110 barangays respectively, the municipalities were broken down geographically, east, west and
"downtown" in order to make collection more efficient for enumerator teams.
2.1.4 Questionnaire Tool Design
The questionnaire was developed by the RAT team in cooperation with the WASH Cluster team. It was revised
after consultation with the sanitary inspectors and municipal health officers during the consultation workshops
organized by the cluster and approved by National WASH Cluster (in Manila, Tacloban, Cebu and Samar) and
the Department of Health (DOH). The questionnaire can be found in annex 2.
Phase I Wash Baseline Assessment - Philippines - April 2014
http://philippines.humanitarianresponse.info/ 10
2.2 MIXED-METHOD DATA COLLECTION
The WASH baseline assessment included three components of data collection and analysis: (a) review of
secondary data made available by national and regional government bodies and humanitarian agencies
regarding WASH activities led by the RAT team; (b) Key Informant Interviews led by the REACH team; (c)
Geographic Information Systems (GIS) and mapping of all collected and analysed data.
2.2.1 Key Informant Interview
The primary method of data collection was a key informant interview with the barangay captain when possible.
When the barangay captain was not available the barangay councillor was commonly the interviewee2. The
general methodology was that the teams would first visit the individual municipalities to obtain a list of the
barangay captains per that given municipality. A team of REACH telecommunication officers would individually
contact the barangay captains to arrange a meeting in a centralised location (commonly the municipality hall)
where all the barangay captains would be asked to attend. The enumerators would conduct face-to-face
interviews individually with each of the barangay captains, one enumerator per one key informant. Therefore if 20
captains/key informants attended the meeting, then 20 individual interviews would have been conducted. As
Phase I was conducted over the Easter vacation week in the last 2 weeks of April 2014, the attendance of the
barangay captains varied, with sometimes there being an 85% attendance rate, and sometimes there being a
20% attendance rate. Therefore, when all attendees of the pre-arranged meeting had been interviewed, then
using the maps and barangay lists, the team leader would delegate n number of barangays to each enumerator.
The team would then individually disperse and travel individually to the given barangay(s) in order to conduct the
remaining interviews for that municipality. When access/time constraints occurred then the REACH
telecommunication team would phone the remaining key informants from the provided municipality list. Face-to-
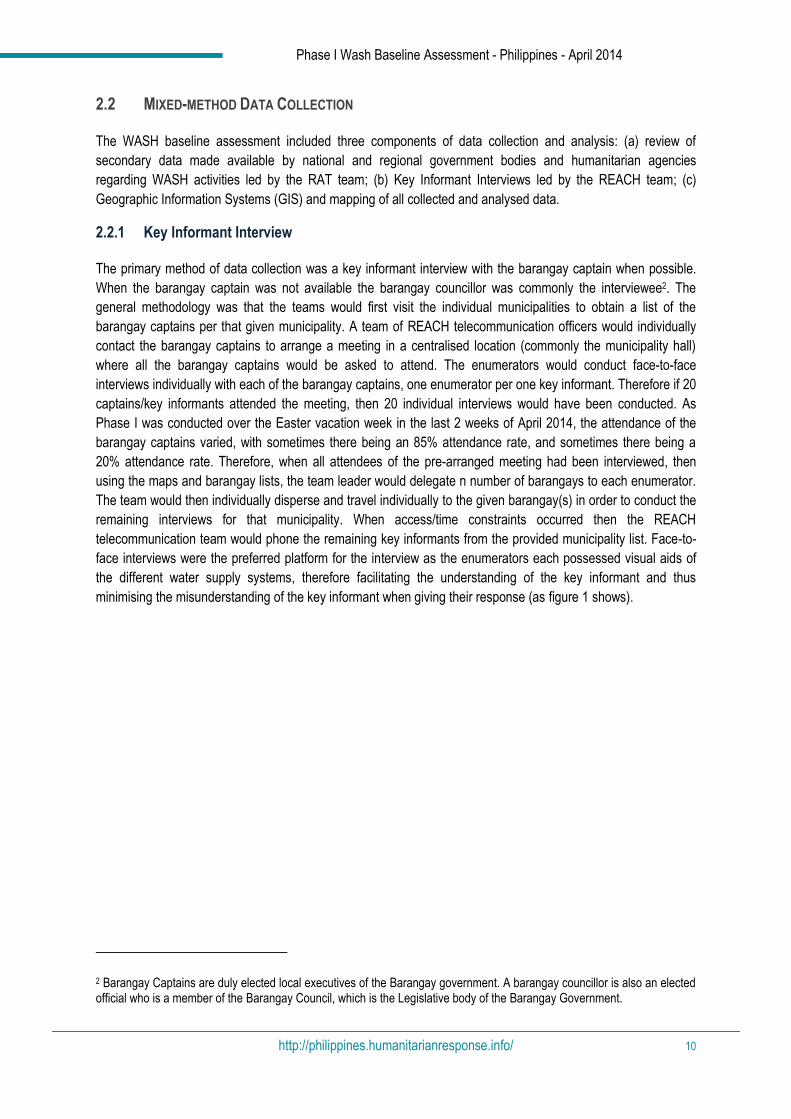
face interviews were the preferred platform for the interview as the enumerators each possessed visual aids of
the different water supply systems, therefore facilitating the understanding of the key informant and thus
minimising the misunderstanding of the key informant when giving their response (as figure 1 shows).
2 Barangay Captains are duly elected local executives of the Barangay government. A barangay councillor is also an elected official who is a member of the Barangay Council, which is the Legislative body of the Barangay Government.
Phase I Wash Baseline Assessment - Philippines - April 2014
http://philippines.humanitarianresponse.info/ 11
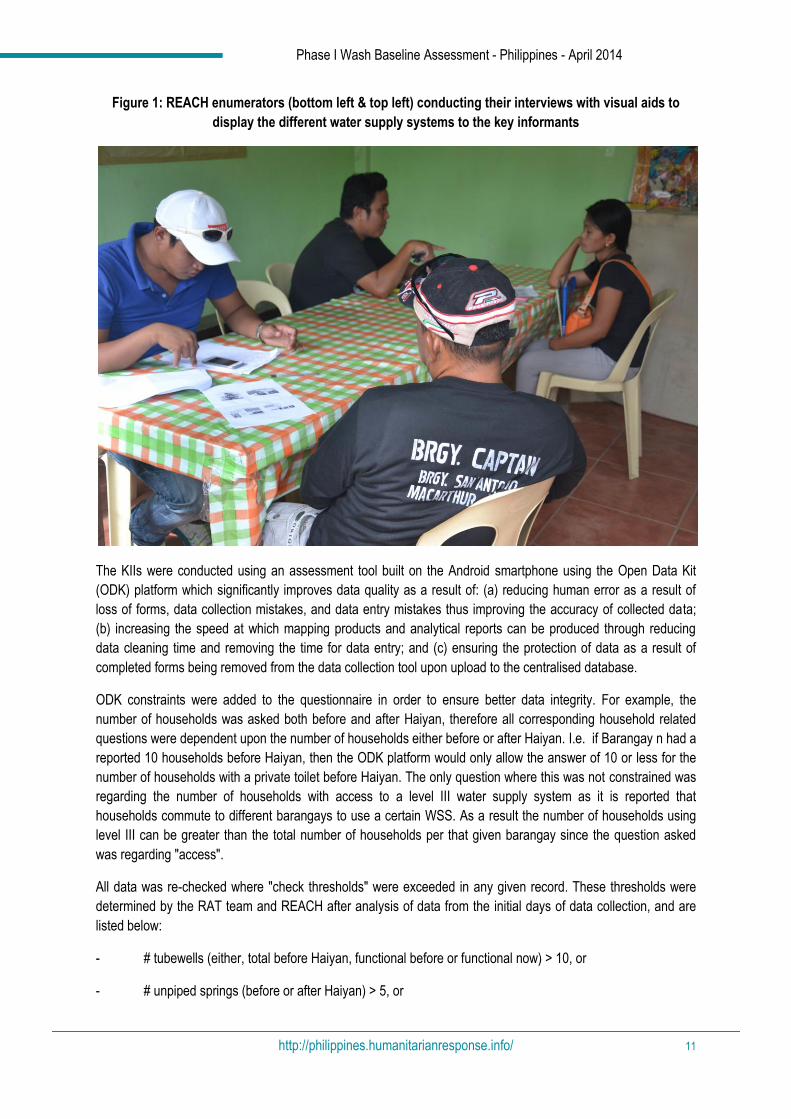
Figure 1: REACH enumerators (bottom left & top left) conducting their interviews with visual aids to
display the different water supply systems to the key informants
The KIIs were conducted using an assessment tool built on the Android smartphone using the Open Data Kit
(ODK) platform which significantly improves data quality as a result of: (a) reducing human error as a result of
loss of forms, data collection mistakes, and data entry mistakes thus improving the accuracy of collected data;
(b) increasing the speed at which mapping products and analytical reports can be produced through reducing
data cleaning time and removing the time for data entry; and (c) ensuring the protection of data as a result of
completed forms being removed from the data collection tool upon upload to the centralised database.
ODK constraints were added to the questionnaire in order to ensure better data integrity. For example, the
number of households was asked both before and after Haiyan, therefore all corresponding household related
questions were dependent upon the number of households either before or after Haiyan. I.e. if Barangay n had a
reported 10 households before Haiyan, then the ODK platform would only allow the answer of 10 or less for the
number of households with a private toilet before Haiyan. The only question where this was not constrained was
regarding the number of households with access to a level III water supply system as it is reported that
households commute to different barangays to use a certain WSS. As a result the number of households using
level III can be greater than the total number of households per that given barangay since the question asked
was regarding "access".
All data was re-checked where "check thresholds" were exceeded in any given record. These thresholds were
determined by the RAT team and REACH after analysis of data from the initial days of data collection, and are
listed below:
- # tubewells (either, total before Haiyan, functional before or functional now) > 10, or
- # unpiped springs (before or after Haiyan) > 5, or
Phase I Wash Baseline Assessment - Philippines - April 2014
http://philippines.humanitarianresponse.info/ 12
- # LII WSS (before or after Haiyan) > 5
Using the collected telephone numbers from the key informants representing the barangay in question, the
REACH telecommunication team called back to check whether the data was correct. If correct, the database
remained unchanged, if different (data entry mistake, poor knowledge of question, misunderstanding of question)
then the database was updated.
2.2.2 Data Representativeness, Extrapolation and Limitations
The dataset was designed to provide the WASH Cluster and other humanitarian actors responding to the needs
with a complete and representative picture of the April 2014 WASH situation to better support intervention and
programming.
The methodology was designed for the extrapolation of findings at either barangay level or aggregation to
municipality/provincial level as all barangays within a municipality have been surveyed. For instance, the level
and types of assistance reported to be received will be displayed as a % for the municipality, based on the
number of barangays that said either yes/ongoing or no to a certain assistance type. Once the reader has
identified a municipality of interest, then all raw data for individual barangays can be further explored in annex 1.
This way the report is aimed at acting as a guide to better understand the current needs and gaps for potential
future WASH responses across the different administration levels.
A limitation for this assessment is that it is dependent upon the strength of the knowledge of the key informant
interviewed. As previously mentioned, the barangay captain was the favoured interviewee for the assessment,
however it was noticed that the resolution of the captains knowledge varied, therefore impacting the quality of the
data. The knowledge and understanding of the captains/councillors will dictate the margin of error in the data,
and before intervention, a follow up assessment should be undertaken by implementing agencies. It must be
noted, that all data over a certain threshold was later doubled checked using a phone call follow up as previously
mentioned.
Phase I Wash Baseline Assessment - Philippines - April 2014
http://philippines.humanitarianresponse.info/ 13
3. Key findings
The figures provided via key informant interviews (KIIs) needs to be contextualized within the pre-Haiyan WASH
services coverage in regions VI, VII and VIII.
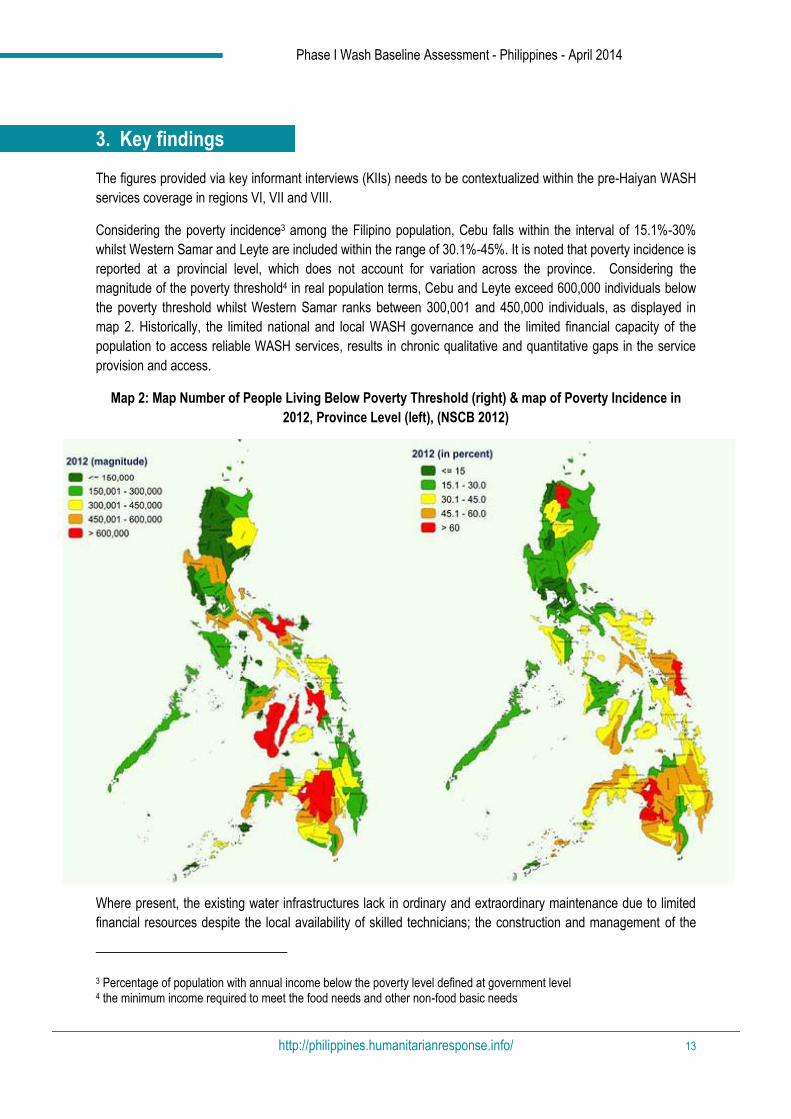
Considering the poverty incidence3 among the Filipino population, Cebu falls within the interval of 15.1%-30%
whilst Western Samar and Leyte are included within the range of 30.1%-45%. It is noted that poverty incidence is
reported at a provincial level, which does not account for variation across the province. Considering the
magnitude of the poverty threshold4 in real population terms, Cebu and Leyte exceed 600,000 individuals below
the poverty threshold whilst Western Samar ranks between 300,001 and 450,000 individuals, as displayed in
map 2. Historically, the limited national and local WASH governance and the limited financial capacity of the
population to access reliable WASH services, results in chronic qualitative and quantitative gaps in the service
provision and access.
Map 2: Map Number of People Living Below Poverty Threshold (right) & map of Poverty Incidence in
2012, Province Level (left), (NSCB 2012)
Where present, the existing water infrastructures lack in ordinary and extraordinary maintenance due to limited
financial resources despite the local availability of skilled technicians; the construction and management of the
3 Percentage of population with annual income below the poverty level defined at government level 4 the minimum income required to meet the food needs and other non-food basic needs
Phase I Wash Baseline Assessment - Philippines - April 2014
http://philippines.humanitarianresponse.info/ 14
sanitation facilities are left to households initiative, despite the existing – but often contradictory – standards and
regulations. Consequently, lack of adequate and appropriate WASH access can be chronic public health
challenges which can be further exacerbated during environmental disasters and environmental and public
health emergencies.
The first phase of the WASH Baseline Survey has investigated 1,181 barangays in Cebu Province (175), Leyte
Province (931) and in Western Samar (75), with the provincial level findings discussed below. For the purposes
of this study Tacloban City and Ormoc City have been grouped with the provincial aggregates of Leyte. Data for
each city is available upon request.
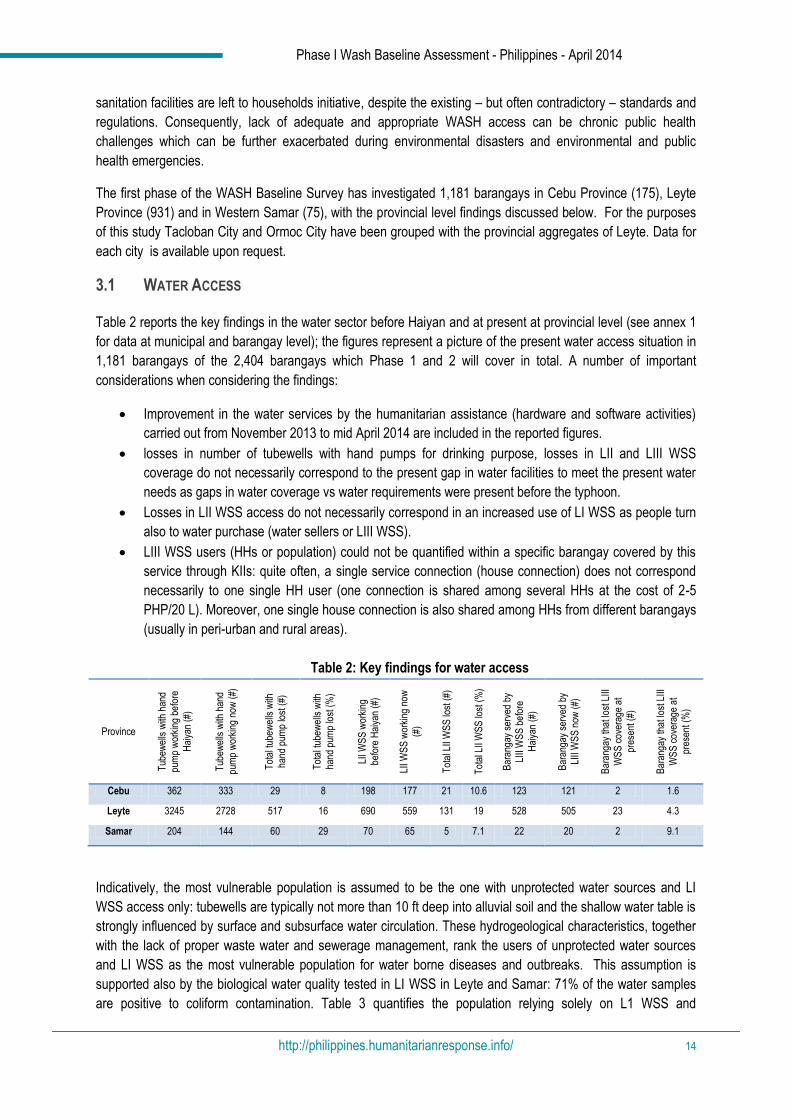
3.1 WATER ACCESS
Table 2 reports the key findings in the water sector before Haiyan and at present at provincial level (see annex 1
for data at municipal and barangay level); the figures represent a picture of the present water access situation in
1,181 barangays of the 2,404 barangays which Phase 1 and 2 will cover in total. A number of important
considerations when considering the findings:
Improvement in the water services by the humanitarian assistance (hardware and software activities)
carried out from November 2013 to mid April 2014 are included in the reported figures.
losses in number of tubewells with hand pumps for drinking purpose, losses in LII and LIII WSS
coverage do not necessarily correspond to the present gap in water facilities to meet the present water
needs as gaps in water coverage vs water requirements were present before the typhoon.
Losses in LII WSS access do not necessarily correspond in an increased use of LI WSS as people turn
also to water purchase (water sellers or LIII WSS).
LIII WSS users (HHs or population) could not be quantified within a specific barangay covered by this
service through KIIs: quite often, a single service connection (house connection) does not correspond
necessarily to one single HH user (one connection is shared among several HHs at the cost of 2-5
PHP/20 L). Moreover, one single house connection is also shared among HHs from different barangays
(usually in peri-urban and rural areas).
Table 2: Key findings for water access
Province
Tub
ewel
ls w
ith h
and
pum
p w
orki
ng b
efor
e
Hai
yan
(#)
Tub
ewel
ls w
ith h
and
pum
p w
orki
ng n
ow (
#)
Tot
al tu
bew
ells
with
ha
nd p
ump
lost
(#)
Tot
al tu
bew
ells
with
hand
pum
p lo
st (
%)
LII W
SS
wor
king
be
fore
Hai
yan
(#)
LII W
SS
wor
king
now
(#
)
Tot
al L
II W
SS
lost
(#)
Tot
al L
II W
SS
lost
(%
)
Bar
anga
y se
rved
by
LIII
WS
S b
efor
e
Hai
yan
(#)
Bar
anga
y se
rved
by
LIII
WS
S n
ow (
#)
Bar
anga
y th
at lo
st L
III
WS
S c
over
age
at
pres
ent (
#)
Bar
anga
y th
at lo
st L
III
WS
S c
over
age
at
pres
ent (
%)
Cebu 362 333 29 8 198 177 21 10.6 123 121 2 1.6
Leyte 3245 2728 517 16 690 559 131 19 528 505 23 4.3
Samar 204 144 60 29 70 65 5 7.1 22 20 2 9.1
Indicatively, the most vulnerable population is assumed to be the one with unprotected water sources and LI
WSS access only: tubewells are typically not more than 10 ft deep into alluvial soil and the shallow water table is
strongly influenced by surface and subsurface water circulation. These hydrogeological characteristics, together
with the lack of proper waste water and sewerage management, rank the users of unprotected water sources
and LI WSS as the most vulnerable population for water borne diseases and outbreaks. This assumption is
supported also by the biological water quality tested in LI WSS in Leyte and Samar: 71% of the water samples
are positive to coliform contamination. Table 3 quantifies the population relying solely on L1 WSS and
Phase I Wash Baseline Assessment - Philippines - April 2014
http://philippines.humanitarianresponse.info/ 15
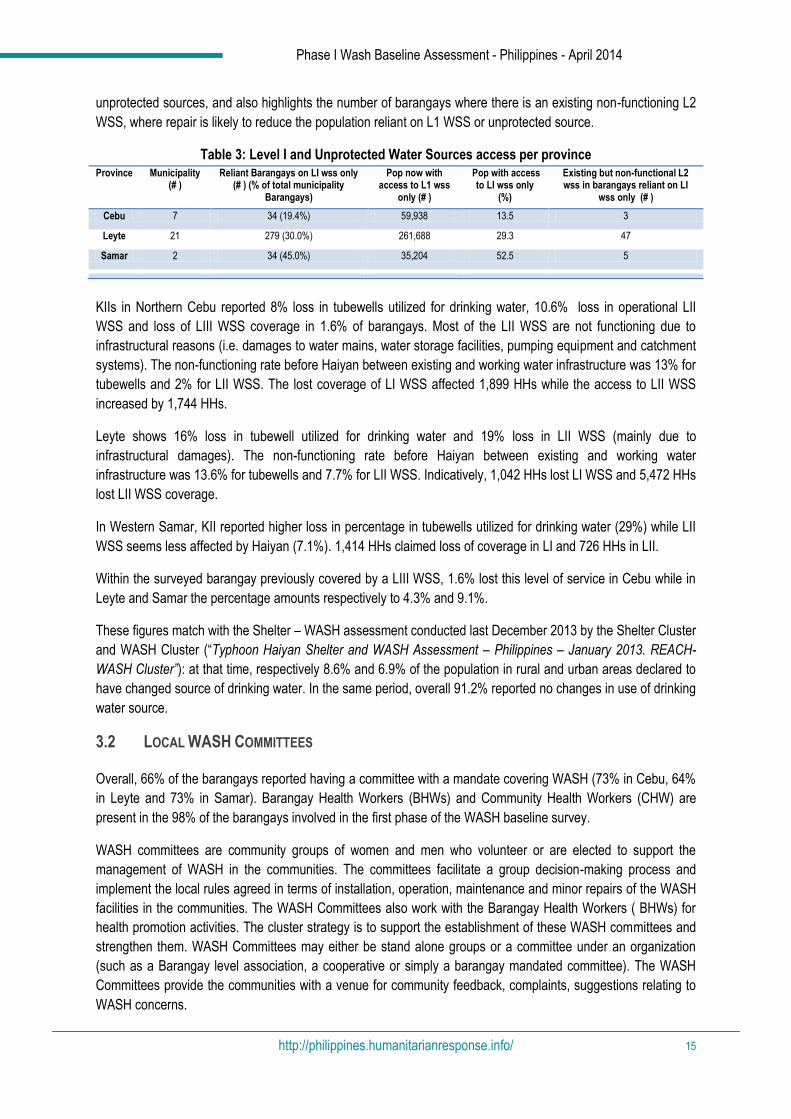
unprotected sources, and also highlights the number of barangays where there is an existing non-functioning L2
WSS, where repair is likely to reduce the population reliant on L1 WSS or unprotected source.
Table 3: Level I and Unprotected Water Sources access per province Province Municipality
(# ) Reliant Barangays on LI wss only
(# ) (% of total municipality Barangays)
Pop now with access to L1 wss
only (# )
Pop with access to LI wss only
(%)
Existing but non-functional L2 wss in barangays reliant on LI
wss only (# )
Cebu 7 34 (19.4%) 59,938 13.5 3
Leyte 21 279 (30.0%) 261,688 29.3 47
Samar 2 34 (45.0%) 35,204 52.5 5
KIIs in Northern Cebu reported 8% loss in tubewells utilized for drinking water, 10.6% loss in operational LII
WSS and loss of LIII WSS coverage in 1.6% of barangays. Most of the LII WSS are not functioning due to
infrastructural reasons (i.e. damages to water mains, water storage facilities, pumping equipment and catchment
systems). The non-functioning rate before Haiyan between existing and working water infrastructure was 13% for
tubewells and 2% for LII WSS. The lost coverage of LI WSS affected 1,899 HHs while the access to LII WSS
increased by 1,744 HHs.
Leyte shows 16% loss in tubewell utilized for drinking water and 19% loss in LII WSS (mainly due to
infrastructural damages). The non-functioning rate before Haiyan between existing and working water
infrastructure was 13.6% for tubewells and 7.7% for LII WSS. Indicatively, 1,042 HHs lost LI WSS and 5,472 HHs
lost LII WSS coverage.
In Western Samar, KII reported higher loss in percentage in tubewells utilized for drinking water (29%) while LII
WSS seems less affected by Haiyan (7.1%). 1,414 HHs claimed loss of coverage in LI and 726 HHs in LII.
Within the surveyed barangay previously covered by a LIII WSS, 1.6% lost this level of service in Cebu while in
Leyte and Samar the percentage amounts respectively to 4.3% and 9.1%.
These figures match with the Shelter – WASH assessment conducted last December 2013 by the Shelter Cluster
and WASH Cluster (“Typhoon Haiyan Shelter and WASH Assessment – Philippines – January 2013. REACH-
WASH Cluster”): at that time, respectively 8.6% and 6.9% of the population in rural and urban areas declared to
have changed source of drinking water. In the same period, overall 91.2% reported no changes in use of drinking
water source.
3.2 LOCAL WASH COMMITTEES
Overall, 66% of the barangays reported having a committee with a mandate covering WASH (73% in Cebu, 64%
in Leyte and 73% in Samar). Barangay Health Workers (BHWs) and Community Health Workers (CHW) are
present in the 98% of the barangays involved in the first phase of the WASH baseline survey.
WASH committees are community groups of women and men who volunteer or are elected to support the
management of WASH in the communities. The committees facilitate a group decision-making process and
implement the local rules agreed in terms of installation, operation, maintenance and minor repairs of the WASH
facilities in the communities. The WASH Committees also work with the Barangay Health Workers ( BHWs) for
health promotion activities. The cluster strategy is to support the establishment of these WASH committees and
strengthen them. WASH Committees may either be stand alone groups or a committee under an organization
(such as a Barangay level association, a cooperative or simply a barangay mandated committee). The WASH
Committees provide the communities with a venue for community feedback, complaints, suggestions relating to
WASH concerns.
Phase I Wash Baseline Assessment - Philippines - April 2014
http://philippines.humanitarianresponse.info/ 16
The questionnaire presently utilized does not contain specific questions to assess the roles, duties and
responsibilities of the barangay committees with a mandate covering WASH. Further investigations would be
relevant to assess which social, cultural, economical and technical conditions are present or need to be
promoted at barangay level to support WASH strategies across behaviours and social changes. This information
would allow the WASH partners to develop mid and long term participatory, sustainability and accountability
strategies which go beyond the creation of a technical capacity to manage the WASH facilities provided.
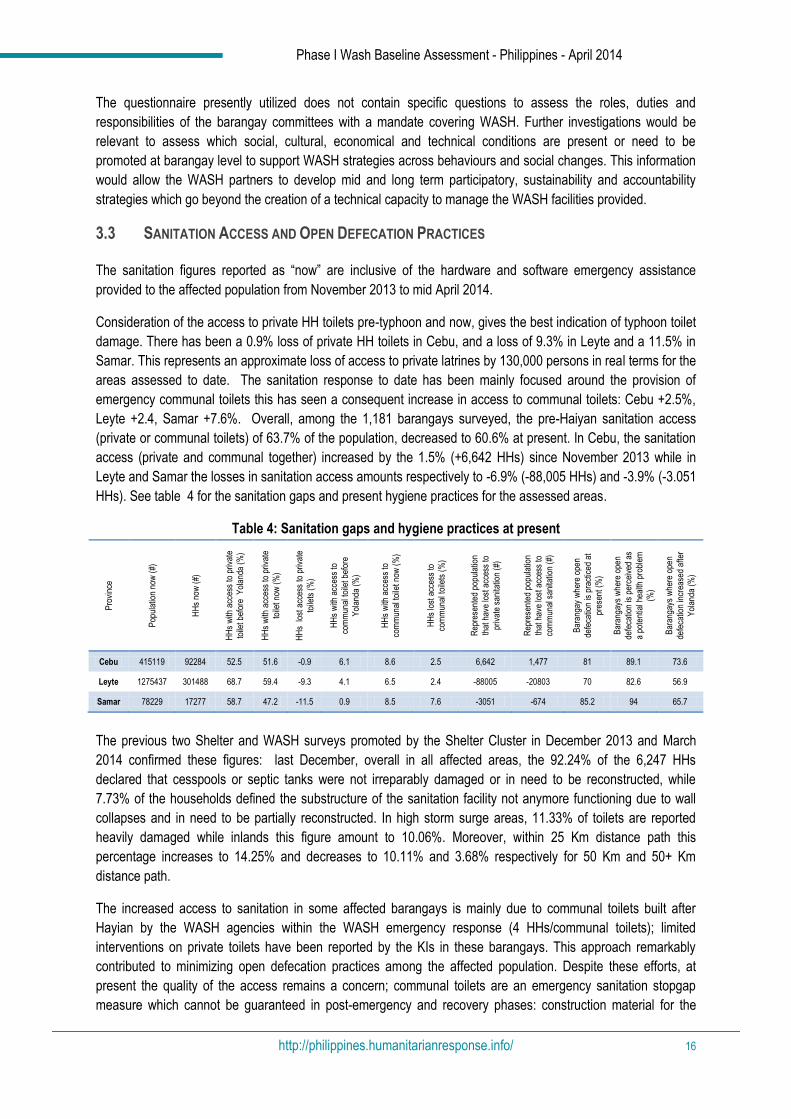
3.3 SANITATION ACCESS AND OPEN DEFECATION PRACTICES
The sanitation figures reported as “now” are inclusive of the hardware and software emergency assistance
provided to the affected population from November 2013 to mid April 2014.
Consideration of the access to private HH toilets pre-typhoon and now, gives the best indication of typhoon toilet
damage. There has been a 0.9% loss of private HH toilets in Cebu, and a loss of 9.3% in Leyte and a 11.5% in
Samar. This represents an approximate loss of access to private latrines by 130,000 persons in real terms for the
areas assessed to date. The sanitation response to date has been mainly focused around the provision of
emergency communal toilets this has seen a consequent increase in access to communal toilets: Cebu +2.5%,
Leyte +2.4, Samar +7.6%. Overall, among the 1,181 barangays surveyed, the pre-Haiyan sanitation access
(private or communal toilets) of 63.7% of the population, decreased to 60.6% at present. In Cebu, the sanitation
access (private and communal together) increased by the 1.5% (+6,642 HHs) since November 2013 while in
Leyte and Samar the losses in sanitation access amounts respectively to -6.9% (-88,005 HHs) and -3.9% (-3.051
HHs). See table 4 for the sanitation gaps and present hygiene practices for the assessed areas.
Table 4: Sanitation gaps and hygiene practices at present
Pro
vinc
e
Pop
ulat
ion
now
(#)
HH
s no
w (
#)
HH
s w
ith a
cces
s to
priv
ate
toile
t bef
ore
Yol
anda
(%
)
HH
s w
ith a
cces
s to
priv
ate
toile
t now
(%
)
HH
s lo
st a
cces
s to
priv
ate
toile
ts (
%)
HH
s w
ith a
cces
s to
com
mun
al to
ilet b
efor
e
Yol
anda
(%
)
HH
s w
ith a
cces
s to
com
mun
al to
ilet n
ow (
%)
HH
s lo
st a
cces
s to
co
mm
unal
toile
ts (
%)
Rep
rese
nted
pop
ulat
ion
that
hav
e lo
st a
cces
s to
priv
ate
sani
tatio
n (#
)
Rep
rese
nted
pop
ulat
ion
that
hav
e lo
st a
cces
s to
co
mm
unal
san
itatio
n (#
)
Bar
anga
y w
here
ope
n
defe
catio
n is
pra
ctic
ed a
t pr
esen
t (%
)
Bar
anga
ys w
here
ope
n
defe
catio
n is
per
ceiv
ed a
s
a po
tent
ial h
ealth
pro
blem
(%
)
Bar
anga
ys w
here
ope
n
defe
catio
n in
crea
sed
afte
r
Yol
anda
(%
)
Cebu 415119 92284 52.5 51.6 -0.9 6.1 8.6 2.5 6,642 1,477 81 89.1 73.6
Leyte 1275437 301488 68.7 59.4 -9.3 4.1 6.5 2.4 -88005 -20803 70 82.6 56.9
Samar 78229 17277 58.7 47.2 -11.5 0.9 8.5 7.6 -3051 -674 85.2 94 65.7
The previous two Shelter and WASH surveys promoted by the Shelter Cluster in December 2013 and March
2014 confirmed these figures: last December, overall in all affected areas, the 92.24% of the 6,247 HHs
declared that cesspools or septic tanks were not irreparably damaged or in need to be reconstructed, while
7.73% of the households defined the substructure of the sanitation facility not anymore functioning due to wall
collapses and in need to be partially reconstructed. In high storm surge areas, 11.33% of toilets are reported
heavily damaged while inlands this figure amount to 10.06%. Moreover, within 25 Km distance path this
percentage increases to 14.25% and decreases to 10.11% and 3.68% respectively for 50 Km and 50+ Km
distance path.
The increased access to sanitation in some affected barangays is mainly due to communal toilets built after
Hayian by the WASH agencies within the WASH emergency response (4 HHs/communal toilets); limited
interventions on private toilets have been reported by the KIs in these barangays. This approach remarkably
contributed to minimizing open defecation practices among the affected population. Despite these efforts, at
present the quality of the access remains a concern; communal toilets are an emergency sanitation stopgap
measure which cannot be guaranteed in post-emergency and recovery phases: construction material for the
Phase I Wash Baseline Assessment - Philippines - April 2014
http://philippines.humanitarianresponse.info/ 17
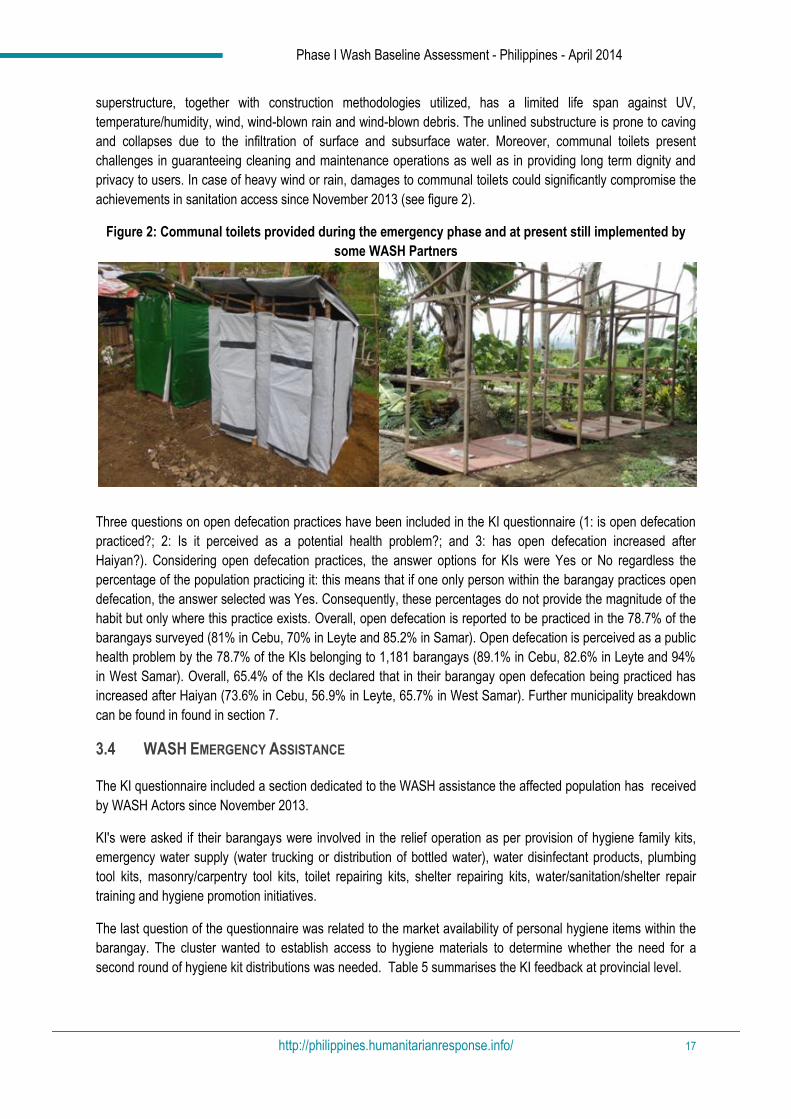
superstructure, together with construction methodologies utilized, has a limited life span against UV,
temperature/humidity, wind, wind-blown rain and wind-blown debris. The unlined substructure is prone to caving
and collapses due to the infiltration of surface and subsurface water. Moreover, communal toilets present
challenges in guaranteeing cleaning and maintenance operations as well as in providing long term dignity and
privacy to users. In case of heavy wind or rain, damages to communal toilets could significantly compromise the
achievements in sanitation access since November 2013 (see figure 2).
Figure 2: Communal toilets provided during the emergency phase and at present still implemented by
some WASH Partners
Three questions on open defecation practices have been included in the KI questionnaire (1: is open defecation
practiced?; 2: Is it perceived as a potential health problem?; and 3: has open defecation increased after
Haiyan?). Considering open defecation practices, the answer options for KIs were Yes or No regardless the
percentage of the population practicing it: this means that if one only person within the barangay practices open
defecation, the answer selected was Yes. Consequently, these percentages do not provide the magnitude of the
habit but only where this practice exists. Overall, open defecation is reported to be practiced in the 78.7% of the
barangays surveyed (81% in Cebu, 70% in Leyte and 85.2% in Samar). Open defecation is perceived as a public
health problem by the 78.7% of the KIs belonging to 1,181 barangays (89.1% in Cebu, 82.6% in Leyte and 94%
in West Samar). Overall, 65.4% of the KIs declared that in their barangay open defecation being practiced has
increased after Haiyan (73.6% in Cebu, 56.9% in Leyte, 65.7% in West Samar). Further municipality breakdown
can be found in found in section 7.
3.4 WASH EMERGENCY ASSISTANCE
The KI questionnaire included a section dedicated to the WASH assistance the affected population has received
by WASH Actors since November 2013.
KI's were asked if their barangays were involved in the relief operation as per provision of hygiene family kits,
emergency water supply (water trucking or distribution of bottled water), water disinfectant products, plumbing
tool kits, masonry/carpentry tool kits, toilet repairing kits, shelter repairing kits, water/sanitation/shelter repair
training and hygiene promotion initiatives.
The last question of the questionnaire was related to the market availability of personal hygiene items within the
barangay. The cluster wanted to establish access to hygiene materials to determine whether the need for a
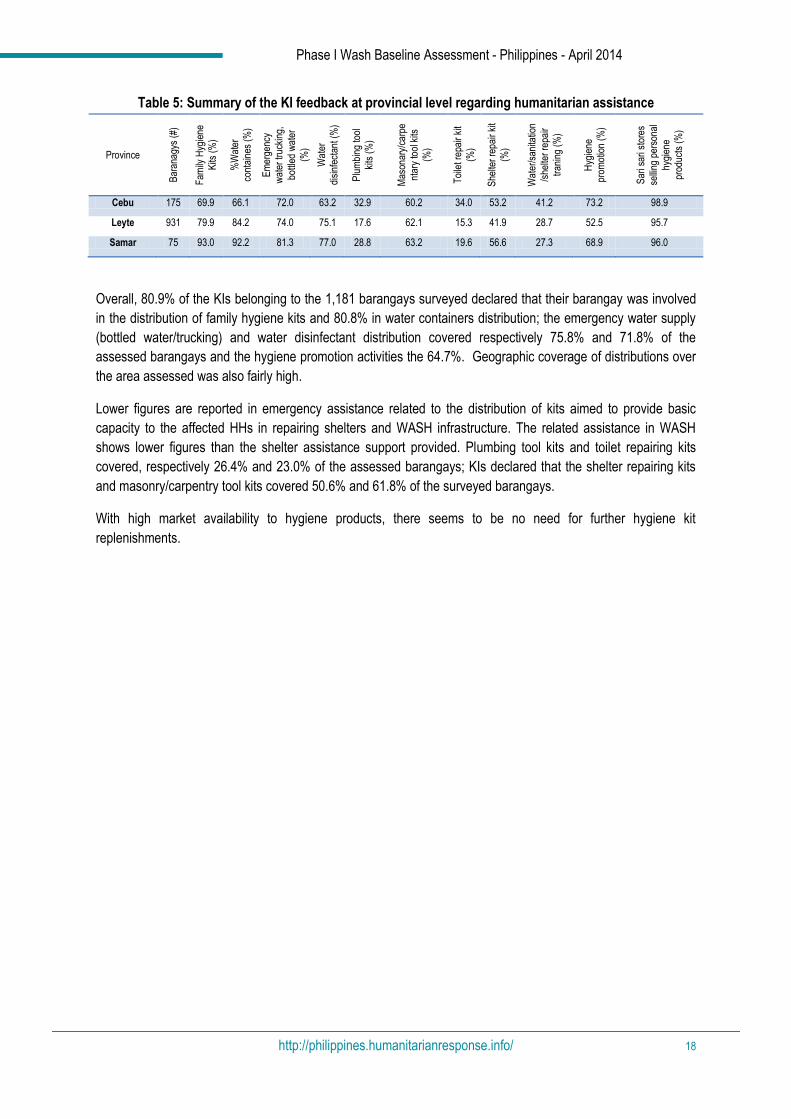
second round of hygiene kit distributions was needed. Table 5 summarises the KI feedback at provincial level.
Phase I Wash Baseline Assessment - Philippines - April 2014
http://philippines.humanitarianresponse.info/ 18
Table 5: Summary of the KI feedback at provincial level regarding humanitarian assistance
Province
Bar
anag
ys (
#)
Fam
ily H
ygie
ne
Kits
(%
)
%W
ater
co
ntai
nes
(%)
Em
erge
ncy
wat
er tr
ucki
ng,
bottl
ed w
ater
(%)
Wat
er
disi
nfec
tant
(%
)
Plu
mbi
ng to
ol
kits
(%
)
Mas
onar
y/ca
rpe
ntar
y to
ol k
its
(%)
Toi
let r
epai
r ki
t
(%)
She
lter
repa
ir ki
t
(%)
Wat
er/s
anita
tion
/she
lter
repa
ir tr
anin
g (%
)
Hyg
iene
pr
omot
ion
(%)
Sar
i sar
i sto
res
selli
ng p
erso
nal
hygi
ene
prod
ucts
(%
)
Cebu 175 69.9 66.1 72.0 63.2 32.9 60.2 34.0 53.2 41.2 73.2 98.9
Leyte 931 79.9 84.2 74.0 75.1 17.6 62.1 15.3 41.9 28.7 52.5 95.7
Samar 75 93.0 92.2 81.3 77.0 28.8 63.2 19.6 56.6 27.3 68.9 96.0
Overall, 80.9% of the KIs belonging to the 1,181 barangays surveyed declared that their barangay was involved
in the distribution of family hygiene kits and 80.8% in water containers distribution; the emergency water supply
(bottled water/trucking) and water disinfectant distribution covered respectively 75.8% and 71.8% of the
assessed barangays and the hygiene promotion activities the 64.7%. Geographic coverage of distributions over
the area assessed was also fairly high.
Lower figures are reported in emergency assistance related to the distribution of kits aimed to provide basic
capacity to the affected HHs in repairing shelters and WASH infrastructure. The related assistance in WASH
shows lower figures than the shelter assistance support provided. Plumbing tool kits and toilet repairing kits
covered, respectively 26.4% and 23.0% of the assessed barangays; KIs declared that the shelter repairing kits
and masonry/carpentry tool kits covered 50.6% and 61.8% of the surveyed barangays.
With high market availability to hygiene products, there seems to be no need for further hygiene kit
replenishments.
Phase I Wash Baseline Assessment - Philippines - April 2014
http://philippines.humanitarianresponse.info/ 19
4. WASH Intention Survey
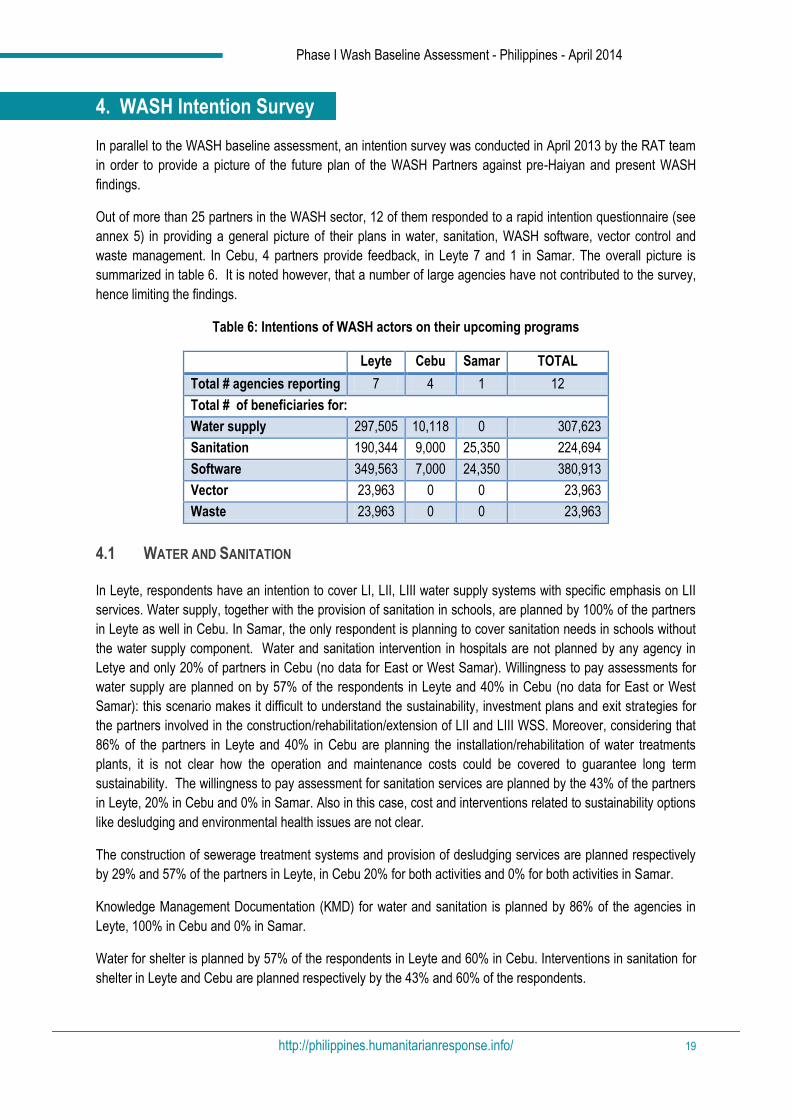
In parallel to the WASH baseline assessment, an intention survey was conducted in April 2013 by the RAT team
in order to provide a picture of the future plan of the WASH Partners against pre-Haiyan and present WASH
findings.
Out of more than 25 partners in the WASH sector, 12 of them responded to a rapid intention questionnaire (see
annex 5) in providing a general picture of their plans in water, sanitation, WASH software, vector control and
waste management. In Cebu, 4 partners provide feedback, in Leyte 7 and 1 in Samar. The overall picture is
summarized in table 6. It is noted however, that a number of large agencies have not contributed to the survey,
hence limiting the findings.
Table 6: Intentions of WASH actors on their upcoming programs
Leyte Cebu Samar TOTAL
Total # agencies reporting 7 4 1 12
Total # of beneficiaries for:
Water supply 297,505 10,118 0 307,623
Sanitation 190,344 9,000 25,350 224,694
Software 349,563 7,000 24,350 380,913
Vector 23,963 0 0 23,963
Waste 23,963 0 0 23,963
4.1 WATER AND SANITATION
In Leyte, respondents have an intention to cover LI, LII, LIII water supply systems with specific emphasis on LII
services. Water supply, together with the provision of sanitation in schools, are planned by 100% of the partners
in Leyte as well in Cebu. In Samar, the only respondent is planning to cover sanitation needs in schools without
the water supply component. Water and sanitation intervention in hospitals are not planned by any agency in
Letye and only 20% of partners in Cebu (no data for East or West Samar). Willingness to pay assessments for
water supply are planned on by 57% of the respondents in Leyte and 40% in Cebu (no data for East or West
Samar): this scenario makes it difficult to understand the sustainability, investment plans and exit strategies for
the partners involved in the construction/rehabilitation/extension of LII and LIII WSS. Moreover, considering that
86% of the partners in Leyte and 40% in Cebu are planning the installation/rehabilitation of water treatments
plants, it is not clear how the operation and maintenance costs could be covered to guarantee long term
sustainability. The willingness to pay assessment for sanitation services are planned by the 43% of the partners
in Leyte, 20% in Cebu and 0% in Samar. Also in this case, cost and interventions related to sustainability options
like desludging and environmental health issues are not clear.
The construction of sewerage treatment systems and provision of desludging services are planned respectively
by 29% and 57% of the partners in Leyte, in Cebu 20% for both activities and 0% for both activities in Samar.
Knowledge Management Documentation (KMD) for water and sanitation is planned by 86% of the agencies in
Leyte, 100% in Cebu and 0% in Samar.
Water for shelter is planned by 57% of the respondents in Leyte and 60% in Cebu. Interventions in sanitation for
shelter in Leyte and Cebu are planned respectively by the 43% and 60% of the respondents.
Phase I Wash Baseline Assessment - Philippines - April 2014
http://philippines.humanitarianresponse.info/ 20
4.2 WASH SOFTWARE
Hygiene promotion is planned by 71% of the respondents in Leyte, 100% in Cebu and 100% in Samar. The
Zero Open Defecation initiative shows similar intentions in the three provinces.
Limited interest on water safety plans, environmental health services, sustainable service scale (3S) is showed
by all respondents in all provinces. By proxy, this finding could represent a limited interest of partners in long
term commitments in capacity building for communities and local/national authorities and probably a limited skill
level in implementing these approaches in the Philippines despite the favourable social and cultural scenarios.
Similar considerations about research and innovative WASH approaches and water quality monitoring
programmes exist.
4.3 VECTOR CONTROL
Vector control in its four approaches proposed by questionnaire (1- Environmental Management for Vector
Control, 3- System-wide Initiative on Malaria and Agriculture -SIMA, 3- Basic approach: vector control in specific
sites - insecticide, larvicide, sensitization campaigns, ITN, LLINs, IRS and 4- Provision of equipment to
public/private counterpart - sprayers any type, protection gears, vehicles, dewatering pumps, insecticide stock
etc) recorded limited or null interested by the respondents. The interested one are mainly planning the so named
“Basic Approach”.
4.4 WASTE MANAGEMENT (SOLID AND MEDICAL WASTE)
Waste management intentions are available only for Leyte. 71% of the respondents are interested on waste
management in communities while 57% are planning capacity building on waste management for local or
national counterparts and waste reduction programs.
Construction of and fix term management of landfills are planned by the 29% of the respondents.
14% of the participants to the intention survey are planning medical waste management in hospitals.
Phase I Wash Baseline Assessment - Philippines - April 2014
http://philippines.humanitarianresponse.info/ 21
5. Technical Descriptions
This section will provide a technical description of the primary data collected, provide sources for secondary data
for complimentary analysis and make recommendations on how to best utilise the baseline data.
5.1 DEMOGRAPHICS
Urban/Rural: Barangay located in urban or rural areas as per Philippines Statistic Authority – National Statistic
Office.
Census population before (#): number of individuals as per 2010-2013 population census by Philippines
National Statistics Coordination Board NSCB (secondary data)
Population before and Household before (#): number of individuals and households in a specific location
(barangay or municipality) before Haiyan. Information collected by KIIs (primary data)
Population now and Households now (#): number of individuals and households in a specific location
(barangay or municipality) in April 2014. Information collected by KII (primary data)
Variation in population before Haiyan (%): variation in % between population (individuals) before Haiyan
(primary data) vs census by the Philippines NSCB (secondary data). It defines positive or negative trends in
population variation in a specific area of interest (barangay or municipality) before Haiyan vs census figures. This
information can help WASH partners to define the pre-Haiyan degree of stress in the utilization of the WASH
facilities in a specific project site (number of water points/users, yield of boreholes/springs versus water demand,
number of users/km of water main, sanitation coverage, solid/liquid waste production versus
transport/treatment/disposal capacity, etc). Health sector partners can utilize this information to define health
coverage versus number of users.
Population growth factor: annual increase of the population
Population growth factor in Region VI Easter Visayas: 1.38
Population growth factor in Region VII Central Visayas: 1.98
Population growth factor in Region VIII Eastern Visayas: 1.48
(source: Philippines Statistic Authority – National Statistic Office, http://www.census.gov.ph/)
Variation in population before and after Haiyan (%): variation in % between population (individuals) before
Haiyan (primary data) and after Haiyan (primary data). It defines positive or negative trends in population
variation in a specific area of interest (barangay or municipality) before and after Haiyan. This information can
help WASH partners to define WASH needs versus new population figures. Health and livelihood partners can
utilize these data for specific sectoral planning activities.
Area (Km2): area of barangays based on WGS 1984 UTM Zone 51N geographic coordinate projection.
Population density (#/Km2 ): at barangay level, number individuals (primary data)/ Km2 at present. This data
provides support to studies on relationship between sanitation, population density, and fecal-associated health
problems, epidemiology in prevention of outbreaks as well as cost-benefit analysis for LII and LIII water supply
systems
Population density Region VI: 342
Phase I Wash Baseline Assessment - Philippines - April 2014
http://philippines.humanitarianresponse.info/ 22
Population density Region VII: 428
Population density Region VIII: 176
(source: Philippines Statistic Authority – National Statistic Office, http://www.census.gov.ph/)
Committee active in WASH: any committee at barangay level active in WASH (hardware and software
activities) at present. This data provides information on WASH governance at barangay level, presence of
potential health and WASH interlocutors (implementation, capacity building and M&E activities)
BHW or CHVs present: Barangay Health Workers or Community Health Volunteers active at barangay level at
present.
Severity score and Rank: Severity score was generated from secondary data using a multivariate formula
incorporating physical factors (storm surge, proximity to storm path, etc), reported affected population statistics
and baseline vulnerability indicators. Data originally compiled by Miguel Antonio from the Barcelona School of
Economics and geo-referenced by MapAction, UN-OCHA, MSF-UK, and WFP.
MGB Geo-hazard map coverage: this data indicated if a specific area (barangay or municipality) is included in
the present 1:50,000 scale landslide and flood susceptibility maps produced and disseminated by the Mines and
Geo-Sciences Bureau (MGB) - http://gdis.denr.gov.ph/mgbviewer/.
The GIS based maps provide also information on:
Geology
Drains
Roads
Shoreline
Waterbodies
Mining Tenement Map
Mineral Resources
GEOBIBS
In addition, MGB is presently involved in a detailed geohazards mapping program at 1:10,000 scale which aims
to identify specific high risk zones, critical sites, and unstable areas within specific target areas. The maps will
also delineate highly vulnerable portions of the target areas that might require follow-up and more detailed
technical works. Possible relocation/ evacuation sites following natural disasters or geohazard events will be also
identified. Primary emphasis is placed on the flood/flashflood and landslide hazards susceptibility analysis. The
detailed geohazard mapping and assessment program is expected to be completed in 2014. It is important to
underline that the new thematic maps will not provide information on mitigation measures needed to be taken for
environmental management, flood/landslide risks mitigation, water resources and water facilities protection as
well as civil engineering standards. Consequently, the present maps (scale 1:50,000 and the basic
geomorphologic analysis of Google Earth imageries, provide enough data to users to recognise if their areas of
intervention are in flood/landslide prone areas and to take all the technical and management actions to mitigate
or reduce mid or long term natural disaster damages. MGB maps, together with Google Earth imageries, can
identify critical portions of the coastal areas, as well as river basin catchment systems, urbanised and cultivated
land and industrial settlements. Moreover, relevant geomorphologic features indicating flood prone areas
(floodplains with oxbow lakes, rills, confluences where two or more watercourses meet) can provide users with
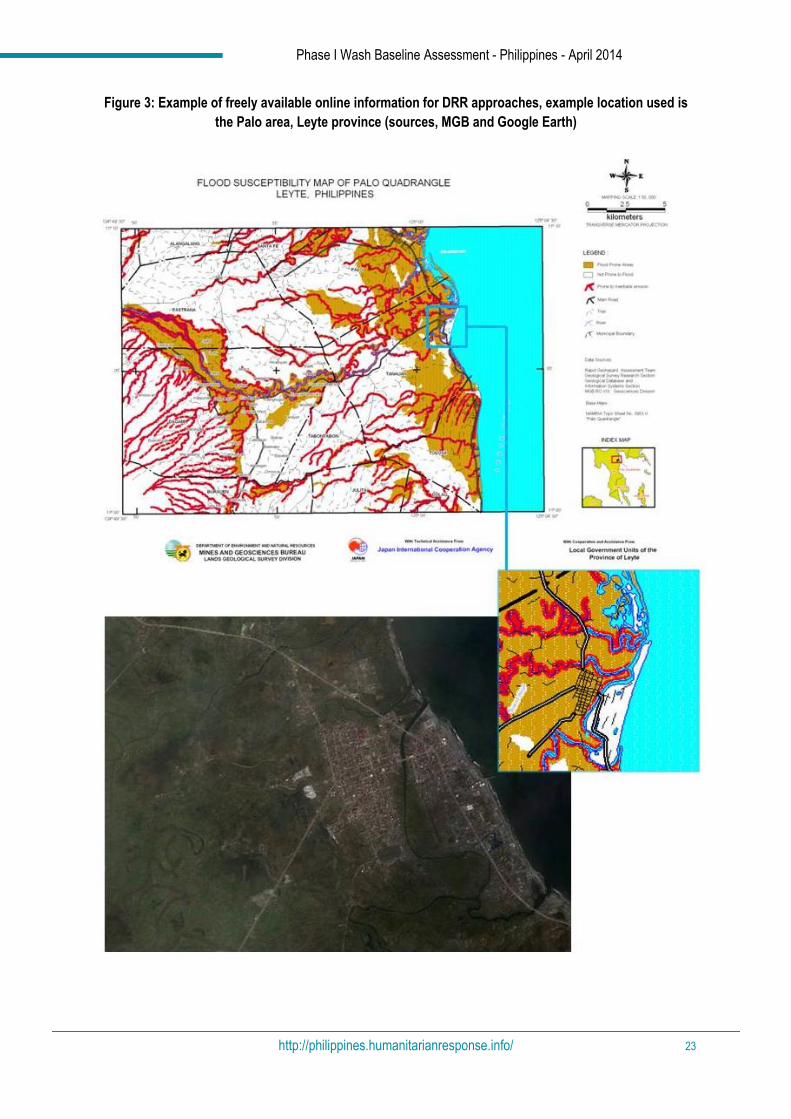
information on how to build back safer and DRR strategies. Figure 3 displays an example of the level of detail on
flood susceptibility in a coastal area (Palo) that users can obtain by crossing the MGB maps and GoogleEarth
imageries.
Phase I Wash Baseline Assessment - Philippines - April 2014
http://philippines.humanitarianresponse.info/ 23
Figure 3: Example of freely available online information for DRR approaches, example location used is
the Palo area, Leyte province (sources, MGB and Google Earth)
Phase I Wash Baseline Assessment - Philippines - April 2014
http://philippines.humanitarianresponse.info/ 24
5.2 WATER SUPPLY SYSTEMS
WATER SUPPLY SYSTEM Level I (LI WSS)
Level I (point source) systems include a protected well (with or without hand pump), a developed spring or rain
water catchment system with an outlet but without a distribution system. These systems are generally adaptable
for rural areas where the houses are thinly scattered. Level I infrastructure provides for least 20 L/p/d, it serves
around 15 to 25 households and its outreach must not be more than 250 meters from the farthest user. The
Philippine National Standards for Drinking Water –PD 856, mentions that the yield or discharge is generally from
40 to 140 liters per minute. Water fees are not collected (source: the Department of Public Works and Highways-
DPWH).
Tubewells before Haiyan (#): total number of tubewells equipped with hand pump before Haiyan regardless of
whether they are working on non-working. This figure considers only tubewells utilized by the population for
drinking water.[Information related to water access, service coverage and service quality ]
Tubewells working before Haiyan (#): number of working tubewells equipped with hand pump before Haiyan
utilized by the population for drinking water only. [Information related to water access, service coverage and
service quality. ]
Tubewells working before Haiyan (%): difference in % between total and working number of tubewells
equipped with hand pump utilized for drinking water before Haiyan. [Information related to water access, service
coverage, governance and operation and maintenance (O&M) capacity at barangay level.]
Tubewell working now (#): number of currently working tubewells equipped with hand pump utilized by the
population for drinking water. [Information related to water access, service coverage and service quality.] This
figure includes also new tubewells constructed or rehabilitated after Haiyan as part of the WASH emergency
response.
Variation in tubewells before and now (%): variation in number of working tubewells equipped with hand pump
and utilized by the population for drinking water before Haiyan and currently. This figure includes also new
tubewells constructed or rehabilitated after Haiyan as part of the WASH emergency response. [Information
related to possible impact of Haiyan on LI water supply.]
HHs using tubewells before (#): number of HHs using tubewells equipped with hand pump for drinking purpose
before Haiyan. [Information related to water access, service coverage, water quality and public health risk
exposure.]
HHs using tubewells before (%): percentage of HHs within a barangay using tubewells equipped with hand
pump for drinking purpose before Haiyan. [Information related to water access, service coverage, water quality
and public health risk exposure.]
HHs using tubewells now (#): number of HHs currently using tubewells equipped with hand pump for drinking
purpose.. [Information related to water access, service coverage, water quality and public health risk exposure.]
HHs using tubewells now (%): percentage of HHs within a barangay currently using tubewells equipped with
hand pump for drinking purpose.[Information related to water access, service coverage. Information on water
access related to possible impact of Haiyan on LI water supply].
Phase I Wash Baseline Assessment - Philippines - April 2014
http://philippines.humanitarianresponse.info/ 25
WATER SUPPLY SYSTEM Level II (LII WSS)
Level II (communal faucet system or stand posts) systems are composed of a source (well, borehole or spring), a reservoir, a piped distribution network and two or more communal faucets located at not more than 25 meters from the farthest house, with each faucet serving from four to six households. These systems are generally suitable for rural and urban fringe areas where houses are clustered densely to justify a simple piped system. Level II infrastructure provides for at least 60 litres per person per day (40-80 L/p/d following the National Standards for Drinking Water – PD 856). Water is not metered (source: the Department of Public Works and Highways-DPWH). Total LII WSS before (#): total number of LII WSS before Haiyan, both functioning and non-functioning. .
[Information related to water access, service coverage, governance and O&M capacity, potential for water mains
extension, water treatment options, rehabilitation/reconstruction options, water quality and public health risk
exposure].
Working LII WSS before (#): number of LII WSS working before Haiyan. [Information related to water access,
service coverage, governance and O&M capacity.]
Working LII WSS before (%): difference in % between total and working number of LII WSS before Haiyan.
Information related to water access, service coverage, governance and O&M capacity at barangay level.
Working LII WSS at present (#): number of LII WSS currently working. This figure may include also
new/rehabilitated LII WSS after Haiyan as part of the WASH emergency response.
Working LII WSS at present (%): difference in % between the number of working LII WSS before Haiyan and
the current number working. This figure also includes new/rehabilitated LII WSS after Haiyan as part of the
WASH emergency response. [Information related to possible impact of Haiyan on LII water supply systems.]
Lost LII WSS at present (%): percentage of LII WSS damaged due to Haiyan.
LII WSS not functioning now (#): number of LII WSS damaged due to Haiyan. This figure does not consider
those LII WSS not working before Haiyan.
Reason why not functioning: KIs were asked to explain why the LII WSS in their barangay were not currently
working. Options for answers were: power supply, infrastructure (borehole or spring box damages, water mains
damages, water towers/reservoirs damages), low yield of water source and do not’ know. [ Information related to
governance, financial capacity and O&M capacity at barangay level. ]
WATER SUPPLY SYSTEM Level III (LIII WSS)
Level III (waterworks systems or individual household connections) are systems with a source, a reservoir, a
piped distribution network and household taps. It is generally suited for populated areas. Level III infrastructure
provides for at least 100 litres per person per day. This level of facility requires a minimum level of disinfection
treatment. A Water metering policy allows for water fees collection (source: the Department of Public Works and
Highways - DPWH)
LIII WSS before (Y/N): barangay covered by a LIII WSS before Haiyan. [Information on quality of service and
service coverage before Haiyan in a specific barangay.]
HHs using LIII WSS before (%): percentage of HHs using LIII WSS for drinking water before Haiyan. This figure
includes all HHs utilizing LIII WSS for drinking water regardless if the HHs are located in a barangay that is not
Phase I Wash Baseline Assessment - Philippines - April 2014
http://philippines.humanitarianresponse.info/ 26
served by a LIII WSS - in peri-urban areas where only LI WSS is available, most HHs buy drinking water from
HHs which are connected to a LIII WSS (informal drinking water market).
LIII WSS now (Y/N): barangay currently covered by a LIII WSS. This figure also includes any
rehabilitation/water mains extensions provided by the WASH emergency response, from November 2013 to April
2014. [Information on the current quality of service and service coverage in a specific barangay. Possible
indicator of Haiyan impact on LIII WSS. ]
HHs using LIII WSS now (%): percentage of HHs currently using a LIII WSS for drinking water. This figure
includes all HHs utilizing LIII WSS for drinking water also regardless if the HHs are located in a barangay that is
not served by a LIII WSS: in peri-urban areas where only LI WSS supply is available, most of the HHs buy
drinking water from HHs which are connected to a LIII WSS (informal drinking water market). Possible indicator
of Haiyan impact on LIII WSS.
Chlorination practiced at present (Y/N): KIs declared that the chlorination of water is a known practice and
practiced by HHs in the barangay but not necessarily by the entire population of the barangay. This information
does not provide any figure on the % of the population which treat the water before drinking: it provides only an
indication of the knowledge level of the HHs on water quality issues. Last December 2013, 70 % of the 6,247
HHs interviewed declared that they do not treat water before drinking it (Typhoon Haiyan Shelter and WASH
Assessment – Philippines – January 2013. REACH-WASH Cluster). The recent Shelter and WASH Response
Monitoring Report – 22 April 2014, REACH-WASH Cluster, quotes the following figures for HH water treatment
practices:
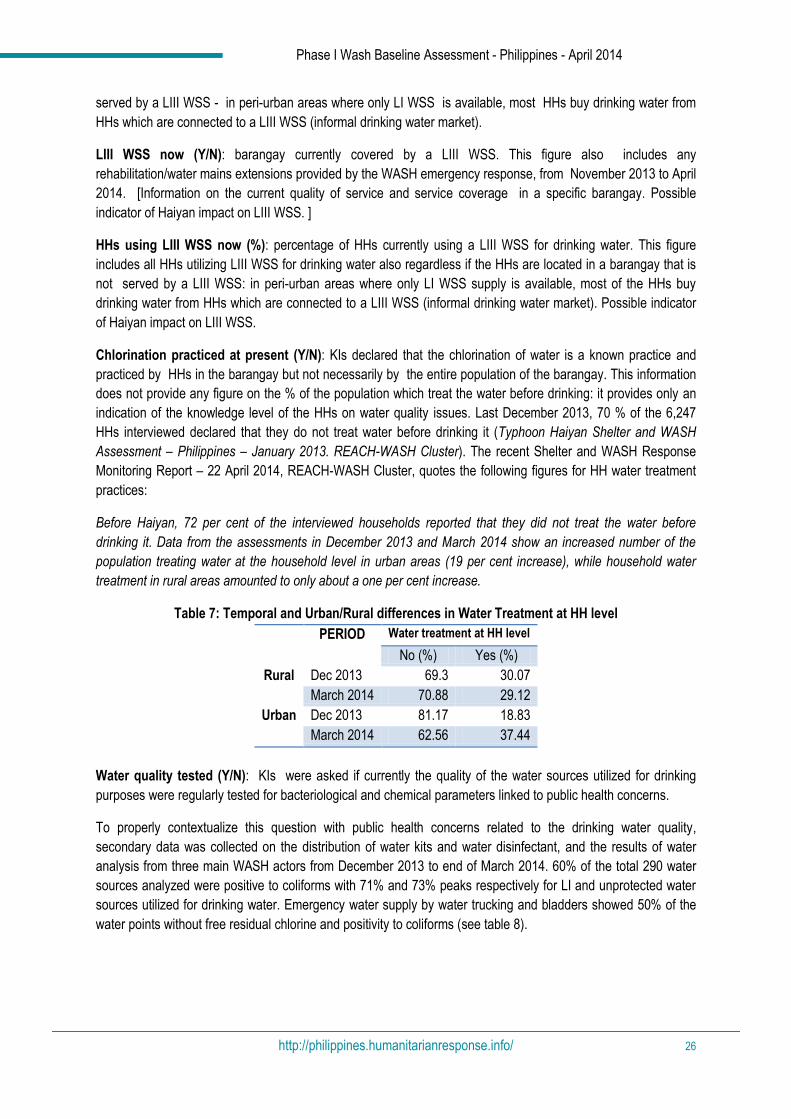
Before Haiyan, 72 per cent of the interviewed households reported that they did not treat the water before
drinking it. Data from the assessments in December 2013 and March 2014 show an increased number of the
population treating water at the household level in urban areas (19 per cent increase), while household water
treatment in rural areas amounted to only about a one per cent increase.
Table 7: Temporal and Urban/Rural differences in Water Treatment at HH level
PERIOD Water treatment at HH level
No (%) Yes (%)
Rural Dec 2013 69.3 30.07
March 2014 70.88 29.12
Urban Dec 2013 81.17 18.83
March 2014 62.56 37.44
Water quality tested (Y/N): KIs were asked if currently the quality of the water sources utilized for drinking
purposes were regularly tested for bacteriological and chemical parameters linked to public health concerns.
To properly contextualize this question with public health concerns related to the drinking water quality,
secondary data was collected on the distribution of water kits and water disinfectant, and the results of water
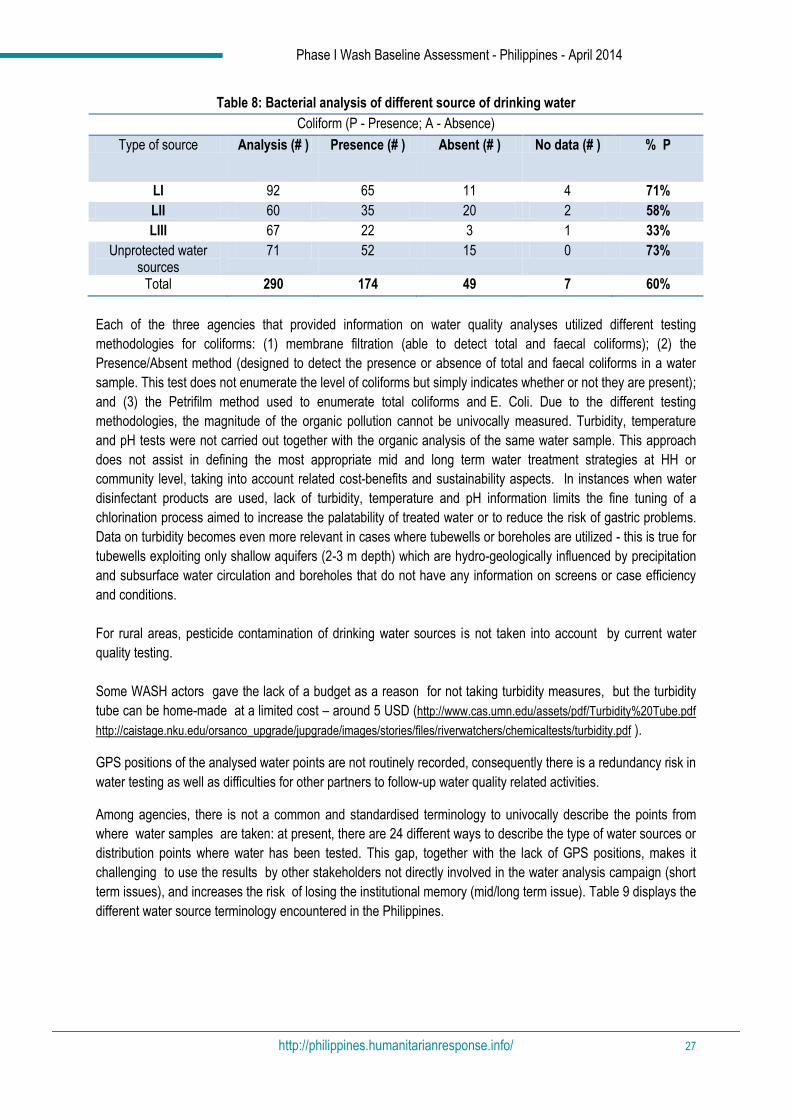
analysis from three main WASH actors from December 2013 to end of March 2014. 60% of the total 290 water
sources analyzed were positive to coliforms with 71% and 73% peaks respectively for LI and unprotected water
sources utilized for drinking water. Emergency water supply by water trucking and bladders showed 50% of the
water points without free residual chlorine and positivity to coliforms (see table 8).
Phase I Wash Baseline Assessment - Philippines - April 2014
http://philippines.humanitarianresponse.info/ 27
Table 8: Bacterial analysis of different source of drinking water
Coliform (P - Presence; A - Absence)
Type of source Analysis (# ) Presence (# ) Absent (# ) No data (# ) % P
LI 92 65 11 4 71%
LII 60 35 20 2 58%
LIII 67 22 3 1 33%
Unprotected water sources
71 52 15 0 73%
Total 290 174 49 7 60%
Each of the three agencies that provided information on water quality analyses utilized different testing
methodologies for coliforms: (1) membrane filtration (able to detect total and faecal coliforms); (2) the
Presence/Absent method (designed to detect the presence or absence of total and faecal coliforms in a water
sample. This test does not enumerate the level of coliforms but simply indicates whether or not they are present);
and (3) the Petrifilm method used to enumerate total coliforms and E. Coli. Due to the different testing
methodologies, the magnitude of the organic pollution cannot be univocally measured. Turbidity, temperature
and pH tests were not carried out together with the organic analysis of the same water sample. This approach
does not assist in defining the most appropriate mid and long term water treatment strategies at HH or
community level, taking into account related cost-benefits and sustainability aspects. In instances when water
disinfectant products are used, lack of turbidity, temperature and pH information limits the fine tuning of a
chlorination process aimed to increase the palatability of treated water or to reduce the risk of gastric problems.
Data on turbidity becomes even more relevant in cases where tubewells or boreholes are utilized - this is true for
tubewells exploiting only shallow aquifers (2-3 m depth) which are hydro-geologically influenced by precipitation
and subsurface water circulation and boreholes that do not have any information on screens or case efficiency
and conditions.
For rural areas, pesticide contamination of drinking water sources is not taken into account by current water
quality testing.
Some WASH actors gave the lack of a budget as a reason for not taking turbidity measures, but the turbidity
tube can be home-made at a limited cost – around 5 USD (http://www.cas.umn.edu/assets/pdf/Turbidity%20Tube.pdf
http://caistage.nku.edu/orsanco_upgrade/jupgrade/images/stories/files/riverwatchers/chemicaltests/turbidity.pdf ).
GPS positions of the analysed water points are not routinely recorded, consequently there is a redundancy risk in
water testing as well as difficulties for other partners to follow-up water quality related activities.
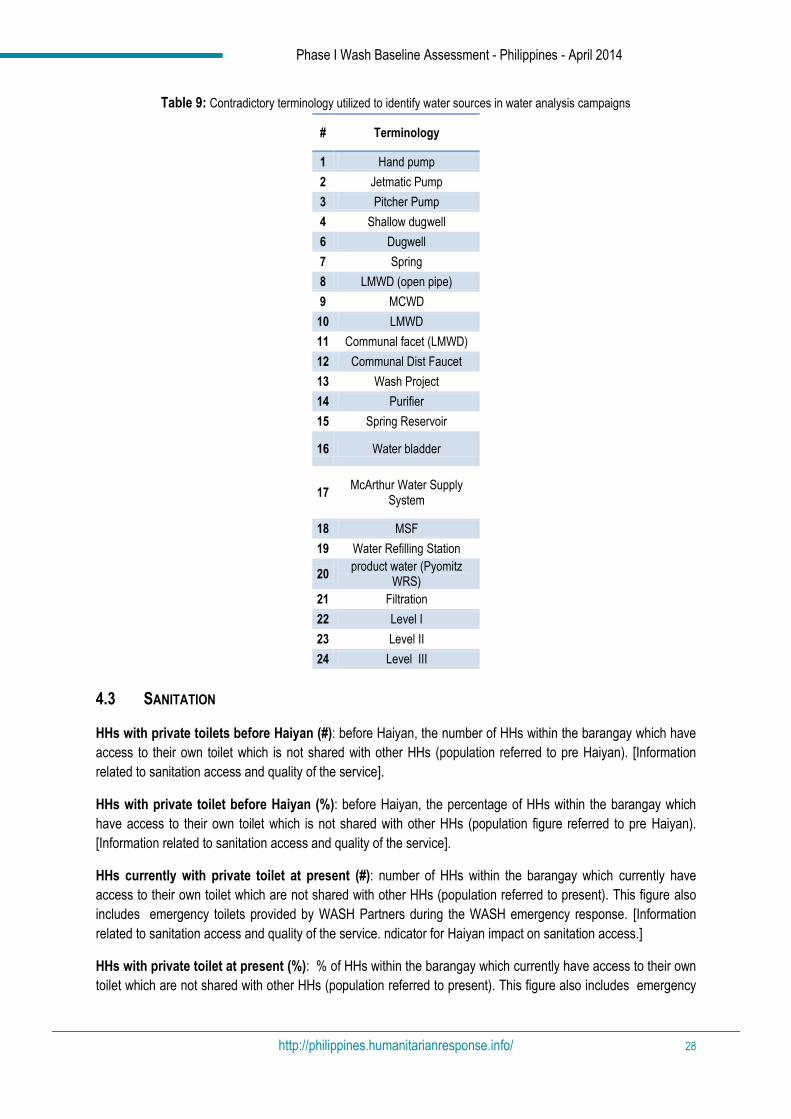
Among agencies, there is not a common and standardised terminology to univocally describe the points from
where water samples are taken: at present, there are 24 different ways to describe the type of water sources or
distribution points where water has been tested. This gap, together with the lack of GPS positions, makes it
challenging to use the results by other stakeholders not directly involved in the water analysis campaign (short
term issues), and increases the risk of losing the institutional memory (mid/long term issue). Table 9 displays the
different water source terminology encountered in the Philippines.
Phase I Wash Baseline Assessment - Philippines - April 2014
http://philippines.humanitarianresponse.info/ 28
Table 9: Contradictory terminology utilized to identify water sources in water analysis campaigns
# Terminology
1 Hand pump
2 Jetmatic Pump
3 Pitcher Pump
4 Shallow dugwell
6 Dugwell
7 Spring
8 LMWD (open pipe)
9 MCWD
10 LMWD
11 Communal facet (LMWD)
12 Communal Dist Faucet
13 Wash Project
14 Purifier
15 Spring Reservoir
16 Water bladder
17 McArthur Water Supply
System
18 MSF
19 Water Refilling Station
20 product water (Pyomitz
WRS)
21 Filtration
22 Level I
23 Level II
24 Level III
4.3 SANITATION
HHs with private toilets before Haiyan (#): before Haiyan, the number of HHs within the barangay which have
access to their own toilet which is not shared with other HHs (population referred to pre Haiyan). [Information
related to sanitation access and quality of the service].
HHs with private toilet before Haiyan (%): before Haiyan, the percentage of HHs within the barangay which
have access to their own toilet which is not shared with other HHs (population figure referred to pre Haiyan).
[Information related to sanitation access and quality of the service].
HHs currently with private toilet at present (#): number of HHs within the barangay which currently have
access to their own toilet which are not shared with other HHs (population referred to present). This figure also
includes emergency toilets provided by WASH Partners during the WASH emergency response. [Information
related to sanitation access and quality of the service. ndicator for Haiyan impact on sanitation access.]
HHs with private toilet at present (%): % of HHs within the barangay which currently have access to their own
toilet which are not shared with other HHs (population referred to present). This figure also includes emergency
Phase I Wash Baseline Assessment - Philippines - April 2014
http://philippines.humanitarianresponse.info/ 29
toilets provided by WASH Partners during the WASH emergency response. [Information related to sanitation
access and quality of the service. Indicator for Haiyan impact on sanitation] access.
HHs using communal toilets before Haiyan (#): before Haiyan, number of HHs within the barangay which are
sharing a toilet (population referred to pre Haiyan). [Information related to sanitation access and quality of the]
service.
HHs using communal toilets before Haiyan (%): before Haiyan, percentage of HHs within the barangay which
are sharing a toilet (population referred to pre Haiyan). [Information related to sanitation access and quality of the
service].
HHs currently using communal toilets (#): currently, number of HHs within the barangay which are sharing a
toilet (population referred to present). [Information related to sanitation access and quality of the service.
Indicator for Haiyan impact on sanitation access].
HHs currently using communal toilets (%): currently, percentage of HHs within the barangay which are
sharing a toilet (population referred to pre Haiyan). [Information related to sanitation access and quality of the
service. Indicator for Haiyan impact on sanitation access].
Open defecation (Y/N): KIs were asked if open defecation is practiced by HHs living in the barangay. This
information does not provide any figure on the number or percentage of population practicing open defecation.
Is open defecation perceived as a problem? (Y/N): KIs were asked if open defecation is perceived as a
potential health problem by HHs living in the barangay.
Open defecation increasing (Y/N): KIs were asked if open defecation has increased since Haiyan.
Land tenure issue (Y/N/ do not know): KIs were asked if there were HHs in the barangay which were not
allowed to build permanent toilets, or portions of land where the construction of permanent structures was not
allowed.
4.4 EMERGENCY ASSISTANCE POST HAIYAN
The questionnaire included ten questions for KIs to ascertain if their respective barangays have been involved in
the WASH or Shelter emergency response. They were limited to a Yes or No response - answering Yes meant
that the barangay received either WASH NFI or emergency shelter assistance, but it does not necessarily mean
that the entire population of the barangay has been covered. The main objective of this section of the
questionnaire is to identify the main gaps in the assistance provided at barangay level within a specific
municipality, as well as to identify the type of assistance not provided from a list of ten items, kits or services:
1. Family hygiene kits;
2. Water containers (any type);
3. Water trucking or distribution of bottled water;
4. Water disinfectant;
5. Plumbing tool kits;
6. Masonry/carpentry tool kits;
7. Toilet repair kit/emergency toilet kit;
Phase I Wash Baseline Assessment - Philippines - April 2014
http://philippines.humanitarianresponse.info/ 30
8. Shelter repair kits;
9. Water/sanitation/shelter repair trainings;
10. Hygiene promotion;
KIs were also asked if there were sari sari stores in their barangay selling personal hygiene items ( a measure of
market availability).
Unfortunately, there is limited data available regarding on-going M&E activities aimed to assess the impact of
these relief operations on the living conditions of the beneficiaries. If a more comprehensive assessment of
impact was to be undertaken, it would including verifying the level of standardization of content of the kits and
replenishment strategies and beneficiary selection criteria implemented in the response. The Philippines WASH
Cluster has a standard hygiene and water kit, but it would be useful to verify the compliance to this standard.
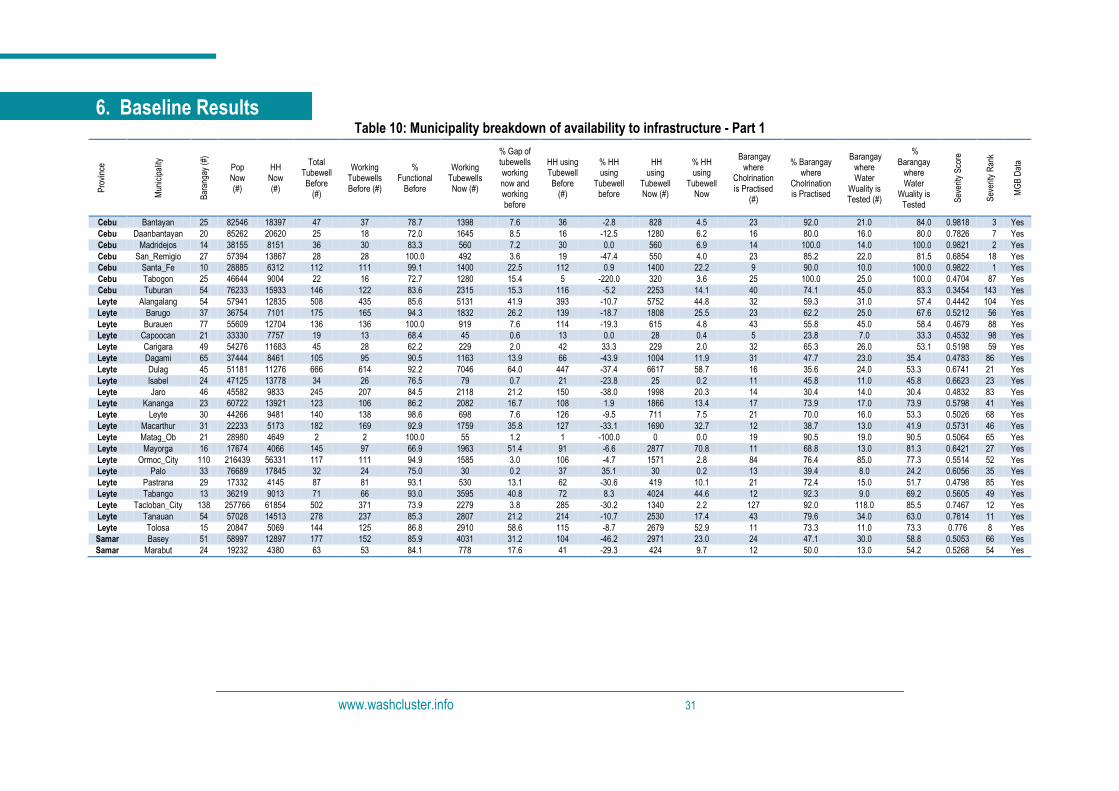
www.washcluster.info 31
6. Baseline Results Table 10: Municipality breakdown of availability to infrastructure - Part 1
Pro
vinc
e
Mun
icip
ality
Bar
anga
y (#
)
Pop Now (#)
HH Now (#)
Total Tubewell Before
(#)
Working Tubewells Before (#)
% Functional
Before
Working Tubewells Now (#)
% Gap of tubewells working now and working before
HH using Tubewell Before
(#)
% HH using
Tubewell before
HH using
Tubewell Now (#)
% HH using
Tubewell Now
Barangay where
Cholrination is Practised
(#)
% Barangay where
Cholrination is Practised
Barangay where Water
Wuality is Tested (#)
% Barangay
where Water
Wuality is Tested
Sev
erity
Sco
re
Sev
erity
Ran
k
MG
B D
ata
Cebu Bantayan 25 82546 18397 47 37 78.7 1398 7.6 36 -2.8 828 4.5 23 92.0 21.0 84.0 0.9818 3 Yes
Cebu Daanbantayan 20 85262 20620 25 18 72.0 1645 8.5 16 -12.5 1280 6.2 16 80.0 16.0 80.0 0.7826 7 Yes
Cebu Madridejos 14 38155 8151 36 30 83.3 560 7.2 30 0.0 560 6.9 14 100.0 14.0 100.0 0.9821 2 Yes
Cebu San_Remigio 27 57394 13867 28 28 100.0 492 3.6 19 -47.4 550 4.0 23 85.2 22.0 81.5 0.6854 18 Yes
Cebu Santa_Fe 10 28885 6312 112 111 99.1 1400 22.5 112 0.9 1400 22.2 9 90.0 10.0 100.0 0.9822 1 Yes
Cebu Tabogon 25 46644 9004 22 16 72.7 1280 15.4 5 -220.0 320 3.6 25 100.0 25.0 100.0 0.4704 87 Yes
Cebu Tuburan 54 76233 15933 146 122 83.6 2315 15.3 116 -5.2 2253 14.1 40 74.1 45.0 83.3 0.3454 143 Yes
Leyte Alangalang 54 57941 12835 508 435 85.6 5131 41.9 393 -10.7 5752 44.8 32 59.3 31.0 57.4 0.4442 104 Yes
Leyte Barugo 37 36754 7101 175 165 94.3 1832 26.2 139 -18.7 1808 25.5 23 62.2 25.0 67.6 0.5212 56 Yes
Leyte Burauen 77 55609 12704 136 136 100.0 919 7.6 114 -19.3 615 4.8 43 55.8 45.0 58.4 0.4679 88 Yes
Leyte Capoocan 21 33330 7757 19 13 68.4 45 0.6 13 0.0 28 0.4 5 23.8 7.0 33.3 0.4532 98 Yes
Leyte Carigara 49 54276 11683 45 28 62.2 229 2.0 42 33.3 229 2.0 32 65.3 26.0 53.1 0.5198 59 Yes
Leyte Dagami 65 37444 8461 105 95 90.5 1163 13.9 66 -43.9 1004 11.9 31 47.7 23.0 35.4 0.4783 86 Yes
Leyte Dulag 45 51181 11276 666 614 92.2 7046 64.0 447 -37.4 6617 58.7 16 35.6 24.0 53.3 0.6741 21 Yes
Leyte Isabel 24 47125 13778 34 26 76.5 79 0.7 21 -23.8 25 0.2 11 45.8 11.0 45.8 0.6623 23 Yes
Leyte Jaro 46 45582 9833 245 207 84.5 2118 21.2 150 -38.0 1998 20.3 14 30.4 14.0 30.4 0.4832 83 Yes
Leyte Kananga 23 60722 13921 123 106 86.2 2082 16.7 108 1.9 1866 13.4 17 73.9 17.0 73.9 0.5798 41 Yes
Leyte Leyte 30 44266 9481 140 138 98.6 698 7.6 126 -9.5 711 7.5 21 70.0 16.0 53.3 0.5026 68 Yes
Leyte Macarthur 31 22233 5173 182 169 92.9 1759 35.8 127 -33.1 1690 32.7 12 38.7 13.0 41.9 0.5731 46 Yes
Leyte Matag_Ob 21 28980 4649 2 2 100.0 55 1.2 1 -100.0 0 0.0 19 90.5 19.0 90.5 0.5064 65 Yes
Leyte Mayorga 16 17674 4066 145 97 66.9 1963 51.4 91 -6.6 2877 70.8 11 68.8 13.0 81.3 0.6421 27 Yes
Leyte Ormoc_City 110 216439 56331 117 111 94.9 1585 3.0 106 -4.7 1571 2.8 84 76.4 85.0 77.3 0.5514 52 Yes
Leyte Palo 33 76689 17845 32 24 75.0 30 0.2 37 35.1 30 0.2 13 39.4 8.0 24.2 0.6056 35 Yes
Leyte Pastrana 29 17332 4145 87 81 93.1 530 13.1 62 -30.6 419 10.1 21 72.4 15.0 51.7 0.4798 85 Yes
Leyte Tabango 13 36219 9013 71 66 93.0 3595 40.8 72 8.3 4024 44.6 12 92.3 9.0 69.2 0.5605 49 Yes
Leyte Tacloban_City 138 257766 61854 502 371 73.9 2279 3.8 285 -30.2 1340 2.2 127 92.0 118.0 85.5 0.7467 12 Yes
Leyte Tanauan 54 57028 14513 278 237 85.3 2807 21.2 214 -10.7 2530 17.4 43 79.6 34.0 63.0 0.7614 11 Yes
Leyte Tolosa 15 20847 5069 144 125 86.8 2910 58.6 115 -8.7 2679 52.9 11 73.3 11.0 73.3 0.776 8 Yes
Samar Basey 51 58997 12897 177 152 85.9 4031 31.2 104 -46.2 2971 23.0 24 47.1 30.0 58.8 0.5053 66 Yes
Samar Marabut 24 19232 4380 63 53 84.1 778 17.6 41 -29.3 424 9.7 12 50.0 13.0 54.2 0.5268 54 Yes
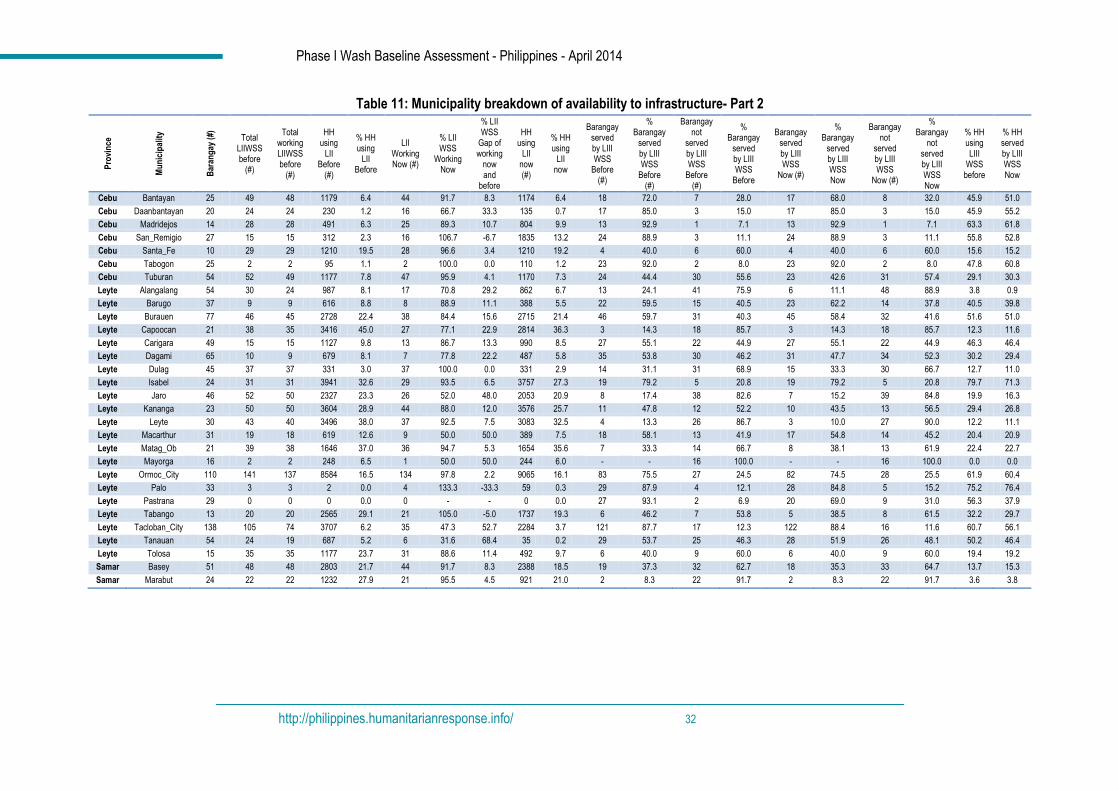
Phase I Wash Baseline Assessment - Philippines - April 2014
http://philippines.humanitarianresponse.info/ 32
Table 11: Municipality breakdown of availability to infrastructure- Part 2 P
rovi
nce
Mu
nic
ipal
ity
Bar
ang
ay (
#)
Total LIIWSS before
(#)
Total working LIIWSS before
(#)
HH using
LII Before
(#)
% HH using
LII Before
LII Working Now (#)
% LII WSS
Working Now
% LII WSS
Gap of working
now and
before
HH using
LII now (#)
% HH using
LII now
Barangay served by LIII WSS
Before (#)
% Barangay
served by LIII WSS
Before (#)
Barangay not
served by LIII WSS
Before (#)
% Barangay
served by LIII WSS
Before
Barangay served by LIII WSS
Now (#)
% Barangay
served by LIII WSS Now
Barangay not
served by LIII WSS
Now (#)
% Barangay
not served by LIII WSS Now
% HH using LIII
WSS before
% HH served by LIII WSS Now
Cebu Bantayan 25 49 48 1179 6.4 44 91.7 8.3 1174 6.4 18 72.0 7 28.0 17 68.0 8 32.0 45.9 51.0
Cebu Daanbantayan 20 24 24 230 1.2 16 66.7 33.3 135 0.7 17 85.0 3 15.0 17 85.0 3 15.0 45.9 55.2
Cebu Madridejos 14 28 28 491 6.3 25 89.3 10.7 804 9.9 13 92.9 1 7.1 13 92.9 1 7.1 63.3 61.8
Cebu San_Remigio 27 15 15 312 2.3 16 106.7 -6.7 1835 13.2 24 88.9 3 11.1 24 88.9 3 11.1 55.8 52.8
Cebu Santa_Fe 10 29 29 1210 19.5 28 96.6 3.4 1210 19.2 4 40.0 6 60.0 4 40.0 6 60.0 15.6 15.2
Cebu Tabogon 25 2 2 95 1.1 2 100.0 0.0 110 1.2 23 92.0 2 8.0 23 92.0 2 8.0 47.8 60.8
Cebu Tuburan 54 52 49 1177 7.8 47 95.9 4.1 1170 7.3 24 44.4 30 55.6 23 42.6 31 57.4 29.1 30.3
Leyte Alangalang 54 30 24 987 8.1 17 70.8 29.2 862 6.7 13 24.1 41 75.9 6 11.1 48 88.9 3.8 0.9
Leyte Barugo 37 9 9 616 8.8 8 88.9 11.1 388 5.5 22 59.5 15 40.5 23 62.2 14 37.8 40.5 39.8
Leyte Burauen 77 46 45 2728 22.4 38 84.4 15.6 2715 21.4 46 59.7 31 40.3 45 58.4 32 41.6 51.6 51.0
Leyte Capoocan 21 38 35 3416 45.0 27 77.1 22.9 2814 36.3 3 14.3 18 85.7 3 14.3 18 85.7 12.3 11.6
Leyte Carigara 49 15 15 1127 9.8 13 86.7 13.3 990 8.5 27 55.1 22 44.9 27 55.1 22 44.9 46.3 46.4
Leyte Dagami 65 10 9 679 8.1 7 77.8 22.2 487 5.8 35 53.8 30 46.2 31 47.7 34 52.3 30.2 29.4
Leyte Dulag 45 37 37 331 3.0 37 100.0 0.0 331 2.9 14 31.1 31 68.9 15 33.3 30 66.7 12.7 11.0
Leyte Isabel 24 31 31 3941 32.6 29 93.5 6.5 3757 27.3 19 79.2 5 20.8 19 79.2 5 20.8 79.7 71.3
Leyte Jaro 46 52 50 2327 23.3 26 52.0 48.0 2053 20.9 8 17.4 38 82.6 7 15.2 39 84.8 19.9 16.3
Leyte Kananga 23 50 50 3604 28.9 44 88.0 12.0 3576 25.7 11 47.8 12 52.2 10 43.5 13 56.5 29.4 26.8
Leyte Leyte 30 43 40 3496 38.0 37 92.5 7.5 3083 32.5 4 13.3 26 86.7 3 10.0 27 90.0 12.2 11.1
Leyte Macarthur 31 19 18 619 12.6 9 50.0 50.0 389 7.5 18 58.1 13 41.9 17 54.8 14 45.2 20.4 20.9
Leyte Matag_Ob 21 39 38 1646 37.0 36 94.7 5.3 1654 35.6 7 33.3 14 66.7 8 38.1 13 61.9 22.4 22.7
Leyte Mayorga 16 2 2 248 6.5 1 50.0 50.0 244 6.0 - - 16 100.0 - - 16 100.0 0.0 0.0
Leyte Ormoc_City 110 141 137 8584 16.5 134 97.8 2.2 9065 16.1 83 75.5 27 24.5 82 74.5 28 25.5 61.9 60.4
Leyte Palo 33 3 3 2 0.0 4 133.3 -33.3 59 0.3 29 87.9 4 12.1 28 84.8 5 15.2 75.2 76.4
Leyte Pastrana 29 0 0 0 0.0 0 - - 0 0.0 27 93.1 2 6.9 20 69.0 9 31.0 56.3 37.9
Leyte Tabango 13 20 20 2565 29.1 21 105.0 -5.0 1737 19.3 6 46.2 7 53.8 5 38.5 8 61.5 32.2 29.7
Leyte Tacloban_City 138 105 74 3707 6.2 35 47.3 52.7 2284 3.7 121 87.7 17 12.3 122 88.4 16 11.6 60.7 56.1
Leyte Tanauan 54 24 19 687 5.2 6 31.6 68.4 35 0.2 29 53.7 25 46.3 28 51.9 26 48.1 50.2 46.4
Leyte Tolosa 15 35 35 1177 23.7 31 88.6 11.4 492 9.7 6 40.0 9 60.0 6 40.0 9 60.0 19.4 19.2
Samar Basey 51 48 48 2803 21.7 44 91.7 8.3 2388 18.5 19 37.3 32 62.7 18 35.3 33 64.7 13.7 15.3
Samar Marabut 24 22 22 1232 27.9 21 95.5 4.5 921 21.0 2 8.3 22 91.7 2 8.3 22 91.7 3.6 3.8
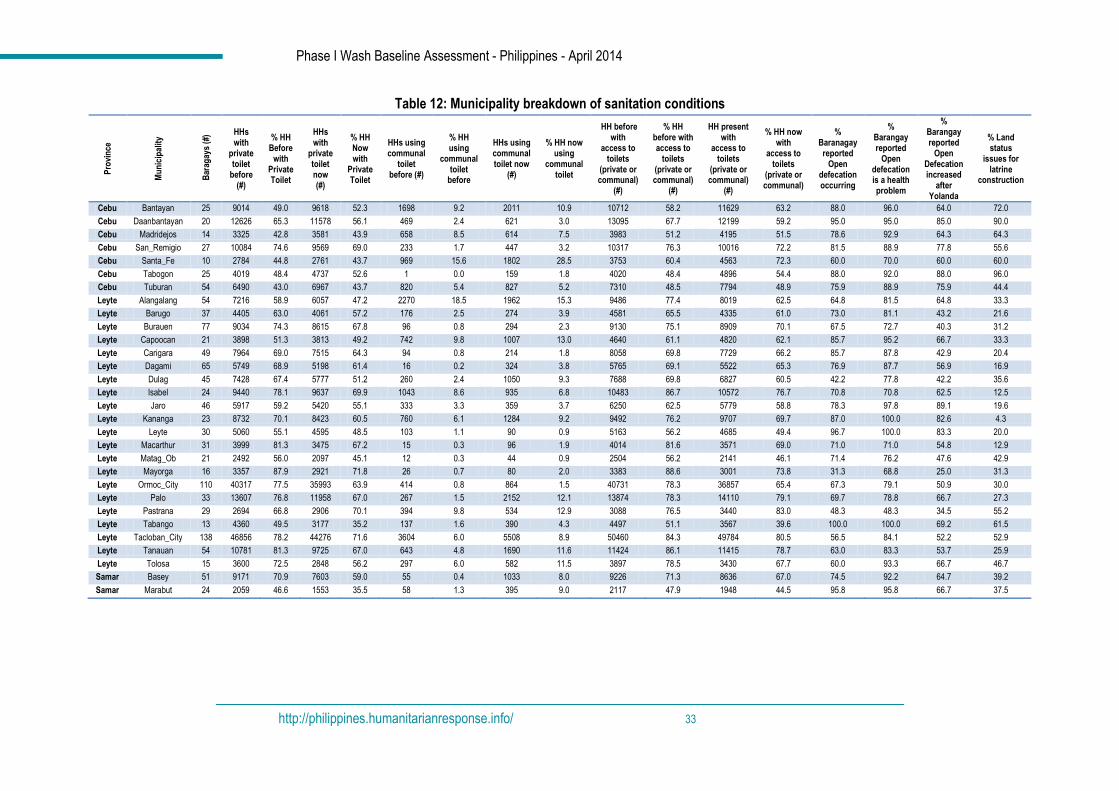
Phase I Wash Baseline Assessment - Philippines - April 2014
http://philippines.humanitarianresponse.info/ 33
Table 12: Municipality breakdown of sanitation conditions P
rovi
nce
Mu
nic
ipal
ity
Bar
agay
s (#
) HHs with
private toilet
before (#)
% HH Before
with Private Toilet
HHs with
private toilet now (#)
% HH Now with
Private Toilet
HHs using communal
toilet before (#)
% HH using
communal toilet
before
HHs using communal toilet now
(#)
% HH now using
communal toilet
HH before with
access to toilets
(private or communal)
(#)
% HH before with access to
toilets (private or communal)
(#)
HH present with
access to toilets
(private or communal)
(#)
% HH now with
access to toilets
(private or communal)
% Baranagay reported
Open defecation occurring
% Barangay reported
Open defecation is a health problem
% Barangay reported
Open Defecation increased
after Yolanda
% Land status
issues for latrine
construction
Cebu Bantayan 25 9014 49.0 9618 52.3 1698 9.2 2011 10.9 10712 58.2 11629 63.2 88.0 96.0 64.0 72.0
Cebu Daanbantayan 20 12626 65.3 11578 56.1 469 2.4 621 3.0 13095 67.7 12199 59.2 95.0 95.0 85.0 90.0
Cebu Madridejos 14 3325 42.8 3581 43.9 658 8.5 614 7.5 3983 51.2 4195 51.5 78.6 92.9 64.3 64.3
Cebu San_Remigio 27 10084 74.6 9569 69.0 233 1.7 447 3.2 10317 76.3 10016 72.2 81.5 88.9 77.8 55.6
Cebu Santa_Fe 10 2784 44.8 2761 43.7 969 15.6 1802 28.5 3753 60.4 4563 72.3 60.0 70.0 60.0 60.0
Cebu Tabogon 25 4019 48.4 4737 52.6 1 0.0 159 1.8 4020 48.4 4896 54.4 88.0 92.0 88.0 96.0
Cebu Tuburan 54 6490 43.0 6967 43.7 820 5.4 827 5.2 7310 48.5 7794 48.9 75.9 88.9 75.9 44.4
Leyte Alangalang 54 7216 58.9 6057 47.2 2270 18.5 1962 15.3 9486 77.4 8019 62.5 64.8 81.5 64.8 33.3
Leyte Barugo 37 4405 63.0 4061 57.2 176 2.5 274 3.9 4581 65.5 4335 61.0 73.0 81.1 43.2 21.6
Leyte Burauen 77 9034 74.3 8615 67.8 96 0.8 294 2.3 9130 75.1 8909 70.1 67.5 72.7 40.3 31.2
Leyte Capoocan 21 3898 51.3 3813 49.2 742 9.8 1007 13.0 4640 61.1 4820 62.1 85.7 95.2 66.7 33.3
Leyte Carigara 49 7964 69.0 7515 64.3 94 0.8 214 1.8 8058 69.8 7729 66.2 85.7 87.8 42.9 20.4
Leyte Dagami 65 5749 68.9 5198 61.4 16 0.2 324 3.8 5765 69.1 5522 65.3 76.9 87.7 56.9 16.9
Leyte Dulag 45 7428 67.4 5777 51.2 260 2.4 1050 9.3 7688 69.8 6827 60.5 42.2 77.8 42.2 35.6
Leyte Isabel 24 9440 78.1 9637 69.9 1043 8.6 935 6.8 10483 86.7 10572 76.7 70.8 70.8 62.5 12.5
Leyte Jaro 46 5917 59.2 5420 55.1 333 3.3 359 3.7 6250 62.5 5779 58.8 78.3 97.8 89.1 19.6
Leyte Kananga 23 8732 70.1 8423 60.5 760 6.1 1284 9.2 9492 76.2 9707 69.7 87.0 100.0 82.6 4.3
Leyte Leyte 30 5060 55.1 4595 48.5 103 1.1 90 0.9 5163 56.2 4685 49.4 96.7 100.0 83.3 20.0
Leyte Macarthur 31 3999 81.3 3475 67.2 15 0.3 96 1.9 4014 81.6 3571 69.0 71.0 71.0 54.8 12.9
Leyte Matag_Ob 21 2492 56.0 2097 45.1 12 0.3 44 0.9 2504 56.2 2141 46.1 71.4 76.2 47.6 42.9
Leyte Mayorga 16 3357 87.9 2921 71.8 26 0.7 80 2.0 3383 88.6 3001 73.8 31.3 68.8 25.0 31.3
Leyte Ormoc_City 110 40317 77.5 35993 63.9 414 0.8 864 1.5 40731 78.3 36857 65.4 67.3 79.1 50.9 30.0
Leyte Palo 33 13607 76.8 11958 67.0 267 1.5 2152 12.1 13874 78.3 14110 79.1 69.7 78.8 66.7 27.3
Leyte Pastrana 29 2694 66.8 2906 70.1 394 9.8 534 12.9 3088 76.5 3440 83.0 48.3 48.3 34.5 55.2
Leyte Tabango 13 4360 49.5 3177 35.2 137 1.6 390 4.3 4497 51.1 3567 39.6 100.0 100.0 69.2 61.5
Leyte Tacloban_City 138 46856 78.2 44276 71.6 3604 6.0 5508 8.9 50460 84.3 49784 80.5 56.5 84.1 52.2 52.9
Leyte Tanauan 54 10781 81.3 9725 67.0 643 4.8 1690 11.6 11424 86.1 11415 78.7 63.0 83.3 53.7 25.9
Leyte Tolosa 15 3600 72.5 2848 56.2 297 6.0 582 11.5 3897 78.5 3430 67.7 60.0 93.3 66.7 46.7
Samar Basey 51 9171 70.9 7603 59.0 55 0.4 1033 8.0 9226 71.3 8636 67.0 74.5 92.2 64.7 39.2
Samar Marabut 24 2059 46.6 1553 35.5 58 1.3 395 9.0 2117 47.9 1948 44.5 95.8 95.8 66.7 37.5
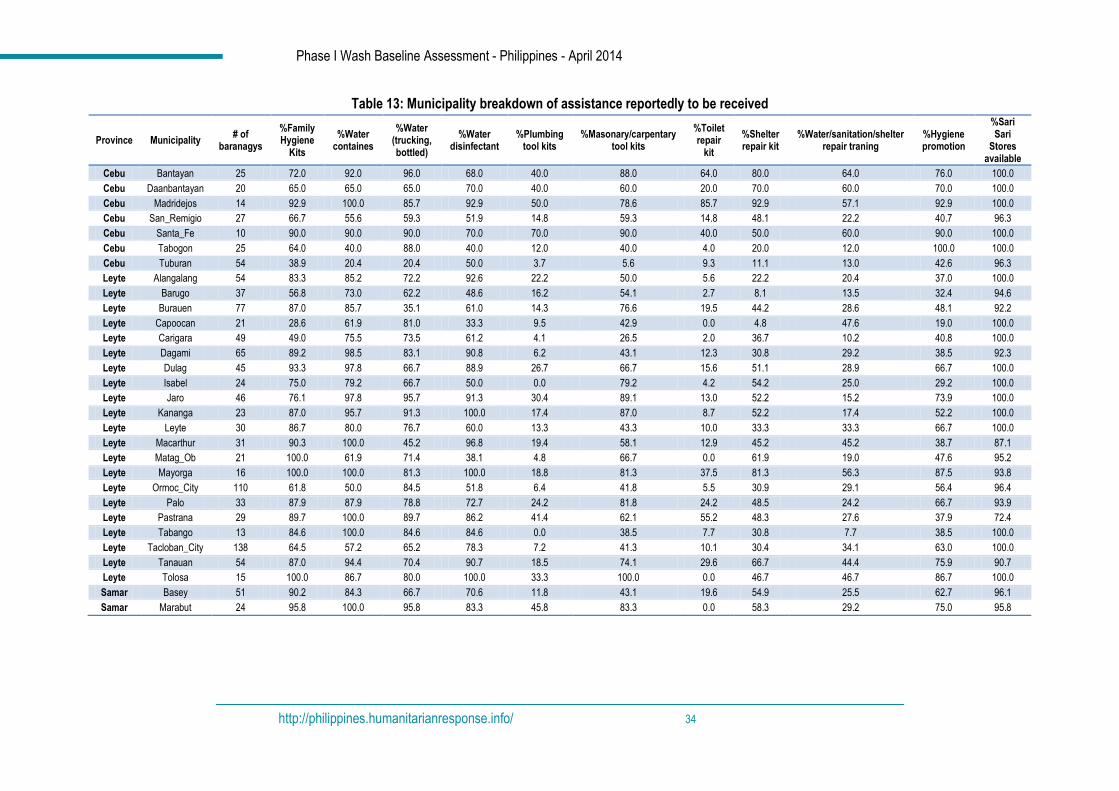
Phase I Wash Baseline Assessment - Philippines - April 2014
http://philippines.humanitarianresponse.info/ 34
Table 13: Municipality breakdown of assistance reportedly to be received
Province Municipality # of
baranagys
%Family Hygiene
Kits
%Water containes
%Water (trucking, bottled)
%Water disinfectant
%Plumbing tool kits
%Masonary/carpentary tool kits
%Toilet repair
kit
%Shelter repair kit
%Water/sanitation/shelter repair traning
%Hygiene promotion
%Sari Sari
Stores available
Cebu Bantayan 25 72.0 92.0 96.0 68.0 40.0 88.0 64.0 80.0 64.0 76.0 100.0
Cebu Daanbantayan 20 65.0 65.0 65.0 70.0 40.0 60.0 20.0 70.0 60.0 70.0 100.0
Cebu Madridejos 14 92.9 100.0 85.7 92.9 50.0 78.6 85.7 92.9 57.1 92.9 100.0
Cebu San_Remigio 27 66.7 55.6 59.3 51.9 14.8 59.3 14.8 48.1 22.2 40.7 96.3
Cebu Santa_Fe 10 90.0 90.0 90.0 70.0 70.0 90.0 40.0 50.0 60.0 90.0 100.0
Cebu Tabogon 25 64.0 40.0 88.0 40.0 12.0 40.0 4.0 20.0 12.0 100.0 100.0
Cebu Tuburan 54 38.9 20.4 20.4 50.0 3.7 5.6 9.3 11.1 13.0 42.6 96.3
Leyte Alangalang 54 83.3 85.2 72.2 92.6 22.2 50.0 5.6 22.2 20.4 37.0 100.0
Leyte Barugo 37 56.8 73.0 62.2 48.6 16.2 54.1 2.7 8.1 13.5 32.4 94.6
Leyte Burauen 77 87.0 85.7 35.1 61.0 14.3 76.6 19.5 44.2 28.6 48.1 92.2
Leyte Capoocan 21 28.6 61.9 81.0 33.3 9.5 42.9 0.0 4.8 47.6 19.0 100.0
Leyte Carigara 49 49.0 75.5 73.5 61.2 4.1 26.5 2.0 36.7 10.2 40.8 100.0
Leyte Dagami 65 89.2 98.5 83.1 90.8 6.2 43.1 12.3 30.8 29.2 38.5 92.3
Leyte Dulag 45 93.3 97.8 66.7 88.9 26.7 66.7 15.6 51.1 28.9 66.7 100.0
Leyte Isabel 24 75.0 79.2 66.7 50.0 0.0 79.2 4.2 54.2 25.0 29.2 100.0
Leyte Jaro 46 76.1 97.8 95.7 91.3 30.4 89.1 13.0 52.2 15.2 73.9 100.0
Leyte Kananga 23 87.0 95.7 91.3 100.0 17.4 87.0 8.7 52.2 17.4 52.2 100.0
Leyte Leyte 30 86.7 80.0 76.7 60.0 13.3 43.3 10.0 33.3 33.3 66.7 100.0
Leyte Macarthur 31 90.3 100.0 45.2 96.8 19.4 58.1 12.9 45.2 45.2 38.7 87.1
Leyte Matag_Ob 21 100.0 61.9 71.4 38.1 4.8 66.7 0.0 61.9 19.0 47.6 95.2
Leyte Mayorga 16 100.0 100.0 81.3 100.0 18.8 81.3 37.5 81.3 56.3 87.5 93.8
Leyte Ormoc_City 110 61.8 50.0 84.5 51.8 6.4 41.8 5.5 30.9 29.1 56.4 96.4
Leyte Palo 33 87.9 87.9 78.8 72.7 24.2 81.8 24.2 48.5 24.2 66.7 93.9
Leyte Pastrana 29 89.7 100.0 89.7 86.2 41.4 62.1 55.2 48.3 27.6 37.9 72.4
Leyte Tabango 13 84.6 100.0 84.6 84.6 0.0 38.5 7.7 30.8 7.7 38.5 100.0
Leyte Tacloban_City 138 64.5 57.2 65.2 78.3 7.2 41.3 10.1 30.4 34.1 63.0 100.0
Leyte Tanauan 54 87.0 94.4 70.4 90.7 18.5 74.1 29.6 66.7 44.4 75.9 90.7
Leyte Tolosa 15 100.0 86.7 80.0 100.0 33.3 100.0 0.0 46.7 46.7 86.7 100.0
Samar Basey 51 90.2 84.3 66.7 70.6 11.8 43.1 19.6 54.9 25.5 62.7 96.1
Samar Marabut 24 95.8 100.0 95.8 83.3 45.8 83.3 0.0 58.3 29.2 75.0 95.8
Phase I Wash Baseline Assessment - Philippines - April 2014
http://philippines.humanitarianresponse.info/ 35
7. Contact Details and Annexes
National WASH Cluster Team
Roland Santiago – Department of Health ([email protected])
Rory Villaluna – National WASH Cluster Coordinator ([email protected])
Nicole Hahn - Sub-National WASH Cluster Coordinator – Leyte ([email protected])
Chris Czpak– Sub-National - WASH Cluster Information Manager – Leyte ([email protected])
Nina Odling – Sub-National - WASH Cluster Coordinator – Cebu ([email protected])
WASH Assessment Team
Francesco Dotto – Inter-Agency Rapid Assessment Team (Global WASH Cluster) ([email protected])
Abel Augustino – Inter-Agency Rapid Assessment Team (Global WASH Cluster) ([email protected])
Robert Trigwell - REACH GIS Specialist ([email protected])
Annex 1: Raw and aggregated data
Annex 2: Baseline Tool
Annex 3: WASH Baseline Survey Training Tool
Annex 4: Water Quality Results and Raw Dataset
Annex 5: WASH Intention Survey Results
Annex 6: Intention Questionnaire and Indicators
For all maps, reports and annexes, please visit:
http://resource.reach-initiative.org/
Phase I Wash Baseline Assessment - Philippines - April 2014
http://philippines.humanitarianresponse.info/ 36
A product of
The Philippines National WASH Cluster is co-led by the Department of Health and UNICEF. For this response, a total of 25+ international and local partners coming from government and civil society continue to be actively engaged in the WASH cluster both at national and sub-national levels. The WASH Cluster has a five year strategic plan and do not deactivate as it tries to contribute in building resilient communities and local capacities for managing WASH response in emergencies. See more at the WASH Cluster page in the Philippine Humanitarian Response website: http://philippines.humanitarianresponse.info/
The global WASH Cluster Rapid Assessment Team (RAT) is a consortium of active WASH agencies (CARE, IFRC and OXFAM) which deploys in the early stages of major emergencies or crises, to provide a rapid assessment of WASH needs to all stakeholders - See more at http://www.washcluster.info
REACH is a joint initiative of two international non-governmental organizations - ACTED and IMPACT Initiatives - and the UN Operational Satellite Applications Programme (UNOSAT). REACH was created in 2010 to facilitate the development of information tools and products that enhance the capacity of aid actors to make evidence-based decisions in emergency, recovery and development contexts. All REACH activities are conducted in support to and within the framework of inter-agency aid coordination mechanisms. For more information, please visit: www.reach-initiative.org. You can write to us at: [email protected] and follow us @REACH_info.