Embed Size (px)
DESCRIPTION
http://www.energyfromthorium.com/pdf/WASH-1184.pdf
Citation preview

WASH-118**
UPDATED (1970)
COST-BENEFIT ANALYSIS
OF THE
U.S. BREEDER REACTOR
PROGRAM
January 1972
-NOT ICE-This report was prepared as an account of work sponsored by the United States Government. Neither the United States nor the United States Atomic Energy Commission, nor any of their employees, nor any of their contractors, subcontractors, or their employees, makes any warranty, express or implied, or assumes any legal liability or responsibility for the accuracy, completeness or usefulness of any information, apparatus, product or process disclosed, or represents that its use would not infringe privately owned rights.
Prepared by
Divis ion of Reactor Development and Technology
U. S. Atomic Energy Commission
For sale by the Superintendent of Documents, U.S. Government Printing Office, Washington, D.C. 20402 - Price 65 cents
5KTa<ei{TH]N Of THIS DOCUMENT !S U«L1«WT

DISCLAIMER
This report was prepared as an account of work sponsored by an agency of the United States Government. Neither the United States Government nor any agency Thereof, nor any of their employees, makes any warranty, express or implied, or assumes any legal liability or responsibility for the accuracy, completeness, or usefulness of any information, apparatus, product, or process disclosed, or represents that its use would not infringe privately owned rights. Reference herein to any specific commercial product, process, or service by trade name, trademark, manufacturer, or otherwise does not necessarily constitute or imply its endorsement, recommendation, or favoring by the United States Government or any agency thereof. The views and opinions of authors expressed herein do not necessarily state or reflect those of the United States Government or any agency thereof.

DISCLAIMER Portions of this document may be illegible in electronic image products. Images are produced from the best available original document.
^ PREFACE
(Updated Cost-Benefit Analysis)
On June f, 1971 President Nixon sent to the U.S. Congress a comprehensive
Energy Message which proposed a program to ensure an adequate supply of
clean energy for the years ahead. This message was the first such action
by a President of the U.S. dealing exclusively with this vital subject.
The major theme of the Presidential message was that recent intensive
national enez>gy study efforts had converged to the conclusion that
comprehensive actions must be taken now to assure the United States a
sufficient supply of clean energy to sustain healthy economic growth
and to improve the quality of our national life. The message stressed
the fact that shortages of electrical power and clean fuel, sharp increases
in certain fuel prices, and a growing awareness of environmental consequences
of energy production and use have all demonstrated that the United States
can no longer take a plentiful supply of energy for granted.
The Energy Message set forth a broad range of specific goals and actions
designed to assure -^e Nation an adequate future supply of clean energy.
These direct measures included l^e assignment of a high priority to civilian
nuclear power in meeting the Nation's future needs f<»> electrical energy.
The Message stated tiiat:
"Our best hc^e today for. meeting the Nation's growing demand for
economical clean energy lies with the fast breeder reactor."
To realize the immense potential of the fast breeder, the President provided
augmented funding for tiie Liquid Metal Fast Breeder Reactor (LMFBR) and
-1 -

established a national commitment to complete the successful demonstration M
of a Liquid Metal Fast Breeder Reactor by 1980.
The substantial benefits to be realized from the breeder were clearly
brought out it» a 1968 AEC Study entitled "Cost-Benefit Analysis of the
U.S. Breeder Program" subsequently published as WASH 1126. This Study
indicated that the readily quantifiable benefits of a successful
commercial breeder in the form of reduced cost of electrical energy,
reductions in ureuiium ore requirements and separative work demand, increased
Plutonium production, and use of the depleted uranium bsrproduct from the
diffusion plants would exceed the development costs of the breeder by a
significant amount. Other benefits, quantifiable and non-quantifiable, such
eis those associated with reductions in air pollution and enhanced social
values through the availability of low-cost electricity were noted. It
is apparent that the results of this Study in combination with other
important national studies on alternative energy production systems
contributed in a major way to achieving the consensus of support which hcis
developed for the breeder program.
Recognizing the rapidly changing nature of the U.S. energy program, it was
decided to update the 1968 Study. The updating, started in 1970, which is
reported in this docimient, indicates that the anticipated benefits are
about twice as large as reported in the 1968 Study. This is attributable
primarily to the greater electrical energy demands that are now being
projected, the increase in the cost of fossil fuels since performing the
last study, and the increased cost of uranium separative work which tends to
improve the competitive position of the breeder over light water tractors.
At a 7% per year discount rate, the anticipated benefits to the Nation in
terms of decreased energy costs, as a result of the timely Introduction of -
the breeder, are from >t.S to 9 times the estimated cost of the development
- 11 -

«ogram. The updated cost-benefit ratios are approximately double those
the 1968 Study.
While these results are highly encouraging, the reader should keep in mind
that the primary puz*pose of this Study is to provide information that will
be useful to the AEC, as well as others in the energy and environmental
communities, in guiding research and development programs to assure
pertinence to the national need. The continuing cost-benefit analysis
studies are integral to the LMFBR program that is new entering the demon
stration plant phase.
Parametric studies involving projections are a continuing LMFBR program
activity. The assumptions basic to these studies are reviewed, the
analysis techniques refined, and the studies updated as appropriate. This
affords a continuous monitoring of the program and provides a tool which
can be used to quickly obtain an indication of the effect of changes on the
Nation's electric power system.
It should be noted that analytic studies which extend 50 years into the
future should be used primarily to indicate trends that may result from
changes in parameters. The validity of the projections is directly dependent
on the veQ.idity of the assumptions used in the study. The reader should
keep this fact and the assumptions clearly in mind when reviewing the
results and avoid a natural tendency to use such parameter studies that
involve projections into the future as absolute forecasts.
Milton Shaw, Director ^ ^ Division of Reactor Develc^ment ^ ^ and Technology
iii -

TABLE OF CONTENTS
PREFACE
1.0 INTRODUCTION
2.0 SUMMARY OF UPDATED COST-BENEFIT ANALYSIS
3.0 DISCUSSION OF COST-BENEFIT ANALYSIS
H.O MAJOR ASSUMPTIONS USED IN THE ANALYSIS
APPENDIX
"A" - Rationale For Updated (1970) Cost-Benefit Analysis
Fossil Fuel Cost Projection
- iv -

GLOSSARY
AEC
EBR-II
FFTF
FPC
FUELCO
GCFR
HTGR
LMFBR
LWBR
LWR
MSBR
PBR
R&D
RDT
"3^8
U.S. Atomic Energy Commission
Experimental Breeder Reactor-II
Fast Flux Test Facility
Federal Power Commission
A computer code used for calculating fuel cycle costs
Gas Cooled Fast Reactor
High Temperature Gas Reactor
Liquid Metal-Cooled Fast Breeder Reactor
Light Hater Breeder Reactor
Light Water Reactor
Molten Salt Breeder Reactm>
Parallel Breeder Reactor
Research and Development
Division of Reactor Development and Technology, AEC
A stable oxide of uranium used as the reference chemical compound for quantitative measurements of uranium. Sales transactions of uranium concentrates ("Yellow Cake") and measurement of reserves are generally based upon theoretical U»0. equivalent.
- V -

LIST OF TABLES
Table 1 - Cases Considered
Page
Table 2 - Summary of Estimated AEC Research and Development
Costs 11
Table 3 - Costs, Benefits, and Benefit/Cost Ratio to Year 2020
for Breeder Program (Undiscounted and Discounted to
Mid-1971 @ 7%/Year) IH
Table >t - Uranium and Separative Work Demand Requirements 15
Table 5 - Costs, Benefits, and Benefit/Cost Ratio to Year 2020
for Breeder Program (Undiscounted and Discounted to
Mid-1971 @ 5%/Year) 28
Table 6 - Costs, Benefits, and Benefit/Cost Ratio to Year 2020
for Breeder Program (Undiscounted and Discounted to
Mid-1971 @ 7%/Year) 29
Table 7 - Costs, Benefits, and Benefit/Cost Ratio to Year 2020
for Breeder Program (Undiscounted and Discounted to
Mid-1971 @ 10%/Year) 30
Table 8 - Costs, Benefits, and Benefit/Cost Ratio to Year 2020
for Breeder Program (Undiscounted and Discounted to
Mid-1971 @ 12.5%/Year) 31
Table 9 - Generating Capacity Placed in Operation with Known
Uranium Resources as of January 1, 1970, Probable
Energy Demand, and HTGR Intz*oduced in 1978 3*
Table 10 - T3rpical Reactor Characteristics Used in Analysis .... HO
Table 11 - Representative Fuel Fabrication and Reprocessing
Costs 41
Table 12 - Uranium Cost Versus Supply «»2
Table 13 - Estimates of Electrical Energy Demand 1970-2020 45
- vi -

LIST OF FIGURES
Page
Figure 1 - Undiscounted Breeder Benefits, Mid-1971 to 2020 .... 19
Figure 2 - 7%/Year Discounted Breeder Benefits, Mid-1971 to
2020 20
Figure 3 - Separative Work Demand 26
Figure •+ - Capital Cost Ground Rule 37
Figure 5 - Average Annual Capacity Factor Histories 46
- vii -
1.0 INTRODUCTION
In 1968, the Division of Reactor Development and Technology (RDT), with the
assistance of the Hanford Engineering Development Laboratory, performed an
analysis of the cost and benefits associated with a number of postulated
cases involving the introduction of the breeder reactor into the U.S.
electric power economy. This Study was published in April 1969 as WASH-1126,
"Cost-Benefit Analysis of the U.S. Breeder Reactor Program." The analysis
confirmed that the Liquid Metal-Cooled Fast Breeder Reactor (LMFBR) can
produce large direct money benefits by making low-cost electrical energy
avadlable to the Nation while simultaneously reducing uranium and separative
work requirements. It also indicated that deferring the presently planned
LMFBR research and development (R&D) program with consequent delays in the
commercial introduction of the LMFBR would reduce the benefits of the LMFBR
while slightly Increasing the cost of the R&D program.
At the time the 1968 Study was performed, the eissumptlons were based upon
the best information available; however, since then there has been a marked
change in the energy economy. The actual consumption of electricity in 1968
and 1969 has been higher than that predicted in 1968, and the Federal Power
Commission (PPC) has substantially increased their energy projections.
Their ctirrently projected energy demand, with an increase of 25% in the
Year 2000, is nearer that of the high energy demand case of the 1968 Study.
In the latter part of 1965, the utility industry purchased a number of
nuclear power plants. This conmitment to nuclear power resulted in a marked
increase in uranium prospecting. It has required from three to five years
for the results of this prospecting to be realized in an increase in uranium
1 -

z*eserves. Inflation, which has been particularly rampant in the constructioji
trades, the addition of cooling towers, and other costs associated with ^
environmental and safety considerations have caused the capital costs
of both fossil and nuclear plants to increase about 50%. Fossil fuel costs,
which were projected to remain essentially level in the earlier Study, have
actually increased by about 35% due to the enactment of air quality regula
tions and a temporary shortage of fossil fuel.
Prediction of the combined effects of these changes is not straightforward.
The higher energy demand and fossil fuel costs would increase the benefits
of developing the breeder while the increased availability of uranium would
cause the benefits to decrease. Since capital costs have increased for both
fossil and nuclear plants, the effect of capital cost changes on the bene
fits of developing the breeder is not readily predictable. Because of these
uncertainties, it was decided to rerun the cost-benefit analysis using up-to-
date assumptions. A number of other updating changes were also made. The
separative work cost was revised from the $26 per kilogram used throughout
the 1968 Study to $27.16 per kilogram for 1970 and 1971 and $32 per kilogram
thereafter. The introduction of the breeder was delayed from 198U to 1986 in
line with current planning. Still another change consisted of correcting the
computer code to give a more accurate summarization of the benefits. This
involved modifying the computer model to include all the energy produced by,
emd the costs for the entire thirty-year useful life of, all plants built
before the cutoff date for calculating benefits. This procedure results in a
more accurate indication of the benefits and is consistent with the method
used by utilities in performing their system analysis studies.
*

tre attention has also been devoted to selecting the input data in the
xrent analysis. The assumptions are stated in greater detail in
Section 4.0.
2.0 SUMMARY OF UPDATED COST-BENEFIT ANALYSIS
The Updated Cost-Benefit Analysis of the U.S. Breeder Reactor Program bears
out the conclusions of the 1968 Study but with considerably more emphasis.
The benefits of the breeder as measured in terms of savings to the Nation's
power customers have increased markedly in the current Study. The breeder
will not only stabilize the cost of electricity, but will also conserve
uranium resources and reduce the amount of uranium separative work capacity
required. While the benefits are sensitive to power demand, they remain
substantial even at the lowest of the projected demands. The relative
capital cost of the LMFBR is an important factor, and the LMFBR power plant
designers should keep costs firmly in mind in order to ass\u?e that z« liable
and dependable LMFBR power plants can be built at minimum cost.
The combined effect of the changes in the power economy since 1968 is to
increase the 7% discounted benefits of the breeder by over 100% — from
$9.1 billion for the base case of the 1968 Study to $21.5 billion for the
base case of the updated Study. Of the $12.4 billion increase in benefits,
$6.7 billion is due to the higher energy demand; $1.2 billion is due to the
higher separative work charge; and $7.1 billion is due to the higher fossil
fuel costs, higher capital costs, and computer program changes. These
increases are partially offset by a $2.6 billion decrease due to the two-
year slippage in introducing the LMFBR.
\ - 3 -

Besides the benefits as measured In dollars, breeder reactors will effect
substantial savings In uranium resources and the separative work capacity ^
necessary to sustain the Nation's demand for electrical energy. The
updated Study Indicates that with presently estimated uranium reserves.
Introduction of the breeder by 1986 will decrease U.O- requirements by
2,360,000 short tons, which is over 50Z of the D.Og requirements if the
breeder were not developed. Stated another way, without the breeder the
Nation will be using $50 per pound uranium by the Year 2020. With the
breader the Nation will be using only $27.50 per pound uranium by the
Year 2020 and. In addition, only a small amount of uranium will be required
to sustain the Nation's power economy for many decades beyond 2020. The
increased use of higher cost reserves with the breeder, as compared to
tha estimate used in the 1968 Study, is due to the higher energy demand, the
higher utilisation of nuclear fuel resulting from the higher cost of fossil
fuel, and the two-year delay in Introducing the UIFBR. Regarding separative
work, the updated Sttidy indicates that without the breeder the separative
work capacity required to sustain the Nation's power economy constantly
increases reaching 270,000 metric tons per year by 2020. With the breeder,
the separative work capacity increases to only 81,000 metric tons per year
in 1992 with no additional capacity required beyond 1992.
Sensitivity analyses were run to determine the effects of changes in the
LMFBR introduction date, uranium reserves, energy demand, and LMFBR capital
costs.
Delaying introduction of the LMFBR to 1990 decreases benefits discounted at
7Z to mld-1971 by $8.2 billion. Therefore, in this four-year timeframe,
- 4 •

every year of delay beyond 1986 costs the Nation about $2 billion a year
^BR higher costs of electric power. A further delay to 1994 decreases 7%
discounted benefits by another $6.2 billion, so that after 1990, each
year of delay costs the Nation about $1.5 billion per year.
If one assumes a more optimistic uranium reserve schedule based on industry
continuing its normal pace of exploration activities, the benefits of the
breeder to the Year 2020 decrease by only $1.4 billion. This small decrease
and lack of sensitivity to uraniiim supply reflect the breeder's efficient
utilization of uranium resources.
The benefits are sensitive to energy d«nand and it is an important input to
the Study. If the energy demand is 20% lower than projected, the breeder's
discounted benefits decrease by $6.7 billion; and conversely, if the energy
demand is 20% greater than projected, the benefits increase by $4.5 billion.
Historical energy usage and future projections should be carefully followed
in guiding the Nation's energy policy.
A 10% incz>ease in capital cost of the UfFBR, above those of other nuclear
power plants, decreases the $21.5 billion benefits to $10.6 billion which
indicates the sensitivity of the benefits to the capital cost of the LMFBR.
However, it should be noted that the addition of SO. removal equipment could
result in a cost penalty for fossil plants which would more than compensate
for a 10% increase in LMFBR capital costs.
The four major quantifiable conclusions of the analysis are:
(1) The introduction of a breeder into the U.S. electric power utility
system will produce significant financial benefits and reduce long-
range uranium and separative work requirements.
- 5 -
(2) The benefit-cost ratio is significantly greater than one for the ^ ^
credible cases examined which provides a high incentive for a stro^^
R6D program.
(3) Deferring the LMFBR introduction date reduces the 7% discounted
benefits by about $2 billion per year; thus, there is a strong incen
tive to intjToduce the breeder at the earliest possible date.
(4) The increase in fossil fuel prices in the United States, since the
1968 Study was completed, has adversely affected the competitive
position of fossil fuel plants.
As stated in the report of the 1968 Study, there are many other benefits
not as readily susceptible to quantitative analysis but of substantial
consequence, which would accrue from early introduction of the breeder.
A number of these relate to the significant economic, technological and
industrial coupling between the Light Water Reactor (LWR) and the Fast
Breeder Reactor (FBR). These benefits include:
(1) Access to a virtually limitless supply of low-cost electricity and
the potential use of this low-cost electricity in energy intensive
applications.
(2) An ample supply of low-cost electricity to areas which have been
denied low-cost energy.
(3) The virtual elimination of air pollution from electric power plants.
(4) Assurance that lew-cost uranium ore reserves will be most efficiently
used.
(5) A premium market for plutonium produced by LWRs.
(6) The most beneficial utilization of the stockpile of depleted uranium
from the diffusion plants.
- 6 -

J7) The efficient use of the manpower and the facility resources committed
^ ^ to the breeder program by the Atomic Energy Commission (AEC) National
Laboratories, by U.S. industry and U.S. utilities.
(8) Stimulation of improved efficiency and economy in other energy producing
industries, including those associated with the production, transporta
tion, and utilization of fossil fuels.
(9) Increased use of the technical and economic ties as a principal vehicle
for international cooperation and a means for promoting peace and
industrial development in other countries.
(10) The continued preeminence of the U.S. in its leadership role in nuclear
power.
3.0 DISCUSSION OF COST-BENEFIT ANALYSIS
3.1 Method of Cost-Benefit Analysis
Seven groups of calculations consisting of 16 cases are presented in this
report. The calculations indicate the benefits accrued from an economy with
a breeder as compared to an economy with only fossil, LWR, and High
Temperature Gas Reactor (HTGR) power plants. By varying the input data, the
effects of potential situations and the sensitivity of the results to the
assumptions can be investigated. The characteristics of the seven groups are
presented in Table 1. Each group consists of a base case without a breeder
and cases with a breeder represented by the LMFBR. The cases with the breeder
indicate that the required energy could be produced less expensively than
the corresponding case without the breeder and the difference represents the
dollar benefit of the breeder.
The seven groups were designed to determine the effect of varying the date
^^^f introduction of the breeder, varying uranium resources, varying energy
- 7 -

TABLE 1
UPDATED (1970) COST-BENEFIT ANALYSIS
Cases Considered
Case No.
1
2
3
4
5
LMFBR
Introduction Date
NONE
1984
1986
1990
1994
Uranium Reserves
Versus Cost
1/1/70 Estimate II
II
II
11
Energy
Demand
Probable
II
6
7
NONE
1986
Optimistic 11
Probable II
8
9
NONE
1986
Unlimited II
Probable II
10
11
NONE
1986
1/1/70 Estimate Low II
12
13
NONE
1986
1/1/70 Estimate High
14* 1986 1/1/70 Estimate Probable
15**
16**
NONE
1986
1/1/70 Estimate Probable II
*Same as case 3 but with LMFBR capital costs increased by 10%.
**Without HTGR.
- 8 -

^^mand, increasing the capital cost of the breeder, and the ability of the
^ m G R to penetrate the market.
The date of breeder introduction was parameterized for 1984, 1986, 1990 and
1994 (cases 2, 3, 4 and 5).
Uranium reserves estimated as of January 1, 1970 were used as the basis for
most of the projections. Two groups were calculated with varying tiranium
resources. In the first group, cases 6 and 7, the uranium resources are
estimated to be those that will probably be found if industry maintains a
normal rate of exploration and development. In the second group, cases 8
and 9, an unlimited availability of $8 per pound of U 0 was assumed.
While unlimited amounts of uranium are not expected to be available at this
price, the group was calculated to serve as a boundary limitation and
reference point against which other cases may be measured.
Two groups were Ccilculated with varying energy demands. The first group,
cases 10 and 11, was for a demand approximately 20% lower than the base
energy demand. This is also approximately equivalent to the base demand of
the 1968 Study and, therefore, serves as a basis for comparison to the 1968
Study. The second group, cases 12 and 13, was calculated for an energy
demand approximately 20% higher than the base case and represents a high or
maximum energy demand situation.
One case (case 14) was calculated with the capital cost of the LMFBR power
plant increased by 10%, while the cost of other plants remained constant.
This 10% increase is approximately equivalent to a one-third increase in
cost of the LMFBR nuclear steam supply system. Since the steam turbine
and generator of the LMFBR are essentially the same as those used in modem
- 9 -

fossil fueled power plants, no relative cost increase would be anticipated
in these portions of the plant. Therefore, the 10% increase in total plaOT
costs represents a very significant increase in the cost of the nuclear
steam supply sjrstem.
The final group (cases 15 and 16) was calculated to measure the effect on
benefits when the HTGR is removed from the calculational model. Case 15
models the power economy if the most probable energy requir«nents are met
with fossil and LWR reactors, and case 16 if power requirements are met
with fossil, LWR, and breeder plants with large-scale introduction of the
LMFBR in 1986.
3.2 Research and Development Costs
Table 2 summarizes the results of an R6D cost analysis for the period mid-
1971 to 2020 with and without introduction of the breeder. The asstimptions
used for R6D costs are discussed in section 4.0 entitled Major Assumptions
Used in the Cost-Benefit Analysis.
The analysis assumed successful R£D programs and a viable and competitive
nuclear industry for each concept introduced into the utility market. The
RSD costs listed in Table 2 were estimated for the following cases:
Case A: LWR + Advanced converter as represented by the HTGR
Case B: LWR + HTGR + breeder with 5 alternatives listed below, including
a Parallel Breeder Reactor (PBR) program:
- 10 - •
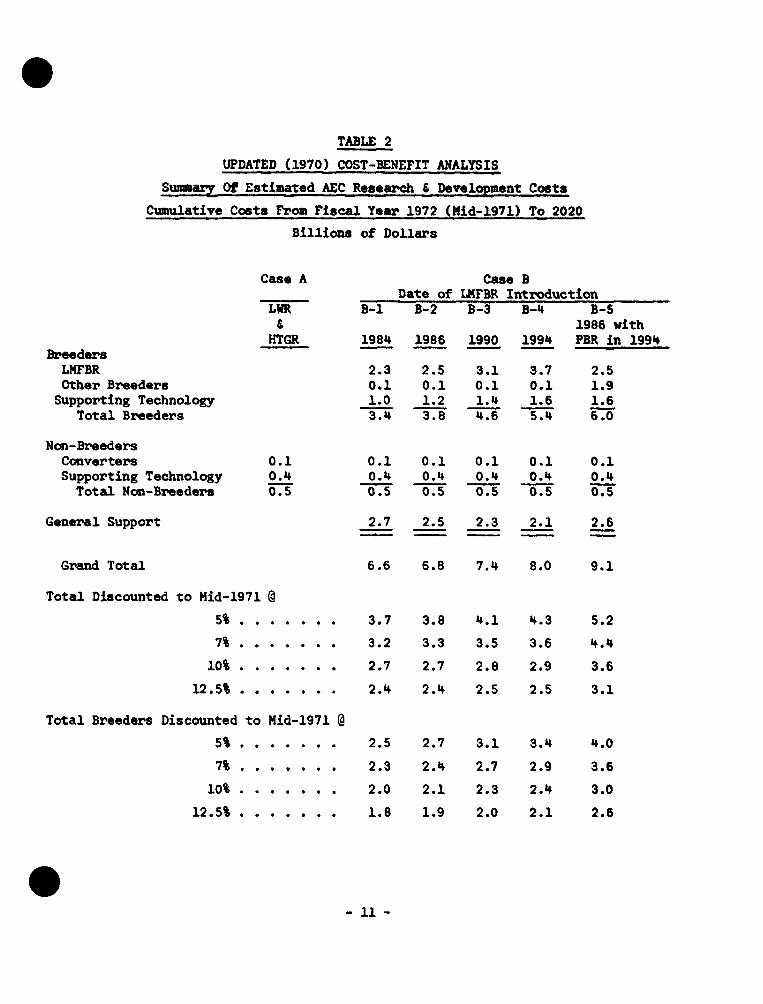
TABLE 2
UPDATED (1970) COST-BENEFIT ANALYSIS
Summary^ Of Estimated AEC Research £ Development Costs
Cumulative Costs From Fiscal Year 1972 (Mid-1971) To 2020
Billions of Dollars
Case A
"urn £
HTGR Breeders LMFBR Other Breeders Supporting Technology
Total Breeders
Non-Breeders Converters Supporting Technology Tot«d Non-Breeders
0.1 0.4 0.5
B-1
1984
2.3 0.1 1.0 3.4
0.1 0.4 0.5
Date of B-2
1986
2.5 0.1 1.2 3.8
0.1 0.4 0.5
Case B LMFBR Introduction B-3
1990
3.1 0.1 1.4 4.6
0.1 0.4 0.5
B-4
1994
3.7 0.1 1.6 5.4
0.1 0.4 0.5
B-5 1986 with PBR in 1994
2.5 1.9 1.6 6.0
0.1 0.4 0.5
General Support 2.7 2.5 2.3 2.1 2.6
Grand Total
Total Discounted to Mid-1971 @
5% ,
7% .
10% .
12.5% ,
Total Breeders Discounted
5% ,
7% ,
10% .
12.5% ,
t •
» •
> •
» •
to
» •
» •
1 •
Mid-1971 @
6.6
3.7
3.2
2.7
2.4
2.5
2.3
2.0
1.8
6.8
3.8
3.3
2.7
2.4
2.7
2.4
2.1
1.9
7.4
4.1
3.5
2.8
2.5
3.1
2.7
2.3
2.0
8.0
4.3
3.6
2.9
2.5
3.4
2.9
2.4
2.1
9.1
5.2
4.4
3.6
3.1
4.0
3.6
3.0
2.6
- 11

LMFBR Commercially i Introduced In *
B-1 Accelerated breeder program 1984
B-2 Ctirrently planned breeder program 1986
B-3 Four-year delay in breeder development program 1990
B-4 Eight-year delay in breeder development program 1994
B-5 PBR program with parallel breeder introduced 1986
in 1994
Commercial introduction is defined as the date when a significant number
of commercial-sized LMFBR power plants become operational.
The results of the R£D cost analysis indicate that undiscounted RSD costs
for the breeder program vary from $3.4 billion for an accelerated program
introducing an LMFBR in 1984 to $6.0 billion for a PBR program. Based on
a 7%/yr. discount rate, the discounted breeder RSD costs vary from $2.3
billicm to $3.6 billion. The cost of the current program discounted 7%/yr.
to mid-1971 is $2.4 billion which increases to $2.7 and $2.9 billion when
introduction of the breeder is delayed to 1990 and 1994, respectively.
The basic reason for the increase in RfiD costs for delayed introduction of
the breeder is the additional RSD costs incurred in the stretchout of a
program. The stretchout involves expenditures in phasing down or phasing
out subprograms and expenditures involved in restarting these stibprograms
at a later date, including those costs associated with the difficult task
of reassembling resources, replacing lost p>ersonnel, retraining personnel,
and replacing deteriorated facilities and equipment.
The costs are slightly lower than for the 1968 Study because there are two
less years of expenditures, and funds allocated to Other Breeder RSD and
Supporting Technology have been reduced.
- 12 -

^fc3.3 Results of Analysis
3.3.1 Benefits and Benefit/Cost Ratios
The results of the cost-benefit analysis which include costs, benefits,
benefit-cost ratios, uranium demand, separative work demand and nuclear
capacities are summarized in Tables 3 and 4. A 7Z/yr. discount rate was
used.
3.3.2 Current Program
Assuming the availability of the HTGR, the undiscounted gross benefits
(Table 3), directly resulting from dollar savings in cost of electric
energy associated with the currently planned breeder program (1986
introduction), range from $10 billion to $475 billion (cases 8 minus 9
and 12 minus 13) in the time period from mld-1971 to 2020, depending on
the assumptions of uranium costs and electrical energy demand.
During this period, the estimated reduction in U.Og requirements would
range from 1,900 to 3,600 kllotons, and the reduction of maximum domestic
separative work demand would range from 140 to 230 kilotonnes per year.
Discounted to mid-1971 at 7%/yr., the present worth gross benefits for the
current program from lower energy costs alone range from $1.2 to $26.0
billion. The highest benefit is associated with the January 1, 1970
estimate of uranium reserves and the high* energy demand (case 12 minus
13), while the lowest benefit is associated with unlimited* availability of
$8/lb. U.Og and the probable* energy demand (case 8 minus 9). Other major
tangible benefits are reduction in air pollution, the production of a large
*Terms are quantitatively defined in Section 4.0, Major Assumptions Used in tha Analysis

TABLE 3
UPDATED (1970) COST-BENEFIT ANALYSIS
Costs, Benefits, and Benefit-Cost Ratio to Year 2020 for Breeder Program
At 7% Per Year Discount Rate
(Dollar Figures are in Billions of Dollars)
Undiscounted Discounted to Mid-1971 @ 7Z/Yr.
Case No.
1
2
3
4
5
Uranium Reserves vs. Cost
1/70 Est. ir
If
"
ti
Energy Demand
Probable II
"
II
II
Date of Introduction
LMFBR
NONE
1984
1986
1990
1994
Energy Cost
2704
2316
2346
2398
2485
Gross Benefit
388
358
306
219
(1) Energy Cost
437.4
413.3
415.9
424.1
430.3
(2) Gross Benefit
24.1
21.5
13.3
7.1
(3) R & D Cost
2.3
2.4
2.7
2.9
(2)-(3) Net
Benefit
21.8
19.1
10.6
4.2
(2) -(3) Benefit to Cost Ratio
-
10.5
9.0
4.9
2.4
6
. 7
*• 8
9
10
11
12
13
14*
Optimistic II
Unlimited 11
1/70 Est. ir
t(
II
n ^
II
II
tl
II
Low II
High II
Probable
NONE
1986
NONE
1986
NONE
1986
NONE
1986
1986
2667
2328
2244
2234
2096
1842
3332
2857
2449
-
339
-
10
-
254
-
475
255
433.5
413.4
409.6
408. A
349.2
334.4
523.3
497.3
426.5
-
20.1
-
1.2
-
14.8
-
26.0
10.9
-
2.4
-
2.4
-
2.4
-
2.4
2.4
-
17.7
-
(1.2)
-
12.4
-
23.6
8.5
-
8.4
-
0.5
-
6.2
-
10.8
4.5
15**
16**
NONE
1986
3466
2387 1079
*wlth 10% higher LMFBR plant capital costs **without HTGR
461.7
419.4 42.3 2.4 39.9 17.6

TABLE 4
UPDATED (1970) COST-BENEFIT ANALYSIS
Uranium And Separative Work Demand Requirements
Case No.
1
2
3
4
5
6
7
8
9
10
11
12
13
14*
15**
16**
Uranium Reserves vs. Cost
1/70 Est. 11
" II
II
Optimistic It
Unlimited It
1/70 Est. It
It
11
It
II
II
Energy Demand
Probable 11
II
" II
II
II
It
II
Low
"
High M
Probable
It
II
Date of Introduction
LMFBR
NONE
1984
1986
1990
1994
NONE
1986
NONE
1986
NONE
1986
NONE
1986
1986
NONE
1986
U30g Required To Year 2020 Kllotons
Required
4531
1929
2171
2589
3129
4639
2320
6636
3043
3740
1798
5327
2419
2216
4540
2152
Savings
2602
2360
1942
1402
-
2319
-
3593
-
1942
-
2908
2315
-
2388
Separative Demani
Kilotonnes : Required
269.6
68.0
80.9
108.3
132.9
271.5
81.0
221.2
77.0
214.0
64.0
333.0
99.3
83.0
220.6
69.8
Work*** d Per Year Savings
-
201.6
188.7
161.3
136.7
-
190.5
-
144.2
-
150.0
-
233.7
186.6
-
150.8
*wlth lOZ higher LMFBR plant capital costs
**without HTGR
***To put this into perspective, the three existing U.S. diffusion plants, after completion of the approved program for cascade Improvement, when operating at 6100 MWe will produce 22 kilotonnes of separative work units per year.
- 15 -

supply of Plutonium, the large reduction in separative work demand, and
efficient and economic use of the depleted uranium stockpile.
Of the cases studied, the most conservative likely case is associated with
the January 1, 1970 estistate of uranixim reserves, probable or medium energy
demand, and the currently planned large-scale introduction of the breeder in
1986 (cases 1 minus 3, Table 3). The results of this case show undlscounted
gross benefits of $358 billion, gross discounted benefits of $21.5 billion,
net benefits accruing from the breeder program of $19.1 billion, and a
benefit-cost ratio of 9.0. This case would also result in a reduction in
U.Og requirements of 2360 kilotons, and a reduction in maximum separative
work demand of 189 kilotonnes per year.
3.3.3 Early Introduction of the Breeder
As shown in Table 3, the benefit-cost ratio of introducing the breeder in
198A is 10.5 compared to 9.0 for introduction of the breeder in 1986. The
additional benefits of advancing the large-scale Introduction of the breeder
by two years is $2.7 billion or $1.3 billion per year.
3.3.A Parallel Breeder Reactor (PBR) Program
Using the assumptions delineated in Section 4.12 Research and Development
Program, a tentative case can be made to Improve the Industrial breeder
base by establishing a PBR program. The benefits of the LMFBR program would
be sufficient to maintain benefit-cost ratios in excess of one for a 1986 or
earlier introduction of the D!PBR, and a 199A introduction of the PBR for all
but one of the cases considered, using discount rates of 7%/yr. or less.
Only the unlimited $8 per pound of U.Og group, which is not considered to
represent a real situation, would fall to support a PBR program. Because
- 16 -

of the technical status and other factors, the decision on whether to
Establish a PBR program would have to await further analyses of alternative
breeder concepts, such as the Molten Salt Breeder Reactor (MSBR), or the
Gas-Cooled Fast Reactor (GCFR).
If justified by further analysis, a PBR program could strengthen the nuclear
posture of the U.S. by providing increased industrial competition, broadening
the industrial manufacturing base, and strengthening the Industrial base of
nuclear technology. The cost-benefit analysis has assumed the possibility
of such a parallel breeder program in each of the groups analyzed. On the
basis of a 1986 LMFBR introduction and the selection of a parallel breeder
concept by 1973, the PBR would be introduced in 199»».
Discussion of Parallel Breeder Results
Table 2 indicates that a parallel full-scale development program will cost
$6.0 billion undlscounted, or an additional $2.2 billion above the current
breeder program, assuming introduction of the LMFBR in 1986 and the PBR
in 199H. Discounted to mid-1971 at 7%/yr., the additional cost will be
$1.2 billion.
Assuming that no additional gross benefits would be obtained as a result of
the PBR program, the benefit-cost ratios at the discount rate of 7%/yr. range
from 7.2 to 0.3 for a parallel breeder program for all cases which included
the HTGR (refer to Tables 2 and 3). This may be compared to a range from
10.8 to 0.5 for the current breeder program for all cases with the HTGR. The
results indicate that the early introduction of the LMFBR provides tangible
quantifiable benefits sufficiently large to adequately support the cost of a
- 17 -
PBR program for most of the cases studied at discount rates of 7Z/yr. or less
and at discount rates up to lOZ/yr. with existing uranium resources and the
most probable, or medium, energy demand.
3.3.5 Sensitivity of Results to Changes in Parameters
Factors Influencing the benefits of the breeder which are not subject to
administrative decision (level of R&D support for example), but are depend
ent on the prevailing total economic structure. Include parameters such as
breeder introduction date, uranium reserves versus cost, electrical energy
demand, capital costs of the breeder, and the degree of utility acceptance
of the HTGR.
The sensitivity of benefits to changes in a parameter provides an Indication
of the extent to which uncertainty in a parameter affects the results. The
sensitivity of important parameters is discussed in the following paragraphs.
1. Breeder Introduction Date
Although benefits are derived from the introduction of the breeder
into the commercial market regardless of the date, these benefits
are substantially affected by the date of Introduction. For
example, examination of Table 3 shows that delaying the breeder
four years beyond 1986 increases the power production costs to the
Tear 2020 by $52 billion. Delaying another four years to the
Year 1994 increases the power production costs by another $87
billion. Conversely, if the breeder is Introduced in 1984 rather
than 1986, power costs decrease by $30 billion. The variation of
benefits with the date of large-scale introduction of the LMFBR
is also shown on Figure 1.
- 18 -

FIGURE 1 UPDATED (1970) C0$T-3B\EFIT ANALYSIS
UNDISCOUNTED BREEDER BENEFITS, IV\ID-1971 TO 2020
with January 1, 1970 Uranium Reserves
500 —
400
300 —
200
100
V High Energy
Demand
''Oh % . M etc
^ ^
Low Energy Demand
i i
'M '^na
i 1984 1986 1990 1994
Date of Large Scale Introduction of LMFBR
- 19 -

FIGURE 2 UPDATED (1970) COST BENEFIT ANALYSIS
7%/YR. DISCOUNTED BREEDER BENEFITS, MID-1971 TO 2020
with January 1, 1970 Uranium Reserves
High Energy Demand
A, Low Energy
Demand
F I , I J I I i J I L 1984 1986 1990 1994
Date of Large Scale Introduction of LMFBR
- 20 -

Figure 2 shows the variation of the 7%/yr. discounted benefits
with the date of large-scale introduction of the breeder. The
figure graphically shows the decrease in benefits resulting from
a delay in the introduction of the breeder. The sensitivity of
benefits to schedule delay is such that for each year of delay in
the introduction date of the breeder, the 7%/yr. discounted
benefits decrease by about $1.3 to $2.0 billion per year of delay.
It is clear that these results, considering only reductions in
energy cost resulting from delay, provide a strong incentive for
the timely development of the breeder reactor.
Uranium Cost Versus Supply
The effect of the uranium cost versus supply schedule is indicated
by compcu ing cases 1 and 3 with cases 6 and 7 in Table 3. Cases 1
emd 3 use the urcmium cost versus supply schedule generally agreed
to represent uranium resources estimated as of January 1, 1970, and
cases 6 and 7 use a more optimistic schedule representative of the
resources that may be found if sufficient time is allowed for dis
covery and exploitation. The benefits of the breeder discounted
at 7%/yr. decrease by $ m billion, from $21.5 to $20.1 billion.
This lack of sensitivity to uranium supply reflects the breeder's
efficient utilization of uranium resources.
Electrical Energy Demand
The electrical energy demand was projected to the Year 2020 by
extrapolating FPC estimates to the Year 2000 by an additional
twenty years. An annual growth rate of H.8%/yr. was used for the
- 21 -

first ten-year period and 3.8%/yr. for the second ten-year period.
These growth rates compare with an FPC growth rate of 5.8U%/yr. "
from 1990 to the Year 2000. Energy demands 20% lower and 20%
higher than the FPC estimate were then selected for the Year 2000
and curves fitted from the 1970 demand through the Year 2000
demand. (See Section ^ .9, Table 13). Cases 10 and 11 represent
the low energy demand situation and cases 12 and 13 the high
energy demand situation. The 7%/yr. discounted benefits of the
breeder decrease 31% ($6.7 billion) when the energy demand is
lowered 20% and increase 21% ($»».5 billion) when the energy
demand is increased 20%. This is shown on Figure 2. This
relatively high sensitivity of the results to energy demand
indicates the importance of accurate energy demand projections to
the validity of such studies.
The low enei>gy demand of this Study corresponds to the base energy
demand of the 1968 Stxidy. The 7%/yr. discounted benefits of the
low energy demand case is $14.8 billion and c«npares with benefits
of $9.1 billion for the base case of the 1968 Study. This increase
in benefits is due to the increased fossil fuel prices, increased
uranium separative work chaz>ge, and a change in the computer
program to include the entire thirty-year energy pz^duction and
costs for reactors placed on the line prior to the Year 2020 cut
off time of the program.
4. Capital Cost of the Breeder
In order to determine the sensitivity of benefits to the capital
coat of the breeder, the capital cost of the entire LMFBR power
- 22 -

plant was increased by 10% while the capital cost of the other power
plants remained constant, (case IH). This increase is conservatively
equal to a one-third increase in the cost of the nuclear island.
This increase decreases the 1%/yT. discounted benefits from $21.5
billion to $10.6 billion and indicates a high degree of sensitivity
to capital costs.
It should be noted that there are also uncertainties in the capital
costs of other plants. For example, the repetitive capital cost of
HTGR power plants on a commercial basis is not yet known. Although
not factored into this Study, the addition of SO removal equipment
to fossil fuel plants could result in a cost penalty which would
more than compensate for a 10% increase in the LMFBR power plant
capital costs.
Effect of Introduction of HTGR
Assuming that the HTGR does not penetrate the commercial market
(cases 15 and 16) increases the 7%/yr. discounted benefits of the
breeder almost 100%, from $21.5 billion to $42.3 billion. This
is attributable to the fact that, without the HTGR, the base cost
of producing power, using only fossil plants and the LWR, is
markedly increased.
Uranium Requirements
Table 4 provides an indication of the substantial savings in
uranium to be gained from the early development of the breeder.
Assuming the probable energy demand and known uranium resources
as of January 1, 1970, the results show a reduction in U 0
- 23 -

requirements to the Year 2020 of 2360 (4531 - 2171) kilotons of
U.O. for an economy with the breeder introduced in 1986, as com- ^
pared to an economy without an LMFBR. A four-year delay, or 1990
Introduction of the breeder, results in a reduction of 1942
(4531 - 2589) kilotons of UoO-, as compared to an economy with
no LMFBR, and a further four-year delay, or 1994 introduction,
results in a reduction of 1402 (4531 - 3129) kilotons.
Assuming the more optimistic uranium cost versus supply schedule
and the probable electrical demand, the results show a reduction
in uranium requirements of 2319 (4639 - 2320) kilotons when the
breeder is Introduced in 1986, as compared to an economy without
an LMFBR. The small change in uranium savings (from 2360 kilotons
with the present uranium reserve schedule to 2319 kilotons with an
optimistic uranium reserve schedule) indicates that uranium
requirements are insensitive to the uranium resource schedule.
The greater use of uranium, than projected in the 1968 Study,
reflects the Impact of the higher energy demand, the higher cost
of fossil fuel t^lch results in increased utilization of nuclear
fuel, and the two-year delay in introducing the LMFBR.
7. Separative Work Demand
Table 4 also provides an indication of substantial savings in
uranium separative work capacity by development of the breeder.
Assuming the probable energy demand and known uranium resources
as of January 1, 1970, the results show a reduction in maximum
annual separative work demand over the time period studied of
188.7 (269.6 - 80.9) kllotonnes/yr. for an economy with the LMPBRJ
- 24 -

Introduced in 1986 as compared to an economy without an LMFBR.
A four-year delay (1990 Introduction) of the breeder results in
a reduction of 161.3 (269.6 - 108.3) kilotons/yr. as compared to
an economy without an LMFBR. A further four-year delay (1994
Introduction) results in a reduction of 136.7 (269.6 - 132.9)
kilotons/yr.
Assuming the more optimistic uranium cost versus supply schedule
and the probable coiergy demand, the results show a reduction in
separative work requirements of 190.5 (271.5 - 81.0) kllotonnes/yr.
when the breeder is Introduced in 1986 as compared to an economy
without an LMFBR. The small change in separative work capacity
savings (from 188.7 kllotonnes/yr. with the present uranium reserve
schedule to 190.5 with an optimistic uranium reserve schedule)
Indicates that separative work capacity is also insensitive to
the uranium resource schedule.
Figure 3 Indicates the separative work demand versus time for
meeting the probable energy demand with presently known uranium
reserves for the cases where there is no breeder, and where
large-scale introduction of the breeder takes place in 1986 and
In 1990. Figure 3 shows that while the breeder cases Indicate
lower separative work requirements in the long term, they also
indicate higher requirements in the years up to and Immediately
after the large-scale Introduction of the breeder. This is
because the breeder limits uranium demand and price to about
one-half the price when there is no breeder and because the
- 25 -

FIGURE 3 UPDATED (1970) COST-BENEFIT ANALYSIS
SEPARATIVE WORK DEMANI^
with Probable Energy Demand with January 1, 1970 Uranium Reserves
Date of Large Scale Cy Introduction of Breeder
X
\ \
Government Diffusion Plant Capacity:
. \ -^With CIP & CUP
1970 1980 1990 2000
YEAR
2010
Present
2020
- 26 -
breeder provides a ready market for plutonium produced by LWRs.
These considerations provide an increased economic incentive to
build LWRs. Thus, the anticipated introduction of the breeder
could significantly increase the demand for LWRs and diffusion
plant capacity through the early 1990's.
Sensitivity of Benefits to Varying Discount Rates
The use of various discount rates and the choice of a discount
rate for comparing the results of a cost-benefit study of an
electric power economy was discussed in detail in the 1968 "Cost-
Benefit Analysis of the U.S. Breeder Reactor Program," WASH-1126
(see pp. 37-41). Interest rates have increased since 1968, but
when performing a study covering a fifty-year period, long-term
interest rates must be considered. While the electric power
industry is presently feeling the effects of the higher interest
rates, it is not certain that the current high interest rates will
become permanent. In addition, a significant fraction of the U.S.
electric generation is performed by public utilities which have a
cost of money lower than private utilities. Therefore, a 7%/yr.
discount rate was used as approximating the average long-term
discount rate for the whole U.S. electric utility industry.
The cranputer model minimized the sura of all present-worthed cash
expenditures at a rate of 7%/yr. The model was also programmed
to provide, from the 7%/yr. optimized solution, the present worth
of the total energy cost mid-1971 to 2020 for discount rates of
- 27 -

TABLE 5
09
UPDATED (1970) COST-BENEFIT ANALYSIS
Costs, Benefits, and Benefit-Cost Ratio to Year 2020 for Breeder Program
At 5% Per Year Discount Rate
(Dollar Figures are in Billions of Dollars)
Undlscounted Discounted to Mid-1971 @ 5%/Yr.
Case No.
1
2
3
4
5
Uranium Reserves vs. Cost
1/70 Est. II
tr
II
II
Energy Demand
Probable M
II
II
11
Date of Introduction
LMFBR
NONE
1984
1986
1990
1994
Energy Cost
2704
2316
2346
2398
2485
Gross Benefit
388
358
306
219
(1) Energy Cost
700.9
647.4
652.5
668.3
681.4
(2) Gross Benefit
53.5
48.4
32.6
19.5
(3) R & D Cost
2.5
2.7
3.1
3.4
(2)-(3) Net
Benefit
51.0
45.7
29.5
16.1
(2)v(3) Benefit to Cost Ratio
-
21.4
17.9
10.5
5.7
6
7
8
9
10
11
Optimistic II
Unlimited II
1/70 Est.
••
It
11
II
II
Low II
NONE
1986
NONE
1986
NONE
1986
2667
2328
2244
2234
2096
1842
-
339
—
10
-
254
693.5
648.2
641.1
639.5
554.2
520.9
-
45.3
—
1.6
-
33.3
-
2.7
.
2.7
-
2.7
-
42,6
_
(1.1)
30.6
-
16.8
—
0.6
_
12.3
12
13
High NONE
1986
3332
2857 475
845.0
785.2 59.8 2.7 57.1 22.1
14* Probable 1986* 2449 255 673.5 27.4 2.7 24.7 10.1
15**
16**
NONE
1986
3466
2387 1079
*with 10% higher LMFBR plant capital costs **wlthout HTGR
761.0
659.3 101.7 2.4 99.3 42.4

TABLE 6
UPDATED (1970) COST-BENEFIT ANALYSIS
Costs, Benefits, and Benefit-Cost Ratio to Year 2020 for Breeder Program
At 7% Per Year Discount Rate
(Dollar Figures are in Billions of Dollars)
Undlscounted Discounted to Mid-1971 0 7%/Yr.
Case No.
1
2
3
4
5
Uranium Reserves vs. Cost
1/70 Est. II
II
M
II
Energy Demand
Probable II
II
II
II
Date of Introduction
LMFBR
NONE
1984
1986
1990
1994
Energy Cost
2704
2316
2346
2398
2485
Gross Benefit
388
358
306
219
(1) Energy Cost
437.4
413.3
415.9
424.1
430.3
(2) Gross Benefit
24.1
21.5
13.3
7.1
(3) R & D Cost
2.3
2.4
2.7
2.9
(2)-(3) Net
Benefit
21.8
19.1
10.6
4.2
(2)v(3) Benefit to Cost P^tio
-
10.5
9.0
4.9
2.4
6
7
8
9
10
11
12
13
14*
Optimistic II
Unlimited II
1/70 Est. II
II
It
]
II
II
II
M
Low II
High II
Probable
NONE
1986
NONE
1986
NONE
1986
NONE
1986
1986
2667
2328
2244
2234
2096
1842
3332
2857
2449
-
339
-
10
-
254
-
475
255
433.5
413.4
409.6
408.4
349.2
334.4
523.3
497.3
426.5
-
20.1
-
1.2
-
14.8
-
26.0
10.9
-
2.4
-
2.4
-
2.4
-
2.4
2.4
-
17.7
-
(1.2)
-
12.4
-
23.6
8.5
-
8.4
-
0.5
-
6.2
-
10.8
4.5
15**
16**
NONE
1986
3466
2387 1079
*wlth 10% higher UIFBR plant capital costs **wlthout HTGR
461.7
419.4 42.3 2.4 39.9 17.6
Case No.
1
2
3
4
5
6
1 7
° 8 1
9
10
11
12
13
14*
15**
16**
Uranium Reserves vs. Cost
1/70 Est. II
II
tl
II
Optimistic It
Unlimited II
1/70 Est. II
II
II
II
II
II
Costs
Energy Demand
Probable II
tl
II
II
II
II
II
tl
Low II
High It
Probable
II
II
1, Benefits,
Date of
TABLE
UPDATED (1970) COST-
, and Benefit-
At 10%
Cost Ratio
Per Year
(Dollar Figures are in
Undlscounted
Introduction Energy LMFBR
NONE
1984
1986
1990
1994
NONE
1986
NONE
1986
NONE
1986
NONE
1986
1986*
NONE
1986
Cost
2704
2316
2346
2398
2485
2667
2328
2244
2234
2096
1842
3332
2857
2449
3466
2387
Gross Benefit
388
358
306
219
-
339
-
10
-
254
-
475
255
-
1079
: 7
•BENEFIT ANALYSIS
1 to Year
Discount
Billions
(1) Energy Cost
247.8
240.4
241.4
244.4
246.4
246.2
240.3
238.5
238.2
200.4
196.2
293.1
285.7
245.4
254.8
242.8
2020 for Breeder
Rate
of Dollars)
Discounted (2)
Gross Benefit
7.4
6.4
3.4
1.4
-
5.9
—
0.3
-
4.2
-
7.4
2.4
—
12.0
to Mid (3)
R & D Cost
2.0
2.1
2.3
2.4
-
2.1
-
2.1
-
2.1
-
2.1
2.1
-
2.4
Program
-1971 @ : (2)-(3) Net
Benefit
5.4
4.3
1.1
(1.0)
3.8
-
(1.8)
-
2.1
—
5.3
0.3
-
9.6
10%/Yr. (2)T(3)
Benefit to Cost Ratio
-
3.7
3.0
1.5
0.6
-
2.3
-
0.1
-
2.0
-
3.5
1.1
-
5.0
*wlth 10% higher LMFBR plant capital costs **wlthout HTGR
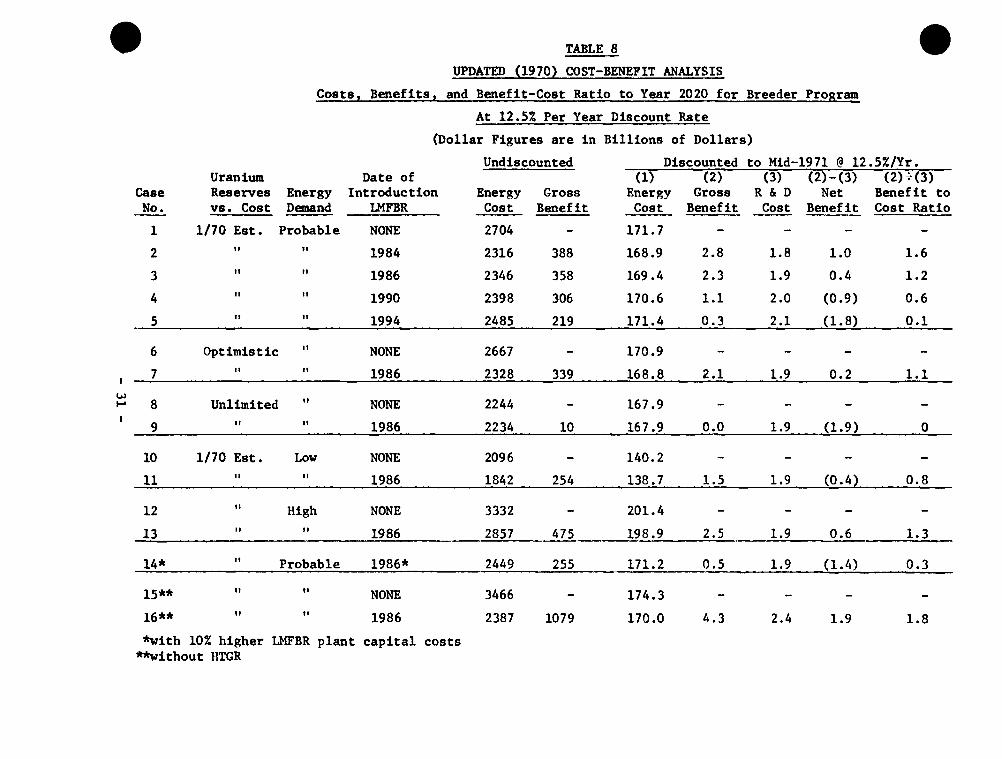
TABLE 8
UPDATED (1970) COST-BENEFIT ANALYSIS
Costs, Benefits, and Benefit-Cost Ratio to Year 2020 for Breeder Program
At 12.5% Per Year Discount Rate
(Dollar Figures are in Billions of Dollars)
Undlscounted Discounted to Mid-1971 @ 12.5%/Yr.
Case No.
1
2
3
4
5
Uranium Reserves vs. Cost
1/70 Est. It
It
"
tl
Energy Demand
Probable It
II
It
It
Date of Introduction
LMFBR
NONE
1984
1986
1990
1994
Energy Cost
2704
2316
2346
2398
2485
Gross Benefit
388
358
306
219
(1) Energy Cost
171.7
168.9
169.4
170.6
171.4
(2) Gross Benefit
2.8
2.3
1.1
0.3
(3) R & D Cost
1.8
1.9
2.0
2.1
(2)-(3) Net
Benefit
1.0
0.4
(0.9)
(1.8)
(2)H3) Benefit to Cost Ratio
-
1.6
1.2
0.6
0.1
1
'
6
7
8
9
10
11
12
13
14*
Optimistic H
Unlimited
"
1/70 Est.
"
11
M
II
II
II
11
Low 11
High II
Probable
NONE
1986
NONE
1986
NONE
1986
NONE
1986
1986*
2667
2328
2244
2234
2096
1842
3332
2857
2449
-
339
_
10
—
254
-
475
255
170.9
168.8
167.9
167.9
140.2
138.7
201.4
198.9
171.2
-
2.1
-
0.0
-
1.5
-
2.5
0.5
-
1.9
_
1.9
-
1.9
-
1.9
1.9
—
0.2
-
(1.9)
(0.4)
—
0.6
(1.4)
-
1.1
—
0
_
0.8
-
1.3
0.3
15**
16**
NONE
1986
3466
2387 1079
*wlth 10% higher LMFBR plant capital costs **without HTGR
174.3
170.0 4.3 2.4 1.9 1.8

5, 10, and 12.5%/yr. The results of the computations with the 5,
7, 10 and 12.5%/yr. are given in Tables 5 through 8. Table 6 is
a repeat of Table 3.
Except for the group in which unlimited amounts of $8/lb. uranium
is assumed (cases 8 minus 9), Table 5, which presents the 5%/yr.
discount rate results, shows a net benefit obtained in all groups.
The net benefits range fiK)m $51.0 billion for the 198H breeder
introduction to $16.1 billion for the 199f breeder introduction.
The benefit-cost ratios exceed one for all of the six 5%/yr.
discount groups, again excluding the unlimited $8/lb. uranium ceise.
For the current program with a 1986 LMFBR introduction, the net
benefits are $»*5.7 billion and the benefit-cost ratio is 17.9.
Table 6, which presents the 7%/yr. discount rate results, the
reference rate used for discussion in this report, shows a lower
benefit-cost ratio, but still shows ratios substantially above one,
except for the unlimited $8/lb. uranium group.
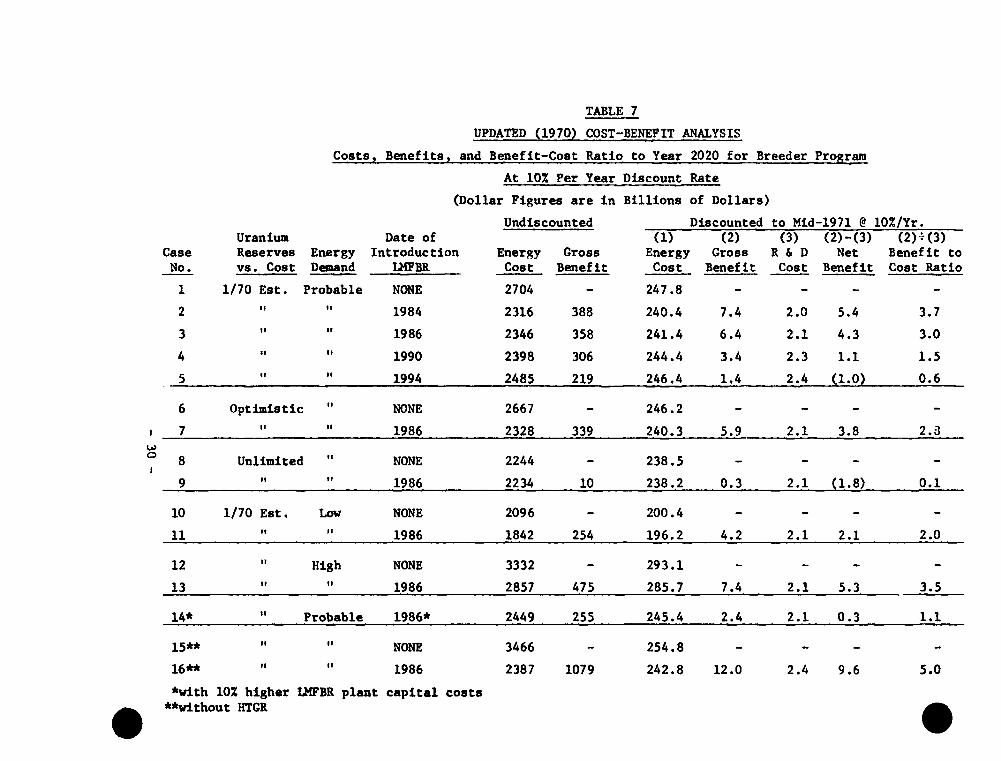
Table 7, which presents the 10%/yr. discount rate results, shows
€dl but two groups where there is a net discounted benefit, with
benefit-cost ratios as high as 5.0. The groups which do not
indicate a benefit-cost ratio of greater than one are the 1994
breeder group (case 1 minus 5) and the artificial unlimited $8/lb.
uranium group (case 8 minus 9). The net benefit for the group
where the probable energy demand is met with January 1, 1970
estimated uranium resources, and the LMFBR is introduced in 1986,
(case 1 minus 3) is $5.H billion with a benefit-cost ratio of 3.0.
- 32 -

In Table 8, which presents the 12.5%/yr. discount rate results,
only half of the cases indicate a net benefit. The benefit-cost
ratio for the group in which the LMFBR is introduced in 1986 (case
1 minus 3) indicates that the savings fz^m the current program fall
to 1.21.
Conclusions reached from examining the results of varying the
discount rates are:
(1) Discount rates of 5%/yr. and 7%/yr. result in large benefit-
cost ratios in six out of seven of the groups of cases
examined. The only group which did not yield a ratio
greater than one involved the artificial boundary limitation
assumption of unlimited availability of $8/lb. U^O..
(2) At a 10%/yr. discount rate the benefit-cost ratios vary
from 3.7 to 1.1, with the exception of the 199«» introduction
of the breeder and the unlimited $8/lb of UgOp cases.
(3) Even with a discount rate of 12.5%/yr., benefit-cost ratios
of 1.2 and 1.1 are obtained for a 1986 introduction of the
breeder with the estimated probable energy demand and
reasonable assumptions of uranium resources. A 1.6 benefit-
cost ratio is obtained for 198H introduction of the breeder.
3.3.6 Electric Generating Capacity
Table 9 Indicates the electrical generating capacity allocations between
fossil, LWR, HTGR, and LHFBR systems determined in this analysis for three
of the cases (cases 1, 3 and H). The actual U.S. generating capacity in
operation in the Year 2020 (the cutoff year in this analysis) for fossil
- 33

TABLE 9
UPDATED (1970) COST-BENEFIT ANALYSIS
Generating Capacity Placed In Operation With Known Uranium Resources, as of January 1, 1970.
Probable Energy Demand, And HTGR Introduced In 1978
1000 MWe or 1,000,000 Kilowatts of Capacity
YEAR
1970-79
1980-89 1
*§ 1990-99
2000-09
2010-19
Total
Case 1 (w/o LMFBR)
Fossil
186
196
73
127
150
732
LWR
114
213
-
-
24
351
HTGR
2
124
792
1,221
1^618
3,757
Case 3 (w/LMFBR Intro.
Fossil LWR HTGR
182
118
16
-
316 1
118
267
-
198
425
,008
2
124
280
85
77
568
1986) LMFBR
-
24
569
1,065
1,290
2,948
Case 4 (w/U!FBR Intro.
Fossil LWR HTGR
182 118 2
157 252 124
67 - 548
21 - 272
0 440 62
427 810 1,008
1990) LMFBR
-
-
250
1,055
1,290
2,595
Total for Each Case
302
533
865
1,348
1,792
4,840*
*The total of 4,840 should be reduced by the initial plants whose thirty-year life has expired before 2020, to obtain operating capacity in 2020 of about 4000 GW(e).
^B^us nuclear is about 4000 million KWe (excluding peaking units and hydro),
as conpared to the total capacity (Hydro + Fossil + Nuclear) in 1970 of
340 million KWe.
4.0 MAJOR ASSUMPTIONS USED IN THE ANALYSIS
The following assumptions used in the analysis were based upon information
available in the fall of 1970. Sensitivity studies were performed on key
parameters, the introduction date of the LMFBR, capital cost of the LMFBR,
uranium resource availability, energy demcmd and the availability of the
HTGR to the electric power economy.
4.1 Discount Rates
The decision concerning the appropriate discount rate to be used in any
given study should be made on a case-by-case basis. The study was performed
at a 7%/yr. discount rate, which was the rate adopted by the AEC Systems
Analysis Task Force in 1967 after a review of utility practices. This same
discount rate was used in the 1968 Study. For purposes of comparison and
discussion the solution which represented the minimum cost of producing the
Nation's energy demand, with the cost of money valued at 7% per year, was
utilized as a basis for calculation at discount rates of 5, 10, and 12.5%/yr.
4.2 Constraint on Reactor Capacity Introduced
No constraints were placed on fossil or LWR power plant capacity, and econom
ics alone control the number of these plants introduced. It was assumed
that the first commercial HTGR would be placed on line in 1978. The date of
large-scale introduction of the LMFBR was varied to occur during 1984, 1986,
1990 and 1994. Unless restrained, the computer model would build large
Riufflbers of new reactor types inmiediately upon introduction into the system.
- 35 -
In this study, it was assumed that 2000 MWe of HTGR capacity would be Intro-J
duced in the 1978-1979 biennium, and that the capacity introduced in any two-
year period could not exceed twice the capacity introduced in any preceding
two-year period. For the LMFBR, 8000 MWe of LMFBR capacity was allowed in
the first biennium with the same limitation that the capacity could no more
than double in any succeeding two-year period. The restraint on the rate of
introduction allows time for the nuclear industry to tool up to meet the
demand for the new power plant. The higher rate of entry of the LMFBR
recognizes that there are five potential LMFBR vendors and only one vendor
for the HTGR.
4.3 Capital Costs of Plants
The capital costs used in the study together with those used in the 1968
Study are shown on Figure 4. Since the costs are expressed in constant
1970 dollars, they decrease with time to reflect increasing unit size,
improved technology, and improved manufacturing and construction techniaues.
Capital costs used in this study are approximately 50% over those used in
the 1968 Study due to increases in construction costs and the addition of
cooling towers or other means of alleviating the waste heat disposal pro
blem. The cost of improved radioactive waste treatment facilities and
other environmental equipment are added to nuclear plant capital costs;
however, fossil plant capital costs do not include SO and/or NO removal
facilities.
While the capital cost of fossil plants used are those for coal-fired units,
residual oil (particularly low sulfur residual oil) prices are more than
i - 36 -

260
250
240
230
220
210
200
$/KWE 190
180
170
160
150
140
130
120
no
FIGURE 4 UPDATED (1970) COST BEMEFIT ANALYSIS
CAPITAL COST GROUr:D RULE All Figures Are In Constant 1970 Dollars
LWR
LMFBRs
100 1970
Avg. Size of New Nucl. Units
1970 C /B Study
B Study
FOSSIL \ W \ 1968 C-B STUDY x l . 5
. LWR & LMFBR ^^% I
1984 LMFBf \ ^ ^ ^ ^ " " ^ ^ ^ ^ S v ^ * ^ ^'"^^
' _ J O S S I L ^ ,7 FOSSIL *- 1 ^ ^ HTQR ;;,'
LWR HTGR I ///
I . -, I ,;/
^ • — I *//
FOSSIL [ - — , ' / 1 " -''
^ -L I
' I ' ' ' < ' ' I ' I ' I ' ' ' ' ' ' ' ' I I I I
1980 1990 2000 2010 2020
Date of Initial Commercial Operation
1 1 I i i I • 1000 1400 1800 2200 2600 3000 MWE
37 -

enough higher than coal prices to offset the lower capital costs of oil-fired
plants. Gas-fired plants are also less expensive but, because of the shortage
of gas, it was assumed that no new gas-fired unit would be built. Existing
gas plants will, of course, continue to inin for the remainder of their
useful life.
The average size of new nuclear units added was assumed to be 1000 MWe in
the Year 1976 and to increase lineeu'ly to 3000 MWe over the subsequent
thirty-year period. Thus, the average size of new nuclear units is about
1500 MWe in 1984, 1700 MWe in 1986, 1900 MWe in 1990, 2200 MWe in 1994, and
3000 MWe in 2006.
LWR and HTGR power plants were assumed to always achieve the average size of
new units added to the utility system. However, it was assumed that the
first four fully commercial LMFBRs would be a maximum size of 1500 MWe and
the second four units, a maximum size of 2200 MWe. Therefore, the first
four units in the 1986 case were introduced at 1500 MWe with the second four
units at 1700 MWe, the average size of new nuclear units installed on the
system in 1986. Similarly, the first four units in the 1990 case were
1500 MWe and the second four units 1900 MWe, the average size of new nuclear
units installed on the system in 1990; and in the 1994 case, the first four
units were 1500 MWe and the second four units 2200 MWe. In the case of fossil
plants, it was assumed that unit size will not increase above 1000 MWe, and
that multiple units will be used to make up plants equivalent in size to
nuclear plants. This assumption is in line with current experience which
indicates that utilities are no longer building fossil units of increasing
size.
- 38 -

^ ^ Although costs have changed since the fall of 1970 when the input data was
^^prepared, it represented the best data available at the time. This ground
rule is under constant review as part of the AEC's continuing evaluation
of capital costs.
4.4 Mass Balance and Reactor Performance
The mass balance and reactor performance data for LWR and HTGR power plants
was the same as that used in the 1968 Study. The mass balance data for the
LMFBR was revised to utilize more recent data developed by the Argonne
Nati«ial Laboratory.
The characteristics of three of the several types of LWRs used in the analysis
are shown in Table 10, representing (1) an LWR with only enriched uranium
feed, (2) an LWR enriched with only plutonium feed for first four years and
enriched with uranium-235 thereafter, and (3) an LWR enriched with only
plutonium feed for the first ten years and enriched with uraniuffl-235
thereafter. This simplified method was used in the computer runs to represent
LWR operation with and without plutonium recycle.
Table 10 also shows l^e two sets of values which were assumed for the LMFBR,
one for the LMFBRs introduced in the first six years and a second for more
advanced LMFBRs introduced in subsequent years. The LMFBRs introduced in
the first six years were assumed to maintain a specific inventory that is
about 15% higher for the thirty years of life than the advanced LMFBRs. In
practice, the earlier cores would be replaced with improved higher perform
ance cores.
4.5 Fuel Cycle Costs
The systems analysis model utilized unit costs of fuel fabrication, chemical
paration, conversion, and chemical reprocessing which have been computed
- 39 -
^^pre

TABLE 10
UPDATED (1970) COST-BENEFIT ANALYSIS
TOPICAL REACTOR CHARACTERISTICS USED IN ANALYSIS
O
REACTOR DESIGN
LWR N o n - r e c y c l e
P u - r e c y c l e
P u - r e c y c l e
HTGR R e f e r e n c e
LMFBR
Early
Advanced Reactors
PLANT NET THERMAL
EFFICIENCY, X
3 2 . 5
3 2 . 5
3 2 . 5
43
42
42
FUEL
E n r i c h e d u r a n i u m f o r 30 y e a r s .
Pu i n n a t u r a l u r a n i u m - 4 y r s . t h e n e n r i c h e d U.
Pu i n n a t u r a l u r a n i u m - 10 y r s . t h e n e n r . U.
H i g h l y e n r . Uranium
c a r b i d e (U^^^ i n
U ) i n The w i t h r e c y c l i n g of b r e d „ 2 3 3
PuO^-UO^
PUO2-UO2
EQUILIBRIUM FUEL
EXPOSURES MWD/TONNE
HEAVY METAL
30,000-1970 20,000-1990
30,000-1970 20,000-1990
30,000-1970 20,000-1990
63,000
Core-68,000 Blanket-6000
Core-104,000 Blanket-9000
SPECIFIC POWER
MWT/
TONNE
3 4 . 9
3 4 . 9
4 4 . 8
5 7 . 0
5 0 . 2
5 3 . 8
KG/MWE-YR
NET YIELD FISSILE
PU
.272
. 107
- . 0 0 9
. 0 0 1
. 217
, 3 5 8
| „ 2 3 3
—
- -
——
. 0 6 4
- -
NET CONSUMPTION
u235
.867
.690
.550
. 293
—
1 INITIAL SPECIFIC INVENTORY
KG FISSILE PER MWE
2 . 1 7
2 . 2 0
1.48
1.77
2 . 6 7
1,96
PLUTONIUM DOUBLING
TIME (SIMPLE INTEREST)
YEARS
—
- -
——
—
12
6
NET
" 3 ° 8 TONNES/ MWE/YR.
.24
. 19
. 1 3
. 09
—
NET SEPARATIVI
WORK KG/MWE-YR.
148
115
105
98
1
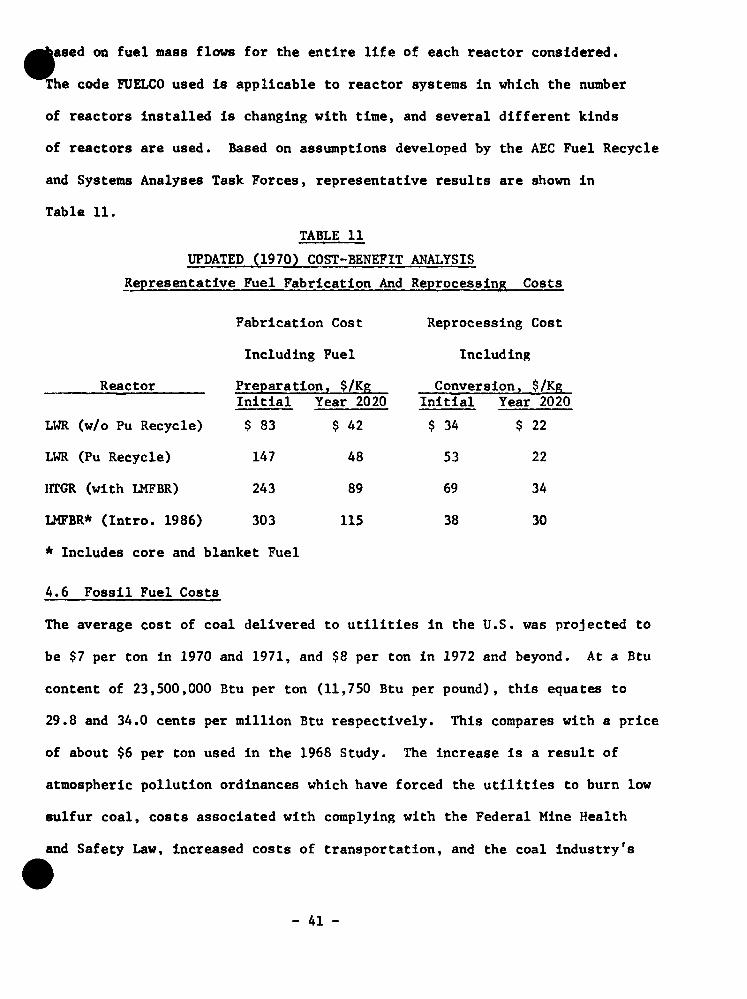
m ased on fuel mass flows for the entire life of each reactor considered. The code FUELCO used is applicable to reactor systems in which the number
of reactors installed is changing with time, and several different kinds
of reactors are used. Based on assumptions developed by the AEC Fuel Recycle
and Systems Analyses Task Forces, representative results are shown in
Table 11.
TABLE 11
UPDATED (1970) COST-BENEFIT ANALYSIS
Representative Fuel Fabrication And Reprocessing Costs
Fabrication Cost
Including Fuel
Reprocessing Cost
Including
Reactor Preparation, $/Kg Initial Year 2020
$ 83
147
243
303
$ 42
48
89
115
C onver s ion, $/Kg Initial Year 2020
$ 34
53
69
38
$ 22
22
34
30
LWR (w/o Pu Recycle)
LWR (Pu Recycle)
IITGR (with LMFBR)
IMFBR* (Intro. 1986)
* Includes core and blanket Fuel
4.6 Fossil Fuel Costs
The average cost of coal delivered to utilities in the U.S. was projected to
be $7 per ton in 1970 and 1971, and $8 per ton in 1972 and beyond. At a Btu
content of 23,500,000 Btu per ton (11,750 Btu per pound), this equates to
29.8 and 34.0 cents per million Btu respectively. This compares with a price
of about $6 per ton used in the 1968 Study. The increase is a result of
atmospheric pollution ordinances which have forced the utilities to burn low
sulfur coal, costs associated with complying with the Federal Mine Health
and Safety Law, increased costs of transportation, and the coal industry's
- 41 -

dsaand for profitability sore in line with other industrial vent\ires. A
detailed discussion of the fossil fuel cost projection is presented in
Appendix A, "Rationale for Fossil Fuel Cost Projection."
H.7 Uraniun Cost Versus Supply
Table 12 shows the three uraniun supply versus cost schedules used in the
Study. In preparing this table, it was assumed that U.S. resources would
supply U.S. requirenents and that if ore was Imported into the U.S. during
the tine period studied, it would be offset by the export of a like amount
of ore from the U.S.
TABLE 12
UPDATED (1970) COST-BENEFIT ANALYSIS
UiPanium Cost Versus Supply
Cases (A £ B Based on Estlnates of U.S. Resources)
Thousands of Average Cost $/Ib. U.O
Tons
0
300
700
1100
1500
1800
2100
2300
2500
2800
4000
of
-
-
-
-
-
-
-
-
-
-
..
V B
300
700
1100
1500
1800
2100
2300
2500
2800
HOOO
10000
Case A
7.25
9.00
11.25
13.75
17.50
22.50
27.50
32.50
37.50
112.50
50.00
Case B
7.25
8.50
9.50
11.00
12.50
15.00
17.50
20.00
25.00
35.00
50.00
Case C
8.00
8.00
8.00
8.00
8.00
8.00
8.00
8.00
8.00
8.00
8.00
- H2 -

^^ase A Is based on domestic uranium z*eserves as of January 1, 1970 and
^^Mtlmates of additional available resources in recognized favorable
geological environments. To achieve the uranium availability shown in
tills ceise would require continued expeditious exploration and exploita
tion of known and estimated resources.
Case B is an alternative analysis based on the premise that resources
may be larger than presently estimated. Historical patterns of
resource development for other metals suggest that this can be expected
If adequate tine is allowed for discovery and exploitation. This case
night be considered as "optimistic" because it goes beyond current
knowledge. If the breeder is Introduced in the 1980's as expected, the
uranium demand can be expected to peak during the next 30 years. If
this prediction curtails prospecting efforts, this projection may not be
realized.
Case C assumes unlimited amounts of uremlum are available at $8/lb. of
U.O . While an unlimited amount of xiranium is not expected to be available
at this price, this case was Included to examine the competitive position of
the breeder if the cost of uranium does not Increase.
H.e Reference and Cutoff Dates
The reference date for this analysis was selected as mld-1971 compared to
January 1, 1970 for the 1968 Study. Since cost-benefit analyses are a
decision-making tool, the reference date should correspond to the earliest
time a decision to change a program can be effected. Since the breeder
R&D program was developed on a U.S. Government Fiscal Yecur basis with costs
discounted to July 1, 1971, the optimization model was based on the same
^^eference date.
- if3 -
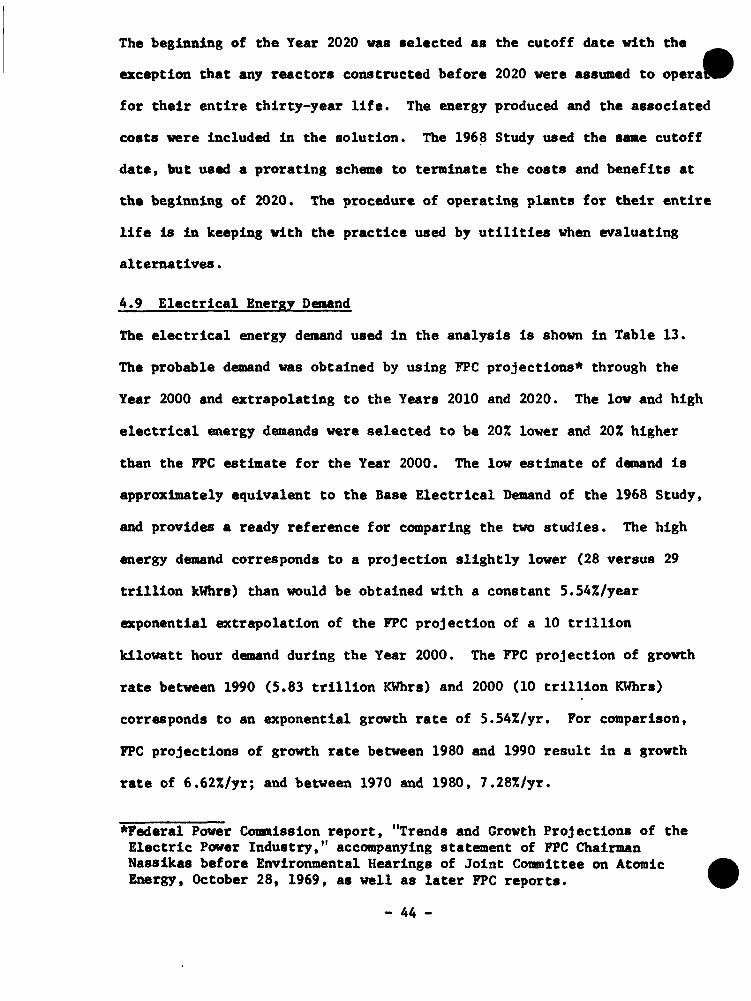
The beginning of the Year 2020 was selected as the cutoff date with the
exception chat any reactors constructed before 2020 were assumed to operaH
for their entire thirty-year life. The energy produced and the associated
costs were included in the solution. The 1968 Study used the sane cutoff
date, but used a prorating scheme to teminate the costs and benefits at
the beginning of 2020. The procedure of operating plants for their entire
life is in keeping with the practice used by utilities when evaluating
alternatives.
4.9 Electrical Energy Demand
The electrical energy demand used in the analysis is shown in Table 13.
The probable demand was obtained by using FPC projections* through the
Year 2000 and extrapolating to the Years 2010 and 2020. The low and high
electrical energy demands were selected to be 207, lower and 20Z higher
than the FPC estimate for the Year 2000. The low estimate of demand is
approximately equivalent to the Base Electrical Demand of the 1968 Study,
and provides a ready reference for comparing the two studies. The high
energy demand corresponds to a projection slightly lower (28 versus 29
trillion kUhrs) than would be obtained with a constant 5.54%/year
exponential extrapolation of the FPC projection of a 10 trillion
kilowatt hour demand during the Year 2000. The FPC projection of growth
rate between 1990 (5.83 trillion KWhrs) and 2000 (10 trillion KWhrs)
corresponds to an exponential growth rate of 5.54%/yr. For comparison,
FPC projections of growth rate between 1980 and 1990 result in a growth
rate of 6.62Z/yr; and between 1970 and 1980, 7.28%/yr.
*Federal Power Commission report, "Trends and Growth Projections of the Electric Power Industry," accompanying statement of FPC Chairman Nassikas before Environmental Hearings of Joint Conmittee on Atomic i Energy, October 28, 1969, as well as later FPC reports. '
- 44 -
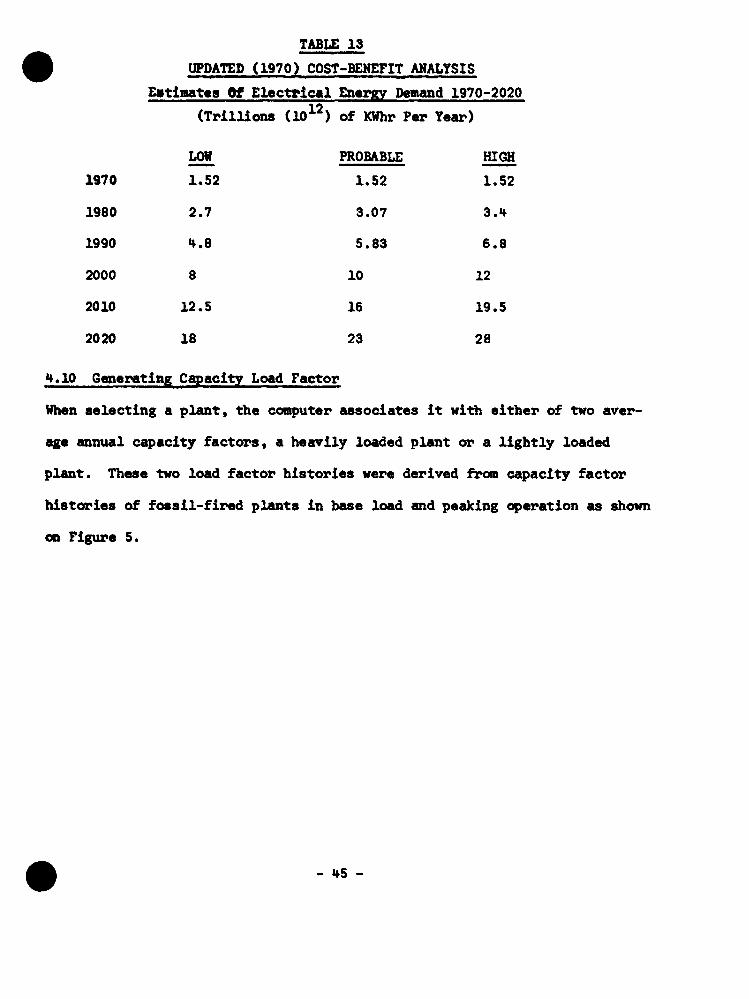
TABLE 13
UPDATED (1970) COST-BENEFIT ANALYSIS
Eatlnates Of Electrical Energy Denand 1970-2020
(TrllHons (10^^) of KWhr Per Year)
1970
1980
1990
2000
2010
2020
LOW
1.52
2.7
«*.8
8
12.5
18
PROBABLE
1.52
3.07
5.83
10
16
23
HIGH
1.52
3.4
6.8
12
19.5
28
H.IO Generating Cig>aclty Load Factor
When selecting a plant, the computer associates it with either of two aver
age annual capacity factors, a heavily loaded plant or a lightly loaded
plant. These two load factor histories were derived from capacity factor
histories of fossil-fired plants in base load and peaking operation as shown
CD Figure 5.
- H5 -

^
^ ht Urn
J^
to o ra =) c c
<
9L S* >
<
1.0 0.9
0.8
0.7
0.6
0.5
0.4
0.3
0.2
0.1
0
FIGURE 5
UPDATED (1970) COST-BENEFIT ANALYSIS
Average Annual Capacity Factor Histories
Heavily Loaded Plant
Lightly Loaded Plant
I
0 2 4 6 8 Id 12 14 16 18 20 22 24 26 28 30
Years From Startup
manner tiiat the predicted yearly Integrated system capacity factor for stean-
electrlc plants was approxlnately 64%, a system capacity factor consistent
with utility experience. This capacity factor does not Include peaking
plants, such as gas turbines, hydro-electric plants, or pumped storage
facilities.
4.11 Separative Work Cost
The separative work charge used was $27.16 per kilogram in 1970 and 1971,
and $32 per kilogram thereafter. The $27.16 per kilogram change represents
- 46 -

€ ^ ^ ;
average of a $26 per kilogram price through February 21, 1971 and $28.70
rough December 31, 1971, consistent with AEC price schedules.
4.12 Research and Development Program
In order to obtain costs, alternate R&D plans were projected which would
lead to the large-scale introduction of the LMFBR reactor in 1984, 1986,
1990 and 1994; and a plan Involving Introduction of a pea:>allel breeder in
1994. The analysis assumed that the RSD programs would be successful and
that a connerclally viable and competitive nuclear Industry would evolve
for each reactor concept pursued.
The following cases were used:
Case A . LWRs Introduced into the power economy in the early 1970's.
HTGRs Introduced into the power economy in the late 1970's.
B Cases . Prior to LMFBR introduction, program Includes converters
(LWR, HTGR) and breeders (LMFBR, MSBR and alternate fast
breeder reactors)
LWRs Introduced into the power economy in the early 1970's.
HTGRs Introduced Into the power economy in the late 1970's.
Except in Case B-5, the parallel breeder, MSBR and other
breeder work continued at technology level until LMFBR
introduction is Imminent, then those efforts are phased out.
Three LMFBR denonstratlon plants and the first few large
connerdal plants r«celve government support.
Large denonstratlon plants follow initial demonstration by
three years and are built by sane reactor nanufacturers.
Fast Flux Test Facility (FFTF) becomes operational In 1974.
- 47 -
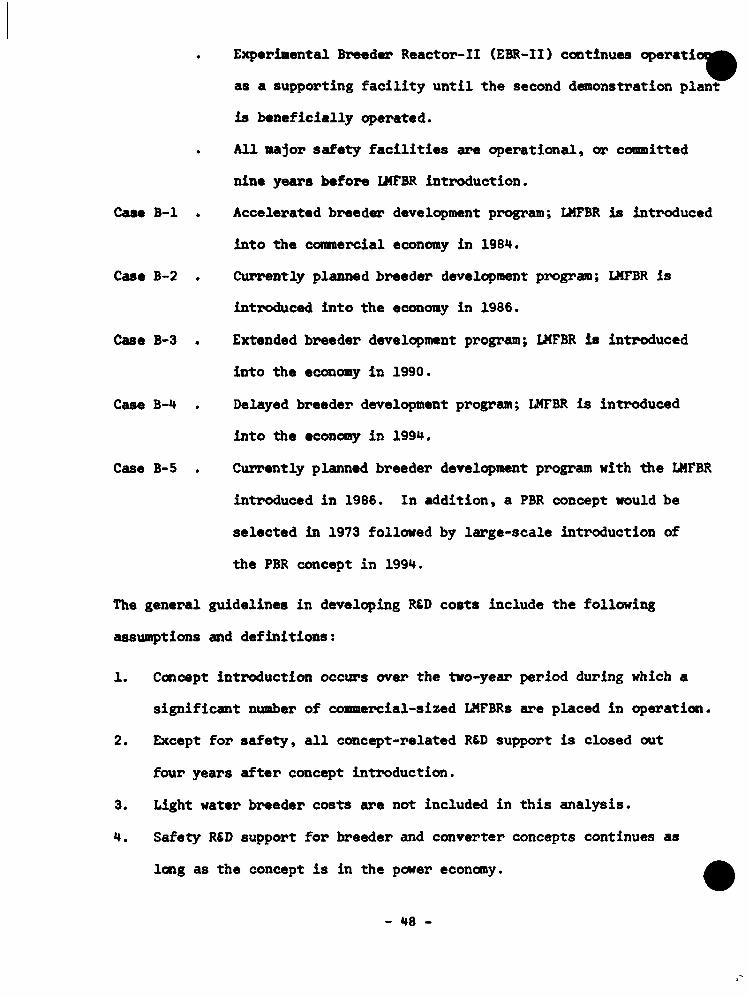
Experlnental Breeder Reactor-II (EBR-II) continues operatlong
as a supporting facility until the second demonstration plant
is beneficially operated.
All major safety facilities are operational, or connltted
nine years before LMFBR introduction.
Case B-1 . Accelerated breeder development program; LMFBR is Introduced
into the commercial economy in 1984.
Case B-2 . Currently planned breeder development program; LMFBR is
Introduced into the economy in 1986.
Caa9 B-3 . Extended breeder development program; UIFBR Is Introduced
Into the economy in 1990.
Case B-4 . Delayed breeder development program; LMFBR is Introduced
into the economy in 1994.
Case B-5 . Currently planned breeder development program with tiie LMFBR
introduced in 1986. In addition, a PBR concept would be
selected In 1973 followed by large-scale introduction of
the PBR concept in 1994.
The general guidelines in developing R&D costs Include the following
assunptlons and definitions:
1. Concept introduction occurs over the two-year period during which a
significant nunber of conner«lal-sized LMFBRs are placed in operation.
2. Except for safety, all concept-related R&D support is closed out
four years after concept lntXK>ductlon.
3. Light water breeder costs are not Included in this analysis.
4. Safety RSD support for breeder and converter concepts continues as
long as the concept is in the power economy. ^
- 48 -

Safety related work on waste disposal, environmental effects, and
other related efforts continue throughout the time period considered
in this program.
In the case of the PBR program, it was assumed that the LMFBR R&D
program would not be changed as the result of a decision to Implement
the PBR program, and that the PBR would benefit from the LMFBR R&D
program.
- 49 -

APPENDIX A
Rationale for Updated (1970) Cost-Benefit Analysis
Fossil Fuel Cost Projection
The coal projection of $7/ton in 1970 and 1971 and $8/ton in 1972 and
beyond was made after reviewing the Bltvmlnous Coal and Lignite Chapter
of the 1970 Edition of the U.S. Bureau of Mines' Mineral Facts and
Problems Yearbook and current literatxire, and after discussions with
the Bureau of Mines.
The 1970 Mineral Facts and Problems Yearbook, published In late 1970,
Is formulated based upcn fuel price data collected by the FPC. No new
material is lntz>oduced into the report edfter the first draft is assembled.
Thus, the 1970 Yeeurbook is based upon the cost of coal delivered to
utilities in 1968 and the coal supply situation as seen in mld-1969.
The costs of "as burned" coal reported in the 1970 Edition in 1968 dollars
are:
1955 $8.13/ton 1957 8.30 1958 8.01 1961 7.22 1963 6.84 1965 6.42 1966 6.29 1967 6.19 1968 6.10
Since many of the current problems in the energy supply and coal
industries had not yet developed by mid-1969, the backdrop for writing
the 1970 Yearbook was a stable coal supply demand relationship with
strong downward pressure on coal prices. In light of this, it was
predicted that prices would gradually decrease to about $6/ton in 1978
- 50 -

id then remain relatively stable rising at a gradtial rate of only 0.1%
^ r year. The slight decrease In costs was attributed to increased
efficiencies resulting from accelerated mechanization. Increased strip
mining, and price con^etltion from other energy sources as well aa
campetltlon within the industry Itself.
The assumption that competition would continue to exert a strong down
ward pressure on prices has proven incorrect, and prices have been and
are continuing to rise. The average utility coal price on an "as
burned" basis in 1969 is now known to have been $6.26/ton and the
Department of the Interior has estimated that the average cost for the
first quarter of 1970 was $6.85/ton.
The 1970 Yearbook did not anticipate or discuss any of the problems
Mfalch exist today. The Increase In energy denand coupled with delajrs
In bringing both large fossil and nuclear plants into operation, which
resulted in an acute shortage of coal for existing plants, had not yet
devel(^ed. The emphasis on lowering SO. emissions resulting in a
quest f(»> low sulfur coal was just getting underway. Attention had
been focused on the black lung disease but had not yet been fully
directed to In^roved mine safety; and the railroads had not yet started
their drive for higher haulage rates.
In addition, the profitability of the coal Industry has been low and
'ttie current situation is providing an opportunity for mine owners to
Improve the economic structxire of the industry. Assistant Secretary
of the Interior Hollis M. Dole, in his October 7, 1970 testimony
before the House of Representatives Select Coonittee on Small Business,
- 51

pointed out that from 1960 through 1968 the profitability in the durable
and nondurable goods industries and the coal industry were as follows:
In percent of sales
1960 1965 1966 1967 1968
Durable and ncmdiirable goods.... 4.4 5.6 5.6 5.0 5.1
Coal 0.4 2.9 1.9 1.9 1.3
By comparison, earnings in the petroleum refining industry were 9.9 to
11.2%; in the minerals and allied products Industries, 6.8 to 7.9%; in
the tobacco Industry, 5.5 to 5.9%; and in the motor vehicles and equip
ment industries, 4.9 to 7.2%. Because of the strong downward price
presstire which has existed during the past several years and the strong
competition from new fuel sources, mine owners (particularly the smaller
mine owners) have sold coal at prices too low to sustain a continuing
qperatlon. Either mine owners had to close their mines as their equip
ment wore out or prices had to Increase. Coupled with this was recognition
on the part of oil companies that the pz*oductivity of mining coal and its
profitability might be improved by the infusion of large amounts of
capital, and that owning coal reserves would provide a hedge against
dwindling domestic resources of gaseous and liquid fuels. The result was
that the major oil companies purchased coal properties and now produce
about 20% of the coal mined in the United States. While these oil com
panies have the capital to Invest in the mines, it is reasonable to expect
that they will also demand a return on their Investment more in line with
petroleum refining and other coimnltments available to them; and once the
current upward price trend ends, it is not likely that prices will ever
return to former levels. This Is paz^lcularly true since many of the sma
- 52 -

^ ^ n e owners have closed their mines for reasons associated with the 1969
Mine Health and Safety Act or because they do not have the capital to
Invest in mine improvements.
Thus, a temporary coal shortage and increased emphasis on low sulfur coal
has occurred at the precise time when increased profitability and greater
capital expenditures for improving mine productivity and safety are required.
Once these economic factors have been reflected, it is unlikely that the
price will ever fall back to former levels. However, after these factors
have run their course, relative long-term stability can be expected. The
larger companies will be able to provide the capital required to increase
mechanization and obtain higher productivity, and the higher productivity
will help offset higher wages and the progressively increasing difficulty
in removing coal from the earth. In light of what is known today, once
coal prices have stabilized at a new level, it is reasonable to agree with
the 1970 Mineral Facts and Problems Yearbook prediction that prices will
renaln essentially stable, rising at the very gradual rate of 0.1%/yr.
While attenpts can be nade to assess the magnitude of each of the various
factors causing the upward price pressure, the various factors are not
necessarily additive. Therefore, authorities in the industry place more
eaphasis on estimates of their overall effect. An informative article on
this subject was published- in August of 1970 by L. G. Hauser and R. F.
Potter of the Westinghouse Electric Corporation. They project 1969
delivered coal costs of 26 cents per million Btu and 1971 costs of 36 cents
per nllllon Btu with further price rises beyond 1971 due to nomal
17 L. G. Hauaer and R. F. Potter, "More Escalation Seen for Coal Costs," ^ ^ Electrical World. Vol. 174, No. 4, pp. 45-48, August IS, 1970.
- 53 -

inflationary factors. When these costs are escalated and deescalated ^ ^
to 1970 dollars respectively and converted to $/ton of coal, prices of
$6.30/ton for 1969 and $8.00/ton for 1971 result. The $6.30/ton for
1969 agrees with the average 1969 price of $6.26/ton detemlned from
FPC data. The Department of the Interior's first quarter of 1970
estimate of $6.85/ton agrees surprisingly well with an interpolation
between the Hauser and Potter 1969 and 1971 average prices. In another
2/ projection,— Mr. Gerald C. Ganbs, Director of Special Projects for Ford,
Bacon and Davis, estimated that average coal costs would reach $10/ton
by October 1971. This projection appears overly pessinistlc and
underestinates the ability of the coal Industry to compete as market
conditions change. On October 6, 1970 Mr. Herbert Stein, Member of the
Council of Economic Advisers, testified before the House Select Coioiilttee
on Small Business Subconnlttee on Special Snail Business Problens, and
stated that bituninous coal prices have been rising sharply. He predicted
that prices would rise to $6.50/ton in 1970. This is slightly lower than
the Hauser and Potter prediction, but essentially in line with the direc
tion coal prices have been novlng.
Consultation with the Bureau of Mines on the predictions of coal prices
indicated agreenent with the factors described and the $8/ton long-term
prediction. It should also be noted that coal prices were at the $8/ton
level as recently as ten years ago. The Bureau of Mines also indicated
that nlne-nouth coal gasification will be industrialized as gas supplies
2/ Nuclear Industry, pg. 10, September 1970, published by Atomic Industrial Forum, 475 Park Avenue South, New York, New York 10016.

fcome scarcer, and that coal production will remain stable as the use
Ifts from producing electricity to producing gas and possibly liquid
hydrocarbons.
Estimating oil and gas prices presents a different problem.
Oil, being a liquid, is relatively easy to transport and manufacture into
other products, such as gasoline, liibricatlng oils, etc. Since the refiner
has considerable control over his product mix, residual oil (the utility's
fuel) can be functionally priced. The price of the alternate fuel sets a
celling price when residual oil is plentiful and a floor price when it is
scaz>ce. East Coast residual oil prices without sulfur content specifica-
tl<»is were about $1.80/bbl., equal to 30 cents per million Btu or $7/tca)
of coal, before 'die enactment of atmospheric pollution ordinances by most
large cities. The enactment of these ordinances has forced many utilities
to convert from coal to oil and to place maximum sulfur content specifica
tions oa fuel. The resulting Increased demand for residual oil has resulted
in the cost of East Coast low sulfur residual oil Increasing to $3/bbl. and
higher. This Is equal to 49 cents per million Btu or $11.60/ton coal, a
price clearly above coal costs. Thus, oil has risen higher than coal prices
and will probably remain so for the life of existing plants. Nuclear power
plants will probably replace these oil-fired plants as they are placed into
peaking service or retired.
Gas prices are regulated by the FPC and there has been pressiire to allow gas
prices to seek higher levels. However, since gas reserves have been
diminishing, an assunptlon was made for this study that existing gas-fueled
electric power plants would continue to run for the remainder of their useful
- 55 -

life, but no new plants would be constructed. Therefore, the cost of g a ^
and the cost of producing electricity from gas is of no consequence to ^ ^
this study.
When considering tiie $8/ton average long-term coal price prediction, it is
Important to understand that it is a prediction made in context of the
present mix of usage by the utility Industry. This mix is entered into
the computer data bank In terms of 13 cost categories selected from 1967
FPC data. The categories were selected in such a way that about equal
amounts of energy were produced in each category. A weighted average
energy cost for each category was then calculated. Since the average
cost of coal delivered to utilities in 1967 was $6.19/ton, the cost of
each category was Increased by $8/$6.19 to cditain new cost categories for
the Year 1972 and beyond. The $8/ton average price is then made up of
categories as low as $4.96/ton and others as high as $10.39/ton.
The computer selects the most econcmical nethod of producing the energy
(fossil or nuclear) in each of the 13 new cost categories. Nuclear energy
supplies HiB energy in the high cost categories in early years and grad
ually progresses to lower cost categories. Thus, the $8/ton fuel cost
assumption allows the continued use of coal in low-cost regions with a
deepening penetration of nuclear plants in the higher fuel cost catego
ries of the United States. The mix of coal usage, therefore, shifts with
time toward lower cost regions. This change in mix results in lowering
the average cost of coal burned below the $8/ton assumption and results
in an average cost of "as burned" coal In later years of approximately
$6.50/ton.
- 56 -•


![(Ord. 1184, Sec. 1 [2021]) - West Fargo, ND](https://img.pdfslide.us/doc/110x75/61d18e4117da8a47fe123a59/ord-1184-sec-1-2021-west-fargo-nd.jpg)