Embed Size (px)
Citation preview

Do Research Joint Ventures Serve a Collusive Function?
Michelle Sovinsky and Eric Helland
No 1030
WARWICK ECONOMIC RESEARCH PAPERS
DEPARTMENT OF ECONOMICS

Do Research Joint Ventures Serve a Collusive Function?
Michelle Sovinsky and Eric Helland1
September, 2012
(First version: October 2007)
Abstract
Every year thousands of �rms are engaged in research joint ventures (RJV), where all knowl-edge gained through R&D is shared among members. Most of the empirical literature as-sumes members are non-cooperative in the product market. But many RJV members arerivals leaving open the possibility that �rms may form RJVs to facilitate collusion. We ex-amine this by exploiting variation in RJV formation generated by a policy change that a¤ectsthe collusive bene�ts but not the research synergies associated with a RJV. We use data onRJVs formed between 1986 and 2001 together with �rm-level information from Compustatto estimate a RJV participation equation. After correcting for the endogeneity of R&Dand controlling for RJV characteristics and �rm attributes, we �nd the decision to join isimpacted by the policy change. We also �nd the magnitude is signi�cant: the policy changeresulted in an average drop in the probability of joining a RJV of 34% among telecommu-nications �rms, 33% among computer and semiconductor manufacturers, and 27% amongpetroleum re�ning �rms. Our results are consistent with research joint ventures serving acollusive function.JEL Classi�cation: L24, L44, K21,O32Keywords: research and development, research joint ventures, antitrust policy, collusion
1 Sovinsky is at the University of Warwick, the University of Zurich, and CEPR; Helland is at ClaremontMcKenna College and RAND. Corresponding author is Sovinsky ([email protected]). We aregrateful to Phil Haile and three anonymous referees for very helpful comments. This research hasbene�ted from comments at Carlos III Madrid, Cergy Pontoise, Claremont McKenna, DOJ An-titrust Division, EARIE meetings, Hebrew University, Laussane, Mannheim, Melbourne, Monash,UC Davis, Zurich, IOS meetings, SEA meetings, and the American Law and Economics meetings,and discussions with Linda Cohen, Jonah Gelbach, Jacob Goeree, Joe Harrington, Hugo Hopen-hayn, Patricia Langohr, Josh Rosett, Janet Smith, and Guofu Tan. We gratefully acknowledgesupport from the Financial Economics Institute and the Lowe Institute of Political Economy. Wethank Katy Femia and Elissa Gysi for research assistance and Albert Link for providing the COREdata.
�People of the same trade seldom meet together, even formerriment and diversion, but the conversation ends in a conspiracy
against the public, or in some contrivance to raise prices.�Adam Smith in Wealth of Nations
1 Introduction
Every year thousands of �rms are engaged in research joint ventures (RJV), an agreement in
which all knowledge gained through research and development (R&D) is shared among mem-
bers. RJVs often provide pro-competitive bene�ts, such as shared risk, increased economies
of scale in R&D, asset complementarities, internalized R&D spillovers (i.e., overcoming free-
rider problems), alleviated �nancial constraints, and shared cost. The majority of the
literature focuses on the bene�ts of RJVs and assumes that members do not collude in the
product market.2 However, by construction, RJVs permit multiproject and multimarket
contact and o¤er �rms an opportunity to coordinate behavior. As Martin (1995) notes, �It
is conceivable that �rms that start to work very closely on R&D projects might start to
extend the coordination of their behavior onto other spheres of the life of the �rms.�3
There are numerous ways in which R&D collaborations may lead to collusive product
market behavior. For instance, RJV formation could centralize decision making by com-
bining collaborative e¤orts with control over competitively signi�cant assets, by imposing
collateral restraints that restrict competition among participants, by including member �rms�
individual R&D in the collaborative e¤ort, by facilitating the exchange of competitively sen-
sitive information, or by functioning as a vehicle to signal cooperative behavior. Finally,
production joint ventures, which involve jointly manufacturing a new or improved product,
2 See for instance, Marin, et al (2003), Cassiman and Veuglers (2002), Kaiser (2002), Hernan, et al (2003),and Roller, et al (2007). Caloghirou and Vonortas (2000) and Hagedoorn, et al (2000) provide summariesof the RJV formation literature.
3 Theoretical papers that address the potential for product market collusion among RJV members included�Aspremont and Jacquemin (1988) who consider a duopoly model of R&D coordination and �nd that welfareis improved by R&D cooperation (when spillovers are high) but that in many cases welfare is reduced if�rms collude in output; Martin (1995) who �nds that self-enforcing R&D makes it more likely that tacitcollusion can be sustained in the product market; and Greenlee and Cassiman (1999) who develop a modelin which RJV formation and the decision to collude in the product market are endogenous. They �nd thatRJVs should not be supported if they involve product market collusion.
1
typically involve agreements on the output level, the price of the joint product, or other
competitive variables.
The collusive potential is even more pronounced when RJV members are product market
rivals, as is frequently the case. Examples of direct product market competitors involved in
joint RJVs include Xerox and Dupont who formed a RJV to develop copying equipment;
Shell and Texaco to re�ne crude oil; General Motors and Toyota to produce a new type of
car; Merck and Johnson & Johnson to develop new over the counter medicines; MCI and
Sprint to provide enhanced telecommunications services; Samsung and Sony to develop LCD
panels; and SEMATECH, a consortium of leading semiconductor manufacturers established
to improve semiconductor manufacturing technology.
In many industries competitors are in numerous RJVs together. Multiproject contact
is an anticompetitive concern, and a number of arguments for how it can facilitate tacit
collusion are discussed in the theoretical literature.4 In addition, Snyder and Vonortas
(2005) show that multiproject contact can facilitate explicit collusion in that it serves to
bundle markets, which reduces the heterogeneity of �rms�private information making collu-
sive agreements more e¢ cient. Another avenue through which multiproject contact may be
anticompetitive is that by participating in several markets together �rms are able to punish
deviations from collusion with price wars on all markets in which they meet.5
Firms in computer manufacturing, petroleum re�ning and telecommunications industries
exhibit the highest multiproject contact via joint membership in numerous RJVs. Among
RJVs registered with the antitrust authorities from 1985 to 1998, Amoco and Chevron were
involved in more than 60 joint RJVs, resulting in the highest multiproject contact among
all �rms. Furthermore, over three-quarters of all RJVs exhibit multiproject contact in that
they have at least one �rm pair that is also in at least one other RJV during the same time
4 Bernheim and Whinston (1990) �nd that multimarket contact may reduce the incentive to deviateby pooling asymmetries among �rms. Spagnolo (1999) shows that multimarket contact will facilitate tacitcolllusion (when �rms have concave utility functions over pro�t) because as markets are added the lost pro�tsfrom deviation increases more than proportionately with the gain from deviation.
5 Cooper and Ross (2009) present a theoretical model in which a joint venture between �rms in onemarket can serve to facilitate collusion in another market. See also van Wegberg and van Witteloostuijn(1995) and Vonortas (2000).
2

period, where 60% of the cases involve �rm pairs from the same industry.6 A common
justi�cation for promoting RJVs is that R&D cooperation eliminates wasteful duplication,
but the frequent occurrence of numerous RJVs with overlapping research agendas seems to
suggest an alternative motivation for RJV formation.
The possibility that �rms may undertake legal RJVs as a means to facilitate illegal
product market collusion has generated regulatory scrutiny in a wide variety of industries and
research areas.7 For example, in the petroleum industry in 1990, antitrust authorities found
evidence that six major oil companies, who were involved in numerous RJVs with overlapping
membership, were sharing price information through direct contacts among competitors,
press releases, and price postings.8 More recently, an antitrust lawsuit was �led in 2006
against CITGO Petroleum and Motiva, a research joint venture between Shell, Texaco,
and Saudi Re�ning, alleging that the defendants conspired with the Organization of the
Petroleum Exporting Countries (OPEC) to �x the price of gasoline.9 The following year
a group of California gasoline station owners brought a suit against Equilon Enterprises,
another RJV between Texaco and Shell, alleging that the RJV violated unfair competition
laws and illegally �xed gasoline prices from 1998 to 2001. The suit states that the chairmen
of the oil companies met privately starting in March 1996 for the �purpose of forming and
organizing a combination,�that the executives destroyed documents from the meetings, and
that the (now-defunct) RJV violated antitrust laws and caused arti�cially high wholesale gas
prices.10 Texaco had to withdraw from Equilon and Motiva when it merged with Chevron to
6 See Snyder and Vonortas (2005) for more analysis on multimarket contact among RJV members.
7 For an extensive discussion see Brodley (1990), Jorde and Teece (1990), and Shapiro and Willig (1990).
8 See Coordinated Proceedings in Petroleum Products Antitrust Litigation, 906 F2d 432 (9th Cir. 1990)and Petroleum Products Antitrust Litigation, 906 F.2d 432 (9th Cir.1990). The �rms were Texaco, Inc.,Union Oil Co. of California, Atlantic Rich�eld Co., Exxon Corp., Mobil Oil Corp., and Shell Oil.
9 On January 9, 2009, the case was dismissed due to lack of subject matter jurisdiction. See Re�nedPetroleum Products Antitrust Litigation (MDL No. 1886) (2006).
10 The lawsuit hinges on a marketing deal that allowed former rivals to collude on prices starting in 1998,when Shell and Texaco formed Equilon Enterprises and Motiva Enterprises. Equilon and Motiva beganoperating when in�ation-adjusted crude oil prices hit their lowest levels post-1930 yet wholesale prices werehigher by 20 to 40 cents a gallon. Franchises typically sign long-term contracts with oil suppliers, makingit di¢ cult to switch to another brand or an independent supplier. The suit is similar to one �led in 2004(Texaco Inc. v. Dagher, 547 U.S. 1; 2006), which was dismissed in 2006 by the Supreme Court who ruled
3

satisfy federal regulators. In addition, European antitrust authorities required Mobil Corp.
to withdraw from a re�ning and marketing RJV with BP Amoco as a condition for approval
of its merger with Exxon Corp.
There have also been high pro�le cases in the computer industry. In one such case Ad-
damax Corp., a producer of security software, alleged that the RJV formed among Hewlett-
Packard, IBM, and Digital Equipment, called the Open Software Foundation, engaged in
horizontal price �xing by conspiring to force input prices (the price of security software)
below the competitive price.11
Recently, in the semiconductor memory market, the US Department of Justice (DOJ)
charged four companies (Samsung, In�neon, Hynix, and Elpida) with �xing prices for dy-
namic random access memory (DRAM). The suit states that company executives discussed
the price of DRAM at joint meetings, agreed to �x prices, and exchanged information with
competitors. Micron, who was a coconspirator, sought amnesty from prosecution through
the DOJ�s leniency policy, and hence was not subject to criminal �nes in exchange for infor-
mation on the other conspirators. Samsung, Hynix, Elpida and In�neon plead guilty and
agreed to pay more than $732 million in collective �nes, the second highest total obtained in
an investigation aimed at one industry. These companies had been involved in various RJVs
with overlapping membership including SEMATECH, of which Micron was a member.
Another industry with a history of collusive behavior in which RJVs are commonplace is
telecommunications, where nearly 40% of �rms are involved in at least one RJV with another
direct product market rival. Between 1984 and 1996, telecom �rms were not permitted to
o¤er both local and long distance services.12 During this period of regulation, the long
that the uni�ed price for the two companies�brands was not an antitrust violation under the rule of reason.
11 Open Software Foundation (OSF) was founded to develop a version of the Unix operating system tocompete with AT&T and Sun Microsystems. Addamax, was a producer of Unix based security software.OSF considered bids for security software from Addamax, AT&T, and SecureWare and selected SecureWare.Addamax then sued OSF alleging horizontal price �xing and unlawful joint venture conduct. The court ruledin favor of the defendents primarily based on the �nding that the lower price of security software was not asubstantial cause of Addamax�s failure to succeed in selling security software. See Addamax Corp. v. OpenSoftware Foundation, 964 F. Supp. 549 (D.Mass. 1997), a¤�d, 152 F.3d 48 (1st Cir. 1998).
12 In 1984, AT&T relinquished its hold on the local market when the Department of Justice ordered AT&Tto divest its local telephony business. These companies became the Regional Bell Operating companies orRBOCs. Local operators were not permitted to o¤er long distance services until the TelecommunicationsAct of 1996.
4

distance market consisted of a regulated dominant �rm (AT&T), two main competitors
(MCI and Sprint), and hundreds of resellers. AT&T was required to provide services to
all long distance customers, to �le with the Federal Communications Commission (FCC) to
add a new service, and to average its rates across consumer markets. MCI and Sprint were
not regulated in their prices or provision of services. Despite being unregulated, MCI and
Sprint charged prices a little lower than those of AT&T. Furthermore, almost every new
rate decrease proposed by AT&T was challenged under the umbrella of predatory behavior.
These observations have led some economists to classify the market for long distance services
in the 1990�s as collusive with AT&T as the price leader.13 It is also notable that from
1984 to 1996, AT&T, MCI, and Sprint were involved in numerous joint RJVs.
In spite of the suggestive evidence, to our knowledge, this is the �rst study in the empirical
literature to examine whether collusive behavior may be facilitated by RJVs.14 Estimating
the impact of the returns to collusion on the decision to join a RJV is di¢ cult as there are
many legal reasons to join a RJV which also result in increased market power of the members.
One option is to consider a subset of �rms engaged in RJVs and another subset not engaged
in RJVs and test whether collusion is higher among the �rst group. However, such a test
would only be able to tell us something about collusive behavior that was detected, but
would not inform us about the prevalence of �rms that form RJVs with collusive intentions
but are not caught. An additional problem is the endogeneity of the choice to join a RJV.
In this paper we propose a test of whether the data are consistent with �rms forming RJVs
as a way to facilitate collusion in the �nal goods market. Rather than directly testing for
collusion by �rms engaged in RJVs we examine their potentially collusive function through
a quasi-experiment. The quasi-experiment tests whether a 1993 revision of the antitrust
leniency policy, which was enacted to detect collusive behavior, made �rms more or less
likely to join RJVs. We argue that the policy revision made applying for amnesty easier and
13 See Huber, et al (1992) and MacAvoy (1995).
14 The closest empirical work on this topic is that of Scott (1988, 1993), who examined all RJV �lings overan 18 month period and found that collaboration may have resulted in less competitive markets. However,as Reinganum (1983) notes, RJVs in�uence R&D levels di¤erently for those �rms in the venture relative tothose not in the venture. For instance, RJVs may exaccerbate initial asymmetries across �rms, resulting inincreased market power for those �rms in the RJV. Hence RJVs may a¤ect market structure and marketpower absent collusive product market behavior.
5

more attractive and, hence, reduced the gains from trying to establish a collusive relationship
because coconspirators would be more likely to defect and seek amnesty. This change in the
value of collusion should change the bene�t of joining a RJV only if membership serves some
sort of collusive function at the margin. Since the leniency policy applies to all �rms after
1993 we are concerned that our results might be driven by some unobserved trends in the
data. For this reason we construct a �treatment�group that consists of potential colluders in
the sense that these are �rms that have joined a RJV with other �rms in the same �nal goods
industry. Furthermore, we examine whether the policy revision di¤erentially impacts �rms
for whom collusion might be more valuable. To do so, we develop a measure of the RJV�s
collusive value to a �rm that is considering whether to join a particular RJV. The �rm-
speci�c measure of �RJV market power�allows us to obtain a heterogeneous treatment e¤ect
of RJV participation. Determining the entire shape of the curve relating the probability of
joining a RJV to the market power of the RJV allows us to make a more precise inference
on the collusive potential of RJVs. Our test of a RJV�s collusive function is (i) whether the
revised leniency policy changed the probability that �rms join a RJV and (ii) whether the
policy has a di¤erential impact if the RJV market power is larger.15 Our approach has the
advantage that we are able to examine the collusive potential of RJVs without observing
costs or prices.
Another obvious problem in measuring collusive intentions, which plagues the majority of
studies of collusion, is de�ning the relevant product market. To this end we consider many
de�nitions of the relevant market, ranging from very broad (e.g., 3-digit NAICS) to very
narrow and industry speci�c (e.g., the market for long distance carriers under the period of
telecommunications regulation). We apply our quasi-experiment to three industries with a
history of antitrust suits coupled with high RJV participation: petroleum manufacturing,
computer and electronic product manufacturing, and telecommunications.
15 We cannot predict what direction the impact of the leniency policy will be. For example it is possiblethat the leniency policy makes all collusive arrangements less attractive and hence RJV are less commonafter the policy and even less common among RJV that would have had a higher collusive value before thepolicy. Alternatively the legal protection a¤orded by registering the RJV may make it a more attractiveoption following the leniency policy. While important for policy makers, the exact sign of the impact of theleniency policy is not important for our test since there is no reason why the leniency policy should impactRJV formation unless some of these ventures serve a collusive purpose.
6

We �nd that the decision to join a RJV is impacted by the policy change and that this
impact is very signi�cant across relevant market de�nitions. Speci�cally, we �nd that the
revised leniency policy reduces the average probability that telecom �rms join a given RJV
by 34%; the reduction among computer and semiconductor manufacturers is 33%; and among
�rms in petroleum re�ning the probability decreases by 27%: Our results are consistent with
RJVs serving (at least in part) a collusive function.
The rest of the paper proceeds as follows. In section 2 we provide background on the
legal policies surrounding RJV formation and collusive behavior. We present the model
and estimation technique in section 3. In section 4 we discuss the data. We present the
results in section 5. In section 6 we conclude.
2 Antitrust Policy Background
2.1 Leniency Policy
The Sherman Act of 1890 makes it illegal for �rms to agree to �x prices or engage in
other agreements that restrict output or harm consumers. In 1978, the US Department of
Justice (DOJ) Antitrust Division enacted the leniency policy program designed to detect
�rms engaged in collusive behavior. The DOJ substantially revised the leniency program,
in August 1993, to make it easier and �nancially more attractive for �rms to cooperate with
the Division. According to a DOJ policy statement, �Leniency means not charging such
a �rm criminally for the activity being reported.� There were three major revisions: (i)
amnesty was made automatic if there was no pre-existing investigation (ii) amnesty could
be granted even if cooperation began after the investigation was underway (iii) all directors,
o¢ cers, and employees of the �ling �rm are protected from criminal prosecution. There is
one important caveat: only the �rst company to �le receives amnesty.
In addition to making it more attractive for cartel members to report illegal behavior,
in 1995, the DOJ substantially increased the penalties for antitrust violations. Prior to
1995, the largest criminal �ne was $6 million. In contrast, the average criminal �ne was
in excess of $6 million after 1996. Total �nes imposed in 1997 and 1998 were �virtually
identical to the total �nes imposed in all of the Division�s prosecutions during the 20 years
7
from 1976 through 1995.� In 1999, total �nes imposed exceeded $1.1 billion.16 Since the
Division revised its leniency program, cooperation from leniency applications has resulted
in numerous convictions and nearly $4 billion in criminal �nes.
There is much evidence that �rms reacted to the policy change. Most concretely, the revi-
sion resulted in a surge in amnesty applications. Under the old policy, the Division obtained
about one amnesty application per year, whereas the new policy generates more than one
application per month. Scott Hammond of the DOJ stated that leniency programs have been
responsible for �detecting and cracking more cartels than all search warrants, secret audio
or videotapes and FBI interrogations combined.�17 A Deputy Assistant Attorney General
of the Division remarked �The early identi�cation of antitrust o¤ences through compliance
programs, together with the opportunity to pay zero dollars in �nes under the Antitrust
Division�s Corporate Amnesty Program, has resulted in a �race to the courthouse,�...� In-
deed, it is not uncommon for a company to request amnesty a few days after one of its
coconspirators has already secured amnesty by �ling �rst.18 Miller (2009), who provides
estimates from a structural model of cartel behavior, shows that the leniency policy reduced
cartel formation by 59%, while it increased the detection rate by 62%.
Some well-known examples of collusive behavior thwarted via the leniency policy include
markets for DRAM chips, marine hosing (used to funnel oil from tankers to storage facilities),
air cargo transportation, graphite electrodes production, vitamin sales, �ne arts auctions,
and USAID construction. Each of theses cases involved multimillion dollar �nes and in
some cases criminal sentences, whereas the amnesty applicant incurred no �nes and received
prosecution protection. For instance, in the graphite electrodes investigation, the second
company to �le paid $32.5 million (10% of annual earnings), the third $110 million (15% of
annual earnings), and the fourth $135 million (28% of annual earnings). Mitsubishi was later
convicted at trial and was sentenced to pay $134 million (76% of annual earnings). Executives
from these companies incurred �nes and prison sentences. In the vitamin investigation, F.
16 See Brown and Burns (2000), Kobayashi (2001), and Spratling (1999) for more details.
17 http://www.justice.gov/atr/cases/f202300/202397.htm
18 Antitrust Division, US DOJ, Annual Report FY 2001.
8
Ho¤mann-La Roche and BASF AG plead guilty and incurred �nes of $500 million and $225
million, respectively. Again, executives from these companies served time in prison. In
the �ne arts auctions case Sothebys paid $45 million, and the chairman was sentenced to
one year in jail and a $7.5 million �ne. Finally, in the USAID Construction case, �rms
were ordered to pay �nes of $140 million and to pay $10 million in restitution to the U.S.
government. An executive for one of the companies received a three year prison sentence.19
0
20
40
60
80
100
120
140
1985 1987 1989 1991 1993 1995 1997 1999 2001
Year
Tota
l New
RJV
s (d
ashe
d)
0
5
10
15
20
25
30
New
RJV
s by
Are
a (s
olid
)
Total Computers Telecom Petroleum
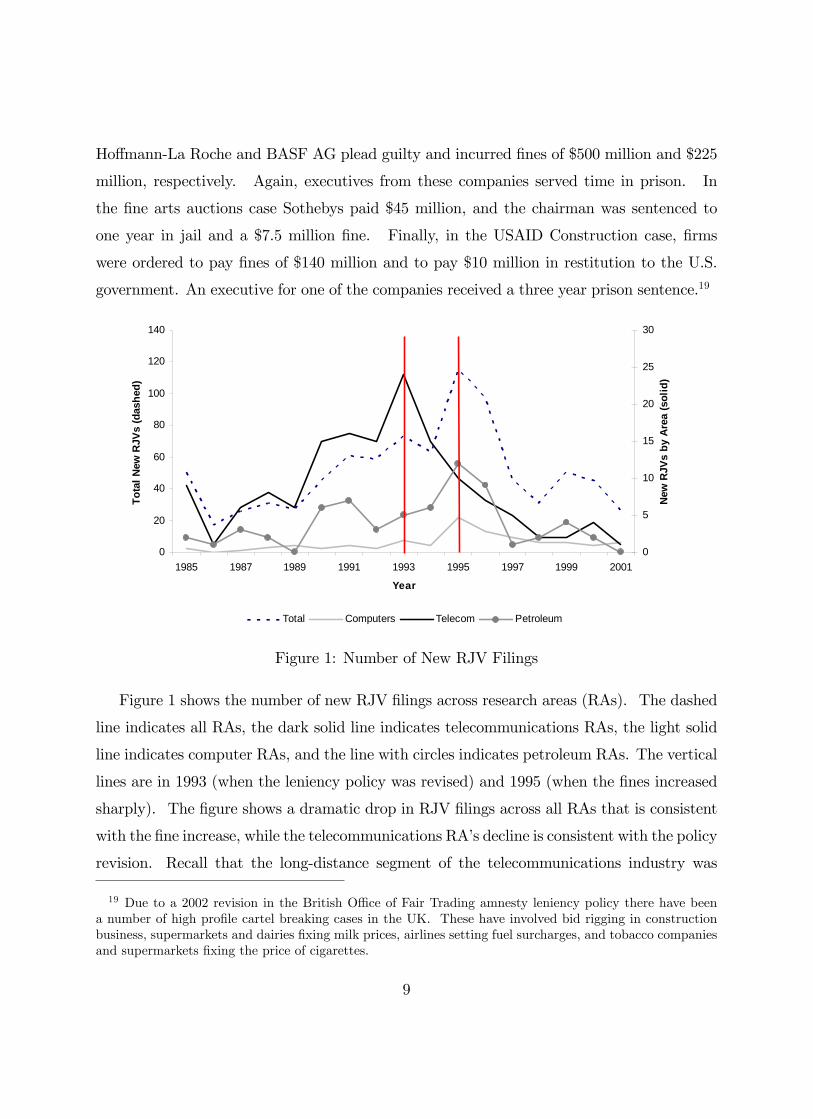
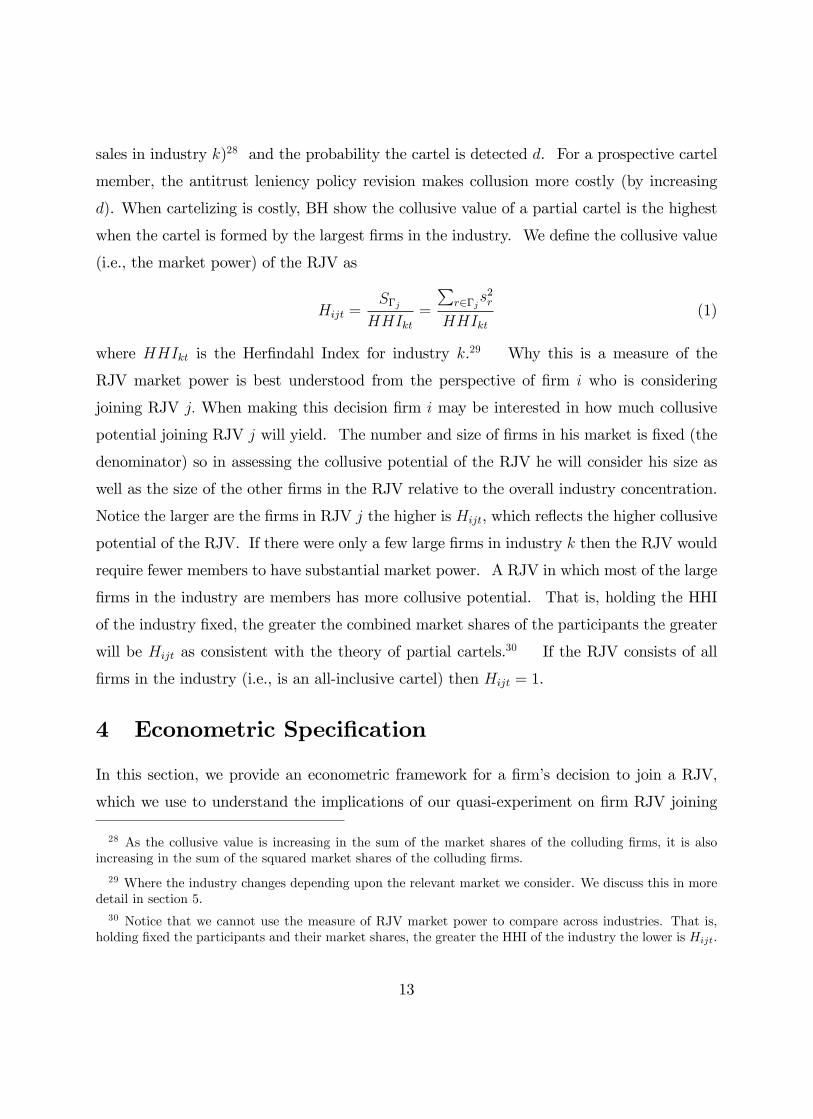
Figure 1: Number of New RJV Filings
Figure 1 shows the number of new RJV �lings across research areas (RAs). The dashed
line indicates all RAs, the dark solid line indicates telecommunications RAs, the light solid
line indicates computer RAs, and the line with circles indicates petroleum RAs. The vertical
lines are in 1993 (when the leniency policy was revised) and 1995 (when the �nes increased
sharply). The �gure shows a dramatic drop in RJV �lings across all RAs that is consistent
with the �ne increase, while the telecommunications RA�s decline is consistent with the policy
revision. Recall that the long-distance segment of the telecommunications industry was
19 Due to a 2002 revision in the British O¢ ce of Fair Trading amnesty leniency policy there have beena number of high pro�le cartel breaking cases in the UK. These have involved bid rigging in constructionbusiness, supermarkets and dairies �xing milk prices, airlines setting fuel surcharges, and tobacco companiesand supermarkets �xing the price of cigarettes.
9

under close scrutiny until 1996 (during the period of regulation) and, hence, telecom �rms
may have been more responsive to policy aimed at deterring collusive behavior. Whereas
�rms from non-regulated industries may have reacted more to an increase in guaranteed �nes
associated with collusive behavior and the further incentive this provided to defect from any
future collusive arrangements. Obviously, there may be other (non-leniency policy related)
reasons for �rms to reduce their RJV applications. However, this �gure suggests that the
decline in RJV applications may be due, at least in part, to the changes in policies regarding
detection and punishment of collusive behavior via the leniency policy.20
2.2 National Cooperative Research and Production Act
The National Cooperative Research Act (NCRA), established in 1984, requires all �rms
interested in forming a RJV to �le with the Federal Trade Commission (FTC).21 The
NCRA was extended in 1993 to include all �rms involved in production joint ventures (and
was renamed the National Cooperative Research and Production Act, NCRPA). By �ling,
if member �rms are subjected to criminal or civil action, antitrust authorities are required to
apply the (more lenient) rule of reason that determines whether the joint venture improves
social welfare rather than the per-se illegality rule.22 If found to fail a rule-of-reason
analysis, member �rms are granted antitrust protection, which limits their possible antitrust
20 While the empirical evidence to date suggests that the leniency policy is e¤ective in curbing collusivebehavior, it is theoretically possible that the policy could have the opposite e¤ect. Cartels are illegal,and therefore, no written contract between member �rms exists. As a result, colluding �rms must rely ontrust to enforce the collusive behavior. If �rms deviate other members have a powerful punishing tool inthe leniency policy: deviation is punished by another member reporting the cartel (and gaining antitrustprotection). Hence, the leniency policy may foster cartel behavior in that it provides a tool that can beused to discourage deviations from collusive agreements. See Spagnolo (2000).
21 According to the NCRA, a RJV is �any group of activities, including attempting to make, making orperforming a contract, by two or more persons for the purposes of (a) theoretical analysis, experimentation,or systematic study of phenomena or observable facts, (b) the development or testing of basic engineeringtechniques, (c) the extension of investigative �nding or theory of a scienti�c or technical nature into practicalapplication for experimental and demonstration purposes..., (d) the collection, exchange, and analysis ofresearch information, or (e) any combination of the [above].�
22 If a behavior is per se illegal then authorities need only prove the behavior exists, there is no allowabledefense for the accused parties. Under the rule of reason authorities are required to examine the inherente¤ect and the intent of the practice.
10

exposure to actual (rather than treble) damages, plus costs and attorneys�fees with respect
to activities identi�ed in the �ling.23
In deciding whether to approve a proposed RJV, the primary consideration of the FTC
is whether the venture is likely to give member �rms the ability to retard the pace or scope
of R&D e¤orts. In practice, antitrust authorities are unlikely to challenge a RJV when
there are at least three independent �rms with comparable research capabilities to those
of the proposed RJV.24 Furthermore, authorities have indicated they will not challenge
RJVs in certain research areas. For example, authorities will permit modi�cations to RJVs
involving pharmaceutical �rms engaged in cardiovascular research; those formed by the four
US manufacturers of centrifugal pumps (used by electrical utilities) that focus on improving
pump performance; or RJVs formed to conduct R&D relating to computer aided design and
manufacturing.25
Finally, we should note that the broadening of the NCRPA coincides with the revision
of the leniency policy. Note, however, that we would expect to see more RJVs formed due
to the NCRPA broadened protection. If the e¤ect of the leniency policy is to reduce RJV
applications, the presence of the NCRA revision would make any negative signi�cant results
we �nd even stronger.
3 Theory
A RJV has the potential to facilitate collusion when member �rms are rivals in the �nal
product market. RJVs commonly involve a subset of all potential rivals. Hence a cartel
formed among RJV members is likely to be partial in the sense that the cartel will involve
a subset of all the �rms in the industry. Partial cartels have been observed in many indus-
tries. For example, a cartel in carbonless paper production had combined market shares
of about 85% (Levenstein and Suslow, 2006); a cartel among shipping �rms in the North
23 Prevailing defendents are entitled to recover costs and attorneys� fees if an action is found to be�frivolous, unreasonable, without foundation, or in bad faith.�See 15 USC section 4304(a)(2)(2000).
24 See Competitor Collaboration Guidelines, section 4.3. www.ftc.gov/os/2000/04/ftcdojguidelines.pdf.
25 See US DOJ Business Review Letter to American Heart Association March 20, 1998; the Pump Researchand Dev. Comm., 1985; and to the Computer Aided Mfg. Int�l Inc. 1985, respectively.
11

Atlantic constituted 75% of the market (Escrihuela-Villar, 2003); and, famously, petroleum
manufacturing �rms in the US and Russia are excluded from the OPEC cartel.
There is a growing theoretical literature that examines partial cartels. Included in this
literature is work by Bos (2009) and Bos and Harrington (2010) (hereafter BH), who consider
partial cartels among �rms in dynamic di¤erentiated products industries. BH endogenize
cartel composition and show that, when �rms are su¢ ciently patient, there exists a stable
partial cartel that involves the largest �rms in the industry.26 BH prove that there is a
positive correlation between �rm size and the incentive to join a partial cartel, where the most
pro�table partial cartel comprises the largest �rms in the industry.27 They establish that
�rms have an incentive to form this cartel when its smallest member is su¢ ciently large.
Bos (2009) shows that partial cartels are often dominant in terms of having a signi�cant
combined market share, while �rms not included in the cartel are typically the small players
in the market.
The link between Bos (2009) and BH�s results to our work is straightforward: if the RJV
is formed to facilitate (partial) collusion then (BH�s results imply) the RJV will be the most
valuable the larger is its size. RJV size (measured as the combined market share of its
members) has a monotonic e¤ect on the value of forming a RJV to collude. Our measure of
the RJV market power is motivated by this theoretical result.
Speci�cally, suppose �rm i belongs to industry k; and let �j be the subset of �rms in
industry k that are engaged in RJV j: The collusive value of a partial cartel �j (formed
via RJV j) is given by Vi(S�j ; d); which is a function of the total size of the partial cartel
(S�j =P
r2�js2r; where sr is the market share of �rm r computed as sales of �rm r over total
26 BH, and other papers in the theoretical literature, assume that a cartel member�s demand is proportionalto the pre-cartel size of the �rm. This allocation rule is motivated by actual cases as cited in BH: theseinclude the Norwegian cement cartel, several German cartels during the early 1900s, and other examplesnoted in Harrington (2006).
27 BH provide the intuition: The price charged by the cartel is increasing its capacity, which implies thatthe price increases when a new member brings more capacity. On the other hand a new cartel member willhave to produce below capacity once it joins the cartel and hence will experience a drop in sales. Since acartel member�s share of output is equal to its share of capacity, the percentage reduction in post-cartel salesis lower for a �rm with more capacity. This gives larger �rms more incentive to join.
12
sales in industry k)28 and the probability the cartel is detected d. For a prospective cartel
member, the antitrust leniency policy revision makes collusion more costly (by increasing
d). When cartelizing is costly, BH show the collusive value of a partial cartel is the highest
when the cartel is formed by the largest �rms in the industry. We de�ne the collusive value
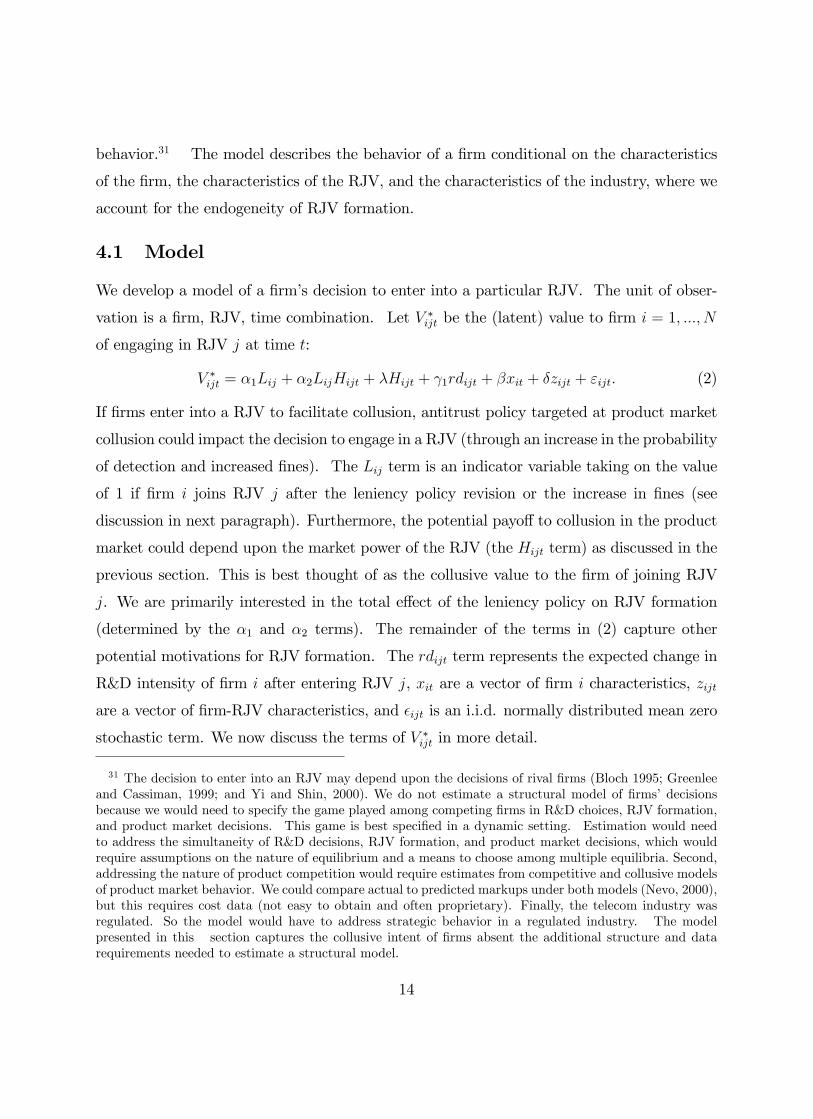
(i.e., the market power) of the RJV as
Hijt =S�jHHIkt
=
Pr2�js
2r
HHIkt(1)
where HHIkt is the Her�ndahl Index for industry k.29 Why this is a measure of the
RJV market power is best understood from the perspective of �rm i who is considering
joining RJV j: When making this decision �rm i may be interested in how much collusive
potential joining RJV j will yield. The number and size of �rms in his market is �xed (the
denominator) so in assessing the collusive potential of the RJV he will consider his size as
well as the size of the other �rms in the RJV relative to the overall industry concentration.
Notice the larger are the �rms in RJV j the higher is Hijt, which re�ects the higher collusive
potential of the RJV. If there were only a few large �rms in industry k then the RJV would
require fewer members to have substantial market power. A RJV in which most of the large
�rms in the industry are members has more collusive potential. That is, holding the HHI
of the industry �xed, the greater the combined market shares of the participants the greater
will be Hijt as consistent with the theory of partial cartels.30 If the RJV consists of all
�rms in the industry (i.e., is an all-inclusive cartel) then Hijt = 1.
4 Econometric Speci�cation
In this section, we provide an econometric framework for a �rm�s decision to join a RJV,
which we use to understand the implications of our quasi-experiment on �rm RJV joining
28 As the collusive value is increasing in the sum of the market shares of the colluding �rms, it is alsoincreasing in the sum of the squared market shares of the colluding �rms.
29 Where the industry changes depending upon the relevant market we consider. We discuss this in moredetail in section 5.30 Notice that we cannot use the measure of RJV market power to compare across industries. That is,
holding �xed the participants and their market shares, the greater the HHI of the industry the lower is Hijt.
13
behavior.31 The model describes the behavior of a �rm conditional on the characteristics
of the �rm, the characteristics of the RJV, and the characteristics of the industry, where we
account for the endogeneity of RJV formation.
4.1 Model
We develop a model of a �rm�s decision to enter into a particular RJV. The unit of obser-
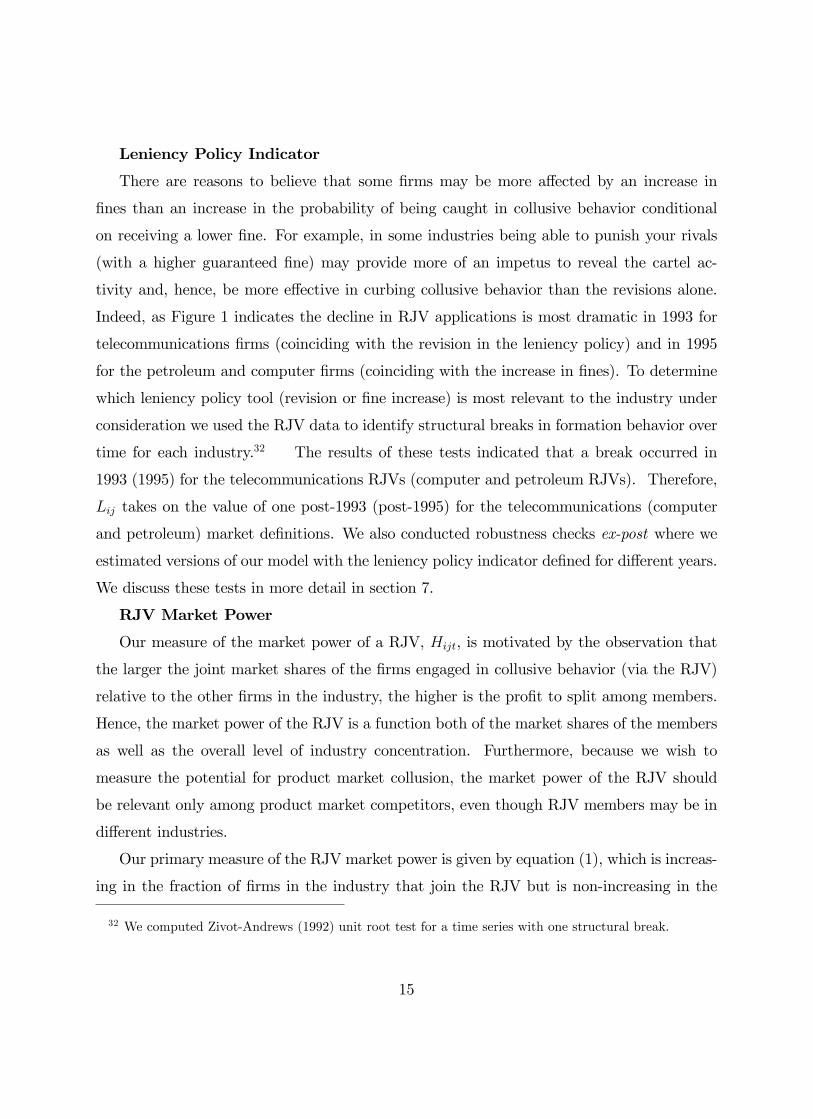
vation is a �rm, RJV, time combination. Let V �ijt be the (latent) value to �rm i = 1; :::; N
of engaging in RJV j at time t:
V �ijt = �1Lij + �2LijHijt + �Hijt + 1rdijt + �xit + �zijt + "ijt: (2)
If �rms enter into a RJV to facilitate collusion, antitrust policy targeted at product market
collusion could impact the decision to engage in a RJV (through an increase in the probability
of detection and increased �nes). The Lij term is an indicator variable taking on the value
of 1 if �rm i joins RJV j after the leniency policy revision or the increase in �nes (see
discussion in next paragraph). Furthermore, the potential payo¤ to collusion in the product
market could depend upon the market power of the RJV (the Hijt term) as discussed in the
previous section. This is best thought of as the collusive value to the �rm of joining RJV
j. We are primarily interested in the total e¤ect of the leniency policy on RJV formation
(determined by the �1 and �2 terms). The remainder of the terms in (2) capture other
potential motivations for RJV formation. The rdijt term represents the expected change in
R&D intensity of �rm i after entering RJV j, xit are a vector of �rm i characteristics, zijt
are a vector of �rm-RJV characteristics, and �ijt is an i.i.d. normally distributed mean zero
stochastic term. We now discuss the terms of V �ijt in more detail.
31 The decision to enter into an RJV may depend upon the decisions of rival �rms (Bloch 1995; Greenleeand Cassiman, 1999; and Yi and Shin, 2000). We do not estimate a structural model of �rms�decisionsbecause we would need to specify the game played among competing �rms in R&D choices, RJV formation,and product market decisions. This game is best speci�ed in a dynamic setting. Estimation would needto address the simultaneity of R&D decisions, RJV formation, and product market decisions, which wouldrequire assumptions on the nature of equilibrium and a means to choose among multiple equilibria. Second,addressing the nature of product competition would require estimates from competitive and collusive modelsof product market behavior. We could compare actual to predicted markups under both models (Nevo, 2000),but this requires cost data (not easy to obtain and often proprietary). Finally, the telecom industry wasregulated. So the model would have to address strategic behavior in a regulated industry. The modelpresented in this section captures the collusive intent of �rms absent the additional structure and datarequirements needed to estimate a structural model.
14
Leniency Policy Indicator
There are reasons to believe that some �rms may be more a¤ected by an increase in
�nes than an increase in the probability of being caught in collusive behavior conditional
on receiving a lower �ne. For example, in some industries being able to punish your rivals
(with a higher guaranteed �ne) may provide more of an impetus to reveal the cartel ac-
tivity and, hence, be more e¤ective in curbing collusive behavior than the revisions alone.
Indeed, as Figure 1 indicates the decline in RJV applications is most dramatic in 1993 for
telecommunications �rms (coinciding with the revision in the leniency policy) and in 1995
for the petroleum and computer �rms (coinciding with the increase in �nes). To determine
which leniency policy tool (revision or �ne increase) is most relevant to the industry under
consideration we used the RJV data to identify structural breaks in formation behavior over
time for each industry.32 The results of these tests indicated that a break occurred in
1993 (1995) for the telecommunications RJVs (computer and petroleum RJVs). Therefore,
Lij takes on the value of one post-1993 (post-1995) for the telecommunications (computer
and petroleum) market de�nitions. We also conducted robustness checks ex-post where we
estimated versions of our model with the leniency policy indicator de�ned for di¤erent years.
We discuss these tests in more detail in section 7.
RJV Market Power
Our measure of the market power of a RJV, Hijt, is motivated by the observation that
the larger the joint market shares of the �rms engaged in collusive behavior (via the RJV)
relative to the other �rms in the industry, the higher is the pro�t to split among members.
Hence, the market power of the RJV is a function both of the market shares of the members
as well as the overall level of industry concentration. Furthermore, because we wish to
measure the potential for product market collusion, the market power of the RJV should
be relevant only among product market competitors, even though RJV members may be in
di¤erent industries.
Our primary measure of the RJV market power is given by equation (1), which is increas-
ing in the fraction of �rms in the industry that join the RJV but is non-increasing in the
32 We computed Zivot-Andrews (1992) unit root test for a time series with one structural break.
15
fragmentation of the �rms that join conditional on the fraction joining. This is reasonable if
we believe that the RJV will be less e¤ective in sustaining collusion relative to the status quo
when the members are more fragmented. Alternatively, if it is more di¢ cult to coordinate
collusion across many �rms, more fragmented �rms may have more to gain from joining a
RJV if the RJV also acts as a tool to coordinate. To allow for this possibility, we consider
an alternative measure of the collusive potential of the RJV that is increasing in both the
fraction of �rms in industry k that join the RJV and in their level of fragmentation (which
we refer to as the fragmentation measure denoted Hfragijt ). The fragmentation measure is
de�ned as: industry concentration post-RJV if the RJV acts as a single entity normalized
by the pre-RJV industry concentration.
To motivate the value to considering both measures suppose there are two industry
structures: Market Structure A (MSA) has eight equally-sized �rms and Market Structure
B (MSB) has four equally-sized �rms. If four �rms under MSA and two �rms under MSB join
a RJV, the �rst measure of the RJV collusive potential (referred to as the primary measure)
is identical: Hijt = 1=2. The fragmentation measure yields di¤erent results: the post-RJV
HHI in MSA is 5=16 if the RJV acts as a perfectly collusive entity and 1=8 under the status
quo, yielding Hfragijt = 5=2. The post-RJV HHI in MSB is 3=8 if the RJV acts as a perfectly
collusive entity and 1=4 under the status quo, yielding Hfragijt = 3=2. The fragmentation
measure indicates the RJV has higher collusive potential under the more fragmented MSA.
To take a more extreme example if all the �rms in an industry join the same RJV should
the RJVs collusive potential be the same or di¤erent if there are four or two equally-sized
�rms in the industry? As this is an empirical question, we consider both the primary and
fragmentation measure of the market power of the RJV in estimation.33
R&D Intensity Many papers in the RJV literature show that the expected impact
on R&D may be an important motivation for joining a RJV (see for example, Kamien,
Muller, and Zang, 1992). For instance, �rms may engage in RJVs to take advantage of
complementarities among member �rms, share R&D related costs, or overcome free-rider
problems. Following the RJV literature, we de�ne rdijt as the change in R&D intensity of
33 We are grateful to an anonymous referee for the idea and motivation for the fragmentation measure ofRJV market power.
16
�rm i that would result from joining RJV j at time t: It is given by
rdijt =R&Dit�1
salesit�1� R&Dijt
salesijt; (3)
where R&Di represents R&D expenditures and salesi represents gross dollar sales.
Firm Characteristics Firm-speci�c terms are captured by xit and include �rm size
(assetsit), the number of other RJV�s in which i is currently engaged and the square, capacity
constraints (cashit); and industry �xed e¤ects (when we consider de�nitions of markets with
�rms from many industries, such as research areas).34 Firms may have di¤erent absorptive
capacities, which in turn determine their willingness to form RJVs (Cohen and Levinthal,
1989). The absorptive capacity is impacted by factors such as size and past experience
with research collaboration (Kogut, 1991). We use total assets as an exogenous measure of
size and as a control for the capital and equipment that a particular �rm brings to a RJV.
This is consistent with the notion by Irwin and Klenow (1996) that larger �rms gain more
from RJVs and from R&D knowledge spillovers.35 Much of R&D is funded from retained
earnings, and we use free cash �ow as a proxy for capital constraints. Firms with a high
free cash follow should be more attractive partners in a RJV since they are able to sustain
investment without loans or new equity issues (see Compte et al, 2002).
RJV Characteristics RJV-speci�c terms are included in the zijt. These are the
number of members of RJV j, whether the intent is to patent the RJV outcome, measures
of �rm-RJV asymmetries, and the RJV market power measure. Baumol (2001) showed that
the potential bene�ts of RJVs may increase with the number of participating �rms since
technological spillovers increase. The intent to patent is a measure of e¢ ciency with which
�rms innovate and may proxy for absorptive capacity (see Gugler and Siebert, 2007). The
theoretical literature suggests that the degree of asymmetries across �rms may in�uence
RJV participation (Petit and Towlinski, 1999). Previous empirical work (for instance,
Roller et al, 2007) �nds that size asymmetries and the degree of product complementarity
between �rms in�uences participation decisions. We include variables designed to capture
34 For a summary of the literature see Caloghirou and Vonortas (2000) and Hagedoorn, et al (2000).
35 Hernan, et. al. (2003) consider the decision to join a RJV in the European Union. They �nd thatsectoral R&D intensity, industry concentration, �rm size, and past RJV participation positively in�uencethe probability of forming a RJV.
17
the attractiveness of a �rm to other partners in the RJV, which consist of a measure of �rm
size relative to the average RJV member (rassetijt) and a measure of capital constraints
relative to the average RJV member (rcapconijt). We de�ne the measure of �rm size
relative to the RJV as
rassetijt =assetsit�1 � avgassetsjt�1
avgassetsjt�1; (4)
where avgassetsjt�1 are average assets of all members of the RJV in the period previous to
RJV j formation. Relative capital constraints, rcapconijt; are similarly de�ned, where we
use cashit as a proxy for capital constraints.
State of Economy Ghosal and Gallo (2001) suggest that antitrust enforcement by the
DOJ is countercyclical. R&D investments may also be counter-cyclical; when the economy
is weak �rms may lack su¢ cient internal resources to �nance long-term R&D projects so
they may be more likely to rely on cooperative research arrangements. We include year
�xed e¤ects to capture any economic or time-speci�c variables relevant to RJV formation
that are not captured in other variables.
4.2 Estimation
Firms that join RJVs join on average more than one.36 Hence, �rm i will form RJV j at
time t if the value to doing so is larger than the value to not doing so. Let V �i0t represent the
value to �rm i of not joining a RJV :
V �i0t = 0rdit + �0xi0t + "i0t; (5)
where rdit is the average annual intensity of R&D undertaken by �rm i when it is not in a
RJV. Hence, �rm i will join RJV j if V �ijt > V �i0t where V �ijt is given in equation (2). Noticethat the number of feasible alternatives does not impact the decision to join a particular
RJV, although our model allows the number of RJVs a �rm is currently engaged in to impact
the value to joining a RJV.
36 Our data indicate that the average number of RJVs �rms join is 1.721 (with a standard deviation of4.748) and the mean number of RJVs joined among joiners is 3.292 (with a standard deviation of 6.162).
18
We don�t observe V �ijt or V�i0t, instead we observe whether �rm i enters a RJV. De�ne
Vijt � �1Lj + �2LjHijt + (rdijt � rdit) + �(xit � xi0t) + �zijt: (6)
Any model of RJV formation must address two issues regarding estimation, both relate to
the observation that the value to �rm i of joining RJV j is a function of (rdijt � rdit): Thatis, �rms consider the expected e¤ect on R&D expenditures when considering whether to
form a RJV. However, R&D intensity is in�uenced by RJV formation. Thus, the �rst
issue to address concerns the endogeneity of R&D. The second issue concerns the e¤ect on
R&D from joining a RJV. We can construct (rdijt � rdit) from the data when �rm j joins
a RJV. However, we do not observe rdijt if the �rm is not engaged in a RJV. We need a
consistent estimate of the expected e¤ect of RJV formation on R&D intensity when a RJV
is not formed. The endogenous switching model estimation procedure (see Lee, 1978) allows
us to address the endogeneity and missing values issues and to obtain consistent parameter
estimates. However, there is one more endogeneity concern related to the fact that Hijt is
a function of the market shares of member �rms and industry concentration and hence may
be endogenous. For instance, if establishing a RJV raises barriers to entry it could increase
the market power of the involved �rms even if they do not collude. We have included the
measure of the market power separately (in the zijt) as well as interacted with the leniency
policy variable, but it is important to keep this caveat in mind when interpreting the results.
Estimation is based on the following equation of RJV formation
Pijt = Vijt + �ijt; (7)
where �ijt � "i0t � "ijt � N(0; �2�).37 We observe rdijt when �rm i is engaged in RJV j:
rdijt = �1wijt + u1it if Vijt > �ijt (8)
where wijt includes a constant, the number of members of RJV j, �rm size relative to the
average RJVmember (rassetijt), and capital constraints relative to the average RJVmember
(rcapconijt). Note that the coe¢ cient on the constant term will pick up other e¤ects on R&D
37 The parameters of Vijt are identi�ed up to the factor �n; hence we normalize �n = 1:
19

of being in RJV such as cost-sharing. If �rm i is not engaged in RJV j we observe:
rdit = �0vit + u0it if Vijt < �ijt (9)
where vit includes the assets and capital constraints faced by �rm i. We assume the er-
rors (u1; u0; �) � N(0;): To obtain asymptotically e¢ cient estimates, we simultaneously
estimate all the parameters of the model by full information maximum likelihood. The
parameters of the model are � = vecf�1; �2; ; �; �; �0; �1;g:38
4.3 Identi�cation
Our strategy to identify collusive intentions relies on the variation in RJV formation arising
from the revisions in the leniency policy. For this to be a reasonable quasi-experiment,
the leniency policy should impact collusive behavior but not a¤ect the other motivations to
form a RJV. As discussed in section 2.1, there is su¢ cient evidence that the revision to
the leniency policy has been successful in curbing collusive behavior. Furthermore, there is
no evidence that the DOJ changed the leniency policy with an intention to in�uence RJV
formation or R&D investments directly.39
The leniency policy revision (�ne increase) applies to all �rms after 1993 (1995) so our
results could be driven by some unobserved trends in the data. For this reason we construct
a �treatment�group that consists of potential colluders in the sense that these are �rms that
have joined a RJV with other �rms in the same �nal goods industry. Our de�nition of which
�rms are in the treatment group depends upon the level of aggregation (i.e., which relevant
38 See Maddala (1983) p. 223-224. The model could be estimated in stages. First, consistent estimates
of the predicted probabilities ( bPijt) come from a reduced form probit regression obtained by substitutingequations (8) and (9) into (6). To control for the endogeneity of R&D, equations (8) and (9) are corrected byincluding control variables (constructed using the inverse Mill�s ratio and the predicted probit probabilitiesbPijt): Least squares yields consistent estimates of the corrected R&D equations. The predicted values fromthe corrected R&D equations are used to construct the predicted di¤erence in R&D intensity, ( brdijt �brdit), from joining a RJV for all �rm-RJV combinations. The probit selection equation in (7) couldbe estimated after including the predicted R&D di¤erence as a regressor, which Lee (1978) shows yieldsconsistent estimates of the parameters. However, to obtain asymptotically e¢ cient estimates all parametersof the model should be estimated simultaneously.
39 The revision appears to have been motivated by the desire to thwart international cartels. Seewww.usdoj.gov/atr/public/speeches/206611.htm.
20

market) we are considering. Note that �rm i from industry k would be in the treatment
group for a particular RJV j; if other �rms from industry k are in RJV j, but not in the
treatment group for another RJV m; if there are no other �rms from industry k in RJV m:
We should also note that we do not have to rely on a discrete law change to identify
potentially collusive e¤orts as the e¤ect of the leniency policy revision on RJV formation is
allowed to vary with a continuous measure of RJV market power (Hijt). While it is possible
that some unknown policy (that has not been controlled for) impacted the propensity to join
a RJV at the same time the leniency policy was revised, it is less likely that this hypothetical
policy would vary with the RJV market power measure as well.
To summarize, the parameters of the model are identi�ed by i) the leniency policy ex-
clusion restriction that should not impact R&D investments directly (equations (8) and (9))
rather only the decision to enter a RJV and ii) through nonlinearities in the model.40
5 Data
Our data cover the period 1986-2001.41 Information on RJVs comes from the CORE
database constructed by Albert Link (Link, 1996) and includes the name of the RJV, date
of �ling, general industry classi�cation, and the nature of research to be undertaken. We
augment the CORE data with the names of the member �rms in each RJV in our time
frame, as reported in the Federal Register.42
Firm-level data come from the U.S. Compustat database, which includes industry classi-
�cation, assets, sales, free cash, and R&D expenditures for over 20,000 publicly traded �rms.
There are a few data issues to address. First, small �rms are underrepresented. They are
less likely to �le a RJV application with the FTC since they are less likely to be the subject
of antitrust investigation, and they are less likely to be in the Compustat database.43 As
40 These nonlinearities arise from the inclusion of the inverse Mill�s ratio in the corrected R&D equations.
41 Link and Bauer (1989) document that cooperative research e¤orts were occuring informally before theNCRA was implemented in 1984. It is likely that RJV applications in 1985 may capture a portion of thepre-1985 stock. For this reason we include all RJVs starting in 1986.
42 See http://www.gpoaccess.gov/fr/index.html.
43 The Compustat data do not contain information on non-publically traded �rms or non-pro�t �rms.
21

a result of losing small �rms, we observe a few RJVs with only one member, which we drop.
If �rms add members to the RJV they are required to re�le with the FTC, therefore we
observe changes in the composition of RJV membership across years. Unfortunately, �rms
do not re�le when the RJV is terminated. As a result, we observe new RJVs and changes
to RJV membership, but not end dates. In practice many RJVs do not span the period of
our data; a RJV formed in 1986 is not likely to be around for new �rms to join in 2001. We
had to make some assumptions regarding the set of potential RJVs available for each �rm
to join (i.e., the choice set). We decided to �end�a RJV in the year that we last observe
a member join.44 Imposing this restriction, there were 386 RJVs in all industries with an
average length of three years.45
The �rm�s choice set requires some additional explanation. One option would be to
assume that every �rm in the sample could join every RJV we ever observe in the data.
Given that there are thousands of RJVs in the sample and tens of thousand of �rm years
this is computationally infeasible. It also assumes that all �rms could contribute to any
RJV. To narrow the viable options we assume a �rm could join any RJV that was formed
or that exists in a given year in which the �rm exists. To make the explanation complete,
consider an example involving AT&T starting in 1986. AT&T�s choice set in 1986 includes
all RJVs in 1986 in which at least one telecommunication �rm has joined �there were three
such RJVs of which it joined one. In 1987 two new RJVs that included telecommunications
�rms formed, so AT&T�s choice set in 1987 is four (the two continuing from 1986 which
it did not join and the two new RJVs). It joined two of these. No telecommunications
�rms joined a RJV in 1988, so AT&T choice set in 1988 consisted of two RJVs (the two
continuing from 1987 which it did not join) of which it joined one. Hence, the number of
RJVs in AT&T�s choice set (and the total number of RJVs joined) in each consecutive year
is 3(1), 4(3), and 2(4). AT&T�s choice set continues to evolve over the sample period with
new RJVs being created and entering the choice set while others exit either because the �rm
joins or our ending rule removes the RJV from all the choice sets.
44 Our results are robust to changes in our end date assumption.
45 For more on RJVs �led under NCRA see Link (1996), who provides an overview; Majewski andWilliamson (2002), who examine contract details of NCRA applicants; and Berg, et al (1982).
22

When considering the collusive intent of �rms it is important to be certain that the level of
aggregation is not too broad, so as to include more �rms than the relevant antitrust market,
nor to narrow, so as to exclude potential rivals.46 This is di¢ cult to address in a sample
spanning many industries, therefore, we do not focus on estimates from the entire pooled
sample.47 Instead, we consider three industries in detail: telecommunications, computer
manufacturing, and petroleum re�ning, which we discuss in turn.
5.1 Telecommunications Markets
The telecommunications sector is very important to the US economy and is a critical input in
production as well as consumption. In addition to a history of potentially collusive behavior,
RJVs are common among rivals, where 38% of �rms involved in at least one RJVwith another
direct product market competitor. This history, coupled with an ability to construct a well-
de�ned antitrust market (due to the telecommunications regulatory mandate), makes the
telecom industry ideal for our study.
We consider �ve de�nitions of the relevant telecom antitrust market. At the most aggre-
gate (3-digit NAICS) industry level we consider two potential markets: �rms in �Broadcast
Telecom�(NAICS 513) and �rms involved in telecommunications research, �Telecom RA,�
stated as the primary research area in their RJV �ling. There are reasons to believe that
this level of aggregation may be too broad. For instance, Broadcast Telecom includes wired
telecommunications carriers, radio stations, television broadcasters, cable providers, and
wireless carriers, which are not always competitors with each other. The Telecom RA also
includes �rms that are often in very di¤erent competitive markets (e.g., �rms in publishing
as well as chemical manufacturing) . Indeed, the descriptive statistics presented in the top
panel of Table 1 indicate the Broadcast Telecom market is less concentrated as given by
the 3-digit Her�ndahl Index (HHI, which is calculated as the sum of squares of the market
shares of all �rms in the relevant industry).
46 See Werden (1988) and Pittman and Werden (1990) for a discussion of the divergence between industryclassi�cations and antitrust markets.47 However, we do conduct robustness checks with the entire sample (see section 7).
23

Source of Firm Data: Compustat Compustat OtherLevel of Aggregation: 3Digit NAICS 6Digit NAICS see details below
Mean Std Dev Mean Std Dev Mean Std Dev
Telecommunications Markets FCC Long Distance FirmsBroadcast Telecom Wired Telecom All Years
HHI 0.16 0.15 0.05 0.01 0.40 0.14Market Share 0.08 0.13 0.02 0.03 0.03 0.11R&D Expenditures 0.55 1.21 0.77 1.38 0.91 1.63Sales 8.45 17.06 13.34 20.72 2.57 9.25Assets 18.34 36.23 27.05 39.67 22.43 34.72Proportion join RJV 0.02 0.14 0.03 0.14 0.07 0.25Number of RJVs 94 94 72
Telecom Research Area Regulated YearsHHI 0.25 0.22 0.46 0.11Market Share 0.14 0.23 0.03 0.12R&D Expenditures 0.37 0.73 1.20 1.85Sales 5.03 9.30 2.45 9.43Assets 5.63 10.24 22.24 24.20Proportion join RJV 0.02 0.14 0.07 0.26Number of RJVs 90 53
Computer Markets Compustat; Gartner; iSuppliComputer/Electronic Computer Manufact Semiconductors
Market Share 0.003 0.01 0.05 0.11 0.06 0.14Sales 2.92 9.98 2.34 6.92 1.16 3.18HHI 0.04 0.01 0.22 0.12 0.21 0.16Assets 3.19 11.46 2.45 7.80 1.30 3.87R&D Expenditures 0.23 0.71 0.19 0.53 0.12 0.35Proportion join RJV 0.01 0.10 0.01 0.11 0.01 0.09Number of RJVs 246 246 246
Software RA Memory/MicroprocMarket Share 0.009 0.03 0.02 0.06Sales 5.23 16.39 1.15 3.46HHI 0.05 0.06 0.17 0.11Assets 11.44 51.48 1.47 4.52R&D Expenditures 0.28 0.87 0.14 0.40Proportion join RJV 0.01 0.12 0.01 0.10Number of RJVs 58 246
Petroleum MarketsEnergy RA Petroleum Refining
Market Share 0.01 0.03 0.03 0.04Sales 6.99 18.78 30.86 37.29HHI 0.05 0.04 0.07 0.01Assets 8.69 31.43 34.05 32.53R&D Expenditures 0.30 0.80 0.33 0.33Proportion join RJV 0.04 0.19 0.12 0.33Number of RJVs 63 135
Coal/ Crude ExtractionMarket Share 0.02 0.03Sales 12.60 27.19HHI 0.10 0.03Assets 13.41 24.78R&D Expenditures 0.23 0.31Proportion join RJV 0.09 0.29Number of RJVs 140Notes: An observation is a firmyear pair. Sales, assets and R&D expenditures are in billions of chain weighted $2004.Gartner and iSuppli shares are from published reports. HHI are calculated at either the 3 or 6digit NAICs dependingon the market definition.
Table 1: Descriptive Statistics
As we re�ne the market de�nition to �Wired Telecom�(6-digit NAICS) we �nd a less
concentrated market, where �rms have even smaller market shares on average and engage
in more R&D relative to their 3-digit counterparts, although they spend approximately the
24
same as a percentage of their sales (7%). While signi�cantly narrower, this de�nition may
still be too broad to be the relevant antitrust market. Wired Telecom consists of all �rms
o¤ering local and long distance telephony, which were not overlapping markets during the
period of telecommunications regulation (prior to 1996).
Our �nal de�nitions of the relevant market uses data from the FCC�s Report of Common
Carriers,48 which permits us to further divide telecom �rms into those o¤ering long distance
versus local service. Furthermore, the FCC data include all �rms in telephony regardless
of size. Our �nal two de�nitions of the relevant market consist of all �rms o¤ering long
distance services. Over all years of the data (1986-2001) the market of long distance �rms
may be too narrow since after 1996 long distance carriers were permitted to o¤er local
services. Therefore, we also consider a subset of the long distance market restricted to the
years of regulation. Although the latter is a relatively small sample, this market de�nition
is particularly attractive since, by law, the market includes only these �rms and these �rms
are not permitted to enter other telecom markets. Table 1 indicates that the market for
long distance services is much more concentrated relative to our other antitrust telecom
market de�nitions. Furthermore, the long distance market was more concentrated during
the period of regulation with an HHI suggesting it operated similar to an industry with two
equally sized �rms. Finally, on average more �rms join a RJV (7%) relative to other telecom
antitrust market de�nitions.
5.2 Computer Markets
The computer industry is a highly-evolving, rapidly-changing industry. It is characterized
both by upstream �rms (such as semiconductor producers) selling inputs to PC �rms, as
well as PC �rms selling to �nal users. The industry consists of several large companies with
worldwide sales and a high degree of capital intensity. RJVs started to play a large role in
computer markets starting in the late 1980s with the formation of SEMATECH, and they
continue to play a large role with over 10% of all RJV �lings registered in computing related
markets. Unlike the telecommunications markets, the computer industry is unregulated
48 See www.fcc.gov/Bureaus/Common_Carrier/ Reports/.
25
during our sample period and, hence, subject to competitive pressures that have increased
the pace of technology (Jorgenson, 2001). Indeed, recently �rms in this industry have been
convicted of collusive behavior, which was revealed via the leniency policy, making it directly
relevant to our study.
We consider �ve relevant market de�nitions and present descriptive statistics in the
middle panel of Table 1. A broad de�nition consists of �rms engaged in the computer software
research area, �Software RA.�Most RJVs in memory-related industries are associated with
the software RA. However, this market de�nition is likely to be too broad as there are �rms
from more than ten 3-digit NAICs industries engaged in software related research. The other
3-digit market de�nition, �Computer and Electronic Product Manufacturing,�encompasses
�rms with NAICS classi�cations that begin with 334. These consist of �rms that manufacture
computers (such as Dell), computer peripherals, and communications equipment as well as
�rms that manufacture components for such products (such as Intel). As these �rms are
not always rivals, indeed Dell is a customer of Intel, the Computer and Electronic Product
Manufacturing market is also likely to be too broad a market de�nition.
A narrow de�nition comprises establishments that engage in manufacturing or assem-
bling of electronic computers (such as mainframes, personal computers, servers, etc.). The
�Computer Manufacturing�de�nition consists of all 6-digit NAICS starting with 33411 and
encompasses �rms such as Dell, HP, Sun, and Apple. This is a more convincing relevant
market, as it does not contain semiconductor manufacturers and hence is more likely to
consist of product rivals to the extent that �rms selling mainframes compete with PC �rms.
The second 6-digit de�nition includes �rms that are engaged in manufacturing semicon-
ductors and other components for electronic applications. The �Semiconductors�de�nition
consists of all 6-digit NAICS starting with 3344 and includes �rms such as Intel, AMD,
Micron, and Motorola. Semiconductors are used as inputs in computer products, in commu-
nications equipment, and in electronics. Semiconductor production, which consists primarily
of memory chips and microcomponents, constitutes the largest component of the computer
industry. Examining the market at this narrow level is particularly worthwhile given the
recent antitrust case against semiconductor/DRAM memory producers who were involved
in many joint RJVs. However, one drawback of narrowing the relevant market de�nition is
26
that the number of observations are fewer and perhaps not su¢ cient to estimate our model.
Furthermore, there are two issues with using the Compustat data at this level. First, Com-
pustat provides total sales data for publicly traded US �rms, but does not break sales down
at the level of detail we require. For instance, IBM�s Microelectronics division was involved
in semiconductor sales during the 1990s. However, IBM is one of the world leaders in main-
frame computers, thus using the Compustat sales data (which is for all of IBM�s divisions)
will lead us to over-estimate the importance of IBM in the semiconductor industry. Sec-
ond, there are many foreign �rms in the semiconductor industry, some of which are major
players, such as Samsung, Toshiba and In�neon. If �rms in the US enter RJVs to facilitate
international collusion then the Compustat data will not give us an accurate measure of the
RJV market power if it does not take into account sales of international �rms. To overcome
these problems, we augment the Compustat data with sales data for semiconductor �rms
published by Gartner Group and iSuppli Corporation.49 These data are provided for the
top worldwide semiconductor �rms (constituting 50% to 70% of worldwide sales) and are
limited to sales of semiconductors.50 We use the data on non-US �rms to get an accurate
measure of the RJV market power as we have information on all worldwide members of the
RJV. We use the Gartner/iSuppli sales data from US �rms together with Compustat data
(on R&D expenditures, etc.) to estimate the model.
While much more narrow than the other relevant markets, the Semiconductor de�nition
consists of �rms that manufacture and sell their chips (such as Intel and Samsung) as well
as �rms that outsource the manufacturing to other companies (such as Qualcomm). The
manufacturing of microprocessors (CPUs) and memory chips (such as dynamic random ac-
cess (DRAM), static random access, and �ash memory) accounts for approximately half of
the sales of semiconductors. Our �nal narrow market de�nition consists of �rms that man-
ufacture microprocessors and memory chips. This market encompasses producers of DRAM
who were involved in the recent antitrust amnesty case. Furthermore, RJVs play a large
49 Prior to 2000 the sales data are from Gartner Dataquest Press Releases (www.gartner.com) and post-2000 data are from iSuppli Corporation (www.isuppli.com). Sales data are released in March.
50 The press releases report the sales for the top 20 �rms (approximately 70% of total semiconductor sales)in all years except 1997, 1998, and 1999 when only the top 10 �rm sales are reported (approximately 50%of total semiconductor sales).
27

role in microprocessor and memory production. Indeed, the largest �rms in the market for
Flash memory products are AMD and Fujitsu, who are the only members of a joint venture
in this area (named Spansion Inc.). We again use the �rm level sales data provided by
Gartner/iSuppli combined with the Compustat data to estimate this market de�nition.
As Table 1 indicates, �rms have high R&D intensities (ranging from 8 to 12%; on aver-
age). Indeed, semiconductor companies rank highest in R&D intensity: approximately 13%
worldwide, which is higher than R&D intensity in pharmaceutical markets. In our data �rms
in the semiconductor industry spend 10% of their sales on R&D, with �rms in memory and
microprocessing spending 12%. Furthermore, as the market de�nition narrows the num-
ber of RJVs stays the same or increases and market concentration grows substantially with
industry concentrations at the 6-digit level consistent with moderate concentration levels.
5.3 Petroleum Markets
Our �nal set of markets involves �rms in petroleum related production, where the prevalence
of numerous overlapping RJVs involving product market rivals is most pronounced. The
importance of oil production worldwide, the existence of an international cartel, and the
high degree of multi-market contact make this industry worthwhile to consider.
The petroleum industry is organized into four broad sectors: exploration and production
of crude oil and natural gas; transport; re�ning; and marketing and distribution. Due
to data limitations common to studies in this industry, we are only able to examine three
market de�nitions.51 Our �rst broad 3-digit de�nition contains �rms engaged in �Coal
and Crude Oil Extraction�who focus on the transformation of crude petroleum and coal
into usable products. The dominant process in the transformation is petroleum re�ning
that involves the separation of crude petroleum into components. In addition, this subsector
includes establishments that further process re�ned petroleum and coal products to produce
related products such as asphalt coatings and petroleum lubricating oils. Our more narrow
de�nition focuses on �rms engaged in petroleum re�ning (de�ned at the 6-digit NAICS).
51 Unfortunately due to the presence of the OPEC cartel it is di¢ cult to �nd accurate data on sales ofworldwide petroleum producers. The capacity data that are available are not representative of sales due tothe fact that �rms often do not operate up to capacity.
28

Finally, we also consider a de�nition based on the primary research area, the �Energy RA.�
Most RJVs classi�ed as being in the energy RA are associated with crude petroleum and
natural gas production, and a large portion are associated with petroleum re�ning.
A few notable aspects of the industry are apparent from the descriptive statistics in the
bottom panel of Table 1. First, there are a large number of RJVs active in each relevant
market coupled with high probabilities of joining a RJV. Furthermore, across all market
de�nitions, R&D intensity is lower than overall R&D spending as a percentage of sales in
other industries (5%). Finally, there are relatively few �rms compared to the number of
RJVs suggesting that, like telecommunications, there is high multi-market contact via RJVs
among rival �rms. Also similar to the telecommunications industry, the petroleum industry
is highly concentrated, however this is not re�ected in our descriptive statistics due to the
presence of a large number of foreign �rms.
There are a few drawbacks to using the petroleum industry to examine the impact of
the leniency program. First, the industry has several large international players, often with
substantial government support, that are not publicly traded in the US and so are not in
our data. For example, in 1998 the largest oil producer was the Saudi Arabian Oil Co.,
and the top �ve were all state owned �rms.52 As a result our sample (regardless of how
the market is de�ned) will omit important players in the industry, most notably members of
OPEC. This important drawback of the data is balanced to some extent, by the fact that the
leniency policy was speci�cally aimed at thwarting cartels that include international �rms.
So, while we aren�t able to construct a sample of all the relevant competitors, the behavior
of the US-based �rms, that we do observe, will still be in�uenced by the leniency policy even
when (or perhaps especially when) they are engaged in international cartels.
6 Results
In this section we present the results for each industry for di¤erent de�nitions of the rele-
vant antitrust market. As discussed in section 4, we include the following controls in all
regressions: a constant, �rm assets, �rm capacity constraints, number of RJVs that the �rm
52 Source: Energy Information Admin http://www.eia.doe.gov/.
29

is a member of and its square, number of RJV members, relative assets, relative capital con-
straints, whether intent is to patent R&D outcome, industry �xed e¤ects (for research area
markets), and year �xed e¤ects. As a result of including year-e¤ects the parameter estimate
for the level e¤ect the leniency policy dummy (de�ned as equal to one in all post-leniency
years) will be the e¤ect of a dummy variable for the year of the leniency policy e¤ect. How-
ever, the interactions of the RJV market power measures with the leniency policy indicator
will take on a non-zero value for all post-leniency years.
Our parameter estimates for the control variables are intuitive and consistent with the
majority of the RJV formation literature �ndings. For instance, we �nd that �rms with more
assets are signi�cantly more likely to engage in RJVs. The more RJVs a �rm is engaged
in the more likely they are to join another RJV but there are decreasing returns to joining.
Firms in industries where patents are not as important are signi�cantly more likely to form
RJVs. Finally, more relatively capital constrained �rms are more likely to join a RJV. Given
that the focus of this paper is on the collusive intent underlying RJV formation, we do not
report the parameter estimates for the controls across the speci�cations and samples.53
If the primary motivation for a �rm to join a RJV is to foster collusion in the product
market, the impact of RJV formation on R&D is a second-order consideration, at best.
For this reason, we estimate two di¤erent model speci�cations for all market de�nitions
and samples. The �rst, the �Without R&D E¤ects� speci�cation, consists of a model of
RJV formation without predicted change in R&D intensity as a regressor. Note that this
speci�cation is equivalent to the �rst stage in a two stage endogenous switching regression
estimation procedure. Estimates of the control variables from the Without-R&D-E¤ects
speci�cation will not be consistent if �rms consider the predicted change in R&D when
making RJV formation decisions. Our second speci�cation, �With R&D E¤ects�, addresses
this by correcting for the endogeneity of R&D and RJV decisions as outlined in section
4. This is worthwhile to consider because our experiment may a¤ect R&D through the
�back door.�For example, because the collusive bene�ts of the RJV are reduced, the R&D
bene�ts that would have occurred (in the absence of the leniency policy) are not realized
53 Parameter estimates for control variables and a subset of speci�cations are atiew.uzh.ch/institute/people/mgoeree/Research.html. All other estimates are available upon request.
30
in the revised leniency policy environment. Controlling for R&D endogeneity allows us
examine the impact of the policy holding R&D intensity constant. Thus, we have estimates
of collusive behavior that are not contaminated by the potential �back door�e¤ects of the
leniency policy on R&D. We present the results from both R&D-E¤ects speci�cations for
all industry samples.54 We report robust standard errors from White�s correction clustered
by �rm (in parenthesis). We now discuss the estimates from each market in turn.
6.1 Telecommunications Markets
Table 2 presents the results from both R&D-E¤ects speci�cations under various levels of
aggregation in telecommunications markets. The top panel presents the estimates from the
�rst-stage probit �Without R&D E¤ects�speci�cation; the lower panel presents the results
from the endogenous switching regression �With R&D E¤ects�speci�cation. We estimated
three models for each market de�nition and R&D e¤ect speci�cation: (i) a model that
includes the primary RJV market power measure (RJV HHI), (ii) a model that includes
the fragmentation RJV market power measure (RJV HHI Fragmentation), and (iii) a model
that is estimated using only �rms in the treatment group.
To reiterate our test is whether the leniency policy and leniency policy interacted with the
RJV measures of market power coe¢ cients are statistically signi�cant. For policy purposes,
however, the overall e¤ect of the leniency policy is of particular interest since it will tell us
the average impact of the leniency policy on RJV formation. We report the predicted total
e¤ect of the revised leniency policy on the probability of joining a RJV in the �nal rows of
the upper and lower panels. The total e¤ect is the di¤erence in the predicted probability
of joining a RJV under a revised leniency policy versus the probability of joining under no
leniency policy, evaluated at the mean of the regressors.
Columns (1)-(3) give the estimates for �rms that join a RJV in the Telecom RA.55
54 We do not present the parameter estimates for the R&D equations due to space considerations. Formost speci�cations we �nd that the more RJVs a �rm is a member of and the more capital constrained isa �rm the lower is its R&D intensity. In many speci�cations, correcting for endogenous R&D is necessary(i.e., the parameter estimates for the inverse mills correction terms are signi�cant).
55 Firms in the Telecom research area span many industries so the regressions for all speci�cations includedummy varibles for 3-digit NAICS.
31
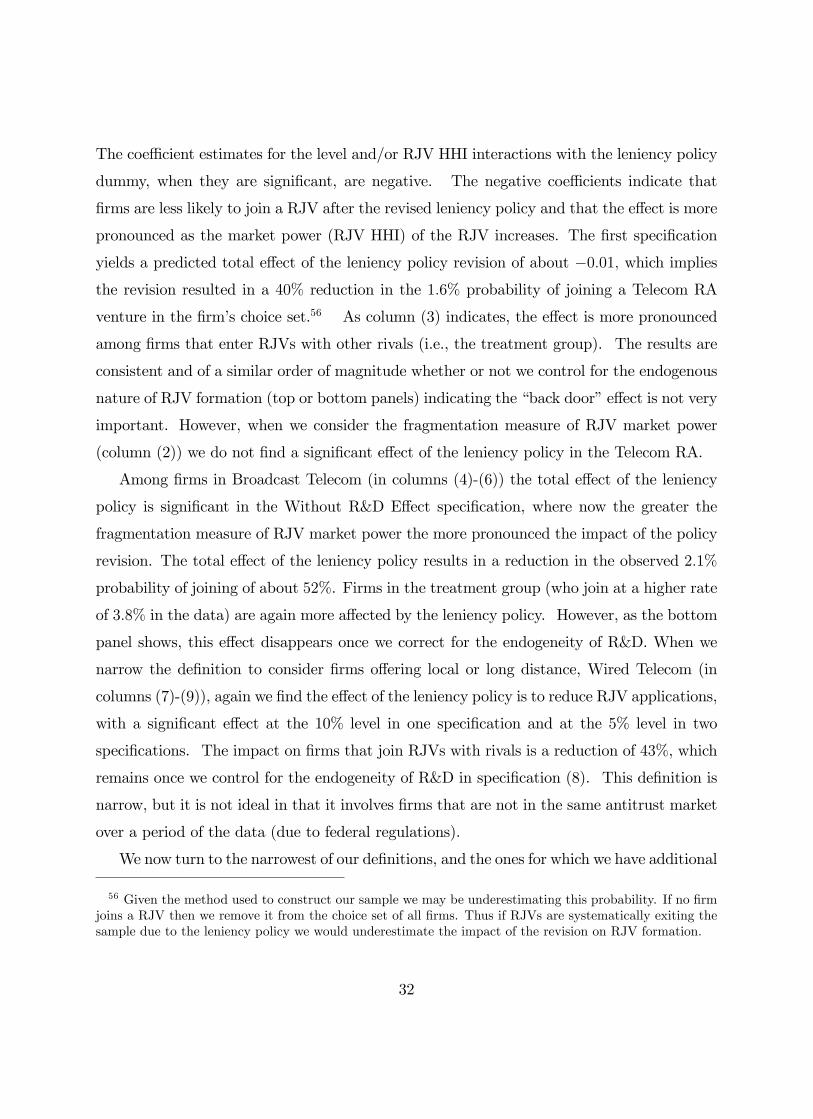
The coe¢ cient estimates for the level and/or RJV HHI interactions with the leniency policy
dummy, when they are signi�cant, are negative. The negative coe¢ cients indicate that
�rms are less likely to join a RJV after the revised leniency policy and that the e¤ect is more
pronounced as the market power (RJV HHI) of the RJV increases. The �rst speci�cation
yields a predicted total e¤ect of the leniency policy revision of about �0:01; which impliesthe revision resulted in a 40% reduction in the 1:6% probability of joining a Telecom RA
venture in the �rm�s choice set.56 As column (3) indicates, the e¤ect is more pronounced
among �rms that enter RJVs with other rivals (i.e., the treatment group). The results are
consistent and of a similar order of magnitude whether or not we control for the endogenous
nature of RJV formation (top or bottom panels) indicating the �back door�e¤ect is not very
important. However, when we consider the fragmentation measure of RJV market power
(column (2)) we do not �nd a signi�cant e¤ect of the leniency policy in the Telecom RA.
Among �rms in Broadcast Telecom (in columns (4)-(6)) the total e¤ect of the leniency
policy is signi�cant in the Without R&D E¤ect speci�cation, where now the greater the
fragmentation measure of RJV market power the more pronounced the impact of the policy
revision. The total e¤ect of the leniency policy results in a reduction in the observed 2:1%
probability of joining of about 52%. Firms in the treatment group (who join at a higher rate
of 3:8% in the data) are again more a¤ected by the leniency policy. However, as the bottom
panel shows, this e¤ect disappears once we correct for the endogeneity of R&D. When we
narrow the de�nition to consider �rms o¤ering local or long distance, Wired Telecom (in
columns (7)-(9)), again we �nd the e¤ect of the leniency policy is to reduce RJV applications,
with a signi�cant e¤ect at the 10% level in one speci�cation and at the 5% level in two
speci�cations. The impact on �rms that join RJVs with rivals is a reduction of 43%, which
remains once we control for the endogeneity of R&D in speci�cation (8). This de�nition is
narrow, but it is not ideal in that it involves �rms that are not in the same antitrust market
over a period of the data (due to federal regulations).
We now turn to the narrowest of our de�nitions, and the ones for which we have additional
56 Given the method used to construct our sample we may be underestimating this probability. If no �rmjoins a RJV then we remove it from the choice set of all �rms. Thus if RJVs are systematically exiting thesample due to the leniency policy we would underestimate the impact of the revision on RJV formation.
32
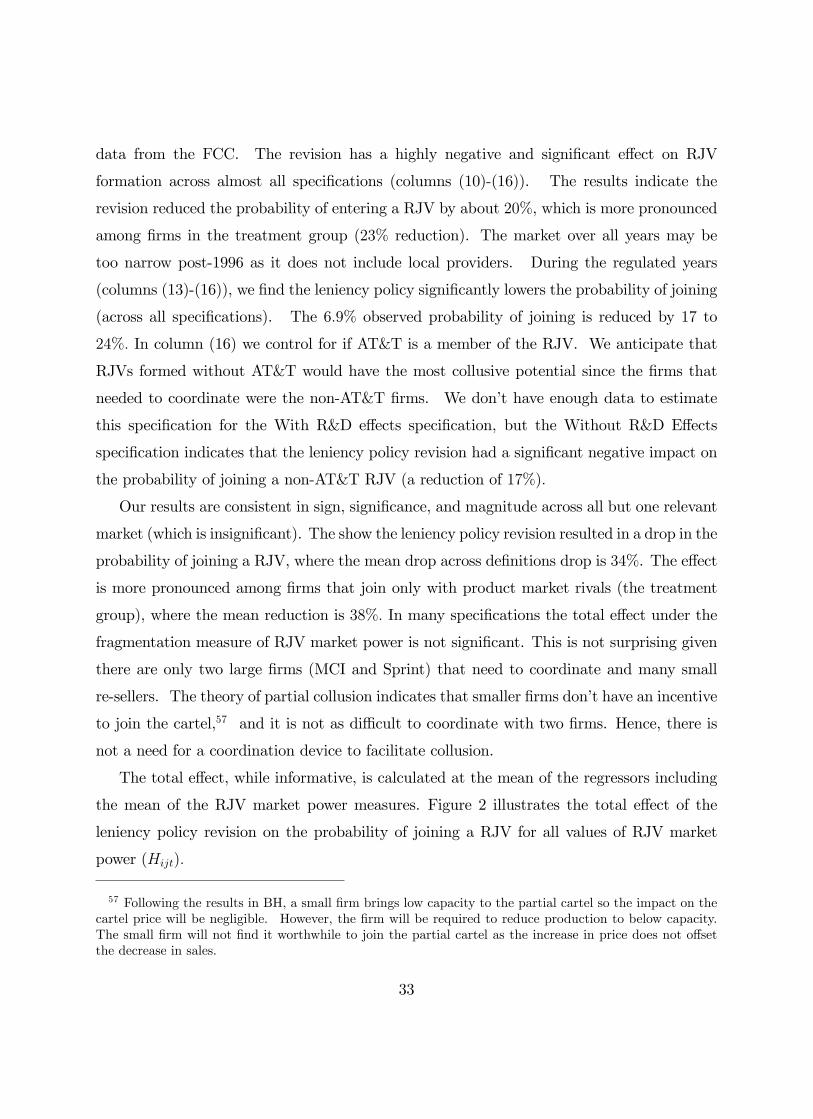
data from the FCC. The revision has a highly negative and signi�cant e¤ect on RJV
formation across almost all speci�cations (columns (10)-(16)). The results indicate the
revision reduced the probability of entering a RJV by about 20%, which is more pronounced
among �rms in the treatment group (23% reduction). The market over all years may be
too narrow post-1996 as it does not include local providers. During the regulated years
(columns (13)-(16)), we �nd the leniency policy signi�cantly lowers the probability of joining
(across all speci�cations). The 6:9% observed probability of joining is reduced by 17 to
24%: In column (16) we control for if AT&T is a member of the RJV. We anticipate that
RJVs formed without AT&T would have the most collusive potential since the �rms that
needed to coordinate were the non-AT&T �rms. We don�t have enough data to estimate
this speci�cation for the With R&D e¤ects speci�cation, but the Without R&D E¤ects
speci�cation indicates that the leniency policy revision had a signi�cant negative impact on
the probability of joining a non-AT&T RJV (a reduction of 17%):
Our results are consistent in sign, signi�cance, and magnitude across all but one relevant
market (which is insigni�cant). The show the leniency policy revision resulted in a drop in the
probability of joining a RJV, where the mean drop across de�nitions drop is 34%. The e¤ect
is more pronounced among �rms that join only with product market rivals (the treatment
group), where the mean reduction is 38%: In many speci�cations the total e¤ect under the
fragmentation measure of RJV market power is not signi�cant. This is not surprising given
there are only two large �rms (MCI and Sprint) that need to coordinate and many small
re-sellers. The theory of partial collusion indicates that smaller �rms don�t have an incentive
to join the cartel,57 and it is not as di¢ cult to coordinate with two �rms. Hence, there is
not a need for a coordination device to facilitate collusion.
The total e¤ect, while informative, is calculated at the mean of the regressors including
the mean of the RJV market power measures. Figure 2 illustrates the total e¤ect of the
leniency policy revision on the probability of joining a RJV for all values of RJV market
power (Hijt):
57 Following the results in BH, a small �rm brings low capacity to the partial cartel so the impact on thecartel price will be negligible. However, the �rm will be required to reduce production to below capacity.The small �rm will not �nd it worthwhile to join the partial cartel as the increase in price does not o¤setthe decrease in sales.
33

Leve
l of A
ggre
gatio
n:3
Dig
it N
AIC
S3
Dig
it N
AIC
S6
Dig
it N
AIC
SLo
ng D
ista
nce
Car
riers
Rel
evan
t Mar
ket D
efin
ition
:Te
leco
m R
esea
rch
Area
Broa
dcas
t Tel
ecom
Wire
d Te
leco
mAl
l Yea
rsR
egul
ated
Yea
rsSa
mpl
e:Al
lAl
lTr
eatm
ent
All
All
Trea
tmen
tAl
lAl
lTr
eatm
ent
All
All
Trea
tmen
tAl
lAl
lTr
eatm
ent
No
ATT
(1)
(2)
(3)
(4)
(5)
(6)
(7)
(8)
(9)
(10)
(11)
(12)
(13)
(14)
(15)
(16)
With
out R
&D
Effe
cts
Post
Len
ienc
y D
umm
y0
.286
***
0.2
20
.281
***
0.4
22*
0.3
50
.599
**0
.416
0.3
080
.622
*0
.460
***
0.2
380
.497
***
0.7
67**
*0.
172
0.8
29**
*0
.848
***
(0.0
80)
(0.1
58)
(0.0
88)
(0.2
35)
(0.2
46)
(0.2
83)
(0.2
85)
(0.2
76)
(0.3
67)
(0.1
19)
(0.2
54)
(0.1
36)
(0.1
55)
(0.3
33)
(0.1
67)
(0.1
64)
RJV
HH
I0.
483*
**0.
564*
**1.
040*
0.66
51.
110*
0.86
90.
785*
**0.
697*
**0.
793*
**0.
739*
**0.
774*
**(0
.129
)(0
.129
)(0
.545
)(0
.476
)(0
.627
)(0
.542
)(0
.125
)(0
.134
)(0
.148
)(0
.156
)(0
.164
)R
JV H
HI*P
ost L
enie
ncy
0.06
460
.049
60
.305
0.1
10.
112
0.19
30.
471*
**0.
449*
*1.
044*
**1.
426*
**1.
255*
**(0
.126
)(0
.125
)(0
.354
)(0
.424
)(0
.381
)(0
.486
)(0
.168
)(0
.188
)(0
.297
)(0
.285
)(0
.316
)R
JV H
HI F
ragm
enta
tion
0.0
907
0.66
0***
0.76
6***
1.2
85**
*1
.362
***
(0.1
66)
(0.1
41)
(0.1
64)
(0.1
83)
(0.2
23)
RJV
HH
I Fra
gmen
tatio
n*0
.063
70
.274
***
0.2
52**
0.2
40
.958
***
Post
Len
ienc
y(0
.140
)(0
.096
)(0
.099
)(0
.222
)(0
.352
)
Leni
ency
Pol
icy
Tota
l Effe
ct0
.010
***
0.0
110
.015
***
0.0
20*
0.0
37**
*0
.041
**0
.022
0.0
44**
0.0
54*
0.0
10**
*0
.013
0.0
15**
*0
.011
***
0.0
13**
*0
.014
***
0.0
11**
*W
ald
Test
Sta
tistic
13.3
514
.62
13.7
15.
718
22.9
8.92
43.
104
9.29
26.
008
21.7
71.
184
18.4
426
.41
27.7
936
.68
30.9
9P
Valu
e0.
001
0.00
10.
001
0.05
70.
000
0.01
20.
212
0.01
00.
050
0.00
00.
553
0.00
00.
000
0.00
00.
000
0.00
0
With
R&
D E
ffect
sPo
st L
enie
ncy
Dum
my
0.1
90*
0.0
848
0.2
22*
0.5
440
.453
0.6
130
.501
0.2
640
.292
0.5
03**
*0
.172
0.5
39**
*0
.848
***
0.33
50
.953
***
See
(0.0
99)
(2.9
91)
(0.1
14)
(5.7
02)
(10.
460)
(1.8
36)
(39.
530)
(0.8
25)
(1.0
03)
(0.1
25)
(0.2
73)
(0.1
43)
(0.1
64)
(0.3
34)
(0.1
85)
Not
eR
JV H
HI
0.93
8***
0.97
9***
1.69
11.
603
0.78
1.72
7**
0.76
4***
0.66
4***
0.77
4***
0.67
7***
(0.1
74)
(0.1
71)
(61.
870)
(12.
480)
(54.
230)
(0.6
74)
(0.1
31)
(0.1
41)
(0.1
64)
(0.1
62)
RJV
HH
I*Pos
t Len
ienc
y0
.286
*0
.419
***
0.3
470
.275
0.13
80
.22
0.54
6***
0.54
7***
1.25
5***
1.75
0***
(0.1
53)
(0.1
58)
(43.
710)
(4.2
22)
(47.
760)
(1.9
25)
(0.1
79)
(0.2
02)
(0.3
16)
(0.3
05)
RJV
HH
I Fra
gmen
tatio
n0
.089
30.
565
0.82
8***
1.2
45**
*1
.345
***
(2.4
90)
(47.
300)
(0.2
36)
(0.1
91)
(0.2
37)
RJV
HH
I Fra
gmen
tatio
n*0.
0273
0.2
80
.312
*0
.346
1.1
90**
*Po
st L
enie
ncy
(0.2
66)
(36.
180)
(0.1
80)
(0.2
36)
(0.3
49)
Leni
ency
Pol
icy
Tota
l Effe
ct0
.011
*0
.002
0.0
20**
*0
.032
0.0
600
.052
0.0
400
.052
*0
.034
0.0
11**
*0
.014
0.0
16**
*0
.011
***
0.0
14**
*0
.014
***
Wal
d Te
st S
tatis
tic8.
867
0.57
313
.47
2.24
51.
163
0.28
10.
0559
4.95
50.
103
25.5
52.
037
21.1
430
.99
31.8
542
.61
PVa
lue
0.01
20.
751
0.00
10.
326
0.55
90.
869
0.97
20.
084
0.95
00.
000
0.36
10.
000
0.00
00.
000
0.00
0N
umbe
r of O
bser
vatio
nsW
ithou
t R&D
Effe
cts
5237
752
377
3618
411
704
1170
464
6664
6064
6033
4616
2716
2713
9784
484
474
425
7W
ith R
&D E
ffect
s37
899
3789
927
006
2389
2389
1346
1650
1650
886
334
334
295
257
257
226
Not
es: R
obus
t sta
ndar
d er
rors
clu
ster
ed b
y fir
m a
re in
par
enth
eses
. * in
dica
tes
sign
ifica
nt a
t the
10%
leve
l; **
at 5
% a
nd **
* at
1%
. The
tota
l effe
ct is
com
pute
d at
the
mea
n of
the
inde
pend
ent v
aria
bles
. An
obse
rvat
ion
is a
a fir
my
earR
JV c
ombi
natio
n. W
e in
clud
e th
e fo
llow
ing
cont
rols
in a
ll re
gres
sion
s: c
onst
ant,
firm
ass
ets,
firm
cap
acity
con
stra
ints
, num
ber o
f RJV
s th
e fir
m is
a m
embe
r of a
nd it
s sq
uare
, num
ber o
f RJV
mem
bers
, rel
ativ
eas
sets
, rel
ativ
e ca
pita
l con
stra
ints
, ind
ustry
fixe
d ef
fect
s (fo
r res
earc
h ar
ea m
arke
ts),
and
year
fixe
d ef
fect
s. T
here
wer
e no
t eno
ugh
obse
rvat
ions
to ru
n sp
ecifi
catio
n (1
6) w
ith R
&D
effe
cts.
Table2:EstimatesforJoinaRJV
inTelecom
Markets
34
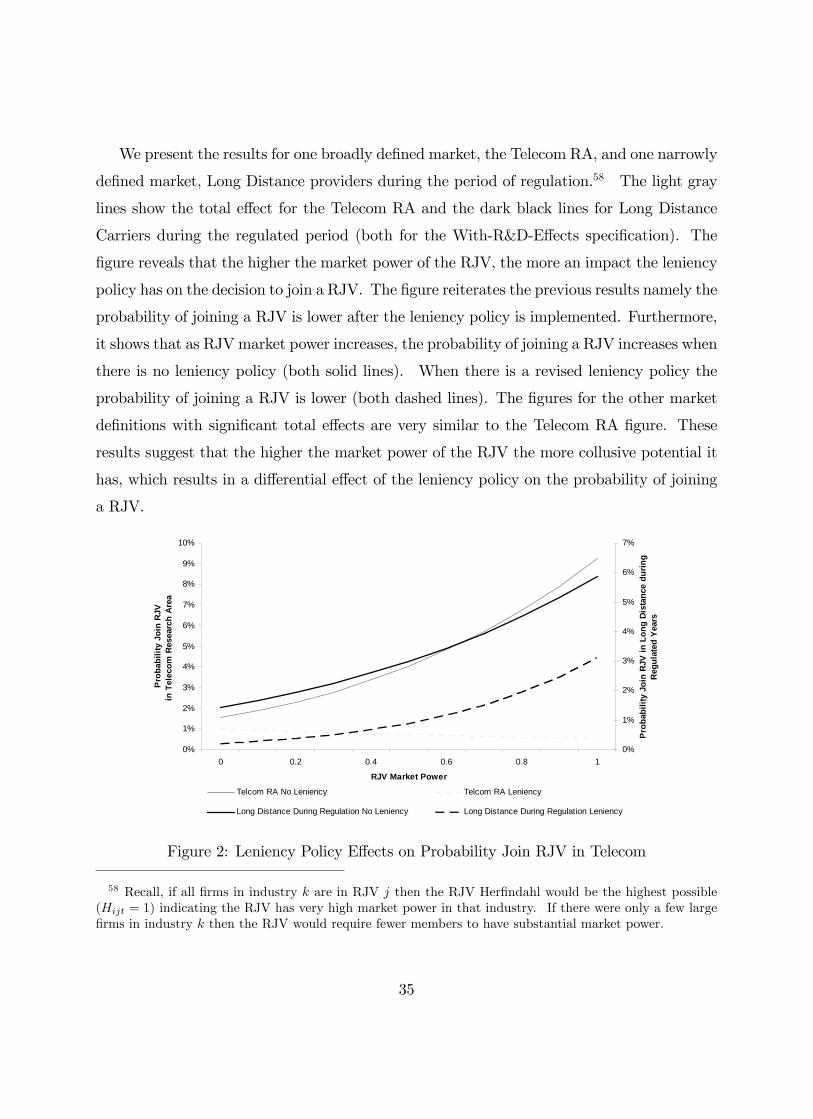
We present the results for one broadly de�ned market, the Telecom RA, and one narrowly
de�ned market, Long Distance providers during the period of regulation.58 The light gray
lines show the total e¤ect for the Telecom RA and the dark black lines for Long Distance
Carriers during the regulated period (both for the With-R&D-E¤ects speci�cation). The
�gure reveals that the higher the market power of the RJV, the more an impact the leniency
policy has on the decision to join a RJV. The �gure reiterates the previous results namely the
probability of joining a RJV is lower after the leniency policy is implemented. Furthermore,
it shows that as RJVmarket power increases, the probability of joining a RJV increases when
there is no leniency policy (both solid lines). When there is a revised leniency policy the
probability of joining a RJV is lower (both dashed lines). The �gures for the other market
de�nitions with signi�cant total e¤ects are very similar to the Telecom RA �gure. These
results suggest that the higher the market power of the RJV the more collusive potential it
has, which results in a di¤erential e¤ect of the leniency policy on the probability of joining
a RJV.
0%
1%
2%
3%
4%
5%
6%
7%
8%
9%
10%
0 0.2 0.4 0.6 0.8 1
RJV Market Power
Pro
babi
lity
Join
RJV
in T
elec
om R
esea
rch
Are
a
0%
1%
2%
3%
4%
5%
6%
7%
Pro
babi
lity
Join
RJV
in L
ong
Dis
tanc
e du
ring
Reg
ulat
ed Y
ears
Telcom RA No Leniency Telcom RA Leniency
Long Distance During Regulation No Leniency Long Distance During Regulation Leniency
Figure 2: Leniency Policy E¤ects on Probability Join RJV in Telecom
58 Recall, if all �rms in industry k are in RJV j then the RJV Her�ndahl would be the highest possible(Hijt = 1) indicating the RJV has very high market power in that industry. If there were only a few large�rms in industry k then the RJV would require fewer members to have substantial market power.
35
6.2 Computer Markets
We report the estimates for the leniency policy and RJV market power variables for the
computer markets in Table 3. The results show a signi�cant and negative impact of the
leniency policy �ne increase across all �ve market de�nitions and all speci�cations. Recall
we posit that if �rms enter RJVs to collude then the impact on R&D is secondary. If our
conjecture is correct then, when the leniency policy has a signi�cant e¤ect on the decision
to join, the results should be similar across R&D speci�cations (if the �back door�impact
on R&D does not matter). Indeed, the results indicate the total e¤ect is identical or very
close across the R&D e¤ects within speci�cations.
The most broad 3-digit NAICS de�nition of the relevant market is Computer and Elec-
tronic product manufacturing, which consists of �rms that manufacture computers, computer
peripherals, and components. The estimates are given in columns (1)-(3). They show that
the predicted total e¤ect of the leniency policy is between �0:002 and �0:003; which impliesthe revision resulted in a 19 to 28% reduction in the 1% observed probability of joining a
RJV in the �rm�s choice set. The e¤ect is of a similar magnitude among �rms that enter
RJVs with other rivals, where the 1:5% probability of joining is reduced by 23%. As we
narrow the market de�nition to the Software RA (columns (4)-(6)) we again �nd signi�cant
negative e¤ects across all speci�cations. However the e¤ects are larger in magnitude, where
the total e¤ect of the revision serves to reduce the probability of joining by between 16
and 36%. Again, within speci�cations the results are of similar magnitudes (when both are
signi�cant) whether or not we control for endogenous R&D. Both measures of RJV market
power show negative and signi�cant impacts on the probability of joining. The previous
market de�nitions included �rms that manufacture computers together with those that man-
ufacture inputs for computers. We consider the subsets individually in the next three market
de�nitions.
36
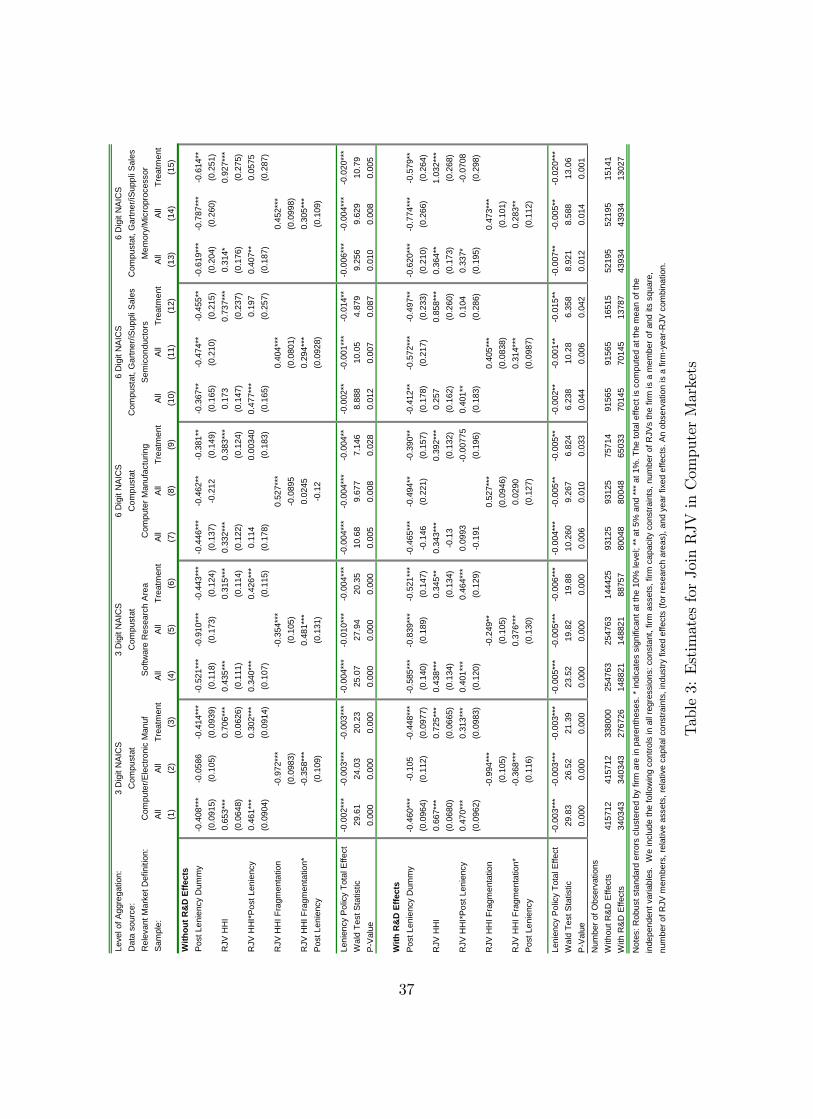
Leve
l of A
ggre
gatio
n:3
Dig
it N
AIC
S3
Dig
it N
AIC
S6
Dig
it N
AIC
S6
Dig
it N
AIC
S6
Dig
it N
AIC
SD
ata
sour
ce:
Com
pust
atC
ompu
stat
Com
pust
atC
ompu
stat
, Gar
tner
/iSup
pli S
ales
Com
pust
at, G
artn
er/iS
uppl
i Sal
esR
elev
ant M
arke
t Def
initi
on:
Com
pute
r/Ele
ctro
nic
Man
ufSo
ftwar
e R
esea
rch
Are
aC
ompu
ter M
anuf
actu
ring
Sem
icon
duct
ors
Mem
ory/
Mic
ropr
oces
sor
Sam
ple:
All
All
Trea
tmen
tA
llA
llTr
eatm
ent
All
All
Trea
tmen
tA
llA
llTr
eatm
ent
All
All
Trea
tmen
t(1
)(2
)(3
)(4
)(5
)(6
)(7
)(8
)(9
)(1
0)(1
1)(1
2)(1
3)(1
4)(1
5)W
ithou
t R&
D E
ffect
sP
ost L
enie
ncy
Dum
my
0.4
08**
*0
.058
60
.414
***
0.5
21**
*0
.910
***
0.4
43**
*0
.446
***
0.4
62**
0.3
81**
0.3
67**
0.4
74**
0.4
55**
0.6
19**
*0
.787
***
0.6
14**
(0.0
915)
(0.1
05)
(0.0
939)
(0.1
18)
(0.1
73)
(0.1
24)
(0.1
37)
0.2
12(0
.149
)(0
.165
)(0
.210
)(0
.215
)(0
.204
)(0
.260
)(0
.251
)R
JV H
HI
0.65
3***
0.70
6***
0.43
5***
0.31
5***
0.33
2***
0.38
3***
0.17
30.
737*
**0.
314*
0.92
7***
(0.0
648)
(0.0
626)
(0.1
11)
(0.1
14)
(0.1
22)
(0.1
24)
(0.1
47)
(0.2
37)
(0.1
76)
(0.2
75)
RJV
HH
I*Po
st L
enie
ncy
0.46
1***
0.30
2***
0.34
0***
0.42
6***
0.11
40.
0034
00.
477*
**0.
197
0.40
7**
0.05
75(0
.090
4)(0
.091
4)(0
.107
)(0
.115
)(0
.178
)(0
.183
)(0
.165
)(0
.257
)(0
.187
)(0
.287
)R
JV H
HI F
ragm
enta
tion
0.9
72**
*0
.354
***
0.52
7***
0.40
4***
0.45
2***
(0.0
983)
(0.1
05)
0.0
895
(0.0
801)
(0.0
998)
RJV
HH
I Fra
gmen
tatio
n*0
.358
***
0.48
1***
0.02
450.
294*
**0.
305*
**P
ost L
enie
ncy
(0.1
09)
(0.1
31)
0.1
2(0
.092
8)(0
.109
)
Leni
ency
Pol
icy
Tota
l Effe
ct0
.002
***
0.0
03**
*0
.003
***
0.0
04**
*0
.010
***
0.0
04**
*0
.004
***
0.0
04**
*0
.004
**0
.002
**0
.001
***
0.0
14**
0.0
06**
*0
.004
***
0.0
20**
*W
ald
Test
Sta
tistic
29.6
124
.03
20.2
325
.07
27.9
420
.35
10.6
89.
677
7.14
68.
888
10.0
54.
879
9.25
69.
629
10.7
9P
Val
ue0.
000
0.00
00.
000
0.00
00.
000
0.00
00.
005
0.00
80.
028
0.01
20.
007
0.08
70.
010
0.00
80.
005
With
R&
D E
ffect
sP
ost L
enie
ncy
Dum
my
0.4
60**
*0
.105
0.4
48**
*0
.585
***
0.8
39**
*0
.521
***
0.4
65**
*0
.494
**0
.390
**0
.412
**0
.572
***
0.4
97**
0.6
20**
*0
.774
***
0.5
79**
(0.0
964)
(0.1
12)
(0.0
977)
(0.1
40)
(0.1
89)
(0.1
47)
0.1
46(0
.221
)(0
.157
)(0
.178
)(0
.217
)(0
.233
)(0
.210
)(0
.266
)(0
.264
)R
JV H
HI
0.66
7***
0.72
5***
0.43
8***
0.34
5**
0.34
3***
0.39
2***
0.25
70.
858*
**0.
364*
*1.
032*
**(0
.068
0)(0
.066
5)(0
.134
)(0
.134
)0
.13
(0.1
32)
(0.1
62)
(0.2
60)
(0.1
73)
(0.2
68)
RJV
HH
I*Po
st L
enie
ncy
0.47
0***
0.31
3***
0.40
1***
0.46
4***
0.09
930
.007
750.
401*
*0.
104
0.33
7*0
.070
8(0
.096
2)(0
.098
3)(0
.120
)(0
.129
)0
.191
(0.1
96)
(0.1
83)
(0.2
86)
(0.1
95)
(0.2
98)
RJV
HH
I Fra
gmen
tatio
n0
.994
***
0.2
49**
0.52
7***
0.40
5***
0.47
3***
(0.1
05)
(0.1
05)
(0.0
946)
(0.0
838)
(0.1
01)
RJV
HH
I Fra
gmen
tatio
n*0
.368
***
0.37
6***
0.02
900.
314*
**0.
283*
*P
ost L
enie
ncy
(0.1
16)
(0.1
30)
(0.1
27)
(0.0
987)
(0.1
12)
Leni
ency
Pol
icy
Tota
l Effe
ct0
.003
***
0.0
03**
*0
.003
***
0.0
05**
*0
.005
***
0.0
06**
*0
.004
***
0.0
05**
0.0
05**
0.0
02**
0.0
01**
0.0
15**
0.0
07**
0.0
05**
0.0
20**
*W
ald
Test
Sta
tistic
29.8
326
.52
21.3
923
.52
19.8
219
.88
10.2
609.
267
6.82
46.
238
10.2
86.
358
8.92
18.
588
13.0
6P
Val
ue0.
000
0.00
00.
000
0.00
00.
000
0.00
00.
006
0.01
00.
033
0.04
40.
006
0.04
20.
012
0.01
40.
001
Num
ber o
f Obs
erva
tions
With
out R
&D
Effe
cts
4157
1241
5712
3380
0025
4763
2547
6314
4425
9312
593
125
7571
491
565
9156
516
515
5219
552
195
1514
1W
ith R
&D
Effe
cts
3403
4334
0343
2767
2614
8821
1488
2188
757
8004
880
048
6503
370
145
7014
513
787
4393
443
934
1302
7
Not
es: R
obus
t sta
ndar
d er
rors
clu
ster
ed b
y fir
m a
re in
par
enth
eses
. * in
dica
tes
sign
ifica
nt a
t the
10%
leve
l; **
at 5
% a
nd *
** a
t 1%
. The
tota
l effe
ct is
com
pute
d at
the
mea
n of
the
inde
pend
ent v
aria
bles
. W
e in
clud
e th
e fo
llow
ing
cont
rols
in a
ll re
gres
sion
s: c
onst
ant,
firm
ass
ets,
firm
cap
acity
con
stra
ints
, num
ber o
f RJV
s th
e fir
m is
a m
embe
r of a
nd it
s sq
uare
,nu
mbe
r of R
JV m
embe
rs, r
elat
ive
asse
ts, r
elat
ive
capi
tal c
onst
rain
ts, i
ndus
try fi
xed
effe
cts
(for r
esea
rch
area
s), a
nd y
ear f
ixed
effe
cts.
An
obse
rvat
ion
is a
firm
yea
rRJV
com
bina
tion.
Table3:EstimatesforJoinRJV
inComputerMarkets
37
The �rst narrow de�nition, Computer Manufacturing consists of �rms that manufacture
or assemble mainframes, personal computer, servers, etc. The estimates are given in columns
(7)-(9). The revised leniency policy again has a signi�cant and negative e¤ect of a similar
magnitude across speci�cations. The total e¤ect of the leniency policy is to reduce the
probability of joining that ranges from 27 to 37%: Among semiconductor �rms (such as
Intel, AMD, Micron, and Motorola) the total e¤ect of the leniency policy is again negative
and signi�cant across speci�cations, indicating a reduction in the probability of joining
ranging from 18 to 33%. A further classi�cation of semiconductors into its relevant 6-
digit components: microprocessors and memory yields a much larger signi�cant impact of
the revision. Indeed, among this subset the total e¤ect of the leniency policy revision is
predicted to have reduced RJV formation by 42 to 67%. In summary, we �nd evidence of
collusive behavior among computer manufacturers, but evidence that the behavior is more
pronounced among memory and microprocessor producers, which is supported by evidence
on collusive cases reported via the amnesty policy in the market for DRAM memory.
Again, our results for the computer markets are consistent in sign, signi�cance, and of
similar magnitude across all relevant markets. Across all speci�cations and market de�ni-
tions the leniency policy revision resulted in an average drop in the probability of joining a
RJV of 33%: It is also interesting to note that the estimated total e¤ect is the same across
speci�cations for both measures of the RJV market power, even though the coe¢ cient esti-
mates for the RJV HHI measures di¤er. Unlike telecommunications, the computer industry
consists of �rms of various sizes, and the signi�cant coe¢ cient estimates for the RJV frag-
mentation measure suggest that the RJV functions as a mechanism to coordinate more �rms
with large combined market shares.
Figure 3 illustrates the total e¤ect of the leniency policy revision on the probability of
joining a RJV for all values of RJV market power: Again, we present the results for one
broadly de�ned 3-digit market, Computer and Electronic Manufacturing (dark line), and
one narrowly de�ned market, Memory and Microprocessors (light line), both for the With-
R&D-E¤ects speci�cation. The �gure reveals the same pattern as with Telecommunications,
suggesting that the higher the market power of the RJV, the more an impact the leniency
policy has on the decision to join a RJV in computer markets. Again, as RJV market
38
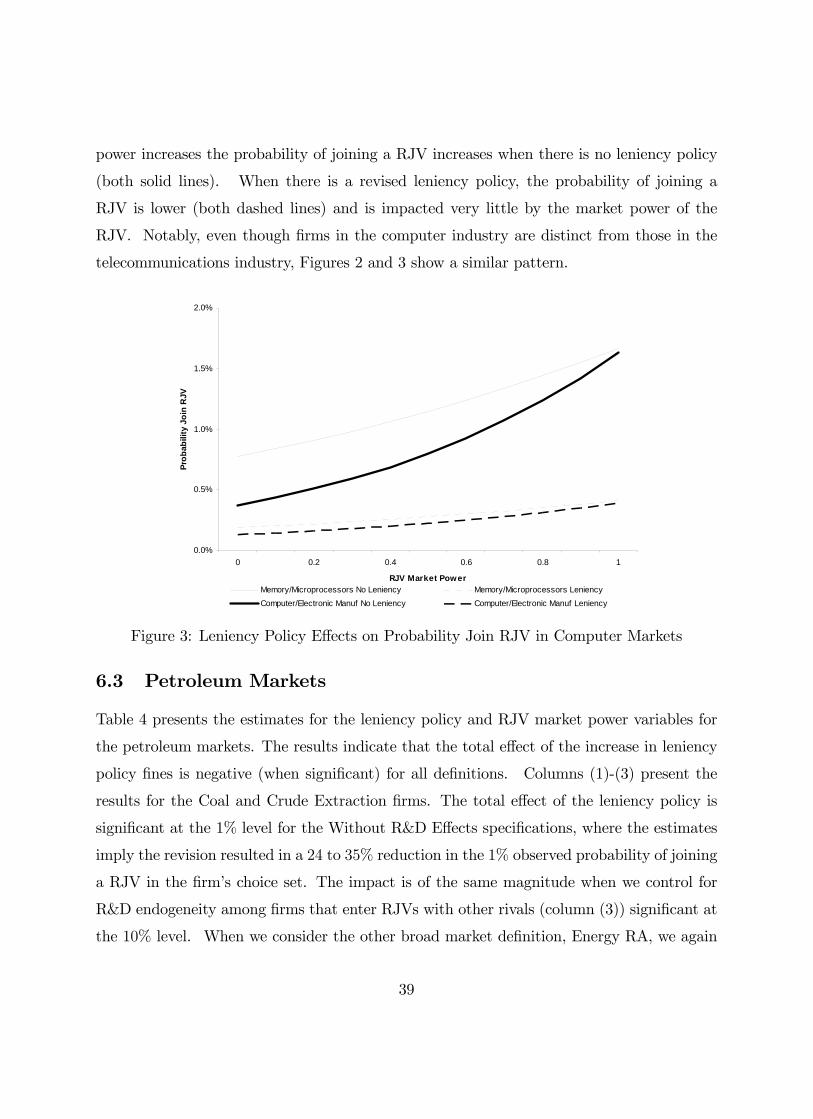
power increases the probability of joining a RJV increases when there is no leniency policy
(both solid lines). When there is a revised leniency policy, the probability of joining a
RJV is lower (both dashed lines) and is impacted very little by the market power of the
RJV. Notably, even though �rms in the computer industry are distinct from those in the
telecommunications industry, Figures 2 and 3 show a similar pattern.
0.0%
0.5%
1.0%
1.5%
2.0%
0 0.2 0.4 0.6 0.8 1
RJV Market Power
Prob
abili
ty J
oin
RJV
Memory/Microprocessors No Leniency Memory/Microprocessors LeniencyComputer/Electronic Manuf No Leniency Computer/Electronic Manuf Leniency
Figure 3: Leniency Policy E¤ects on Probability Join RJV in Computer Markets
6.3 Petroleum Markets
Table 4 presents the estimates for the leniency policy and RJV market power variables for
the petroleum markets. The results indicate that the total e¤ect of the increase in leniency
policy �nes is negative (when signi�cant) for all de�nitions. Columns (1)-(3) present the
results for the Coal and Crude Extraction �rms. The total e¤ect of the leniency policy is
signi�cant at the 1% level for the Without R&D E¤ects speci�cations, where the estimates
imply the revision resulted in a 24 to 35% reduction in the 1% observed probability of joining
a RJV in the �rm�s choice set. The impact is of the same magnitude when we control for
R&D endogeneity among �rms that enter RJVs with other rivals (column (3)) signi�cant at
the 10% level. When we consider the other broad market de�nition, Energy RA, we again
39
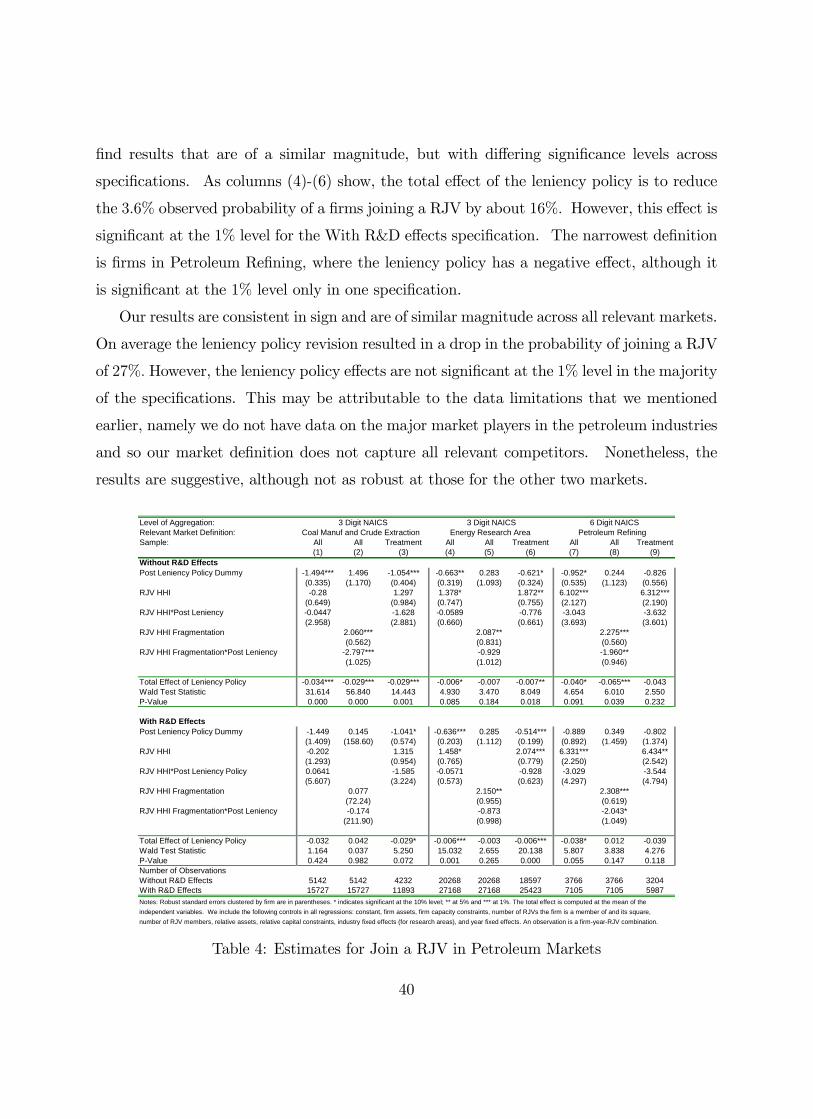
�nd results that are of a similar magnitude, but with di¤ering signi�cance levels across
speci�cations. As columns (4)-(6) show, the total e¤ect of the leniency policy is to reduce
the 3:6% observed probability of a �rms joining a RJV by about 16%: However, this e¤ect is
signi�cant at the 1% level for the With R&D e¤ects speci�cation. The narrowest de�nition
is �rms in Petroleum Re�ning, where the leniency policy has a negative e¤ect, although it
is signi�cant at the 1% level only in one speci�cation.
Our results are consistent in sign and are of similar magnitude across all relevant markets.
On average the leniency policy revision resulted in a drop in the probability of joining a RJV
of 27%: However, the leniency policy e¤ects are not signi�cant at the 1% level in the majority
of the speci�cations. This may be attributable to the data limitations that we mentioned
earlier, namely we do not have data on the major market players in the petroleum industries
and so our market de�nition does not capture all relevant competitors. Nonetheless, the
results are suggestive, although not as robust at those for the other two markets.
Level of Aggregation: 3 Digit NAICS 3 Digit NAICS 6 Digit NAICSRelevant Market Definition: Coal Manuf and Crude Extraction Energy Research Area Petroleum RefiningSample: All All Treatment All All Treatment All All Treatment
(1) (2) (3) (4) (5) (6) (7) (8) (9)Without R&D EffectsPost Leniency Policy Dummy 1.494*** 1.496 1.054*** 0.663** 0.283 0.621* 0.952* 0.244 0.826
(0.335) (1.170) (0.404) (0.319) (1.093) (0.324) (0.535) (1.123) (0.556)RJV HHI 0.28 1.297 1.378* 1.872** 6.102*** 6.312***
(0.649) (0.984) (0.747) (0.755) (2.127) (2.190)RJV HHI*Post Leniency 0.0447 1.628 0.0589 0.776 3.043 3.632
(2.958) (2.881) (0.660) (0.661) (3.693) (3.601)RJV HHI Fragmentation 2.060*** 2.087** 2.275***
(0.562) (0.831) (0.560)RJV HHI Fragmentation*Post Leniency 2.797*** 0.929 1.960**
(1.025) (1.012) (0.946)
Total Effect of Leniency Policy 0.034*** 0.029*** 0.029*** 0.006* 0.007 0.007** 0.040* 0.065*** 0.043Wald Test Statistic 31.614 56.840 14.443 4.930 3.470 8.049 4.654 6.010 2.550PValue 0.000 0.000 0.001 0.085 0.184 0.018 0.091 0.039 0.232
With R&D EffectsPost Leniency Policy Dummy 1.449 0.145 1.041* 0.636*** 0.285 0.514*** 0.889 0.349 0.802
(1.409) (158.60) (0.574) (0.203) (1.112) (0.199) (0.892) (1.459) (1.374)RJV HHI 0.202 1.315 1.458* 2.074*** 6.331*** 6.434**
(1.293) (0.954) (0.765) (0.779) (2.250) (2.542)RJV HHI*Post Leniency Policy 0.0641 1.585 0.0571 0.928 3.029 3.544
(5.607) (3.224) (0.573) (0.623) (4.297) (4.794)RJV HHI Fragmentation 0.077 2.150** 2.308***
(72.24) (0.955) (0.619)RJV HHI Fragmentation*Post Leniency 0.174 0.873 2.043*
(211.90) (0.998) (1.049)
Total Effect of Leniency Policy 0.032 0.042 0.029* 0.006*** 0.003 0.006*** 0.038* 0.012 0.039Wald Test Statistic 1.164 0.037 5.250 15.032 2.655 20.138 5.807 3.838 4.276PValue 0.424 0.982 0.072 0.001 0.265 0.000 0.055 0.147 0.118Number of ObservationsWithout R&D Effects 5142 5142 4232 20268 20268 18597 3766 3766 3204With R&D Effects 15727 15727 11893 27168 27168 25423 7105 7105 5987Notes: Robust standard errors clustered by firm are in parentheses. * indicates significant at the 10% level; ** at 5% and *** at 1%. The total effect is computed at the mean of theindependent variables. We include the following controls in all regressions: constant, firm assets, firm capacity constraints, number of RJVs the firm is a member of and its square,number of RJV members, relative assets, relative capital constraints, industry fixed effects (for research areas), and year fixed effects. An observation is a firmyearRJV combination.
Table 4: Estimates for Join a RJV in Petroleum Markets
40

Figure 4 illustrates the total e¤ect of the leniency policy revision on the probability of
joining a RJV for all values of RJV market power. We present the results for one broadly
de�ned 3-digit market, Energy RA (light line), and one narrowly de�ned market, Petroleum
Re�ning (dark line), both for the With-R&D-E¤ects speci�cation. As the other �gures, we
�nd that the higher the market power of the RJV, the more an impact the leniency policy has
on the decision to join a RJV. The RJV market power increases the probability of joining
a RJV when there is no leniency policy (both solid lines). When there is a revised leniency
policy, the probability of joining a RJV is lower (both dashed lines) and is not impacted by
the market power of the RJV.
0%
2%
4%
6%
8%
10%
12%
0 0.2 0.4 0.6 0.8 1
RJV Market Power
Pro
babi
lity
Join
RJV
in E
nerg
y R
esea
rch
Are
a
0%
20%
40%
60%
80%
100%
120%
Pro
babi
lity
Join
RJV
in R
efin
ing
Energy RA No Leniency Energy RA Leniency Refining No Leniency Refining Leniency
Figure 4: Leniency Policy E¤ects on Probability Join RJV in Petroleum Markets
6.4 Implications
The economic damage caused by cartels is signi�cant. Connor (2003) estimates that modern
international cartels resulted in 28% higher prices. The graphite electrode cartel, for instance,
caused more than a 60% price increase. Small increases also have the potential to cause
substantial harm. For example, the lysine cartel resulted in 17% higher: an overcharge of
more than $75 million in the U.S. and $200 million worldwide (Connor, 2003). Secondly,
41

cartels may cause dynamic ine¢ ciencies if �rms have fewer incentives to innovate to improve
their market position.59 Finally, cartels may generate �X-ine¢ ciencies� in that e¢ cient
operation is not as necessary because collusive pro�ts are su¢ cient to compensate for higher
costs.
To the extent that �rms in alliances and trade associations (i.e., non-research focused
ventures) are registered, and hence protected, under the NCRPA, the welfare implications
of collusion are clear. Alliances and trade associations are not engaged in R&D and hence
realize no e¢ ciency gains to o¤set the welfare losses due to collusion.60 Therefore, welfare
is unambiguously lower under collusion. Alliances are prevalent in many industries. For
example, in the airline industry a number of antitrust concerns over code-sharing has raised
collusive concerns. A study by Oum and Park (1997) found that the 30 largest airlines
were involved in over 300 various types of alliances in 1996 alone. In the early 1980s
antitrust authorities voiced concern over the cartel-inducing properties of alliances formed
in the movie industry. Speci�cally, major movie companies created a RJV where members
would provide movies exclusively to a pay network for a limited time before making them
available to other networks.61
On the other hand, there are many potential bene�ts to R&D collaboration as discussed
in section 1. Whether overall welfare is reduced as a result of collusion among RJV members
depends on the magnitude of the welfare loss due to product market collusion relative to
the welfare gain due to R&D collaboration. The welfare implications depend both on the
nature of competition in the industry, the characteristics of the RJV, and the extent to which
RJVs help to overcome ine¢ ciencies associated with R&D (such as high levels of spillovers).
Notice that antitrust authorities are faced with a similar dilemma when considering whether
to approve a proposed merger. Mergers can generate e¢ ciencies (e.g., by decreasing costs)
but lead to increased market concentration that may overcompensate for the welfare gains.
59 However, the conclusion could be to the contrary, as mentioned in Bos (2009), if due to higher pro�tsthe colluding �rms have more means to innovate. Moreover, a �rm may bene�t more from its innovationwhen it is not under competitive pressure.
60 We thank an anonymous referee for this point.
61 United States v. Columbia Pictures Indus 507 F. Supp. 412 n. 47 (S.D.N.Y 1980).
42

In deciding whether to permit a merger, antitrust authorities consider each case individ-
ually while applying a �rule of thumb�based on industry concentration.62 Our results
suggest a parallel approach be taken with a subset of RJV applications. First, the conven-
tional wisdom that cartels are most easily established in concentrated industries leads to the
suggestion that RJVs formed in concentrated industries should be more closely examined.
Second, every partial cartel leads to prices above the competitive level. However the over-
charge, and thus the damage caused, increases in the size of the cartel relative to the market.
Therefore, the combined market share of the cartel relative to industry concentration (i.e.,
the RJV market power index) might provide an indication of the welfare implications of
collusion. A RJV �rule-of-thumb�could be formulated based on the market power of the
RJV. Finally, the results suggest it could be worthwhile to consider the coordination role of
RJVs in industries where �rms are more fragmented.
7 Speci�cation and Robustness Checks
We conducted a number of goodness-of-�t, speci�cation and robustness checks, which we
detail below.63 Overall our results are robust to alternative speci�cations, controls for
potential serial correlation, and the inclusion of unobserved �rm and RJV e¤ects.
Table 5 presents tests of the �t of the model. We �nd that the empirical model has strong
explanatory power before the policy change, but that it �ts well over the whole time period
only when we include the policy dummy and interaction terms. The relevant pre-leniency
sample is prior to the leniency policy revision for the Telecom markets and prior to the
increase in �nes for the Computer and Petroleum markets. The restricted (full) model is
the model without (with) the leniency policy indicators and interactions. The �rst column
presents the pseudo R-squared measure of �t of the restricted model over the pre-leniency
period. The results of the second column show that the restricted model does not �t as
62 According to the US Merger guidelines mergers are generally not challenged when the HHI is smallerthan 1000, when the HHI is between 1000 and 1800 and the merger will increase the HHI by less than 100points or when the HHI is larger than 1800 and the merger will increase the HHI by less than 50 points. Allother mergers might be challenged.
63 Due to space constraints we discuss some results for which we do not present parameter estimates. Toavoid many repetitions we note here that details for all results are available upon request.
43

well in the post-leniency period for any market de�nition. The �nal two columns report
the results of a likelihood ratio test of the null hypothesis that the restricted model �ts as
well as the full model over the entire sample period. As the P-value shows we can reject
the null hypothesis for most markets at the 1% level. We can reject the null at the 5%
level for Telecom RA, Wired, and the Long Distance �rms under the period of regulation;
and at the 10% level for Computer Manufacturing. There are only two markets where
the restricted model does not give a worse �t than the full model: the Energy RA (in the
petroleum industry) and Long Distance Firms over all years (in the telecom industry).
Restricted Model Likelihood Ratio Test:Psuedo RSquared Null Hypothesis Restricted Model
PreLeniency PostLeniency Fits as Good as Full ModelSample Sample Test Statistic PValue
Telecom Research Area 0.217 0.146 9.17 0.010Broadcast 0.329 0.240 17.83 0.000Wired 0.344 0.226 8.88 0.012Long Distance All Years 0.445 0.375 1.65 0.439Long Distance Regulated 0.445 0.398 7.46 0.024
Computer Computer/Electronic 0.305 0.232 32.22 0.000Software Research Area 0.308 0.234 24.31 0.000Computer Manufacturing 0.289 0.212 5.51 0.064Semiconductors 0.283 0.197 9.60 0.008Memory/Microproc 0.303 0.228 10.78 0.005
Petroleum Coal/Crude Extraction 0.486 0.445 29.56 0.000Energy Research Area 0.467 0.354 3.85 0.146Petroleum Refining 0.444 0.351 13.84 0.001
Results are reported for the "Without R&D Effects" specifications using the primary measure of the RJV measure of market power.All regressions include same controls as in main specification. The likelihood ratio test statistic assumes no heteroskedasticityin standard errors. The Wald statistic for the significance of the leniency policy variables is presented in the estimates tables.The restricted (full) model is the model without (with) the leniency policy indicators. The relevant preleniency sample is priorto revision for telecom and prior to increase in fines for computer and petroleum.
Table 5: Goodness of Fit Results
7.1 Market Shares and Multi-market Contact
Gugler and Siebert (2007) study the e¤ect of mergers and RJV participation on �rms�
market shares in the semiconductor industry. They show that e¢ ciency gains realized from
a RJV overcompensate for increased market power when combined post-RJV market shares
of members are higher than combined pre-RJV shares. We note that if a �rm joins a RJV to
collude they expect no e¢ ciency gains. Hence, Gugler and Siebert (2007) provide a �rm-level
44
speci�cation check.64 Speci�cally, we consider whether various measures of RJV contact
result in lower post-RJV market shares, which would be consistent with increased market
power and suggestive of product market collusion. We estimate four speci�cations for each
market in the telecommunications, computer, and petroleum industries.
The �rst speci�cation (1) estimates current market share (sit) as a function of lagged
market share, an indicator variable that is equal to one if �rm i participated in a RJV in
period t; 1(in RJV )it, and year �xed e¤ects, �t :
sit = �0 + �1si;t�1 + �1(in RJV )it + �t + "it: (10)
Following Gugler and Siebert (2007) we correct for the endogeneity of lagged market share
using lagged patent stock (the number of accumulated patents of �rm i until period t �1) as an instrument and estimate the parameters by two-stage least squares (2SLS).65
Lagged patent stock captures e¢ ciency di¤erences across �rms and so should be correlated
with lagged market share. First-stage regressions indicate that patent stock is not a weak
instrument: the F-statistic is above 10 for all speci�cations and market de�nitions (Stock,
Wright, and Yogo, 2002). In speci�cation (2) we include the number of RJVs joined by
�rm i, denoted #RJVit, as an extra regressor. Again, we use lagged patent stock as an
IV for lagged market share and estimate by 2SLS. Speci�cation (3) considers the impact of
multi-market contact (facilitated by joining a RJV with at least one product market rival)
on market shares. It may be the case that the more multi-market contact a �rm has the
higher the collusive value of the RJV as �rms can punish competitors in multiple markets
(Cooper and Ross (2009). In this speci�cation we incorporate the number of RJVs joined by
�rm i with product market rivals, denoted (#RJV with rival)it. We estimate:
sit = '0 + '1si;t�1 + �11(in RJV )it ++�3(#RJV with rival)it + �t + "it; (11)
64 Duso, Roller, and Seldeslachts (2010) extend Gugler and Siebert to examine the impact of joining RJVson market shares across all 3-digit NAICS industries.
65 Patent stock data were obtained from the NBER U.S. Patent Citations Data File (Hall, et al, 2001).These contain information on almost 3 million U.S. patents starting in 1963 and programs that computepatent stock, which can be matched to �rm-identi�ers provided in Compustat.
45
by 2SLS using lagged patent stock as an IV for lagged market share. There may be
unobserved �rm-speci�c attributes that impact �rm market shares. In speci�cation (4) we
control for unobserved �rm-e¤ects by �rst di¤erencing and using the �rst di¤erence of lagged
market shares and lagged patent stocks as instruments for�sit�1 (Arellano and Bond, 1991).
These instruments will be correlated with �sit�1 but uncorrelated with the �rst di¤erence
of the �rm �xed e¤ects.
Table 6 gives the parameters estimates for all industries and market de�nitions. Across
all market de�nitions, the results of speci�cations (2), (3) or (4) show that the impact of
joining more RJVs (column labeled �Number of RJVs�) and/or increasing multi-market
contact (column labeled �Multimarket Contact�) results in a statistically signi�cant decline
in post-RJV market shares. These results suggest that joining more RJVs and in particular
joining more RJVs with rivals results in an increase in market power. These �ndings are
consistent with those presented in section 6 that RJVs serve a collusive function. Further-
more, these robustness results are more suggestive of collusive behavior in the Petroleum
markets than our RJV-�rm-speci�c results.
46

Market Definition Lagged Market Share In at least one RJV Number of RJVs Multimarket Contactand Specification Coefficient Std. Error Coefficient Std. Error Coefficient Std. Error Coefficient Std. Error
Telecom Research Area (1) 0.9778*** (0.0130) 0.0022*** (0.0007)Markets (2) 0.9904*** (0.0150) 0.0039*** (0.0015) 0.0013* (0.0007)
(3) 0.9900*** (0.0144) 0.0042*** (0.0015) 0.0012* (0.0007) 0.0001*** (0.0000)(4) 0.8570*** (0.0637) 0.0005 (0.0011) 0.0005 (0.0009) 0.0000 (0.0000)
Broadcast (1) 0.9397*** (0.0136) 0.0024** (0.0012)(2) 0.9580*** (0.0133) 0.0032** (0.0014) 0.0008** (0.0004)(3) 0.9043*** (0.0311) 0.0029** (0.0013) 0.0004 (0.0004) 0.0019*** (0.0006)(4) 0.9510*** (0.0499) 0.0018 (0.0011) 0.0006 (0.0005) 0.0001* (0.0001)
Wired (1) 0.9430*** (0.0169) 0.0031* (0.0017)(2) 0.9681*** (0.0153) 0.0044** (0.0021) 0.0012** (0.0006)(3) 0.9075*** (0.0322) 0.0044** (0.0019) 0.0008* (0.0004) 0.0027*** (0.0008)(4) 0.8845*** (0.0415) 0.0026 (0.0016) 0.0004 (0.0005) 0.0001 (0.0001)
FCC All Years (1) 0.9834*** (0.0112) 0.0071 (0.0066)(2) 0.9924*** (0.0059) 0.0140 (0.0108) 0.0037 (0.0023)(3) 0.9838*** (0.0122) 0.0133 (0.0102) 0.0036* (0.0020) 0.0042 (0.0031)(4) 0.9705*** (0.0344) 0.0015 (0.0013) 0.0006 (0.0004) 0.0001 (0.0001)
FCC Regulated Years (1) 1.0261*** (0.0114) 0.0079 (0.0076)(2) 1.0684*** (0.0206) 0.0273 (0.0202) 0.0102 (0.0073)(3) 1.0616*** (0.0166) 0.0271 (0.0198) 0.0102 (0.0071) 0.0046 (0.0032)(4) 0.9300*** (0.0230) 0.0043* (0.0025) 0.0013* (0.0008) 0.0000 (0.0001)
Computer Computer/Electronic (1) 0.9647*** (0.0072) 0.0004** (0.0002)Markets (2) 0.9650*** (0.0070) 0.0004* (0.0003) 0.0000 (0.0002)
(3) 0.9633*** (0.0072) 0.0004* (0.0003) 0.0000 (0.0002) 0.0001*** (0.0000)(4) 1.1298*** (0.0480) 0.0001 (0.0001) 0.0001 (0.0002) 0.0000 (0.0000)
Software Research Area (1) 1.0119*** (0.0285) 0.0017 (0.0011)(2) 1.0176*** (0.0278) 0.0043*** (0.0017) 0.0020*** (0.0007)(3) 1.0166*** (0.0280) 0.0046*** (0.0017) 0.0019*** (0.0007) 0.0000*** (0.0000)(4) 0.8095*** (0.1172) 0.0002 (0.0003) 0.0002 (0.0003) 0.0000*** (0.0000)
Computer Manufacturing (1) 0.9786*** (0.0116) 0.0028 (0.0022)(2) 0.9781*** (0.0114) 0.0012 (0.0055) 0.0012 (0.0036)(3) 0.9772*** (0.0127) 0.0017 (0.0055) 0.0012 (0.0036) 0.0008*** (0.0002)(4) 1.0962*** (0.1455) 0.0059 (0.0046) 0.0028 (0.0033) 0.0001 (0.0001)
Semiconductors (1) 0.9841*** (0.0426) 0.0021 (0.0034)(2) 1.0214*** (0.0229) 0.0157** (0.0064) 0.0108*** (0.0031)(3) 1.0209*** (0.0218) 0.0158** (0.0063) 0.0104*** (0.0031) 0.0004 (0.0003)(4) 0.5819*** (0.1452) 0.0060 (0.0039) 0.0038** (0.0018) 0.0002 (0.0001)
Memory/Microproc (1) 0.9119*** (0.0232) 0.0064 (0.0042)(2) 0.9528*** (0.0153) 0.0130* (0.0076) 0.0057* (0.0035)(3) 0.9352*** (0.0175) 0.0122* (0.0070) 0.0049* (0.0028) 0.0013*** (0.0004)(4) 1.0858*** (0.1337) 0.0025** (0.0010) 0.0028*** (0.0009) 0.0001 (0.0000)
Petroleum Coal/Crude Extraction (1) 1.0160*** (0.0145) 0.0040 (0.0028)Markets (2) 1.0215*** (0.0121) 0.0075 (0.0046) 0.0014** (0.0007)
(3) 1.0255*** (0.0125) 0.0077* (0.0046) 0.0013** (0.0006) 0.0001** (0.0000)(4) 0.7739*** (0.2350) 0.0007 (0.0010) 0.0004 (0.0004) 0.0001* (0.0000)
Energy Research Area (1) 0.9471*** (0.0651) 0.0057** (0.0024)(2) 0.9479*** (0.0654) 0.0083*** (0.0031) 0.0013** (0.0005)(3) 0.9512*** (0.0669) 0.0086*** (0.0030) 0.0011** (0.0005) 0.0002*** (0.0000)(4) 0.6599** (0.2977) 0.0004 (0.0005) 0.0001 (0.0001) 0.0000*** (0.0000)
Petroleum Refining (1) 1.0111*** (0.0112) 0.0014 (0.0018)(2) 1.0143*** (0.0104) 0.0041 (0.0032) 0.0009** (0.0005)(3) 1.0137*** (0.0100) 0.0038 (0.0030) 0.0007* (0.0004) 0.0009*** (0.0002)(4) 0.7043*** (0.2035) 0.0006 (0.0007) 0.0002* (0.0001) 0.0000 (0.0000)
Regressions include year fixed effects. Lagged patent stock is used as an IV for lagged market share in specifications (1)(3). Specification (4)controls for firm fixed effects following Arellano and Bond (1991). Robust standard errors clustered at the firmlevel are in parenthesis. *** indicatessignficant at the 1% level; ** at the 5% level; and * at the 10% level.
Table 6: 2SLS Market Share Regressions
7.2 Robustness Checks
Our �rst robustness check considers that, in our descriptive framework including controls
for observable industry, RJV, and �rm characteristics may not be su¢ cient as there may
47
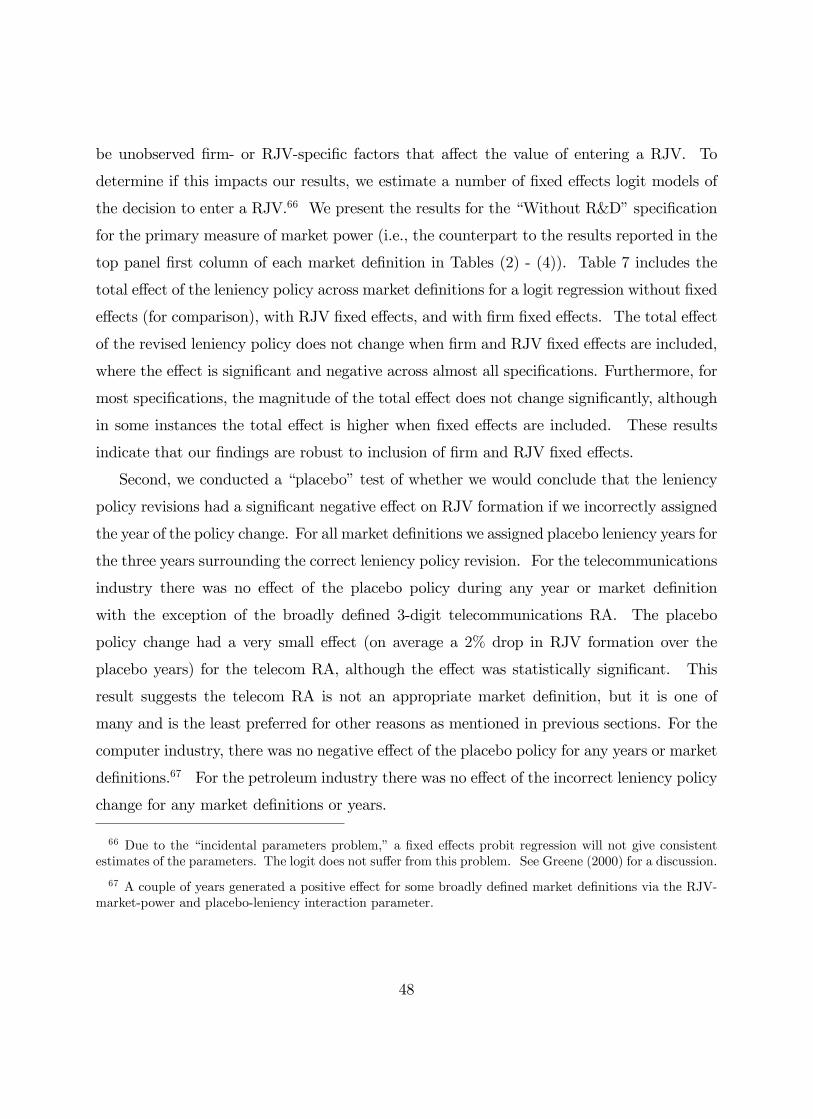
be unobserved �rm- or RJV-speci�c factors that a¤ect the value of entering a RJV. To
determine if this impacts our results, we estimate a number of �xed e¤ects logit models of
the decision to enter a RJV.66 We present the results for the �Without R&D�speci�cation
for the primary measure of market power (i.e., the counterpart to the results reported in the
top panel �rst column of each market de�nition in Tables (2) - (4)). Table 7 includes the
total e¤ect of the leniency policy across market de�nitions for a logit regression without �xed
e¤ects (for comparison), with RJV �xed e¤ects, and with �rm �xed e¤ects. The total e¤ect
of the revised leniency policy does not change when �rm and RJV �xed e¤ects are included,
where the e¤ect is signi�cant and negative across almost all speci�cations. Furthermore, for
most speci�cations, the magnitude of the total e¤ect does not change signi�cantly, although
in some instances the total e¤ect is higher when �xed e¤ects are included. These results
indicate that our �ndings are robust to inclusion of �rm and RJV �xed e¤ects.
Second, we conducted a �placebo�test of whether we would conclude that the leniency
policy revisions had a signi�cant negative e¤ect on RJV formation if we incorrectly assigned
the year of the policy change. For all market de�nitions we assigned placebo leniency years for
the three years surrounding the correct leniency policy revision. For the telecommunications
industry there was no e¤ect of the placebo policy during any year or market de�nition
with the exception of the broadly de�ned 3-digit telecommunications RA. The placebo
policy change had a very small e¤ect (on average a 2% drop in RJV formation over the
placebo years) for the telecom RA, although the e¤ect was statistically signi�cant. This
result suggests the telecom RA is not an appropriate market de�nition, but it is one of
many and is the least preferred for other reasons as mentioned in previous sections. For the
computer industry, there was no negative e¤ect of the placebo policy for any years or market
de�nitions.67 For the petroleum industry there was no e¤ect of the incorrect leniency policy
change for any market de�nitions or years.
66 Due to the �incidental parameters problem,� a �xed e¤ects probit regression will not give consistentestimates of the parameters. The logit does not su¤er from this problem. See Greene (2000) for a discussion.
67 A couple of years generated a positive e¤ect for some broadly de�ned market de�nitions via the RJV-market-power and placebo-leniency interaction parameter.
48
Industry Market Definition Included Total Effect of Wald PValueFixed Effects Leniency Policy Statistic
Telecom Research Area None 0.001** 8.784 0.012RJV 0.009*** 38.020 0.000Firm 0.024* 5.488 0.064
Broadcast None 0.011*** 13.420 0.001RJV 0.019** 9.233 0.010Firm 0.039 3.088 0.213
Wired None 0.018** 7.505 0.024RJV 0.026 4.140 0.126Firm 0.036 1.342 0.511
Long Distance All Years None 0.038 1.852 0.396RJV 0.593 4.171 0.124Firm 0.076 0.722 0.697
Long Distance Regulated None 0.001*** 16.060 0.000RJV 0.370*** 144.700 0.000Firm 0.032*** 36.980 0.000
Computer Computer/Electronic None 0.001*** 26.790 0.000RJV 0.034*** 36.360 0.000Firm 0.017** 19.520 0.000
Software Research Area None 0.001*** 23.480 0.000RJV 0.080*** 95.790 0.000Firm 0.167*** 16.690 0.000
Computer Manufacturing None 0.003** 9.225 0.010RJV 0.547*** 391.000 0.000Firm 0.040*** 17.050 0.000
Semiconductors None 0.001*** 12.330 0.002RJV 0.000 0.112 0.946Firm 0.005*** 10.300 0.006
Memory/Microproc None 0.002*** 9.751 0.008RJV 0.016 2.287 0.319Firm 0.009** 8.416 0.015
Petroleum Coal/Crude Extraction None 0.023*** 27.130 0.000RJV 0.473 2.014 0.156Firm 0.011* 5.719 0.057
Energy Research Area None 0.003* 5.238 0.073RJV 0.004 0.065 0.968Firm 0.574*** 49.000 0.000
Petroleum Refining None 0.028** 7.976 0.019RJV 0.144*** 9815.000 0.000Firm 0.084*** 14.740 0.001
Results are reported for the "Without R&D Effects" specifications using the primary measure of the RJV measure of market power.All regressions include same controls as in main specification including year dummies (and industry dummies for research areas).
Table 7: Fixed E¤ect Logit Results
Third, the estimates presented in the results section address potential serial correlation in
the errors by clustering. An alternative way to limit the e¤ects of potential serial correlation
is to run the regressions in a tighter window around the leniency policy. We estimated the
regressions using only data from 1991 to 1997. The results from this robustness check do
not change in sign or signi�cance, although the total e¤ect of the leniency policy revision is
smaller in magnitude for the 3-digit Computer market de�nitions and the Computer Man-
ufacturing market de�nition. Not surprisingly, given the restricted sample, the signi�cance
values are lower. The results suggest that the negative impact of the leniency policy on RJV
formation is not an artifact of the sample period.
Finally, to examine if our results are sensitive to limiting the set of RJVs which �rms can
49

enter (by considering speci�c markets), we estimated our model using a pooled sample of
�rms across all industries. Constructing a sample that consists of all possible �rm-year-RJV
combinations in all industries yields a dataset of unmanageable size. Therefore, we restricted
our analysis to �rms with complete Compustat data that joined a RJV (in a given year) and
a random sample of �rms that did not join (in a given year).68 Our pooled sample consists
of 1,651 �rms yielding 13,399 �rm years and 133,654 �rm-year-RJV observations. Firms in
the pooled sample undertake more R&D and have more assets, free cash, and sales than an
average Compustat �rm. Market concentration at the 6-digit NAICs is higher (0:280) than
at the 3-digit level (0:082).
Table 8 presents the results for the pooled sample across all 3-digit industries for both
R&D e¤ects speci�cations. Columns (1) and (4) include the post leniency policy revision
and its interaction with the RJV market power as regressors, for the Without R&D and
With R&D E¤ects, respectively. The results suggest that, holding industry, �rm, and RJV
characteristics constant, the revision of the leniency policy resulted in a signi�cant reduction
of the probability a �rm joins a RJV in the set of available RJVs open to the �rm regardless
of industry. The total e¤ect of the leniency policy is to reduce the probability of joining
by 1:5 to 4%, although the reduction is larger for RJVs among rivals (Columns (3) and
(6)) where it is 2 to 5:5%: The total e¤ects are all signi�cantly negative at the 1% level.
When the leniency policy indicator is interacted with the fragmentation measure of RJV
market power, in columns (2) and (5), the results indicate the leniency policy level e¤ect is
signi�cant and negative, but the interaction is signi�cant and positive resulting in an overall
positive e¤ect of the leniency policy. The impact is not signi�cant at the 1% level and
the magnitude is also small (1� 2%). One potential problem in interpreting the across all
industries results is that the RJV measure of market power di¤ers across industries and is
of a similar magnitude within industries. Hence, while industry �xed e¤ects are included as
68 As our selection criteria is whether a �rm joined a RJV there may be concern about sample selectionbias. However, selection bias is mitigated due to the panel aspect of our data. That is, since the data are a�rm-RJV-year panel, a �rm will potentially have a number of years in which it does not join a RJV, and anumber of years during which it could potentially join (i.e., other members of its industry have joined) butit does not. Hence this �rm is included among joiners in some years and non-joiners in others. In manyways the estimation strategy is to estimate a panel of the probability of joining but to include those �rmsthat never join to allow for systematic di¤erences between the two groups.
50

control variables, it may still be that the RJV market power e¤ects are re�ecting di¤erences
across industries in RJV market power. Furthermore, di¤erences across industries (such as
the degree of product homogeneity, the presence of many dispersed customers, etc.) may
in�uence the feasibility or the optimal structure of the partial cartel. These points further
motivate the necessity to examine �rm behaviors within more narrowly de�ned markets.
However, the exercise is useful as it presents an overall picture which is consistent with
our industry-speci�c results in that the e¤ect on average is negative and signi�cant, which
suggest our industry-speci�c �ndings are not due to a limiting of the potential choice set of
�rms.
Specification: Without R&D Effects With R&D EffectsSample: All All Treatment All All Treatment
(1) (2) (3) (4) (5) (6)Post Leniency Policy Dummy 0.178*** 0.247** 0.171*** 0.113* 0.195* 0.108*
(0.0645) (0.126) (0.0655) (0.0580) (0.115) (0.0591)RJV HHI 0.717*** 0.655*** 0.645*** 0.582***
(0.0726) (0.0759) (0.0711) (0.0719)RJV HHI*Post Leniency 0.331*** 0.292*** 0.301*** 0.266***
(0.0774) (0.0781) (0.0716) (0.0704)RJV HHI Fragmentation 0.716*** 0.629***
(0.0872) (0.0795)RJV HHI Fragmentation*Post Leniency 0.296** 0.276**
(0.128) (0.114)
Total Effect of Leniency Policy 0.0008*** 0.0002* 0.0011*** 0.0003*** 0.0004** 0.0004***Wald Test Statistic 19.57 5.450 15.54 17.84 6.960 14.50PValue 0.0001 0.0655 0.000422 0.0001 0.0308 0.0007Observations 222059 222059 146458 166916 166916 112747Notes: Robust standard errors clustered by firm are in parenthesis. An observation is a firmrjvyear combination. All specifications include the usualcontrols plus industry dummies. Total effect is computed at the mean of the regressors. * indicates significant at 10%; ** at 5%; *** at 1%.
Table 8: Estimates for Join a RJV for Pooled 3-Digit Industries
8 Conclusion
This paper examines an important and relatively unexplored issue: Do research joint ventures
serve as a collusive device? RJVs allow for easy communication among partners, and
members are granted antitrust protection. It is possible that permitting �rms to legally
collude in R&D may facilitate illegal collusion in the �nal goods market. If this is the case,
�rms may undertake RJVs for anticompetitive reasons with possible negative social welfare
repercussions. The question of whether collusive intensions may be facilitated by RJVs has
51
not been addressed in the empirical literature, and this paper �lls this gap.
To separately identify the intention to collude from other (legal) reasons to form a RJV
we take advantage of a shift in antitrust policy which made product market collusion more
di¢ cult to sustain. We exploit the variation in RJV formation generated by a revision to
the leniency policy that e¤ects the collusive bene�ts of a RJV but not the research synergies
associated with that venture.
We examine RJVs in three industries with a history of antitrust litigation that are char-
acterized by high multi-market contact via RJVs: telecommunications, computer manufac-
turing, and petroleum re�ning. We �nd that the leniency policy revision has a signi�cant
negative e¤ect on the probability of joining a RJV in telecommunications and computer
industries across market de�nitions. The results are robust to a variety of modi�cations and
speci�cations. Our �ndings are consistent with collusive behavior on the part of telecommu-
nications �rms (particularly over the years of telecom regulation) and computer manufac-
turers. We also �nd support for collusive behavior among petroleum re�ners. Our results
indicate the revised leniency policy reduces the average probability that telecom �rms join a
given RJV by 34%; the reduction among computer and semiconductor manufacturers is 33%;
and among petroleum re�ners the probability decreases by 27%: Furthermore, our �ndings
show that the higher the market power of the RJV the more collusive potential it has, which
generates a di¤erential e¤ect of the leniency policy on the probability of joining a RJV.
To the extent that antitrust authorities wish to detect and prohibit collusion brought about
through RJV formation, our results suggest they should be more concerned when RJVs have
a high joint market share relative to industry concentration.
52
References
Arellano, M. and S. Bond (1991) �Some Tests of Speci�cation for Panel Data: MonteCarlo Evidence and an Application to Employment Equations,�Review of EconomicStudies 58:277-97.
d�Aspremont, C. and A. Jacquemin (1988) �Cooperative and Noncooperative R&D inDuopoly with Spillovers,�American Economic Review, 78(5):1133-1137.
Baumol, W. (2001) �When is Inter�rm Coordination Bene�cial? The Case of Innova-tion,�International Journal of Industrial Organization, 19:727-737.
Berg, S., Duncan, J., and P. Friedman (1982) Joint Venture Strategies and CorporateInnovation, Cambridge: Oelgeschlager Gunn & Hain.
Bernheim, D. and M.Whinston (1990) �Multimarket Contact and Collusive Behavior,�Rand Journal of Economics, 21(1):1-26.
Bloch, F. (1995) �Endogenous Structures of Association in Oligopolies,�Rand Journalof Economics, 26(3):537-56.
Bos, I. (2009) Incomplete Cartels and Antitrust Policy: Incidence and Detection, Tin-bergen Institute, Thela Thesis.
Bos, I. and J. Harrington (2010) �Endogenous Cartel Formation with HeterogeneousFirms,�RAND Journal of Economics, 41(1):92-117.
Brodley, J. (1990) �Antitrust Law and Innovation Cooperation,�Journal of EconomicPerspectives, 4(3):97-112.
Brown, N. and J. Burns (2000) �Antitrust Violations,�American Criminal Law Review37:163-203.
Caloghirou Y. and N. Vonortas (2000) �Science and Technology Policies Towards Re-search Joint Ventures,�Final Report, Project SoE1-CT97-1075,TSER, European Com-mission, DG XII.
Cassiman, B. and R. Veugelers (2002) �R&D Cooperations and Spillovers: Some Em-pirical Evidence from Belgium,�American Economic Review, 92(4):1169-1184.
Cohen, W. and D. Levinthal (1989) �Innovation and Learning: The Two Faces ofR&D,�Economic Journal, 99(397):569-96
Compte, O., F. Jenny and P. Rey (2002) �Capacity Constraints, Mergers and Collu-sion,�European Economic Review, 46(1):1-29.
Connor, J. (2001) Global Price Fixing Boston Mass: Kluwer Academic Publishers

Connor, J. (2003) �Private International Cartels: E¤ectiveness, Welfare, and Anti-cartel Enforcement,�Working paper 03-12, Department of Agricultural Economics,Purdue University.
Cooper, R. and T. Ross (2009) �Sustaining Cooperation with Joint Ventures,�Journalof Law, Economics, and Organization, 25(1):31-54.
Duso, T., L. Roller, and J. Seldeslacts (2010) �Research Networks as a Collusive Tool:An Emprical Assessment,�mimeo.
Escrihuela-Villar, M. (2003) �Partial Cartels,�Doctoral Thesis, University of Alicante.
Ghosal, V. and J. Gallo (2001) �The Cyclical Behavior of the Departmentof Justice�s Antitrust Enforcement Activity,� International Journal of IndustrialOrganization,19:27-54.
Greene, W. (2000) Econometric Analysis, 4th ed., Prentice Hall, Engelwood Cli¤s.
Greenlee, P. and B. Cassiman (1999) �Product Market Objectives and the Formationof Research Joint Ventures,�Managerial and Decision Economics, 20:115-130.
Gugler, K. and R. Siebert (2007) �Market Power versus E¢ ciency E¤ects of Mergersand Research Joint Ventures: Evidence from the Semiconductor Industry,�Review ofEconomics and Statistics 89(4):645-659.
Hagedoorn, J., A. Link and N. Vonortas (2000) �Research Partnerships,�ResearchPolicy, 29(4-5).
Hall, B., A. Ja¤e and M. Tratjenberg (2001) �The NBER Patent Citation Data File:Lessons, Insights and Methodological Tools,�NBER Working Paper 8498.
Harrington, J (2006) �How do Cartels Operate?,�Foundations and Trends in Micro-economics, 2(1):1-105.
Hernan, R., P. Marin and G. Siotis (2003) �An Empirical Analysis of the Determinantsof Research Joint Venture Formation,�Journal of Industrial Economics, 51:75-89.
Huber, P., M. Kellogg and J. Thorne (1992) �The Geodesic Network II: 1992 Reporton Competition in the Telephone Industry,�Geodesic Co., Washington D.C.
Irwin D. and P. Klenow (1996) �High-tech R&D Subsidies: Estimating the E¤ects ofSematech,�Journal of International Economics 40:323-344.
Jorde, M. and D. Teece (1990) �Innovation and Cooperation: Implications for Com-petition and Antitrust,�Journal of Economic Perspectives, 4(3):75-96.
54

Kaiser, U. (2002) �An Empirical Test of Models Explaining Research Expendituresand Research Cooperation: Evidence for the German Service Sector,� InternationalJournal of Industrial Organization, 20:747-74.
Kobayashi, B. (2001) �Antitrust, Agency, and Amnesty: An Economic Analysis of theCriminal Enforcement of the Antitrust Laws Against Corporations,�George Washing-ton Law Review 69(5/6):715-744.
Kogut B. (1991) �Joint Ventures and the Option to Exapand and Acquire,�Manage-ment Science 37:19-33.
Lee, L. (1978) �Unionism and Wage Rates: A Simultaneous Equations Modelwith Qualitative and Limited Dependent Variables,�International Economic Review,19(2):415-433.
Levinstein, M. and V. Suslow (2006) �What Determines Cartel Success?�Journal ofEconomic Literature 44:43-95.
Link, A. (1996) �Research Joint Ventures: Patterns from Federal Register Filings,�Review of Industrial Organization, 11(5):617-628.
A. Link and L. Bauer (1989) Cooperative Research in US Manufacturing, LexingtonBooks.
MacAvoy, P.W. (1995) �Tacit Collusion under Regulation in the Pricing of InterstateLong-Distance Telephone Services,�Journal of Economics and Management Strategy4:147-185.
Maddala, G. (1983) Limited Dependent and Qualitatitve Variables in Econometrics,Cambridge University Press, Cambridge.
Majewski, S. and D. Williamson (2002) �Endogenous Spillovers, Strategic Blocking,and the Design of Contracts in Collaborative R&D: Evidence from the NCRA Filingsof R&D Joint Ventures,� Antitrust Division, US Department of Justice, EconomicAnalysis Group Working Paper.
Marin, P., G. Siotis and R. Hernan (2003) �An Empirical Evaluation of the Determi-nants of Research Joint Venture Formation,�Journal of Industrial Economics 51(1):75-89.
Martin, S. (1995) �R&D Joint Ventures and Tacit Product Market Collusion,�Euro-pean Journal of Political Economy 11:733-41.
Miller, N. (2009) �Strategic Leniency and Cartel Enforcement,�American EconomicReview, 99:750�768.
55

Nevo, A. (2000) �Mergers with Di¤erentiated Products: The Case of the Ready-to-EatCereal Industry,�Rand Journal of Economics 31(3):395-421.
Oum, T. and J. Park (1997) �Airline Alliances: Current Status, Policy Issues, andFuture Directions,�Journal of Air Transport Management 3:133-44.
Petit, M. and B. Towlinski (1999) �R&D Cooperation or Competition,� EuropeanEconomic Review, 43:185-208
Pittman R. and G. Werden (1990) �The Divergence of SIC Industries from AntitrustMarkets: Indications from Justice Department Merger Cases,� Economics Letters,33:283-286.
Reinganum, J. (1983) �Uncertain Innovation and the Persistence of Monopoly,�Amer-ican Economic Review, 73(4):741-748.
Roller, L., R. Siebert and M. Tombak (2007) �Why Firms Form (or do not Form)RJVS,�Economic Journal 117(522):1122-1144.
Scott, J. (1988) �Diversi�cation versus Cooperation in R&D Investment,�ManagerialDecision Economics, 9:173-86.
Scott, J. (1993) Purposive Diversi�cation and Economic Performance, New York:Cambridge University Press.
Shapiro, C. and R.Willig (1990) �On the Antitrust Treatment of Production JointVentures,�Journal of Economic Perspectives, 4(3):113-130.
Smith, A. (1776) An Inquiry into the Nature and Causes of the Wealth of Nations, W.Strahan and T. Cadell Publishers, London.
Snyder C. and N. Vonortas (2005) �Multiproject Contact in Research Joint Ventures:Evidence and Theory,�Journal of Economic Behavior and Organization 58:459-486.
Spagnolo, G. (1999) �On Interdependent Supergames: Multimarket Contact, Concav-ity, and Collusion,�Journal of Economic Theory,89(1):127-139.
Spagnolo, G. (2000) �Self Defeating Antitrust Laws: How Leniency Programs SolveBertrand�s Paradox and Enforce Collusion in Auctions,�mimeo, Stockholm School ofEconomics.
Spratling, G. (1999) �Negotiating the Waters of International Cartel Prosecutions,�Address to the Thirteenth Annual National Institute on White Collar Crime.www.usdoj.gov/atr/publi/speeches/2275.htm
56

Stock, J., J. Wright and M. Yogo (2002) �A Survey of Weak Instruments and WeakIdenti�cation in Generalized Method of Moments,�Journal of the American StatisticalAssociation, 20(4): 518�29.
van Wegberg, M. and A. van Witteloostuijn (1995) �Multicontact Collusion in ProductMarkets and Joint R&D Ventures: the Case of the Information Technology Industryin Integrating Europe,�Technical Change and the World Economy; Hagedoor (ed)Edward Elgar, Adlershot, United Kingdom.
Vonoras, N. (2000) �Multimarket Contact and Inter-Firm Cooperation in R&D,�Jour-nal of Evolutionary Economics 10:243-271.
Werden, G. (1988) �The Divergence of SIC Industries from Antitrust Markets: SomeEvidence from Price Fixing Cases,�Economics Letters, 28:193-197.
Yi, S. and H. Shin (2000) �Endogenous Formation of Research Coalitions withSpillovers,�International Journal of Industrial Organization 18:229-56.
Zivot, E. and D. Andrews (1992) �Further Evidence on the Great Crash, the Oil-PriceShock, and the Unit-Root Hypothesis,�Journal of Business and Economic Statistics,10(3):251-70.
57