Embed Size (px)
Citation preview

Warwick Circular Economy Cluster Initiative
Strategic Plan
Sarnia-Lambton Economic Partnership (SLEP)
March 31, 2018
WARWICK CIRCULAR ECONOMY CLUSTER INITIATIVE STRATEGIC PLAN
DISCLAIMER
The information, concepts and recommendations expressed in this document are based on information available at the time of the preparation of this document. Action or abstinence from acting based on the opinions and information contained in this document are the sole risk of the reader and Delphi shall have no liability for any damages or losses arising from use of the information and opinions in this document. All information is provided “as is” without any warranty or condition of any kind. The document may contain inaccuracies, omissions or typographical errors.
CONFIDENTIAL
This document should be treated as confidential business information and should not be shared outside of SLEP and the Township of Warwick without the expressed written consent of The Delphi Group.
Copyright © 2018 The Delphi Group
All rights reserved. The use of any part of this document, whether it is reproduced, stored in a retrieval system, or transmitted in any form or means (including electronic, mechanical, photographic, photocopying or recording), without the prior written permission of The Delphi Group is an infringement of copyright law.
Head Office: 428 Gilmour Street Ottawa, ON K2P 0R8 Canada Tel.: (613) 562-2005 Fax: (613) 562-2008 www.delphi.ca
Project Contact:
Paul Shorthouse [email protected]

WARWICK CIRCULAR ECONOMY CLUSTER INITIATIVE STRATEGIC PLAN
PREFACE The Sarnia-Lambton Economic Partnership and Warwick Township engaged The Delphi Group, in partnership with Reclay StewardEdge, to undertake research in order to identify opportunities for developing a “circular economy” cluster in the region to serve the province of Ontario, with a focus on the reuse, remanufacturing, recycling, and waste management sectors. The purpose of the study is to gain a better understanding of regional strengths, gaps, and opportunities for growing commercial activities in the circular economy, attracting new investment, and supporting local businesses in this space. The analysis considered both waste / resource diversion opportunities from the Twin Creeks landfill (e.g., potential future opportunities due to upcoming landfill bans and policy implications), as well as any high-level opportunities identified through the analysis of key industry sectors and companies in the Southwestern Ontario region that may be able to turn current waste streams into resource opportunities. Secondary research for the study, in support of this Strategic Plan, included undertaking a broad sweep of relevant websites, reports, and articles; collecting and analyzing relevant industry, policy and regulatory drivers and trends; aggregating relevant business / economic and workforce data; profiling examples of circular economy and cluster development activities; and assessing existing strengths, capabilities, and weaknesses of the regional “circular economy” supply chain. Consultation was also undertaken through 17 key informant interviews and a ‘virtual’ focus group webinar with local and provincial experts and stakeholders from government, business, and non-government organizations to gather insights on the regional opportunities and challenges. Participants in the interviews and webinar meeting included:
• Bioindustrial Innovation Canada
• Bluewater Recycling Association
• Bullfrog Power
• Canadian Fibers Ltd. (CFL)
• Canadian Plastic Industries Association (CPIA)
• Cascades Recovery Inc.
• The City of Toronto
• Emterra / Revital
• Enerkem
• Lambton College
• Ministry of Environment & Climate Change
(Government of Ontario)
• NOVA Chemicals
• Ontario Federation of Agriculture
• Ontario Waste Management Association
• PAC (the Packaging Consortium)
• Paper & Paperboard Packaging Environmental
Council (PPEC)
• Recycling Council of Ontario
• Sarnia-Lambton Economic Partnership (SLEP)
• Shift Recycling
• The Township of Warwick
• Waste Management of Canada
From this research, a strengths, weaknesses, opportunities, and threats (i.e., SWOT) analysis was undertaken and an Opportunities Evaluation Matrix was developed to help prioritize and score the opportunities across key criteria. In total, 14 specific opportunity areas were evaluated against the criteria, including pre-commercial / research initiatives, the concept of a ‘clean energy’ hub, and various segments of both municipal solid waste (MSW) and institutional, commercial, and industrial (IC&I) waste streams (e.g., mattress and carpet recycling). From this, a Strategic Plan (i.e., this document) was developed in order to help guide the Township of Warwick and the Sarnia-Lambton Economic Partnership prioritize next steps.

WARWICK CIRCULAR ECONOMY CLUSTER INITIATIVE STRATEGIC PLAN
TABLE OF CONTENTS
Executive Summary ..................................................................................... i
1.0 Introduction ........................................................................................... 1
1.1 Why a Circular Economy Hub for Warwick Township? ....................................................................................... 1
1.2 Overview of this Strategic Plan Document. ......................................................................................................... 3
2.0 Overview of Policy & Market Drivers ..................................................... 4
2.1 Policy Drivers. ...................................................................................................................................................... 4
2.2 Market Drivers..................................................................................................................................................... 6
3.0 Warwick’s Strengths & Weaknesses ..................................................... 7
3.1 Strengths & Capabilities ...................................................................................................................................... 7
3.2 Weaknesses & Gaps ............................................................................................................................................ 8
4.0 Overview of Highest Priority Opportunities .......................................... 10
4.1 Niche Industry Opportunities ............................................................................................................................ 10
4.2 Organics Processing & Compost Production ..................................................................................................... 13
4.3 Biogas & RNG Production .................................................................................................................................. 14
4.4 Mixed Plastics Recycling R&D ............................................................................................................................ 15
4.5 C&D Waste Processing ...................................................................................................................................... 16
4.6 Mixed Waste Processing ................................................................................................................................... 18
5.0 Strategic Plan ..................................................................................... 20
5.1 Strategic Goals & Actions .................................................................................................................................. 20
5.2 Implementation Timelines ................................................................................................................................ 27
5.3 Strategic Partners & Investment Attraction ...................................................................................................... 28
5.4 Risks ................................................................................................................................................................... 30

WARWICK CIRCULAR ECONOMY CLUSTER INITIATIVE STRATEGIC PLAN
Appendices ............................................................................................... 31
Appendix A: Ontario’s Circular Economy Policy Drivers .......................................................................................... 31
Appendix B: Current Status of Ontario’s Circular Economy .................................................................................... 39
Appendix C: Waste Diversion in Southern Ontario ................................................................................................. 50
Appendix D: Southern Ontario Industry Profile ...................................................................................................... 53
Appendix E: Relevant Research & Innovation Activities ......................................................................................... 59
Appendix F: SWOT Analysis ..................................................................................................................................... 63
Appendix G: Circular Economy Opportunities by Key Industry ............................................................................... 66
Appendix H: Feasibility Assessment for Top Opportunities .................................................................................... 69
Appendix I: Innovation & Climate Change Funding Mechanisms ........................................................................... 74
WARWICK CIRCULAR ECONOMY CLUSTER INITIATIVE STRATEGIC PLAN
i
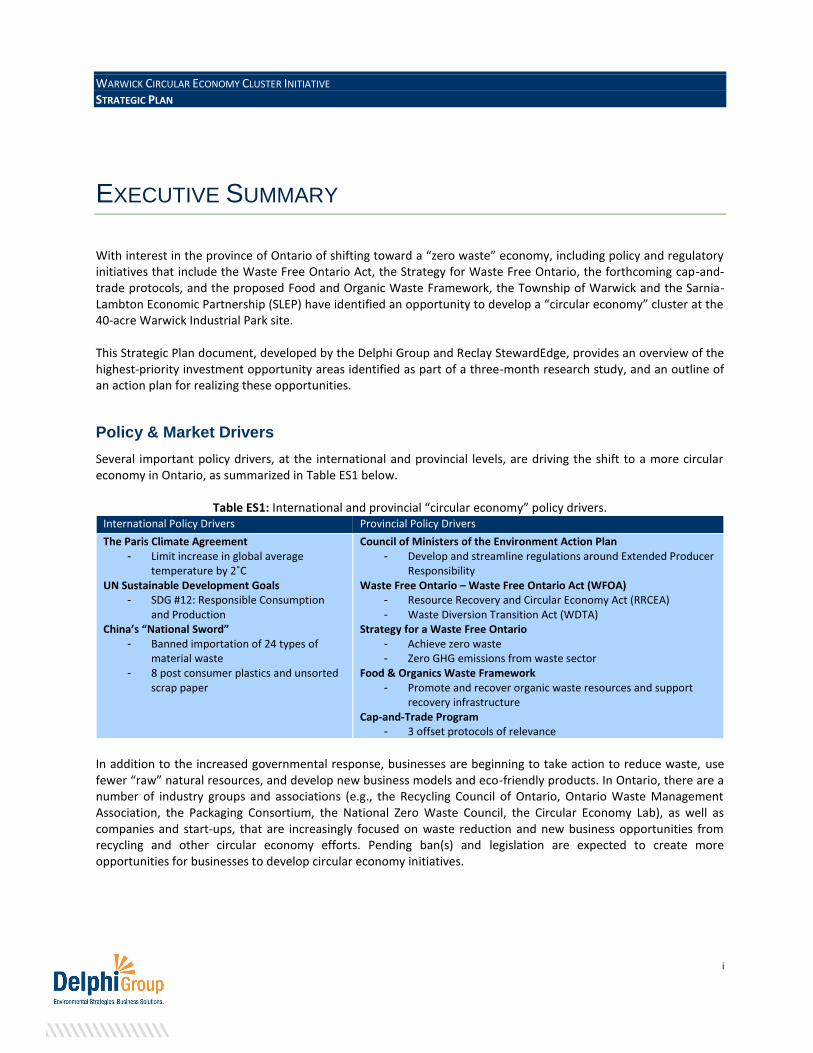
EXECUTIVE SUMMARY With interest in the province of Ontario of shifting toward a “zero waste” economy, including policy and regulatory initiatives that include the Waste Free Ontario Act, the Strategy for Waste Free Ontario, the forthcoming cap-and-trade protocols, and the proposed Food and Organic Waste Framework, the Township of Warwick and the Sarnia-Lambton Economic Partnership (SLEP) have identified an opportunity to develop a “circular economy” cluster at the 40-acre Warwick Industrial Park site. This Strategic Plan document, developed by the Delphi Group and Reclay StewardEdge, provides an overview of the highest-priority investment opportunity areas identified as part of a three-month research study, and an outline of an action plan for realizing these opportunities.
Policy & Market Drivers
Several important policy drivers, at the international and provincial levels, are driving the shift to a more circular economy in Ontario, as summarized in Table ES1 below.
Table ES1: International and provincial “circular economy” policy drivers. International Policy Drivers Provincial Policy Drivers
The Paris Climate Agreement - Limit increase in global average
temperature by 2˚C UN Sustainable Development Goals
- SDG #12: Responsible Consumption and Production
China’s “National Sword” - Banned importation of 24 types of
material waste - 8 post consumer plastics and unsorted
scrap paper
Council of Ministers of the Environment Action Plan - Develop and streamline regulations around Extended Producer
Responsibility Waste Free Ontario – Waste Free Ontario Act (WFOA)
- Resource Recovery and Circular Economy Act (RRCEA) - Waste Diversion Transition Act (WDTA)
Strategy for a Waste Free Ontario - Achieve zero waste - Zero GHG emissions from waste sector
Food & Organics Waste Framework - Promote and recover organic waste resources and support
recovery infrastructure Cap-and-Trade Program
- 3 offset protocols of relevance
In addition to the increased governmental response, businesses are beginning to take action to reduce waste, use fewer “raw” natural resources, and develop new business models and eco-friendly products. In Ontario, there are a number of industry groups and associations (e.g., the Recycling Council of Ontario, Ontario Waste Management Association, the Packaging Consortium, the National Zero Waste Council, the Circular Economy Lab), as well as companies and start-ups, that are increasingly focused on waste reduction and new business opportunities from recycling and other circular economy efforts. Pending ban(s) and legislation are expected to create more opportunities for businesses to develop circular economy initiatives.

WARWICK CIRCULAR ECONOMY CLUSTER INITIATIVE STRATEGIC PLAN
ii
Local Strengths & Weaknesses
While the policy and market drivers toward a circular economy are growing and leading to a range of possible opportunities, it is important to consider the unique strengths and capabilities of the Township of Warwick and the surrounding region, as well as potential weaknesses that may impact on success for developing a regional circular economy hub. Warwick’s key assets are outlined in the bullet points in Table ES2 below.
Table ES2: Warwick’s strengths and weaknesses relevant to developing a circular economy hub. Strengths & Capabilities Weaknesses & Gaps
• Accessible & strategic location
• Twin Creeks Landfill & Industrial Park
• Strong community & educated workforce
• Favourable investment environment
• Access to local industries
• Proximity to innovation & research centers
• Relatively small population
• Proximity to larger urban centers
• Limited diversity of industry & employment opportunities
• Lack of existing infrastructure
• Limited waste management service providers
• Lack of available waste stream data
• Competition with surrounding research & innovation hubs
Highest Priority Opportunities
With the above strengths and weaknesses in mind, an opportunities evaluation matrix was developed that reviewed and scored 14 specific opportunities for consideration. The opportunities were assessed against criteria such as current and potential future policy drivers, the potential market size and maturity, uniqueness of the opportunity, local capacity and infrastructure, and potential partners. From this initial assessment, six primary opportunities of highest priority were identified, structured around three strategic areas and along various timelines, as outlined in the table below.
Strategic Area #1: Local Industry “Niche” Opportunities
Time horizons: Immediate (1+ years)
Description: Given the surrounding existence of a number of key industries, including the petro-chemical manufacturing, agriculture / food production, and service sectors, a number of niche opportunities exist that present immediate opportunities for consideration. These niche opportunities are, for the most part, company-specific (or relevant to a small number of local companies in the region within a specific industry). Specific opportunities identified include:
1. Agricultural waste collection and recycling 2. IPA wax recycling 3. Electronics waste recycling and destruction 4. Furniture and household goods refurbishment
Strategic Area #2: Organic Waste Stream Opportunities
Time horizons: Immediate (1+ years) to medium-term (2-3+ years)
Description: Considering the local agriculture industry, a centralized composting and/or anaerobic digestion (AD) facility set up in the Warwick Industrial Park site could be used to process organic material into biogas / renewable natural gas, compost, and/or value-add fertilizers to supply both the local and regional markets. The food production / processing industry in Southwestern Ontario may also be a suitable source for providing feedstock.

WARWICK CIRCULAR ECONOMY CLUSTER INITIATIVE STRATEGIC PLAN
iii
Strategic Area #3: Plastics, Mixed Waste & C&D Processing
Time horizons: Medium (2-3+ years) to longer-term (3-5+ years)
Description: Establishing a mixed plastics research and development (R&D) centre (including for flexible packaging and black plastics) in Warwick’s Real-Flex facility presents a pre-commercial opportunity that could fit as part of a broader initiative to leverage innovation funding and research focused on recycling and sorting equipment / technology and related piloting of new solutions with government and industry partners at the table. Given proximity to Bluewater, there is an opportunity to conduct pilot projects to recover flexible packaging and send them to the R&D facility for testing. Over the longer-term and depending somewhat on incoming policies (including landfill bans and EPR regulations) as well as funding / incentive programs, there may be opportunities to establish a construction and demolition (C&D) processing facility and/or a mixed-waste materials recovery facility (MRF) leveraging existing institutional, commercial, and industrial (IC&I) and municipal solid waste (MSW) streams through recycling, refurbishment and/or remanufacturing of materials. A “dirty” MRF as it is sometimes referred to is an advanced mixed-waste sortation facility that allows for ‘black bag’ solid wastes to be processed, allowing for more overall recycled materials to be captured from the waste stream prior to disposal / landfilling. As per the Ontario Waste Management Association, the C&D recycling market is underserviced, with waste streams largely entering local landfills in Ontario or being transported to the United States.
Strategic Plan
The Delphi Group and Reclay StewardEdge propose three strategic goals focused on developing a circular economy cluster for the Warwick Industrial Park. These three key goals are inline with the market and policy-focused research for this study, as well as shaped from the input of various industry stakeholders consulted as part of this project. The goals that guide this Strategic Plan are outlined below.
• Goal 1: Establish the Warwick Industrial Park as a leading hub in Canada for circular economy activities by 2023.
• Goal 2: Establish new markets over the next 12-24 months for local industry waste and resource streams.
• Goal 3: Over the next 5 years, align with incoming regulations and incentives to capitalize on longer-term provincial waste-to-resource streams.
Associated with each of these goals are specific strategies and detailed action items that allow key decision-makers and implementers to prioritize and act upon these strategies. A summary of the three goals and their underlying strategies and actions are summarized in the tables below.

WARWICK CIRCULAR ECONOMY CLUSTER INITIATIVE STRATEGIC PLAN
iv
Goal 1: Establish the Warwick Industrial Park as a leading hub in Canada for circular economy activities by 2023.
Warwick’s Industrial Park presents a unique opportunity for developing a leading centre for innovation and business development, centered around the concept of a co-location, circular economy hub. In order to be successful, it will be important for the Township of Warwick and the Sarnia-Lambton Economic Partnership to raise awareness and promote the opportunities with key government leaders and agencies, private sector companies and investors active in the sector, and other industry leaders.
Strategies Actions
Strategy 1.1: Raise awareness and promote the opportunities widely
• Develop a stakeholder engagement and communications plan.
• Participate in and host events focused on relevant circular economy topics.
Strategy 1.2: Establish strategic partners and a network of potential investors
• Establish strategic partnerships with key industry associations and government agencies.
• Target specific private sector companies and investors inline with the Strategic Plan and identified opportunity areas.
Goal 2: Establish new markets over the next 12-24 months for local industry waste and resource streams.
Lambton County and nearby Sarnia region has a mix of industry within close geographic proximity to Warwick Township and its Industry Park site. Some of these industries have small but potentially valuable waste streams that can be leveraged for new business ventures, including the nearby petro-chemicals industry and the agricultural sector. A key activity over the next 1-2 years will be to more thoroughly investigate the local waste-resource stream opportunities and develop strategic partnerships with lead proponents to grow these business opportunities.
Strategies Actions
Strategy 2.1: Leverage existing and identify new potential niche opportunities from surrounding industry
• Engage with a network of local artisans and develop a local ‘maker-space’.
• Work with the petrochemicals industry to further investigate local supply of IPA wax and engage potential commercial interests.
• Work with local farmers to recycle existing agricultural waste streams that are currently under-serviced.
• Determine potential for an electronics waste (e-waste) recycling and destruction business within the Warwick Industrial Park.
• Undertake further research over next 6 months to identify specific waste streams that could be turned into resource opportunities.
• Host an industrial symbiosis workshop in Warwick Township or surrounding region.
• Develop 10+ strategic partnerships with local industry players and/or investors over next 12 months.
Strategy 2.2: Develop an organics composting facility in the Warwick Industrial Park
• Over the next 12 months, undertake a more detailed feasibility study to establish the parameters for an organics composting facility in the Warwick Industrial Park.
• Secure zoning requirements and permitting to enable the construction of the composting facility.
• Identify and secure lead proponent who will actively build and manage the composting facility.
WARWICK CIRCULAR ECONOMY CLUSTER INITIATIVE STRATEGIC PLAN
v
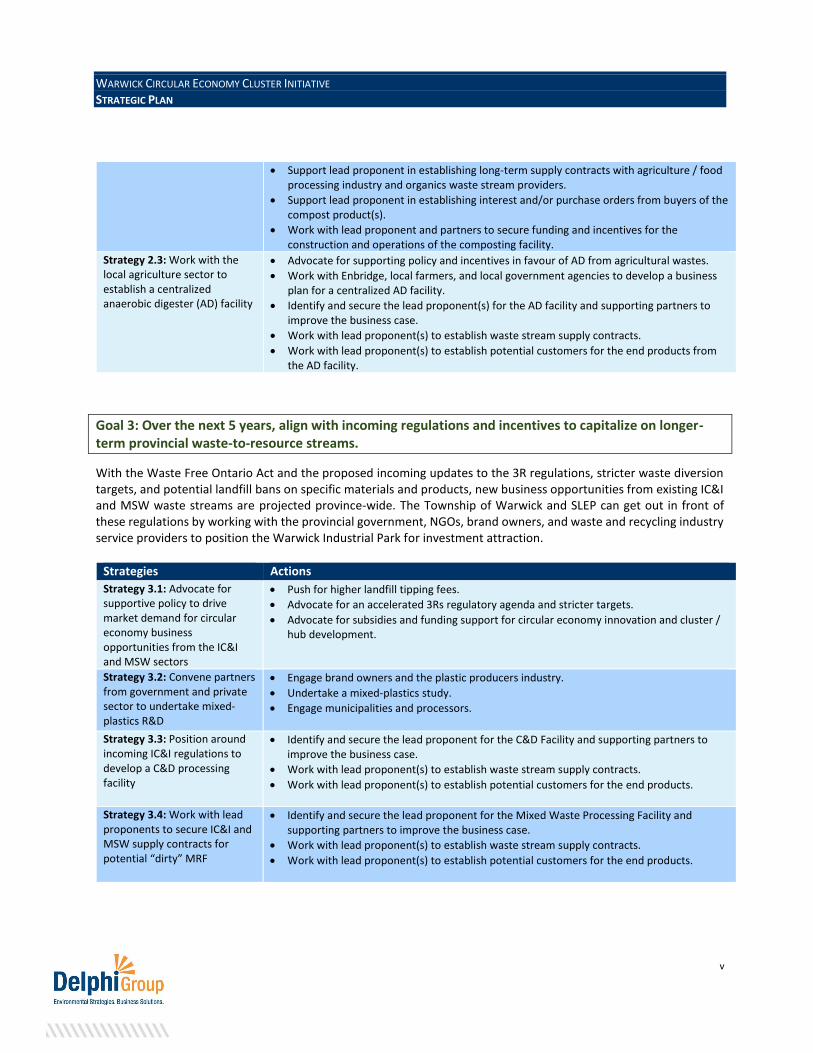
• Support lead proponent in establishing long-term supply contracts with agriculture / food processing industry and organics waste stream providers.
• Support lead proponent in establishing interest and/or purchase orders from buyers of the compost product(s).
• Work with lead proponent and partners to secure funding and incentives for the construction and operations of the composting facility.
Strategy 2.3: Work with the local agriculture sector to establish a centralized anaerobic digester (AD) facility
• Advocate for supporting policy and incentives in favour of AD from agricultural wastes.
• Work with Enbridge, local farmers, and local government agencies to develop a business plan for a centralized AD facility.
• Identify and secure the lead proponent(s) for the AD facility and supporting partners to improve the business case.
• Work with lead proponent(s) to establish waste stream supply contracts.
• Work with lead proponent(s) to establish potential customers for the end products from the AD facility.
Goal 3: Over the next 5 years, align with incoming regulations and incentives to capitalize on longer-term provincial waste-to-resource streams.
With the Waste Free Ontario Act and the proposed incoming updates to the 3R regulations, stricter waste diversion targets, and potential landfill bans on specific materials and products, new business opportunities from existing IC&I and MSW waste streams are projected province-wide. The Township of Warwick and SLEP can get out in front of these regulations by working with the provincial government, NGOs, brand owners, and waste and recycling industry service providers to position the Warwick Industrial Park for investment attraction.
Strategies Actions
Strategy 3.1: Advocate for supportive policy to drive market demand for circular economy business opportunities from the IC&I and MSW sectors
• Push for higher landfill tipping fees.
• Advocate for an accelerated 3Rs regulatory agenda and stricter targets.
• Advocate for subsidies and funding support for circular economy innovation and cluster / hub development.
Strategy 3.2: Convene partners from government and private sector to undertake mixed-plastics R&D
• Engage brand owners and the plastic producers industry.
• Undertake a mixed-plastics study.
• Engage municipalities and processors.
Strategy 3.3: Position around incoming IC&I regulations to develop a C&D processing facility
• Identify and secure the lead proponent for the C&D Facility and supporting partners to improve the business case.
• Work with lead proponent(s) to establish waste stream supply contracts.
• Work with lead proponent(s) to establish potential customers for the end products.
Strategy 3.4: Work with lead proponents to secure IC&I and MSW supply contracts for potential “dirty” MRF
• Identify and secure the lead proponent for the Mixed Waste Processing Facility and supporting partners to improve the business case.
• Work with lead proponent(s) to establish waste stream supply contracts.
• Work with lead proponent(s) to establish potential customers for the end products.

WARWICK CIRCULAR ECONOMY CLUSTER INITIATIVE STRATEGIC PLAN
vi
Risks & Considerations The Strategic Plan identifies a number of risks that may influence negatively on the success of the Goals and Strategies outlined in this document, as listed in the bullets below.
• Potential changes in government that could shift the policy focus away from circular economy and incoming waste regulations.
• Timelines around policies, regulations, and program roll-outs provide uncertainty.
• Limited market demand for recycled / refurbished products.
• Threat of operating under the “status quo”.
• Current low energy costs creating financial barriers.
• Proximity to the United States may negatively influence on investment decisions in Canada versus the United States.
Developing mitigating approaches to these risks will help ensure a higher likelihood of success.

WARWICK CIRCULAR ECONOMY CLUSTER INITIATIVE STRATEGIC PLAN
1
1.0 INTRODUCTION
1.1 Why a Circular Economy Hub for Warwick Township?
Situated in Lambton County (pop. 126,199) in Southwestern Ontario, Warwick Township is located approximately 40 kilometers between the Cities of London and Sarnia on the Highway 402 corridor. The region has a strong industrial base that includes agriculture and food processing, chemical and petro-chemical manufacturing, and construction products and materials. Warwick is also home to the Twin Creeks landfill, the second largest of such facilities in Ontario, managed by Waste Management of Canada Corp. The Township of Warwick’s 2015-2020 Strategic Plan identifies using alternative forms of energy, minimizing the consumption of resources and the impact on the local environment, and attracting businesses that are committed to producing environmentally-friendly products as core tenets of its vision – all of which are consistent with the concept of a circular economy. A circular economy “is a comprehensive framework for thinking about how materials and energy would flow in a fully sustainable, low-carbon economy1.” It can help communities reduce dependency on materials and natural resources, divert materials from landfills, improve resource productivity, and create economic growth and employment opportunities.
The circular economy’s sustainable production and consumption model differs from the traditional and widespread linear economy based on a “make-use-discard” model that consumes finite resources to create products that end up in landfills. A high-level description of how products and materials move through a linear economy is illustrated in Figure 1.
Source: Veolia2
Figure 1: Linear Economy Diagram
1 http://institute.smartprosperity.ca/sites/default/files/spipolicybrief-circulareconomy.pdf 2 https://www.veolia.co.uk/our-approach/our-vision-and-strategy

WARWICK CIRCULAR ECONOMY CLUSTER INITIATIVE STRATEGIC PLAN
2
Source: Ministry of Environment and Climate Change (Government of Ontario)3
Figure 2: Circular Economy Diagram
A circular economy moves toward a systems-based model “…that is restorative and regenerative by design, and which aims to keep products, components and materials at their highest utility and value at all times, distinguishing between technical and biological cycles4.” Figure 2 provides a high-level view of how materials move through a circular economy.
Products in a circular economy are designed with their entire life-cycle in mind (eco-design) so that when it comes time for the product’s disposal, waste can be minimized through reuse, refurbishing, remanufacturing, and recycling. Instead of treating products as waste when they are no longer useable, they are treated as a resource that can be upcycled. Circular economies use less natural resources, reduce the amount of residuals/material losses, reduce emissions, increase the use of renewable resources and energy, and aim to maximize the value of materials.
With interest in the province of Ontario focused on shifting to a more circular economy model, including recent policy and initiatives such as the Waste Free Ontario Act, the Strategy for Waste Free Ontario, the forthcoming cap-and-trade protocols, and the proposed Food and Organic Waste Framework, the Township of Warwick and the Sarnia-Lambton Economic Partnership have identified the opportunity to develop a “circular economy” cluster at the 40-acre Warwick Industrial Park site, which includes the Warwick Real-Flex Facility which offers low-cost flexible units for lease or purchase ideal for commercial, professional, administrative, light-industrial, light manufacturing, and/or storage and warehousing activities. This Strategic Plan lays out a proposed roadmap for action.
3 https://files.ontario.ca/finalstrategywastefreeont_eng_aoda1_final-s.pdf 4 Definition of a circular economy is from the Ellen MacArthur Foundation, a foundation dedicated to accelerating a transition to a circular economy.
WARWICK CIRCULAR ECONOMY CLUSTER INITIATIVE STRATEGIC PLAN
3
1.2 Overview of this Strategic Plan Document.
To support the development of Warwick’s Circular Economy Cluster, this Strategy document provides an overview of the highest-priority investment opportunity areas identified through this research and an outline of an action plan for realizing the opportunities. This document is broken out into the following chapters:
• Chapter 2: Provides an overview of the key market and policy drivers.
• Chapter 3: Provides a profile of Warwick’s primary strengths / capabilities and weaknesses / gaps with respect
to developing a circular economy cluster in the region.
• Chapter 4: Provides an overview of highest priority opportunity areas identified through the research and
consultation as part of developing this Strategic Plan.
• Chapter 5: Provides specific details on the recommended goals, strategies, and actions, as well as timelines, a
list of potential partners, and identified risks of the Strategy.
In addition, the Appendices include a range of additional information, data, and evidence in support of this Strategic Plan.
WARWICK CIRCULAR ECONOMY CLUSTER INITIATIVE STRATEGIC PLAN
4
2.0 OVERVIEW OF POLICY & MARKET DRIVERS
2.1 Policy Drivers.
In recent years, there have been a number of key market drivers and initiatives that are enabling the development of a more circular economy. These include research and development of more eco-friendly products and processes using fewer “raw” natural resources; the heightened awareness and governmental response on climate change; the rise of policy and financial incentives; the increasing demand from consumers for more environmental-friendly products; resource scarcity issues; and the development of new business models and opportunities.
At the international level, government action on global challenges, such as climate change and sustainable development, have been two of the most significant stimuluses for the circular economy. Some key, all-encompassing policy efforts focused on driving and enabling a more circular economy globally include:
• The Paris Climate Agreement. Signed by 195 countries in 2015, aims to limit the increase in global average temperatures to well below two degrees Celsius above pre-industrial levels. The circular economy is considered a key tool to help governments limit their emissions and reduce their impact as it seeks to encourage and reward a more effective use of scarce resources while enabling product design innovation and regeneration. Recent studies have demonstrated that 44% to 70% of emissions could be cut the next few decades if circular economy, energy efficiency and renewable energy regulations and policies were adopted. With the UN reporting that global consumption is set to triple by 20505, policy has begun to shift towards using business ingenuity in a way that demands and rewards producers who take steps to reduce waste, resources and emissions.
• The UN’s Sustainable Development Goals (SDG). SDG #12, Responsible Consumption and Production, which focuses on sustainable consumption and production and resource and energy efficiency6 aligns with the concept of the circular economy. As the 193 countries that have adopted the SDGs, including Canada, begin to take action, there will be a greater governmental push for industry and organizations to integrate circular economy strategies. Canada has adopted the SDGs and aligned its 2016-2019 Federal Sustainable Development Strategy with them.
• China’s “National Sword”. In 2017, the Chinese government through its National Sword policy banned importation of 24 types of materials into China, including eight types of postconsumer plastics and unsorted scrap paper. The policy is intended to address increasing levels of contamination being sold as commodities and forcing Chinese companies to deal with it. Although the Chinese government began its crackdown on imports in 2013 (Operation Green Fence) by rejecting loads of scrap material that did not meet certain standards, all-out bans of certain recyclables recently have been proclaimed and the National Sword customs crackdown has been underway since early 2017. The Institute of Scrap Recycling Industries (ISRI) estimates that the proposed ban would affect 2.9 million tons or $532 million (USD) of U.S. mixed paper and plastics exports, leaving nations without waste management solutions scrambling to find alternatives. However, this presents Ontario with an opportunity to address these issues as it is moving towards full producer responsibility.
5 Global Resource Consumption, United Nations: https://phys.org/news/2011-05-global-resource-consumption-triple.html 6 See: https://sustainabledevelopment.un.org/?menu=1300

WARWICK CIRCULAR ECONOMY CLUSTER INITIATIVE STRATEGIC PLAN
5
At the provincial level, current and emerging policies that are focused on reducing waste and driving circular economy principles include the policy-related initiatives described in the bullet points below.
• Council of Ministers of the Environment Action Plan. In 2009, the Canadian Council of Ministers of the Environment (CCME) approved the Canada-wide Action Plan for Extended Producer Responsibility of 2009 (CAP-EPR)7, which would develop and streamline regulations around Extended Producer Responsibility (EPR). EPR increases the scope of producer responsibility to “the postconsumer stage of [their] product’s life cycle.” The objective is to increase diversion and producers’ awareness of end-of-life management and shift the physical and financial burden onto producers. These programs would improve the overall life-cycle performance of products, reduce associated GHG emissions and drive towards more circular economy efforts. Committed jurisdictions that are working to incorporate operational EPR programs for the following products may represent key opportunities for the circular economy: construction materials; demolition materials; furniture, textiles and carpet; and appliances, including ozone-depleting substances.
• Waste Free Ontario. In 2016, Ontario passed the Waste Free Ontario Act8 (WFOA), which consists of two acts: (i) Resource Recovery and Circular Economy Act (RRCEA) and (ii) Waste Diversion Transition Act (WDTA). The aim of the acts are to eliminate waste going to landfills, create jobs, and fight climate change. Under this legislation, producers will be responsible for the full cost associated with the end-of-life management of their products and packaging – in other words, producer responsibility will shift to 100%. Overall, the WFOA and its subsequent policies and regulation will create economic opportunities. According to a Conference Board of Canada study, increasing overall waste diversion rate to 60% could create close to 13,000 net new jobs in Ontario and increase GDP by $1.5 billion.
• Strategy for a Waste Free Ontario. The Strategy for Waste Free Ontario9 provides a provincial strategic plan to fight climate change by reducing landfilled materials and developing a circular economy. It is driven by two aspirational goals: (i) to achieve zero waste, and (ii) to have zero greenhouse gas (GHG) emission from the waste sector. The Strategy mentions that there will be amendments to the 3Rs Regulations (Regulation 102) based on the Waste Free Ontario Act with the goal to help the institutional, commercial, and industrial (IC&I) sector understand their waste streams and develop plans to reduce, reuse and/or recycle their waste10. The IC&I sector currently diverts approximately 13% of its waste. One of the most relevant actions under the Strategy is to implement disposal bans on identified materials. The first materials considered for disposal bans include: food waste; materials designated under existing waste diversion programs; beverage containers; corrugated cardboard and some paper materials; and fluorescent bulbs and tubes. Mattresses, carpets, clothing and textiles, and furniture are also rumoured to be planned for a disposal ban but this has not been formally confirmed11. This Strategy and the forthcoming disposal bans provide opportunities to create circular economy hubs for materials, especially ones that would increase the value of recycled materials.
7 Canada Wide Action Plan, CCME: https://www.ccme.ca/files/Resources/waste/extended/CAP-EPR%20Progress%20Report.pdf 8 Bill 151, Waste-Free Ontario Act, 2016: http://www.ontla.on.ca/web/bills/bills_detail.do?locale=en&BillID=3598 9 Strategy for WFO: https://www.ontario.ca/page/strategy-waste-free-ontario-building-circular-economy 10 Strategy for Waste Free Ontario: https://www.ontario.ca/page/strategy-waste-free-ontario-building-circular-economy#foot-19 11 IBID.

WARWICK CIRCULAR ECONOMY CLUSTER INITIATIVE STRATEGIC PLAN
6
• The Food and Organics Waste Framework. The Food and Organic Waste Framework was introduced in November 2017 to help reduce the 3.6 million tons of organic and food waste in Ontario, promote and recover organic waste resources, and support recovery infrastructure. This Framework could set a 40% organic waste diversion target by 2025 and 60% by 203512. The benefit of diverting organics will not only save landfill space and reduce GHGs, but will also create economic benefits. It is estimated that every 1,000 tons of organic waste diverted generates 60% more GDP and 40% more jobs than landfilling13.
More on these policy drivers can be found in Appendix A.
2.2 Market Drivers.
In addition to the increased governmental response, businesses are beginning to take action to reduce waste, use fewer “raw” natural resources, and develop new business models and eco-friendly products. Circular economy initiatives led by producers across industries are creating new sharing and leasing platforms that move towards more service-based models. Producers are also increasing the recyclability and reparability of products, the recycled or renewable content in products, and their ability to remanufacture products and parts. Large multi-national corporation taking action to reduce their waste include BASF, DuPont, Danone, Sony, Bayer, Levi’s, H&M, Adidas, Nike, IKEA, Dell, Ford, and many others. Companies such as Tetra Pak, Kellogg, Unilever, Walmart, and others have set aggressive sustainability and zero waste goals. In Ontario, there are a number of industry groups / associations (e.g., the Recycling Council of Ontario, Ontario Waste Management Association, the Packaging Consortium, the National Zero Waste Council, the Circular Economy Lab), as well as companies and start-ups, that are increasingly focused on waste reduction and new business opportunities from recycling and other circular economy efforts. Pending ban(s) and legislation are expected to create more opportunities for businesses to develop circular economy initiatives. More information and examples of the industry groups and businesses working on circular economy principles can be found in Appendix B.
12 Strategy for Waste Free Ontario: https://www.ontario.ca/page/strategy-waste-free-ontario-building-circular-economy#foot-19 13 Ministry of the Environment and Climate Change: http://www.downloads.ene.gov.on.ca/envision/env_reg/er/documents/2015/012-5834_DraftStrategy.pdf

WARWICK CIRCULAR ECONOMY CLUSTER INITIATIVE STRATEGIC PLAN
7
3.0 WARWICK’S STRENGTHS & WEAKNESSES
3.1 Strengths & Capabilities
The Township of Warwick has a number of key strengths that create opportunities for developing a circular economy cluster in the area with a focus on recycling, reuse, and remanufacturing. Warwick’s key assets are outlined in the bullet points below.
• Accessible and strategic location Warwick is connected to major transportation corridors (King’s Highways 401 and 402), which not only connect the town to Toronto and the broader Greater Toronto Area, but also to the United States. The town is also located near the major industries in Lambton County. Given the proximity to industry and major cities/routes, promoting Warwick as circular economy hub with a focus on the reuse, recycling, waste and remanufacturing sector has the potential to attract new business.
• Strong community and educated workforce The town is a small rural community with a population of about 4,000 residents. There is a great community work ethic and residents tend to want to stay in the area. The community is also home to an educated workforce with around 62% of the population having completed post-secondary education.
• Existing infrastructure relevant to circular economy opportunities Warwick has two key assets relevant to the development of a potential waste, recycling, reuse, and remanufacturing hub. These include: the Warwick Industrial Park (a 40-acre greenfield site) with the “Real-Flex” facility zoned for mixed commercial/industrial use with outside storage and connections to essential services (e.g., energy, water, sewer); and Waste Management’s Twin Creeks Landfill, which is Ontario’s second largest landfill permitted to receive up to 1.4 million tons/year. In addition, the area is connected to a number of waste/resource companies and associations in the region including: the Recycling Council of Ontario, OWMA, PAC, Bluewater Recycling Association, and Waste Management.
• Favourable investment environment Low taxes and housing prices create a favourable and attractive environment for both businesses and talent. In addition, the provincial government is focused on innovation and development of circular economy initiatives, with potential funding support.
• Access to local industries The Sarnia-Lambton region, which includes Warwick Township, has become an established hub for the petro-chemical industry and refined petroleum producers, with six of the world’s top chemical producers in nearby Sarnia14. The largest employers include petroleum, chemical, and transportation equipment manufacturing companies, such as NOVA Chemicals, ARLANXEO, Air Products Canada Ltd., ReVital, Imperial Oil, Waterville TG Inc., Shell, and Suncor. Potential waste and/or by-products from these industries could be used as feedstock for closed loop solutions through reuse, recycling, and/or remanufacturing in lieu of raw material inputs and, likewise, opportunities may exist for the Warwick Circular economy hub to produce certain material or energy feedstocks for this industry from recycled products.
14 http://www.sarnialambton.on.ca/key-sectors/petrochemical-and-refined-petroleum

WARWICK CIRCULAR ECONOMY CLUSTER INITIATIVE STRATEGIC PLAN
8
Other major local industries and employers include construction and agriculture. The area’s construction industry and proximity to the GTA could provide feedstock materials for recycled, reuse, and remanufactured products for the construction industry, as well as to other local manufacturers. Lambton County is also home to 200 agriculture-related employers. The local agriculture industry could provide feedstock and create opportunities around the bio-economy, biomass for energy, nutrient extraction, and compost, among others. More details on the region’s industries can be found in Appendix D.
• Proximity to innovation and research centers In Southern Ontario, there a number of universities, non-profits, and government organizations that are conducting research and developing solutions that are relevant to the circular economy. One example is Bioindustrial Innovation Canada, based in Sarnia, which could act as a potential partner and/or opportunity for collaboration with companies locating in the Warwick Industrial Park. For more information on the area’s research and innovation activities see Appendix E.
3.2 Weaknesses & Gaps
While the Township of Warwick has a number of key strengths and assets, there are also weaknesses and gaps, which may create challenges for the area to develop a circular economy cluster. These weaknesses are described in the bullets below.
• Small population
The region’s relatively rural population means that there is a limited market for talent and for business and
investment. In addition, the town has a low number of working age residents (19-50 years of age), which may
make it harder for businesses to hire.
• Proximity to large cities
Warwick’s proximity to larger cities and markets is not only a strength, but a weakness, as it makes it challenging
for the town to attract businesses and talent that want access to the amenities and markets available in urban
centers.
• Limited diversity of industry and employment opportunities
While the area is home to a number of industries and large employers, it is heavily focused on the petro-chemical
and agricultural sectors. This limits the type of employment opportunities. In addition, given the high
concentration of companies in a few sectors, there could be challenges in developing circular economy
opportunities without the partnership and support of these industrial players.
• Surrounding research and innovation hubs
While the town has neighboring R&D and innovation facilities, this may make it difficult for the township to
attract the investment and capital required to build its own facilities on greenfield property given existing
infrastructure that exists nearby, especially since many of the existing facilities have room for further expansion.

WARWICK CIRCULAR ECONOMY CLUSTER INITIATIVE STRATEGIC PLAN
9
• Limited waste management service providers and lack of available data
The lack of more than one waste management provider in the area means that there are limited local partners
for the township to work with to develop a circular economy hub focused on waste, particularly if local waste
streams are not available to access. In addition, there is currently a lack of data on specific volumes of waste /
materials and the composition of waste and resource streams entering the Twin Creeks Landfill. This reduces the
ability to fully understand the volumes and types of waste streams that could support new business
opportunities.

WARWICK CIRCULAR ECONOMY CLUSTER INITIATIVE STRATEGIC PLAN
10
4.0 OVERVIEW OF HIGHEST PRIORITY OPPORTUNITIES
4.1 Niche Industry Opportunities
Time Horizons: Immediate (1 year+)
Overview of the Opportunities: Given the surrounding existence of a number of key industries, including the petro-
chemical manufacturing, agriculture / food processing, and service sectors, a number of niche opportunities exist that
present immediate, albeit relatively small, opportunities for consideration. These niche opportunities are, for the
most part, company-specific (or relevant to a small number of local companies in the region within a specific industry).
Examples of four of the niche opportunities identified during this study are highlighted below.
1. Agricultural Waste Collection and Recycling: With the high concentration of farming activities in the region,
opportunities to collect and recycle farming equipment, materials, and waste, such as bale / silage wrap, twine,
seed and grain bags, containers, and other items presents an opportunity. In particular, a local recycler of bale
wrap and twine is no longer active, presenting a potential opportunity for a new company to step in.
Agricultural Waste Collection and Recycling
Current State of Play in Ontario
Agriculture waste collection is active across Ontario. CleanFarms operates a voluntary
program to collect, process, or treat some agriculture waste. Previously, there was a fair
amount of ‘bale wrap’ source separation taking place at various municipal sites and transfer
stations in Southwestern Ontario but that has been halted. In addition, a facility in Clinton
was doing some recycling of bale wrap but is no longer accepting it. A key market challenge
was the economics and not having a recycle product that was clean enough for processing,
despite the demand remaining. As such, the bale wrap is now ending up in landfill. Source(s) of Supply There is estimated to be more than 800,000 pounds of bale wrap and twine available per
year for recycling from farms in Southwestern Ontario.
Potential Buyers • Recycled material brokers
• Plastic recyclers
Competitive Landscape
CleanFarms is currently active in the region with the below services:
• 23L pesticide & fertilizer container (retail collection)
• Pesticide non-deposit bulk
• Obsolete pesticide & animal health collection
• Seed bag and pesticide bag
Potential Partners / Investors
CleanFarms15
15 http://cleanfarms.ca/
WARWICK CIRCULAR ECONOMY CLUSTER INITIATIVE STRATEGIC PLAN
11
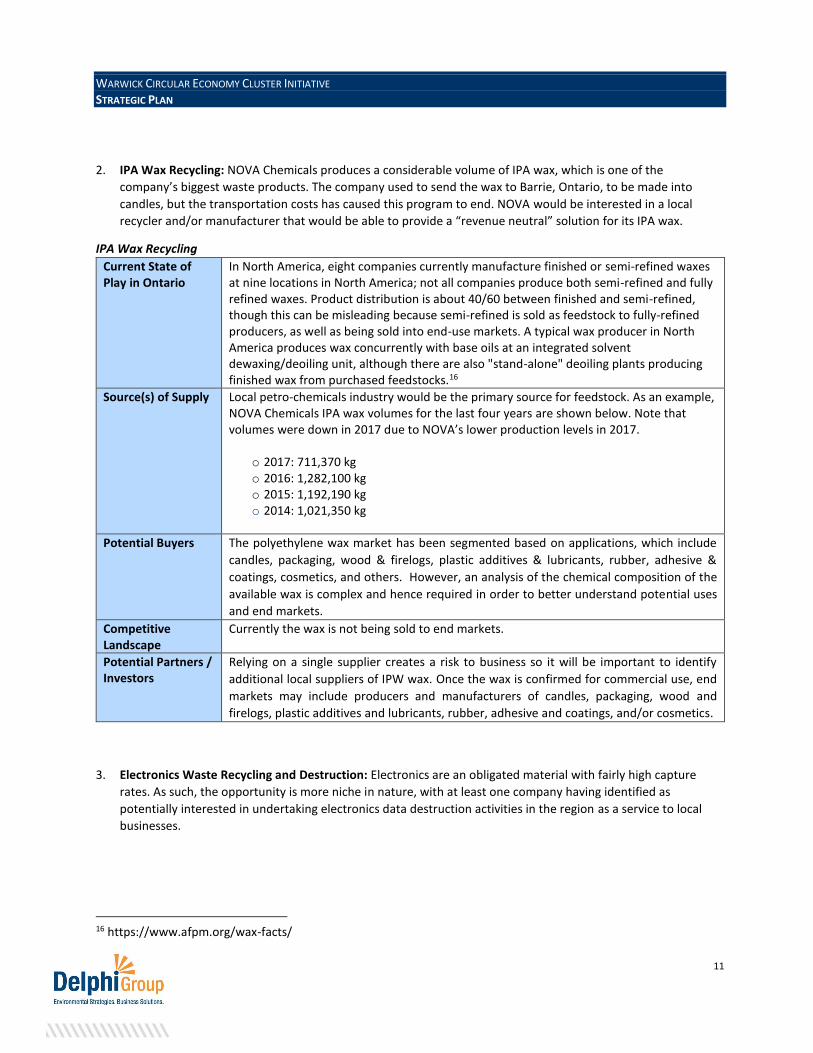
2. IPA Wax Recycling: NOVA Chemicals produces a considerable volume of IPA wax, which is one of the
company’s biggest waste products. The company used to send the wax to Barrie, Ontario, to be made into
candles, but the transportation costs has caused this program to end. NOVA would be interested in a local
recycler and/or manufacturer that would be able to provide a “revenue neutral” solution for its IPA wax.
IPA Wax Recycling
Current State of Play in Ontario
In North America, eight companies currently manufacture finished or semi-refined waxes at nine locations in North America; not all companies produce both semi-refined and fully refined waxes. Product distribution is about 40/60 between finished and semi-refined, though this can be misleading because semi-refined is sold as feedstock to fully-refined producers, as well as being sold into end-use markets. A typical wax producer in North America produces wax concurrently with base oils at an integrated solvent dewaxing/deoiling unit, although there are also "stand-alone" deoiling plants producing finished wax from purchased feedstocks.16
Source(s) of Supply Local petro-chemicals industry would be the primary source for feedstock. As an example, NOVA Chemicals IPA wax volumes for the last four years are shown below. Note that volumes were down in 2017 due to NOVA’s lower production levels in 2017.
o 2017: 711,370 kg o 2016: 1,282,100 kg o 2015: 1,192,190 kg o 2014: 1,021,350 kg
Potential Buyers The polyethylene wax market has been segmented based on applications, which include
candles, packaging, wood & firelogs, plastic additives & lubricants, rubber, adhesive &
coatings, cosmetics, and others. However, an analysis of the chemical composition of the
available wax is complex and hence required in order to better understand potential uses
and end markets. Competitive Landscape
Currently the wax is not being sold to end markets.
Potential Partners / Investors
Relying on a single supplier creates a risk to business so it will be important to identify
additional local suppliers of IPW wax. Once the wax is confirmed for commercial use, end
markets may include producers and manufacturers of candles, packaging, wood and
firelogs, plastic additives and lubricants, rubber, adhesive and coatings, and/or cosmetics.
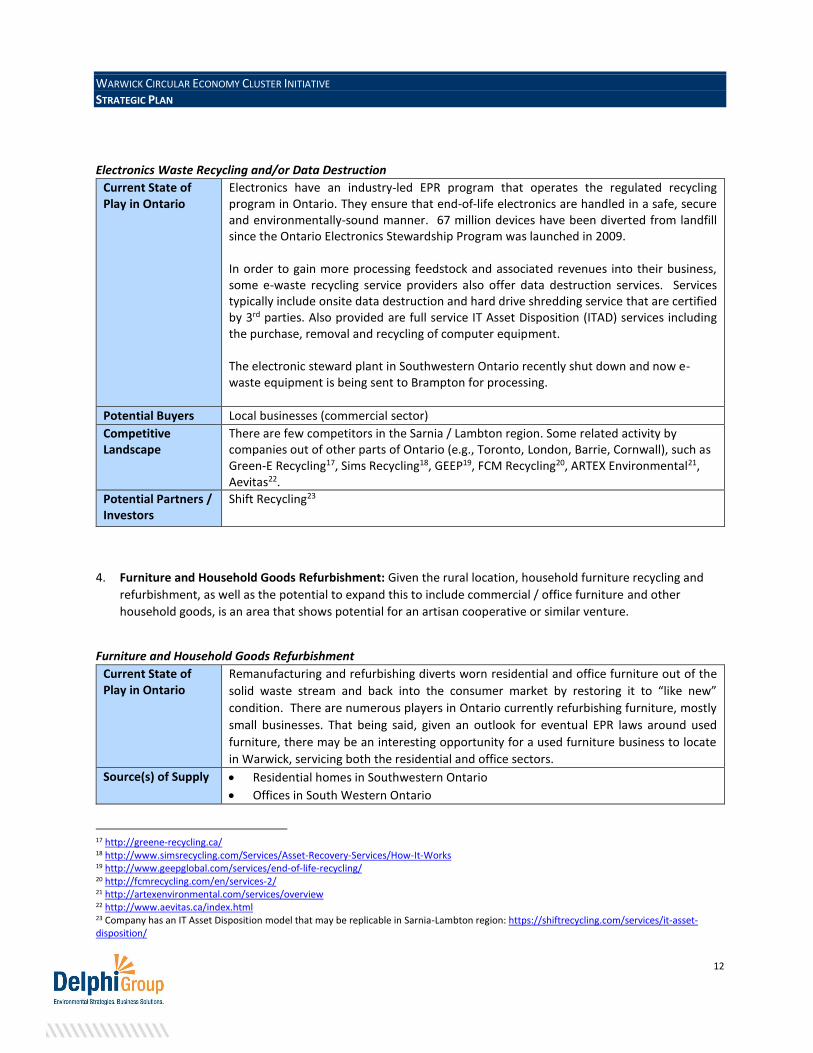
3. Electronics Waste Recycling and Destruction: Electronics are an obligated material with fairly high capture
rates. As such, the opportunity is more niche in nature, with at least one company having identified as
potentially interested in undertaking electronics data destruction activities in the region as a service to local
businesses.
16 https://www.afpm.org/wax-facts/
WARWICK CIRCULAR ECONOMY CLUSTER INITIATIVE STRATEGIC PLAN
12
Electronics Waste Recycling and/or Data Destruction
Current State of Play in Ontario
Electronics have an industry-led EPR program that operates the regulated recycling program in Ontario. They ensure that end-of-life electronics are handled in a safe, secure and environmentally-sound manner. 67 million devices have been diverted from landfill since the Ontario Electronics Stewardship Program was launched in 2009. In order to gain more processing feedstock and associated revenues into their business, some e-waste recycling service providers also offer data destruction services. Services typically include onsite data destruction and hard drive shredding service that are certified by 3rd parties. Also provided are full service IT Asset Disposition (ITAD) services including the purchase, removal and recycling of computer equipment. The electronic steward plant in Southwestern Ontario recently shut down and now e-waste equipment is being sent to Brampton for processing.
Potential Buyers Local businesses (commercial sector) Competitive Landscape
There are few competitors in the Sarnia / Lambton region. Some related activity by companies out of other parts of Ontario (e.g., Toronto, London, Barrie, Cornwall), such as Green-E Recycling17, Sims Recycling18, GEEP19, FCM Recycling20, ARTEX Environmental21, Aevitas22.
Potential Partners / Investors
Shift Recycling23
4. Furniture and Household Goods Refurbishment: Given the rural location, household furniture recycling and
refurbishment, as well as the potential to expand this to include commercial / office furniture and other
household goods, is an area that shows potential for an artisan cooperative or similar venture.
Furniture and Household Goods Refurbishment
Current State of Play in Ontario
Remanufacturing and refurbishing diverts worn residential and office furniture out of the
solid waste stream and back into the consumer market by restoring it to “like new”
condition. There are numerous players in Ontario currently refurbishing furniture, mostly
small businesses. That being said, given an outlook for eventual EPR laws around used
furniture, there may be an interesting opportunity for a used furniture business to locate
in Warwick, servicing both the residential and office sectors. Source(s) of Supply • Residential homes in Southwestern Ontario
• Offices in South Western Ontario
17 http://greene-recycling.ca/ 18 http://www.simsrecycling.com/Services/Asset-Recovery-Services/How-It-Works 19 http://www.geepglobal.com/services/end-of-life-recycling/ 20 http://fcmrecycling.com/en/services-2/ 21 http://artexenvironmental.com/services/overview 22 http://www.aevitas.ca/index.html 23 Company has an IT Asset Disposition model that may be replicable in Sarnia-Lambton region: https://shiftrecycling.com/services/it-asset-disposition/

WARWICK CIRCULAR ECONOMY CLUSTER INITIATIVE STRATEGIC PLAN
13
Potential Buyers • Residential homes in Southwestern Ontario
• Offices in South Western Ontario
Competitive Landscape
The used furniture industry in the area is currently limited to a few micro-artisans and those engaged in online trading through platforms such as Craig’s List.
Potential Partners / Investors
• REdeUSE
• Barry’s Office Furniture
4.2 Organics Processing & Compost Production
Time Horizons: Immediate (1 year+)
Overview of the Opportunity: Considering the local agriculture industry, a centralized composting facility set up in
the Warwick Industrial Park site could be used to compost organic material and then supply both to the local and
regional markets. The food processing / manufacturing industry in the region may also be a suitable source for
providing feedstock.
Current State of Play in Ontario
Organics are a growing concern for the Province of Ontario, particularly in line with the incoming Climate Cap and Trade Protocols and the Food and Organics Waste Framework.24 There is also considerable concern from the Ministry of Environment and Climate Change and the Environmental Commissioner to reduce organic waste as a means to fight climate change. According to Statistics Canada, every year Ontarians generate over 12 million tonnes of garbage with over three-quarters of it sent to disposal. Almost 4 million tonnes of this waste is organic.25 In 2015, there were a total of 87 organics processing facilities in Ontario. While there were some changes in the number of facilities operating, the majority of the change from last year’s report is due to a number of small municipal leaf and yard composting sites being identified.26 This number is expected to rise once the Cap and Trade protocol for organics waste management kicks in within the next few years. A large facility processing approximately 40,000 tons/year costs in the range of $5-$9M USD and $17-28 USD per incoming ton to operate.27
Source(s) of Supply
Food and organic waste make up approximately one-third of Ontario's total waste. Sources of supply include the local agriculture industry and food processing sector, as well as the potential to establish contracts with local municipalities over the longer-term to deal with organic streams for MSW. Sources may also include the regional retail sector – e.g. Walmart is keen on solutions relating to organics.
Potential Buyers High quality compost could be used for horticulture and landscape. It could also be used by farmers for local and/or regional agriculture and growing. Potential buyers include:
• Local farms and greenhouses
• Distributors of agriculture supplies
24 See: https://www.ebr.gov.on.ca/ERS-WEB-External/displaynoticecontent.do?noticeId=MTMzOTI0&statusId=MjAzNzAz 25 http://compost.org/English/PDF/Rethink%20Organic%20Waste%20Oct%202015%20web.pdf 26 https://silkstart.s3.amazonaws.com/0cc0af45-f75d-497d-8727-6cc590adc83a.pdf 27 See: http://www.refed.com/solutions/centralized-composting

WARWICK CIRCULAR ECONOMY CLUSTER INITIATIVE STRATEGIC PLAN
14
Competitive Landscape
Existing compost facilities in Southwestern Ontario include: the City of Guelph’s Organic Waste Processing Facility; Harvest Energy Garden in London; and Peel’s Integrated Waste Management Facility.
4.3 Biogas & RNG Production
Time Horizons: Medium-term (2-3 years+)
Overview of the Opportunity: Considering the local agriculture industry and the fact that Southwestern Ontario is the greenhouse capital of the province, this space shows opportunity, particularly in line with the bio-economy, nutrient extraction, and saleable product development. Potential exists to aggregate organic and/or agricultural waste to produce renewable natural gas (RNG) through a centralized anaerobic digestion (AD) facility in Warwick Industrial Park. The opportunity factors in the following considerations:
• Projects that divert and anaerobically treat eligible organic waste and/or wastewater streams that otherwise would have gone to solid waste landfills or on-site uncontrolled anaerobic wastewater treatment facilities.
• Anaerobic digestion of organics can also generate carbon offsets through the electricity production from the combustion of biogas (methane).
• Methane can be used as a heating source for greenhouses or feedstock to the petrochemical industry. • There are opportunities to sell direct to the market or work with a distributor like Enbridge. • A further opportunity exists to develop a clean natural gas distribution hub for transport vehicles in the
Warwick Township / Lambton County region.
Current State of Play in Ontario
Market is still young and is expected to grow with the Organics ban and Clean Fuel standard. In particular, there are significant opportunities to make AD more economically viable due to the forthcoming Climate Protocols expected to be launched late 2018. Several provincial policy and regulatory drivers exist, including: • Cap and Trade Protocol • The Food and Organics Waste Framework • Climate Action Plan Discussions are also underway to consider a Clean Fuel Standard for RNG. In addition, the Ontario Government is currently considering developing a $100M fund to support RNG development in Ontario that would be managed by gas utilities (i.e., Enbridge) to help support the purchase of RNG in an open-market RFP process. However, the current political landscape in Ontario is not favourable to new project investments in this space until the cap-and-trade protocol for Anaerobic Digestion and Composting, the forthcoming biofuel regulation, and a proposed $100M RNG fund are established (likely post-election in Ontario). Should it move forward, RNG production through agricultural AD is unlikely economically viable at $14-$16/GJ without incentives / subsidies.

WARWICK CIRCULAR ECONOMY CLUSTER INITIATIVE STRATEGIC PLAN
15
However, given the latest AD technology, the project may be economically viable as a whole when considering the combined revenues from methane, the potential generation of carbon offset credits and the sale of digestate converted to compost and/or value-add nutrients.
Source(s) of Supply
Sources of supply include the local agriculture industry and food processing sector, as well as the potential to establish contracts with local municipalities over the longer-term to deal with organic streams for MSW. There are abundant agricultural facilities (dairy and poultry) to supply waste for AD facilities in Lambton County and surrounding region.
Potential Buyers • Demand for RNG exists for certain ‘consumer-facing’ companies, which is driving up interest in Ontario. Additional buyers may include:
• Natural gas distributors, including Enbridge and Bullfrog Power.
• While petro-chem and related industries are not usually willing to pay a premium for RNG (i.e., the price differential for NG and RNG is too high, even with carbon credits applied), there may be some interest in lower quality biogas / methane.
• Biogas could be sold to offset the costs of power for companies looking to locate in the Warwick Industrial Park and/or fuel fleet vehicles (i.e., transportation companies).
• Nutrients extracted from the AD process can also be turned into fertilizers and sold to nearby farms and/or exported outside of the region.
Competitive Landscape
A few AD facilities have been set up on farms in Southwestern Ontario, mostly to power
nearby operations rather than RNG. To date, none have developed a centralized approach to
the aggregation of local feedstock, although Bioindustrial Innovation Canada (BIC) is working
on a large anaerobic digester project for one of the industrial parks that will treat industrial
wastewater but will also look to include offsite source separated organic (SSO) waste streams
from around the region (up to 40,000 tonnes of SSO). Despite the current ‘wait and see’ status
for Ontario’s RNG market around new project development, opportunities exist to position
and develop a unique business model for the region. However, it will be important to avoid
direct competition with BIC for local organic feedstock supplies.
4.4 Mixed Plastics Recycling R&D
Time Horizons: Medium-term (2-3 years+)
Overview of the Opportunity: Mixed plastic research (including for flexible packaging and black plastics) is a pre-
commercial, R&D-focused opportunity area that could fit as part of a broader initiative to leverage innovation funding
and research focused on recycling and sorting equipment / technology and related piloting of new solutions with
government and industry partners at the table.
Given proximity to Bluewater, there is an opportunity to conduct pilot projects to recover flexible packaging and send
them to the R&D facility for testing. Technologies from different parts of the world could be brought to bear on this
opportunity to test / pilot separation efforts in order to valorize the material stream.
WARWICK CIRCULAR ECONOMY CLUSTER INITIATIVE STRATEGIC PLAN
16
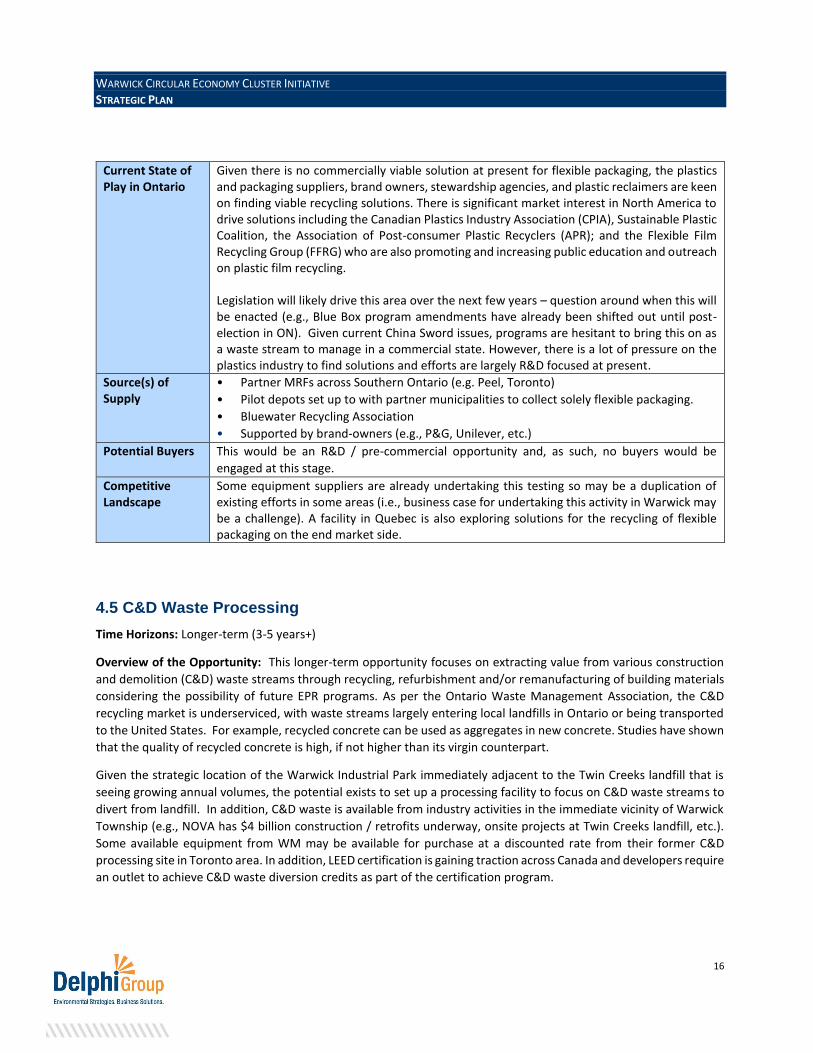
Current State of Play in Ontario
Given there is no commercially viable solution at present for flexible packaging, the plastics and packaging suppliers, brand owners, stewardship agencies, and plastic reclaimers are keen on finding viable recycling solutions. There is significant market interest in North America to drive solutions including the Canadian Plastics Industry Association (CPIA), Sustainable Plastic Coalition, the Association of Post-consumer Plastic Recyclers (APR); and the Flexible Film Recycling Group (FFRG) who are also promoting and increasing public education and outreach on plastic film recycling. Legislation will likely drive this area over the next few years – question around when this will be enacted (e.g., Blue Box program amendments have already been shifted out until post-election in ON). Given current China Sword issues, programs are hesitant to bring this on as a waste stream to manage in a commercial state. However, there is a lot of pressure on the plastics industry to find solutions and efforts are largely R&D focused at present.
Source(s) of Supply
• Partner MRFs across Southern Ontario (e.g. Peel, Toronto)
• Pilot depots set up to with partner municipalities to collect solely flexible packaging.
• Bluewater Recycling Association
• Supported by brand-owners (e.g., P&G, Unilever, etc.)
Potential Buyers This would be an R&D / pre-commercial opportunity and, as such, no buyers would be
engaged at this stage.
Competitive Landscape
Some equipment suppliers are already undertaking this testing so may be a duplication of existing efforts in some areas (i.e., business case for undertaking this activity in Warwick may be a challenge). A facility in Quebec is also exploring solutions for the recycling of flexible packaging on the end market side.
4.5 C&D Waste Processing
Time Horizons: Longer-term (3-5 years+)
Overview of the Opportunity: This longer-term opportunity focuses on extracting value from various construction
and demolition (C&D) waste streams through recycling, refurbishment and/or remanufacturing of building materials
considering the possibility of future EPR programs. As per the Ontario Waste Management Association, the C&D
recycling market is underserviced, with waste streams largely entering local landfills in Ontario or being transported
to the United States. For example, recycled concrete can be used as aggregates in new concrete. Studies have shown
that the quality of recycled concrete is high, if not higher than its virgin counterpart.
Given the strategic location of the Warwick Industrial Park immediately adjacent to the Twin Creeks landfill that is
seeing growing annual volumes, the potential exists to set up a processing facility to focus on C&D waste streams to
divert from landfill. In addition, C&D waste is available from industry activities in the immediate vicinity of Warwick
Township (e.g., NOVA has $4 billion construction / retrofits underway, onsite projects at Twin Creeks landfill, etc.).
Some available equipment from WM may be available for purchase at a discounted rate from their former C&D
processing site in Toronto area. In addition, LEED certification is gaining traction across Canada and developers require
an outlet to achieve C&D waste diversion credits as part of the certification program.

WARWICK CIRCULAR ECONOMY CLUSTER INITIATIVE STRATEGIC PLAN
17
Challenges exist around the reality that costs on average to operate a mixed C&D processing facility are higher than
what most are willing to pay to process the C&D waste streams. As such, the economic viability will depend on
incoming regulation / landfill bans on specific products, grants or subsidies, and/or increased tipping fees. Capital
costs for setting up this facility are also high. In case of a facility with the total annual throughput of 120,000 tonnes
of mixed and selected C&D loads, the capital cost for the equipment is approximately $10 million; building and site
preparation costs are approximately $5 million.28
Low market demand for recycled, reclaimed, and refurbished C&D waste streams may also create challenges in the
shorter-term. As such, this option will require further investigation, with a focus on exploring new business models,
revenue stream opportunities, and strategic partnerships (potentially with WM over the longer-term).
Current State of Play in Ontario
With the incoming 3R regulations, the IC&I sector will require outlets to recycle its C&D
materials. There are also incentives from LEED for the use of green construction materials
and it is expected that green building codes in Ontario will evolve to include more incentives
for green materials.
However, the recent announcement from the US Government signalling plans to add tarriffs
on imported aluminum and other metals from Canada may impact on this opportunity and
should be monitored.
Source(s) of Supply
• C&D waste generator stakeholders such as property developers, contractors or construction service providers (e.g., Brookfield Residential, PCL, Ellis Don, etc.) require sustainable outlets for their C&D waste.
• Direct sourcing from construction undertaken in nearby industries (e.g. NOVA).
Potential Buyers • Recycled material brokers
• Construction firms/contractors across Southwestern Ontario and outside of the region
• Recycling companies
Competitive Landscape
C&D recycling is not too common in Ontario. Countrywide Recycling Inc., is a Material Recovery Facility (MRF) specializing in recycling of non-hazardous construction, renovation, and demolition materials located in Hamilton. They have a 60,000 square foot facility, that processes up to 800 tonnes of material per day. WM has a mixed C&D processing site in Ottawa which has been successful because of the volumes of C&D waste generated in that area. In addition, some local competition exists for existing C&D streams in the region with companies such as Tri-recycling in Sarnia and Good Valley in London. A large portion of C&D waste is currently being disposed in landfills in either Ontario or in Michigan.
28 http://www.metrovancouver.org/services/solid-waste/SolidWastePublications/DemolitionConstructionMaterialRecoveryFacilityDiversionPotential.pdf

WARWICK CIRCULAR ECONOMY CLUSTER INITIATIVE STRATEGIC PLAN
18
4.6 Mixed Waste Processing
Time Horizons: Longer-term (3-5 years+)
Overview of the Opportunity: Mixed waste processing involves a focus on extracting value from ‘black bag’ MSW
and IC&I waste streams. It includes the potential to set up a ‘dirty’ materials recovery facility (MRF) to process
targeted MSW and IC&I streams to divert from landfill. A dirty MRF is an advanced mixed-waste sortation facility that
allows for ‘black bag’ solid wastes to be processed, allowing for more overall recycled materials to be captured from
the waste stream prior to disposal / landfilling.
Supporters of mixed-waste sorting facilities point to examples from Europe where the method has been implemented
in conjunction with waste-to-energy and anaerobic digestion operations to significantly curb the amount of waste
sent to landfill.29 Their advanced operations can also be a source for innovation and piloting new technologies (e.g.,
AI, automation, and robotics).
Given aggressive recycling targets in Ontario and regulations set to come into play over the next several years driving
more diversion efforts, efforts to increase diversion will likely come from mining MSW streams (i.e., black bag). The
new 3R regulations could also reduce the existing threshold for the IC&I sector to increase the number of
companies/facilities required to implement waste diversion programs. In addition, the 70% divergence requirement
as per the organics framework may present opportunities to extract additional organics, including wood. Other
materials with value include carpet, mattresses, plastics, cardboard / paper, aluminum, and other metals.
That being said, the growth of multi-family dwellings in Southwestern Ontario shows high alignment with the
opportunities given these have poor recycling and recovery rates compared to single-family homes (i.e., high-value
recyclables are still ending up in the multi-family MSW stream).
Given the strategic location of the Warwick Industrial Park immediately adjacent to the Twin Creeks landfill and its
growing annual volumes (approx. 1.2+ tons per year at present), there is potential to set up a ‘dirty’ MRF focused on
processing targeted MSW and IC&I streams to divert from landfill.
Challenges exist with respect to the costs required to operate a ‘dirty’ MRF, which can be in the $100/ton range on
average (the nearby landfill currently takes in waste at approximately $35-$40/ton). As such, the economic viability
will depend on incoming regulation / landfill bans on specific products, grants or subsidies, and/or increased tipping
fees. Capital costs to build a ‘dirty’ MRF type facility are also high (in the range of $20M-$30M).
In addition, the quality of material recovered from a dirty MRF has higher contamination rates relative to clean MRFs.
This may pose challenges in the short-term given the low China Sword contamination thresholds. This option will
require new business models, revenue stream opportunities, and strategic partnerships (potentially with WM over
the longer-term).
29 See “Top Five MRF Trends article from September 2014: https://www.envisionwaste.net/images/latest_news/TopFiveMRFTrends2014.pdf

WARWICK CIRCULAR ECONOMY CLUSTER INITIATIVE STRATEGIC PLAN
19
Current State of Play in Ontario
Currently, most Blue Box materials are being sorted across Ontario at MRFs. Some
municipalities in Ontario, including Toronto, have considered the potential for dirty MRFs,
or single stream processing, given the growth of multi-family units which currently have
relatively poor recovery of blue box materials.
However, the development of such a facility would require aggressive recycling targets,
revised 3Rs regulations, and an increase in tipping fees, ultimately encouraging a much
broader recycling industry.
Potential exists to find partners and investors around innovation in robotics / AI, sorting
technology, etc. with incentives and funding from Ontario Govt and other funding partners.
Source(s) of Supply
• Direct from municipalities (through service contracts)
• Direct from the IC&I sector (e.g. large retailers, institutions, office buildings)
Potential Buyers Potential interested buyers for plastics and wood exist in nearby Sarnia through Bioindustrial
Innovation Canada networks.
Competitive Landscape
In total, over 800,000 tonnes of materials are recycled under the Blue Box program in Ontario.30 The materials are processed in approximately 60 MRF, where CFL owns and operates a mega MRF in Toronto, about 30 are owned by municipalities and the remaining are operated by private waste management companies. In addition, there is a dirty MRF facility in London, Ontario, at present (redirected waste is processed at approximately $200/ton). That being said, there are opportunities to recover more materials through the penetration of multi-family dwellings and the IC&I sector. In particular, as per a 2005 OWMA report, private sector businesses in Ontario generate 7.6 million tonnes of waste of which 1.4 million tonnes are diverted and 6.2 million tonnes are disposed. About 2 million tonnes of IC&I and C&D materials are currently disposed in the US, mostly in landfills in Michigan, although some waste goes to New York State. Over 3 million tonnes are disposed in private sector Ontario landfills; the remainder is disposed in municipal landfills.31
30 http://stewardshipontario.ca/wp-content/uploads/2017/06/2016_SO_AnnualReport.pdf 31 http://kelleherenvironmental.com/wp-content/uploads/2012/07/ICIPrivateSectorWasteStudy.pdf

WARWICK CIRCULAR ECONOMY CLUSTER INITIATIVE STRATEGIC PLAN
20
5.0 STRATEGIC PLAN
5.1 Strategic Goals & Actions
The Delphi Group and Reclay StewardEdge propose three strategic goals focused on developing a circular economy cluster for the Warwick Industrial Park. These three key goals are inline with the market and policy-focused research for this study, as well as shaped from the input of various industry stakeholders consulted as part of this project. The goals that guide this Strategic Plan are outlined below.
• Goal 1: Establish the Warwick Industrial Park as a leading hub in Canada for circular economy activities by 2023.
• Goal 2: Establish new markets over the next 12-24 months for local industry waste and resource streams.
• Goal 3: Over the next 5 years, align with incoming regulations and incentives to capitalize on longer-term provincial waste-to-resource streams.
Associated with each of these goals are specific strategies and detailed action items that allow key decision-makers and implementers to prioritize and act upon these strategies. While the strategies provide the general direction for what needs to be done in order to develop the circular economy cluster in the region, the action items provide specific and measurable tactics for achieving the strategies and overarching goals.
Goal 1: Establish the Warwick Industrial Park as a leading hub in Canada for circular economy activities by 2023.
Background: Warwick’s Industrial Park presents a unique opportunity for developing a leading centre for innovation and business development, centered around the concept of a co-location, circular economy hub. In order to be successful, it will be important for the Township of Warwick and the Sarnia-Lambton Economic Partnership (SLEP) to raise awareness and promote the opportunities with key government leaders and agencies, private sector companies and investors active in the sector, and other industry leaders.
Strategy 1.1: Raise awareness and promote the opportunities widely.
Key Actions:
• Action 1.1.1. Develop a stakeholder engagement and communications plan. Working with key initial partners,
the Township of Warwick and the SLEP, develop an initial 2-3 year stakeholder engagement and communications plan, in line with the implementation plan, designed to raise awareness about the focus of the circular economy hub and the business and investment opportunities. From this, develop targeted marketing and promotional materials (e.g., website, brochures, advertisements, social media campaigns) to raise awareness around the opportunities.

WARWICK CIRCULAR ECONOMY CLUSTER INITIATIVE STRATEGIC PLAN
21
• Action 1.1.2. Participate in and host circular economy focused events. Host and attend relevant events in Ontario, as well as across Canada and internationally where relevant (e.g., Zero Waste Conference, Canadian Waste to Resource Conference, GLOBE 2020), in order to engage with potential partners, companies, investors, and government agencies that might have an interest in the Warwick Industrial Park and the proposed circular economy hub.
Strategy 1.2: Establish strategic partners and a network of potential i nvestors.
Key Actions:
• Action 1.2.1. Establish strategic partnerships with key industry associations and government agencies. These
relationships will be important for advancing the various priorities within the Strategic Plan and ensuring that an understanding of the policy and regulatory environment and timelines for the rollout of new regulations (e.g., landfill bans, 3R regulations, RNG fund, etc.) are well understood. Key organizations include the Ontario Ministry of Environment and Climate Change, Bluewater Recycling Association, the Canadian Plastic Industries Association, the National Zero Waste Council, the Ontario Waste Management Association, PAC (the Packaging Consortium), and the Recycling Council of Ontario.
• Action 1.2.2. Target specific private sector companies and investors inline with the Strategy Plan and identified opportunity areas. These could include Canadian Fibers Ltd., Emterra / Revital, Waste Management of Canada, EFS, and Licella. Funding partners may include the Ontario Green Fund, the Green Municipal Fund, and the new Low Carbon Fund.
Goal 2: Establish new markets over the next 12-24 months for local industry waste and resource streams.
Background: Lambton County and nearby Sarnia region has a mix of industry within close geographic proximity to Warwick Township and its Industry Park site. Some of these industries have small but potentially valuable waste streams that can be leveraged for new business ventures, including the nearby petro-chemicals industry and the agricultural sector. A key activity over the next 1-2 years will be to more thoroughly investigate the local waste-resource stream opportunities and develop strategic partnerships with lead proponents to grow these business opportunities.
Strategy 2.1: Leverage exist ing and identify new potential niche opportunit ies from surrounding industry .
Key Actions:
• Action 2.1.1. Engage with a network of local artisans and develop a local ‘maker-space’. Investigate the
potential to bring together funding partners to lease space within the Real-Flex facility for local artisans and youth to develop a maker-space32 to recycle, repair, and refurbish furniture and/or other household and commercial items and equipment. This could include strategic partnerships with the local high school and/or other community associations providing important skills training for youth and/or disadvantaged demographics (e.g., people with barriers to employment).
32 https://www.makerspaces.com/what-is-a-makerspace/
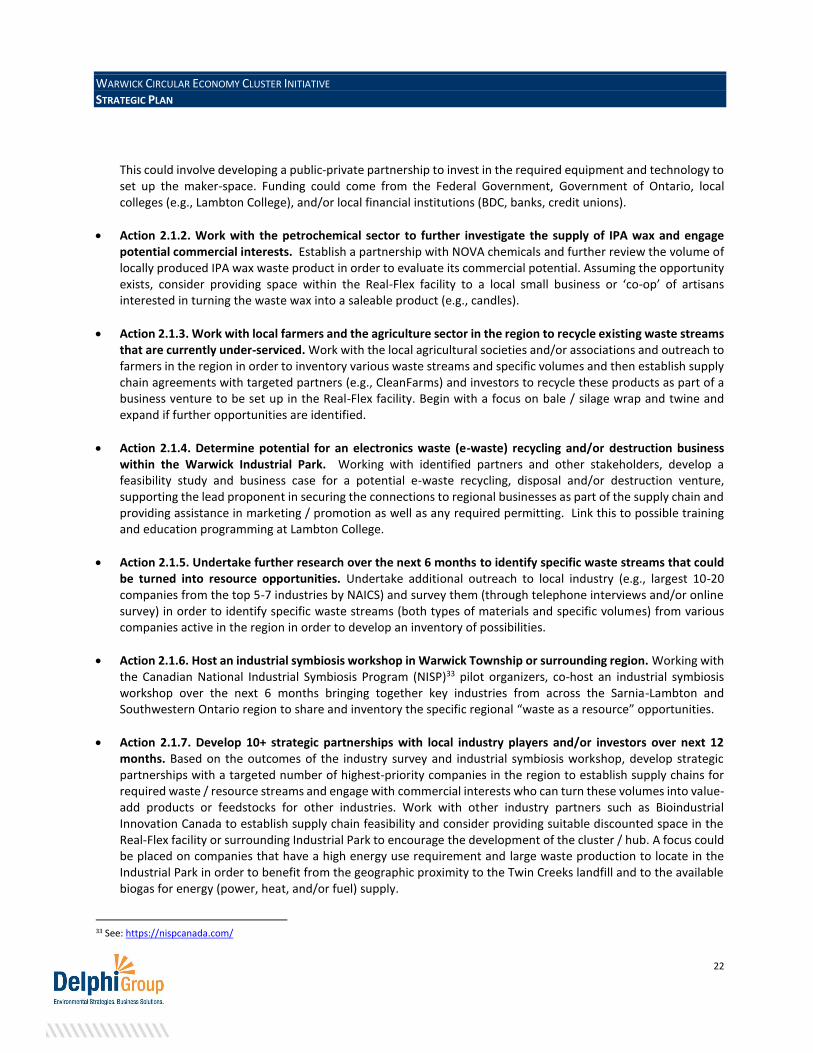
WARWICK CIRCULAR ECONOMY CLUSTER INITIATIVE STRATEGIC PLAN
22
This could involve developing a public-private partnership to invest in the required equipment and technology to set up the maker-space. Funding could come from the Federal Government, Government of Ontario, local colleges (e.g., Lambton College), and/or local financial institutions (BDC, banks, credit unions).
• Action 2.1.2. Work with the petrochemical sector to further investigate the supply of IPA wax and engage potential commercial interests. Establish a partnership with NOVA chemicals and further review the volume of locally produced IPA wax waste product in order to evaluate its commercial potential. Assuming the opportunity exists, consider providing space within the Real-Flex facility to a local small business or ‘co-op’ of artisans interested in turning the waste wax into a saleable product (e.g., candles).
• Action 2.1.3. Work with local farmers and the agriculture sector in the region to recycle existing waste streams that are currently under-serviced. Work with the local agricultural societies and/or associations and outreach to farmers in the region in order to inventory various waste streams and specific volumes and then establish supply chain agreements with targeted partners (e.g., CleanFarms) and investors to recycle these products as part of a business venture to be set up in the Real-Flex facility. Begin with a focus on bale / silage wrap and twine and expand if further opportunities are identified.
• Action 2.1.4. Determine potential for an electronics waste (e-waste) recycling and/or destruction business within the Warwick Industrial Park. Working with identified partners and other stakeholders, develop a feasibility study and business case for a potential e-waste recycling, disposal and/or destruction venture, supporting the lead proponent in securing the connections to regional businesses as part of the supply chain and providing assistance in marketing / promotion as well as any required permitting. Link this to possible training and education programming at Lambton College.
• Action 2.1.5. Undertake further research over the next 6 months to identify specific waste streams that could be turned into resource opportunities. Undertake additional outreach to local industry (e.g., largest 10-20 companies from the top 5-7 industries by NAICS) and survey them (through telephone interviews and/or online survey) in order to identify specific waste streams (both types of materials and specific volumes) from various companies active in the region in order to develop an inventory of possibilities.
• Action 2.1.6. Host an industrial symbiosis workshop in Warwick Township or surrounding region. Working with the Canadian National Industrial Symbiosis Program (NISP)33 pilot organizers, co-host an industrial symbiosis workshop over the next 6 months bringing together key industries from across the Sarnia-Lambton and Southwestern Ontario region to share and inventory the specific regional “waste as a resource” opportunities.
• Action 2.1.7. Develop 10+ strategic partnerships with local industry players and/or investors over next 12 months. Based on the outcomes of the industry survey and industrial symbiosis workshop, develop strategic partnerships with a targeted number of highest-priority companies in the region to establish supply chains for required waste / resource streams and engage with commercial interests who can turn these volumes into value-add products or feedstocks for other industries. Work with other industry partners such as Bioindustrial Innovation Canada to establish supply chain feasibility and consider providing suitable discounted space in the Real-Flex facility or surrounding Industrial Park to encourage the development of the cluster / hub. A focus could be placed on companies that have a high energy use requirement and large waste production to locate in the Industrial Park in order to benefit from the geographic proximity to the Twin Creeks landfill and to the available biogas for energy (power, heat, and/or fuel) supply.
33 See: https://nispcanada.com/

WARWICK CIRCULAR ECONOMY CLUSTER INITIATIVE STRATEGIC PLAN
23
Strategy 2.2: Develop an organics composting fac i l ity in the Warwick Industria l Park .
Key Actions:
• Action 2.2.1. Over the next 12 months, undertake a more detailed feasibility study to establish the parameters
for an organics composting facility in the Warwick Industrial Park. The feasibility study should include a full business case, outlining the revenue model and costs for equipment and other capital investments, capacity and space requirements, key partners and investors, competitive positioning, regulatory / zoning requirements, sources of supply, and buyers (i.e., potential purchase order contracts for compost).34
• Action 2.2.2. Secure zoning requirements and permitting to enable the construction of the composting facility. Depending on the outcomes of the feasibility study, proper permitting and zoning will be required for the construction of the composting facility, including for any structures (e.g., windrow or in-vessel) and specific equipment brought on site.
• Action 2.2.3. Identify and secure lead proponent who will actively build and manage the composting facility.
Based on the outcomes of the feasibility study, target specific private sector investors and companies that would be interested in establishing the organics composting facility within the Warwick Industrial Park and establish a long-term MOU and/or working contract. This could be established as a public-private partnership with the Warwick Township and/or a consortium of agriculture companies that could represent both supply and demand for the compost product. Examples of targeted proponents include Harvest Power and Orgaworld.
• Action 2.2.4. Support lead proponent in establishing long-term supply contracts with agriculture / food processing industry and organics waste stream providers. Supply contracts can be set up with local farmers for organic waste from agricultural and food processing operations in Lambton County and neighbouring regions. Additional sources of supply could be established through local commercial facilities (e.g., restaurants, hotels, etc.) and through municipal (MSW) supply contracts.
• Action 2.2.5. Support lead proponent in establishing interest and/or purchase orders from buyers of the compost product(s). Interest to purchase the compost product (i.e., letters of intent and/or purchase contracts could be established with regional farmers, the Township of Warwick (for local gardens and landscaping), and with other municipalities and landscaping businesses across the region and potentially outside the region (for export of compost products).
• Action 2.2.6. Work with lead proponent and partners to secure funding and incentives for the construction and operations of the composting facility. Funding and incentives could include regional and provincial grants and/or more specific, local incentives to establish the composting facility within the Warwick Industrial Park site.
34 Potential funding sources are identified in Appendix I. Note that the Green Municipal Fund through the Federation of Canadian Municipalities can fund both projects and feasibility studies and may have relevance here.

WARWICK CIRCULAR ECONOMY CLUSTER INITIATIVE STRATEGIC PLAN
24
Strategy 2.3: Work with the local agriculture sector to e stablish a central ized anaerobic digester (AD) faci l ity .
Key Actions:
• Action 2.3.1. Advocate for supporting policy and incentives in favour of AD from agricultural wastes. In line
with current climate action policy priorities at the federal and provincial levels, efforts around advocacy should focus on carbon pricing (e.g., cap-and-trade) and incentives for RNG production from agricultural AD production. A specific push should be made to encourage a certain amount of RNG production in Ontario to come from agricultural wastes through AD.
• Action 2.3.2. Work with Enbridge, local farmers, and local government agencies to develop a business plan for a centralized AD facility. The business plan should include a full analysis of the revenue model for the production of both biogas and pipeline-grade RNG, as well as from the application of nutrient recovery technologies that can be used to produce a saleable product (e.g., fertilizer). Required zoning and permitting applications should also be included. 35
• Action 2.3.3. Identify and secure the lead proponent for the AD facility and supporting partners to improve the business case. Target specific project developers and technology providers, ideally as a consortium, to develop a best-in-class AD facility, including nutrient recovery technology options. Engage with additional partners and supporting partners such as Bullfrog Power and Enbridge to develop encourage project developers and raise awareness for the opportunity, establish access to the pipeline for RNG, and other project considerations.
• Action 2.3.4. Support lead proponent in establishing waste stream supply contracts. Work with various agriculture agencies / associations to engage with local farmers (in particular dairy and poultry) to establish the appropriate supply of waste (i.e., manure, poultry litter, bedding, etc.) and arrange for suitable transportation of the waste materials to the centralized location at the Warwick Industrial Park for aggregation. Supply may also be secured through organic waste contracts from municipalities and large retailers in the area.
• Action 2.3.5. Support lead proponent in establishing potential customers for the end products from the AD facility. This could include biogas for powering and/or heating nearby businesses (e.g., office spaces, industrial facilities, and greenhouses), selling RNG into the pipeline, and/or establishing a CNG fueling station for fleet vehicles (e.g., municipal fleets, waste haulers, agriculture trucks, construction vehicles such as dump trucks, etc.).
35 Potential funding sources are identified in Appendix I. Note that the Green Municipal Fund through the Federation of Canadian Municipalities can fund both projects and feasibility studies and may have relevance here.

WARWICK CIRCULAR ECONOMY CLUSTER INITIATIVE STRATEGIC PLAN
25
Goal 3: Over the next 5 years, align with incoming regulations and incentives to capitalize on longer-term provincial waste-to-resource streams.
Background: With the Waste Free Ontario Act and the proposed incoming updates to the 3R regulations, stricter waste diversion targets, and potential landfill bans on specific materials and products, new business opportunities from existing IC&I and MSW waste streams are projected province-wide. The Township of Warwick and SLEP can get out in front of these regulations by working with the provincial government, NGOs, brand owners, and waste and recycling industry service providers to position the Warwick Industrial Park for investment attraction.
Strategy 3.1: Advocate for supportive pol icy to drive market demand for circular economy business opportunit ies from the IC&I and MSW sectors.
Key Actions:
• Action 3.1.1. Push for higher landfill tipping fees. In order to support a circular economy that drives greater
diversion and reintroduces waste materials back into the supply chain, the cost of landfilling will need to increase. It is critical that higher landfill tipping fees come into play that make recycling more competitive. Advocating for higher tipping fees will be key to driving diversion, not only in the Warwick area but Ontario as a whole. It will be key to engage and/or partner with key elected officials, municipal and provincial waste management departments, producers, processors, and relevant industry associations.
• Action 3.1.2. Advocate for an accelerated agenda around the 3Rs regulation and stricter targets. The biggest gap in Ontario’s waste management sector is the lack of action, data, and information relating to the waste activities of the IC&I sector. It is estimated by waste management experts that less than 20% of IC&I waste is diverted in Ontario which is a significant amount of lost economic and environmental opportunity. Working with industry associations and the recycling industry to advocate for the proposed 3Rs regulations and targets for the private sector will be important. As per the former point, it will be key to engage with key elected officials, municipal and provincial waste management departments, producers, processors, and industry associations.
• Action 3.1.3. Advocate for subsidies and funding support for circular economy innovation and cluster / hub development. The support of subsidies and funding will be important to attract investment into a circular economy innovation and cluster/hub. As a key step to driving investment to Warwick, it will be important to engage the provincial government and government funding organizations for subsidies and funding support, thus building the economic business case for the project.
Strategy 3.2: Convene partners from government and pr ivate sector to undertake mixed-plast ics research and development.
Key Actions:
• Action 3.2.1. Engage the plastic producers industry. Host meetings and workshops in order to develop a
partnership with the plastics and petro-chemical Industry to become the primary partners in this endeavor. The key objective would be to seek new, commercially viable solutions to drive the diversion of plastics. Development of partnerships with producers, with the support of PAC, will be a strategic step in terms of securing materials as well as financial support. Materials to consider for diversion development would be resins 3-7, and flexible plastics.

WARWICK CIRCULAR ECONOMY CLUSTER INITIATIVE STRATEGIC PLAN
26
• Action 3.2.2. Develop mixed plastics study. A mixed plastics study, developed with input from both the plastics industry, producers, and other stakeholders, would identify key materials to target for research. The study will also identify technology options and recycling partners, as well as initial funding. Potential funding sources could come from industry participants such as PAC, the Canadian Plastics Industry Association, and/or brand owners themselves.36
• Action 3.2.3: Engage municipalities and processors. Establish agreements with processors to sort the targeted mixed plastics out in order to build economies of scale for research and development.
Strategy 3.3: Posit ion around incoming IC&I regulations to develop a C&D processing faci l ity.
Key Actions:
• Action 3.3.1. Push for higher landfill tipping fees. In order to make C&D processing more economically viable
instead of the low cost of landfilling, it is critical that higher landfill tipping fees come into play that make recycling more competitive. It will be important to engage and/or partner with key elected officials, municipal and provincial waste management departments, real estate developers, contractors, construction companies, service providers, industry associations, and other relevant agencies.
• Action 3.3.2. Advocate for an accelerated agenda around the 3Rs regulation and stricter targets. As previously discussed, the biggest gap in Ontario’s waste management sector is the lack action, data and information relating to the waste activities of the IC&I sector. Warwick / SLEP should advocate with potential partners 3Rs regulations and targets for the private sector, ultimately to mandate recycling as a first resort for construction, renovation & demolition materials. As per the former point, it will be important to engage with elected officials, municipal and provincial waste management departments, real estate developers, Canadian Green Building Council, LEED Canada, contractors, construction firms, service providers, industry associations, and other agencies.
• Action 3.3.3. Identify and secure the lead proponent for the C&D Facility and supporting partners to improve the business case. Target specific project developers and technology providers, ideally as a consortium, to develop a business plan and funding sources for a C&D processing facility. Partners in this case may include real estate developers with an interest to drive sustainability through increased diversion. Additional potential funding sources are identified in Appendix I, including innovation or cleantech funding from the federal and/or provincial governments in collaboration with groups such as MaRS and Sustainable Development Technology Canada (SDTC).
• Action 3.3.4. Support lead proponent in establishing waste stream supply contracts. Once a processing partner is established, begin securing supply contracts from the across the construction, renovation, and demolition industry.
• Action 3.3.5. Support lead proponent in establishing potential customers for the end products. Secure customers for recovered materials by engaging brokers, construction material recyclers and the construction industry.
36 Additional potential funding sources are identified in Appendix I, including innovation or cleantech funding from the federal and/or provincial governments in collaboration with groups such as MaRS and Sustainable Development Technology Canada (SDTC).

WARWICK CIRCULAR ECONOMY CLUSTER INITIATIVE STRATEGIC PLAN
27
Strategy 3.4: Work with lead proponents to secure IC&I and MSW supply contracts for potentia l “dirty” MRF.
• Action 3.4.1. Identify and secure the lead proponent for the Mixed Waste Processing Facility and supporting partners to improve the business case. Once supporting regulations and fee structures are in place, target specific project developers and technology providers, ideally as a consortium, to develop a business plan and funding sources for a best-in-class mixed waste processing facility. Additional potential funding sources are identified in Appendix I, including innovation or cleantech funding from the federal and/or provincial governments in collaboration with groups such as MaRS and Sustainable Development Technology Canada (SDTC).
• Action 3.4.2. Establish waste stream supply contracts. Once a processing partner is established, begin securing supply contracts from municipalities and potentially the IC&I sector.
• Action 3.4.3. Establish potential customers for the end products. Secure customers for recovered materials by engaging brokers, secondary recycling processors and producers/packagers.
5.2 Implementation Timelines
The Gantt Chart below provides a proposed implementation timeline for Goals 1 and 2 of this Strategic Plan, broken
out by quarter over a 2-year period (from Q2 2018 to Q1 2020). Note that Goal 3 was not included in this
implementation timeline given the current policy and market uncertainties. It will be important to monitor these
closely in order to position for the opportunities under Goal 3 and develop an implementation timeline as the circular
economy policy landscape in Ontario evolves.
5.2.1: Goal 1 Proposed Timelines
Goals & Actions Q2 2018 Q3 2018 Q4 2018 Q1 2019 Q2 2019 Q3 2019 Q4 2019 Q1 2020
Goal 1: Establish the Warwick Industrial Park as a leading hub in Canada for circular economy activities by 2023.
Action 1.1.1. Develop a stakeholder engagement and communications plan.
Action 1.1.2. Participate in circular economy focused events.
Action 1.2.1. Establish strategic partnerships with key industry associations and government agencies.
Action 1.2.2. Target specific private sector companies and investors inline with the Strategic Plan and identified
opportunity areas.
Proposed Timeline

WARWICK CIRCULAR ECONOMY CLUSTER INITIATIVE STRATEGIC PLAN
28
5.2.2: Goal 2 Proposed Timelines
5.3 Strategic Partners & Investment Attraction
Below is a list of potential strategic partners and companies to target under each opportunity area. Given the unique and diverse nature of the niche opportunities described in section 4.1, they have not been included in this list.
Opportunity Area Potential Partners for Project Development Companies to Target for Investment
Attraction
Organics Processing &
Compost Production • Agro-processing / food processing
industries
• Farms and horticulture / greenhouse operations in the Sarnia-Lambton region
• Bluewater Recycling Association
• Other municipalities in Ontario
• Large retailers with organic waste
• Ontario Green Fund
• Green Municipal Fund (FCM)
• Sustainable Development Technology Canada (SDTC)
• Municipal GHG Challenge Fund
• Harvest Power
• Waste Management (WM) of Canada
• Green Mountain
• Erth
• Brome Composting
• Miller Waste
• Taggart Investments Inc
Goals & Actions Q2 2018 Q3 2018 Q4 2018 Q1 2019 Q2 2019 Q3 2019 Q4 2019 Q1 2020
Goal 2: Establish new markets over the next 12-24 months for local industry waste and resource streams.
Action 2.1.1. Engage with a network of local artisans and develop a local ‘maker-space’.
Action 2.1.2. Work with the petrochemical industry to further investigate its supply of IPA wax and engage potential
commercial interests.
Action 2.1.3. Work with local farmers and the agriculture sector in the region to recycle existing waste streams that are
currently under-serviced.
Action 2.1.4. Determine potential for an electronics waste (e-waste) recycling and/or destruction business within the
Warwick Industrial Park.
Action 2.1.5. Undertake further research over the next 6 months identify specific waste streams that could be turned into
resource opportunities.
Action 2.1.6. Host an industrial symbiosis workshop in Warwick Township or surrounding region.
Action 2.1.7. Develop 10+ strategic partnerships with local industry players and/or investors over next 12 months.
Action 2.2.1. Over the next 12 months, undertake a more detailed feasibility study to establish the parameters for an
organics composting facility.
Action 2.2.2. Secure zoning requirements and permitting to enable the construction of the composting facility.
Action 2.2.3. Identify and secure lead proponent who will actively build and manage the composting facility.
Action 2.2.4. Support lead proponent in establishing long-term supply contracts with agriculture / food processing
industry and organics waste stream providers.
Action 2.2.5. Support lead proponent in establishing interest and/or purchase orders from buyers of the compost
product(s).
Action 2.2.6. Work with lead proponent and partners to secure funding and incentives for the construction and
operations of the composting facility.
Action 2.3.1. Advocate for supporting policy and incentives in favour of AD from agricultural wastes.
Action 2.3.2. Work with Enbridge, local farmers, and local government agencies to develop a business plan for a
centralized AD facility.
Action 2.3.3. Identify and secure the lead proponent for the AD facility and supporting partners to improve the business
case.
Action 2.3.4. Establish waste stream supply contracts with local framers.
Action 2.3.5. Establish potential customers for the end products from the AD facility.
Proposed Timeline
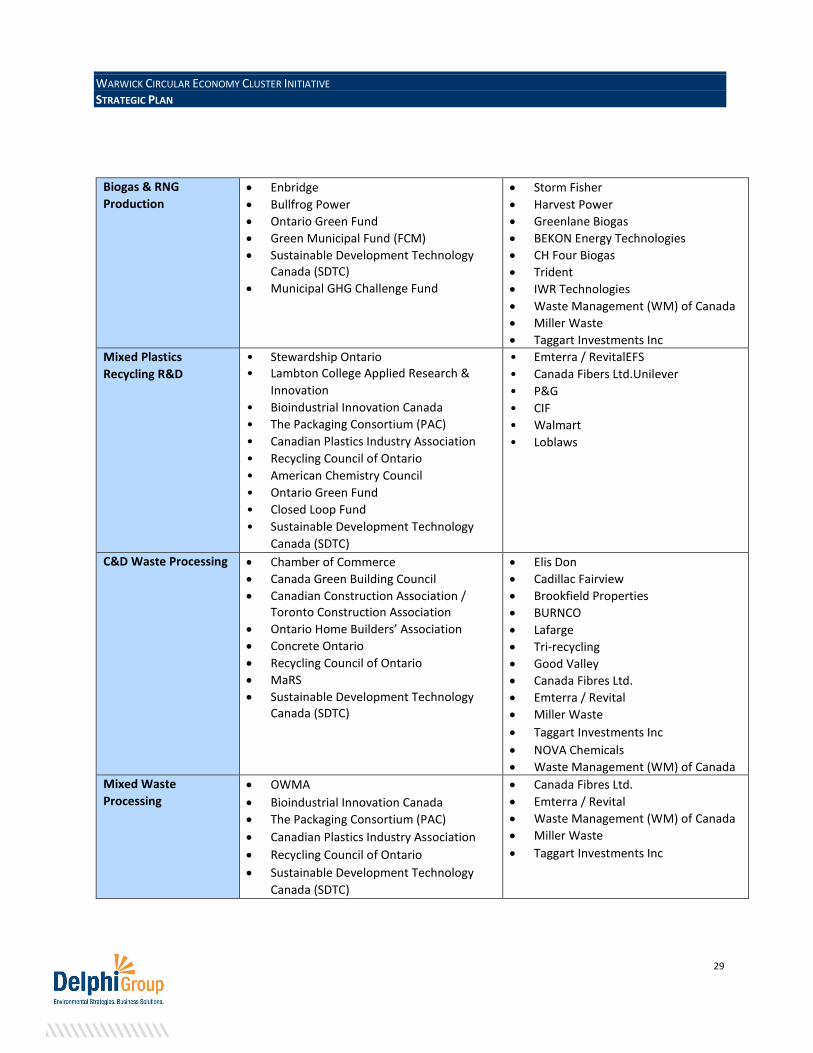
WARWICK CIRCULAR ECONOMY CLUSTER INITIATIVE STRATEGIC PLAN
29
Biogas & RNG
Production • Enbridge
• Bullfrog Power
• Ontario Green Fund
• Green Municipal Fund (FCM)
• Sustainable Development Technology Canada (SDTC)
• Municipal GHG Challenge Fund
• Storm Fisher
• Harvest Power
• Greenlane Biogas
• BEKON Energy Technologies
• CH Four Biogas
• Trident
• IWR Technologies
• Waste Management (WM) of Canada
• Miller Waste
• Taggart Investments Inc
Mixed Plastics
Recycling R&D • Stewardship Ontario • Lambton College Applied Research &
Innovation
• Bioindustrial Innovation Canada
• The Packaging Consortium (PAC)
• Canadian Plastics Industry Association
• Recycling Council of Ontario
• American Chemistry Council
• Ontario Green Fund
• Closed Loop Fund
• Sustainable Development Technology
Canada (SDTC)
• Emterra / RevitalEFS
• Canada Fibers Ltd.Unilever
• P&G
• CIF
• Walmart
• Loblaws
C&D Waste Processing • Chamber of Commerce
• Canada Green Building Council
• Canadian Construction Association / Toronto Construction Association
• Ontario Home Builders’ Association
• Concrete Ontario
• Recycling Council of Ontario
• MaRS
• Sustainable Development Technology Canada (SDTC)
• Elis Don
• Cadillac Fairview
• Brookfield Properties
• BURNCO
• Lafarge
• Tri-recycling
• Good Valley
• Canada Fibres Ltd.
• Emterra / Revital
• Miller Waste
• Taggart Investments Inc
• NOVA Chemicals
• Waste Management (WM) of Canada
Mixed Waste
Processing • OWMA
• Bioindustrial Innovation Canada
• The Packaging Consortium (PAC)
• Canadian Plastics Industry Association
• Recycling Council of Ontario
• Sustainable Development Technology
Canada (SDTC)
• Canada Fibres Ltd.
• Emterra / Revital
• Waste Management (WM) of Canada
• Miller Waste
• Taggart Investments Inc

WARWICK CIRCULAR ECONOMY CLUSTER INITIATIVE STRATEGIC PLAN
30
5.4 Risks
Below are a number of risks that may influence negatively on this Strategic Plan and should be considered going forward. Developing mitigating approaches to these risks will help ensure a higher likelihood of success.
• Potential changes in government shifts policy focus away from circular economy and incoming waste
regulations. With an election around the corner, there is risk that legislation that has been past (e.g., Cap and Trade) may be overturned if the PCs win. There is also risk that policy that has been implemented, like the Strategy for a Waste Free Ontario, will also be overturned.
• Timelines around regulation and program roll-outs. At present, no timelines have been released with respect to
actions related to the circular economy strategy, expected regulations, forthcoming GHG protocols, forthcoming
landfill bans (with the exception of organics) or the release of new EPR programs as per noted in the Council of
Ministers of the Environment Action Plan (e.g., furniture, construction and demolition, carpet). This poses a risk
with respect to the exact timing and planning of selected opportunities for SLEP / Warwick to pursue.
• Limited market demand for recycled / refurbished products. There is limited existence of secondary markets for
recycled products at the present time, which may make it hard to convince industries to help develop a new
market. Virgin materials and new products are often cheaper that recycled products and perceptions can be that
recycled, refurbished, or remanufactured products are of lower quality.
• Threat of status quo. Without a strong market pull / demand, industry may not see the long-term value of
developing circular economy practices. In addition, local partners involved in the waste management industry
may not be interested in changing their current business models to explore new approaches and take risks. Some
in the private sector would likely aggressively advocate against 3R regulations given a perceived increase in
overall waste management fees in an effort to minimize costs.
• Current low energy costs. Industries reliance on low-price natural gas could mean an unwillingness to look at
alternative energy sources and/or that RNG from AD sources will be challenged to compete with alternatives
(e.g., biogas from landfill) in an open market and without subsidies and carbon pricing.
• Proximity to the United States. Tax incentive, exchange rates, free trade agreement challenges, and other
economic factors may influence negatively on investment decisions in Canada versus the United States (i.e.,
Michigan) for opening up commercial facilities. In addition, landfilling in the U.S. is often cheaper than in Canada,
which means that waste is sent over the border in many cases further challenging the business case.
WARWICK CIRCULAR ECONOMY CLUSTER INITIATIVE STRATEGIC PLAN
31
APPENDICES
Appendix A: Ontario’s Circular Economy Policy Drivers
Despite efforts by all levels of governments over the last four decades, Canada’s performance lags behind other G8 and Organisation for Economic Cooperation and Development (OECD) countries when it comes to municipal solid waste (MSW) diversion and disposal. By comparison, Germany, the country which recycles and composes the highest percentage of its municipal waste, recycles 65%. Even compared to the U.S., which recycles 35% of its total municipal waste, Canada lags37. In 2015, Canada’s combined recycling rate was 27%. Ontario as a province has a diversion rate of 22.9%, which is lower than several other provinces, including BC (35.4%) and Nova Scotia (42%).38 Currently, there is no nation-wide waste management strategy; however, international, national, and provincial policies are all driving the shift for producers, consumers, the waste sector and jurisdictions to the circular economy. The major policy drivers described in this chapter include:
• Waste Free Ontario Act;
• Strategy for Waste Free Ontario;
• Food and Organic Waste Framework;
• Landfill bans;
• Ontario’s Cap and Trade;
• Council of Ministers of the Environment Action Plan; and
• China’s National Sword bans.
Waste Free Ontario Act.
What is the Waste Free Ontario Act. In 2016, Ontario passed the Waste Free Ontario Act39 (WFOA) with an aim to move zero waste to landfills, create jobs and fight climate change. The legislation tackles the issue of waste generation by increasing resource recovery and promoting the Circular Economy. Under this legislation, producer responsibility will soon shift to 100%, meaning producers will be responsible for the full cost associated with the end-of-life management of their products and packaging. The Waste-Free Ontario Act includes two acts:
• Resource Recovery and Circular Economy Act (RRCEA), 2016 that sets overarching provincial direction and
establishes a new full producer responsibility regime for designated items including Printed Paper and Packaging
(PPP), Municipal Hazardous and Special Waste (MHSW), Waste Electronic and Electronic Equipment (WEEE) and
waste tires. The RRCEA establishes and empowers the Resource Productivity and Recovery Authority (RPRA) to
enhance provincial direction and oversight. RPRA, which replaced Waste Diversion Ontario (WDO), will be
responsible for overseeing the transition of current programs to the new waste framework and for compliance
and enforcement, under both the current and new waste frameworks.
37 Environment at a Glance 2015: OECD Indicators; http://www.keepeek.com/Digital-Asset-Management/oecd/environment/environment-at-a-glance-2015_9789264235199-en#page50 38 https://www.ccme.ca/files/Resources/waste/wst_mgmt/State_Waste_Mgmt_in_Canada%20April%202015%20revised.pdf 39 Bill 151, Waste-Free Ontario Act, 2016: http://www.ontla.on.ca/web/bills/bills_detail.do?locale=en&BillID=3598

WARWICK CIRCULAR ECONOMY CLUSTER INITIATIVE STRATEGIC PLAN
32
• Waste Diversion Transition Act (WDTA), 2016, which replaces the Waste Diversion Act, 2002 and streamlines the
current waste diversion programs (Blue Box, Municipal Hazardous or Special Waste, Waste Electrical and
Electronic Equipment; and Used Tires) to a new producer responsibility framework40. This legislation allows for
wind-up of the existing waste diversion programs and Industry Funding Organizations that operate these
programs.
Circular economy opportunities created by WFOA.
The Waste Free Ontario Act provides numerous opportunities for development of a circular economy approach as it:
• Encourages research and innovation in recycling processes and requires producers to take full environmental and
financial responsibility for their products and packaging;
• Shift responsibility to producers, which may lead to lower recycling costs and give consumers access to more
convenient recycling options;
• Focuses on reducing GHG emissions from the waste industry especially with respect to the avoidance of landfilling
products that could be recycled or composted; and
• Creates better opportunities to develop sustainable end markets and provide incentive on green procurement
practices to build market demand for recovered materials.
Overall, the WFOA and its subsequent policies and regulation will create economic opportunities. According to a
Conference Board Study, increasing overall waste diversion rate to 60% could create close to 13,000 net new jobs in
Ontario, and increase GDP by $1.5 billion.
Strategy for a Waste Free Ontario.
The Strategy for Waste Free Ontario41 provides a strategic plan by the provincial government to fight climate change by reducing landfilled materials and developing a circular economy. The strategy provides vision, goals, objectives and key actions to increase waste diversion across the Province. It is driven by two aspirational goals: 1) to achieve zero waste; and 2) to have zero GHG emission from the waste sector. One of the most relevant actions under the strategy is to implement disposal bans on identified materials (e.g., organic waste, beverage containers, corrugated cardboard, paper materials, fluorescent bulbs and tubes, other materials under existing programs, etc.). Currently, organic collection is available at varying municipalities across Ontario for the residential sector, providing an alternative to landfilling organic material. This reduces GHGs, as decomposing organic waste emits methane gas, which is twenty-five times more harmful to our climate than CO₂42. While the Industrial, Commercial and Institutional (IC&I) sectors are not currently required to have source separated organics (food waste), the Strategy acknowledges that “the province has committed to banning waste from disposal (e.g. landfill, incineration) to increase diversion of these wastes and reduce GHG emissions.”
40 https://www.ontario.ca/page/strategy-waste-free-ontario-building-circular-economy 41 Strategy for WFO: https://www.ontario.ca/page/strategy-waste-free-ontario-building-circular-economy 42 Ministry of the Environment and Climate Change.

WARWICK CIRCULAR ECONOMY CLUSTER INITIATIVE STRATEGIC PLAN
33
The Strategy does not suggest any timeframe for a food waste disposal ban, however the province has launched a stakeholder-working group to inform the development of an action plan to address food and organic wastes. For materials under existing waste diversion programs, a ban is tentatively set to begin in 2021. The Strategy mentions that there will be amendments to the 3Rs Regulations based on the Waste Free Ontario Act. The goal of these amendments will be to help the IC&I sectors, which only diverts 13% of their waste, understand their waste streams and develop pans to reduce, reuse and/or recycle their waste43. There are a number of Ontario regulations that set a wide range of requirements for establishments such as restaurants, hospitals, and hotels, including: O. Reg. 102/94 (Waste Audits and Waste Reduction Work Plans), O. Reg. 103/94 (Industrial, Commercial and Institutional Source Separation Programs), and 104/94 (Packaging Audits and Packaging Reduction Work Plans). These establishments are set to undergo evaluation for amended 3Rs Regulations during a period of consultation planned for 2018 with implementation scheduled for 2019. The Strategy also ambitiously puts forth plan to drive resource productivity upstream in products’ lifecycles to reduce overall environmental impact. In the Strategy, Ontario vaguely states that it would use a variety of tools and actions to encourage producers to show leadership and innovation in resource productivity to prevent waste. It is expected that future regulations will include incentives for packaging that demonstrate low carbon emission life cycles, reusability, high recyclability and/or include recycled content. As a result, we may see a greater demand for recycled content in products (e.g. automobile or the construction sectors) and packaging (e.g. consumer packaged goods (CPG) sector) may increase across numerous industries.
The Food and Organics Waste Framework.
In November 2017, and on the heels of the Circular Economy Strategy, the Ontario government introduced the Food and Organic Waste Framework with the following key objectives:
• Reduce food and organic waste;
• Recover resources from food waste and organic waste;
• Support resource recovery infrastructure; and
• Promote beneficial uses of recovered resources
The framework highlights that globally, food waste represents the third highest GHG emissions by any country in the world after China and the United States. In Ontario, 3.6 million tonnes of food and organic waste is generated annually and more than 60 per cent of it is lost to disposal. Under the framework, the following broad range of materials are included:
• Surplus food;
• Food waste;
• Food processing / manufacturing waste and by-products;
• Soiled paper;
• Leaf and yard waste;
• Compostable products and packaging; and
• Bio-solids
43 Strategy for Waste Free Ontario: https://www.ontario.ca/page/strategy-waste-free-ontario-building-circular-economy#foot-19
WARWICK CIRCULAR ECONOMY CLUSTER INITIATIVE STRATEGIC PLAN
34
The final materials to be considered under the framework will be based on environmental and economic opportunities. This includes an analysis of the viability of existing or potential end-markets; the recovery of high-volume resource streams to increase diversion; emerging trends in the marketplace for the production, use and/or processing of materials; the potential costs and benefits, including cost efficiency and program effectiveness; and effectiveness of the current process to manage the material. The Food and Organics Framework could set targets to have 40% of organic wastes diverted by 2025 and 60% by 203544. The benefit of diverting organics will not only save landfill space, reduce GHGs, but will also create economic benefits. It is estimated that for every 1000 tons of organic waste diverted generates 60% more GDP and 40% more jobs than landfilling45. In addition, Ontario’s Ministry of the Environment and Climate Change estimates that increasing the diversion of organic waste from current levels by an additional 50% could save up to 414,000 tonnes of landfill space per year. It also would benefit the environment as increasing Ontario’s organic waste diversion rate by 10% would avoid an additional 275,000 tonnes of GHG emissions.
Landfill Disposal Bans.
Ontario aims to use disposal bans to improve material diversion and promote reuse and recycling streams. Along with improved diversion, this will drive investment in diversion infrastructure and support the development of end-markets. Considering that existing infrastructure may not be sufficient to immediate disposal bans, therefore bans are being phased in over time. The key factors in assessing the viability of disposal bans on particular wastes include:
• Materials best suited for early disposal bans;
• Adequate and effective alternatives to disposal;
• Costs and benefits:
• Reporting and data requirements;
• Existing infrastructure capacity and future needs;
• Roles of producers, generators and service providers in supporting disposal bans; and
• Compliance and enforcement approaches based on modern regulatory principles and practices
The first materials considered for disposal bans include:
• Food waste;
• Materials designated under existing waste diversion programs;
• Beverage containers;
• Corrugated cardboard and some paper materials; and
• Fluorescent bulbs and tubes
44 Strategy for Waste Free Ontario: https://www.ontario.ca/page/strategy-waste-free-ontario-building-circular-economy#foot-19 45 Ministry of the Environment and Climate Change: http://www.downloads.ene.gov.on.ca/envision/env_reg/er/documents/2015/012-5834_DraftStrategy.pdf

WARWICK CIRCULAR ECONOMY CLUSTER INITIATIVE STRATEGIC PLAN
35
Mattresses, carpets, clothing and textiles, and furniture are also rumored to be planned for a disposal ban but this has not been formally confirmed46. In order to implement disposal bans on the above materials, there will need to be appropriate information, awareness and programs for consumers to avoid disposing of the banned materials. This provides an opportunity to create circular economy hubs for materials, especially to create higher value recycled material.
Ontario’s Cap-and-Trade Program.
What is the Cap-and-Trade Program. The Ontario Regulation 144/16, Cap-and-Trade program, was passed under the Climate Change Mitigation and Low-carbon Economy Act, 2016. The objective of the regulation is to help fight climate change, and reward businesses that reduce their GHG emissions. Under the regulations, the entities that meet one or more of the criteria below, must register as Mandatory Participants. Such entities must report and verify their GHG emissions from approved verification agencies. These entities include:
• Fuel suppliers - that first place 200 litres or more of fuel per year on the Ontario market;
• Electricity importers;
• Natural gas distributors emitting 25,000 tonnes or more of GHG emissions per year; and
• Facilities generating 25,000 tonnes or more of GHG emissions per year from one or more of the activities
listed in Table 2 of O. Reg. 143/16 (provided in annexure)
Under the regulations, the entities that meet one or more of the criteria below, must report their GHG emissions but are not required to verify their GHG emissions:
• Natural gas distributors emitting more than 10,000 tonnes but less than 25,000 tonnes of GHG emissions;
and
• Facilities generating more than 10,000 tonnes but less than 25,000 tonnes of GHG emissions from one or
more of the activities listed in Table 2 of O. Reg. 143/16 (provided in annexure).
Such entities may choose to be part of the cap and trade program as Voluntary Participants. If an entity chooses to opt in as a voluntary participant in the cap and trade program it will be required to have its GHG emissions verified. The regulation “O. Reg. 143/16: Quantification, Reporting and Verification of Greenhouse Gas Emissions” provides the modalities of reporting. In addition, there is “Guideline for Quantification, Reporting and Verification of Greenhouse Gas Emissions – 2017” that provides step by step calculation guidance for various industry sectors.47
Opportunities for the Waste Sector under the Cap-and-Trade program. The cap-and-trade scheme is expected to have limited impact on the waste management sector in terms of capped participants, however it may present more opportunities to generate and trade carbon offsets based on the design of offset protocols.
46 Strategy for Waste Free Ontario: https://www.ontario.ca/page/strategy-waste-free-ontario-building-circular-economy#foot-19 47 Ontario Cap & Trade Program: https://www.ontario.ca/page/cap-and-trade
WARWICK CIRCULAR ECONOMY CLUSTER INITIATIVE STRATEGIC PLAN
36
There are three offset protocols that can have key impact on waste sector: 1. Landfill Gas Capture and Destruction
• Landfills are largest emitter of emissions in the waste industry due to release of methane emissions
generated from the anaerobic decay of the organic components of waste.
• This protocol is applicable to landfills that capture landfill gas not mandated by law (less than 1.5 million
cubic meters).
2. Anaerobic Digestion (Wastewater treatment and Manure)
• Projects that divert and anaerobically treat eligible organic waste and/or wastewater streams that
otherwise would have gone to solid waste landfills or on-site uncontrolled anaerobic wastewater
treatment facilities.
• Anaerobic digestion of organics can also generate carbon offsets through the electricity production from
the combustion of biogas.
3. Organic Waste Management
• Projects that avoid methane emissions into the atmosphere through the diversion and composting of food
waste that would otherwise have been sent to landfill.
• Avoidance of organics to landfill and creates feedstock for alternative organic waste treatment methods
i.e. composting and anaerobic digestion
Protocols #2 and #3 are expected to significantly support the development of the organics treatment market in relation to both Anaerobic Digestion and Composting.
Opportunities for industries to develop circular economy strategies under the Cap and Trade program. The Cap and Trade program could create opportunities for hydrogen power and hydrogen based power. This may be an opportunity for chemical industry, in particular. For example, the petrochemical industry in Sarnia current fracks natural shale gas from U.S. (also currently exploring other opportunities to frack in the Sarnia) and supplies to the Chemical Industry (eg. Nova Chemicals). As part of this process, methane escapes and creates GHG emissions. To address this problem and reduce GHGs and the amount of fracked natural gas, methane could be captured and used from the fracking to manufacture CO2 free hydrogen. The hydrogen could then be burned or converted to electricity in a fuel cell—including mobile fuel cells that power cars. Transportation that runs on hydrogen would reduce emissions and could also help improve air quality48. This is one example of how the cap and trade program could incentive industries to develop systems that help close their production loop.
48 Interview with Arthur Potts, MPP, MOECC
WARWICK CIRCULAR ECONOMY CLUSTER INITIATIVE STRATEGIC PLAN
37
Council of Ministers of the Environment Action Plan.
In 2009, the Canadian Council of Ministers of the Environment (CCME) approved the Canada-wide Action Plan for Extended Producer Responsibility of 2009 (CAP-EPR)49, which would develop and streamline regulations around Extended Producer Responsibility (EPR). EPR extends producer’s responsibility for their products to “the postconsumer stage of a product’s life cycle.” By further developing the EPR programs, the objective is to increase diversion, increase producers’ awareness of end-of-life management and shift the physical and financial burden onto producers. These programs would improve the overall life-cycle performance of products, including reducing associated GHG emissions in an effort to drive circular economies. Under the terms of CAP-EPR, there are two phases that committed jurisdictions are working towards to develop EPR legislation, regulation or requirements of EPR programs, which should be aligned with the following timelines and priority products/materials: 1. Phase 1 Product Categories, by 2015
• Packaging – all packaging currently handled by municipalities or generated from the industrial, commercial and institutional sectors, e.g., PET (#1) and HDPE (#2) plastics, steel and aluminum cans, glass bottles or jars, aseptic (juice) boxes, gable top cartons.
• Printed Materials – printed materials will be included in all packaging EPR programs, e.g., newspapers, advertising flyers, magazines, directories.
• Mercury-containing lamps – including compact fluorescents lamps (CFLs) and other lamps containing mercury as identified in CAP-EPR, Appendix I50.
• Other mercury-containing products – thermostats, thermometers, barometers, or other measuring devices and switches, as identified in CAP-EPR, Appendix I51.
• Electronics and electrical equipment – all products identified on the common list of CCME recommended electronics in CAP-EPR, Appendix D, e.g., laptop computers, televisions, cell phones, DVD players52.
• Household hazardous and special wastes – all products identified in the common list in CAPEPR, Appendix F, e.g., paints, coatings, solvents and their containers, fertilizers and pesticides, including containers, pharmaceuticals and sharps53.
• Automotive products – used crankcase oil, filters and containers, lead acid batteries, lamps, tires, refrigerants and anti-freeze, brake, transmission, other fluids and their containers.
• In addition, existing programs for the Phase 1 product categories that were established before the adoption of CAP-EPR will be reviewed by jurisdictions within the context of CAP-EPR by 2015.
2. Phase 2 Product Categories, by 2017 onwards: Jurisdictions commit to working to incorporate into operational EPR programs the following product categories, subject to further elaboration by CCME:
49 Canada Wide Action Plan, CCME: https://www.ccme.ca/files/Resources/waste/extended/CAP-EPR%20Progress%20Report.pdf 50 PN 1499- CAP-EPR, pg. 19: https://www.ccme.ca/files/current_priorities/waste/pn_1499_epr_cap_e.pdf 51 Ibid. 52 PN 1499 – CAP-EPR, pg. 37https://www.ccme.ca/files/current_priorities/waste/pn_1499_epr_cap_e.pdf 53 PN 1499 – CAP-EPR, pg. 40 https://www.ccme.ca/files/current_priorities/waste/pn_1499_epr_cap_e.pdf
WARWICK CIRCULAR ECONOMY CLUSTER INITIATIVE STRATEGIC PLAN
38
• Construction materials
• Demolition materials
• Furniture
• Textiles and carpet
• Appliances, including ozone-depleting substances (ODS).
The above Phase 2 categories may represent key opportunities in the circular economy market moving forward.
Potential impacts of China National Sword.
China’s National Sword creates uncertainty for the recycling industry. China’s importation bans created uncertainty for the future of the recycling industry, not only in Ontario, but globally. These threats could result in a significant decline of commodity pricing due to additional closures of reclaimers, specifically plastic reclaimers, and the potential for municipalities to cease collection of certain materials. In addition, the types of packaging introduced by producers are increasingly complex, which introduces new sorting challenges. However, as Ontario moves towards full producer responsibility, there is opportunity to address these issues. In addition, companies like Tetra Pak, Kellogg, Unilever, Walmart and many others continue to push toward aggressive sustainable and zero waste goals and development of domestic market capacity. Perhaps the pending ban(s) and legislated recycling targets will spark opportunities for further domestic market development in Ontario. In light of the China Sword and the New Plastics Economy initiative led by the Ellen MacCarthur Foundation, it is believed by experts across the recycling spectrum, that the plastics industry could see the greatest downstream opportunities for recycling market development in the short to medium term. Private industry is already stepping up – many companies have committed to the New Plastics Economy, which will spur demand for recovered plastics and innovation to recycle more types of plastics.
WARWICK CIRCULAR ECONOMY CLUSTER INITIATIVE STRATEGIC PLAN
39
Appendix B: Current Status of Ontario’s Circular Economy
History of recycling in Ontario.
The development of recycl ing in Ontario Ontario’s recycling program started as the world’s first curbside recycling program in 1981 with its Blue Box program. The Blue Box program offers recycling services to home-owners and industrial producers, and applies to printed paper and packaging. The administration and funding for the program is shared between municipalities and industry producers. Since the 1980s, the Blue Box program has become a blueprint for recycling programs in more than 150 countries around the world. By 2012, over 220 municipalities offered residential recycling programs, and Blue Box is used by 90% of individuals across the province. Ontario’s waste diversion rate for residential printed paper and packaging is the highest in North America. Overall, the Blue Box program has achieved a 64% diversion rate since the early 2000s, and has a job multiplier rate of 2.97. One of the first legislations in Ontario to promote waste reduction, reuse, and recycling, The Waste Diversion Act (WDA), 2002, obligated companies that introduce packaging or printed paper, managed through the municipal waste system, to pay into a fund. Until recently, this fund pays Ontario municipalities a 50% share of the net cost of operating residential recycling programs. The WDA also established the Waste Diversion Ontario (WDO) as a non-Crown corporation to develop, implement, and operate waste diversion programs for a wide range of materials, including Blue Box wastes. WDO commissioned industry organization, Stewardship Ontario, to develop the Blue Box Program Plan. After 14 years, the WDA was replaced by the Waste Free Ontario Act, 2016 (WFOA) that establishes a new vision based on full-producer responsibility, both operationally and financially.
Diversion rates and recycling in Ontario.
Residential waste diversion
The residential waste diversion happening in Ontario provides insight into the types of waste streams that are available and could be developed into circular economy business opportunities. In addition, the Waste Free Ontario Act, the Food and Organic Framework, and the landfill bans, will change residential (and commercial) waste collection and management. As illustrated in Figure B1, in 2015, the overall residential waste diversion rate in Ontario was 47.7%54. This rate has only improved marginally over the past 5 years increasing by 1.2% from 2011 when it was 46.5%. In 2015, Ontario residents diverted over 2.3 million tonnes of residential waste or 14% more residential waste than they did 5 years earlier. On average, this amounts to around 367 kilograms of residential waste generated per person, a decrease of 1.1% in residential waste generation per person since 2009. The limited growth in diversion over the years has led to the provincial government taking action through the passing of Waste Free Ontario Act.
54 Resource Productivity & Recovery Authority: https://rpra.ca/datacall/

WARWICK CIRCULAR ECONOMY CLUSTER INITIATIVE STRATEGIC PLAN
40
Figure B1: Residential waste diversion rates in Ontario by year, 2010-2015.
In terms of waste streams across Ontario, in 2015, blue box recyclables (46.5%) and organics (40.3%) contributed the most to overall residential waste diversion efforts by weight (see Figure B2). As shown in the graphs below, in 2015 the total blue box recyclables collected/marketed were 852,437 tonnes and total non-blue box recyclables were 138,694 tonnes. Waste management programs, such as Blue Box, not only divert waste, but also create jobs. For the entire Blue Box program, including all downstream industries, the program supported 6.14 full-time equivalent (FTE) jobs per 1,000 tonnes, and had a jobs multiplier of 2.97.
Figure B2: Contribution to residential diversion in 2015 by sector.
Figures B3 and B4 break down the type of recyclables and quantities collected across Ontario. Some materials, such as printed paper, OCC/OBB, flint glass, PET, steel and mix plastic, which have higher collected quantities, might be opportunities for industry to reuse or remanufacture.
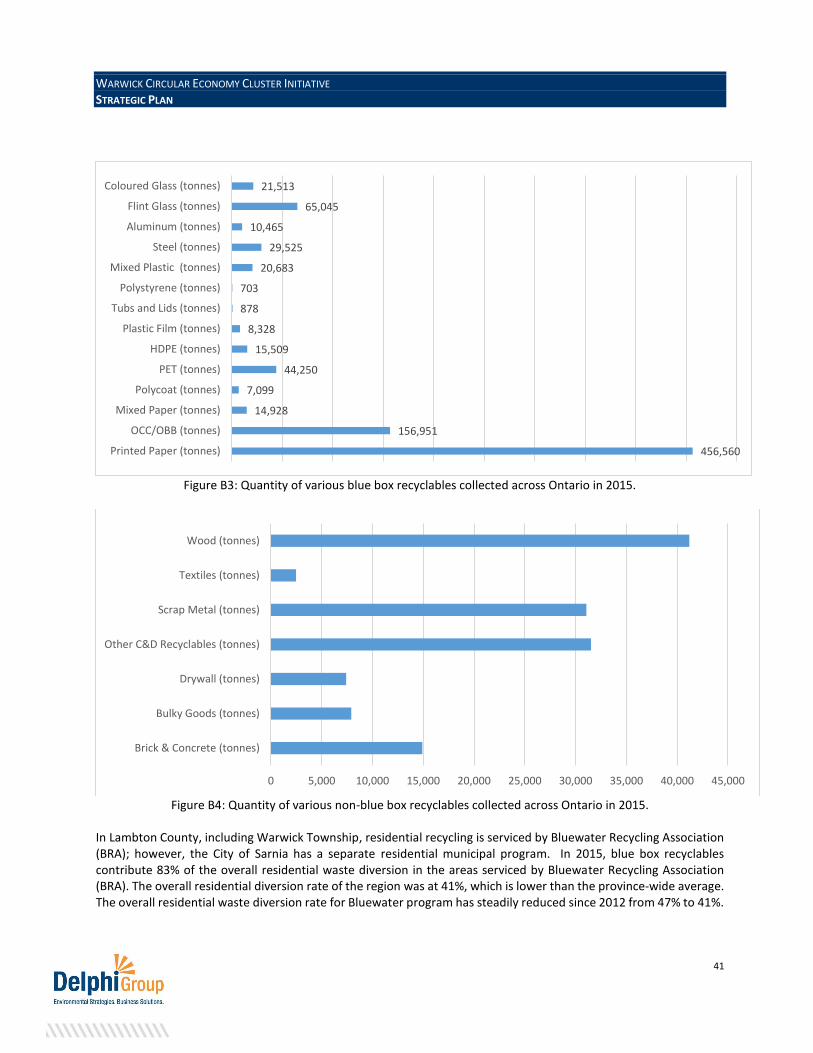
WARWICK CIRCULAR ECONOMY CLUSTER INITIATIVE STRATEGIC PLAN
41
Figure B3: Quantity of various blue box recyclables collected across Ontario in 2015.
Figure B4: Quantity of various non-blue box recyclables collected across Ontario in 2015.
In Lambton County, including Warwick Township, residential recycling is serviced by Bluewater Recycling Association (BRA); however, the City of Sarnia has a separate residential municipal program. In 2015, blue box recyclables contribute 83% of the overall residential waste diversion in the areas serviced by Bluewater Recycling Association (BRA). The overall residential diversion rate of the region was at 41%, which is lower than the province-wide average. The overall residential waste diversion rate for Bluewater program has steadily reduced since 2012 from 47% to 41%.
456,560
156,951
14,928
7,099
44,250
15,509
8,328
878
703
20,683
29,525
10,465
65,045
21,513
Printed Paper (tonnes)
OCC/OBB (tonnes)
Mixed Paper (tonnes)
Polycoat (tonnes)
PET (tonnes)
HDPE (tonnes)
Plastic Film (tonnes)
Tubs and Lids (tonnes)
Polystyrene (tonnes)
Mixed Plastic (tonnes)
Steel (tonnes)
Aluminum (tonnes)
Flint Glass (tonnes)
Coloured Glass (tonnes)
0 5,000 10,000 15,000 20,000 25,000 30,000 35,000 40,000 45,000
Brick & Concrete (tonnes)
Bulky Goods (tonnes)
Drywall (tonnes)
Other C&D Recyclables (tonnes)
Scrap Metal (tonnes)
Textiles (tonnes)
Wood (tonnes)

WARWICK CIRCULAR ECONOMY CLUSTER INITIATIVE STRATEGIC PLAN
42
RPRA also tracks non-Blue Box or other recyclables diverted from landfill each year, including: • Textiles; • Bulky goods; • Scrap metal; • Drywall; • Wood; • Brick and concrete; and • Other Construction & Demolition (C&D) materials.
Municipal recycling programs collected 138,694 tonnes of non-Blue Box recyclables in 2015. This represents a 1.4%
increase over 2014 and an overall 1.2% increase since 2011. As these materials are raw materials for many industries,
such as construction, there may be an opportunity for companies to recycle, reuse or remanufacture these into new
products.
The heavier materials such as wood, brick and C&D waste have represented recyclables tonnes for the past five years,
including 2015 (63.2%) as represented in Figure B5 below.55
Figure B5: Other residential recyclable materials collected in 2015.56
Textiles in particular is a growing concern. In Ontario, 85% of most textile waste ends up in landfills. That being said,
both consumers and retailers have begun to think about opportunities to close loops. In recent years, technological
advances have made it possible to recycle more waste.57 Ontario has identified textiles as a high priority and municipal
programs have been implemented in key municipalities, including Durham and Toronto.
56 2015 Non-Blue Box Recyclables Trends (Residential), RPRA 57 Beyond the Blue Box, Environment Commissioner of Ontario: http://docs.assets.eco.on.ca/reports/special-reports/2017/Beyond-the-Blue-Box.pdf

WARWICK CIRCULAR ECONOMY CLUSTER INITIATIVE STRATEGIC PLAN
43
Industrial , Commercial and Institutional ( IC&I) Waste
For the past 10 years, Ontario has only recycled about 25% of its waste and the situation has not improved. This means that over eight million tonnes of waste are sent to landfill each year 58 In Ontario, in 2014, the IC&I sectors produced 55% (6,668,089 tonnes) of the overall waste in Ontario, with a diversion rate of only 15% (993,000 tonnes). In 2006, the Ontario Waste Management Association (OWMA) concluded in a study that considerable amounts of waste data are missed through the Statistics Canada bi-annual survey and commissioned a study of waste diversion in Ontario to identify sources of additional waste diversion not captured in the government data. There is currently minimal data to identify trends in industrial and commercial waste. As such, in order to adequately plan for Ontario’s circular economy, the province needs a robust data governance system for the IC&I waste sector. More information, including performance information, will be particularly crucial in informing decision making around IC&I diversion programs. As per a recent report from the Environmental Commissioner’s Office, it was noted that the IC&I sectors, including construction, retail and manufacturing, have played too small of a role in diversion for too long. Since these sectors generate far more waste and divert much less than residences, Ontario cannot make substantial progress on its diversion goals towards a circular economy without the IC&I sectors pulling their weight. 59
Notable circular economy trends in Ontario.
Energy from waste.
Ontario has three approved EFW facilities. Of the three approved facilities, Algonquin Power in Peel Region is a full-sized operating EFW facility and can process up to approximately 180,000 tonnes of MSW and ICI waste annually. The second one, the Durham York Energy Centre, processes municipal household waste left over after recycling and composting. The facility also recycles ferrous and non-ferrous metals.60 A third one is a demonstration facility in Ottawa (Plasco) utilizing new gasification technology – approved to process up to 85 tonnes MSW per day. Another facility (Entech-REM), to be located near Port Hope, is undergoing the environmental screening approval process and utilizes a new gasification technology. 61 Generally speaking however, the Ontario government is relatively anti-EfW although this may change considering Europe’s position on the topic and the GHG mitigation benefits. Based on recent discussions with Ministry of Environment and Climate Change leadership, the government may become more open to clean waste to energy solutions in an effort to meet the Province’s climate action targets.
58 Strategy for a Waste Free Ontario, Ministry of Environment & Climate Change: https://files.ontario.ca/finalstrategywastefreeont_eng_aoda1_final-s.pdf 59 Beyond the Blue Box, Environment Commissioner of Ontario: http://docs.assets.eco.on.ca/reports/special-reports/2017/Beyond-the-Blue-Box.pdf 60 State of Waste Management in Canada: https://www.ccme.ca/files/Resources/waste/wst_mgmt/State_Waste_Mgmt_in_Canada%20April%202015%20revised.pdf 61 Ontario waste to energy plant begins operations: http://www.power-eng.com/articles/2016/02/ontario-waste-to-energy-plant-begins-operations.html

WARWICK CIRCULAR ECONOMY CLUSTER INITIATIVE STRATEGIC PLAN
44
Organics treatment Given a large portion of Ontario’s waste is made up of organics as well as the GHG implications, there is a significant focus on organics waste treatment both internationally and provincially. In 2015, a total of 1,024,440 tonnes of residential organic materials were reported in Ontario as having been collected in Ontario. This tonnage is the total quantity of all organics streams listed above, and represents the amount collected for processing. Organics processing facilities include compost facilities, anaerobic digestion plants, and wood- and brush-chipping operations.62 Since 2011, the amount of organic material collected has increased by 16.4%. Between 2014 and 2015, the tonnes of collected organic material decreased by 2.1%. Over the past five years, the average annual increase in organics tonnes collected was 3.8%. Ontario is a leader in North America with respect to (AD), with over 30 biogas facilities operating in 2014 on farms and at centralized locations. Prior to 2000, farm-based anaerobic digestion served primarily as a method of treating manure. It is now attracting interest as a way of generating renewable energy, especially with revenue opportunities from electricity sales.63 As noted earlier, with Cap and Trade Protocols forthcoming over the next few years and an organics landfill ban expected by 2022, it is expected that opportunities for both composting and anaerobic digestion (AD) processing will be on the rise.
Businesses and associations active in Ontario’s circular economy.
Industry groups that serve Ontario’s recycling sector. The recycling industry has been well served by various industry groups. Some of the noted industry groups or associations are listed in the table below. Industry Group What it is. What it does.
Created in 1978 to help Ontario's struggling recycling operators cooperatively market the newspapers, glass, and metal cans, which they were collecting from community recycling depots and door-to-door drives64.
• Builds awareness of waste issues and opportunities to eliminate it through the 3Rs.
• Provides information and resources to the Industrial, Commercial & Institutional (IC&I) sector.
• Provides the public with information and resources through various programs.
• Recognize best practices through Awards program. • Improve Ontario's diversion rate through the
development of innovative stewardship programs.
62 Organics Trends - 2015, RPRA https://rpra.ca/wp-content/uploads/2017/10/2015-Organics-Residential.pdf 63 Bio Gas in Ontario, Ministry of Agriculture: http://www.omafra.gov.on.ca/english/engineer/ge_bib/biogas.htm 64 Recycling Council of Ontariohttp://www.rco.on.ca/

WARWICK CIRCULAR ECONOMY CLUSTER INITIATIVE STRATEGIC PLAN
45
Ontario’s largest environmental association which represents over 275 members, including private sector companies; municipalities and organizations and individuals involved in the waste management sector in Ontario65. The members manage over 85% of the province’s waste as they are involved in waste and recycling collection, landfills, transfer stations, material recycling facilities, organics processing and composting.
• Develops detailed research and provide expert advice with the objective of increasing recycling.
• Addresses climate change and fostering investment and innovation in the waste management sector.
• Provides opportunities for members to network together while supporting their professional development and career growth with educational events and webinars.
A not-for-profit corporation that includes over 2,500 members throughout the packaging value chain66. The key aim of PAC is to develop resources, provide opportunities to learn and network among its members on topics related to packaging.
• Organizes webinars, seminars, conferences, competitions, facility tours, education programs, trade shows, technical work groups and social activities (golf tournaments) for its members.
Launched in 2016, the lab brings together public and private sector leaders from different industries and value chains to develop and operationalize circular economy solutions67.
• Enables governments and businesses to understand the opportunities, barriers and strategies for advancing the circular economy within their organizations, value chains and the province as a whole.
• Works with partners to identify, incubate and scale circular products, services, policies, business models and strategies.
• Increases circular economy awareness, understanding and commitment through strategic research, communications, education and engagement activities for stakeholders across Canada
The National Zero Waste Council is a leadership initiative bringing together governments, businesses and non-government organizations to advance waste prevention in Canada. Founded by Metro Vancouver in collaboration with the Federation of Canadian Municipalities in 2013, the Council has united, among others, six of Canada’s largest metropolitan regions – Metro Vancouver, Toronto, Montreal, Halifax, Calgary and Edmonton – with key business and
• The key mission of the Council is to act collaboratively with business, government and the community, at the national and international level, as an agent of change for waste prevention and reduction in the design, production and use of goods.
• Given that there is no Canada-wide Waste Management Strategy led by the Federal Government, the National Zero Waste Council is currently advocating to lead Canada’s first Zero Waste Strategy.
65 Ontario Waste Management Association: https://www.owma.org/ 66 PAC: http://www.pac.ca/ 67 Circular Economy Lab: http://circulareconomylab.com/

WARWICK CIRCULAR ECONOMY CLUSTER INITIATIVE STRATEGIC PLAN
46
government leaders, academia and non-profit organizations in a call for national action and systems change to address waste generation.
A number of companies in Ontario are beginning to take part in the Circular Economy through waste reduction or reuse of existing materials. A summary list of companies and their work can be found in the table below.
Company Circular Economy Initiative
Ice River Springs, a beverage company, manufactures new PET water bottles from 100% post-consumer waste. This helps the company create a closed-loop manufacturing process. In addition, after delivering water to customers, it recovers bales of plastic from municipalities68.
Emterra Group’s Canadian Liquids Processors Limited takes waste beverages and pharmaceuticals and converts them into ethanol, and then creates a non-toxic, windshield washer fluid. The company also recovers 96% of its packaging and recycles it69.
The Beer Store’s voluntary beer bottle-deposit return program recovers around 2 million containers annually. 99% of the recoverd bottles can be reused by more than 45 brewers, which diverts more than 400,000 tons of material from landfills70.
Club Coffee developed the first 100% compostable single-use coffee pods with researchers from Guelph University. The compostable pod will help reduce the waste of coffee pods that go to landfills as well as the plastic used for the coffee pod cup71.
Cascades Recovery manufactures polystyrene foam meat trays using recycled content and its plans create less than 1% waste72.
Green Standards takes old office furniture and either resells it, donate it, or recycles it73. The company operates in Canada and the U.S.
68 http://circulareconomylab.com/wp-content/uploads/2017/03/printed-paper-and-packaging-rapid-lab-report.pdf 69 http://circulareconomylab.com/wp-content/uploads/2017/03/printed-paper-and-packaging-rapid-lab-report.pdf 70 Ibid. 71 http://zerowasteontarioconference.ca/zero-waste-materials-innovations/ 72 http://cbsr.ca/2017/07/20/bending-line-closing-loop-demystifying-circular-economic-system/ 73 http://greenstandardsltd.com/how-it-works/

WARWICK CIRCULAR ECONOMY CLUSTER INITIATIVE STRATEGIC PLAN
47
Large multi-national corporation are also taking action to reduce their waste. For example, Dell takes back old computers and uses the plastic waste for its OptiPlex 3030 Desktop Computers. Another is Ford’s Oakville plant uses returnable packaging for its auto parts delivery74. Other MNCs that are trying to limit their waste are Sony, Bayer, Levi’s, DuPont, H&M, Speedo, Adidas, Nike, IKEA, and more.
Circular economy-related start-ups working in Ontario.
Start-ups have formed in Southern Ontario whose mission is to reduce waste and consumption. While there are many start-ups that provide services and/or products related to the green economy, the ones featured below are recycling and upcycling materials that in a linear economy would be disposed of.
Company What they do.
Nudnik, a Toronto-based company, makes children’s clothes from scraps of old fabric in Toronto75
Boro is a peer-to-peer marketplace for women’s clothing. It allow clothing to be rented or lent, reusing clothing that may otherwise have been thrown away and reduces the purchase of new clothes76.
Tryomer is a Waterloo based company that has developed a way to re-process used tires into synthetic rubber77.
The Bio-industrial Innovation Canada also has a list of small and medium sized enterprises (SMEs) throughout Canada that have a focus on bio-material products.78
The reuse, remanufacturing, recycling, and waste management sectors in Southern Ontario.
Industry overview As this project’s focus is on developing a circular economy centred around opportunities related to the waste, reuse, recycling and remanufacturing, the industry subsector that is most relevant is the Waste Management and Remediation Services subsector (NAICS code 562). This industry subsector includes waste collection, treatment and disposal services, environmental remediation services, septic tank services and material recovery facilities79 In Southern Ontario, there are around 4,715 people employed in this sector. In Lambton County, there are 478 employees across 22 different employers in this subsector. The majority of these employers in Lambton are small and have between 10-99 employees. The following two charts provide a breakdown of employment in the Waste Management and Remediation Services subsector:
74 http://www.downloads.ene.gov.on.ca/envision/env_reg/er/documents/2015/012-5834_DraftStrategy.pdf 75 https://littlenudniks.com/ 76 https://boroit.ca/boro-works/ 77https://www.therecord.com/news-story/4549168-university-of-waterloo-tire-recycling-startup-wins-tech-award/ 78 See likst here: https://docs.wixstatic.com/ugd/b22338_57da6f858b0842f4bb2d9acf5d2e2190.pdf 79 The three NAICS codes for this subsector include 5621,5622, and 5629.
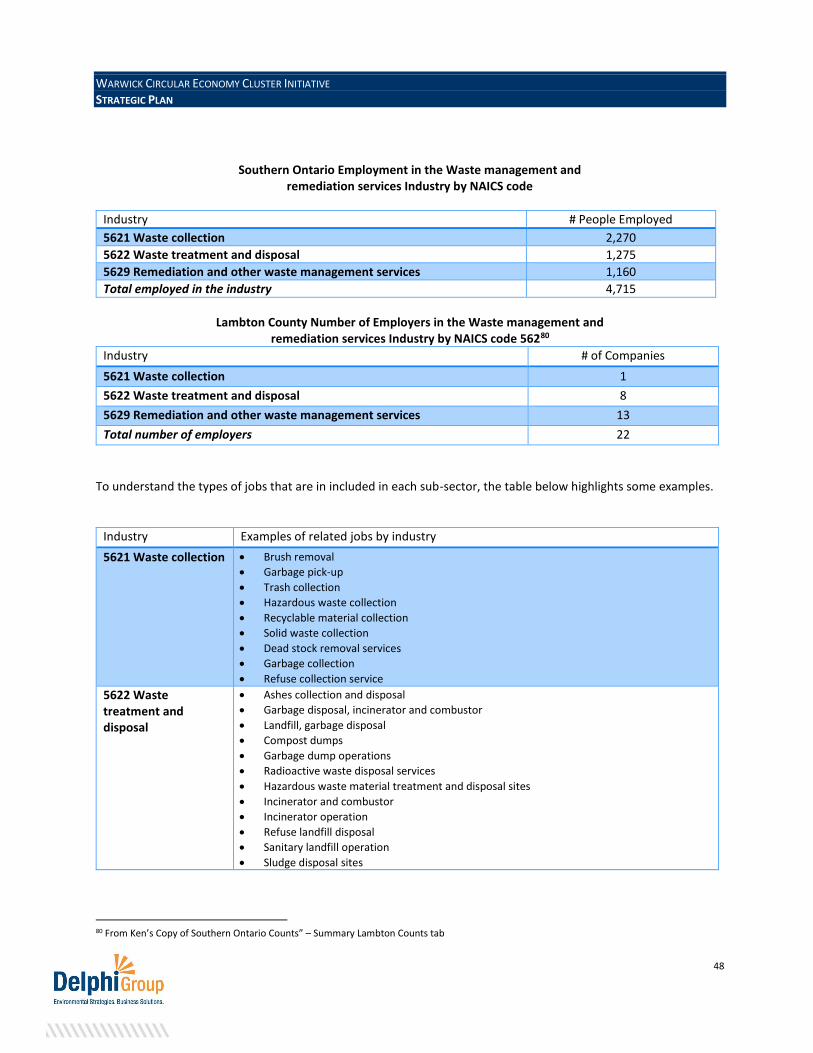
WARWICK CIRCULAR ECONOMY CLUSTER INITIATIVE STRATEGIC PLAN
48
Southern Ontario Employment in the Waste management and remediation services Industry by NAICS code
Industry # People Employed
5621 Waste collection 2,270
5622 Waste treatment and disposal 1,275
5629 Remediation and other waste management services 1,160
Total employed in the industry 4,715
Lambton County Number of Employers in the Waste management and
remediation services Industry by NAICS code 56280
Industry # of Companies
5621 Waste collection 1
5622 Waste treatment and disposal 8
5629 Remediation and other waste management services 13
Total number of employers 22
To understand the types of jobs that are in included in each sub-sector, the table below highlights some examples.
Industry Examples of related jobs by industry
5621 Waste collection • Brush removal
• Garbage pick-up
• Trash collection
• Hazardous waste collection
• Recyclable material collection
• Solid waste collection
• Dead stock removal services
• Garbage collection
• Refuse collection service
5622 Waste treatment and disposal
• Ashes collection and disposal
• Garbage disposal, incinerator and combustor
• Landfill, garbage disposal
• Compost dumps
• Garbage dump operations
• Radioactive waste disposal services
• Hazardous waste material treatment and disposal sites
• Incinerator and combustor
• Incinerator operation
• Refuse landfill disposal
• Sanitary landfill operation
• Sludge disposal sites
80 From Ken’s Copy of Southern Ontario Counts” – Summary Lambton Counts tab

WARWICK CIRCULAR ECONOMY CLUSTER INITIATIVE STRATEGIC PLAN
49
5629 Remediation and other waste management services
• Asbestos removal contractors
• Oil spill cleanup
• Contaminated site remediation
• Environmental remediation services
• Toxic material abatement services
• Lead paint removal contractors
• Material recovery facility
• Sorting, cleaning, and bailing of commingled recyclable materials
• Waste recovery facility
Spend on waste-related services. Based on national averages, it is estimated that the major industry sectors in Lambton county (i.e., manufacturing, retail, and healthcare) spend approximately the following amount annually on waste and remediation related services: Manufacturing ($364,860), Retail ($507,702), Health-care ($152,580)81. Basic chemical manufacturing is a particular manufacturing industry that spends the most on waste management and remediation services in relation to its total production at 0.4%. As the chemical sector is one of the major industrial sectors in Lambton County, this presents opportunities as a potential sector to target related to circular economy initiatives.
81 Acton White & Associates (2015): Waste Value Chain data table.

WARWICK CIRCULAR ECONOMY CLUSTER INITIATIVE STRATEGIC PLAN
50
Appendix C: Waste Diversion in Southern Ontario
Figure C1: Bluewater's total residential waste generated (tonnes) vs total residential diversion rate
Figure C2: Contribution to Bluewater program's residential diversion in 2015
34.00%
36.00%
38.00%
40.00%
42.00%
44.00%
46.00%
48.00%
-
5,000
10,000
15,000
20,000
25,000
30,000
35,000
40,000
45,000
2010 2011 2012 2013 2014 2015
Bluewater's total residential waste generated (tonnes) vs total residential diversion rate
Total residential waste generated (tonnes) Total Residential Diversion Rate
Residential deposit
program…
Residential Reuse0%
Residential On Property
11%
Residential Recyclables
Diverted83%
Residential Organics Diverted
1%
Residntial MHSW0%
Contribution to Bluewater program's residential diversion in 2015

WARWICK CIRCULAR ECONOMY CLUSTER INITIATIVE STRATEGIC PLAN
51
Figure C3: Quantity of various recyclables collected by Bluewater program in 2015
Figure C4: Quantity of various non-blue box recyclables collected by Bluewater program in 2015
1,609
1,920
5,853
112
532
215
80
3
2
257
491
173
782
249
Printed Paper (tonnes)
OCC/OBB (tonnes)
Mixed Paper (tonnes)
Polycoat (tonnes)
PET (tonnes)
HDPE (tonnes)
Plastic Film (tonnes)
Tubs and Lids (tonnes)
Polystyrene (tonnes)
Mixed Plastic (tonnes)
Steel (tonnes)
Aluminum (tonnes)
Flint Glass (tonnes)
Coloured Glass (tonnes)
Quantity of various blue box recyclables collected by Bluewater program in 2015
602
114
Other C&D Recyclables (tonnes)
Scrap Metal (tonnes)
Quantity of various non-blue box recyclables collected by Bluewater program in 2015
Series1
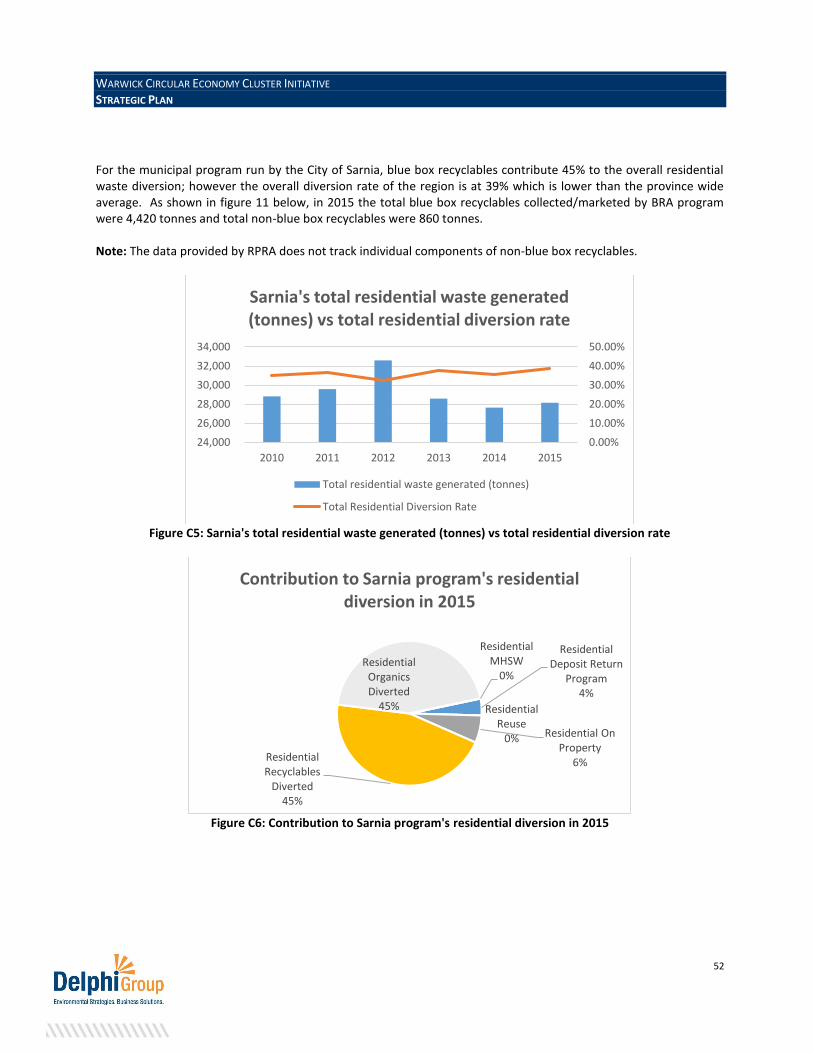
WARWICK CIRCULAR ECONOMY CLUSTER INITIATIVE STRATEGIC PLAN
52
For the municipal program run by the City of Sarnia, blue box recyclables contribute 45% to the overall residential waste diversion; however the overall diversion rate of the region is at 39% which is lower than the province wide average. As shown in figure 11 below, in 2015 the total blue box recyclables collected/marketed by BRA program were 4,420 tonnes and total non-blue box recyclables were 860 tonnes. Note: The data provided by RPRA does not track individual components of non-blue box recyclables.
Figure C5: Sarnia's total residential waste generated (tonnes) vs total residential diversion rate
Figure C6: Contribution to Sarnia program's residential diversion in 2015
0.00%
10.00%
20.00%
30.00%
40.00%
50.00%
24,000
26,000
28,000
30,000
32,000
34,000
2010 2011 2012 2013 2014 2015
Sarnia's total residential waste generated (tonnes) vs total residential diversion rate
Total residential waste generated (tonnes)
Total Residential Diversion Rate
Residential Deposit Return
Program4%
Residential Reuse
0% Residential On Property
6%Residential Recyclables
Diverted45%
Residential Organics Diverted
45%
Residential MHSW
0%
Contribution to Sarnia program's residential diversion in 2015

WARWICK CIRCULAR ECONOMY CLUSTER INITIATIVE STRATEGIC PLAN
53
Appendix D: Southern Ontario Industry Profile
As discussed in the policy section above, the Government of Ontario introduced legislation to encourage businesses to engage in the circular economy through the Waste Free Ontario Act. This Act will drive innovation to manage waste as a resource. This Chapter looks at existing industries located in the Southern Ontario region in order to consider potential synergies related to the circular economy opportunities for Warwick Township.
Southern Ontario Region.
Population overview
Southwestern Ontario, which includes the counties, Brucem Elgin, Essex, Grey, Huron, Chatham-Kent, Lambton, Middlesex, Oxford and Perth, has a population of around 1.62 million people (2016) and is expected to grow to 1.84 million by 2041. Middlesex County and Oxford County will have the fastest growth, and Lambton, Huron and Chatham-Kent are project to have slightly declining populations82.
Industry overview Based on data from Statistics Canada, the top 3 industries in Southern Ontario, based on the number of employees are: Full-service restaurants and limited service eating places (NAICS code: 7225), Elementary and secondary schools (NAICS Code6111), and Hospitals (NAICS code: 6220). While the top 3 industries are focused in the service sector, an examination of the top 10 industries (see Figure D1) reveals that the manufacturing industry is also an important sector for the region. Other notable sectors include the agriculture and construction industries83.
Figure D1: Top 10 industries in Southern Ontario (by number of employees).
The manufacturing sector is of particular interest as this sector is ripe with potential, for incorporating circular economy strategies due to current and proposed future regulations as well as potential cost savings for businesses. In this Profile Report, the focus is on the largest manufacturers (those with 200+ employees) as they are the companies that most likely produce the highest volumes of waste and will most likely benefit the most from applying circular economy strategies. Figure D2 below shows that Southern Ontario has a number of manufacturing industries with over 200 employees, including:
82 https://www.fin.gov.on.ca/en/economy/demographics/projections/ 83 2016 Business Counts by NAICS Dec2016

WARWICK CIRCULAR ECONOMY CLUSTER INITIATIVE STRATEGIC PLAN
54
• Food manufacturing (NAICS code: 311); • Petroleum and coal product manufacturing (NAICS code: 324); • Chemical manufacturing (NAICS code: 325); and • Transportation equipment manufacturing (NAICS code: 336).
Figure D2: Number of large manufacturers in Southern Ontario by industry (by number of employees).
Transportation equipment manufacturing is the industry that has the largest (200+ employees) in Southern Ontario. This industry group is comprised of vehicle, vehicle parts, aerospace, railroad, ship and boat, and other transportation equipment manufacturers84. The majority of the transportation manufactures are located in Wellington, Waterloo, Essex, Oxford, and Durham Counties. Food manufacturing includes companies that manufacture animal food, sugar and confectionery products, dairy products, meat products, preserved fruit and/or vegetable products. It also includes bakeries and tortilla plants, seafood product preparation and packaging and grail and oilseed milling85. The counties with the most food manufacturing industries are: Wellington, Waterloo, Oxford, Essex, Middlesex, and Hastings. The types of manufacturers classified under “chemical manufacturing” are those that manufacture: basic chemicals; resins, synthetic rubbers, and artificial and synthetic fibres and filaments; pesticides, fertilizers and other agricultural chemicals; pharmaceuticals and medicines; paint, coating and adhesives; soap and cleaning compounds and other chemical products86. The only chemical manufacturer with 500+ employees is in Lambton county. The petrochemical and coal product manufacturing industry consists of companies that make produce petroleum and/or coal products87. The three companies in this industry that have 200-499 employees are all located in Lambton county. There are no companies in this industry in Southern Ontario that have 500+ employees. In summary, there are a number key manufacturing industries with large employers that could be analyzed further for potential circular economy opportunities.
84 http://www23.statcan.gc.ca/imdb/p3VD.pl?Function=getVD&TVD=307532&CVD=307534&CPV=336&CST=01012017&CLV=2&MLV=5 85 http://www23.statcan.gc.ca/imdb/p3VD.pl?Function=getVD&TVD=118464&CVD=118466&CPV=311&CST=01012012&CLV=2&MLV=5 86 http://www23.statcan.gc.ca/imdb/p3VD.pl?Function=getVD&TVD=118464&CVD=118466&CPV=325&CST=01012012&CLV=2&MLV=5 87 http://www23.statcan.gc.ca/imdb/p3VD.pl?Function=getVD&TVD=118464&CVD=118466&CPV=324&CST=01012012&CLV=2&MLV=5

WARWICK CIRCULAR ECONOMY CLUSTER INITIATIVE STRATEGIC PLAN
55
Lambton County.
Population overview
Lambton County is home to 126,638 people, which represents approximately 1% of the Province’s total population. The average median income of households in Lambton county is $70,022. The City of Sarnia is the most populous town and the Township of Warwick, the focus of this project, is located within Lambton county.
Industry overview As illustrated in Figure D3, Lambton County’s major industries include: healthcare, manufacturing, retail, construction, and accommodation and food services. Based on the top industries, Lambton County has developed service, industrial, and agricultural sectors.
Figure D3: Lambton County top economic and employment sectors in 2016.
Figure D4 below provides an overview of the industries in Lambton County.
Figure D4: Top 10 industries in Lambton County (by number of employees).
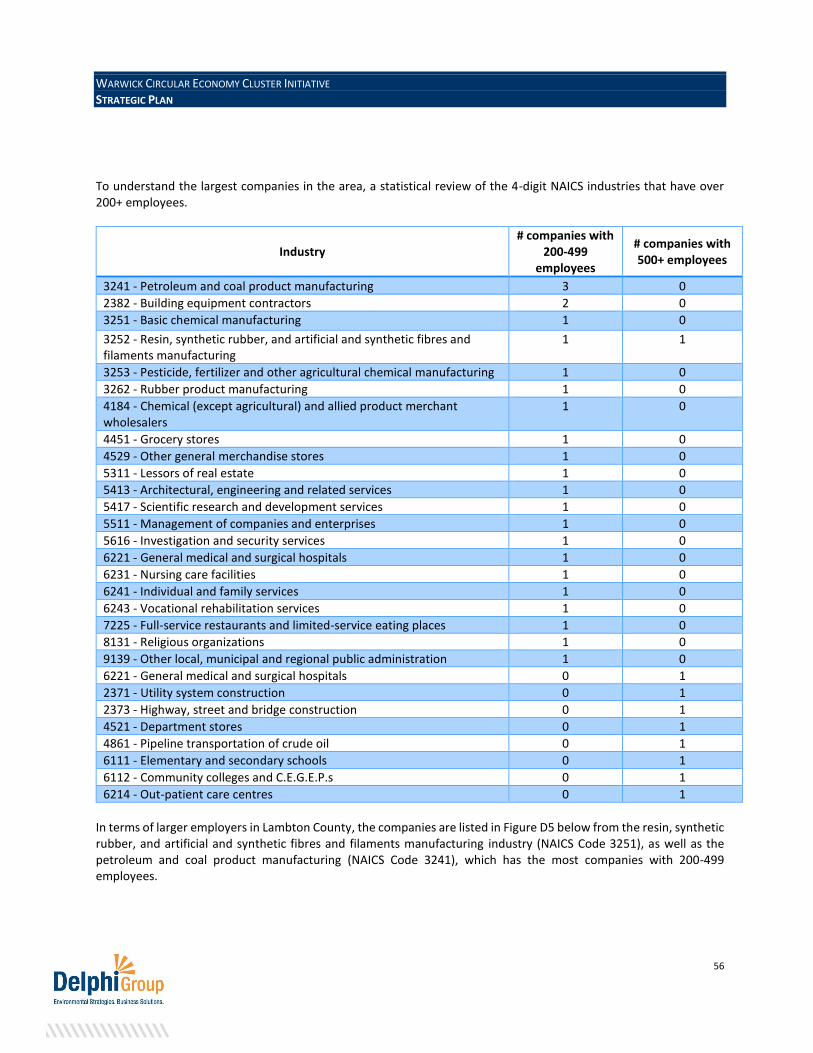
WARWICK CIRCULAR ECONOMY CLUSTER INITIATIVE STRATEGIC PLAN
56
To understand the largest companies in the area, a statistical review of the 4-digit NAICS industries that have over 200+ employees.
Industry # companies with
200-499 employees
# companies with 500+ employees
3241 - Petroleum and coal product manufacturing 3 0
2382 - Building equipment contractors 2 0
3251 - Basic chemical manufacturing 1 0
3252 - Resin, synthetic rubber, and artificial and synthetic fibres and filaments manufacturing
1 1
3253 - Pesticide, fertilizer and other agricultural chemical manufacturing 1 0
3262 - Rubber product manufacturing 1 0
4184 - Chemical (except agricultural) and allied product merchant wholesalers
1 0
4451 - Grocery stores 1 0
4529 - Other general merchandise stores 1 0
5311 - Lessors of real estate 1 0
5413 - Architectural, engineering and related services 1 0
5417 - Scientific research and development services 1 0
5511 - Management of companies and enterprises 1 0
5616 - Investigation and security services 1 0
6221 - General medical and surgical hospitals 1 0
6231 - Nursing care facilities 1 0
6241 - Individual and family services 1 0
6243 - Vocational rehabilitation services 1 0
7225 - Full-service restaurants and limited-service eating places 1 0
8131 - Religious organizations 1 0
9139 - Other local, municipal and regional public administration 1 0
6221 - General medical and surgical hospitals 0 1
2371 - Utility system construction 0 1
2373 - Highway, street and bridge construction 0 1
4521 - Department stores 0 1
4861 - Pipeline transportation of crude oil 0 1
6111 - Elementary and secondary schools 0 1
6112 - Community colleges and C.E.G.E.P.s 0 1
6214 - Out-patient care centres 0 1
In terms of larger employers in Lambton County, the companies are listed in Figure D5 below from the resin, synthetic rubber, and artificial and synthetic fibres and filaments manufacturing industry (NAICS Code 3251), as well as the petroleum and coal product manufacturing (NAICS Code 3241), which has the most companies with 200-499 employees.

WARWICK CIRCULAR ECONOMY CLUSTER INITIATIVE STRATEGIC PLAN
57
Figure D5: Major private employers in Lambton County (by number of employees).
As mentioned earlier, these companies are likely large producers of waste and circular economy opportunities (as outlined in Chapter 6) for improving their operations, generation new revenue streams, and minimizing costs due to waste disposal may be worth further exploration. As many of these industries are interrelated, Sarnia-Lambton has become an established hub for the petrochemical and refined petroleum producers, with six of the world’s top chemical producers88. In addition, there is a Bio-Industrial park in Sarnia, where some of these companies reside. Some of the other smaller and medium-sized (less than 200 employees) in the chemical and petrochemical sector in the area include: Lanxess Inc., D S K Industries, Esso Raffinerie, Matheson Gas Products, Sarnia Products Pipeline, and Polysar89. Innovation, research and development within these manufacturing sub-sectors may create a unique opportunity for Warwick to collect waste resources to offset the raw materials needed for these industries to operate. The proximity to the United States (i.e., State of Michigan) as well as the Greater Toronto Area, provide additional opportunities for consideration.
Township of Warwick.
The Township of Warwick is located in the central Eastern area of Lambton County and is along major routes that not only connect the town to Toronto and the broader Greater Toronto Area, but also to the United States. It is a small rural community with a population of about 4,000 residents. The township’s major industries are agriculture or agri-businesses, construction, retail and services90.
88 http://www.sarnialambton.on.ca/key-sectors/petrochemical-and-refined-petroleum 89https://www.google.ca/search?client=safari&hl=en-ca&q=chemical+companies+in+Lambton+county&npsic=0&rflfq=1&rlha=0&rllag=42912466,-82419041,3457&tbm=lcl&ved=0ahUKEwjlsuPgoenXAhVF9WMKHdmMAcUQjGoIYQ&tbs=lrf:!2m1!1e3!3sIAE,lf:1,lf_ui:2&rldoc=1#rlfi=hd:;si:446940152259949302;mv:!1m3!1d74992.46571126186!2d-82.28970965!3d42.91958645!2m3!1f0!2f0!3f0!3m2!1i556!2i308!4f13.1 90 Southern Ontario Counts dataset.
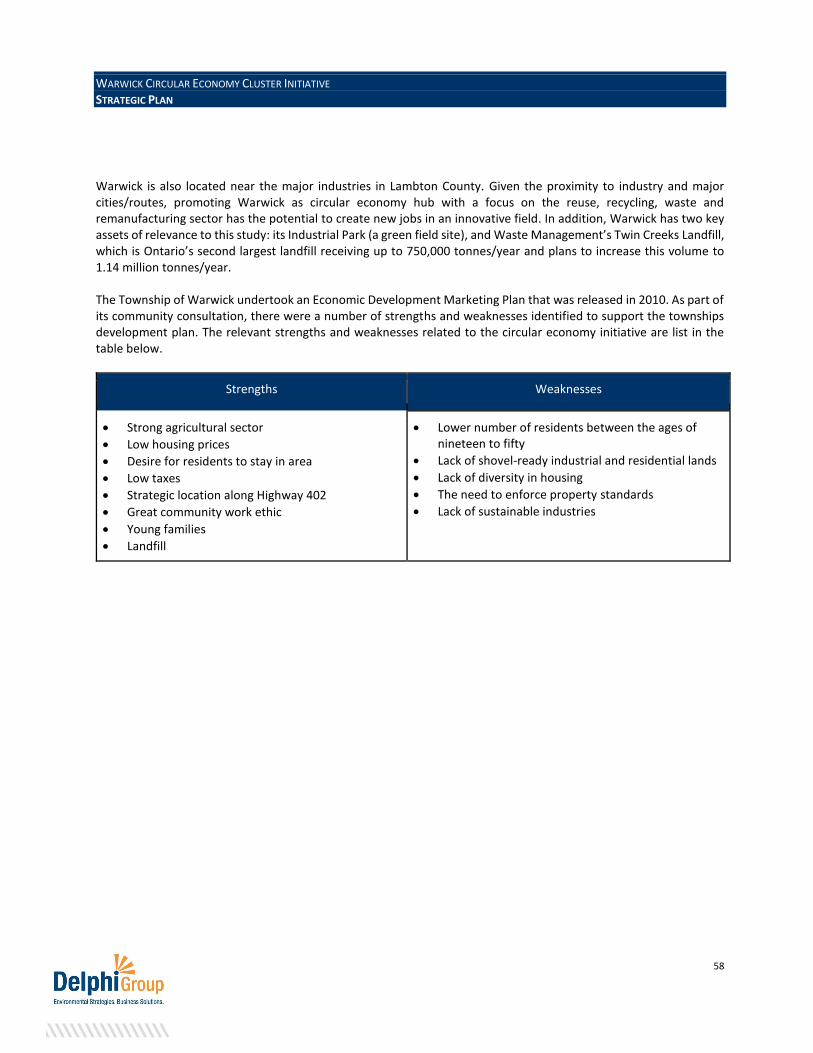
WARWICK CIRCULAR ECONOMY CLUSTER INITIATIVE STRATEGIC PLAN
58
Warwick is also located near the major industries in Lambton County. Given the proximity to industry and major cities/routes, promoting Warwick as circular economy hub with a focus on the reuse, recycling, waste and remanufacturing sector has the potential to create new jobs in an innovative field. In addition, Warwick has two key assets of relevance to this study: its Industrial Park (a green field site), and Waste Management’s Twin Creeks Landfill, which is Ontario’s second largest landfill receiving up to 750,000 tonnes/year and plans to increase this volume to 1.14 million tonnes/year. The Township of Warwick undertook an Economic Development Marketing Plan that was released in 2010. As part of its community consultation, there were a number of strengths and weaknesses identified to support the townships development plan. The relevant strengths and weaknesses related to the circular economy initiative are list in the table below.
Strengths Weaknesses
• Strong agricultural sector
• Low housing prices
• Desire for residents to stay in area
• Low taxes
• Strategic location along Highway 402
• Great community work ethic
• Young families
• Landfill
• Lower number of residents between the ages of nineteen to fifty
• Lack of shovel-ready industrial and residential lands
• Lack of diversity in housing
• The need to enforce property standards
• Lack of sustainable industries

WARWICK CIRCULAR ECONOMY CLUSTER INITIATIVE STRATEGIC PLAN
59
Appendix E: Relevant Research & Innovation Activities
In Southern Ontario, there a number of universities, non-profits, and government organizations that are conducting research and developing solutions related to the circular economy. Many of these institutions have a focus on a particular industry or sector, which may create valuable solutions for industries to shift towards closed-loop models. These organizations could be potential partners or models for Warwick as it seeks to develop its circular economy cluster.
Research centers at Ontario’s universities.
There are a number of universities located in Southern Ontario, Western, Lambton College, University of Guelph, that all have research facilities or faculties that are conducting work that would be relevant to developing a circular economy hub in Warwick, as listed below.
• University of Guelph’s Bioproducts Discovery and Development Center (BDDC) o Established in 2008 and is a center where “biologists, chemists, and engineers converge to investigate
and commercialize biomaterials.” o The Center focuses in researching and developing greener bioproducts substitutes for non-renewable
materials and goods. o Commercial applicability is important to the center and it seeks to work with automotive, packaging or
building materials sectors to create biomaterial products and processing, such as bioplastics. o Current areas of research relevant to the circular economy are:
▪ Bio-composites and green composites ▪ Renewable resource-based green polymers ▪ Bio-based nylons and polyolefins ▪ Petroleum-based biodegradable polymers ▪ Polyols from plant oils and bio-based polyurethanes ▪ Bio-based polyesters/epoxies ▪ Agricultural residues and grass fibres as reinforcing fillers ▪ Nanostructure carbons, nano-cellulose, nano-clay and nano-metals ▪ Improved utilization of lignin, soy meal, distillers dried grains with solubles (DDGS), canola meal
and crude glycerol ▪ Hybrid bio-composites of agricultural residues and industrial waste/co-products ▪ New biocarbon-based materials ▪ Durability and sustainability of bio-based materials ▪ Compostability and biodegradability of bioplastics and bio-composites
o The Center is active in hosting events on the circular economy and held a “Circular Economy Workshop Towards Mitigating Climate Change” in May 2017.
o BDDC is working with 28 industry partners, 14 government agencies or NGOs. o This center works with industry to develop commercial applications for bio-product materials that would
replace non-renewable packaging, and manufacturing material. Given, Warwick’s proximity to the bio-industrial hub, an R&D facility could form a partnership with local industry and work towards developing bio-based material for manufacturing could be valuable to the local industry91.
91https://www.therecord.com/news-story/4549168-university-of-waterloo-tire-recycling-startup-wins-tech-award/

WARWICK CIRCULAR ECONOMY CLUSTER INITIATIVE STRATEGIC PLAN
60
• Center for Agricultural Renewable Energy and Sustainability (CARES) at the University of Guelph92 o CARES focuses on providing education and training, and researching and developing renewable energy
and agri-based solutions that can help advance rural economies. o Relevant research to the circular economy is CARES’ work in biogas and its 600,000 L/year biodiesel
plant and 250kW biogas production (anaerobic digester) that creates a complete closed-loop energy production93.
o The Real Flex building could look at developing a similar closed-loop energy production facility, using organic waste.
• Centre of Excellence in Energy & Bio-Industrial Technologies at Lambton College o Provides post-secondary education in fields related to energy and biotech. o Supports businesses through development of new technologies, products and processes. o This Centre helps develop talent for Sarnia-Lambton’s industries and could also be a potential partner
to develop an R&D facility in Warwick.
• The Bluewater Technology Access Centre (BTAC) at Lambton College94 o Works with SMEs to help them develop and advance their products. Companies have access to advance
material processing and test labs, a robotics lab and an advanced manufacturing & 3D printing lab. o A lab could be established at the Real Flex building that could be similar to the BTAC labs. In addition,
the Real Flex could partner with BTAC and potentially host a lab that complements BTAC’s work.
• Centre for Bio-composites and Biomaterials Processing at the University of Toronto95 o Provides research and develops bio-based (nanocellulose) composites, such as bio-foams, sustainable
and lightweight product manufacturing for automotive and aerospace sectors and more. o The Center also evaluates bioplastics and researches renewable bio-material for packaging and building
and construction. o It has 9 partners including:
▪ Ingredion Canada Inc. ▪ Powertrain Engineering Research and Development Center ▪ Omtec Inc. ▪ Performance Materials of DSM Corp. ▪ Bayview Flowers Ltd. ▪ Tembec inc. ▪ Crest Mold Technology Inc. ▪ AV Cell Inc. ▪ Total American Services Inc. ▪ Alliance Surface Finishing Inc.
o CBBP could be a potential partner if Warwick Township develops a R&D or innovation hub. It could also serve as a source for innovation and solutions for industry in Sarnia-Lambton to build a circular economy.
• Centre for Environment & Sustainability (CES) at Western University o Interdisciplinary center (Faculty of Science Faculty of Engineering and Faculty of Social Science) for
undergraduate and master’s programs related to environmental science and sustainability.
92 https://www.ridgetownc.com/cares/index.cfm 93 https://www.ridgetownc.com/cares/sandbox_facilities.cfm 94 https://www.lambtoncollege.ca/BTAC/Labs/ 95https://navigator.innovation.ca/en/facility/university-toronto/infrastructure-facility-centre-biocomposites-and-biomaterials
WARWICK CIRCULAR ECONOMY CLUSTER INITIATIVE STRATEGIC PLAN
61
• Western University’s Sarnia-Lambton Research Park96 o Partnership between County of Lambton, the City of Sarnia and Western University. o Largest clean-tech incubator in Canada. o The research park helps catalyze innovation and employment in the biotech, agriculture, energy,
chemical and industrial processing sectors. o This could be a potential partner for the development of an R&D or incubator hub in Warwick. In
addition, the Real Flex facility building could be used as a potential lab or co-working space for some of the clean-tech incubators working at this facility.
Government and non-profit R&D and incubators.
• Ontario Agri-Food Technologies (OAFT)97 o Focuses on using technology to improve the value and sustainability of agriculture and food industry. o OAFT researches and helps develop commercial biotechnology and bio-based products. o Helped create the Ontario Bio-Products “A-Team,” which is a group of 10 experts (7 academics) who
collaborate to develop biomaterials98.
• Bio-industrial Innovation Canada (BIC)99 o BIC is a non-profit based in Sarnia that provides “critical strategic investment, advice, and services to
business developers of clean, green and sustainable technologies.” o It has 14 partners, 19 investments in early stage companies and has help create 340 jobs. o BIC established the Center for Commercialization of Sustainable Chemistry Innovation (COMM SCI), a
hub for commercial-scale sustainable and bio-based chemistry. It is funded by the Federal Economic Development Agency for Southern Ontario’s (FedDev Ontario) Investing in Regional Diversification, and the Government of Ontario’s Ministry of Research, Innovation and Science.
o BIC supports cluster and values chain development to support SME’s in developing technology and commercializing innovative products/services.
o BIC has helped attract companies such as BioAmber and Origin Matterials to the Hybrid Chemistry Cluster in Sarnia-Lambton.
o BIC is also trying to develop a Bioproducts AgSci Research Cluster to create opportunities for the agriculture sector and develop new bioproducts for the manufacturing and energy sectors.
o Manages the Ontario Sustainable Chemistry Alliance Fund
• Ontario Centers of Excellence (OCE)100 o Non-profit that bridges the gap between academic research centers and industry to build the Ontario’s
future economy. It supports innovation and entrepreneurs with the goal of creating successful commercialized products and businesses.
o OCE focuses on four sectors. ▪ Advanced Manufacturing ▪ Advanced Health Technologies ▪ Energy and Environment
96 http://sarnialambtonresearchpark.ca/ 97 http://oaft.org/about-us/ 98 http://www.ontariobioproducts-ateam.ca/ 99 https://www.bincanada.ca/ 100 http://www.oce-ontario.org/about-us/focus-on-sectors/energy-and-environment

WARWICK CIRCULAR ECONOMY CLUSTER INITIATIVE STRATEGIC PLAN
62
▪ Information, Communications & Digital Media o Given Sarnia-Lambton’s industry focus, there might be circular economy related solutions coming out
of OCE’s Advanced Manufacturing focus. In addition, OCE has communities of interest related to “Waste Management,” “Resource Management,” “Sustainable Infrastructure” and “Sustainable Agriculture,” which could have resources relevant to the development of a circular economy hub in Warwick with a focus on the waste, reuse, recycling and remanufacturing sector.
• GreenCentre Canada101 o Operates a lab in Kingston, ON. It has 8,000sq. ft. of lab space for small-scale chemistry innovation. At
this facility, practical and sustainable chemical solutions are developed102. o An organization that commercializes academic and entrepreneurial innovations and helps existing
companies expand their R&D capacities. o It is funded by the Government of Ontario, the Government of Canada, and various industry partners. o Given its ability to commercial research discoveries and also help existing companies expand their R&D,
this could be an interesting model for Warwick to consider for its Real Flex space. In addition, the Real Flex space could also be a building that GreenCentre could open another lab in.
• Bioenterprise Corporation103 o Non-profit agri-technology focused business accelerators. o It helps agri-businesses develop, find funding and grow. o It is funded by Growing Forward 2, a federal-provincial-territorial initiative, and the Canada Accelerator
and Incubator Program (CAIP).
• Agri-Technology Commercialization Centre (ATTC)104 o ATTC is a cluster of agriculture innovation resources that researches and develops technologies in the
agri-business sector. o Bio enterprise Corporation, Soy 20/20 and Ontario Agri-Food Technologies are its three founding
organizations. o The center helps startups develop, grow and fund their businesses. To date it has helped more than 500
agri-technology entrepreneurs and businesses. o ATTC is funded by the Agriculture and Agri-Food Canada and the Ontario Ministry of Agriculture, Food
and Rural Affairs through Growing Forward 2, a federal-provincial-territorial initiative.
101 https://www.greencentrecanada.com/about-us/company-overview/ 102 https://www.greencentrecanada.com/about-us/our-labs/ 103 http://www.bioenterprise.ca/index.cfm?page=about 104 http://www.agritechcentre.ca/index.cfm?page=about

WARWICK CIRCULAR ECONOMY CLUSTER INITIATIVE STRATEGIC PLAN
63
Appendix F: SWOT Analysis
This analysis looks at the internal strengths and weaknesses and external opportunities and threats for the Township of Warwick to develop a circular economy cluster with a focus on its waste, recycling, reuse, and remanufacturing sectors.
Strengths
Location
• Connected to major transportation corridors (King’s Highways 401 and 402), Warwick’s economy is linked to
the Greater Toronto Area (GTA) and the United States.
Community Investment
• The economic conditions (low taxes and housing prices) may attract businesses and talent to the region if
innovative circular economy based opportunities are created
• Educated workforce; 62% of the population has completed post-secondary education
• Ontario’s focus on innovation and development may help secure funding and support to develop a circular
economy incubator.
Existing Infrastructure
• Waste Management’s Twin Creeks Landfill plans to accept up to 1.4 million tonnes of waste per year; there
is an abundance of waste resources available from different waste streams
• The “Real-Flex” facility at Warwick Industrial Park is zoned for mixed commercial/industrial use with outside
storage and connections to essential services (e.g. energy, water, sewer)
Local Industry Participants
• Waste/resource companies and associations connected to region include: the Recycling Council of Ontario,
OWMA, PAC, Bluewater Recycling and Waste Management
• Large employers in the region include petroleum and coal, chemical and transportation equipment
manufacturing:
o NOVA Chemicals, ARLANXEO, Air Products Canada Ltd., ReVital, Imperial Oil, Waterville TG Inc.,
Shell and Suncor
o Potential waste or by-products from these activities may be a feedstock for closed loop solutions
through reuse, recycling and/or remanufacturing in lieu of raw material inputs
• Lambton County is home to 200 agriculture-related employers a potential source of biomass feedstocks for
energy, nutrient extraction, compost, and bio-products, among others
• Construction industry in Lambton could provide feedstock materials for recycled, reused and
remanufactured products

WARWICK CIRCULAR ECONOMY CLUSTER INITIATIVE STRATEGIC PLAN
64
Innovation Space
• Knowledge and expertise from nearby research centres and Lambton College could be leveraged around
circular economy R&D opportunities
• The Bio-Industrial Park in Sarnia may present opportunities to form partnerships and/or build synergies with
a proposed R&D, recycling, or remanufacturing facility in Warwick Township
Weaknesses
Community Demographics
• Small population with limited local markets for new business opportunities
• Low number of working age residents (19 – 50 years of age)
Location
• Proximity to larger cities may make it difficult to attract business and talent that want access to amenities
provided in larger urban centres
• Applied research centres that neighbour Warwick may make it difficult to establish new R&D facilities and/or
incubator focused on the bioeconomy sector (e.g. Sarnia Bio-Industrial Park)
• Limited diversity in employment opportunities
Waste Management Data
• Data on waste composition and resource streams entering the Twin Creeks Landfill are limited
Opportunities
Policy and Legislation
• Through its National Sword Program, China will no longer accept 24 types of materials for disposal opening
an opportunity to build a market around the recycling, reuse and/or remanufacturing of these waste
resources (See Appendix A)
• A number of provincial policies are or will be enacted that will require great waste diversion and will create
opportunities to develop circular economy businesses. Some of the policies include: Waste Free Ontario Act;
Waste Free Ontario Strategy, Cap and Trade, and evolving building codes and green building certification
(See Appendix A).
Waste Management Sector
• Approximately 3.5 million tonnes of waste is exported to the US annually from Ontario; recovery of this
material could support new secondary markets in Warwick
• There has been recent technological improvements in resource recovery, recycling, data analytics, modular
design technology and more105 that could be applied and developed.
105 http://www.plasticsnews.com/article/20170117/NEWS/170119916/davos-report-calls-for-boosting-plastics-recycling-to-70-percent

WARWICK CIRCULAR ECONOMY CLUSTER INITIATIVE STRATEGIC PLAN
65
Consumer Response
• Consumer awareness, specifically on impacts from plastic waste, may trigger increased research to find new
ways to reuse or reduce the amount of plastics generated
• Consumer demands for sustainable products is growing and may already be supporting nearby markets for
circular economy products that Warwick could collect feedstocks for
Industry Impacts
• Construction, agriculture and local manufacturing have not yet embraced circular economy concepts and
have the potential to create new business opportunities or cost savings from waste management fees
• Reduced risk in price volatility from global energy prices through use of renewable energy sources (e.g.
methane) or securing purchasing power agreements with local producers
• Growing market for organic and local food may support farmers in a switch to compost and bio-nutrients if
they were accessible
Threats
Political Leadership
• A change in political leadership may put existing legislation at risk (e.g. Cap and Trade)
• The Ontario government has not set clear timelines or actions to support the circular economy, which
impacts timing and planning on the part of SLEP/Warwick
• Waiting for circular economy strategy, regulations, GHG protocols, landfill bans, and extended producer
responsibility programs
• Government inaction does not encourage quick action from industry
Energy Mix
• Ontario’s oversupply of electricity and market price does not provide an incentive for short to medium-term
waste to energy solutions
• Low cost natural gas could mean an unwillingness to look at alternative energy sources
Economic Influences
• Tax incentives, exchange rates and other factors may influence investment decisions between Canada and
the US
• Secondary markets are limited making it difficult to influence industry to develop new markets
• Waste to landfill is a cheaper alternative to than recycling, reuse and/or remanufacturing
• Lower landfilling costs in the US could influence organizations to send waste there

WARWICK CIRCULAR ECONOMY CLUSTER INITIATIVE STRATEGIC PLAN
66
Appendix G: Circular Economy Opportunities by Key Industry
Opportunities for major industries.
Based on the prominent industries in the Sarnia-Lambton region, there are a number of potential opportunities for industries to develop circular economy solutions. In addition, the Waste Free Ontario Strategy presents opportunities for producers to begin evaluating how they are going to take responsibility for their products. While this will impact many industries in the long-term, in the short-term, manufacturers of tires, electronics, and MHSW will have to address this challenge106. The list below provides an initial set of high-level circular economy opportunity areas for further consideration based on existing industries in Southern Ontario.
• Petroleum107108:
o Recovery and reuse of chemicals as a raw material (e.g., potassium hydroxide - KOH)
o Recovery and reuse of chemicals for Energy from Waste / co-processing
o Recovery and reuse of hazardous waste for Energy from Waste/co-processing
o Recovery and reuse of used oil, possibly for Energy from Waste/co-processing
o Reuse of pipelines: pipelines, reuse could be worth five times the scrap value of the steel, or even
more, if reusing the pipelines means that new pipelines do not have to be built
• Coal product manufacturing109:
o Waste coal (Usable material that is a byproduct of previous coal processing operations) used as energy
from waste and burned as-is in unconventional fluidized-bed combustors
• Basic chemical manufacturing110111:
o Energy from waste: replacing fossil raw materials with renewable feedstock including biomass material
(e.g., bioethanol, lactic acid, bio C2/C4), which is partially derived from waste, as input in chemical
processes. Energy from waste may also be derived from end market packaging from the plastics
industry.
o Research and development of full suites of new products and solutions that can essentially be re-used
“as is,” such as durable PET bottle
o Mechanical recycling of end-use materials could be collected, processed and into the upstream value
chain. The recycling of thermoplastics and the extraction of phosphorus from sludge are two
examples.
106 Interview with Cindy Acab, Senior Advisor, Policy, MOECC 107 Taking Circular Economy to Oil & Gas Refining, US Chamber Foundation: https://www.uschamberfoundation.org/blog/post/taking-circular-economy-oil-and-gas-refining-industry 108 Waste management in the oil and gas industry by Brazilian Guideline for Environmental Audits, American Journal of Environmental Protection: http://article.sciencepublishinggroup.com/pdf/10.11648.j.ajep.20130206.18.pdf 109 Waste Coal, Source Watch: https://www.sourcewatch.org/index.php/Coal_waste 110 Circular Economy, BASF, : https://www.basf.com/en/company/sustainability/management-and-instruments/circular-economy.html.html 111 Taking European Chemistry Industry Into Circular Economy, Accenture: https://www.accenture.com/us-en/_acnmedia/pdf-45/accenture-cefic-report-exec-summary.pdf
WARWICK CIRCULAR ECONOMY CLUSTER INITIATIVE STRATEGIC PLAN
67
o Chemical recycling of chemical by modifying the material’s molecular bonds to recover hydrocarbons.
The industry would need to invest in further research and development in cracking and gasification
processes.
• Resin:
o The use of less virgin material and more recycled plastic resins and compounds for a variety of plastic
process applications.
o The use of naturally sourced resins made form plants, trees, animals, and even insects
• Synthetic rubber112:
o The use of carbon black derived from waste materials through Pyrolysis technology (e.g., from used
tires)
o Development of recycling market for recyclable synthetic rubber (e.g., crumb rubber for tiles, soccer
fields)
o Energy from waste
o Retreading/regrooving (tires)
• Artificial and synthetic fibres and filaments manufacturing 113
o Reuse and recycling of pre-consumer processing, including scrap created as a by-product from yarn
and fabric
o Reuse and recycling of post-consumer, including garments, vehicle upholstery, carpet
o For example, polyester-based textiles, garments are shredded and then granulated, and processed into
polyester chips. These are subsequently melted and used to create new fibers for use in new polyester
fabrics
• Food manufacturing114:
o Use of food process by-product, for anaerobic digestion to generate renewable energy
o Use of food process by-product to produce compost and vital nutrients for the pet food, agriculture or
landscaping industry
• Transportation equipment manufacturing:
o Reuse, repair or remanufacturing of equipment or equipment parts
o Integration of recyclable materials into equipment
• Agricultural:
o Use of agriculture organic waste, for anaerobic digestion to generate renewable energy
o Use of agriculture organic waste to produce compost and vital nutrients for the agriculture or
landscaping industry
112 Rubber Recycling: http://www.seas.columbia.edu/earth/RRC/documents/recycling_rubber.pdf 113 Basics of Textile Recycling: https://www.thebalance.com/the-basics-of-recycling-clothing-and-other-textiles-2877780 114Food and Drink Circular Economy, WRAP: http://www.wrap.org.uk/sites/files/wrap/WRAP%20Food%20and%20Drink%20-%20Circular%20Economy%20Jan%202013%20v2.pdf

WARWICK CIRCULAR ECONOMY CLUSTER INITIATIVE STRATEGIC PLAN
68
• Construction115:
o Remanufacturing or recycling of building materials using recovered steel, plasterboard, timber and
concrete that is ultimately converted into valuable feedstock for new building materials or other end-
use applications
o Recycled demolition waste (brick, concrete, stone) used as a foundation material for infrastructure
o Reuse of glass, plasterboard, timber, structural metals, aluminum, insulation
• Mining machinery manufacturing
o Reuse, repair or remanufacturing of machinery or machinery parts
o Integration of recyclable materials into machinery or machinery parts
115Identification of Circular Economy Opportunities in the Scottish Construction Sector: http://www.zerowastescotland.org.uk/sites/default/files/Circular%20Economy%20Opportunities%20in%20Construction%20-%20Nov2017.pdf
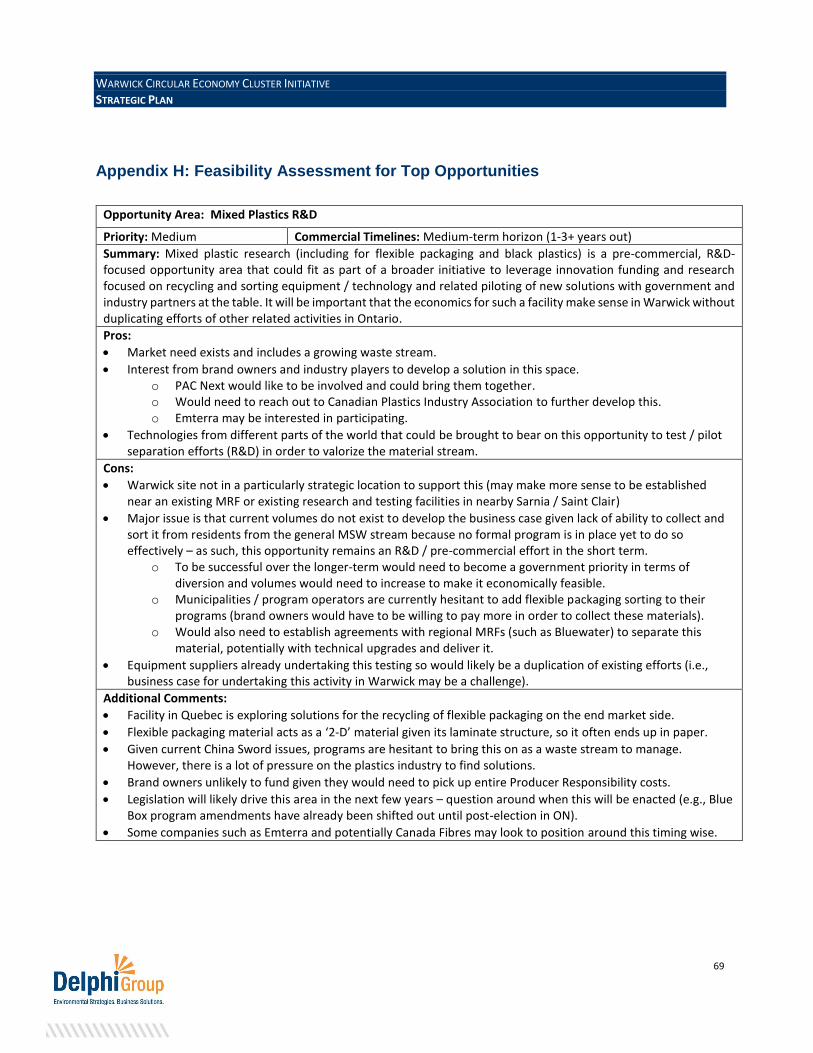
WARWICK CIRCULAR ECONOMY CLUSTER INITIATIVE STRATEGIC PLAN
69
Appendix H: Feasibility Assessment for Top Opportunities
Opportunity Area: Mixed Plastics R&D
Priority: Medium Commercial Timelines: Medium-term horizon (1-3+ years out)
Summary: Mixed plastic research (including for flexible packaging and black plastics) is a pre-commercial, R&D-focused opportunity area that could fit as part of a broader initiative to leverage innovation funding and research focused on recycling and sorting equipment / technology and related piloting of new solutions with government and industry partners at the table. It will be important that the economics for such a facility make sense in Warwick without duplicating efforts of other related activities in Ontario.
Pros:
• Market need exists and includes a growing waste stream.
• Interest from brand owners and industry players to develop a solution in this space. o PAC Next would like to be involved and could bring them together. o Would need to reach out to Canadian Plastics Industry Association to further develop this. o Emterra may be interested in participating.
• Technologies from different parts of the world that could be brought to bear on this opportunity to test / pilot separation efforts (R&D) in order to valorize the material stream.
Cons:
• Warwick site not in a particularly strategic location to support this (may make more sense to be established near an existing MRF or existing research and testing facilities in nearby Sarnia / Saint Clair)
• Major issue is that current volumes do not exist to develop the business case given lack of ability to collect and sort it from residents from the general MSW stream because no formal program is in place yet to do so effectively – as such, this opportunity remains an R&D / pre-commercial effort in the short term.
o To be successful over the longer-term would need to become a government priority in terms of diversion and volumes would need to increase to make it economically feasible.
o Municipalities / program operators are currently hesitant to add flexible packaging sorting to their programs (brand owners would have to be willing to pay more in order to collect these materials).
o Would also need to establish agreements with regional MRFs (such as Bluewater) to separate this material, potentially with technical upgrades and deliver it.
• Equipment suppliers already undertaking this testing so would likely be a duplication of existing efforts (i.e., business case for undertaking this activity in Warwick may be a challenge).
Additional Comments:
• Facility in Quebec is exploring solutions for the recycling of flexible packaging on the end market side.
• Flexible packaging material acts as a ‘2-D’ material given its laminate structure, so it often ends up in paper.
• Given current China Sword issues, programs are hesitant to bring this on as a waste stream to manage. However, there is a lot of pressure on the plastics industry to find solutions.
• Brand owners unlikely to fund given they would need to pick up entire Producer Responsibility costs.
• Legislation will likely drive this area in the next few years – question around when this will be enacted (e.g., Blue Box program amendments have already been shifted out until post-election in ON).
• Some companies such as Emterra and potentially Canada Fibres may look to position around this timing wise.

WARWICK CIRCULAR ECONOMY CLUSTER INITIATIVE STRATEGIC PLAN
70
Opportunity Area: RNG Production from Agricultural Anaerobic Digestion
Priority: Low-Medium Commercial Timelines: Medium-term (pending results from Govt. of ON election)
Summary: Potential for aggregating organic and/or agricultural waste to produce RNG through a centralized AD facility in Warwick Industrial Park. However, the current political landscape in Ontario is not yet favourable to new project investments in this space until the cap and trade protocol for Anaerobic Digestion and Composting, the forthcoming biofuel regulation, and the RNG fund are established (likely post-election in Ontario). Should it move forward, RNG production through agricultural AD is unlikely economically viable at $14-$16/GJ without incentives / subsidies. However, given the latest AD technology, the project may be feasible as a whole when also considering revenues from the potential generation of carbon offset credits and the sale of digestate converted to compost and/or value-add nutrients.
Pros:
• Demand for RNG exists for certain ‘consumer-facing’ companies, which is driving up interest in ON.
• ON Govt currently being pressured by gas utilities (i.e., Enbridge / Union Gas) to develop a $100M fund to support RNG development in ON – would like fund to go to gas utilities to help support the purchase of RNG in an open-market RFP process.
• Abundant agricultural facilities (dairy and poultry) to supply waste for AD facilities in Lambton County and surrounding region.
• Bullfrog Power interested in potential projects to support.
• The project may be economically viable as a whole when considering the combined revenues from methane, the potential generation of carbon offset credits and the sale of digestate converted to compost and/or value-add nutrients.
• Biogas is an additional area where it can be used to power nearby operations or fleet vehicles (e.g., WM now using CNG for vehicles in the City of London).
o Landfill gas could be used to offset the costs of power for companies looking to locate in the Warwick Industrial Park.
Cons:
• Current ‘wait and see’ status for Ontario’s RNG market around new project development – unlikely that ON Govt will decide on this $100M fund until post-election if the Liberals stay in power.
• Open bid for the procurement of RNG by gas utilities will result in RNG production at the $14-$16/GJ range, which is too low for agriculture-based AD RNG production (although landfills may be best positioned as a source for RNG at that price point).
• Petrochem and related industries are not usually willing to pay a premium for RNG – price differential for NG and RNG is too high, even with carbon credits applied.
Additional Comments:
• Potential for ON Govt to incentives and/or prescribe RNG from agriculture sources in order to diversify and hedge risks from landfill organic biogas.
• Potential for nutrient recovery technologies to be applied in order to build the business case further from new revenue streams, linked to fertilizers, etc.
• Depending on outcome of RNG policy / incentives /regulation, the greatest opportunity in this space may be for WM to sell RNG into the grid and/or provide RNG for nearby industry, commercial facilities, or for transportation fueling.
o Transportation fueling facility could have potential for Warwick Industrial Site. o The Ontario Green Fund is already active (see: www.greenon.ca)
• Landfills larger than 1 million tons do not qualify for carbon credits under the current cap-and-trade regime.

WARWICK CIRCULAR ECONOMY CLUSTER INITIATIVE STRATEGIC PLAN
71
Opportunity Area: Mixed C&D Processing
Priority: Low-Medium Commercial Timelines: Longer-term horizon (3-5+ years out)
Summary: Focus on extracting value from various construction and demolition (C&D) waste streams. Potential to set up a processing facility to focus on C&D waste stream to divert from landfill. Challenges exist around relatively low tipping fees and regulatory drivers at present, making the resource recovery efforts less economically feasible, as well as potential conflicts from competing interests in the region. Market demand for recycled, reclaimed, and refurbished C&D waste streams may also create challenges. This option will require new business models, revenue stream opportunities, and strategic partnerships (potentially with WM over the longer-term).
Pros:
• Strategic location of Warwick Industrial Park immediately adjacent to the Twin Creeks landfill – with growing annual volumes.
• Construction and demolition waste is available from industry activities in the immediate vicinity of Warwick Township (e.g., NOVA has $4 billion construction / retrofits underway, onsite projects at Twin Creeks landfill, etc.) – potential risks around contaminated waste.
• Could be incorporated into a repair, reuse, reconditioning, repurposing, or remanufacturing facility.
• Some available equipment from WM available for purchase from a former C&D processing site in Toronto area.
Cons:
• Average costs to operate a mixed C&D processing facility are higher than what WM currently takes waste in at (i.e., which is currently $40/ton) – as such the economic viability will depend on incoming regulation / landfill bans on specific products, grants or subsidies, and/or increased tipping fees.
o Landfill gate fee increases likely won’t be raised until after new waste regulations (WFOA and 3R) come into play.
o WM has a mixed C&D processing site in Ottawa which has been successful because of the volumes of C&D waste generated in that area. The volumes in Lambton County region are not sufficient on their own and, as such, C&D materials would need to be imported from other parts of the province.
• Issues / potential risks around fees and potential revenue losses for WM (e.g., decreased tonnage and/or organic streams could impact on fees collected and/or potential to sell biogas in the future); as such, they are not a willing partner at present.
• Some local competition exists for existing C&D streams in the region with companies such as Tri-recycling in Sarnia and Good Valley in London.
• Current market demand for reclaimed construction materials may present challenges for economic viability.
• Lack of existing infrastructure at Warwick Industrial Park could create economic feasibility challenges. Capital costs to build a mixed C&D processing facility are high.
Additional Comments:
• This opportunity could not rely solely on existing WM tonnage and contracts (given they are all private contracts) – would need to source new C&D waste streams.
• Business case depends on volumes of C&D waste streams from specific industries / activities – this information is currently not available in a disaggregated form pr by material stream.
o Timelines for NOVA project may be great than 5+ years. o Would have to import from other parts of ON and have a better understanding of the long-term
regional growth that would impact on construction activities in Southern ON.
• Potential to tie in with local construction – need to better understand C&D materials in the area and related opportunities.

WARWICK CIRCULAR ECONOMY CLUSTER INITIATIVE STRATEGIC PLAN
72
Opportunity Area: Mixed Waste Processing – MSW & IC&I
Priority: Low-Medium Commercial Timelines: Longer-term horizon (3-5+ years out)
Summary: Focus on extracting value from ‘black bag’ MSW and IC&I waste streams. Potential to set up a ‘dirty’ MRF to process targeted MSW and IC&I streams to divert from landfill. Challenges exist around relatively low tipping fees and regulatory drivers at present, making the resource recovery efforts less economically feasible, as well as potential conflicts from competing interests in the region. In addition, the quality of material recovered from a dirty MRF has higher contamination rates relative to clean MRFs. This may pose challenges in the short-term given the low China Sword contamination thresholds. This option will require new business models, revenue stream opportunities, and strategic partnerships (potentially with WM over the longer-term).
Pros:
• Strategic location of Warwick Industrial Park immediately adjacent to the Twin Creeks landfill – with growing annual volumes (approx. 1.2+ tons per year at present).
• Aggressive recycling targets in ON and regulations to come into play in the near future, driving more diversion efforts – likely won’t see the increased diversion coming from what’s being collected at the curb but rather mined from other MSW streams (i.e., black bag) – but this would need to be considered as “diverted” waste, which it currently is not. The new 3R regulations could also reduce the existing threshold for the IC&I sector to increase the number of companies/facilities required to implement waste diversion programs.
• Growth of Multi-family dwellings shows high alignment with opportunities – these have some of the worst recovery rates compared to single-family homes.
o Higher value recyclables are still ending up in the waste stream – potential to target these recyclers (e.g., from the Peel Region = 25% of 250,000+ tons per year from Peel comes from multi-family).
• 70% divergence requirement as per the organics framework may present opportunities to extract additional organics, including wood.
• Other materials with value include plastics, cardboard / paper, aluminum and other metals, etc. o NOVA interested in polyethylene recycling and would be open to partnering with others to reduce
waste (including in R&D areas). o NOVA IPA wax reprocessing / remanufacturing – used to send it to Barrie to be made into candles
(costly to ship this). o Agricultural wrap and twine recycling / reprocessing.
• Potential interested buyers for plastics and wood in nearby Sarnia through Bioindustrial Innovation Canada networks.
• Potential to find partners and investors around innovation in robotics / AI, sorting technology, etc. with incentives and funding from Ontario Govt and other funding partners.
• Potential for remanufacturing facilities given increased material flows in the region.
• Some Ontario-based companies have considered the feasibilities of developing dirty MRF facilities.
Cons:
• Average costs to operate a ‘dirty’ MRF can in the $100/ton range (WM currently takes waste in at $40/ton) – as such the economic viability will depend on incoming regulation / landfill bans on specific products, grants or subsidies, and/or increased tipping fees.
o There is a facility similar to this in London, Ontario, at present – redirected waste is processed at approximately $200/ton.
o Landfill gate fee increases likely won’t be raised until after new waste regulations (WFOA and 3R) come into play.
• Some issues / potential risks around fees and potential revenue losses for WM (e.g., decreased tonnage and/or organic streams could impact on fees collected and/or potential to sell biogas in the future); as such, they are not a willing partner at present.

WARWICK CIRCULAR ECONOMY CLUSTER INITIATIVE STRATEGIC PLAN
73
• Major buyers of recycled plastic resources (Revital, Canada Fibres, etc.) not looking for more plastic feedstock / materials – sourcing very large quantities from the US already and not in need of additional supply from Ontario which can only provide relatively small volumes.
• Post-processed plastic comes in at close to the same price as virgin materials.
• Capital costs to build a ‘dirty’ MRF type facility are high (in the range of $20M-$30M).
• May require a restructuring of contracts between WM and Peel Region (and others) – which might delay things if contracts need to expire first.
• Recovery values for reclaimed / diverted materials that dirty MRFs get compared to clean MRFs is lower due to contamination
o Example: Revital/Emterra is not interested in purchasing ‘dirty’ plastics – who are the buyers? o Potentially in the United States? o Can also wash the materials, but that adds costs.
Additional Comments:
• This opportunity could not rely solely on existing WM tonnage and contracts (given they are all private contracts) – would need to source new MSW or IC&I waste streams.
• The proposed a-BBPP had indicated the target wouldn’t be reached for 9 years; 2 years after full transition.
• Need to better understand activity at transfer stations – is MSW transported separately from IC&I to the landfill. o Combining mixed IC&I waste with MSW would only make sense if the MSW source has an effective
organics programs. IC&I wastes tends to be cleaner than MSW and processing them together may not be viable / feasible.
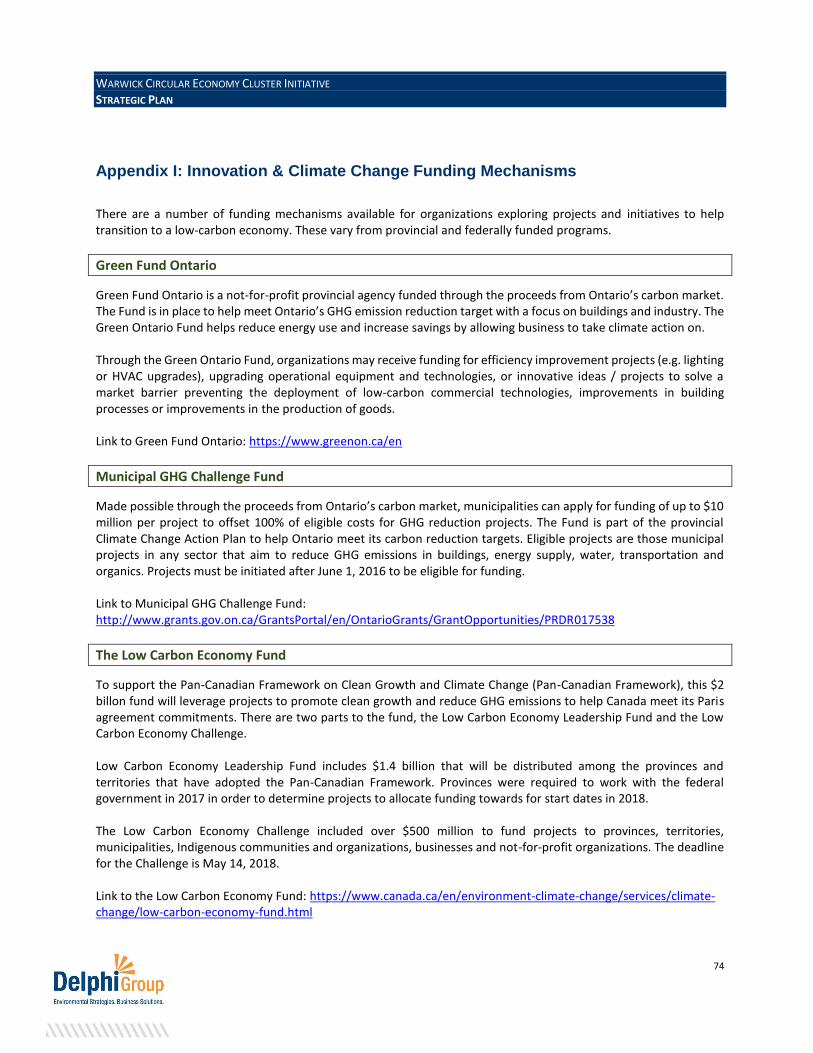
WARWICK CIRCULAR ECONOMY CLUSTER INITIATIVE STRATEGIC PLAN
74
Appendix I: Innovation & Climate Change Funding Mechanisms
There are a number of funding mechanisms available for organizations exploring projects and initiatives to help transition to a low-carbon economy. These vary from provincial and federally funded programs.
Green Fund Ontario
Green Fund Ontario is a not-for-profit provincial agency funded through the proceeds from Ontario’s carbon market. The Fund is in place to help meet Ontario’s GHG emission reduction target with a focus on buildings and industry. The Green Ontario Fund helps reduce energy use and increase savings by allowing business to take climate action on. Through the Green Ontario Fund, organizations may receive funding for efficiency improvement projects (e.g. lighting or HVAC upgrades), upgrading operational equipment and technologies, or innovative ideas / projects to solve a market barrier preventing the deployment of low-carbon commercial technologies, improvements in building processes or improvements in the production of goods. Link to Green Fund Ontario: https://www.greenon.ca/en
Municipal GHG Challenge Fund
Made possible through the proceeds from Ontario’s carbon market, municipalities can apply for funding of up to $10 million per project to offset 100% of eligible costs for GHG reduction projects. The Fund is part of the provincial Climate Change Action Plan to help Ontario meet its carbon reduction targets. Eligible projects are those municipal projects in any sector that aim to reduce GHG emissions in buildings, energy supply, water, transportation and organics. Projects must be initiated after June 1, 2016 to be eligible for funding. Link to Municipal GHG Challenge Fund: http://www.grants.gov.on.ca/GrantsPortal/en/OntarioGrants/GrantOpportunities/PRDR017538
The Low Carbon Economy Fund
To support the Pan-Canadian Framework on Clean Growth and Climate Change (Pan-Canadian Framework), this $2 billon fund will leverage projects to promote clean growth and reduce GHG emissions to help Canada meet its Paris agreement commitments. There are two parts to the fund, the Low Carbon Economy Leadership Fund and the Low Carbon Economy Challenge. Low Carbon Economy Leadership Fund includes $1.4 billion that will be distributed among the provinces and territories that have adopted the Pan-Canadian Framework. Provinces were required to work with the federal government in 2017 in order to determine projects to allocate funding towards for start dates in 2018. The Low Carbon Economy Challenge included over $500 million to fund projects to provinces, territories, municipalities, Indigenous communities and organizations, businesses and not-for-profit organizations. The deadline for the Challenge is May 14, 2018. Link to the Low Carbon Economy Fund: https://www.canada.ca/en/environment-climate-change/services/climate-change/low-carbon-economy-fund.html

WARWICK CIRCULAR ECONOMY CLUSTER INITIATIVE STRATEGIC PLAN
75
Clean Energy Fund Program
The Clean Energy Fund was created in 2009 by the Government of Canada to support clean energy research, development and demonstration (RD&D) projects to ensure a healthy environment. Designed to support the development of new, cutting-edge energy technologies essential to the reduction of GHG and other air emissions, funding was available for:
• Large scale-carbon capture and storage projects
• Small-scale demonstration projects in renewable and clean energy systems technologies
• Federal clean energy research and development The funding that was available through the Clean Energy Fund Program has officially been allocated to successful applicants with not additional funding available at this time. Link to Clean Energy Fund Program: http://www.nrcan.gc.ca/energy/funding/cef/4949
Green Municipal Fund (FCM)
The Green Municipal Fund is available through the Federation of Canadian Municipalities (FCM) that provides funding to support initiatives that aims to reduce GHG emissions, and improve air, water and soil. The funding is available for four types of municipal environmental initiatives:
• Plans
• Feasibility studies
• Pilot projects
• Capital projects Funding through the Green Municipal Fund is allocated in the following focus areas:
• Sustainable neighbourhood and brownfield action plans
• Energy efficiency and recovery
• Transportation and fuel efficiency
• Water quality and conservation
• Waste management and diversion
• Brownfields Link to Green Municipal Fund (FCM) https://fcm.ca/home/programs/green-municipal-fund/about-gmf.htm
The SD Tech Fund
Sustainable Development Technology Canada (SDTC) funds Canadian clean-tech projects to move technologies to market. Most recently, two major funding opportunities were made available: The SD Tech Fund and the NextGen Biofuels Fund. SDTC also partners with organizations to streamline funding of targeted innovation initiatives.
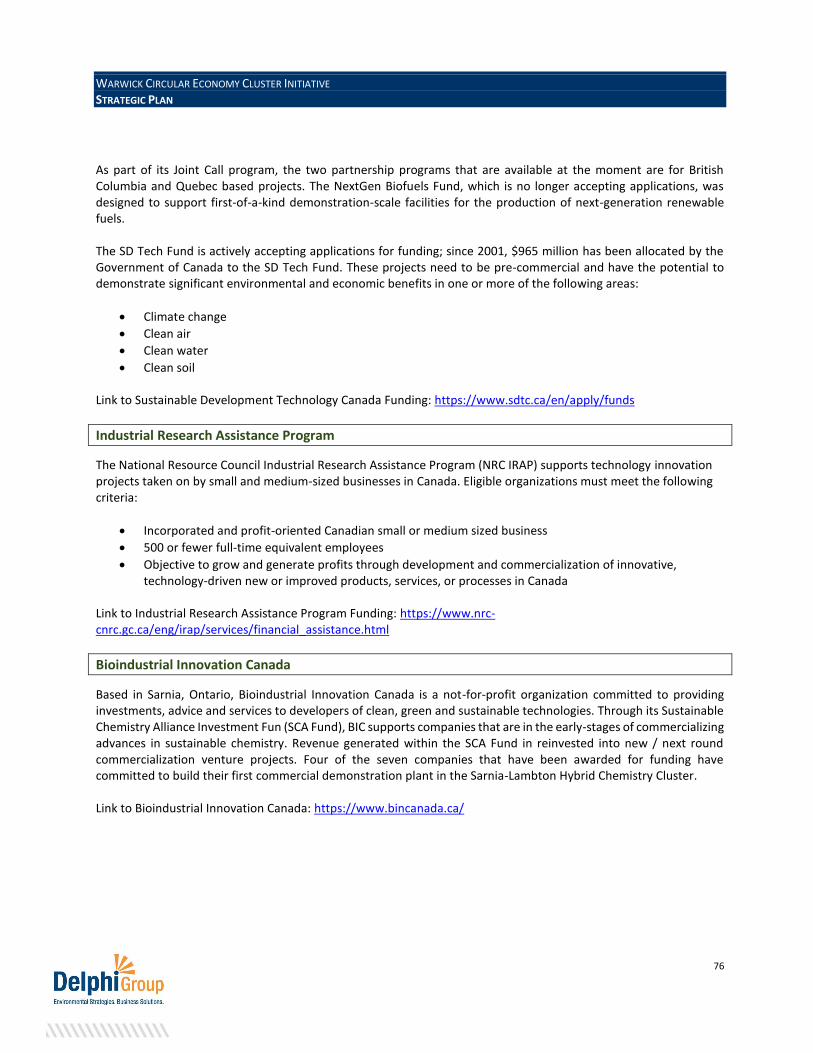
WARWICK CIRCULAR ECONOMY CLUSTER INITIATIVE STRATEGIC PLAN
76
As part of its Joint Call program, the two partnership programs that are available at the moment are for British Columbia and Quebec based projects. The NextGen Biofuels Fund, which is no longer accepting applications, was designed to support first-of-a-kind demonstration-scale facilities for the production of next-generation renewable fuels. The SD Tech Fund is actively accepting applications for funding; since 2001, $965 million has been allocated by the Government of Canada to the SD Tech Fund. These projects need to be pre-commercial and have the potential to demonstrate significant environmental and economic benefits in one or more of the following areas:
• Climate change
• Clean air
• Clean water
• Clean soil Link to Sustainable Development Technology Canada Funding: https://www.sdtc.ca/en/apply/funds
Industrial Research Assistance Program
The National Resource Council Industrial Research Assistance Program (NRC IRAP) supports technology innovation projects taken on by small and medium-sized businesses in Canada. Eligible organizations must meet the following criteria:
• Incorporated and profit-oriented Canadian small or medium sized business
• 500 or fewer full-time equivalent employees
• Objective to grow and generate profits through development and commercialization of innovative, technology-driven new or improved products, services, or processes in Canada
Link to Industrial Research Assistance Program Funding: https://www.nrc-cnrc.gc.ca/eng/irap/services/financial_assistance.html
Bioindustrial Innovation Canada
Based in Sarnia, Ontario, Bioindustrial Innovation Canada is a not-for-profit organization committed to providing investments, advice and services to developers of clean, green and sustainable technologies. Through its Sustainable Chemistry Alliance Investment Fun (SCA Fund), BIC supports companies that are in the early-stages of commercializing advances in sustainable chemistry. Revenue generated within the SCA Fund in reinvested into new / next round commercialization venture projects. Four of the seven companies that have been awarded for funding have committed to build their first commercial demonstration plant in the Sarnia-Lambton Hybrid Chemistry Cluster. Link to Bioindustrial Innovation Canada: https://www.bincanada.ca/

WARWICK CIRCULAR ECONOMY CLUSTER INITIATIVE STRATEGIC PLAN
77
EcoAction Community Funding Program
The EcoAction Community Funding Program had accepted applications until March 21, 2018 for new projects that engage Canadians and demonstrate measurable, positive environmental results related to clean water or climate change. Projects that engage Indigenous Peoples, youth or small businesses received preference in their evaluation for fudning. Link to EcoAction: https://www.canada.ca/en/environment-climate-change/services/environmental-funding/ecoaction-community-program/call-proposals.html
Closed Loop Fund
With a focus on improving recycling infrastructure, the Closed Loop Fund prioritizes closing the loop on materials and enhancing existing infrastructure. The fund is aimed towards replicable and financially viable recycling infrastructure projects in the following categories:
• Collection
• Sortation
• Processing/end markets Closed Loop Fund has identified the following priority areas within the categories:
• Comprehensive infrastructure development in underserved recycling markets
• Sortation of small format rigid plastics
• Sortation and processing of glass. Link to Closed Loop Fund: http://www.closedlooppartners.com/apply/
Continuous Improvement Fund/Stewardship Ontario
In partnership with Waste Diversion Ontario, the Association of Municipalities of Ontario, the City of Toronto and Stewardship Ontario, the Continuous Improvement Fund (CIF) provides grants and loans to municipalities to execute projects that improve the effectiveness and efficiency of municipal blue box recycling. CIF is committed to provide municipalities with the tools need to plan, manage and continuously improve their Blue Box Program through training courses and workshops. Link to Continuous Improvement Fund: http://stewardshipontario.ca/service-providers-municipalities-bluebox/continuous-improvement-fund/

WARWICK CIRCULAR ECONOMY CLUSTER INITIATIVE STRATEGIC PLAN
78
Business Development Bank of Canada
The Business Development Bank of Canada is the bank of entrepreneurs. Through BDC, organizations have access to financing and advisory service options to help fund innovative projects. Link to Business Development Bank of Canada: https://www.bdc.ca/en/pages/home.aspx
Lambton College Applied Research & Innovation
As an Applied Research center, Lambton College is eligible for a range of provincial, federal and private funding programs. Dependent on the organization, project and opportunity for Lambton students, funding opportunities exist. There are financial obligations that the organization must provide to support the opportunity. Link to Lambton College Applied Research Funding: https://www.lambtoncollege.ca/About_Us/Applied_Research/Funding_Sources/