Embed Size (px)
Citation preview
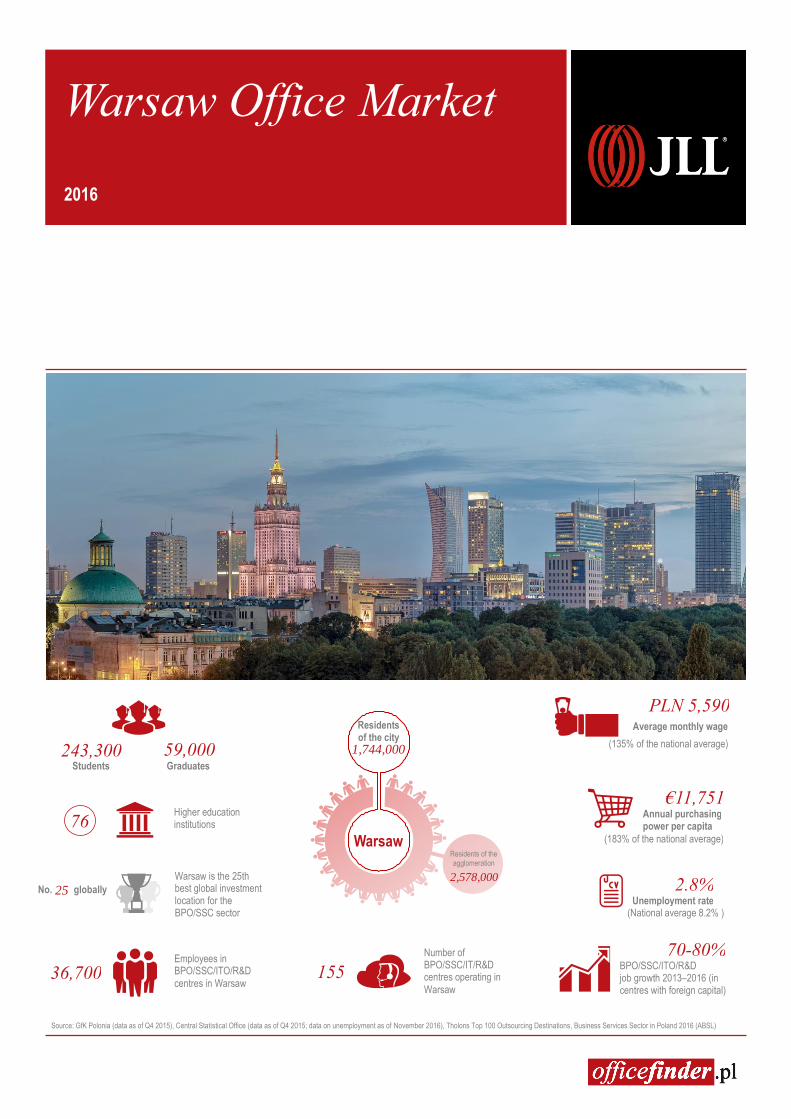
Warsaw Office Market 2016
Students Graduates 243,300 59,000
Residents of the city
Warsaw
1,744,000
2,578,000
Residents of the agglomeration
Average monthly wage (135% of the national average)
PLN 5,590
Annual purchasing power per capita
€11,751
(183% of the national average)
Unemployment rate (National average 8.2% )
2.8% 25 No. globally Warsaw is the 25th best global investment location for the BPO/SSC sector
Source: GfK Polonia (data as of Q4 2015), Central Statistical Office (data as of Q4 2015; data on unemployment as of November 2016), Tholons Top 100 Outsourcing Destinations, Business Services Sector in Poland 2016 (ABSL)
36,700 Employees in BPO/SSC/ITO/R&D
centres in Warsaw
Number of BPO/SSC/IT/R&D centres operating in
Warsaw 155
BPO/SSC/ITO/R&D job growth 2013–2016 (in centres with foreign capital)
70-80%
76 Higher education institutions
As a year, 2016 was extraordinary, both for Poland and globally. Political turmoil was the hot topic of 2016, with some of the biggest surprises including the Brexit vote, Donald Trump winning the US presidential election and new government’s policies in Poland. However, Warsaw, and its office market, successfully weathered the storm and showed undisputed strength as the regional leader.
There are several factors that made this possible. Numerous ongoing infrastructural improvements, such as the extension of the second metro line and the redevelopment of Marynarska Street, as well as planned projects, will greatly enhance transportation within the city and therefore improve market sentiment. Real estate thrives on public investments such as those, as can be seen from the example of the area near Daszyńskiego roundabout.
In terms of the office market in Warsaw, 2016 proved to be extremely busy. A key feature of the year was the extensive new supply which entered the market. This led to an increase in vacancy throughout the year in the city, but sound demand definitely softened the spike and proved that Warsaw is a vastly absorptive market. A number of companies decided to start operations in Warsaw or to expand their current premises and that trend is expected to continue.
Demand
2016 was a sound year on the Warsaw leasing market. Despite the much lower number of large leases (only two transactions of more than 10,000 m2, compared to ten in 2015), the market did very well. New developments attracted prestigious occupiers, some global firms expanded the range of their operations in Warsaw and a number of companies present in the city decided to renew their leases.
An interesting characteristic of the office market in 2016 was the return of Warsaw as an important location for modern business services. As the labour market became increasingly saturated and wages in regional cities rose, the city once again became an option for new services centres in Poland. That hasn’t been the case for the last few years and offers significant opportunities for the capital’s office market. Examples of recent new investments in Warsaw by this sector include Credit Suisse, Dentons, DLA Piper, William Demant, Bain & Company and others.
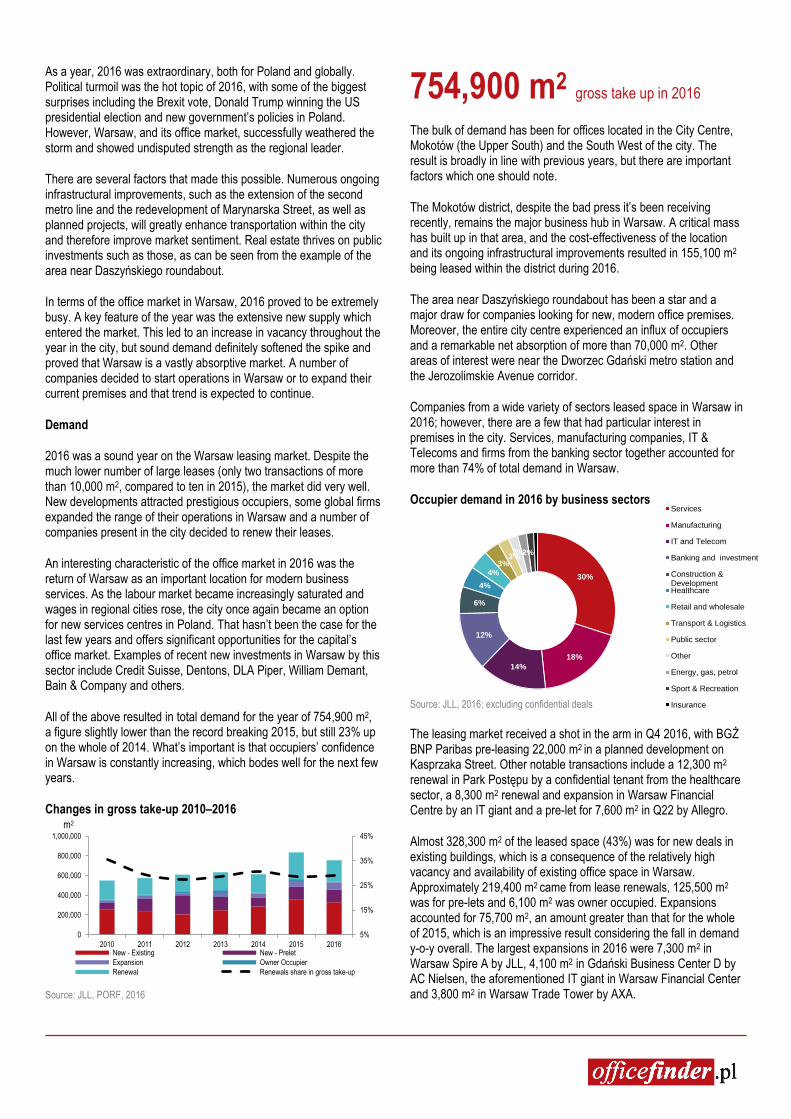
All of the above resulted in total demand for the year of 754,900 m2, a figure slightly lower than the record breaking 2015, but still 23% up on the whole of 2014. What’s important is that occupiers’ confidence in Warsaw is constantly increasing, which bodes well for the next few years.
Changes in gross take-up 2010–2016
Source: JLL, PORF, 2016
754,900 m2 gross take up in 2016
The bulk of demand has been for offices located in the City Centre, Mokotów (the Upper South) and the South West of the city. The result is broadly in line with previous years, but there are important factors which one should note.
The Mokotów district, despite the bad press it’s been receiving recently, remains the major business hub in Warsaw. A critical mass has built up in that area, and the cost-effectiveness of the location and its ongoing infrastructural improvements resulted in 155,100 m2 being leased within the district during 2016.
The area near Daszyńskiego roundabout has been a star and a major draw for companies looking for new, modern office premises. Moreover, the entire city centre experienced an influx of occupiers and a remarkable net absorption of more than 70,000 m2. Other areas of interest were near the Dworzec Gdański metro station and the Jerozolimskie Avenue corridor.
Companies from a wide variety of sectors leased space in Warsaw in 2016; however, there are a few that had particular interest in premises in the city. Services, manufacturing companies, IT & Telecoms and firms from the banking sector together accounted for more than 74% of total demand in Warsaw.
Occupier demand in 2016 by business sectors
Source: JLL, 2016; excluding confidential deals
The leasing market received a shot in the arm in Q4 2016, with BGŻ BNP Paribas pre-leasing 22,000 m2 in a planned development on Kasprzaka Street. Other notable transactions include a 12,300 m2 renewal in Park Postępu by a confidential tenant from the healthcare sector, a 8,300 m2 renewal and expansion in Warsaw Financial Centre by an IT giant and a pre-let for 7,600 m2 in Q22 by Allegro.
Almost 328,300 m2 of the leased space (43%) was for new deals in existing buildings, which is a consequence of the relatively high vacancy and availability of existing office space in Warsaw. Approximately 219,400 m2 came from lease renewals, 125,500 m2 was for pre-lets and 6,100 m2 was owner occupied. Expansions accounted for 75,700 m2, an amount greater than that for the whole of 2015, which is an impressive result considering the fall in demand y-o-y overall. The largest expansions in 2016 were 7,300 m2 in Warsaw Spire A by JLL, 4,100 m2 in Gdański Business Center D by AC Nielsen, the aforementioned IT giant in Warsaw Financial Center and 3,800 m2 in Warsaw Trade Tower by AXA.
5%
15%
25%
35%
45%
0
200,000
400,000
600,000
800,000
1,000,000
2010 2011 2012 2013 2014 2015 2016New - Existing New - Prelet
Expansion Owner Occupier
Renewal Renewals share in gross take-up
30%
18%
14%
12%
6%
4%
4%3%
3%2%2%
Services
Manufacturing
IT and Telecom
Banking and investment
Construction &DevelopmentHealthcare
Retail and wholesale
Transport & Logistics
Public sector
Other
Energy, gas, petrol
Sport & Recreation
Insurance
m2
0
100,000
200,000
300,000
400,000
500,000
2010 2011 2012 2013 2014 2015 2016 2017F 2018F
Completions (m²) Planned (m²)
Supply
2016 was an exceptional year for Warsaw on the supply side of the market. More than 407,000 m2 of modern office space was completed within the city, with the most spectacular new developments including two towers, i.e. Warsaw Spire A (59,100 m2, by Ghelamco Poland) and Q22 (46,400 m2, by Echo Investment), as well as Gdański Business Center D (29,300 m2, by HB Reavis) and West Station I (28,700 m2, by HB Reavis), among others.
This upswing in developer activity was concentrated mainly in the City Centre Fringe submarket (more than 123,000 m2 completed), the South West district (87,600 m2) and the CBD (72,100 m2). It is interesting that the Mokotów district saw the completion of only one office building in the whole of 2016 – Wołoska 24 – which is well-below its long-term average. The construction activity in that subzone of Warsaw totals approximately 100,000 m2.
Several high-profile new constructions and demolitions started in Warsaw in 2016, the latter including the demolition of the Universal building in the very centre of the capital. For a long time it was one of the most famous buildings in Warsaw, but in recent years it had lost all of its former glory. The building will be replaced by an office tower being developed by S+B Gruppe. The most anticipated new projects include The Warsaw Hub (by Ghelamco Poland), Mennica Legacy Tower (by Golub Gethouse) and Spark office complex (by Skanska Property Poland). HB Reavis recently started work on its Varso Place office park, which will include one of the tallest towers in Europe. Both Spark and Varso Place will be completed in phases.
675,000 m2 under construction
Currently approximately 675,000 m2 of office space is under construction in Warsaw, of which 46% is located in Central locations and 54% outside of those. The developer activity is quite high in Warsaw; however, the volume of completions in 2017 will soften compared to that in 2016.
In 2017 the South West will be the subzone of interest in terms of new supply. Two large-scale developments will be completed in that district, Business Garden buildings III–VII (approximately 55,000 m2 in total, by Vastint) and West Station II (34,100 m2, by HB Reavis), along with others. A significant amount of modern office space will also be delivered in the city centre, with the notable projects including Generation Park X (19,300 m2, by Skanska Property Poland), Wronia 31 (14,400 m2, by Ghelamco Poland), CEDET (14,300 m2, by Immobel Poland) and Ethos (12,100 m2; by Kulczyk Silverstein Properties).
Completions and pipeline 2010–2018*
Source: JLL, PORF, 2016
Vacancy
Last year brought significant fluctuations in the vacancy rate in Warsaw. It surged in H1 2016, as a consequence of the extensive supply entering the market. However, sound demand enabled the gradual absorption of the new space, and thus H2 2016 saw a slight decrease in the rate.
In detail, compared to the end of 2015 the vacancy rate rose by 1.9 pp (from 12.3% in Q4 2015 to 14.2% in Q4 2016). During H1 2016, when more than 360,100 m2 of modern office space entered the market, the vacancy rate for Warsaw spiked at 15.4% (17.1% in the CBD, 17.9% in the City Center Fringe and 14.4% in Non-Central locations).
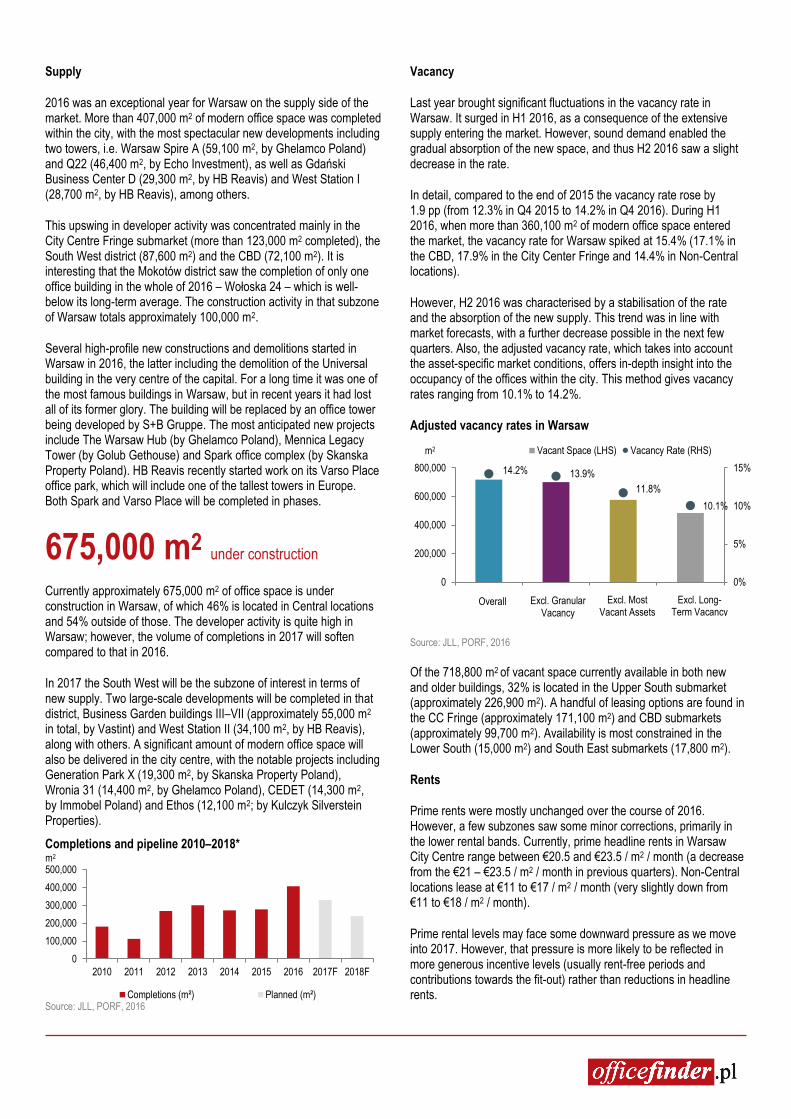
However, H2 2016 was characterised by a stabilisation of the rate and the absorption of the new supply. This trend was in line with market forecasts, with a further decrease possible in the next few quarters. Also, the adjusted vacancy rate, which takes into account the asset-specific market conditions, offers in-depth insight into the occupancy of the offices within the city. This method gives vacancy rates ranging from 10.1% to 14.2%.
Adjusted vacancy rates in Warsaw
Source: JLL, PORF, 2016
Of the 718,800 m2 of vacant space currently available in both new and older buildings, 32% is located in the Upper South submarket (approximately 226,900 m2). A handful of leasing options are found in the CC Fringe (approximately 171,100 m2) and CBD submarkets (approximately 99,700 m2). Availability is most constrained in the Lower South (15,000 m2) and South East submarkets (17,800 m2).
Rents
Prime rents were mostly unchanged over the course of 2016. However, a few subzones saw some minor corrections, primarily in the lower rental bands. Currently, prime headline rents in Warsaw City Centre range between €20.5 and €23.5 / m2 / month (a decrease from the €21 – €23.5 / m2 / month in previous quarters). Non-Central locations lease at €11 to €17 / m2 / month (very slightly down from €11 to €18 / m2 / month).
Prime rental levels may face some downward pressure as we move into 2017. However, that pressure is more likely to be reflected in more generous incentive levels (usually rent-free periods and contributions towards the fit-out) rather than reductions in headline rents.
14.2% 13.9%
11.8%
10.1%
0%
5%
10%
15%
0
200,000
400,000
600,000
800,000
O 0g m l
Vacant Space (LHS) Vacancy Rate (RHS)
Excl. Long-Term Vacancy
Excl. Granular Vacancy
Overall Excl. Most Vacant Assets
m2
m2
Jones Lang LaSalle
© 2017 Jones Lang LaSalle IP, Inc. All rights
reserved. The information contained in this
document is proprietary to Jones Lang
LaSalle and shall be used solely for the
purposes of evaluating this proposal. All such
documentation and information remains the
property of Jones Lang LaSalle and shall be
kept confidential. Reproduction of any part of
this document is authorized only to the extent
necessary for its evaluation. It is not to be
shown to any third party without the prior
written authorization of Jones Lang LaSalle.
All information contained herein is from
sources deemed reliable; however, no
representation or warranty is made as to the
accuracy thereof.
JLL
Anna Młyniec
Head of Office Agency
and Tenant Representation
Warsaw Spire
Plac Europejski 1
00-844 Warszawa
tel. +48 22 167 0000
www.jll.pl
JLL
Mateusz Polkowski
Head of Research &
Consultancy
Warsaw Spire
Plac Europejski 1
00-844 Warszawa
tel. +48 22 167 0000
www.jll.pl
JLL
Łukasz Dziedzic
Research Analyst
Warsaw Spire
Plac Europejski 1
00-844 Warszawa
tel. +48 22 167 0000
www.jll.pl
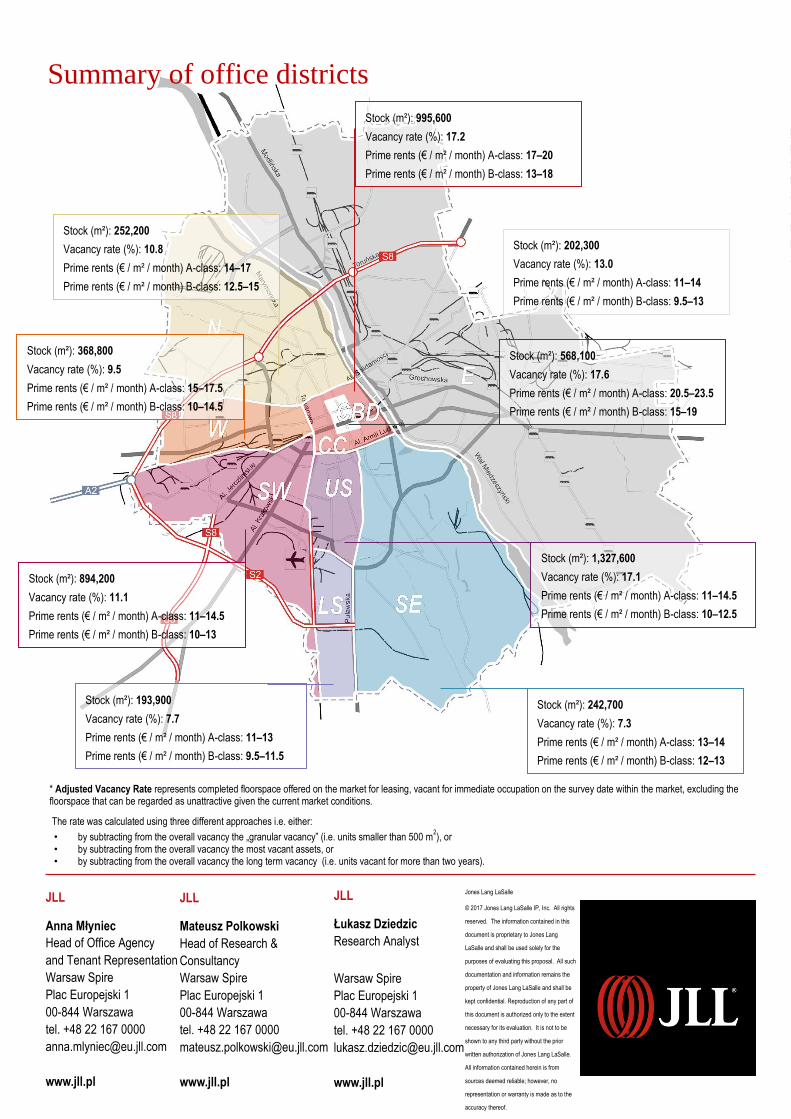
Summary of office districts
Stock (m²): 193,900
Vacancy rate (%): 7.7
Prime rents (€ / m² / month) A-class: 11–13
Prime rents (€ / m² / month) B-class: 9.5–11.5
Stock (m²): 242,700
Vacancy rate (%): 7.3
Prime rents (€ / m² / month) A-class: 13–14
Prime rents (€ / m² / month) B-class: 12–13
Stock (m²): 568,100
Vacancy rate (%): 17.6
Prime rents (€ / m² / month) A-class: 20.5–23.5
Prime rents (€ / m² / month) B-class: 15–19
Stock (m²): 1,327,600
Vacancy rate (%): 17.1
Prime rents (€ / m² / month) A-class: 11–14.5
Prime rents (€ / m² / month) B-class: 10–12.5
Stock (m²): 995,600
Vacancy rate (%): 17.2
Prime rents (€ / m² / month) A-class: 17–20
Prime rents (€ / m² / month) B-class: 13–18
Stock (m²): 202,300
Vacancy rate (%): 13.0
Prime rents (€ / m² / month) A-class: 11–14
Prime rents (€ / m² / month) B-class: 9.5–13
Stock (m²): 252,200
Vacancy rate (%): 10.8
Prime rents (€ / m² / month) A-class: 14–17
Prime rents (€ / m² / month) B-class: 12.5–15
Stock (m²): 368,800
Vacancy rate (%): 9.5
Prime rents (€ / m² / month) A-class: 15–17.5
Prime rents (€ / m² / month) B-class: 10–14.5
Stock (m²): 894,200
Vacancy rate (%): 11.1
Prime rents (€ / m² / month) A-class: 11–14.5
Prime rents (€ / m² / month) B-class: 10–13
* Adjusted Vacancy Rate represents completed floorspace offered on the market for leasing, vacant for immediate occupation on the survey date within the market, excluding the floorspace that can be regarded as unattractive given the current market conditions.
The rate was calculated using three different approaches i.e. either: • by subtracting from the overall vacancy the „granular vacancy” (i.e. units smaller than 500 m
2), or
• by subtracting from the overall vacancy the most vacant assets, or • by subtracting from the overall vacancy the long term vacancy (i.e. units vacant for more than two years).