Embed Size (px)
Citation preview
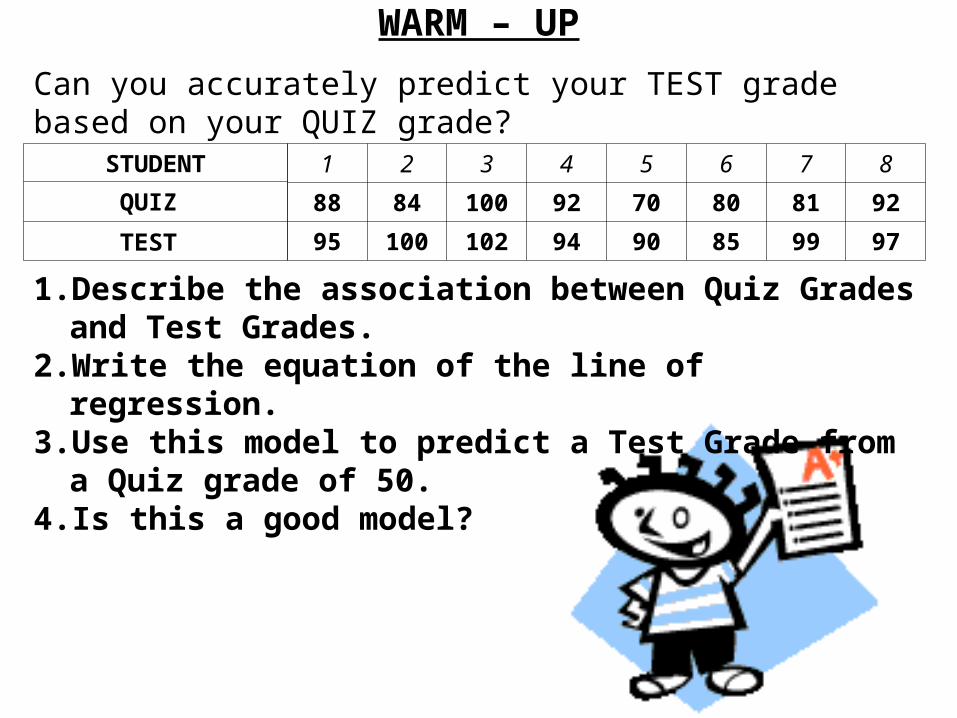
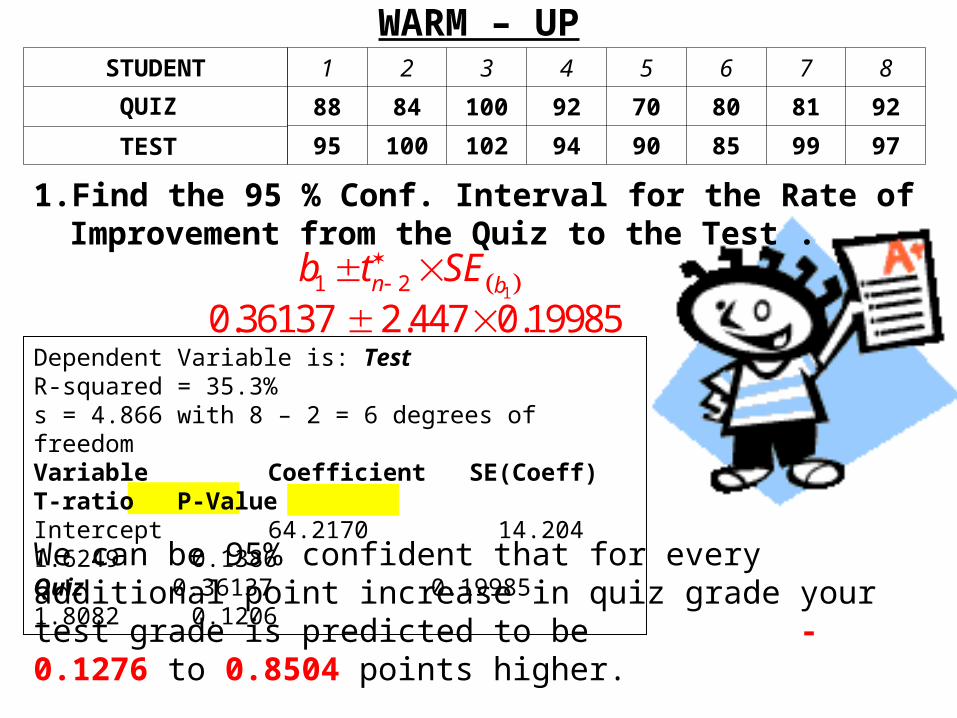
WARM – UP
Can you accurately predict your TEST grade based on your QUIZ grade?
1 2 3 4 5 6 7 8
88 84 100 92 70 80 81 92
95 100 102 94 90 85 99 97
STUDENT
QUIZ
TEST
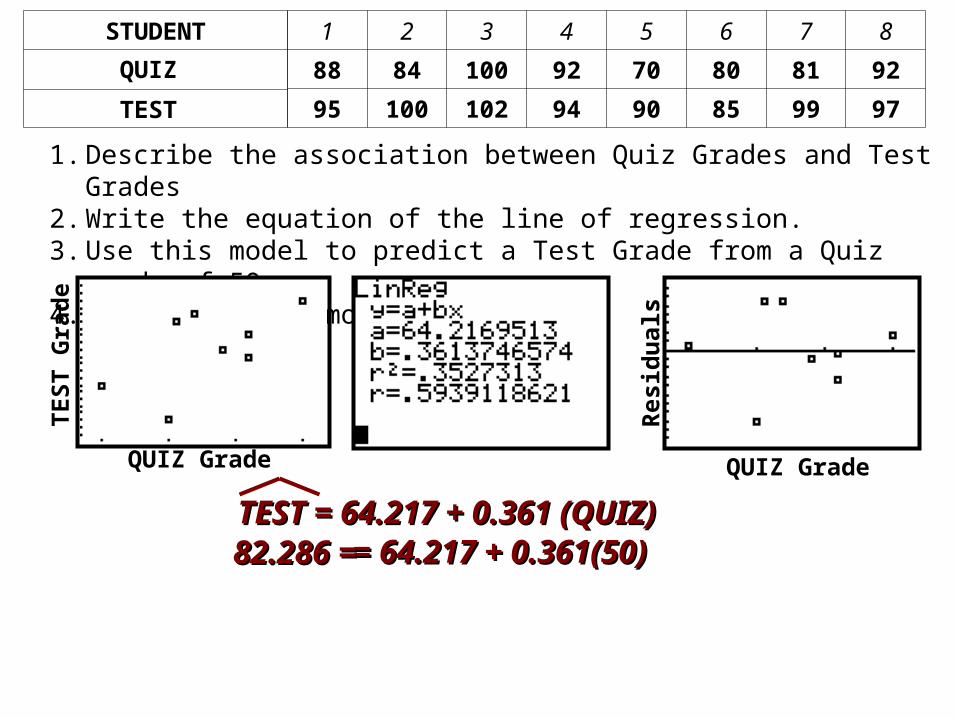
1. Describe the association between Quiz Grades and Test Grades.
2. Write the equation of the line of regression.3. Use this model to predict a Test Grade from a Quiz
grade of 50.4. Is this a good model?
QUIZ Grade
TE
ST
Gra
de
QUIZ Grade
Res
idu
als
TEST = 64.217 + 0.361 (QUIZ) TEST = 64.217 + 0.361 (QUIZ) = 64.217 + 0.361(50) = 64.217 + 0.361(50) 82.286 =82.286 =
1. Describe the association between Quiz Grades and Test Grades2. Write the equation of the line of regression.3. Use this model to predict a Test Grade from a Quiz grade of 50.4. Is this a good model?
1 2 3 4 5 6 7 8
88 84 100 92 70 80 81 92
95 100 102 94 90 85 99 97
STUDENT
QUIZ
TEST
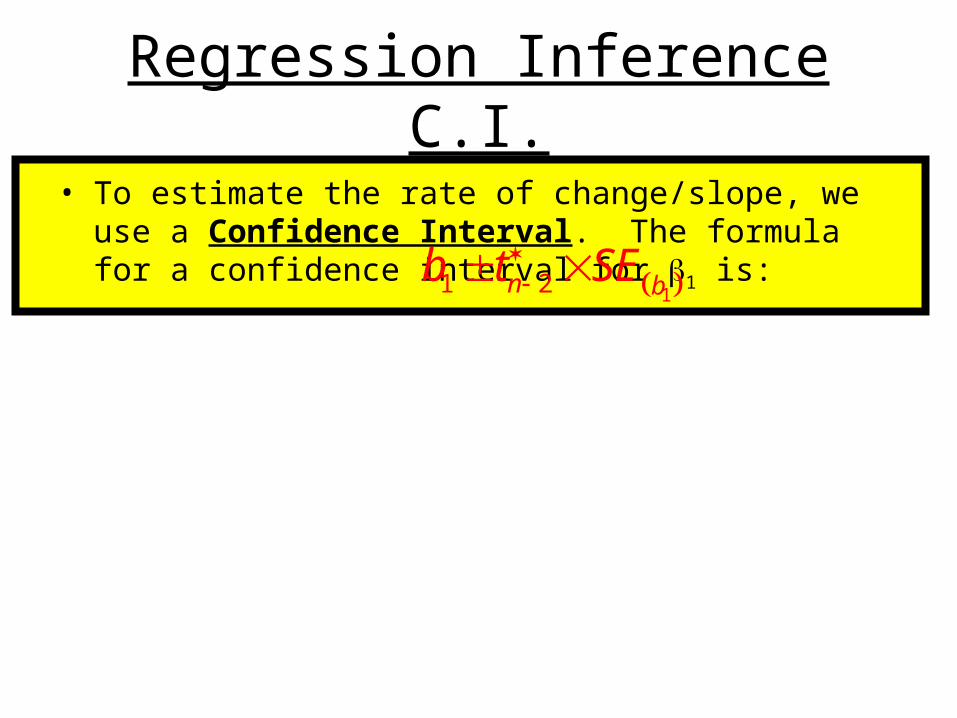
Regression InferenceC.I.
• To estimate the rate of change/slope, we use a Confidence Interval. The formula for a confidence interval for 1 is: 11 2n bb t SE
WARM – UP1 2 3 4 5 6 7 8
88 84 100 92 70 80 81 92
95 100 102 94 90 85 99 97
STUDENT
QUIZ
TEST
1. Find the 95 % Conf. Interval for the Rate of Improvement from the Quiz to the Test .
11 2n bb t SE
0.36137 2.447 0.19985
We can be 95% confident that for every additional point increase in quiz grade your test grade is predicted to be - 0.1276 to 0.8504 points higher.
Dependent Variable is: TestR-squared = 35.3%s = 4.866 with 8 – 2 = 6 degrees of freedomVariable Coefficient SE(Coeff) T-ratio P-ValueIntercept 64.2170 14.204 1.6249 0.1386Quiz 0.36137 0.19985 1.8082 0.1206
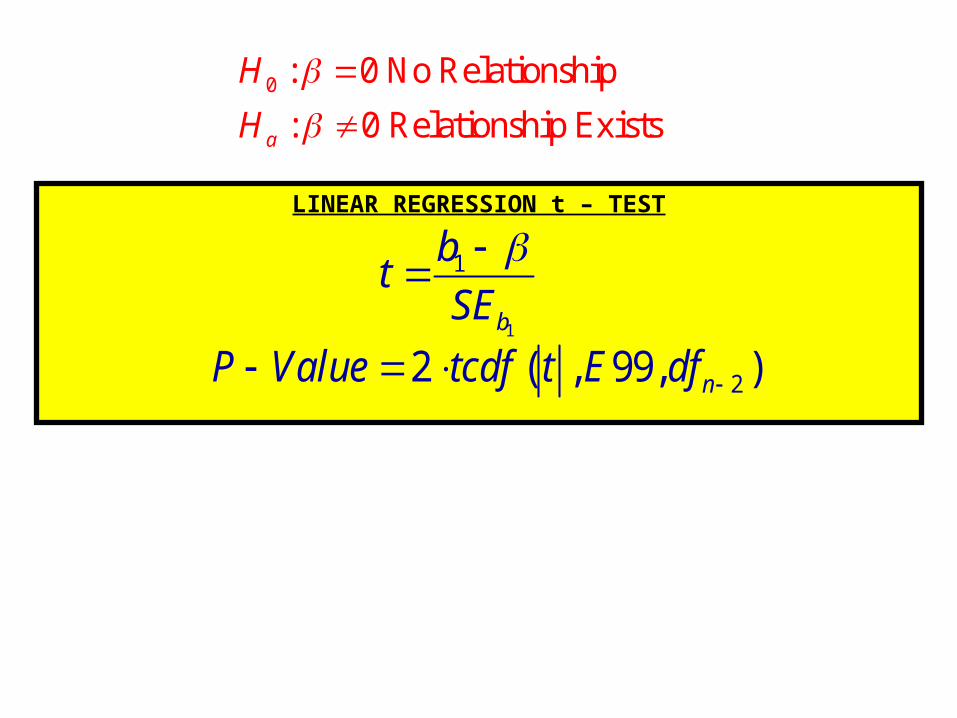
LINEAR REGRESSION t – TEST
1
1
b
bt
SE
22 ( , 99, )nP Value tcdf t E df
0 : 0 No Relationship
: 0 Relationship Existsa
H
H
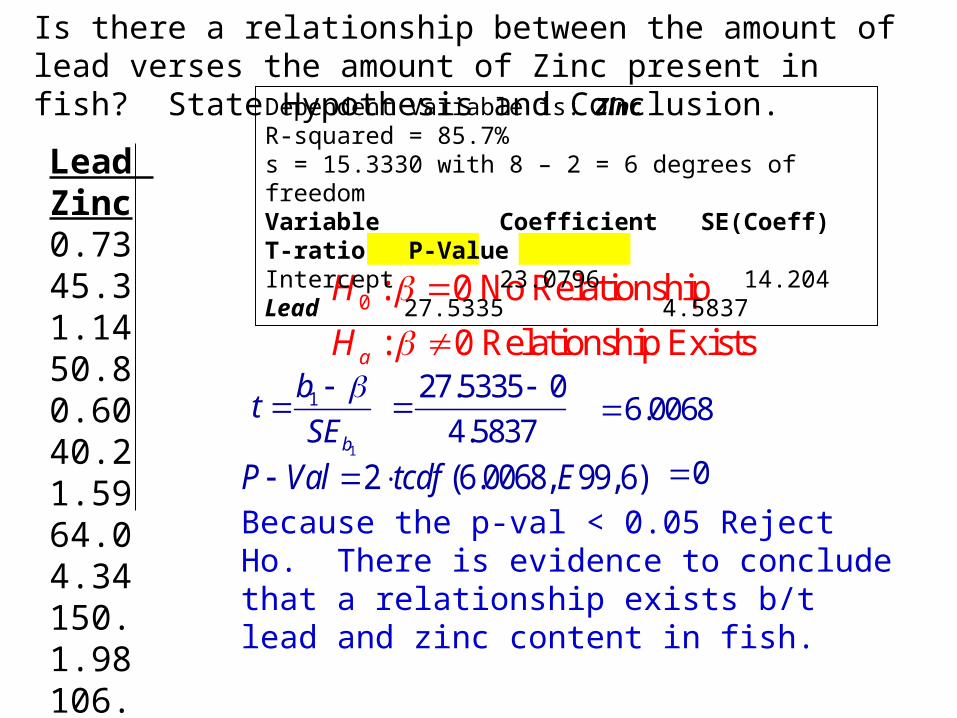
Is there a relationship between the amount of lead verses the amount of Zinc present in fish? State Hypothesis and Conclusion.
Lead Zinc 0.73 45.3 1.14 50.8 0.60 40.2 1.59 64.0 4.34 150. 1.98 106. 3.12 90.8 1.80 58.8
0 : 0 No Relationship
: 0 Relationship Existsa
H
H
Because the p-val < 0.05 Reject Ho. There is evidence to conclude that a relationship exists b/t lead and zinc content in fish.
Dependent Variable is: ZincR-squared = 85.7%s = 15.3330 with 8 – 2 = 6 degrees of freedomVariable Coefficient SE(Coeff) T-ratio P-ValueIntercept 23.0796 14.204Lead 27.5335 4.5837
1
1
b
bt
SE
27.5335 0
4.5837
6.0068
2 (6.0068, 99,6)P Val tcdf E 0

P-valueP-value
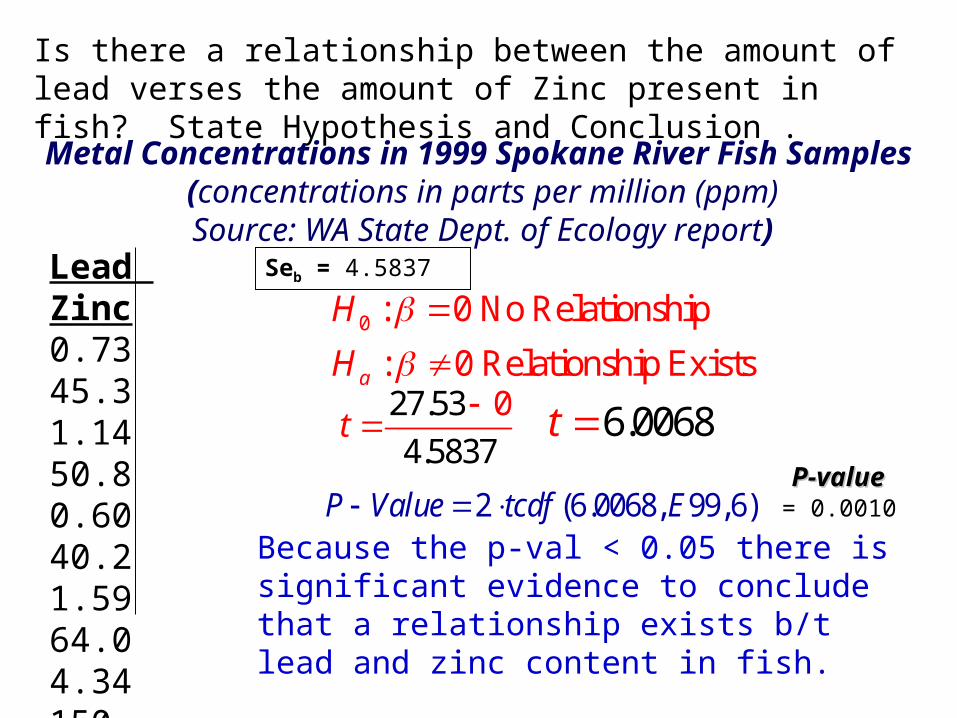
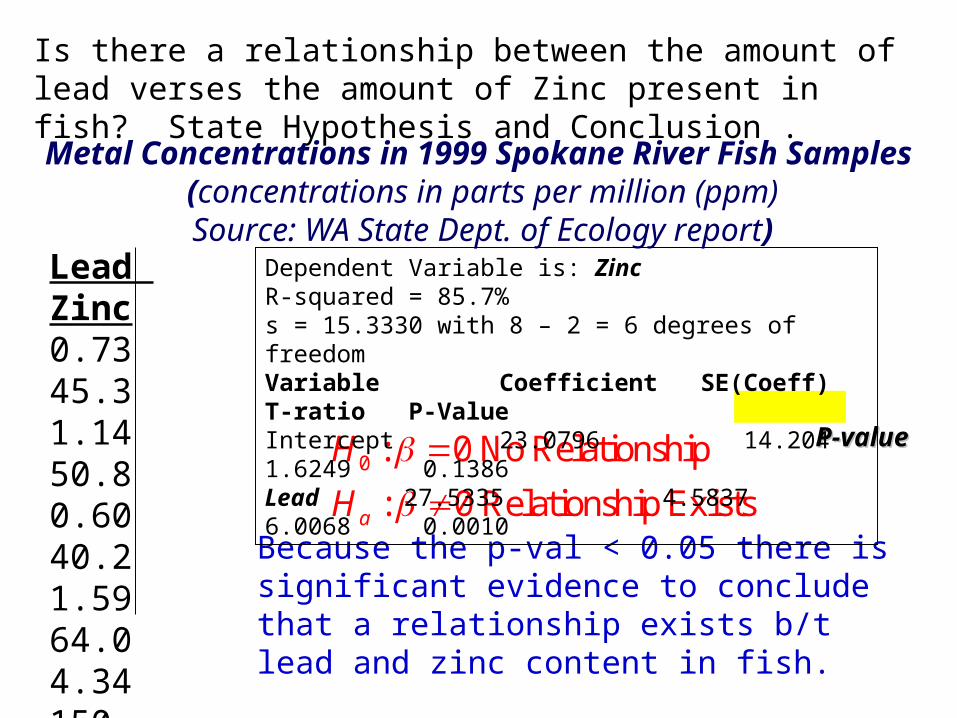
Is there a relationship between the amount of lead verses the amount of Zinc present in fish? State Hypothesis and Conclusion .
Metal Concentrations in 1999 Spokane River Fish Samples (concentrations in parts per million (ppm)
Source: WA State Dept. of Ecology report)Lead Zinc 0.73 45.3 1.14 50.8 0.60 40.2 1.59 64.0 4.34 150. 1.98 106. 3.12 90.8 1.80 58.8
0 : 0 No Relationship
: 0 Relationship Existsa
H
H
Because the p-val < 0.05 there is significant evidence to conclude that a relationship exists b/t lead and zinc content in fish.
Seb = 4.5837
= 0.0010
27.53
837
0
4.5t
6.0068t
2 (6.0068, 99,6)P Value tcdf E
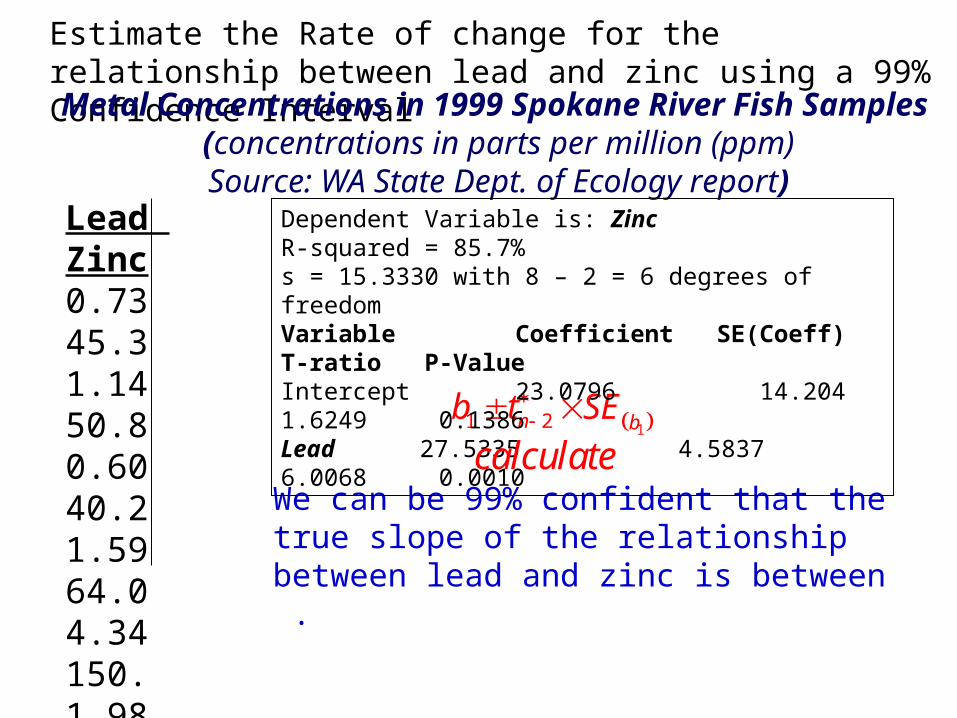
Estimate the Rate of change for the relationship between lead and zinc using a 99% Confidence Interval
Metal Concentrations in 1999 Spokane River Fish Samples (concentrations in parts per million (ppm)
Source: WA State Dept. of Ecology report)Lead Zinc 0.73 45.3 1.14 50.8 0.60 40.2 1.59 64.0 4.34 150. 1.98 106. 3.12 90.8 1.80 58.8
11 2n bb t SE
We can be 99% confident that the true slope of the relationship between lead and zinc is between .
Dependent Variable is: ZincR-squared = 85.7%s = 15.3330 with 8 – 2 = 6 degrees of freedomVariable Coefficient SE(Coeff) T-ratio P-ValueIntercept 23.0796 14.204 1.6249 0.1386Lead 27.5335 4.5837 6.0068 0.0010
calculate
P-valueP-value
Is there a relationship between the amount of lead verses the amount of Zinc present in fish? State Hypothesis and Conclusion .
Metal Concentrations in 1999 Spokane River Fish Samples (concentrations in parts per million (ppm)
Source: WA State Dept. of Ecology report)Lead Zinc 0.73 45.3 1.14 50.8 0.60 40.2 1.59 64.0 4.34 150. 1.98 106. 3.12 90.8 1.80 58.8
0 : 0 No Relationship
: 0 Relationship Existsa
H
H
Because the p-val < 0.05 there is significant evidence to conclude that a relationship exists b/t lead and zinc content in fish.
Dependent Variable is: ZincR-squared = 85.7%s = 15.3330 with 8 – 2 = 6 degrees of freedomVariable Coefficient SE(Coeff) T-ratio P-ValueIntercept 23.0796 14.204 1.6249 0.1386Lead 27.5335 4.5837 6.0068 0.0010
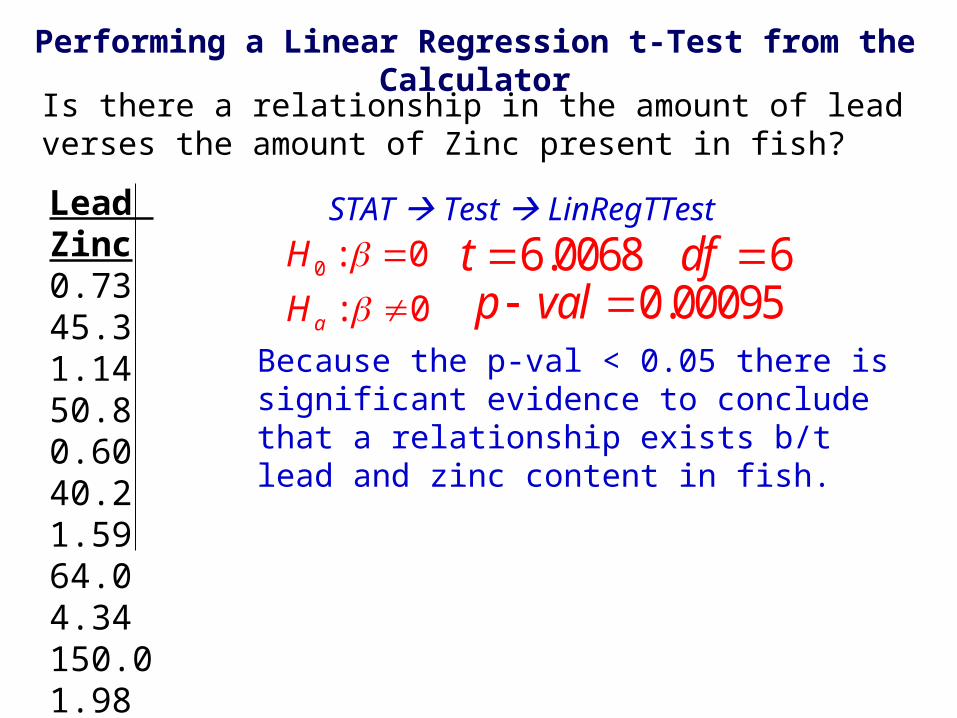
Is there a relationship in the amount of lead verses the amount of Zinc present in fish?
Performing a Linear Regression t-Test from the Calculator
Lead Zinc 0.73 45.3 1.14 50.8 0.60 40.2 1.59 64.0 4.34 150.0 1.98 106.0 3.12 90.8 1.80 58.8
0 : 0
: 0a
H
H
6.0068 6t df 0.00095p val
Because the p-val < 0.05 there is significant evidence to conclude that a relationship exists b/t lead and zinc content in fish.
STAT Test LinRegTTest
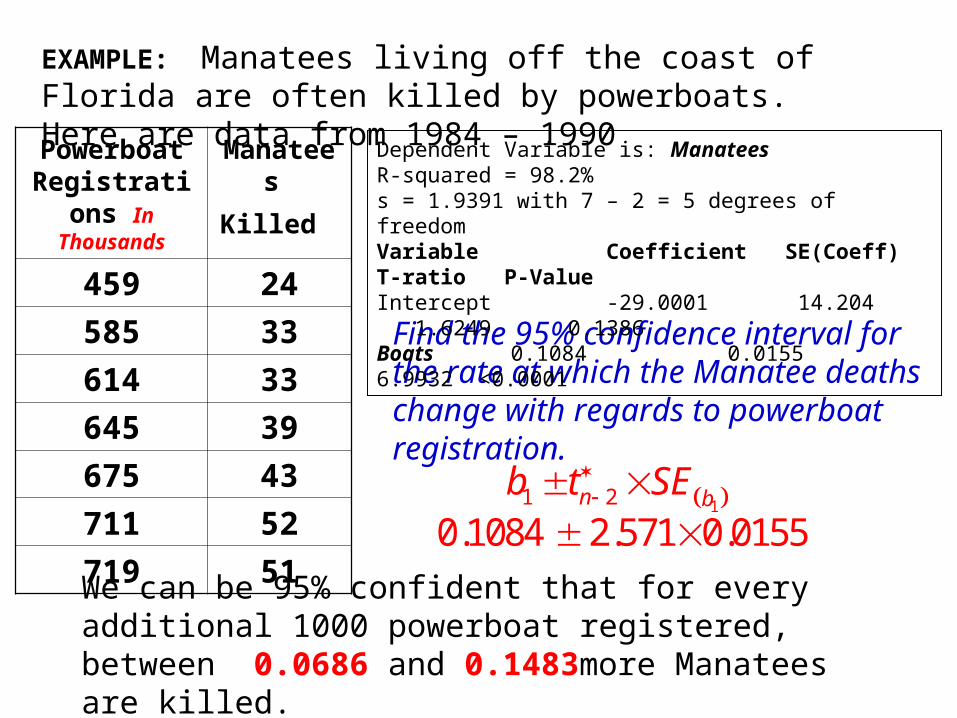
EXAMPLE: Manatees living off the coast of Florida are often killed by powerboats. Here are data from 1984 – 1990
Powerboat Registrations
In Thousands
Manatees
Killed
459 24
585 33
614 33
645 39
675 43
711 52
719 51
Find the 95% confidence interval for the rate at which the Manatee deaths change with regards to powerboat registration.
11 2n bb t SE
0.1084 2.571 0.0155
Dependent Variable is: ManateesR-squared = 98.2%s = 1.9391 with 7 – 2 = 5 degrees of freedomVariable Coefficient SE(Coeff) T-ratio P-ValueIntercept -29.0001 14.204 1.6249 0.1386Boats 0.1084 0.0155 6.9932 <0.0001
We can be 95% confident that for every additional 1000 powerboat registered, between 0.0686 and 0.1483more Manatees are killed.
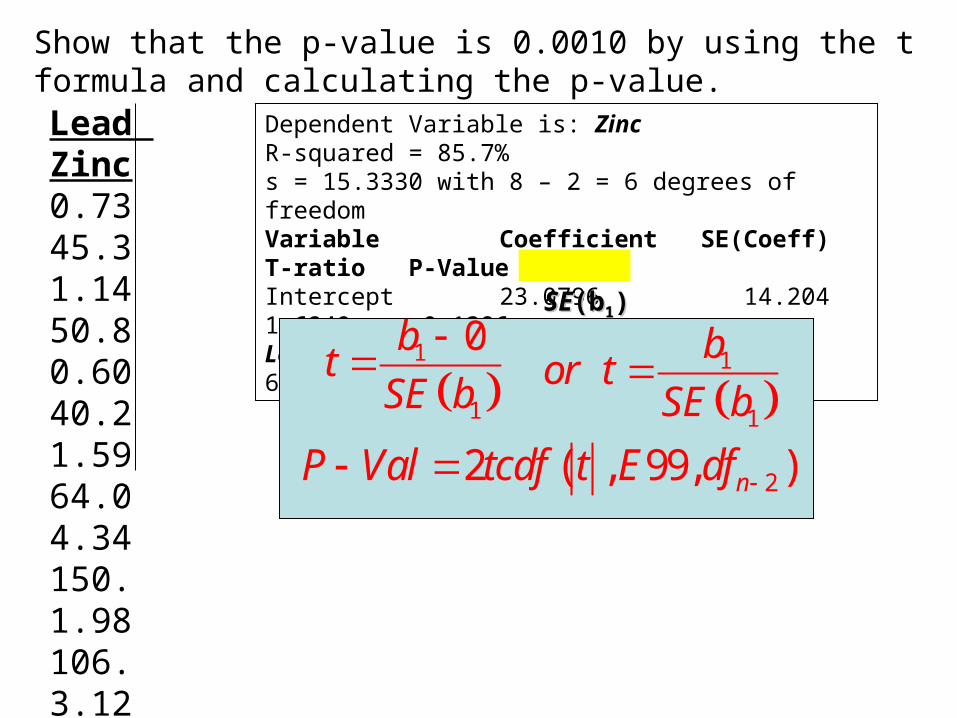
Show that the p-value is 0.0010 by using the t formula and calculating the p-value.Lead Zinc 0.73 45.3 1.14 50.8 0.60 40.2 1.59 64.0 4.34 150. 1.98 106. 3.12 90.8 1.80 58.8
Dependent Variable is: ZincR-squared = 85.7%s = 15.3330 with 8 – 2 = 6 degrees of freedomVariable Coefficient SE(Coeff) T-ratio P-ValueIntercept 23.0796 14.204 1.6249 0.1386Lead 27.5335 4.5837 6.0068 0.0010
1
1
0btSE b
22 ( , 99, )nP Val tcdf t E df
SESE(b(b11))
1
1
bor t
SE b