Embed Size (px)
Citation preview

Warm-Up #39
• Complete Study Guide page 128

Human Populations
Objectives
• Describe how the size of the human population has changed over time.
• Explain why population growth rates differ from country to country.
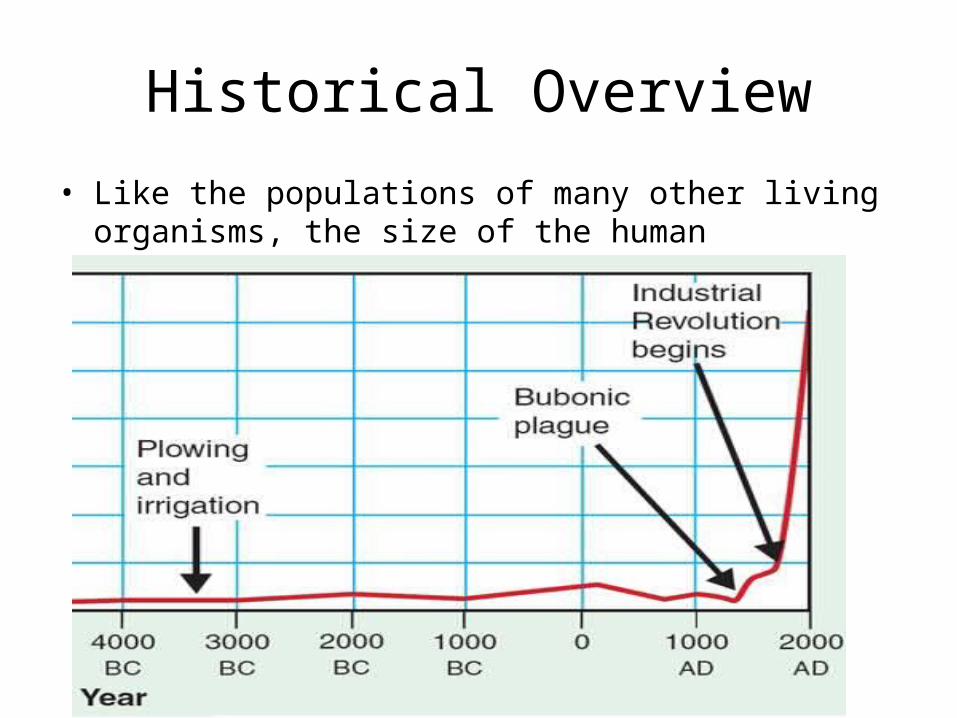
Historical Overview
• Like the populations of many other living organisms, the size of the human population tends to increase with time.
Patterns of Population Growth
• The human population cannot keep growing exponentially forever.
• What will limit human population growth?– war, famine, disease, many other social and economic factors.
• Demography is the study of human populations.• It examines the characteristics of human populations
and attempts to explain how those populations will change over time
• Birthrates, death rates and age structure can be used to predict the growth rates for various countries.
The Demographic Transition
• Over the past century, population growth in the US, Japan and much of Europe has slowed dramatically.
• Demographers explain this shift through a theory called demographic transition.
• The demographic transition involves a dramatic change in the birth and death rates in these countries.
The Demographic Transition
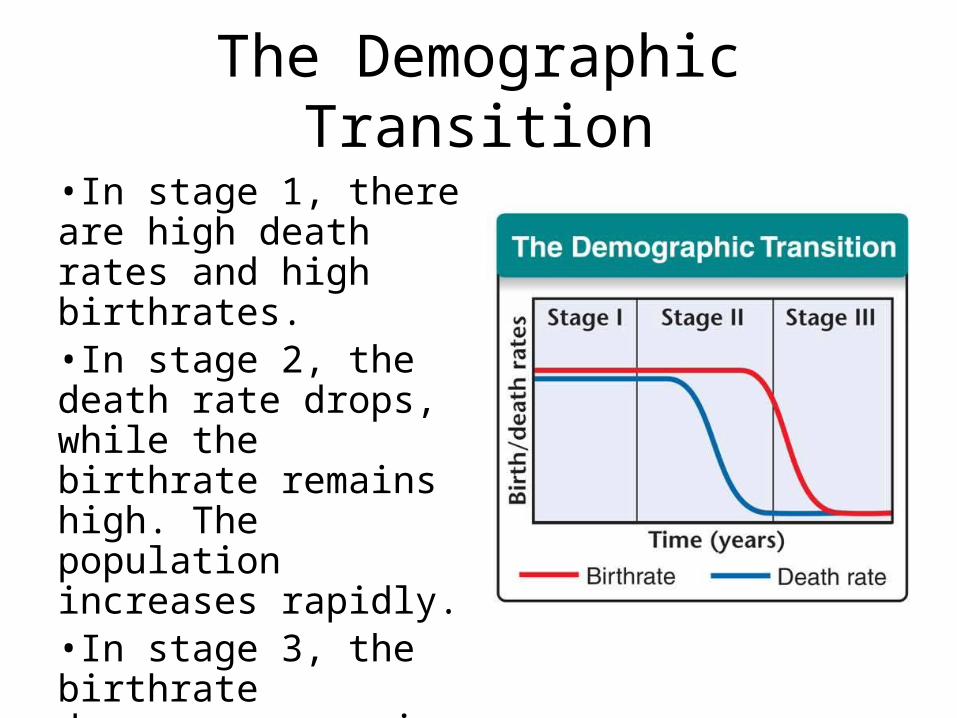
•In stage 1, there are high death rates and high birthrates.•In stage 2, the death rate drops, while the birthrate remains high. The population increases rapidly.•In stage 3, the birthrate decreases, causing population growth to slow
Age Structure
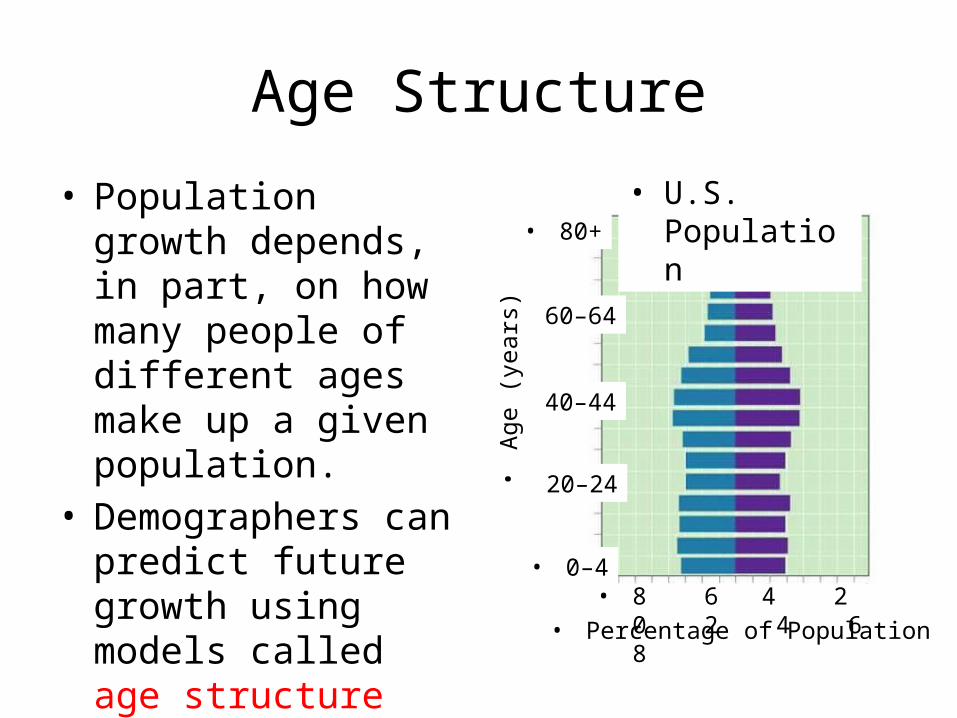
• Population growth depends, in part, on how many people of different ages make up a given population.
• Demographers can predict future growth using models called age structure diagrams or population profiles
• Males
• Females
• 8 6 4 2 0 2 4 6 8 • Percentage of Population
• 80+
• 60–64
• 20–24
• 0–4
• 40–44
•Ag
e (y
ears
)
• U.S. Population
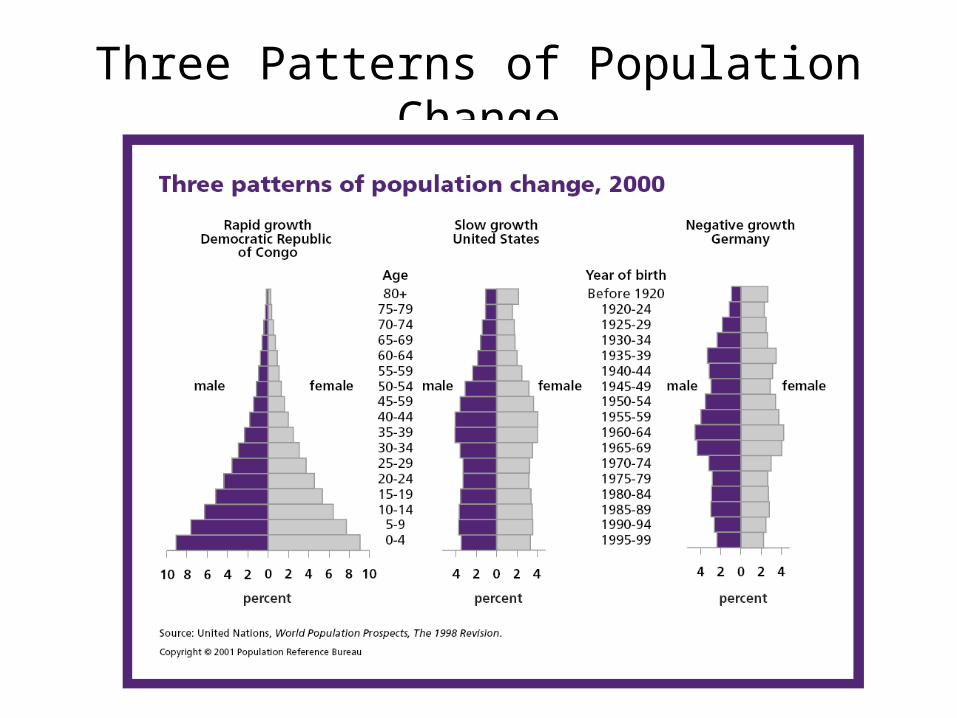
Three Patterns of Population Change
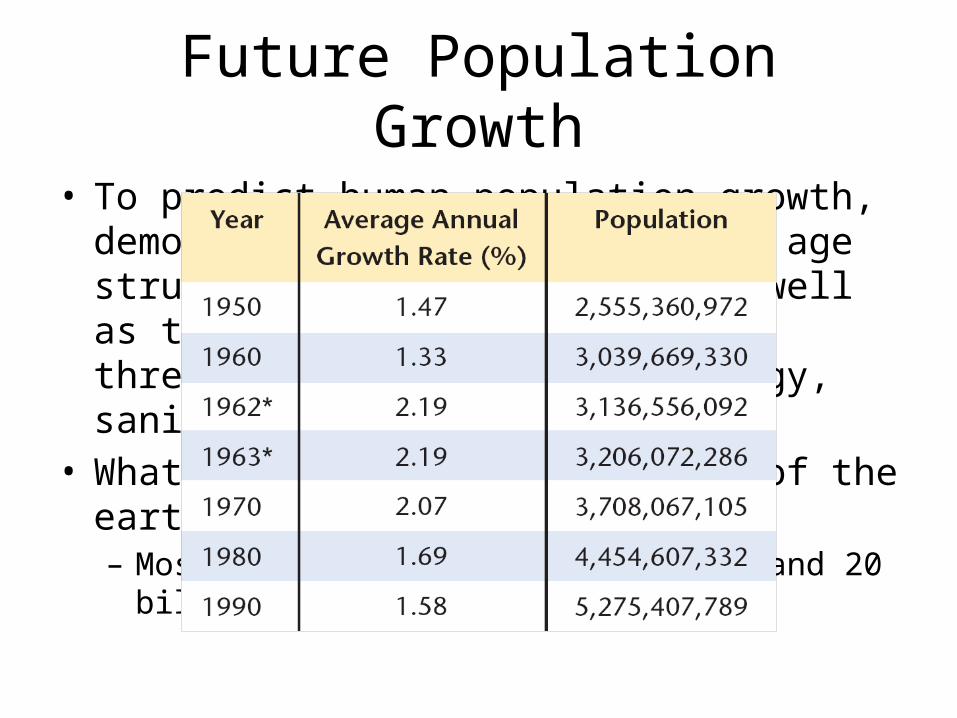
Future Population Growth
• To predict human population growth, demographers must consider the age structure of each country, as well as the prevalence of life-threatening diseases, technology, sanitation, etc.
• What is the carrying capacity of the earth?– Most estimates put it between 10 and 20 billion.
Summary
• How has the size of the human population changed over time?
• Why do population growth rates differ from country to country?
• Why does the age structure diagram look like for– A country experiencing rapid growth?– A country experiencing slow growth?– A country experiencing negative growth?
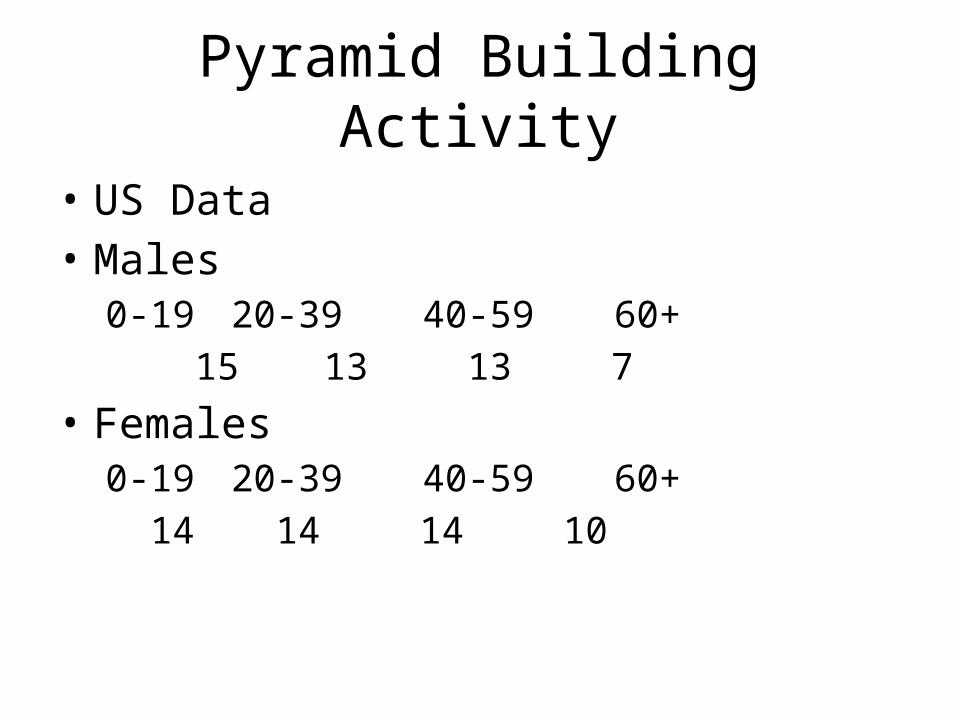
Pyramid Building Activity
• US Data• Males
0-19 20-39 40-59 60+ 15 13 13 7
• Females0-19 20-39 40-59 60+ 14 14 14 10

Homework
• STUDY FOR TEST• Homework Packets– Warm-Ups #38-40 (38 & 39 in packet)—6 points– Study Guide—3 points– Analyzing Data page 123—3 points– Population Growth Lab—5 points– Building Pyramids Activity—3 points– Extra Credit—phschool.com webcode: cba-2050