Embed Size (px)
Citation preview
Warm Up #10
1.) Graph 5x + 7y =35
2.) Graph y= 2x -3
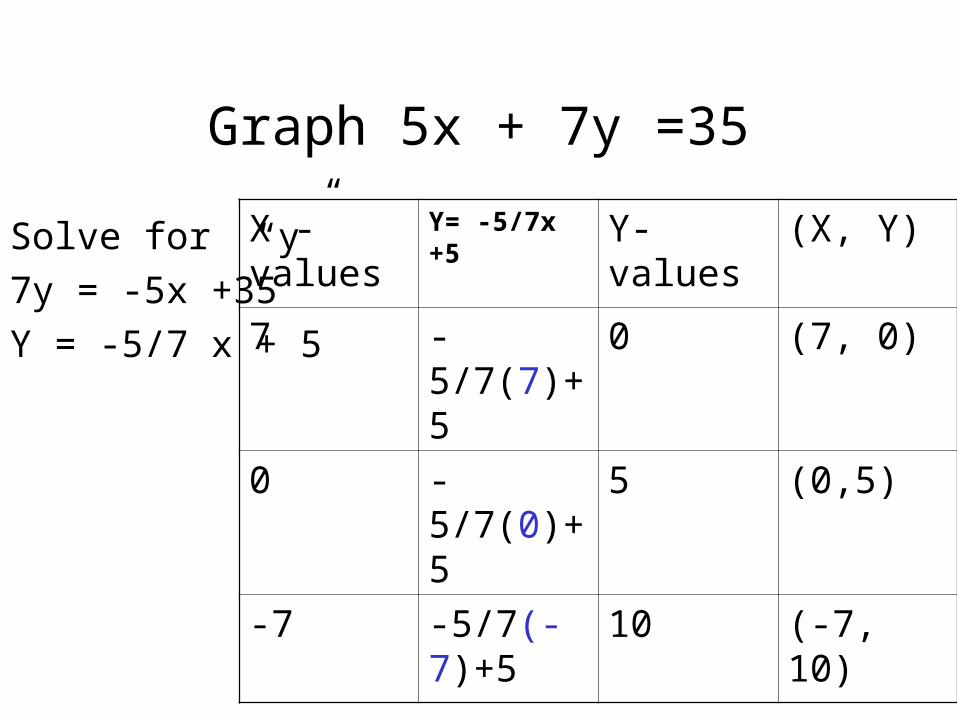
Graph 5x + 7y =35
Solve for “y”
7y = -5x +35
Y = -5/7 x + 5
X -values Y= -5/7x +5 Y- values (X, Y)
7 -5/7(7)+5 0 (7, 0)
0 -5/7(0)+5 5 (0,5)
-7 -5/7(-7)+5 10 (-7, 10)
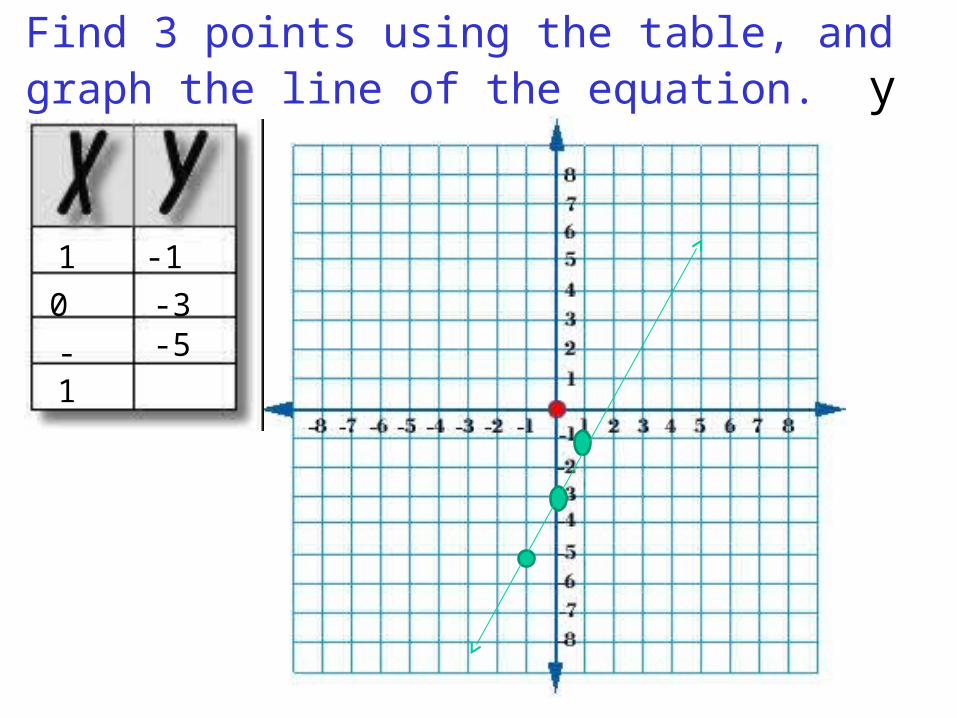
Find 3 points using the table, and graph the line of the equation. y = 2x - 3
1 -1
0 -3
-1 -5
7.3 Linear Equations and Their Graphs
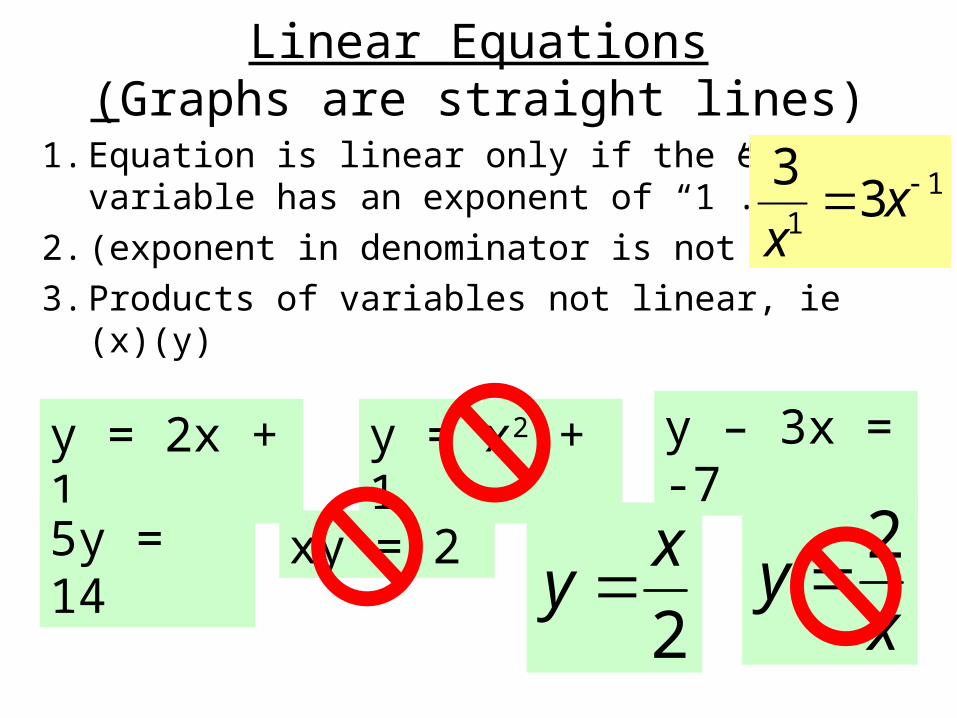
Linear Equations(Graphs are straight lines)
1. Equation is linear only if the each variable has an exponent of “1”.
2. (exponent in denominator is not linear)
3. Products of variables not linear, ie (x)(y)
y = 2x + 1
y = x2 + 1
y – 3x = -7
5y = 14 xy = 2
xy
2
2
xy
11
33x
x
4
3
2
1
-1
-2
-3
-6 -4 -2 2 4 6
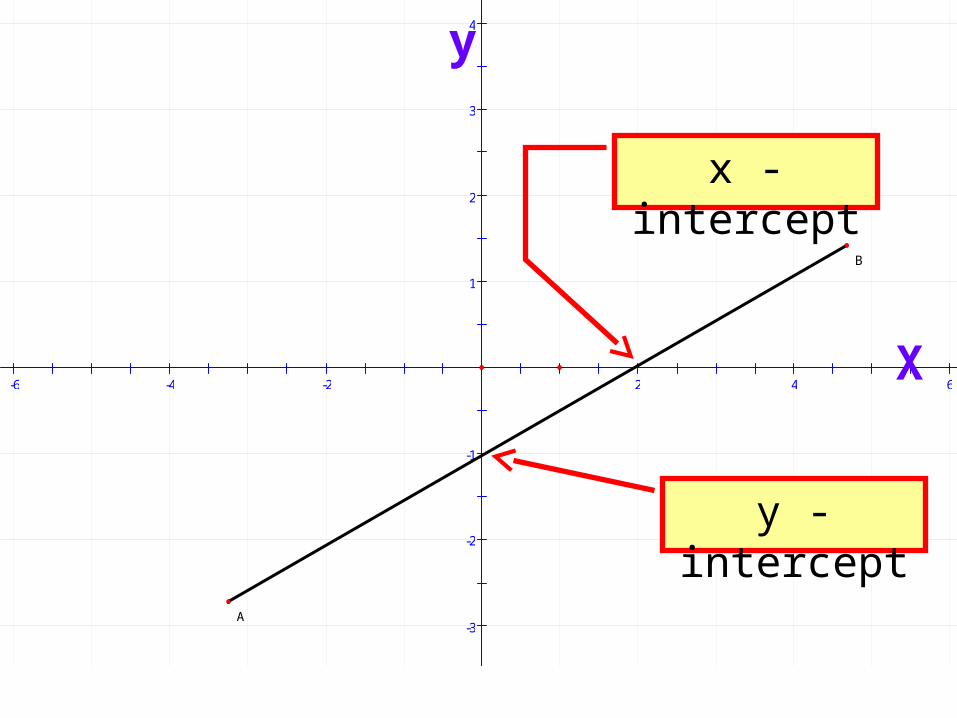
A
B
y - intercept
x - intercept
y
X
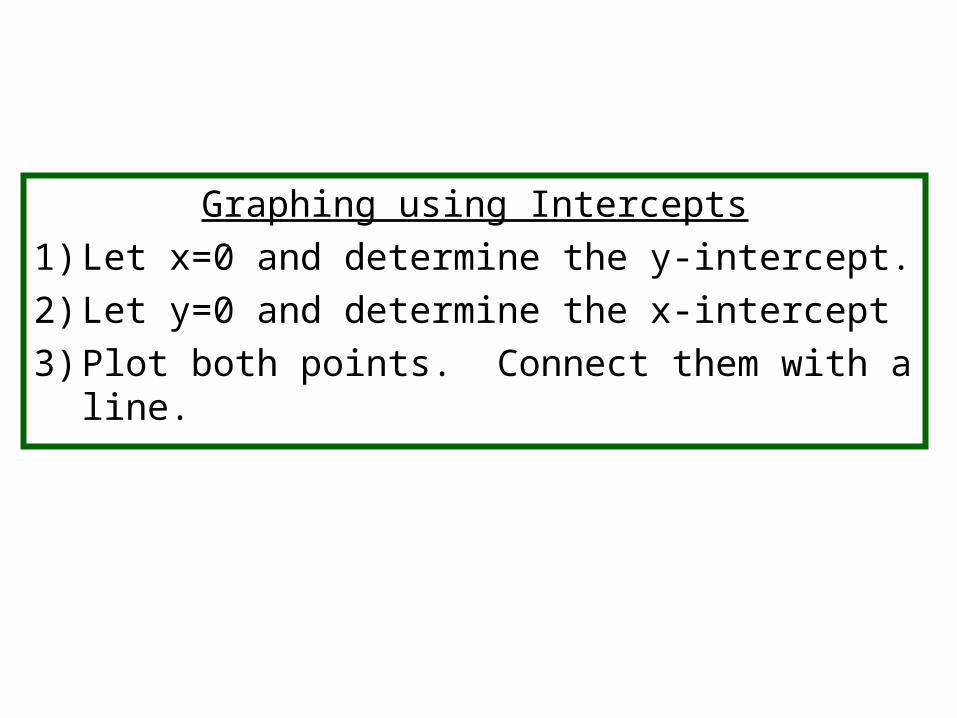
Graphing using Intercepts1) Let x=0 and determine the y-intercept.2) Let y=0 and determine the x-intercept3) Plot both points. Connect them with a
line.
6
5
4
3
2
1
-1
-2
-3
-4
-5
-8 -6 -4 -2 2 4 6 8
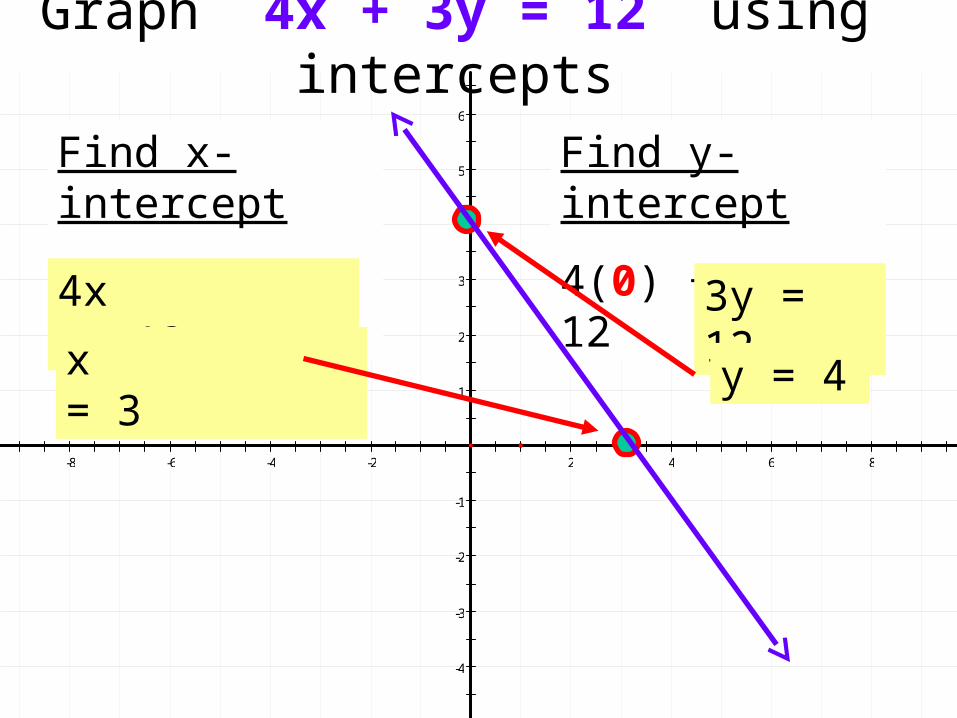
Graph 4x + 3y = 12 using intercepts
Find x-intercept
4x + 3(0) = 12
Find y-intercept
4(0) + 3y = 12
4x = 12x = 3
3y = 12
y = 4
6
5
4
3
2
1
-1
-2
-3
-4
-5
-8 -6 -4 -2 2 4 6 8
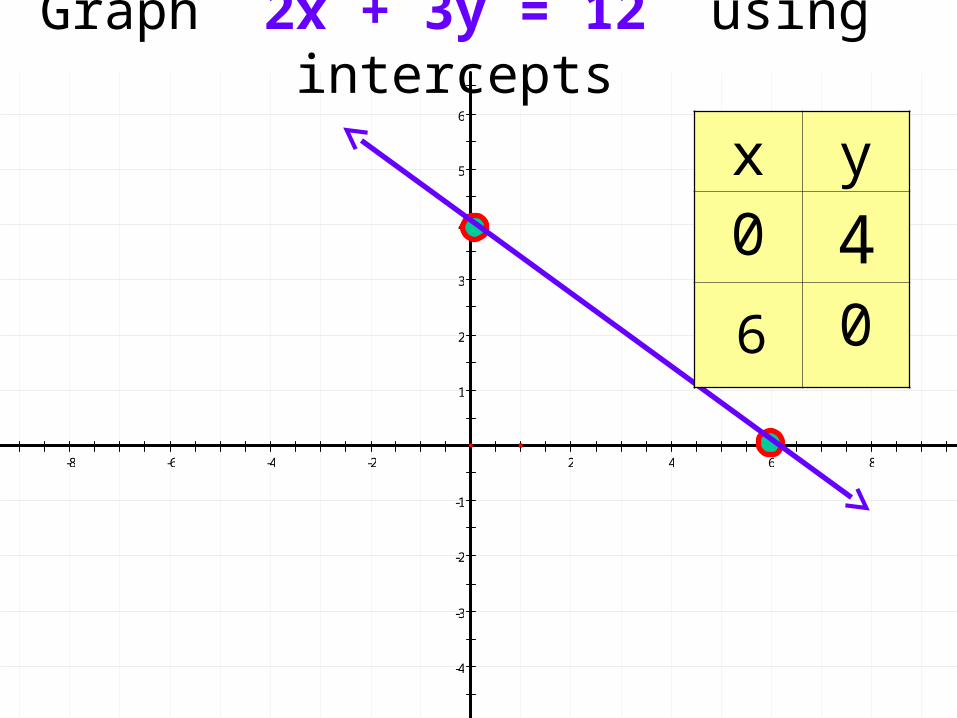
Graph 2x + 3y = 12 using intercepts
x y0
04
6
6
5
4
3
2
1
-1
-2
-3
-4
-5
-8 -6 -4 -2 2 4 6 8
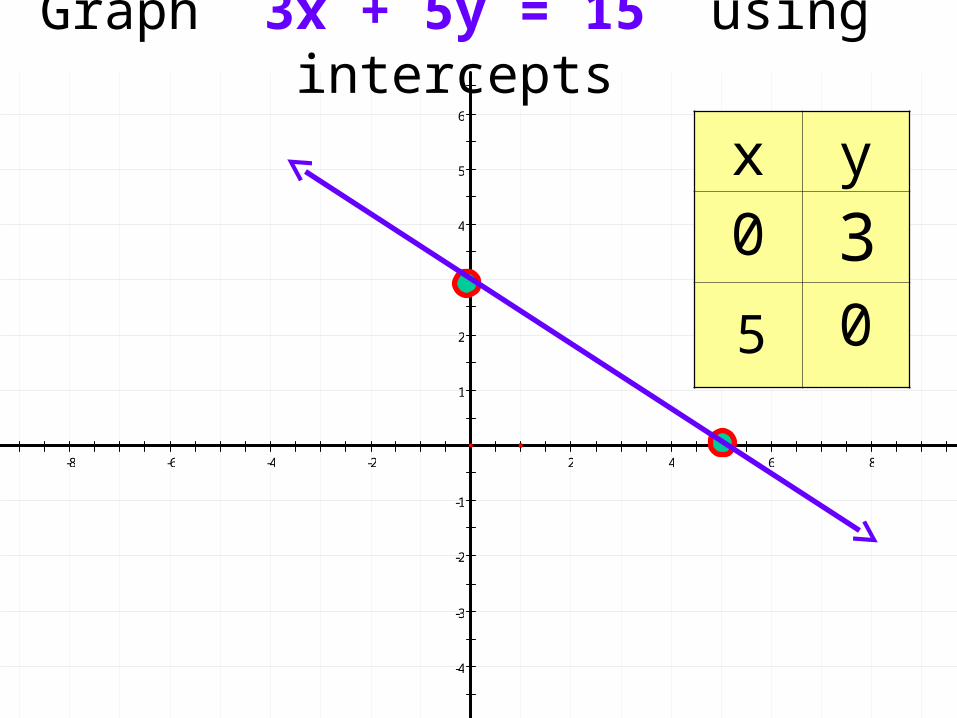
Graph 3x + 5y = 15 using intercepts
x y0
03
5
6
5
4
3
2
1
-1
-2
-3
-4
-5
-8 -6 -4 -2 2 4 6 8
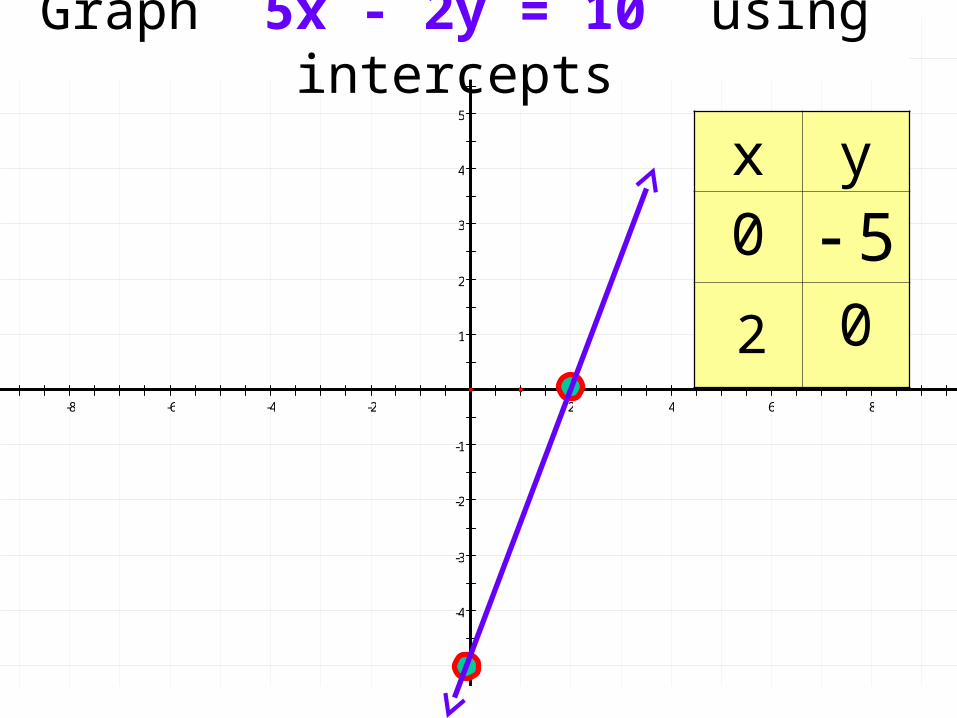
Graph 5x - 2y = 10 using intercepts
x y0
05
2
6
5
4
3
2
1
-1
-2
-3
-4
-5
-8 -6 -4 -2 2 4 6 8
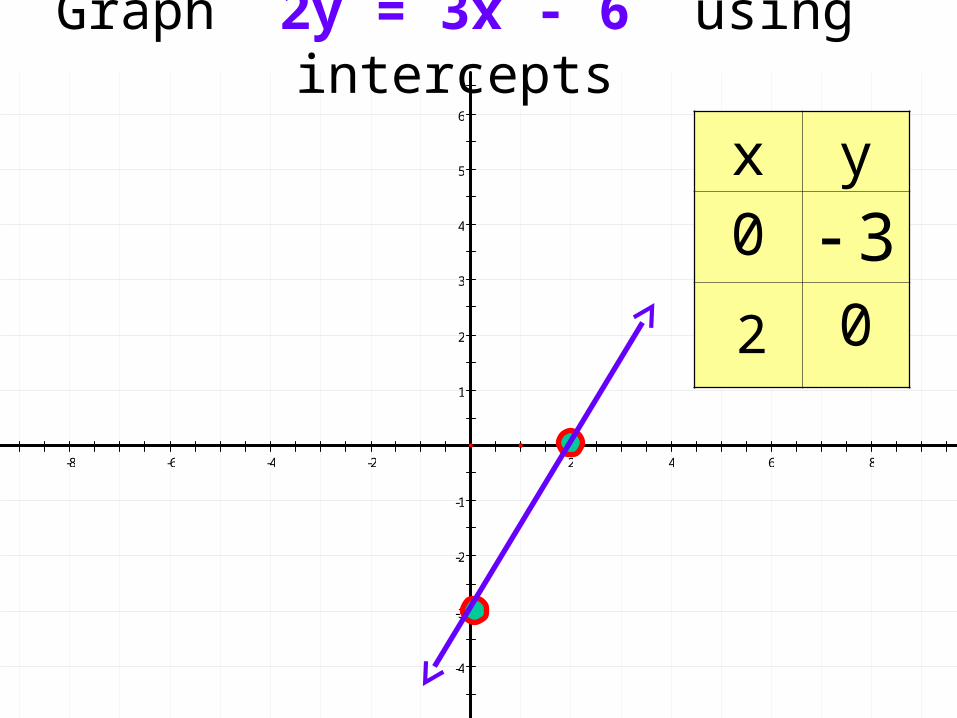
Graph 2y = 3x - 6 using intercepts
x y0
03
2
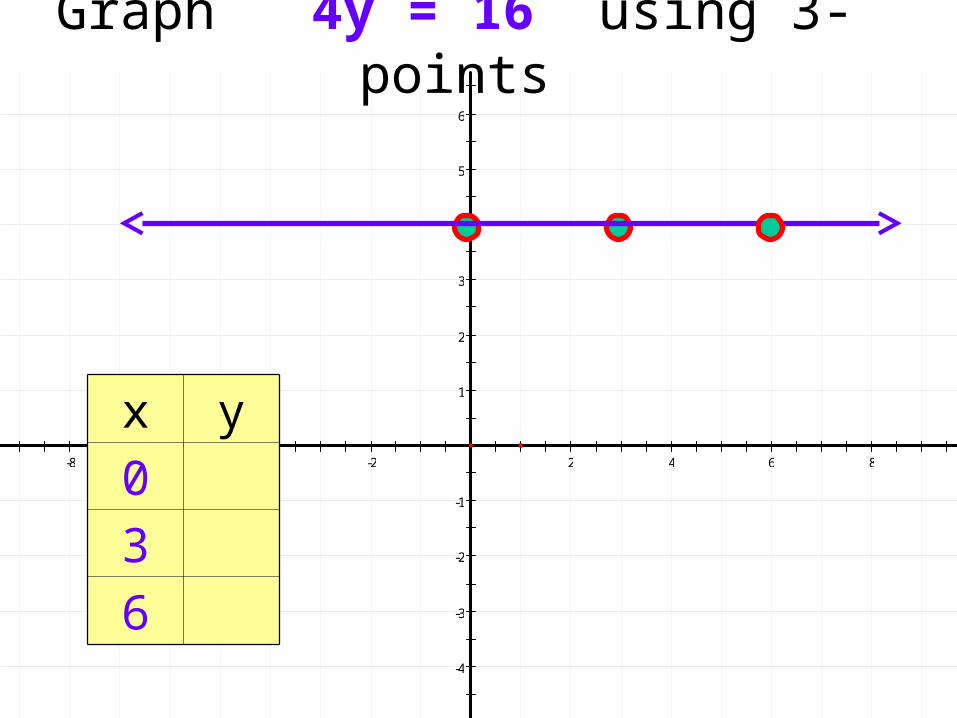
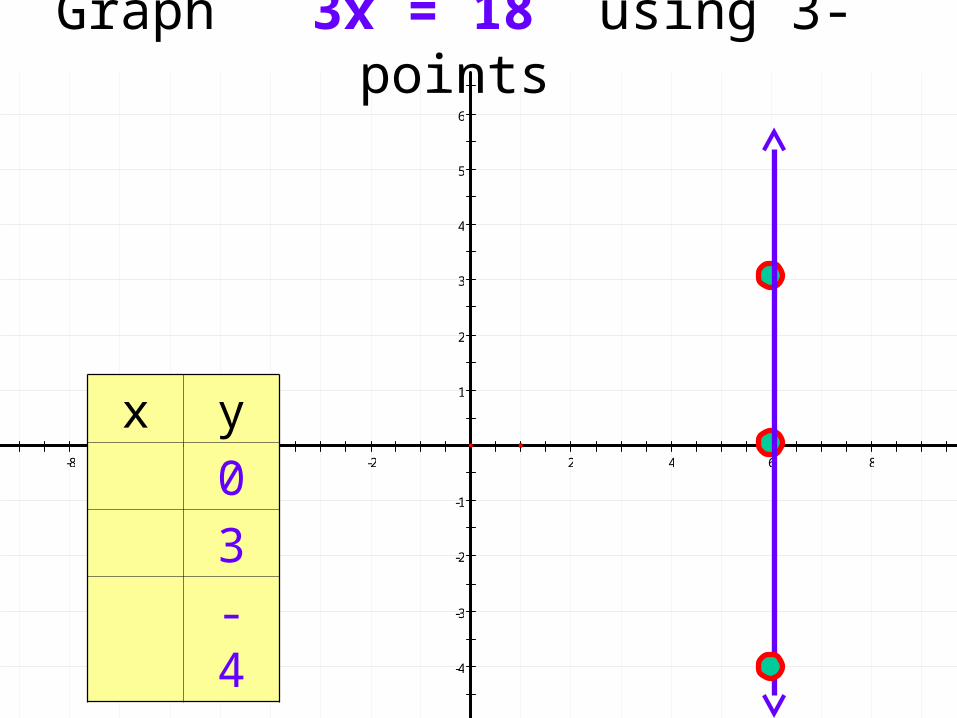
Horizontal and Vertical Lines
• The graph of y= # is HORIZONTAL
• The graph x =# is VERTICAL
6
5
4
3
2
1
-1
-2
-3
-4
-5
-8 -6 -4 -2 2 4 6 8
Graph 4y = 16 using 3-points
x y
036
6
5
4
3
2
1
-1
-2
-3
-4
-5
-8 -6 -4 -2 2 4 6 8
Graph 3x = 18 using 3-points
x y
03
- 4
Differences between graphing by using a table and graphing by finding the x and y intercepts
• When graphing by a table you need to solve for y (Slope Intercept Form y=mx+b)
• When graphing by finding the x and y intercepts you do not have to solve for y (Standard Form Ax +By =C)
Assignment
Page 316( 16 – 42 even and 45-49 all)