Embed Size (px)
Citation preview

War on Poverty: Effectiveness of Anti-Poverty Programs in the United States
Chien-Chung Huang and Juliann Vikse
Huamin Research Center, School of Social Work, Rutgers University
Abstract
In the 1960s the U.S. crafted and implemented an array of social assistance and social
insurance policies aimed atalleviating poverty. Fifty years later, many of these programs and
policies—or variations of them—are still in effect. Primarily using data from literature, this paper
analyzes the effectiveness of antipoverty programs over the last half-century.We find that social
insurance programs have had much stronger effects on reducing poverty rates than have social
assistance programs. Overall, the U.S. social welfare system tends to favor in-kind over cash
benefits, and has expanded the scope and reach of its provision of medical care, food, and tax
benefits. While antipoverty programs and policies have been somewhat successful in alleviating
poverty among the elderly and disabled, they have failed to alleviate poverty among single
mothers and their children.

Introduction
By the 1960smore thanone fifth of the U.S. populationlived in poverty. Rates of poverty
were highest among the elderly (35%), followed by children (27%) (DeNavas-Walt, Proctor, &
Smith, 2013).Although the nation had enjoyed close to a decade of postwar economic
prosperity,a host of internal and external conflicts posed new challenges (Trattner, 1999; Stern &
Axinn, 2012).An increased flow of immigrants and refugees from Europe, Latin America and
Asia, and changing birth and death rates, led to an enormous increase in population size—132
million in 1940, to 205 million in 1970—which in turn created new social welfare needs (Stern
& Axinn, 2012).Urbanization posed another set of challenges. The percentage of the population
living in urban areas grew from 64% in 1950 to 72% in 1970, and urban centers experienced
worsening conditions(Trattner, 1999; Stern & Axinn, 2012).Redlining practices left poor
families with limited access to building loans, urban renewal projects displaced predominantly
nonwhite residents, and pollution intensified (Pager & Shepherd, 2008). In Appalachian
communities,there were high rates of high school dropout, incarceration, and joblessness
(Gillette, 2010; Ziliak, 2010). Several notable books, including Michael Harrington’s The Other
America: Poverty in the United States and Dwight MacDonald’s Our Invisible Poor, helped
sparkpublic discourse aboutboth urban and rural poverty. At the same time, the intensifying Civil
Rights Movement drew widespread attention to the state of inequalityand discrimination.
President Lyndon B. Johnson’s ambitious “unconditional war on poverty,” which he
launched within months of taking office, aimed to “not only relieve the symptom of poverty, but
to cure it and, above all, to prevent it” (Johnson, 1964). Thiswar on poverty centered on several
key pieces of legislation. The Food Stamp Act (1964) gave permanent legislative authority to the
pilot program, which had been created in 1962 to raise levels of nutrition among low-income

households. The Economic Opportunity Act (1964) centered on job training, work incentives,
and social services, established programs to provide the education, skills, training, and
experience deemed necessary for success(e.g. Job Corps, VISTA, and federal work-study),
created specialized programs to combat rural poverty, and established the Office of Economic
Opportunity (OEO). The Social Security Amendments (1965) established Medicare and
Medicaid and expanded Social Security benefits. Also enacted in 1965, the Elementary and
Secondary Education Act established Title I, which distributed federal funding to low-income
schools.Finally, the1965 Appalachian Regional Development Act (ARDA) created the
Appalachian Regional Commission (ARC) to expand economic opportunities, human capital,
transportation, and other forms of infrastructure(Trattner, 1999; Stern & Axinn, 2012).
Following the 1960s, the war on poverty encountered several key shifts. Although
numerous social, political, and economic factors shaped social welfare developments during the
1970-1990 period, two particularly framed its history. The first was a confluence of slow
economic growth, high inflation, and high unemployment, which left limited resources to pay for
expanding social welfare demands. Wage growth slowed significantly during the 1970s, which
meant that economic growth had less of an effect on raising the wages of low-skilled workers
(Bailey & Danziger, 2013).Second, the veto of 1971 marked a substantial ideological shift in the
sphere of social welfare. The political right, dubbed the “New Right,” was suspicious of
government programs, and viewed welfare as weakening traditional family structure and
morality (Stern & Axinn, 2012). Over time, the New Right’s battle for conservative fiscal and
social policies contributed to a shift in public opinion (Trattner, 1999; Stern & Axinn, 2012).
Since the 1990s, antipoverty programs and policies have continued to undergo significant
changes. While the 1990s began in the shadow of a recession, unemployment and inflation rates

quickly decreased as technological advances led to increased productivity and standards of living
(Stern & Axinn, 2012). At the same time, racial and ethnic demographic shifts, increasing rates
of incarceration, divorce and single motherhood, and the increasing visibility of gay and lesbian
populations, have challenged some of the key assumptions of many antipoverty programs and
policies (Bailey & Danziger, 2013). Program and policy reforms during this period, most notably
the 1996 welfare reforms, have made the American social safety net more work-based. In
addition, the system has shifted further in favor of social insurance programs and tax incentives,
which do not necessarily target the poor (Ziliak, 2011).
The purpose of this paper is to analyze the effectiveness of antipoverty programs over the
last fifty years. Certainly, antipoverty programs and policies are closely tied to changing cultural,
political and economic contexts. Before exploring some of these issues further, and considering
their effects on antipoverty effectiveness, this paper will first provide a brief overview of a
number of key programs.
Types and Content of Anti-Poverty Programs
Social Assistance Programs
Social assistance programs are aimed at alleviating poverty among low-income
individuals and families. These are means tested programs that require recipients to meet specific
sets of requirements. In particular, Temporary Assistance to Needy Families (TANF) and the
Supplemental Nutrition Assistance Program (SNAP) provide benefits to very low-income
recipients; SNAP is the largest income support program in the U.S. The tax system is another
important means of delivering cash assistance to low-income families with children, through tax
credits like the Earned Income Tax Credit (EITC), Child Tax Credit, structural aspects of the tax

code, and credits such as the Child Tax Credit (CTC) and Child and Dependent Care Credit
(CDCC),that provide greater benefits to lower-income families.
TANF. The 1935 Aid to Dependent Children (ADC) program, created by the Social
Security Act, functioned as a fully funded assistance approach to poverty alleviation. This
program was aimed at poor, single, white mothers, who were expected to remain at home with
their children—and thus reinforced women’s roles as wives and homemakers (Tolleson-Rinehart
& Josephson, 2005). In 1962, partly in response to concerns about the program’s discouraging
marriage, ADC was renamed Aid to Families with Dependent Children (AFDC). By the 1990s,
mothers were seen as employable and were expected to work, and a subsequent wave of welfare
reforms imposed time limits and more stringent work requirements on all recipients. The
Personal Responsibility and Work Opportunity Reconciliation Act was passed and signed into
law in 1996, and effectively ended families’ entitlement to cash assistance. This marked the
transition from AFDC to Temporary Assistance for Needy Families (TANF).
The programs and policies aimed at poverty prevention and alleviation have changed
dramatically since this latter set of reforms, when the Clinton administration and Republican
Congress focused on “making work pay” and “ending welfare as we know it.” Currently, TANF
provides a basic block grant of $16.5 billion to all statesand requires states to contribute a
maintenance-of-effort (MOE) requirement of at least $10.4 billion annually (CRS, 2012). As of
2011 there were 1.9 billion needy families receiving TANF cash assistance—a 58% decline since
1998 (Trisi & Pavetti, 2012). One important distinguishing feature of the TANF program is its
lifetime limitation on receiving benefits. The maximum, federal limit is 60 months, and many
states have imposed shorter limits—as low as 21 months (CRS, 2013). Recipients also face strict
job search and work requirements (20-30 hours per week), a feature that was instituted as a

means to offset the risk for disincentivizing work. In many respects, TANF also allows for
greater flexibility on the part of states, both in terms of monthly benefit amounts and work
requirement exemptions. For instance, the maximum monthly benefit for a family of 3 in 2011
was $170 in Mississippi, and $704 in California (CRS, 2013). Additionally, while 6 states make
no allowances for parents caring for young children, 12 states (including New Jersey) provide 3
months of exemption from work requirements (CRS, 2013).
While TANF did expand childcare options for recipients, it failed to require states to
offer educational and training opportunities. In turn, many states adopted a “rapid attachment”
strategy, which entailed moving welfare recipients into low-wage jobs as quickly as possible,
without proper skills matching or job training. In the decade following the 1996 welfare reforms
TANF caseloads fell by at least 27% in every state, and by over 50% in 36 states, as policies
shifted dramatically toward work support (Trisi & Pavetti, 2012).
SSI.Created in 1974, Supplemental Security Income (SSI) provides means-tested income
for adults over the age of 65 and the permanently disabled. The federal government administers
this program, which is indexed to keep pace with inflation, and several states, including New
Jersey, provide supplemental SSI funding. Recipients of SSI are automatically eligible for
Medicaid.In the decades following its passage, the number of Americans receiving SSI was
limited; numerous applications were denied, despite serious income inadequacy.
As with Social Security, the SSI program is criticized for having structural work
disincentives; recipients experience a “cash cliff” (i.e. suddenly lose benefits) when they engage
in any so-called “substantial gainful activity (SGA)” (Guzman et al., 2013). Some states have
addressed this problem by developing “benefit offset” initiatives. However, researchers have
found that such policies have thus far had little effect on labor force participation (Weathers &

Hemmeter, 2011).There were 7,912,266 recipients of federally administered SSI payments in
2010, 1,183,853 of them aged; 2,385,933 of all recipients also received state supplementation.
On average, an individual receiving SSI in 2012 received $8,376 annually (CRS, 2012).
EITC.The Earned Income Tax Credit (EITC) is a refundable tax credit for low- and
medium-income families and individuals, enacted in 1975. It is one form of tax expenditure,
which is a cost in foregone revenue attributable to tax provisions that are incurred when the tax
system is used as a means to attain social outcomes or goals. Tax expenditures are generally used
to measure income, distribute fiscal benefits and burdens according to ability to pay, and
promote socially desirable ends. While they do not involve directly spending government money,
as do government programs, tax expenditures such as EITC do entail foregone revenue and are
therefore considered a form of government spending. Politically, Republicans tend to support tax
expenditures, while Democrats are more supportive of government programs.
Taxexpenditures have also shifted substantially in recent decades; they have arguably
become the government’s primary means of providing cash assistance to low-income families
(Eissa & Hoynes, 2011; Guzman et al., 2013). The EITC was a relatively small program
until1994, when credit levels were increased and eligibility was extended to the entire U.S.
population. In the wake of the financial crisis of 2007 and 2008, to strengthen the weakened
economy the U.S. government expanded EITC and instituted additional, temporary tax credits.
These included the “Making Work Pay” provision of the American Recovery and Reinvestment
Act of 2009, which provided a refundable tax credit of up to $400 for working individuals and up
to $800 for married taxpayers (IRS, 2014), and a tax exclusion for the first $2,400 of
unemployment benefits received (IRS, 2012). In 2011, 28 million working families with children
with annual incomes between $37,900 and $51,600 received EITC. The benefits received depend

on marital status, number of children, and household income; on average, EITC for a family with
children was $2,905 (CRS, 2012).
America’s anti-poverty programs are rooted in America’s strongest virtues: the desire for
fairness, compassion, and a sense of community. However, these values are tempered by strong
beliefs in work, autonomy and self-reliance, and the “primacy of the family” (Ellwood, 1988).
Because of this, among U.S. social assistance programs, EITC is perhaps most in line with
Americans’ preferences. It is not considered a handout, although it is technically a form of
government spending, and is aimed at helping working individuals and families support
themselves through autonomy and self-reliance.
SNAP. In 1965 the U.S. created the federal Food Stamps program to provide food to low-
income families. Replaced in 2008 by the Supplemental Nutrition Assistance Program (SNAP),
it is a means tested program but does not consider age or family structure. Thus, SNAP reaches a
broader target population than other social assistance programs (Ziliak, 2011). One out of every
seven Americans, and one out of every five American children, accesses this program, and all
who receive TANF or General Assistance (GA) are eligible. There is also a specialized variation
of the program, DSNAP, which is designed to provide food assistance in disaster relief situations.
Although SNAP is the largest food assistance program, others exist for particularly
vulnerable segments of the population. The supplemental feeding program for Women, Infants,
and Children (WIC) is premised on the idea that ensuring pregnant and breastfeeding mothers’
access to healthy foods is in the public interest. This program covers the cost of many essential
food products for mothers, including dairy, fresh produce, and infant formula. Through the
School Lunch program, free and reduced price breakfast and lunch meals are offered to low-
income children in a school-based setting. Eligibility for both of these programs is income-based.

The SNAP program is an example of an “in-kind” benefit, as it entails limited choice on
the part of recipients. The primary advantages of in-kind benefits are that recipients are
encouraged to use the benefits toward the needs of themselves and their families, and that misuse
of funds is discouraged. However, in-kind benefits such as SNAP also constrain choice,
potentially stigmatize the recipients, incur administrative costs, and in some cases, encourage
illegal behavior to circumvent the constraint (e.g., selling food stamps). During the 1990s
welfare reforms, SNAP was made to phase out paper coupons in favor of Electronic Benefit
Transfer (EBT) cards, and restrict eligibility. The 2002 Farm Bill expanded eligibility once again,
and the program was further liberalized in 2008. In 2013 the program participation was
47,636,000, and recipients received $133.07 per month on average (FNS, 2014).
Medicaid. Medicaid is the largest social assistance program in the U.S. Its coverage
extends to individuals with certain disabilities, and to low-income adults and their children.
Anyone who receives SSI is automatically eligible to enroll in Medicaid. Jointly funded by the
federal and state governments, Medicaid covers almost all health care costs and dental service
costs incurred by recipients. While the majority of recipients are single mothers and their
children, the elderly incur the majority of expenditures. Under the Patient Protection and
Affordable Care Act (PPACA), enacted in 2010, states have the option to increase eligibility to
Medicaid.
There are a number of other programs that subsidize health-related costs for low-income
Americans. Pharmaceutical Assistance to the Aged and Disabled (PAAD) is a means-tested
program that permits recipients to fill any prescription and pay no more than $5 in co-payment.
Through Ryan White programs, which are administered by the Department of Health, the federal
government subsidizes the costs of pediatric HIV/AIDS medications. Federally Qualified Health

Care Centers (FQHC) are federally funded, community-based medical centers in low-income
regions with poor access to services. Finally, the State Children’s Health Insurance Program
(SCHIP), also referred to as CHIP, provides matching funds to states for the purpose of insuring
low-income children whose families do not qualify for Medicaid.In 2013 the Medicaid served
71.7 million beneficiaries, and the CHIP program served 8.4 million—a total of 80.1 million
enrollees.
Other In-Kind Programs.Housing assistance in the U.S. takes a number of different
forms. These include public housing; Emergency Assistance (EA), which may consist of a hotel,
motel, or transitional housing facility; Temporary Rental Assistance (TRA), for those who owe
back rent or mortgage payments; and Section 8 Rental Assistance vouchers, which subsidize
rental costs for privately owned housing. These housing assistance programs are implemented by
more than 2,400 local housing authorities, which set guidelines on eligibility and oversee public
housing maintenance (Ziliak, 2011). As of 2011, there were over 14,000 public housing units
serving 2.3 million Americans, most of them elderly or disabled (Ziliak, 2011). Insufficient
funding and maintenance has led to widespread demolition of public housing in recent years, and
in such situations Section 8 vouchers are often used to partially subsidize rental fees for
displaced residents. In 1992 the HOPE VI program was launched to replace poor-quality public
housing units with mixed-income developments, but funding has been cut substantially in recent
years.
Childcare is an increasingly important economic instrument, as more and more U.S.
families rely on two incomes. Head Start, an evidence-based, means tested program, is centered
on providing nutritional support and health screenings, fostering parental involvement, and
developing school readiness among low-income preschool children. It is financed federally to

local, community-based organizations. The Child Care and Development Block Grant (CCDBG),
which was passed along with TANF, heavily subsidizes childcare for low-income families.
Every county in the U.S. features a “lead” childcare agency, where eligible community members
may obtain vouchers redeemable at participating, licensed, and approved childcare centers—
whether center-based or home-based.
The War on Poverty also established several educational and college-preparation
programs, aimed at reducing poverty through expanding opportunities for young Americans
(Haskins & Rouse, 2013). The EOA (1965) and the Higher Education Act (1968) authorized the
Upward Bound (UB), Student Support Services (SSS), Educational Opportunity Grants, and
Educational Talent Search (ETS) programs, and in the late 1990s several programs were added,
including the McNair Scholars program (1986), Upward Bound Math-Science (1990) and GEAR
UP (1998). These programs differ modestly, but all center on helping low-income students
graduate from high school and college. They provide participating colleges and nonprofits
funding, and offer students educational preparation and summer school. In addition, ETS aims to
inform low-income students about educational opportunities and available aid.
Social Insurance Programs
Social insurance programs and policies also expect certain requirements of beneficiaries,
but are universal and not means tested. These programs are intended to protect people from
normal vacillations in the labor market, and to assist the elderly and disabled who are not able to
fully participate in the labor market. In certain cases, social insurance programs can be costly,
large-scale, and potentially unsustainable (CRS, 2012). They are typically funded via payroll tax,
and pay out cash benefits to qualifying participants.

OASDI. The Social Security Act in 1935 was the major piece of legislation resulting
from the New Deal, and was an important landmark for U.S. social welfare policy. This act
placed responsibility for social welfare on the federal government, and reflected a shift from
public concern for property rights, to concern for the rights of people (Trattner, 1999; Stern &
Axinn, 2012). In its final version, the SSA was considerably more conservative than had been
envisioned by the Committee on Economic Security; it did not include provisions for health or
disability insurance, and entailed only fiscal administration of unemployment insurance and
relief programs. However, by introducing old age insurance, unemployment compensation, and
relief for vulnerable populations (e.g. widows and children), the SSA drew attention to the
limitations of an unfettered market, and the need for government intervention. Subsequent
amendments extended coverage and benefits to survivors and family dependents (1939) and to
the disabled (1954), added Medicare health care benefits (1965), and mandated cost-of-living
adjustments (1977).
Older Age Survivors and Disability Insurance (OASDI) includes retirement benefits and
Social Security Disability Insurance (DI). Qualified retirees may begin receiving reduced cash
benefits at age 62, or full benefits at 65. Like other insurance programs, dependent children and
spouses are also eligible to receive benefits. The DI program provides cash assistance to
qualified workers who have experienced mental or physical disabilities that impact their ability
to engage in “significant gainful activity” (SGA). Recipients of DI must have significant history
of earnings, and are made eligible for Medicare (Ben-Shalom et al., 2011). Both of these
programs are federally financed and are moderately progressive and redistributive; while benefits
are positively related to contributions, replacement rates are higher for low-income workers
(Ben-Shalom, 2011).

In 2013 over 59 million Americans received Social Security benefits. The average
monthly benefits for retired workers was $1,294; for disabled workers, $1,146; and for survivors,
$1,244(Social Security Administration, n.d.).There were a number of changes made to Social
Security eligibility requirements and benefit amounts in 2014. The cost-of-living adjustment
(COLA) was increased in response to a rise in the Consumer Price Index (CPI-W), and while tax
rates remained the same, maximum taxable earnings were increased from $113,700 to
$117,000(U.S. House of Representatives, 2013;Social Security Administration, n.d.).
Medicare. Medicare, a federal entitlement program, was developed in 1965 to provide
medical benefits to adults aged 65 or older, and to SSDI recipients under 65. Benefits are
distributed by the Center for Medicare Services (CMS), and cover hospital expenses, prescription
drugs, and physician charges. The federal government is solely responsible for financing this
program, and therefore Congress determines all eligibility and benefit formulas (Ben-Shalom et
al., 2011). Coverage is limited, and many recipients choose to supplement their Medicare
benefits with privately sold “Medigap” policies. In 2012 Medicare covered approximately 50
million individuals, and total spending was $555.9 billion.
Employment. Unemployment Insurance (UI) is a state-level program that provides cash
payments to those who have been involuntarily laid off, and who have adequate employment
histories. These benefits are often capped after a state-determined period of time, typically six
months, but the federal government provides extended payments during economic downturns
(Ben-Shalom et al., 2011). They range widely by state; for instance, in 2012 the weekly
maximums in Mississippi and Massachusetts were $235 and $653, respectively. Unemployment
Insurance Benefits (UIB) are also available to those who have worked a certain number of
quarters, with coverage, and have been discharged at no fault of their own. Workers’

Compensation, a state program, provides cash and medical benefits to those who experience
temporary or permanent work-related injuries, and to dependents of workers whose deaths were
job-related. This program allows workers to file claims with their employers, and if substantiated,
receive medical care fees and lost wages through their employers’ insurance.Temporary
Disability Insurance (TDI), also referred to as cash sickness benefits, is a state-level program that
was first enacted in Rhode Island in 1942. In most states TDI covers commercial and industrial
wage and salary workers who are privately employed, and several states include government
employees and agricultural workers (SSA, n.d.). Typically, claimants must have specified
amounts of past earnings and be unable to perform regular work due to a physical or mental
disability (SSA, n.d.).Finally, the Family Medical Leave Act (FMLA) provides guaranteed
insurance, and in some cases monetary benefits, to those who cannot work while on medical
leave. This law provides job protection and income security for the general population.
Measuring Poverty
Official U.S. Measure
The U.S. uses an absolute standard to measure poverty, based on thresholds developed in
1959 by Mollie Orshansky of the Social Security Administration, and implemented in 1965. In
1969, the U.S. Bureau of the Budget designated a revised version of these poverty thresholds as
the federal government’s official statistical definition of poverty (Fisher, 1992). This standard is
based on the concept of a family being able to afford minimally nutritious food. In the late 1950s,
the federal government used the nationally representative Consumer Expenditure Survey to
analyze the distribution of Americans’ expenditures. As families spent about one third of their
income on food at that time, the measure estimated a minimum food budget, and multiplied this
by three (Cofer, Grossman & Clark, 1962; Orshansky, 1965).

Today this measure is still in use, having been updated annually for inflation according to
the Consumer Price Index, as well as for family size, family composition, and age. Income,
dividends and accrued interest, child support, and cash assistance are included in the measure,
while non-cash benefits (such as food stamps and tax benefits) are excluded. According to the
U.S. Census Bureau, the poverty threshold in 2012 was $11,722 for a single person household,
$14,960 for a two-person household, $18,287 for 3 people, $23,497 for 4, $27,815 for 5, 31,485
for 6, $35,811 for 7, $39,872 for 8, and $47,536 for 9 or more (U.S. Census Bureau, 2012).
In addition to the poverty line, it is important to consider several other categories of
poverty in the U.S. Currently, 5% of the U.S. population lives in “chronic poverty,” meaning
they consistently live at or below the poverty line for at least a two-year period. Transitory
poverty entails being poor at any time during a two-year period; this rate is currently 28%
(Duclos, Araar, & Giles, 2006). These distinctions have been used by governments and social
commentators throughout history to analyze policy needs and effectiveness (Duclos, Araar, &
Giles, 2006). It is important to consider these categories of poverty, as the rates of each may
respond differently to policies (Chronic Poverty Research Centre, 2004).
Criticisms
The current measure was created at a period of time when food typically represented one
third of a family’s budget. However, this is infrequently the case today, given the higher relative
expense of health care, childcare, and housing costs. While the measure is adjusted for inflation,
it does not account for rapidly increasing standards, and costs, of living (Guzman et al., 2013). In
2011 the poverty threshold for a family of four was 37% of the median, whereas in 1963 it had
represented 50% (U.S. Census Bureau, 2012). An individual who works full time at the

minimum wage, currently $7.25 per hour, will earn only $14,500 annually—nearly $4,000 less
than the poverty threshold for a single parent with two children ($18,123).
Additionally, the poverty measure is critiqued because it cannot assess the impacts of
anti-poverty programs, as it does not account for non-cash benefits. In-kind transfers such as
Medicaid, public housing, and SNAP, are ultimately not counted (Guzman et al., 2013). The
measure is also not adjusted for geographical differences. States use the Federal Poverty
Threshold (FPT) for distribution of benefits, but there are stark differences among states’ living
and out-of-pocket expenses (Hutto et al., 2011).
Household economies of scale create further complication in measuring living standards
and poverty. When no economies of scale are assumed, children—who often live in relatively
large families—are higher risk of poverty than the elderly, and when strong economies of scale
are used, the opposite is true (World Bank, 2000). Household economies of scale are not easily
defined, as demand for goods and services generally stem from both size and composition of a
household (Logan, 2008). In addition, income and substitution effects work differently according
to the consumed goodsand services in question (Logan, 2008).In fact, trends have revealed that
food expenditures in this country have been particularly inconsistent in relation to household
scale economies (Logan, 2008). Economies of scale also vary according to the economic climate,
and over time. For instance, relative price changes have been shown to have strong effects on
economies of scale during large or sudden relative price shifts in transition economies (Lanjouw
et al., 2009).
Finally, the current measure is based on income—but income reporting, from the U.S.
Census and surveys, does not account for the homeless, institutionalized, incarcerated, or
undocumented. These populations are particularly vulnerable and at-risk for being poor, yet are
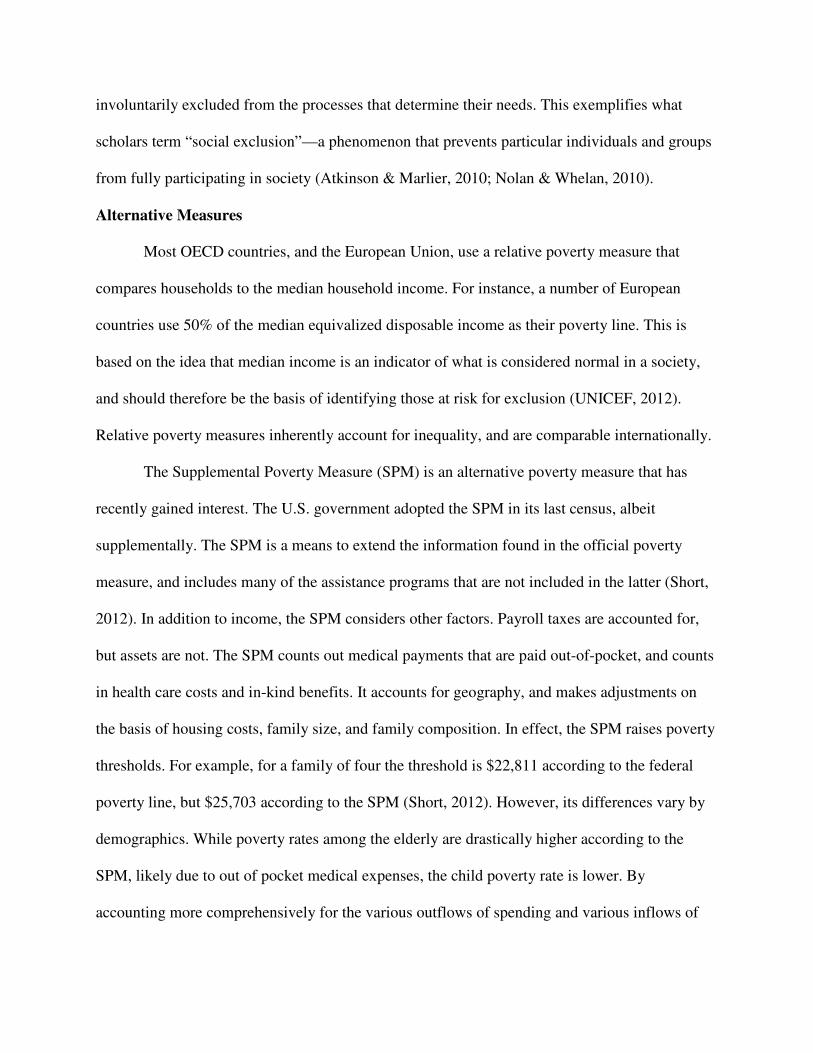
involuntarily excluded from the processes that determine their needs. This exemplifies what
scholars term “social exclusion”—a phenomenon that prevents particular individuals and groups
from fully participating in society (Atkinson & Marlier, 2010; Nolan & Whelan, 2010).
Alternative Measures
Most OECD countries, and the European Union, use a relative poverty measure that
compares households to the median household income. For instance, a number of European
countries use 50% of the median equivalized disposable income as their poverty line. This is
based on the idea that median income is an indicator of what is considered normal in a society,
and should therefore be the basis of identifying those at risk for exclusion (UNICEF, 2012).
Relative poverty measures inherently account for inequality, and are comparable internationally.
The Supplemental Poverty Measure (SPM) is an alternative poverty measure that has
recently gained interest. The U.S. government adopted the SPM in its last census, albeit
supplementally. The SPM is a means to extend the information found in the official poverty
measure, and includes many of the assistance programs that are not included in the latter (Short,
2012). In addition to income, the SPM considers other factors. Payroll taxes are accounted for,
but assets are not. The SPM counts out medical payments that are paid out-of-pocket, and counts
in health care costs and in-kind benefits. It accounts for geography, and makes adjustments on
the basis of housing costs, family size, and family composition. In effect, the SPM raises poverty
thresholds. For example, for a family of four the threshold is $22,811 according to the federal
poverty line, but $25,703 according to the SPM (Short, 2012). However, its differences vary by
demographics. While poverty rates among the elderly are drastically higher according to the
SPM, likely due to out of pocket medical expenses, the child poverty rate is lower. By
accounting more comprehensively for the various outflows of spending and various inflows of

money, the SPM addresses some of the aforementioned critiques of the official measure
(Guzman et al., 2012; Short, 2012).
Effectiveness of Anti-Poverty Programs
Trends in Poverty Rates
Between 1959 and 2012 the poverty rate has gradually declined, from 22.5% to 15.0%,
while the number of Americans living in poverty has increased from approximately 40 to 46.5
million, see Figure 1 (DeNavas-Walt, Proctor, & Smith, 2013). The poverty rates differ widely
by demographics. While elderly poverty rates have declined substantially, from approximately
35% in 1959 to 9.1% in 2012, the poverty rates of adults (17.0% to 13.7%) and children (27.0%
to 21.8%) have fallen only slightly, see Figure 2 (DeNavas-Walt, Proctor, & Smith, 2013).
Poverty is lowest among non-Hispanic whites (9.7%) and Asians (11.7%), and highest among
blacks (27.2%) and Hispanics (25.6%). Family structure and composition also play important
roles. Poverty rates among families headed by single women are highest (30.9%), followed by
single households headed by men (16.4%); married-couple households have relatively low
poverty rates, at 6.3%. America’s poverty rates are sharply higher than those of many other
economically developed OECD countries (Gould & Wething, 2012).
Expenditures of Anti-Poverty Programs
Social insurance programs have experienced significant growth, particularly OASI and
Medicare (Ziliak, 2011), see Table 1. Expenditures on OASI, Medicare, Unemployment
Insurance and Disability Insurance were each more than 100 billion dollars in 2009, and with
Workers’ Compensation, totaled 1,389 billion. In comparison, spending on social assistance
programs totaled only 587 billion in the same year—less than half that spent on social insurance
programs. Spending on means-tested programs has fluctuated over the last 40 years. While

AFDC (TANF) spending has increased very slightly since its peak in the mid-1970s, with long
periods of 0% growth, Food Stamps (SNAP), housing aid, SSI, and EITC expenditures have
grown more substantially (Ben-Shalom et al., 2011).
These antipoverty program expenditure trends have resulted in a “double redistribution”
of wealth in the U.S. The first has been from the very poor, to the less poor and near poor, likely
owed to increased expenditures on SNAP and EITC. The second has been from the nonelderly
and nondisabled to the elderly and disabled, as a product of greatly increased expenditures on
OASDI, Medicare, and Medicaid (Ben-Shalom, Moffitt, & Scholz, 2011). Overall, antipoverty
program spending has reflected an increasing focus on elderly and families and individuals, as
well as those with disabilities. While program expenditures for single-parent families decreased
by 20% between 1984 and 2004, spending on the elderly and disabled over the same period
increased by 12% and 16%, respectively, see Table 2 (Ben-Shalom, Moffitt, & Scholz, 2011).
The U.S. system has also favored workers over workers, given the significant expansion of EITC
alongside declining TANF spending.
Effects of Anti-Poverty Programs on Poverty
Ben-Shalom, Moffitt, and Scholz (2011) calculated the effects of anti-poverty programs
on poverty; see Table 3. According to their study theofficial poverty rate in 2004 would have
been 29% without government intervention, and would have decreased to 13.5% after accounting
for all anti-poverty programs. The overall reduction in poverty by these programs was about 53%
in 2004. The rates were 56.7% and 52.3% in 1993 and 1984, respectively. There is evidence that
anti-poverty programs have had strong effects on reducing deep poverty, but that the rate of deep
poverty has increased over time. For example, anti-poverty programs reduced deep poverty by
69% [(21.3-6.6)/21.3] in 2004, while the rate of deep poverty in that year increased to 6.6%,

from 4.5% in 1984. In measuring150 percent of thepoverty line, the reduction effects of anti-
poverty programs appear stronger over time, from 26.9% in 1984 to 36.1% in 2004.
Social assistance programs currently have limited effects on poverty in the United States.
Once accounted for, Medicaid and SSI reduced the overall poverty rate from 29.0% to 25.2%
and 28.6%, respectively, and reduced the deep poverty rate from 21.3% to 14.7% and 19.5%. On
the other hand, TANF, EITC, and SNAP had very effects, reducing the poverty rate to 28.9%,
28.1% and 28.6%. Housing assistance did reduce the deep poverty rate to 19.7%, and EITC
reduced the percentage of Americans living at or below 150% of the poverty line from 39.6% to
38.6%, but overall there was very limited impact.
Although social assistance programs do not necessarilyhave significant effects on poverty
rates, they have hadother important impacts on poverty in the U.S. The food and nutrition
programs created and expanded during the War on Poverty have been successful, in that they
have successfully combated food insecurity and hunger, and improved related outcomes for low-
income families (Hoynes & Schanzenbach, 2011;Waldfogel, 2013). Using the SPM to account
for in-kind benefits, researchers have shown that child poverty in 2010 would have been three
percentage points higher if SNAP benefits were not counted as income, and one additional
percentage point higher if free and reduced price school lunches were not counted (Wimer et al.,
2013).
The EITC has played an important role in poverty reduction since its inception in 1975,
and currently is the largest income support program for low-income families with children
(Waldfogel, 2013). Using the SPM, researchers estimate that the child poverty rate would have
been four percentage points higher if the EITC were not counted as income (Wimer et al., 2013).
Other research has explored whether, and how, EITC and other tax credits have altered recipients’

behavior and circumstances (Athreya, Reilly & Simpson, 2010; Guzman et al., 2013; Lim,
Livermore & Davis, 2010). For instance, because of regional cost-of-living variations, EITC
recipients in high-cost areas receive lower benefits and are more prone to lose eligibility
(Fitzpatrick & Thompson, 2010). Overall, EITC has been shown to improve the employment and
earnings of working-age women, reduce the number of female-headed households receiving cash
welfare, and improve children’s health and educational outcomes (Dahl & Lochner, 2012; Marr,
Charite & Huang, 2013; Meyer & Rosenbaum, 2014). Using the SPM, researchers found that the
EITC lifted 9.4 million people (including 4.9 million children) out of poverty in 2011 (Marr,
Charite, & Huang, 2013).
While researchers provide different estimates for the percent of poor households moved
out of poverty by TANF, a program that provides much more modest benefits, it has certainly
reduced the depth of poverty over time (Waldfogel, 2013). However, the decline in TANF
caseloads since policies shifted toward work support in the mid-1990s has arguably undermined
the program’s supportiveness and effectiveness (Bane, 2009). While many former recipients are
earning more than the welfare benefits they previously received, they continue to live in poverty
and have not developed the skills or education necessary to improve their circumstances (Bane,
2009).
With respect to social insurance programs, the programs have a relatively stronger effect
on reducing poverty rates than have social assistance programs. Medicare and OASI have
decreasedthe poverty rate from 29.0% to 19.9% and 21.0%, respectively, and deep poverty from
21.3% to 12% and 13.8%, respectively. Although the DI, UI, and Worker’s Compensation
programshave only slightly decreased the overall poverty rate, they have had modest impacts on
reducing the deep poverty rate.

Social Security has been the most important tool in alleviating poverty among the elderly
(McGarry, 2013). After the 1964 amendments to the SSA significantly increased benefits,
elderly poverty rates declined more sharply than that of other age groups, and have continued to
fall. The program has meaningfully contributed to the circumstances of America’s elder poor; in
2008 Social Security comprised 84% of income for those in the lowest income quartile, and only
20% of income for those in the top quartile (McGarry, 2013).
Medicare has also been successful in alleviating poverty among the elderly and disabled.
Within a decade of Medicare’s establishment, low-income elderly were as likely as high-income
elderly to visit a physician (Davis & Schoen, 1978). Medicare also hastened the racial
desegregation of hospitals, which expanded access to quality healthcare among low-income,
nonwhite elderly (Swartz, 2013). Today, however, rising health care costs and gains in life
expectancy are placing the effectiveness and sustainability of Medicare at risk. Medicare Part B
premiums and long-term care services may become unaffordable for low-income elderly, if the
program’s inefficiencies and unsustainable financing mechanisms are not addressed (Swartz,
2013).
Appalachia
The War on Poverty entailed a unique, decades-long campaign in Appalachia, where
poverty rates in 1960 were 10 percentage points higher, on average, than in the rest of the
country. To date, the Appalachian Regional Commission is the second longest running, and
geographically largest, place-based regional development program in the U.S. (Ziliak, 2010).
Some reformers at the time viewed measures to address rural poverty as “gestures,” secondary to
urban antipoverty measures. While the Johnson White House was notably sensitive to the plight
of the rural poor, the massive population shift from rural areas to urban centers gave rise to a

public perception that rural economies were disappearing and therefore not worth investing in
(Gillette, 2010; Ziliak, 2010).
The systemic problems that existed in the 1960s continue to cripple many Appalachian
communities: excess natural resource extraction by absent landowners has poured money out of
the region, and severely degraded the environment (APA, 2014; Burns, 2007; Shapiro, 2010).
The growing prevalence of mountaintop coal mining has also led to significantly worsened
health outcomes, higher mortality rates, and higher poverty rates in Appalachian counties reliant
on this form of mining (Hendryx, 2011). Fifty years after the War on Poverty, employment has
stagnated in the ARC region, and many counties suffer high rates of family dissolution,
imprisonment, and prescription drug abuse (Gabriel, 2014).
There have been some modest gains, however. Research shows that poverty rates in
central Appalachia dropped substantially between 1960 and 2000, from 59.4% to 23%, and that
income growth improved on average (Ziliak, 2010). According to James Sundquist, a political
scientist who was involved in formulating War on Poverty legislation, the most effective
programs for the Appalachian region were those funded by the EOA: loans and grants to poor
farmers and small business owners in the ARC region (Gillette, 2010).
Discussion
Overall, it seems that the U.S. war on poverty policies and programs have had quite
varied impacts on poverty levels. While social insurance programs have had significant impacts
on reducing poverty among the elderly and disabled populations, social assistance programs have
had negligible effects on poverty levels. However, in considering the effects of the war on
poverty it is important to consider the historical, social, economic, and cultural factors that have
shaped the implementation of antipoverty policies and programs in the U.S. The historical

context of the war on poverty initially shaped antipoverty programs and policies, and since that
time, issues such as race, gender, economic development, and party politics have further
contributed to the direction in which they have moved. While this study does not directly analyze
the effects of context, the following section will briefly explore some of these external issues that
have impacted the effectiveness of antipoverty programs and policies over the last 50 years.
While the war on poverty is often criticized for its limited scope and impact, many
historians laud its lasting legacies. It generated direct government involvement in education,
health, labor, and community development, and enacted antipoverty legislation that influenced
subsequent programs and policies (Bailey & Danziger, 2013). It also importantly influenced the
grassroots style of politics that later emerged in the early 1970s, when advocates worked to
challenge the status quo through community action and representational politics (Rosales, 2000).
In this vein, theCommunity Action Program (CAP) was one of the most controversial
initiatives of the war on poverty (Gillette, 2010). Toward building self-sufficiency among low-
income communities, CAP established and funded Community Action Councils that called for
the “maximum feasible participation” of the poor. The program gave rise to a new form of
accountability—to participants. This led to vital and dramatic changes in the U.S. social welfare
system (Bailey & Danziger, 2013). Along with CAP, a number of “national emphasis programs”
were developed to empower low-income individuals, families and communities. These included
legal aid programs; job training programs; educational programs such as Head Start, Follow
Through, and Upward Bound; and community-based programs to fund and coordinate
comprehensive community health and family planning centers.
From the outset of War on Poverty programs’ and policies’ implementation, strong waves
of political opposition and backlash undermined their effectiveness. The regulatory and political

context of the 1960s was relatively inhospitable for an antipoverty movement rooted in
community-based initiatives and the “maximum feasible participation” of the poor (Melish,
2014). City mayors were politically threatened by their lack of control over federally funded
programs, and the public was shaken by the perceived aggressiveness of newly empowered poor
communities. In their quantitative analysis of the geographic distribution of spending through the
EOA (a program designed to expand participatory engagement and equalize opportunity), Bailey
& Duquett (2014) found that political variables had played a very minor role in EOA funding;
the authors believed that this small role of politics partly explains the particularly strong backlash
against Johnson’s antipoverty programs, as political factions and lobby groups were not
sufficiently appeased.
Conceptual Framework
Johnson’s war on poverty was rooted in certain social and cultural assumptions that have
inherently affected the long-term relevance and effectiveness of the policies and programs it
produced (Raz, 2013). Many of the programs and policies aimed at alleviating poverty among
minority and working class families, particularly those that were education-based, such as Head
Start, were informed by cultural deprivation theory. This theory was based on maternal and
sensory deprivation experiments, but ultimately lacked empirical validation (Raz, 2013). Rather
than considering alternative forms of support that were more salient to rural, working class, and
minority communities (e.g. extended kinship networks), many war on poverty policies and
programs aimed to overcompensate for the perceived inadequacies and deficiencies of poor
families, based largely on prevailing stereotypes (Fagan, 1995; Huffman, 2010; Raz, 2013).
American Values
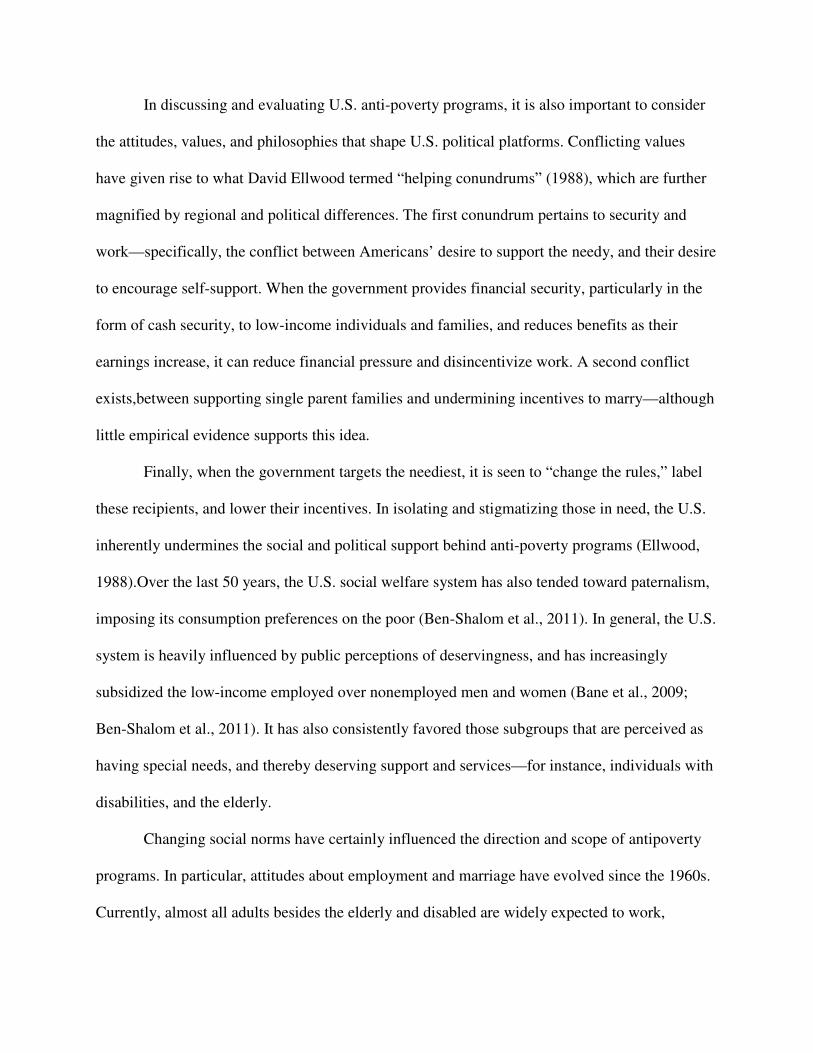
In discussing and evaluating U.S. anti-poverty programs, it is also important to consider
the attitudes, values, and philosophies that shape U.S. political platforms. Conflicting values
have given rise to what David Ellwood termed “helping conundrums” (1988), which are further
magnified by regional and political differences. The first conundrum pertains to security and
work—specifically, the conflict between Americans’ desire to support the needy, and their desire
to encourage self-support. When the government provides financial security, particularly in the
form of cash security, to low-income individuals and families, and reduces benefits as their
earnings increase, it can reduce financial pressure and disincentivize work. A second conflict
exists,between supporting single parent families and undermining incentives to marry—although
little empirical evidence supports this idea.
Finally, when the government targets the neediest, it is seen to “change the rules,” label
these recipients, and lower their incentives. In isolating and stigmatizing those in need, the U.S.
inherently undermines the social and political support behind anti-poverty programs (Ellwood,
1988).Over the last 50 years, the U.S. social welfare system has also tended toward paternalism,
imposing its consumption preferences on the poor (Ben-Shalom et al., 2011). In general, the U.S.
system is heavily influenced by public perceptions of deservingness, and has increasingly
subsidized the low-income employed over nonemployed men and women (Bane et al., 2009;
Ben-Shalom et al., 2011). It has also consistently favored those subgroups that are perceived as
having special needs, and thereby deserving support and services—for instance, individuals with
disabilities, and the elderly.
Changing social norms have certainly influenced the direction and scope of antipoverty
programs. In particular, attitudes about employment and marriage have evolved since the 1960s.
Currently, almost all adults besides the elderly and disabled are widely expected to work,

including parents of young children—however, despite an expanding job market, the
employment rates and inflation-adjusted wages of uneducated workers have stagnated since 1973
(Cancian & Danziger, 2009). Family structure has also experienced stark changes, as rates of
divorce and out-of-wedlock birth have increased dramatically (Cancian & Danziger, 2009).
Party politics also plays an important role in shaping public discussions about poverty.
Conservatives typically value programs that are transferred through tax credits, and programs
that incentivize educational attainment and labor market participation. Liberals tend to support
social assistance programs, and feel government should play a more key role in providing equal
opportunities and safety nets for those unable to fairly participate in the labor market. Overall,
Americans harbor strong beliefs in work, autonomy and self-reliance, and the “primacy of the
family.” This contributes to Americans’ distrusting redistributive policies and government
intervention, and blaming poverty on the poor, at higher rates than many other nationalities
(Karabel & Laurison, 2012).
Despite these challenges, America’s anti-poverty programs are ultimately rooted in
America’s strongest virtues: the desire for fairness, compassion, and a sense of community
(Ellwood, 1988). While American values are often thrown into conflict, they also provide a
strong philosophical basis for reforming poverty policies to support individuals, strengthen
families, and provide dignity and security to the poor (Cancian & Danziger, 2009)
Scale and Efficiency
One of the inherent problems with “anti-poverty” programs is the aforementioned
difficulty, and controversy, involved in defining and measuring poverty. As Guzman et al. (2013)
point out, understanding and identifying the populations most in need of assistance through
social policy is a core challenge. Another difficulty is that of determining and assessing the

mechanisms through which welfare programs affect outcomes—for instance, do School
Breakfast and Lunch programs incentivize school attendance among low-income children, or do
its arguable health effects lead students to achieve more academically? This is a complicated task,
as a wide range of factors must come into consideration alongside program logistics. These
include family makeup, educational opportunities, school environments, and community
characteristics (Bartfield & Kim, 2010).
In financial terms, there are key drawbacks specific to large social insurance programs. If
these programs are not implemented sustainably, their sheer scale means that potential
insolvency might bear important consequences for the U.S. economy (Aaron, 2011; Kotlikoff,
2011). Although economists and researchers disagree on the scale of the problem, it is generally
recognized that reforms will be necessary to correct potential financial shortfalls (Aaron, 2011;
Goda et al., 2011; Guzman et al., 2013; Kotlikoff, 2011). Additionally, there is some resistance,
philosophically, to insurance programs such as social security shifting resources from single to
married adults, from those with lower to higher life expectancies, and from future generations to
current and past ones (Guzman et al., 2013; Kotlikoff, 2011).
Work Incentives & Disincentives
As previously discussed, embedded in many U.S. anti-poverty programs are so-called
“cash cliffs” that families encounter as their earnings increase, and benefits decrease. These cash
cliffs arguably hurt the overall effectiveness of social assistance programs in this country
(Guzman et al., 2013; Romich et al., 2007). Childcare costs and health care costs are of special
concern to low-income parents, who worry about becoming ineligible for subsidized daycare and
health insurance (Romich et al., 2007).

Another long-debated issue in the formulation and implementation of anti-poverty
programs is the concept of work incentives. Particularly among conservatives, criticism is often
framed as the concept that participation in welfare programs shapes recipients’ attitudes and
behaviors, and that such programs disincentivize labor force participation. As pointed out by
Hoynes and Schanzenbach (2011), testing this idea as it pertains to welfare programs like TANF
and SNAP is very difficult because of their uniformity among states. Researchers, therefore,
cannot analyze significant policy variations and their disparate outcomes. Social insurance
programs have also fielded similar criticisms. Social Security, for example, begins to impose an
“implicit tax” on workafter fourteen years of employment. At this point, the value of Social
Security taxes begins to exceed the discounted value of future benefits(Guzman et al., 2009). The
SSDI program likewise involves a series of cash cliffs. In response, certain states have attempted
to employ new policies to offset benefits, but these policies—while encouraging recipients to
earn slightly more—have not had significant effects on labor force participation (Weathers &
Hemmeter, 2011).
Role of Discrimination
Discrimination continues to bar access to education, employment, and other opportunities
that can empower individuals and lift them out of poverty. Subsequently, discrimination serves
to widen inequalities and reduce social mobility among the populations it affects. In this vein,
discrimination drives a wedge between social equality and income equality, and perhaps more
importantly, prevents the attainment of income equality from the start. This occurs because
geographic isolation, often within portions of urban areas, forces certain groups into harsh
circumstances, while keeping them removed from the majority, power-wielding population.
These circumstances, which propel a cycle of injustice, include endemic poverty, inadequate

resources, and high crime rates. Researchers have found evidence demonstrating the existence of
discrimination in access to employment (albeit less discrimination in wage allocation), pervasive
discrimination in rental and housing markets, and widespread discrimination pertaining to credit
markets and consumer transactions (Pager & Shepherd, 2008). Women are also importantly
affected by discrimination. Policies and programs often reinforce gendered cultural norms, such
as occupational goals and behavioral expectations, which in turn affect the way that women
conceive of their own roles, abilities, and limitations (Tolleson-Rinehart & Josephson, 2005).
Inequality & Economic Mobility
In discussing the effectiveness of anti-poverty programs, it is important to also look at
two related indicators: inequality and economic mobility. The programs and policies described in
this article have not yet suitably addressed America’s severe levels of poverty, vast inequalities
in wealth distribution, and limited economic mobility. While the American people are typically
attuned to the ways that unfettered trade policies aggravate and sustain economic problems, they
often disregard (or at least fail to suitably address) other factors that help to sustain cycles of
poverty (Kreuger, 2003). The level of a nation’s economic well-being certainly depends on
variables such as policy, culture, social institutions, and the talents and virtues of its people.
However, equality and mobility are likewise important, and often discounted, predictors of
economic success. Noted economists Torsten Persson and Guido Tabellini have shown that
nations with higher rates of earnings inequality often have lower economic growth rates (Persson
& Tabellini, 1995). While poverty inhibits a wide class of people from being productive and
entrepreneurial, seemingly guaranteed wealth encourages unproductive, speculative spending.
American attitudes toward poverty and anti-poverty programs are certainly shaped, in
part, by the belief in U.S. economic mobility. Yet, in the United States economic mobility varies

according to socioeconomic stratus. In particular, being raised in deep poverty places poor
children at a tremendous disadvantage in future endeavors. In addition, the “unusually large
premiums that American employers pay for college degrees” certainly magnifies the importance
of family background and parents’ educational trajectories (DeParle, 2012). Compared to other
developed countries, America’s rates of socioeconomic mobility are relatively low. A multi-
country study, the Cross-National Research on Intergenerational Transmission of Advantage
(CRITA), assessed levels of economic mobility in ten countries (Smeeding et al., 2009). Its
findings showed that differences in mobility are often established at a very early age, and that the
U.S. consistently demonstrated the strongest relationship between family background and child
outcomes. Given the wide range it found among developed countries, this study posits that
policies and institutions bear important consequences for the magnitude of these early gaps, and
later, lower levels of socioeconomic mobility.
Conclusion
Overall, the American social welfare system tends to favor in-kind over cash benefits. In turn,
it has expanded the scope and reach of its provision of medical care, food, and tax benefits.
These preferences reflect the U.S. system’s tendency toward paternalism—it imposes its
consumption preferences on the poor and is heavily influenced by perceptions of deservingness.
The Americansocial welfare system, often categorized as a “liberal” welfare regime, is not based
on a universal idea. Instead, aspreviously discussed, it is shaped by complex political and social
views that shift over time. Ultimately dominated by the logic of the market, however, U.S.
welfare and benefits are often modest and potentially stigmatizing. While research has shown
that social-democratic welfare regimes have the greatest impact on poverty reduction, liberal

regimes are less effective than conservative and corporatist systems, which are largely status-
based and have modest redistributive effects.
In determining whether the War on Poverty was a failure or success, it is important to
consider its effects on a number of different groups. Antipoverty programs and policies have
been successful in alleviating poverty among the elderly and disabled, but have failed to alleviate
poverty among single mothers and their children. Over one fifth of American children live in
single mother families, whose poverty rate is 80% before transfers, and 67% after transfers are
accounted for. In light of these dismalstatistics it is perhaps warranted to claim that the U.S.
social welfare system, while protecting many vulnerable individuals and families, is failing to
sufficiently support the new generation of Americans.
References
Aaron, H.J. (2011). Social security reconsidered, National Tax Journal 64(2), 385-414.
Burris, T.L. (2014, January). Appalachian cultural consequences from the war on poverty.
Retrieved from apa.org.
Athreya, K.B., Reilly, D., & Simpson, N.B. (2010). Earned income tax credit recipients: Income,
marginal tax rates, wealth, and credit constraints, Economic Quarterly 96(3), 229-258.
Atkinson, A.B. &Marlier, E. (Eds.) (2010). Income and Living Conditions in Europe.
Luxembourg: Publications Office of the European Union.
Bailey, M.J. &Duquette, N.J. (2014). How Johnson fought the war on poverty: The economics
and politics of funding at the Office of Economic Opportunity, The Journal of Economic
History74, 351-388.

Bane, M.J. (2009).Poverty, policy and politics.In M. Cancian& S. Danziger (Eds.), Changing
Poverty, Changing Policies. New York: Russell Sage.
Bartfield, J. & Kim, M. (2010). Participation in the school breakfast program: New evidence
from the ECLS-K, Social Service Review 84(4), 541-562.
Ben-Shalom, Y., Moffitt, R. &Scholz, J.K. (2011). An assessment of the effectiveness of anti-
poverty programs in the United States, In P. Jefferson (Ed.) Oxford Handbook of
Economics of Poverty. Oxford, U.K.: Oxford University Press.
Burns, S. S. (2007). Bringing Down the Mountains. Morgantown: West Virginia University
Press.
Cancian, M. &Danziger, S.H. (2009). Changing Poverty, Changing Policies. New York: Russell
Sage Foundation.
Chronic Poverty Research Centre (2004).The Chronic Poverty Report 2004-05. Manchester:
CPRC/University of Manchester.
Cofer, E., Grossman, E., & Clark, F. (1962). Family food plans and food costs. U.S. Department
of Agriculture, Agricultural Research Service. Home Economics Research Report No. 20.
CRS (2012a). Social security: The minimum benefit provision. Retrieved from
greenbook.waysandmeans.house.gov.
CRS (2012b). The earned income tax credit (EITC): An overview. Retrieved from
greenbook.waysandmeans.house.gov.
CRS (2012c). The temporary assistance for needy families (TANF) block grant: A primer on
TANF financing and federal requirements. Retrieved from
greenbook.waysandmeans.house.gov.
CRS (2013). The temporary assistance for needy families (TANF) block grant: Responses to

frequently asked questions. Retrieved from greenbook.waysandmeans.house.gov.
Dahl, G. &Lochner, L. (2012). The impact of family income on child achievement: Evidence
from the earned income tax credit, American Economic Review, 1927-1956.
Danziger, S.H.,Schoeni, R.F., & Blank, R.M. (2008). Working and Poor: How Economic and
Policy Changes Are Affecting Low-Wage Workers. New York: Russell Sage.
Davis, K. & Schoen, C. (1978). Medicare, the great society, and the aged. In Health and the War
on Poverty – A Ten-Year Appraisal.
DeNavas-Walt, C., Proctor, B. D., & Smith, J. C. (2013). U.S. Census Bureau, Current
Population Reports, P60-245, Income, Poverty, and Health Insurance Coverage in the
United States: 2012, U.S. Government Printing Office, Washington, DC, 2013.
DeParle, J. (2012, January 4). For many poor students, leap to college ends in a hard fall.
Retrieved from www.nytimes.com.
Duclos, J., Araar, A.& Giles, J. (2006). Chronic and transient poverty: Measurement and
estimation with evidence from China, Institute for the Study of Labor. Discussion Paper
No. 2078.
Eissa, N. &Hoynes, H. (2011). Redistribution and tax expenditures: The earned income tax credit,
National Tax Journal 64(2): 689–729.
Ellwood, D. (1988). Values and the helping conundrums. In Poor Support: Poverty in the
American Family. New York: Basic Books, Inc.
Fagan, G.H. (1995). Culture, politics, and Irish school dropouts: Constructing political identities.
Westport, CT: Bergin and Garvey.

Fisher, G.M. (1992). Poverty guidelines for 1992, Social Security Bulletin, 55(1): 46.
Fitzpatrick, K. & Thompson, J.P. (2010). The interaction of metropolitan cost-of-living and the
federal earned income tax credit: One size fits all?,National Tax Journal 63(3), 419-445.
Gabriel, T. (2014, April 20). 50 years into the war on poverty, hardship hits back. Retrieved from
www.nytimes.com.
Gillette, M.L. (2010). Launching the War on Poverty: An Oral History. New York: Oxford
University Press.
Goda, G.S.,Shoven, J.B., &Slavov, S.N. (2011). How well are social security recipients protected
from inflation?,National Tax Journal 64(2), 429-449.
Gould, E. &Wething, H. (2012). U.S. poverty rates higher, safety net weaker than in peer
countries, Economic Policy Institute Issue Brief 339.
Guzman, T., Pirog, M.A.,&Seefeldt, K. (2013). Social policy: What have we learned?,Policy
Studies Journal 41, 53-70.
Haskins, R. & Rouse, C.E. (2013). Time for change: A new federal strategy to prepare
disadvantaged students for college, Princeton-Brookings Policy Brief.
Hendryx, M. (2011). Poverty and mortality disparities in central Appalachia: Mountaintop
mining and environmental justice, Journal of Health Disparities Research and Practice
4(3), 44-53.
Hoynes, Hilary Williamson, and Diane Whitmore Schanzenbach. 2011. “Work Incentives and
the Food Stamp Program.” Journal of Public Economics 96 (1–2): 151–62.

Huffman, T. (2010). Theoretical perspectives on American Indian education: Taking a new look
at academic success and the achievement gap.
Hutto, Nathan, Jane Waldfogel, NeerajKaushal, and Irv Garfinkel (2011). Improving
themeasurement of poverty,Social Service Review 35(1): 39-74.
Johnson, L.B. (1964, January 8). Annual Message to Congress on the State of the Union.Austin,
TX: Lyndon B. Johnson Library. Retrieved from:
http://www.lbjlib.utexas.edu/johnson/archives.hom/speeches.hom/640108.asp
Karabel, J. &Laurison, D. (2012). An exceptional nation?American political values in
comparative perspective. Working Paper for Institute for Research on Labor and
Employment at UC Berkeley.
Kotlikoff, L.J. (2011). Fixing social security: What would Bismarck do?,National Tax Journal
64(2), 415-428.
Krueger, A.B. (2007). Inequality, too much of a good thing. In Grusky&Szelenyi (Eds.),
Inequality Reader: Contemporary and Foundational Readings in Race, Class, and
Gender. Cambridge, MA: Westview Press.
Lanjouw, P., Milanovic, B. &Paternostro, S. (2009). Economies of scale and poverty: The
impact of relative price shifts during economic transition. Report for the World Bank.
Lim, Y., Livermore, M., & Davis, B. C. (2010). Material hardship among banked and unbanked
EITC-eligible families. Journal of Poverty, 14(3), 266–284.
Logan, T.D. (2008). Economies of scale in the household: Puzzles and patterns from the
American past. Working Paper 13869. Cambridge, MA: National Bureau of Economic
Research.
Marr, C., Charite, J. & Huang, C. (2013, April 9). Earned income tax credit promotes work,
encourages children’s success at school, research finds, Center on Budget and Policy
Priorities.
McGarry, K. (2013). The safety net for the elderly, In M. Bailey & S. Danziger (Eds.) Legacies
of the War on Poverty. New York: Russell Sage.
Melish, T. (2014). Maximum feasible participation of the poor: New governance, new
accountability, and a 21st century war on the sources of poverty. Yale Human Rights and
Development Journal 13(1), 1-134.
Meyer, B.D. & Rosenbaum, D.T. (2014). Welfare, the earned income tax credit, and the labor
supply of single mothers, Quarterly Journal of Economics 116(3): 1063- 2014.
Nolan, B. and C. T. Whelan (2010). Using non-monetary deprivation indicators to analyse
poverty and social exclusion: Lessons from Europe?,Journal of Policy Analysis
andManagement29(2), 305-325.
Orshansky, M. (1988). Counting the poor: Another look at the poverty profile, Social Security
Bulletin, 51(10), 25-51.
Pager, D. & Shepherd, H. (2008). The sociology of discrimination: Racial discrimination in
employment, housing, credit, and consumer markets, Annual Review of Sociology 34,
181-209.
Persson, T. & and Tabellini, G. (1995). Is inequality harmful for growth? American Economic
Review 84.
Raz, M. (2013). What’s Wrong with the Poor? Psychiatry, Race, and the War on Poverty.
Chapel Hill: UNC Press.
Romich, J., Simmelink, J. & Holt, S. (2007). When working harder does not pay: Low-income
working families, tax liabilities, and benefit reductions, Families in Society 88(3), 418-

426.
Rosales, R. (2000). The Illusion of Inclusion: The Untold Political Story of San Antonio, Texas.
Texas: University of Texas Press.
Shapiro, T. (2010).Mountain justice: Homegrown resistance to mountaintop removal for the
future of us all. Oakland, CA: AK Press.
Short, K. (2012). The research: Supplemental poverty measure 2011, Current Population
Reports. US Census Bureau, 1-20.
Smeeding, T.M., Wing, C., & Robson, K. (2009). Differences in social transfer support and
poverty for immigrant families with children: Lessons from the LIS. In E. Grigorenko
and R. Takanishi (Eds.), Immigration, diversity, and education. New York: Routledge.
Social Security Administration. (n.d.). 2014 social security changes. Retrieved from ssa.gov.
Stern, M. J &Axinn, J. (2012).Social Welfare: A History of the American Response to Need (8th
ed.). New York: Pearson.
Swartz, K. (2013). The war on poverty’s effects on health care use of the elderly, In M. Bailey &
S. Danziger (Eds.) Legacies of the War on Poverty. New York: Russell Sage.
Tolleson-Rinehart & Josephson (2005). Gender and American Politics: Women, Men, and the
Political Process. Armonk, NY: M.E. Sharpe.
Trattner, W. I. (1999). From Poor Law to Welfare State (6th ed.). New York: Free Press.
Trisi, D. &Pavetti, L. (2012, March 13). TANF weakening as a safety net for poor families,
Center on Budget and Policy Priorities.

U.S. Census Bureau (2012).Income, poverty, and health insurance coverage in the United States,
2011, Current Population Reports, 60-243.
U.S. House of Representatives, Committee on Ways and Means (2013).Overview of Entitlement
Programs.2012 Green Book. Washington, D. C.: U.S. Government Printing Office.
UnicefInnocenti Centre (2010). Children left behind: A league table of inequality in child well-
being in the worlds’ rich countries, Innocenti Centre Report Card 9. Florence, Italy.
Waldfogel, J. (2013). The social safsety net for families with children, In M. Bailey & S.
Danziger (Eds.) Legacies of the War on Poverty. New York: Russell Sage.
Weathers, R.R. &Hemmeter, J. (2011). The impact of changing financial work incentives on the
earnings of social security disability insurance (SSD() beneficiaries, Journal of Policy
Analysis and Management 30(4), 708-728.
Wimer, C., Fox, L., Garfinkel, I., Kaushal, N. &Waldfogel, J. (2013). Trends in poverty with an
anchored supplemental poverty measure.CPRC Working Paper No. 13-01.
Ziliak, J.P. (2010). Alternative poverty measures and the geographic distribution of poverty in
the United States. Report prepared for the Office of the Assistant Secretary for Planning
and Evaluation, U.S. Department of Health and Human Services.
Ziliak, J. (2011). Recent developments in antipoverty policies in the United States, Institute for
Research on Poverty Discussion Paper No. 1396-11.

Table 1: Total Expenditures of Anti-Poverty Programs, 1999-2009
Unit: Billion$ 1999 2009 % Change
Social Insurance
OASI 424 568 34.0
Medicare 270 519 92.2
UI 26 122 369.2
DI 65 121 86.2
Workers Compensation 55 59 7.3
Social Assistance
Medicaid 260 392 50.8
EITC 40 59 47.5
SNAP 23 55 139.1
SSI 39 47 20.5
Housing 36 41 13.9
TANF 29 29 0.0
Source: Ziliak, 2011, Table 1.

Table 2: Average Monthly Expenditures per Family
Monthly Expenditures per Family 1984 1993 2004 % Change
Nonelderly, Nondisabled
Single-parent families 624 623 501 -20
Two-parent families 199 224 322 62
Childless families and individuals 143 164 153 7
Employed families 130 156 210 62
Nonemployed families 693 718 544 -22
Elderly families and individuals 1177 1304 1324 12
Disabled families and individuals 1247 1305 1445 16
Source: Ben-Shalom, Moffitt, &Scholz, 2011, Table 2.

Table 3: Effects of Anti-Poverty Programs on Poverty
% Poor % Deep Poverty 150% Poverty
Pre Post Pre Post Pre Post
2004 29.0 13.5 21.3 6.6 39.6 25.3
1993 30.3 13.1 20.8 4.5 43.7 29.4
1984 32.1 15.3 20.4 4.5 49.7 36.3
Source: Ben-Shalom, Moffitt, &Scholz, 2011, Table 3.
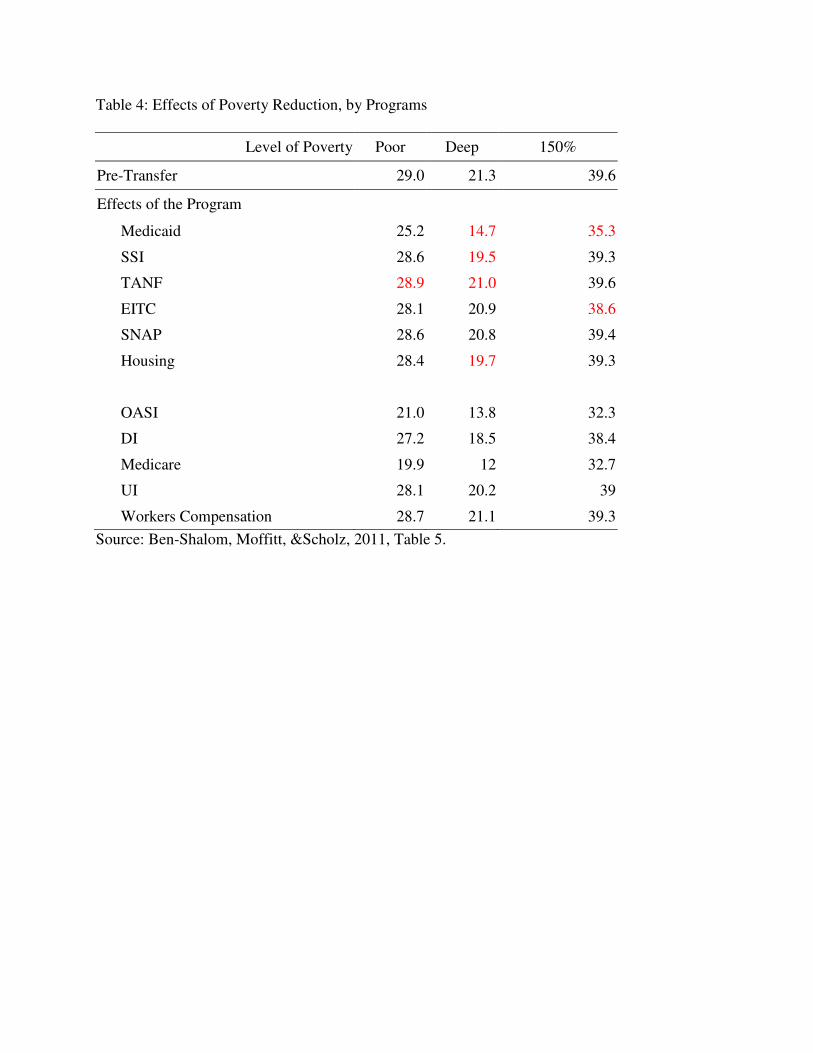
Table 4: Effects of Poverty Reduction, by Programs
Level of Poverty Poor Deep 150%
Pre-Transfer 29.0 21.3 39.6
Effects of the Program
Medicaid 25.2 14.7 35.3
SSI 28.6 19.5 39.3
TANF 28.9 21.0 39.6
EITC 28.1 20.9 38.6
SNAP 28.6 20.8 39.4
Housing 28.4 19.7 39.3
OASI 21.0 13.8 32.3
DI 27.2 18.5 38.4
Medicare 19.9 12 32.7
UI 28.1 20.2 39
Workers Compensation 28.7 21.1 39.3
Source: Ben-Shalom, Moffitt, &Scholz, 2011, Table 5.

Figure 1: Numbers and Rates of Poverty, 1959-2012
Source: DeNavas-Walt, Proctor, & Smith, 2013, Figure 4.

Figure 2: Poverty Rates by Age, 1959-2012
Source: DeNavas-Walt, Proctor, & Smith, 2013, Figure 5.