Embed Size (px)
Citation preview
Biosystems II: Neuroscience
Sensory Systems
Lecture 3
Neural Representations of Sensory Stimuli:Properties of Spike Trains
Dr. Xiaoqin Wang
Outline
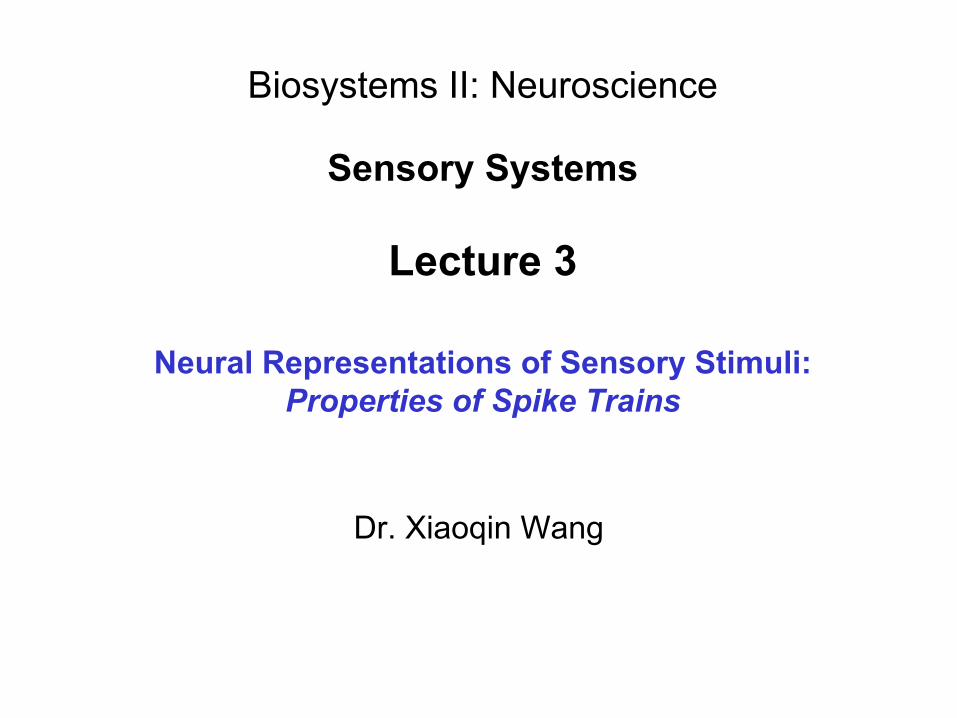
1. Measurements of neural responses (Fig.3-1)
- Intracellular vs. extracellular recordings
- In vivo (e.g., intact brain) vs. in vitro (e.g. brain slice, isolated neurons) preparation
2. Action potentials (“spikes”) as the information carriers in CNS (Fig.3-2)
3. Information about a sensory stimulus can be encoded in terms of average discharge rate or temporal discharge patterns
- Discharge rate (Fig.3-3, 3-4, 3-5)
- Temporal discharge patterns (Fig.3-6, 3-7, 3-8, 3-9)
4. Neural firings (“spike trains”) can be modeled as Poisson processes
- Poisson process model (Fig.3-10, 3-11)
- Coefficient of variation (CV) analysis (Fig.3-12)
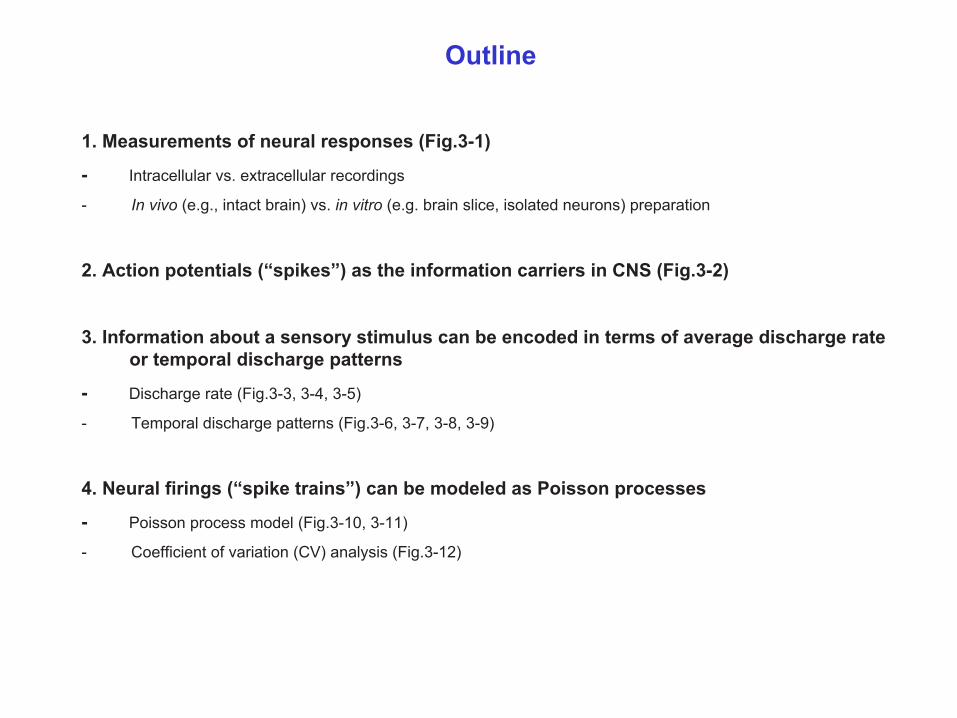
Fig.3-1
Extracellularrecording
(spikes)
Intracellular recording
(EPSP, IPSP, spikes)
Intracellular recording
In vivo (e.g., intact brain) vs. in vitro (e.g. brain slice, isolated neurons)
Three simulated recordings from a neuron. The top trace represents a recording from an intracellular electrode connected to the soma of the neuron. The height or the action potentials has ban clipped to show the subthreshold membrane potential more clearly. The time scale is such that the action potential trajectory cannot be resolved. The bottom trace represents a recordingfrom an intracellular electrode connected to the axon some distance away from the soma. The full height of the action potentialsis indicated in the trace. The middle trace is a simulated extracellular recording. Action potentials appear as roughly equal positive and negative potential fluctuations with an amplitude of around 0.1 mV. This is roughly 1000 times smaller than the approximately 0.1 V amplitude of an intracellularly recorded action potential
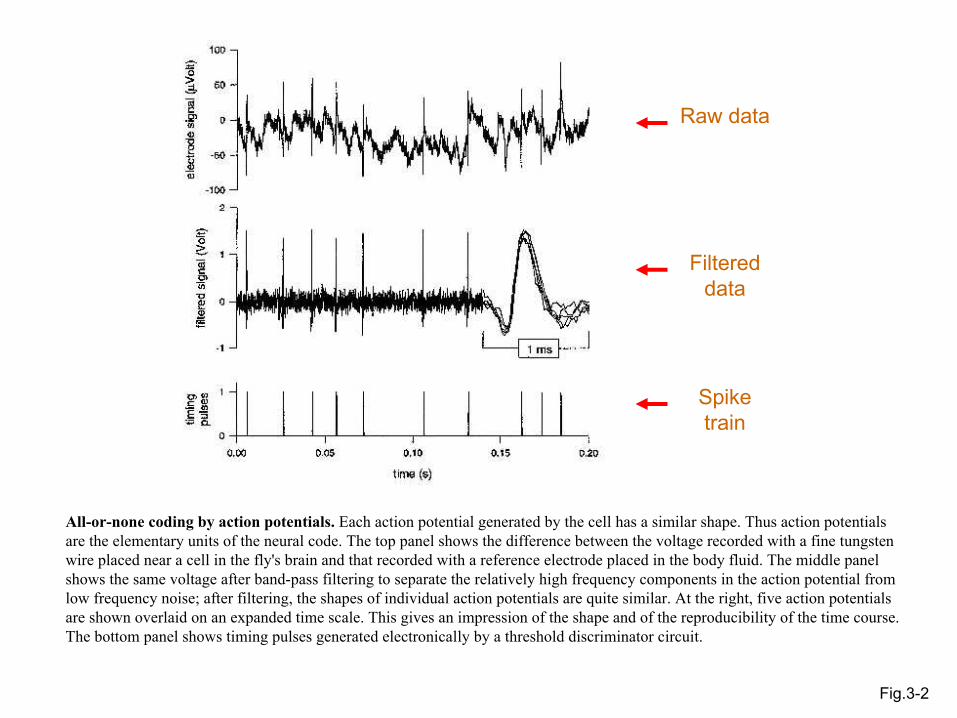
Fig.3-2
Raw data
Filtered data
Spike train
All-or-none coding by action potentials. Each action potential generated by the cell has a similar shape. Thus action potentials are the elementary units of the neural code. The top panel shows the difference between the voltage recorded with a fine tungsten wire placed near a cell in the fly's brain and that recorded with a reference electrode placed in the body fluid. The middle panel shows the same voltage after band-pass filtering to separate the relatively high frequency components in the action potential from low frequency noise; after filtering, the shapes of individual action potentials are quite similar. At the right, five action potentials are shown overlaid on an expanded time scale. This gives an impression of the shape and of the reproducibility of the time course. The bottom panel shows timing pulses generated electronically by a threshold discriminator circuit.
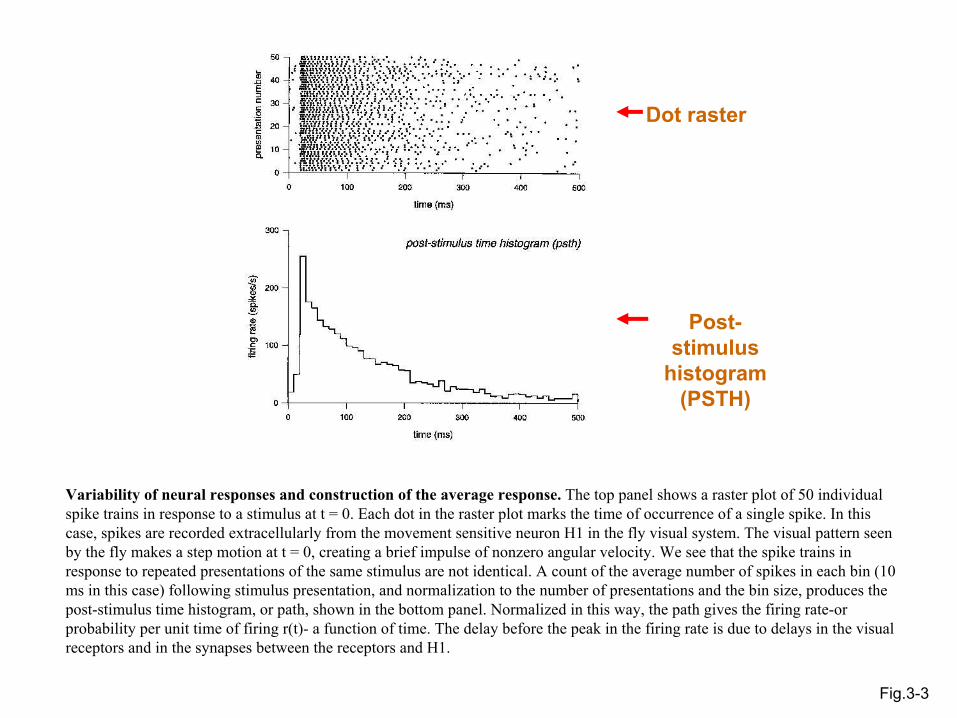
Fig.3-3
Dot raster
Post-stimulus
histogram (PSTH)
Variability of neural responses and construction of the average response. The top panel shows a raster plot of 50 individual spike trains in response to a stimulus at t = 0. Each dot in the raster plot marks the time of occurrence of a single spike. In this case, spikes are recorded extracellularly from the movement sensitive neuron H1 in the fly visual system. The visual pattern seen by the fly makes a step motion at t = 0, creating a brief impulse of nonzero angular velocity. We see that the spike trains in response to repeated presentations of the same stimulus are not identical. A count of the average number of spikes in each bin (10 ms in this case) following stimulus presentation, and normalization to the number of presentations and the bin size, produces the post-stimulus time histogram, or path, shown in the bottom panel. Normalized in this way, the path gives the firing rate-or probability per unit time of firing r(t)- a function of time. The delay before the peak in the firing rate is due to delays in the visual receptors and in the synapses between the receptors and H1.
Response measures of spike trains:
• Mean firing rate• Post-stimulus histogram (PSTH)• Period histogram• Inter-spike interval (ISI) histogram
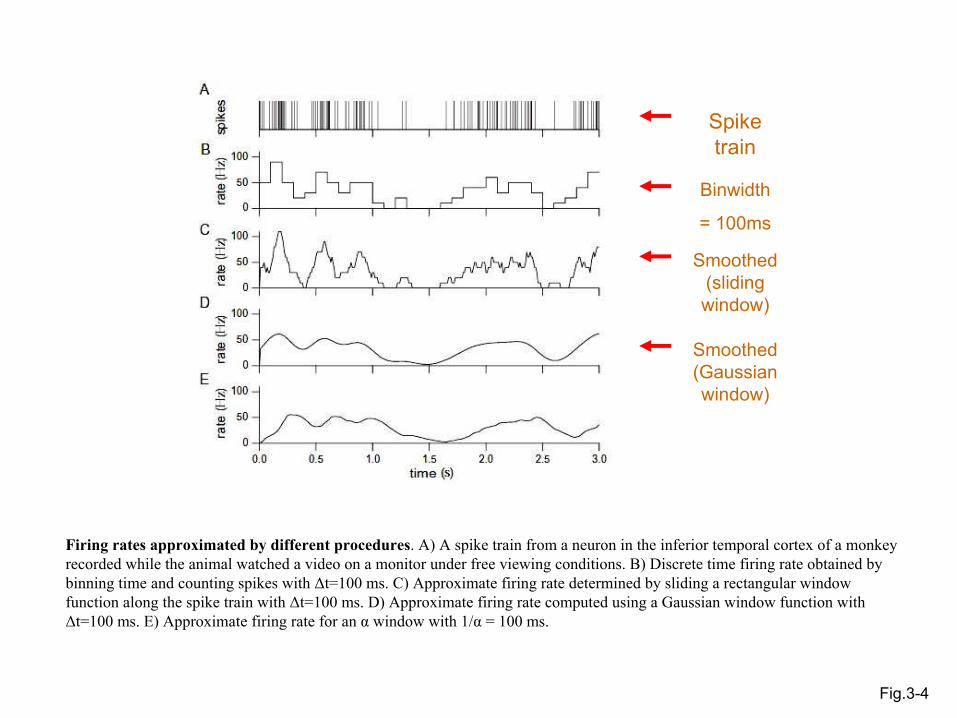
Fig.3-4
Spike train
Binwidth
= 100ms
Smoothed (sliding window)
Smoothed (Gaussianwindow)
Firing rates approximated by different procedures. A) A spike train from a neuron in the inferior temporal cortex of a monkey recorded while the animal watched a video on a monitor under free viewing conditions. B) Discrete time firing rate obtained by binning time and counting spikes with ∆t=100 ms. C) Approximate firing rate determined by sliding a rectangular window function along the spike train with ∆t=100 ms. D) Approximate firing rate computed using a Gaussian window function with∆t=100 ms. E) Approximate firing rate for an α window with 1/α = 100 ms.
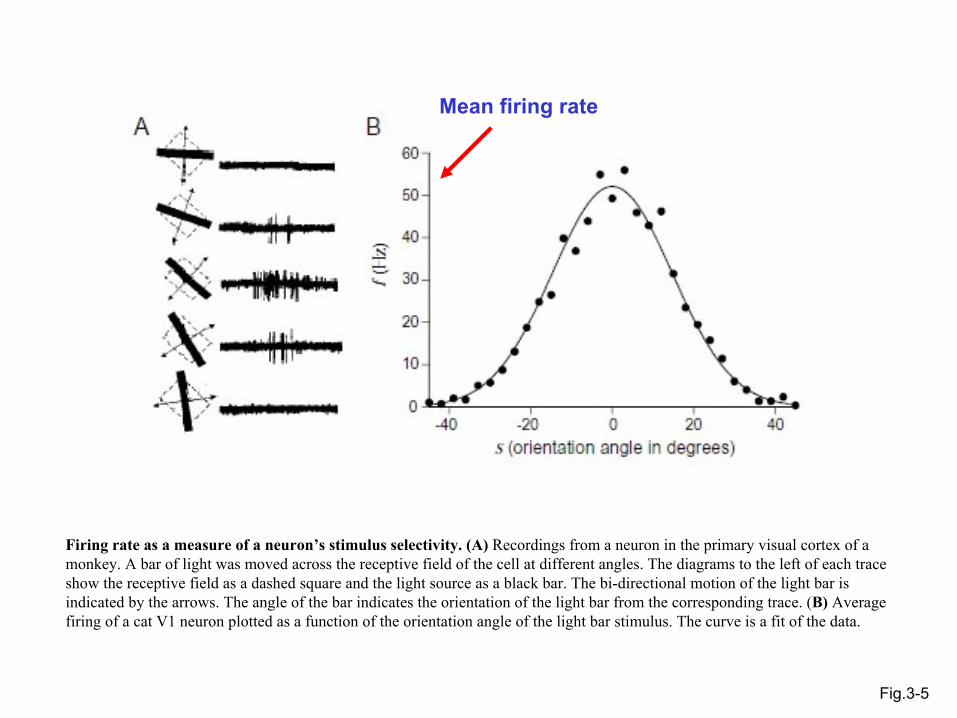
Fig.3-5
Mean firing rate
Firing rate as a measure of a neuron’s stimulus selectivity. (A) Recordings from a neuron in the primary visual cortex of a monkey. A bar of light was moved across the receptive field of the cell at different angles. The diagrams to the left of each trace show the receptive field as a dashed square and the light source as a black bar. The bi-directional motion of the light bar is indicated by the arrows. The angle of the bar indicates the orientation of the light bar from the corresponding trace. (B) Average firing of a cat V1 neuron plotted as a function of the orientation angle of the light bar stimulus. The curve is a fit of the data.
1
2
3
Temporal Structure of Spike Trains
Fig.3-6
Phase-locking
Period histogram
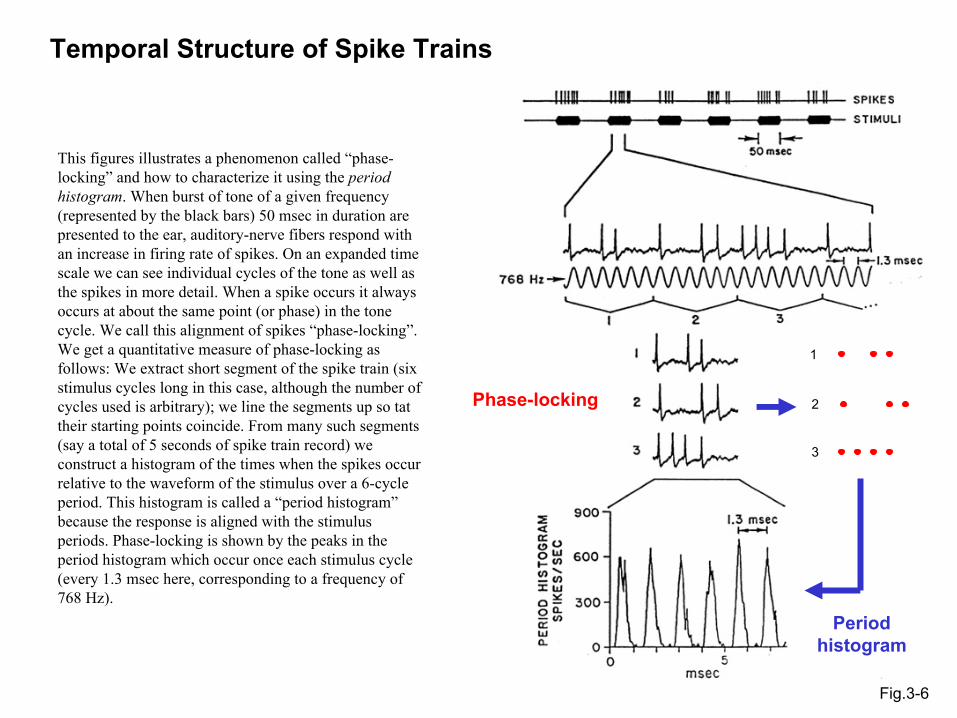
This figures illustrates a phenomenon called “phase-locking” and how to characterize it using the period histogram. When burst of tone of a given frequency (represented by the black bars) 50 msec in duration are presented to the ear, auditory-nerve fibers respond with an increase in firing rate of spikes. On an expanded time scale we can see individual cycles of the tone as well as the spikes in more detail. When a spike occurs it always occurs at about the same point (or phase) in the tone cycle. We call this alignment of spikes “phase-locking”. We get a quantitative measure of phase-locking as follows: We extract short segment of the spike train (six stimulus cycles long in this case, although the number of cycles used is arbitrary); we line the segments up so tat their starting points coincide. From many such segments (say a total of 5 seconds of spike train record) we construct a histogram of the times when the spikes occur relative to the waveform of the stimulus over a 6-cycle period. This histogram is called a “period histogram”because the response is aligned with the stimulus periods. Phase-locking is shown by the peaks in the period histogram which occur once each stimulus cycle (every 1.3 msec here, corresponding to a frequency of 768 Hz).
Phase-locking in the discharges of somatosensory neurons
Fig.3-7b
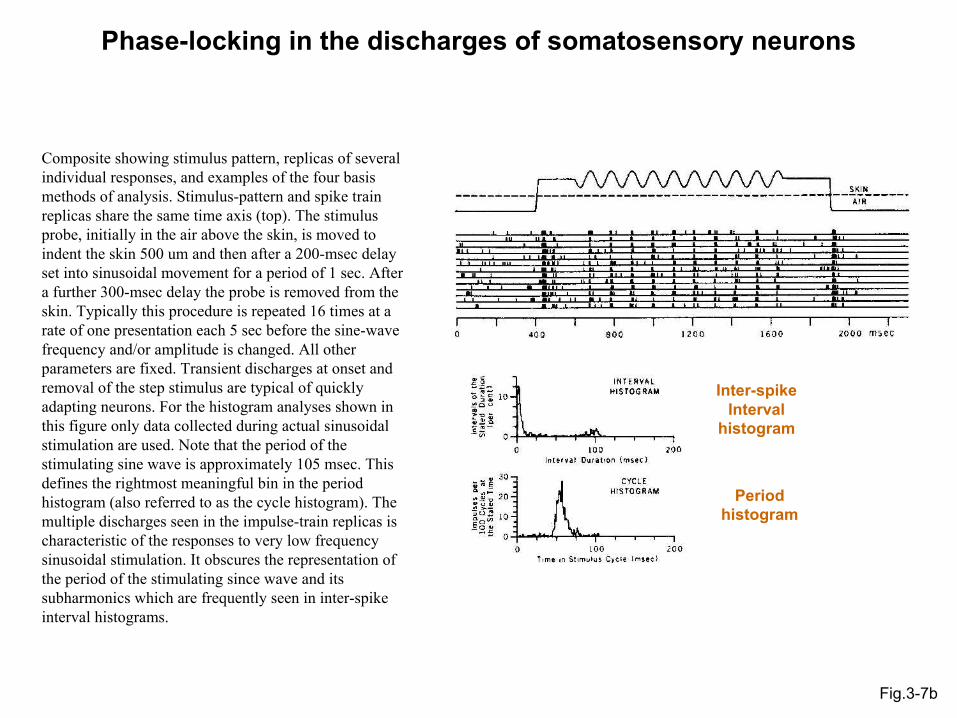
Composite showing stimulus pattern, replicas of several individual responses, and examples of the four basis methods of analysis. Stimulus-pattern and spike train replicas share the same time axis (top). The stimulus probe, initially in the air above the skin, is moved to indent the skin 500 um and then after a 200-msec delay set into sinusoidal movement for a period of 1 sec. After a further 300-msec delay the probe is removed from the skin. Typically this procedure is repeated 16 times at a rate of one presentation each 5 sec before the sine-wave frequency and/or amplitude is changed. All other parameters are fixed. Transient discharges at onset and removal of the step stimulus are typical of quickly adapting neurons. For the histogram analyses shown in this figure only data collected during actual sinusoidal stimulation are used. Note that the period of the stimulating sine wave is approximately 105 msec. This defines the rightmost meaningful bin in the period histogram (also referred to as the cycle histogram). The multiple discharges seen in the impulse-train replicas is characteristic of the responses to very low frequency sinusoidal stimulation. It obscures the representation of the period of the stimulating since wave and itssubharmonics which are frequently seen in inter-spike interval histograms.
Inter-spike Interval
histogram
Period histogram
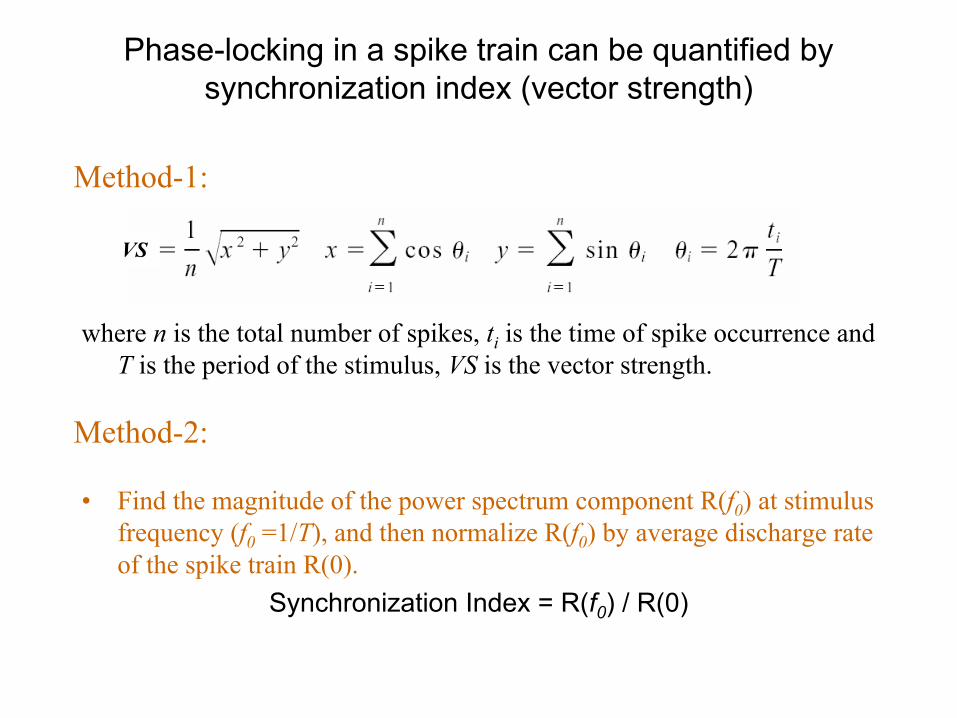
Phase-locking in a spike train can be quantified by synchronization index (vector strength)
• Find the magnitude of the power spectrum component R(f0) at stimulus frequency (f0 =1/T), and then normalize R(f0) by average discharge rate of the spike train R(0).
Synchronization Index = R(f0) / R(0)
where n is the total number of spikes, ti is the time of spike occurrence and T is the period of the stimulus, VS is the vector strength.
Method-1:
Method-2:
VS
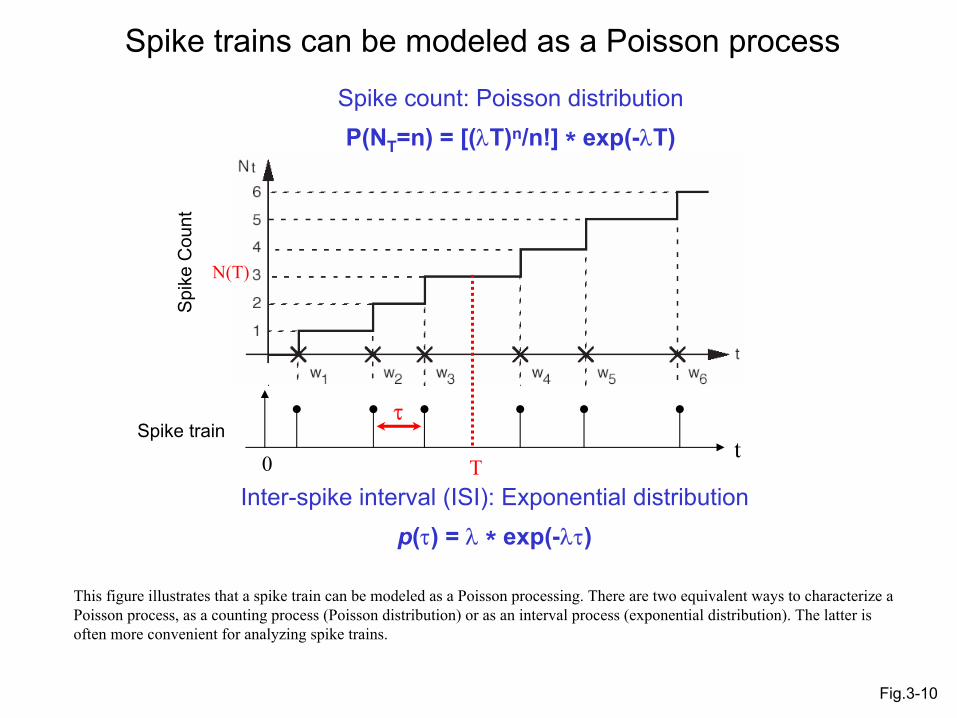
Spike trains can be modeled as a Poisson process
Inter-spike interval (ISI): Exponential distributionp(τ) = λ * exp(-λτ)
Spike count: Poisson distributionP(NT=n) = [(λT)n/n!] * exp(-λT)
tSpike train
0 T
N(T)
Spi
ke C
ount
τ
Fig.3-10
This figure illustrates that a spike train can be modeled as a Poisson processing. There are two equivalent ways to characterize a Poisson process, as a counting process (Poisson distribution) or as an interval process (exponential distribution). The latter is often more convenient for analyzing spike trains.
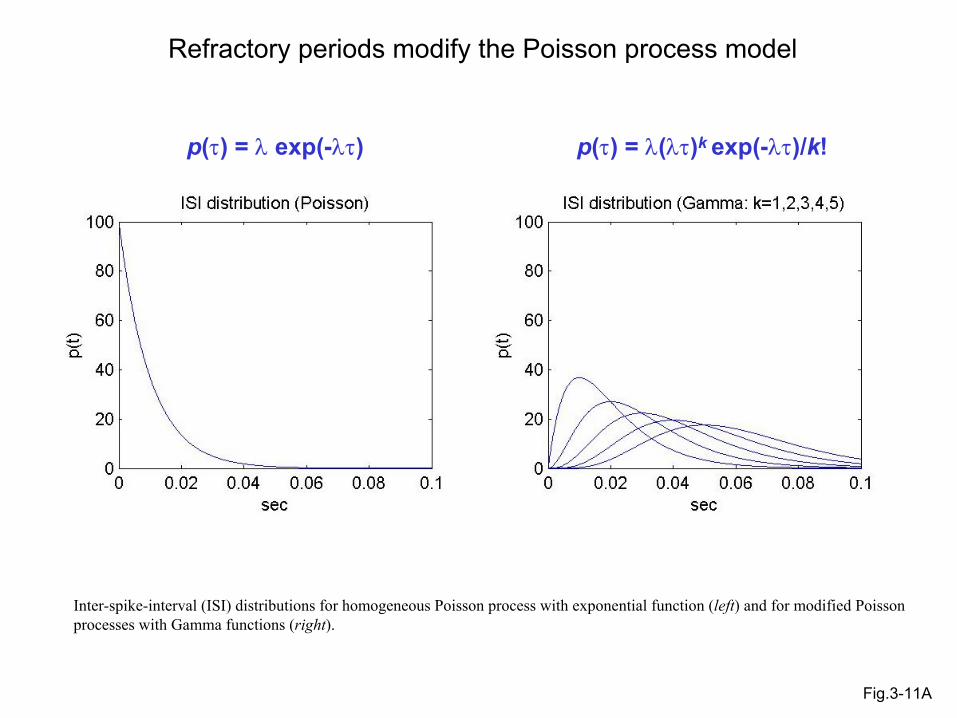
Refractory periods modify the Poisson process model
p(τ) = λ exp(-λτ) p(τ) = λ(λτ)k exp(-λτ)/k!
Inter-spike-interval (ISI) distributions for homogeneous Poisson process with exponential function (left) and for modified Poisson processes with Gamma functions (right).
Fig.3-11A
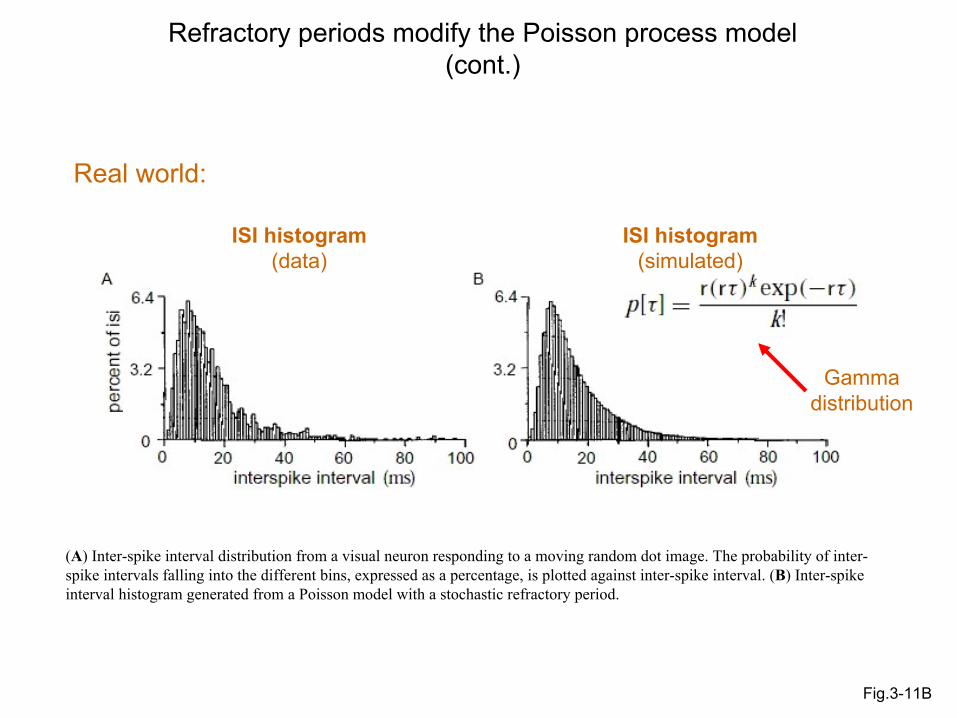
Fig.3-11B
Refractory periods modify the Poisson process model(cont.)
ISI histogram (data)
ISI histogram (simulated)
Gamma distribution
Real world:
(A) Inter-spike interval distribution from a visual neuron responding to a moving random dot image. The probability of inter-spike intervals falling into the different bins, expressed as a percentage, is plotted against inter-spike interval. (B) Inter-spike interval histogram generated from a Poisson model with a stochastic refractory period.
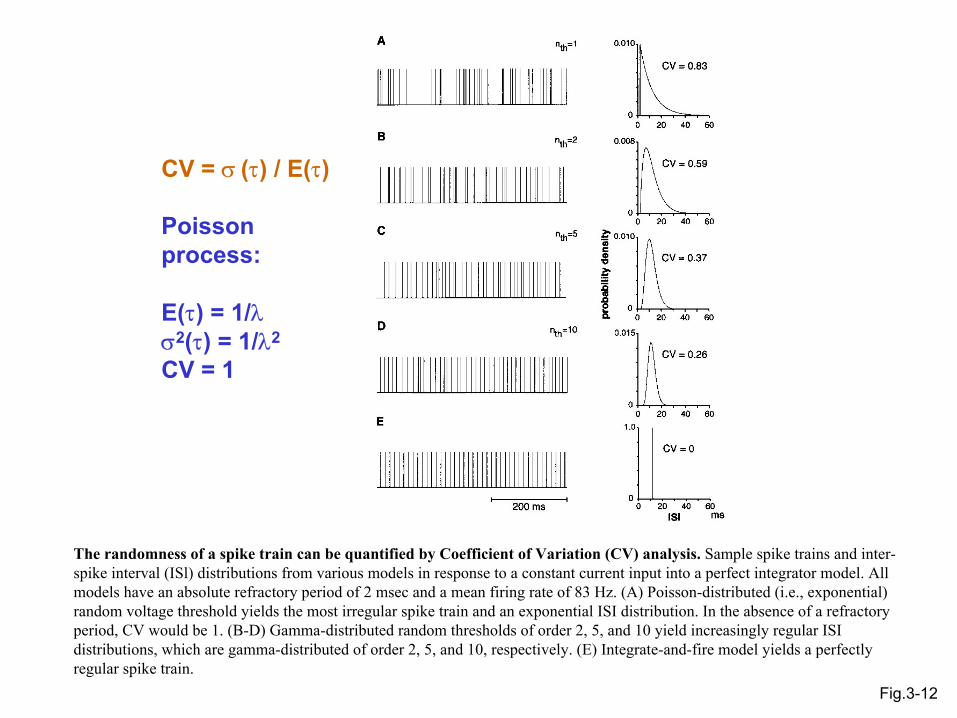
Fig.3-12
CV = σ (τ) / E(τ)
Poisson process:
E(τ) = 1/λσ2(τ) = 1/λ2
CV = 1
The randomness of a spike train can be quantified by Coefficient of Variation (CV) analysis. Sample spike trains and inter-spike interval (ISl) distributions from various models in response to a constant current input into a perfect integrator model. All models have an absolute refractory period of 2 msec and a mean firing rate of 83 Hz. (A) Poisson-distributed (i.e., exponential) random voltage threshold yields the most irregular spike train and an exponential ISI distribution. In the absence of a refractory period, CV would be 1. (B-D) Gamma-distributed random thresholds of order 2, 5, and 10 yield increasingly regular ISI distributions, which are gamma-distributed of order 2, 5, and 10, respectively. (E) Integrate-and-fire model yields a perfectly regular spike train.
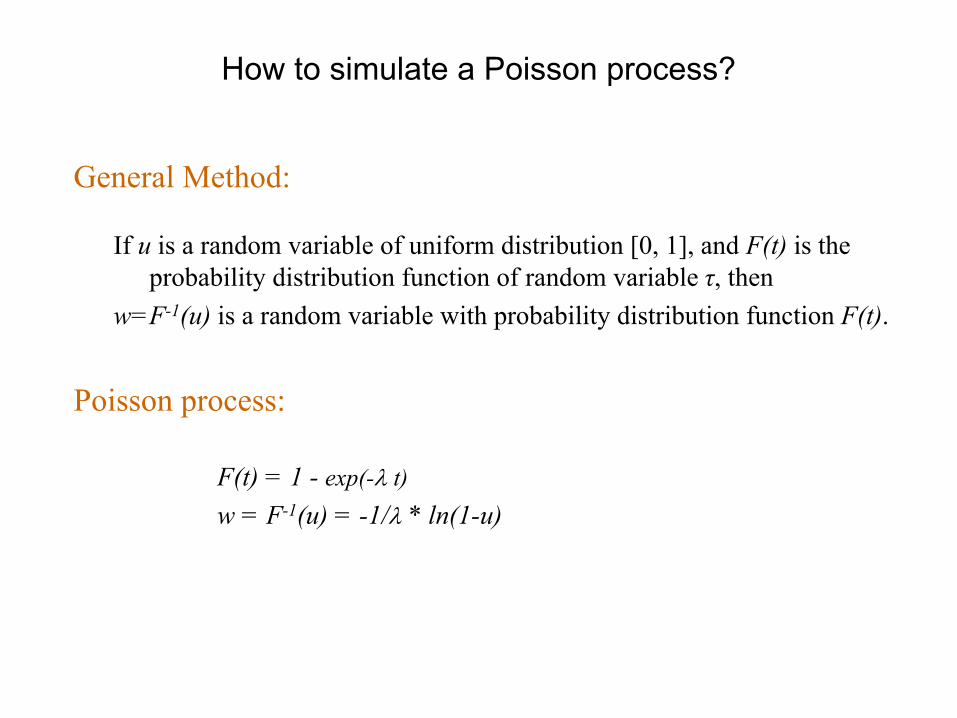
How to simulate a Poisson process?
If u is a random variable of uniform distribution [0, 1], and F(t) is the probability distribution function of random variable τ, then
w=F-1(u) is a random variable with probability distribution function F(t).
General Method:
Poisson process:
F(t) = 1 - exp(-λ t)w = F-1(u) = -1/λ * ln(1-u)
Summary of Lecture 3
• Information about a sensory stimulus can be encoded in terms of either average discharge rateor temporal discharge patterns.
• Spike train can be modeled as modified Poisson processes.
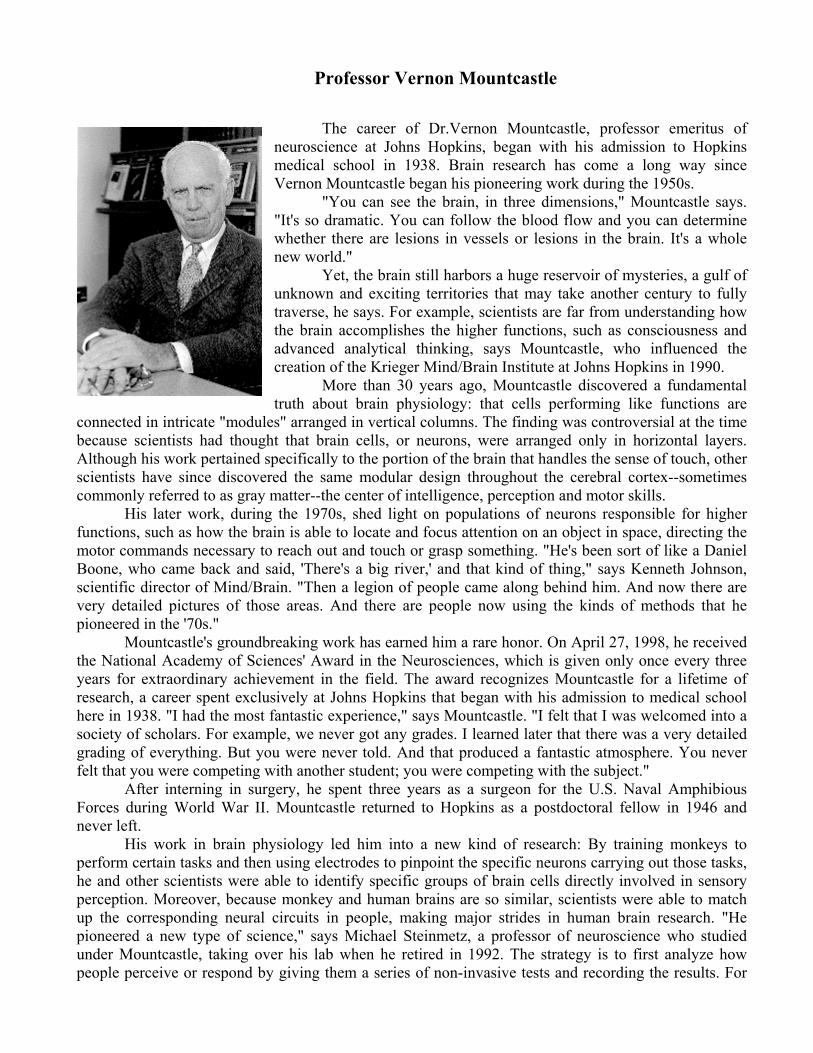
Professor Vernon Mountcastle
The career of Dr.Vernon Mountcastle, professor emeritus of neuroscience at Johns Hopkins, began with his admission to Hopkins medical school in 1938. Brain research has come a long way since Vernon Mountcastle began his pioneering work during the 1950s.
"You can see the brain, in three dimensions," Mountcastle says. "It's so dramatic. You can follow the blood flow and you can determine whether there are lesions in vessels or lesions in the brain. It's a whole new world."
Yet, the brain still harbors a huge reservoir of mysteries, a gulf of unknown and exciting territories that may take another century to fully traverse, he says. For example, scientists are far from understanding how the brain accomplishes the higher functions, such as consciousness and advanced analytical thinking, says Mountcastle, who influenced the creation of the Krieger Mind/Brain Institute at Johns Hopkins in 1990.
More than 30 years ago, Mountcastle discovered a fundamental truth about brain physiology: that cells performing like functions are
connected in intricate "modules" arranged in vertical columns. The finding was controversial at the time because scientists had thought that brain cells, or neurons, were arranged only in horizontal layers. Although his work pertained specifically to the portion of the brain that handles the sense of touch, other scientists have since discovered the same modular design throughout the cerebral cortex--sometimes commonly referred to as gray matter--the center of intelligence, perception and motor skills.
His later work, during the 1970s, shed light on populations of neurons responsible for higher functions, such as how the brain is able to locate and focus attention on an object in space, directing the motor commands necessary to reach out and touch or grasp something. "He's been sort of like a Daniel Boone, who came back and said, 'There's a big river,' and that kind of thing," says Kenneth Johnson, scientific director of Mind/Brain. "Then a legion of people came along behind him. And now there are very detailed pictures of those areas. And there are people now using the kinds of methods that he pioneered in the '70s."
Mountcastle's groundbreaking work has earned him a rare honor. On April 27, 1998, he received the National Academy of Sciences' Award in the Neurosciences, which is given only once every three years for extraordinary achievement in the field. The award recognizes Mountcastle for a lifetime of research, a career spent exclusively at Johns Hopkins that began with his admission to medical school here in 1938. "I had the most fantastic experience," says Mountcastle. "I felt that I was welcomed into a society of scholars. For example, we never got any grades. I learned later that there was a very detailed grading of everything. But you were never told. And that produced a fantastic atmosphere. You never felt that you were competing with another student; you were competing with the subject."
After interning in surgery, he spent three years as a surgeon for the U.S. Naval Amphibious Forces during World War II. Mountcastle returned to Hopkins as a postdoctoral fellow in 1946 and never left.
His work in brain physiology led him into a new kind of research: By training monkeys to perform certain tasks and then using electrodes to pinpoint the specific neurons carrying out those tasks, he and other scientists were able to identify specific groups of brain cells directly involved in sensory perception. Moreover, because monkey and human brains are so similar, scientists were able to match up the corresponding neural circuits in people, making major strides in human brain research. "He pioneered a new type of science," says Michael Steinmetz, a professor of neuroscience who studied under Mountcastle, taking over his lab when he retired in 1992. The strategy is to first analyze how people perceive or respond by giving them a series of non-invasive tests and recording the results. For
example, the human visual system might be studied by testing how people perceive changing patterns or images on a computer screen. Then the actual neural mechanisms involved in the perception can be learned by having monkeys perform the same tests while electrodes are used to probe their brains. "He was a major force in the development and refinement of methodologies that have made it a standard technique for studying the brain," Steinmetz says. It was an important step beyond the more conventional method of brain research, in which only broad geographic regions of the brain are mapped and linked to certain functions. "Just through the volume of neurons that he studied, he established a whole new standard by which critical areas of the brain would have to be studied," says Hopkins professor Kenneth Johnson, one of Mountcastle’s former doctoral students.
To really understand how the brain works, scientists need to identify and study specialized pockets of neurons, each containing several million brain cells, compared to the brain's total circuitry of about 100 billion neurons. Even today's advanced imaging techniques can't bring those smaller units into focus. Methods such as nuclear magnetic resonance, functional magnetic resonance imaging and positron emission tomography scanning measure changes in blood flow, oxygen consumption and other basic activities in brain regions. They reveal important information about which parts of the brain are active while it performs certain functions, such as remembering, perceiving or commanding motor movements. "They sort of tell you that this area lights up, or that that area lights up, but that's kind of like saying that a football crowd all shouts 'hurrah' at the same time," Johnson says.
The imaging devices don't tell scientists anything about the precise details of neuronal performance, which are central to brain function. "Most descriptions you see about the brain are metaphorical statements: 'The motor cortex controls movement. ...' Well, that doesn't tell you much, except for the geography," Mountcastle says. He was among the first scientists to directly probe the neural mechanisms involved in the senses, the perception of objects in space and how the brain is able to focus visual attention on specific objects.
Mountcastle was director of the Department of Physiology at the School of Medicine from 1964 to 1980, when he founded the Philip Bard Laboratories of Neurophysiology, which were incorporated into the Department of Neuroscience. Scientists in the labs concentrated on research dealing with vision, the sense of touch and the brain mechanisms involved in sensation and perception in those fields. Then, about a decade ago, then Johns Hopkins President Steven Muller held a university-wide meeting to discuss plans for the future. "A lot of suggestions were made, and then I said, “You ought to strike big, establish an independent brain institute,” Mountcastle says. "He called me into his office on Monday morning, and he said: “I think that's a grand idea, but it has to be at Homewood.” When the institute was formed at Krieger Hall, it was built around the Bard Labs, which were moved from the School of Medicine to the Homewood campus. Consequently, Mind/Brain scientists are faculty members of the Department of Neuroscience, and they teach in the School of Medicine. They also are involved in the undergraduate program in neuroscience, a growing field that is attracting experts from many disciplines. Because of this, an arrangement was approved in February through which Mind/Brain now reports to the dean of Arts and Sciences. Appointments will be made through both Arts and Sciences and the School of Medicine.
"There is virtually no science that's not relevant to the study of the brain," Mountcastle says. "In this brain research institute there are two physicists, others trained in physiology, others in biomedical engineering." The multidisciplinary nature of the research underscores the importance of establishing an independent institute; many of the researchers would not fit into a standard science department, but their services mesh perfectly in brain research. "Brain science is extremely important, independently from its importance in medicine," Mountcastle says. "It provides the opportunity to understand ourselves, to understand how our brain functions, how we remember, how we generate emotions, etc." By continuing brain research, he says, "we will come to understand ourselves a great deal better than we do now. Many people in neuroscience feel very strongly about that." (From JHU Gazatte, April 20, 1998)