Embed Size (px)
Citation preview
1
Insurance Incentives and Road Safety: Evidence from a Natural Experiment in
China
Abstract: we investigate the effects of the insurance incentives on safe driving by
evaluating both the accident frequency and accident severity following the reform of
the insurance pricing mechanism introduced in the city of Shenzhen in China. Our
contribution to literature is a clean identification of causal effect of insurance incentives
on road safety by employing the difference-in-differences methodology in the
framework of a natural experiment. We find that increasing insurance incentives can
reduce accident frequency significantly. These results are robust to the inclusion of
controls, alternative definitions for accident frequency and the placebo experiments.
Moreover, the impact of basing insurance pricing on traffic violations is bigger than on
past claims. The impact of insurance incentives on accident severity is inconclusive and
insignificant.
Key words: insurance incentives; experience rating; road safety; natural experiment
1、 Introduction
Road safety policies use both monetary (fines, insurance premiums) and non-monetary
incentives (point-record drivers’ licenses) to stimulate safe driving. Bourgeon & Picard
(2007) and Castillo-Manzano & Castro-Nuño (2012) address the question of whether
the point-record drivers’ license can boost road safety whilst many contributions have
been published to empirically evaluate the effects of the insurance premiums on road
safety(Boyer & Dionne, 1989; Cohen & Dehejia, 2004; Israel, 2008; Li et al., 2007;
Wang et al., 2008). Dionne et al. (2011) compare the relative incentive properties of
fine, insurance experience rating and point-record drivers’ license. The experience-
rated premium based on past claims and traffic violations used by insurance companies
is one of the most important monetary incentive mechanisms. Cummins et al. (2001)
conduct both the theoretical and empirical analysis of the impact of no-fault automobile
insurance on fatalities in U.S. states and find that the more stringent experience rating,
the lower fatality rates. The enforcement of experience rating can be justified by the
potential presence of asymmetric information between insured and insurer regarding
individual risks (Abbring et al., 2003; Chiappori & B.Salanié, 2000; Cohen, 2005;
Dionne et al., 2013). The asymmetric information goes towards two directions: one is
adverse selection and the other is moral hazard. The literature that try to disentangle
these two information problems is vast and dates back as least as early as Arrow(1963).
The goal of this paper is to test whether the insurance incentives the insurers employ
can reduce the insurance claims and hence enhance the road safety and how efficiently
the insurance incentives can improve road safety. The identification of a causal effect
often can be questioned since there is a number of important limitations in the
methodologies. First, the empirical analysis of the effects of the incentive mechanisms
is complicated by endogeneity. And the problem of omitted variables bias always
2
confounds inference if unobservable characteristics both influence insurance incentives
and road safety. Dionne et al. (2011) employs a reform in Quebec, Canada in 1992 to
test whether experienced-rated insurance premium based on demerit points can reduce
traffic violations and they find that the frequency of traffic violations fall down by 15%
following the enforcement of the reform. Unfortunately they do not have access to a
control group, which is necessary to identify the other changes that may contribute to
decrease the traffic violations because this compulsory insurance is provided by a
monopoly insurer.
Overcoming these limitations and eliminating the confounders, we contribute to the
empirical literature because we can cleanly and directly identify the impact of insurance
incentives on safe driving in the framework of natural experiment, which allows us to
examine the reactions of drivers to plausibly exogenous incentives for safe driving. The
Shenzhen Insurance Association announced that new pricing mechanisms would be
introduced in Shenzhen automobile insurance market since March 1st, 2011. This
reform would base the automobile insurance pricing on the past claims and traffic
violations of the insured. Located in the province of Guangdong, Shenzhen is called the
window of the Chinese reform and openness. The pricing mechanism in other markets
in Guangdong keep unchanged as before. We regard the city of Shenzhen as the
treatment group whilst the city of Foshan, also located in Guangdong and near
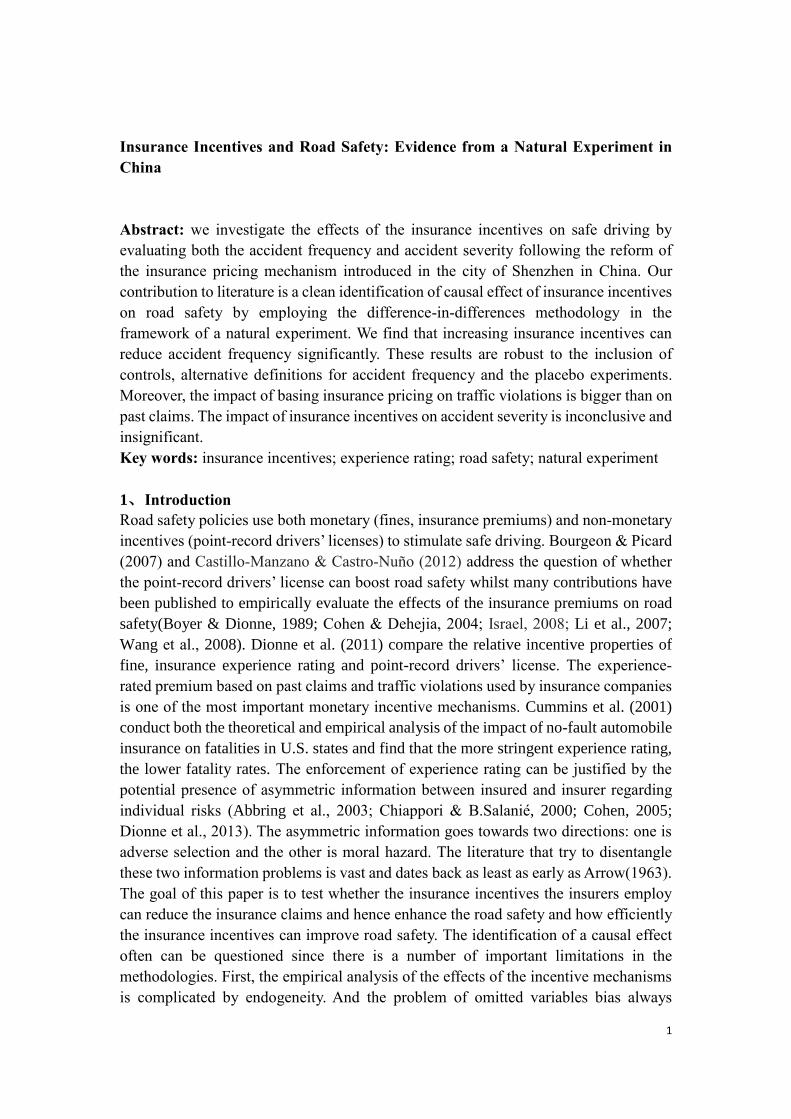
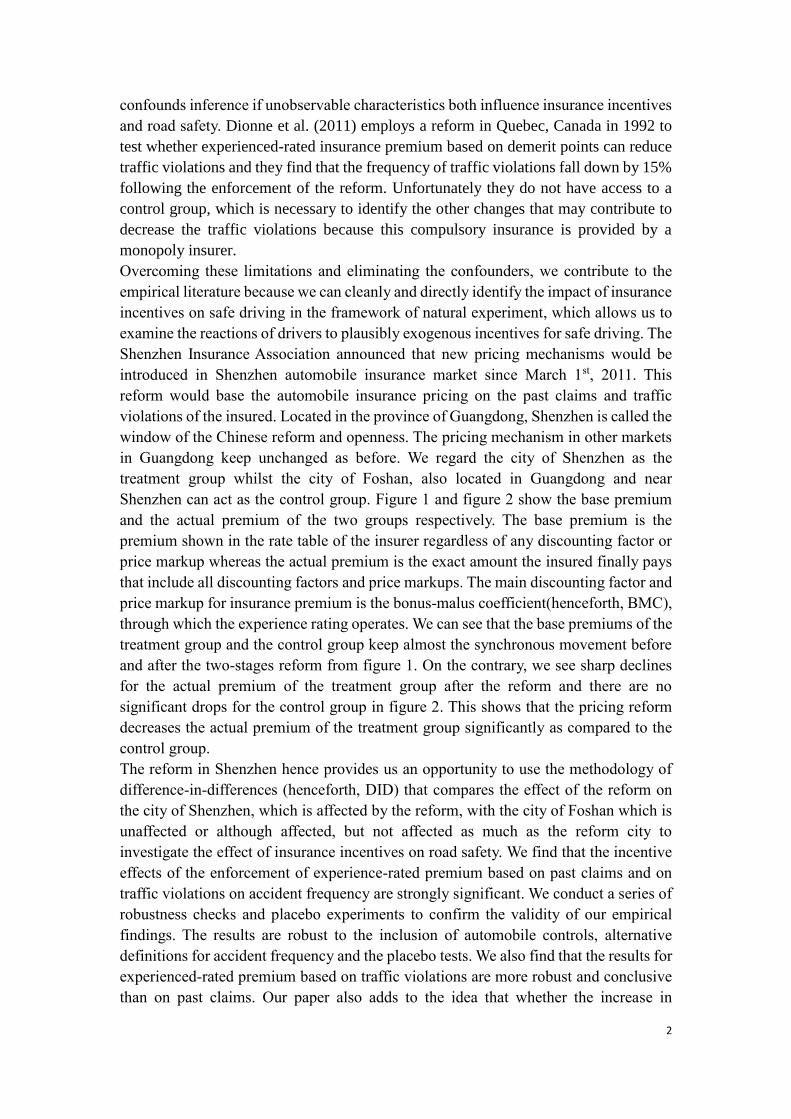
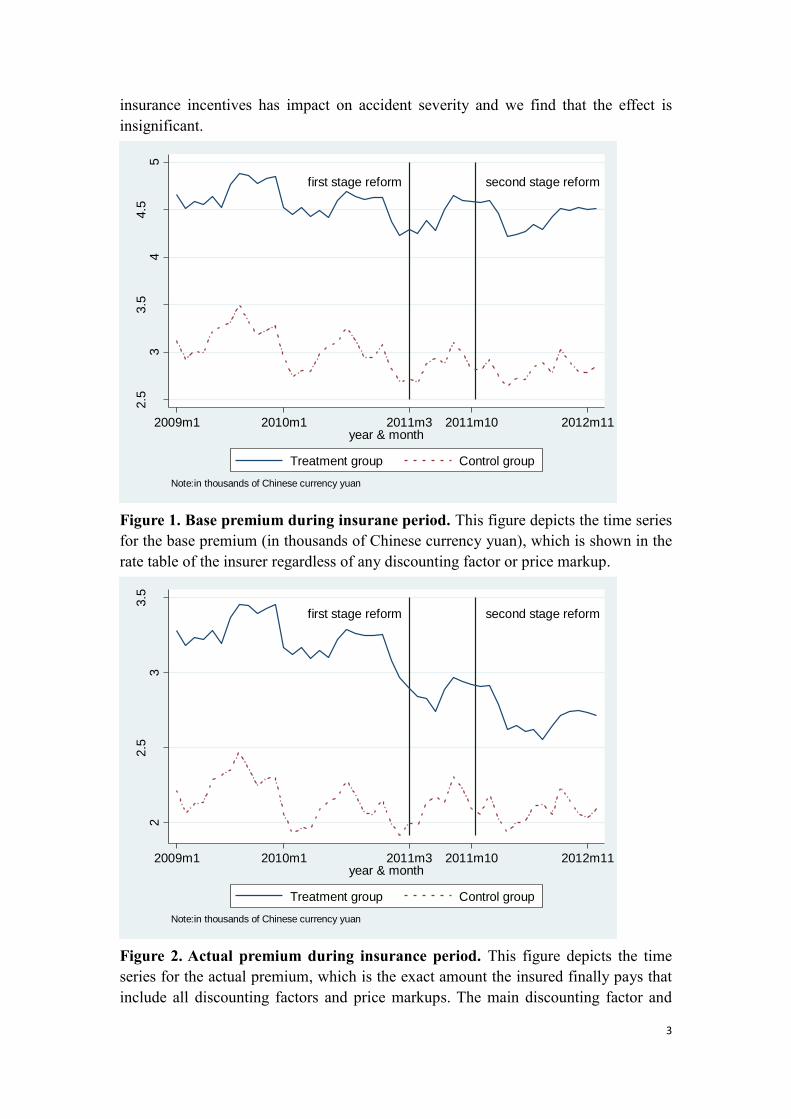
Shenzhen can act as the control group. Figure 1 and figure 2 show the base premium
and the actual premium of the two groups respectively. The base premium is the
premium shown in the rate table of the insurer regardless of any discounting factor or
price markup whereas the actual premium is the exact amount the insured finally pays
that include all discounting factors and price markups. The main discounting factor and
price markup for insurance premium is the bonus-malus coefficient(henceforth, BMC),
through which the experience rating operates. We can see that the base premiums of the
treatment group and the control group keep almost the synchronous movement before
and after the two-stages reform from figure 1. On the contrary, we see sharp declines
for the actual premium of the treatment group after the reform and there are no
significant drops for the control group in figure 2. This shows that the pricing reform
decreases the actual premium of the treatment group significantly as compared to the
control group.
The reform in Shenzhen hence provides us an opportunity to use the methodology of
difference-in-differences (henceforth, DID) that compares the effect of the reform on
the city of Shenzhen, which is affected by the reform, with the city of Foshan which is
unaffected or although affected, but not affected as much as the reform city to
investigate the effect of insurance incentives on road safety. We find that the incentive
effects of the enforcement of experience-rated premium based on past claims and on
traffic violations on accident frequency are strongly significant. We conduct a series of
robustness checks and placebo experiments to confirm the validity of our empirical
findings. The results are robust to the inclusion of automobile controls, alternative
definitions for accident frequency and the placebo tests. We also find that the results for
experienced-rated premium based on traffic violations are more robust and conclusive
than on past claims. Our paper also adds to the idea that whether the increase in
3
insurance incentives has impact on accident severity and we find that the effect is
insignificant.
Figure 1. Base premium during insurane period. This figure depicts the time series
for the base premium (in thousands of Chinese currency yuan), which is shown in the
rate table of the insurer regardless of any discounting factor or price markup.
Figure 2. Actual premium during insurance period. This figure depicts the time
series for the actual premium, which is the exact amount the insured finally pays that
include all discounting factors and price markups. The main discounting factor and
first stage reform second stage reform
2.5
33.5
44.5
5
base
pre
miu
m
2009m1 2010m1 2011m3 2011m10 2012m11year & month
Treatment group Control group
Note:in thousands of Chinese currency yuan
first stage reform second stage reform
22.5
33.5
actu
al pre
miu
m
2009m1 2010m1 2011m3 2011m10 2012m11year & month
Treatment group Control group
Note:in thousands of Chinese currency yuan
4
price markup for insurance premium is the bonus-malus coefficient, through which the
experience rating operates.
The remainder of this paper is organized as follows. Section 2 gives details on
institutional background on the research setting. In section 3 we discuss the data, the
summary statistics, and the methodology. Section 4 presents the basic analysis, the
empirical results and the results for two placebo experiments. Section 5 concludes this
paper.
2、 Institutional Background
Automobile insurers in China offer almost the same contracts options to the market
under the strictly regulated pricing rules. The automobile insurance market in China
consists of two parts: one is the compulsory third party liability insurance and the other
is the commercial insurance. This paper investigates the commercial insurance. The
four main lines of commercial insurance are automobile damage & loss insurance, third
party liability insurance, theft insurance and drivers & passengers liability insurance.
Like in many other countries, insurers in China use both a priori pricing and a posteriori
pricing for the one-year insurance contracts. A priori pricing is based on the observables
by insurers whilst a posteriori pricing is based on BMC. Insurers compute the base-
premium at the start of the contract based on the observables, such as the age of the
automobile, the value of the automobile, etc. This is a priori pricing. The base-premium
should be identical across insured with the same characteristics. A posteriori pricing is
the mechanism of experience rating. Contracts can be renewed and premiums will be
revised according to the BMC, which is based on the past claims and works as
incentives for safe driving.
Although the experience-rated premium based on past claims exists in the Chinese
automobile insurance market for a long time, since there is fierce competition among
automobile insurers and they are not obliged to share the claims information in a certain
platform, the insured has no commitment to BMC because they can escape their bad
records by switching to another insurer without any punishment. The experience rating
hence is only in name in China before the reform. To promote the fairness of the pricing,
the Shenzhen Insurance Association announced that the pricing reform would be
implemented in Shenzhen. The reform has two stages: (1)Stage one started from March
1st, 2011 and premiums will be revised according to the past claims. BMC turned
steeper than before. Previously the coefficient range was from 0.7 to 1.3 and after this
stage reform it is from 0.5 to 2.0. (2) Stage two started from Oct 15th, 2011 and the
pricing will not only depend on the past claims but also on the traffic violations of the
insured. The premium mulas coefficient is from 1.1 to 1.3 depending on the degree of
the seriousness of traffic violations. It is for the first time in Chinese automobile
insurance market that insurance premium will be adjusted according to the record of
traffic violations of the insured. It is also the first time that the long-term nominal
experience rating based on past claims is put into effect finally in China. The insurers
are required by law to share the claims and traffic violations records of the insured
through the commercial automobile insurance information platform. Therefore BMC
could stick to the insured even if he or she switches to another insurer. Our analysis is
5
based on the idea that the experience rating has been put into practice in the treatment
group since the pricing reform whilst there is no meaningful experience rating in the
control group.
3、 Data and methodology
(1)Data
Our data are policy information for the two cities of Shenzhen and Foshan obtained
from one of the top three property and liability insurers in China, whose written
premium accounted for about 19% of the automobile insurance market in China in 2014.
We obtained a complete set of individual automobile policy and claims data. The data
span the years 2009-2012. During this four-year-period, insured can enter and leave the
insurer freely. To address sample selection and attrition issues, we only keep the
automobiles who stay with this insurer for four consecutive years, which makes nearly
10 percent of the whole sample. That means we employ a balanced panel for analysis,
which includes data of 20,603 automobiles after excluding missing values and there are
82,412 observations in total.
Each observation is a one-year commercial automobile insurance policy. Our sample
contain detailed policy underwriting information and claims records. The underwriting
data record the automobile’s characteristics, such as the tonnage, the age, the value, the
actual premium, and the type of the automobile. The claims data include two
dimensions: one is claim frequency and the other is claim severity during the one-year
insurance period, which can be regarded as proxies for accident history of the insured.
The claims are all based on accidents for which the insured is fully or partially
responsible. So our estimation will not be biased by the claims for which the third
party’s insurer is fully responsible.
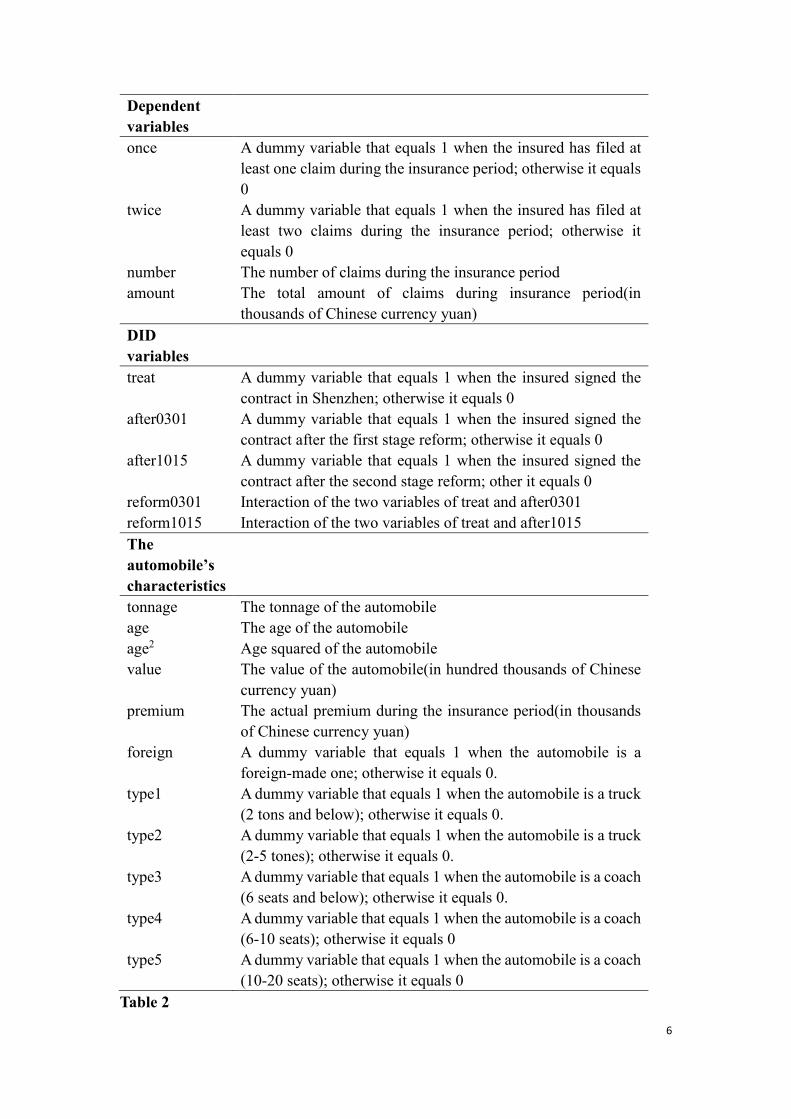
The definitions for all the variables employed in this study are shown in Table 1. Three
variables, once, twice, and number are employed to act as the proxies for accident
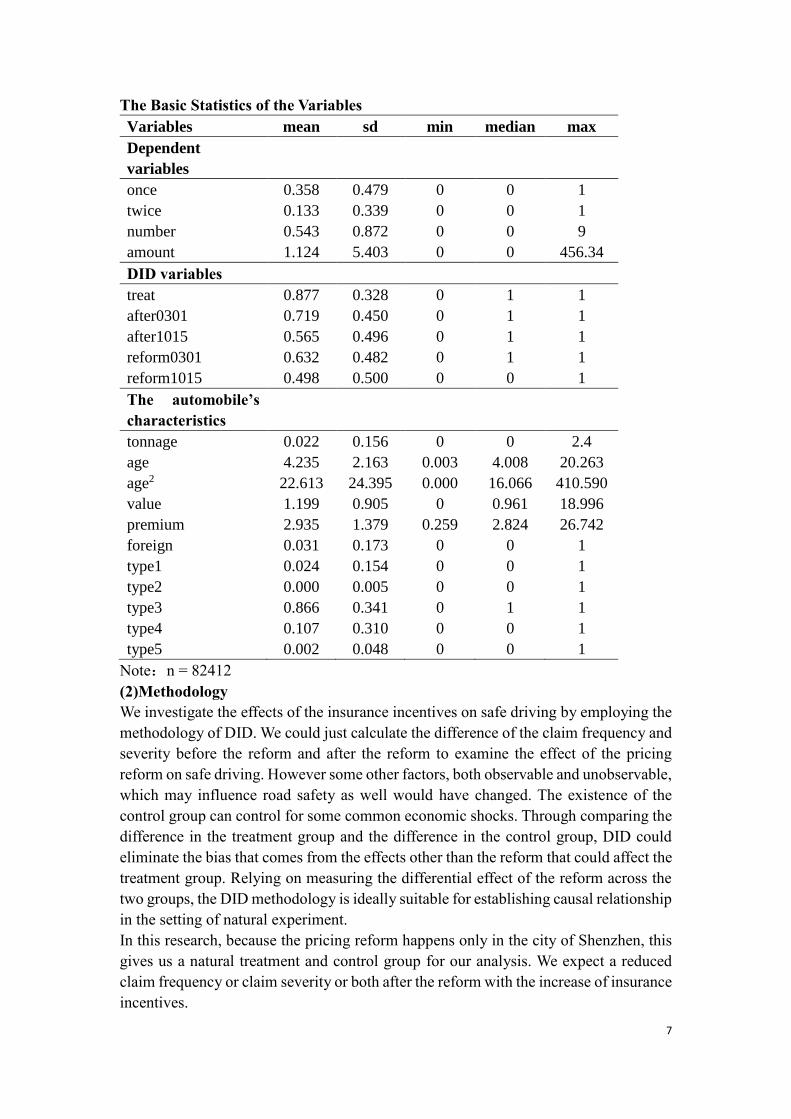
frequency and the claim severity is the proxy for accident severity. Table 2 shows the
summary statistics for each variable: the mean, standard deviation, the minimum value,
the maximum value and the number of observations. Note that the frequency of claim
at least once and twice during the insurance period is 0.358 and 0.133 respectively. The
number of claims during the insurance period is 0.543. The average claim amount is
1.124(in thousands of Chinese currency yuan), with the maximum reaching 456.340.
87.7% of the policies are proposed in Shenzhen. The policies after the reform are the
majority and the policies after the first stage reform and the second reform account for
71.9% and 56.5% of the total. If we look at the variables regarding the automobile’s
characteristics, we can see that the average tonnage of the automobile is 0.022 and the
average age is 4.235 years. Only 3.1% are foreign-made automobiles. The average
value of the automobile is 1.199(in hundred thousands of Chinese currency yuan) and
the average actual premium is 2.935(in thousands of Chinese currency yuan). Variable
type1 till type5 describes the type of the automobile and 86.6% are the regular
automobile (with 6 seats and below).
Table 1
Definitions of variables
Variables Definitions
6
Dependent
variables
once A dummy variable that equals 1 when the insured has filed at
least one claim during the insurance period; otherwise it equals
0
twice A dummy variable that equals 1 when the insured has filed at
least two claims during the insurance period; otherwise it
equals 0
number The number of claims during the insurance period
amount The total amount of claims during insurance period(in
thousands of Chinese currency yuan)
DID
variables
treat A dummy variable that equals 1 when the insured signed the
contract in Shenzhen; otherwise it equals 0
after0301 A dummy variable that equals 1 when the insured signed the
contract after the first stage reform; otherwise it equals 0
after1015 A dummy variable that equals 1 when the insured signed the
contract after the second stage reform; other it equals 0
reform0301 Interaction of the two variables of treat and after0301
reform1015 Interaction of the two variables of treat and after1015
The
automobile’s
characteristics
tonnage The tonnage of the automobile
age The age of the automobile
age2 Age squared of the automobile
value The value of the automobile(in hundred thousands of Chinese
currency yuan)
premium The actual premium during the insurance period(in thousands
of Chinese currency yuan)
foreign A dummy variable that equals 1 when the automobile is a
foreign-made one; otherwise it equals 0.
type1 A dummy variable that equals 1 when the automobile is a truck
(2 tons and below); otherwise it equals 0.
type2 A dummy variable that equals 1 when the automobile is a truck
(2-5 tones); otherwise it equals 0.
type3 A dummy variable that equals 1 when the automobile is a coach
(6 seats and below); otherwise it equals 0.
type4 A dummy variable that equals 1 when the automobile is a coach
(6-10 seats); otherwise it equals 0
type5 A dummy variable that equals 1 when the automobile is a coach
(10-20 seats); otherwise it equals 0
Table 2
7
The Basic Statistics of the Variables
Variables mean sd min median max
Dependent
variables
once 0.358 0.479 0 0 1
twice 0.133 0.339 0 0 1
number 0.543 0.872 0 0 9
amount 1.124 5.403 0 0 456.34
DID variables
treat 0.877 0.328 0 1 1
after0301 0.719 0.450 0 1 1
after1015 0.565 0.496 0 1 1
reform0301 0.632 0.482 0 1 1
reform1015 0.498 0.500 0 0 1
The automobile’s
characteristics
tonnage 0.022 0.156 0 0 2.4
age 4.235 2.163 0.003 4.008 20.263
age2 22.613 24.395 0.000 16.066 410.590
value 1.199 0.905 0 0.961 18.996
premium 2.935 1.379 0.259 2.824 26.742
foreign 0.031 0.173 0 0 1
type1 0.024 0.154 0 0 1
type2 0.000 0.005 0 0 1
type3 0.866 0.341 0 1 1
type4 0.107 0.310 0 0 1
type5 0.002 0.048 0 0 1
Note:n = 82412
(2)Methodology
We investigate the effects of the insurance incentives on safe driving by employing the
methodology of DID. We could just calculate the difference of the claim frequency and
severity before the reform and after the reform to examine the effect of the pricing
reform on safe driving. However some other factors, both observable and unobservable,
which may influence road safety as well would have changed. The existence of the
control group can control for some common economic shocks. Through comparing the
difference in the treatment group and the difference in the control group, DID could
eliminate the bias that comes from the effects other than the reform that could affect the
treatment group. Relying on measuring the differential effect of the reform across the
two groups, the DID methodology is ideally suitable for establishing causal relationship
in the setting of natural experiment.
In this research, because the pricing reform happens only in the city of Shenzhen, this
gives us a natural treatment and control group for our analysis. We expect a reduced
claim frequency or claim severity or both after the reform with the increase of insurance
incentives.

8
Accident is measured both by accident frequency and accident severity. Three variables,
namely, once, twice, and number are proxies for accident frequency whilst claim
severity is a proxy for accident severity. Because the two variables of once and twice
are binary dependent variables, panel logit model is adopted to test the effect of the
reform on the probability of whether to claim at least once and twice, which is shown
by equation (1); Since the variable of number is count number, panel poisson model is
adopted to evaluate the effect of the reform on the number of claims, which is shown
by equation(2). For accident severity, we employ OLS to test the effect of the reform
on claim severity, which is shown by equation(3).
+
( + )Pr ( , =1) ( + )
1
ln + , Pr ( , 1)(1)1
it it i t
it it i t
reform X u
it it it it i t reform X u
it it i t it it
eob once twice reform X u
e
preform X u p ob once twice
p
;
Pr ( ) ( 0,1,2, ,9)!
E(number )=Var(number )= ;
ln + (2)
it itn
itit it i
it
it it it
it it it i t
eob number n n
n
reform X u
;
In all the above equations subscripts i and t denote the automobile and the
year(from 2009 till 2012) respectively. iu is automobile fixed effects and t is year
& month fixed effects. We control for the automobile characteristics, including the
tonnage, the age, age squared, the value, the actual premium, and the type of the
automobile, summarized in the vector of X . The reason why we include the age
squared in the regression is that we wish to capture the possible non-linear effect of the
age of the automobile(i.e. both the claim frequency and the severity might initially rise
then decline with the increase of the automobile’s age).
The main explanatory variable of interest is itreform 1 , the interaction of the two
indicator variables, itreat and 0301tafter or 1015tafter . itreat captures the
differences in claiming behaviors of the treatment group and control group before the
enforcement of the reform. 0301tafter and 1015tafter captures the difference before
1
itreform is 0301itreform when evaluating the impact of the first stage reform and itreform
is 1015itreform when evaluating the impact of the second stage reform.
+ (3)it it it i t itseverity reform X u

9
and after the first stage reform and the second stage reform respectively for the control
group. itreform therefore evaluates the differential effect of the reform across
treatment group and control group. The DID methodology address the concerns of the
omitted variables that might affect both the treatment group and the control group in
the same way. The inclusion of automobile fixed effects guarantees the control of the
automobile-level heterogeneity. The year & month fixed effects account for the
aggregate shocks at macro level.
We can choose the model specification from the three models of the pooled model,
random effects model and fixed effects model to estimate the equation (1), equation (2)
and equation (3). The pooled model assumes there is no automobile fixed effects (i.e.
iu u for any automobile) and the random effects model requires that there is no
correlations between the automobile fixed effects and the model regressors, both of
which are hard to hold in reality. The fixed effects model, however, permits the possible
correlations between the regressors and the automobile fixed effects. We therefore
employ the fixed effects model to evaluate the impact of the reform on accident
frequency and accident severity using automobile-level data. The fixed effects model
cannot obtain the estimation for the parameters of the time-invariant variables, which
is the disadvantage of the panel fixed effects model.
In Equation(1) ( ) is the logistic cumulative distribution function. itonce (the
probability of claim at least once) and ittwice (the probability of claim at least twice)
are the dependent variables of interest, which are proxies for accident frequency. The
model can be estimated by conditional maximum likelihood. One disadvantage of panel
logit model is that any automobile with all positive or negative outcomes is dropped
since it will not contribute to the estimation of . For logit model, stands for the
log-odds ratio (odds ratio is also called the relative risk) instead of the marginal effects.
In our case 6237 automobiles (24948 observations from 2009 till 2012) are dropped for
the panel logit model with the dependent vatiable of itonce whilst 12720 automobiles
(50880 observations from 2009 till 2012) are dropped for the panel logit model with
the dependent variable of ittwice .
In Equation(2) itnumber (number of claims) is the dependent variable of interest,
which is also the proxy for accident frequency. We call 0it as poisson arrival rate.
For poisson model, stands for the seimi-elasticity of the reform instead of the
marginal effects. The disadvantage of the panel poisson model is that any automobile
with all zero outcomes is dropped. In our case, 5343 automobiles (21372 observations

10
from 2009 till 2012) are dropped.
In Equation(3) itseverity is the dependent variable of interest, which is the proxy for
accident severity. it is the error term following a normal distribution.
4、 The Impact of the reform on road safety
(1) Before-after analysis
In table 3 we perform the simple “pre” and “post” test by taking the time-averages
before and after the reform. We get the results both for the first stage reform and the
second stage reform. We note that once, twice, number and amount declined both after
the first stage reform and after the second stage reform. For example, the probability of
whether to claim at least once declined by 0.15 after the first stage reform. Compared
with the pre-reform mean of 0.47, this is a substantial decline. The amount of claim
declined similarly but not as much as once, twice and number. That is to say, much
acuter drops happen to claim frequency as compared to claim severity.
Table 3
“Pre” and “Post” Claim Average Test of the Reform
This table reports the pre-after analysis of the two-stage reform. First stage reform
started from Mar 1st, 2011, when insurance pricing was required by law to be based on
past claims of insured. Second stage reform started from Oct 15th, 2011, when insurance
pricing was further required to be based on traffic violations. Once, twice, number and
amount are four proxies for accident history(once, twice, and number are proxies for
accident frequency and amount is a proxy for accident severity), which stand for the
probability of claim at least once, the probability of claim at least twice, number of
claims, amount of claims during insurance period respectively. Standard errors are
reported in brackets. *** implies significance at the 99% level.
First stage Reform Second Stage Reform
before after difference before after difference
once 0.466
(0.003)
0.315
(0.002)
-0.151***
(0.004)
0.441
(0.003)
0.294
(0.002)
-0.147***
(0.003)
twice 0.207
(0.003)
0.104
(0.001)
-0.104***
(0.003)
0.189
(0.002)
0.090
(0.001)
-0.099***
(0.002)
number 0.762
(0.007)
0.457
(0.003)
-0.305***
(0.007)
0.713
(0.005)
0.412
(0.003)
-0.300***
(0.006)
amount 1.220
(0.037)
1.087
(0.022)
-0.133***
(0.042)
1.192
(0.029)
1.072
(0.025)
-0.120***
(0.038)
(2) Before-after analysis for treatment group and control group
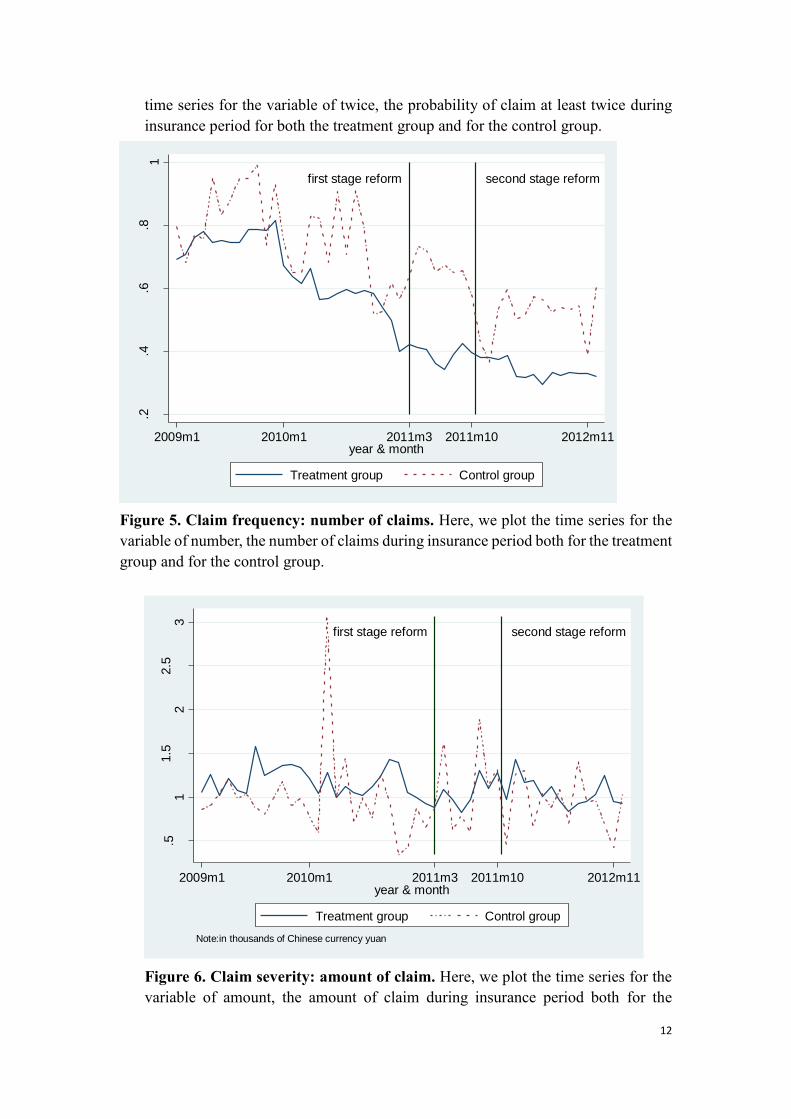
In figure 3, 4, 5, and 6 we separately plot the time series of once, twice, number, and
amount both for the treatment group and for the control group. We see that proxies for
accident frequency, namely, once, twice, and number moved in the roughly same pattern
before the first stage of reform. After the reform once, twice, number of both the
treatment group and the control group declined significantly. But the disparity between
the treatment group and the control group expands. The enlarged disparity is due to the
much more decrease of the claim frequency of the treatment group than that of the
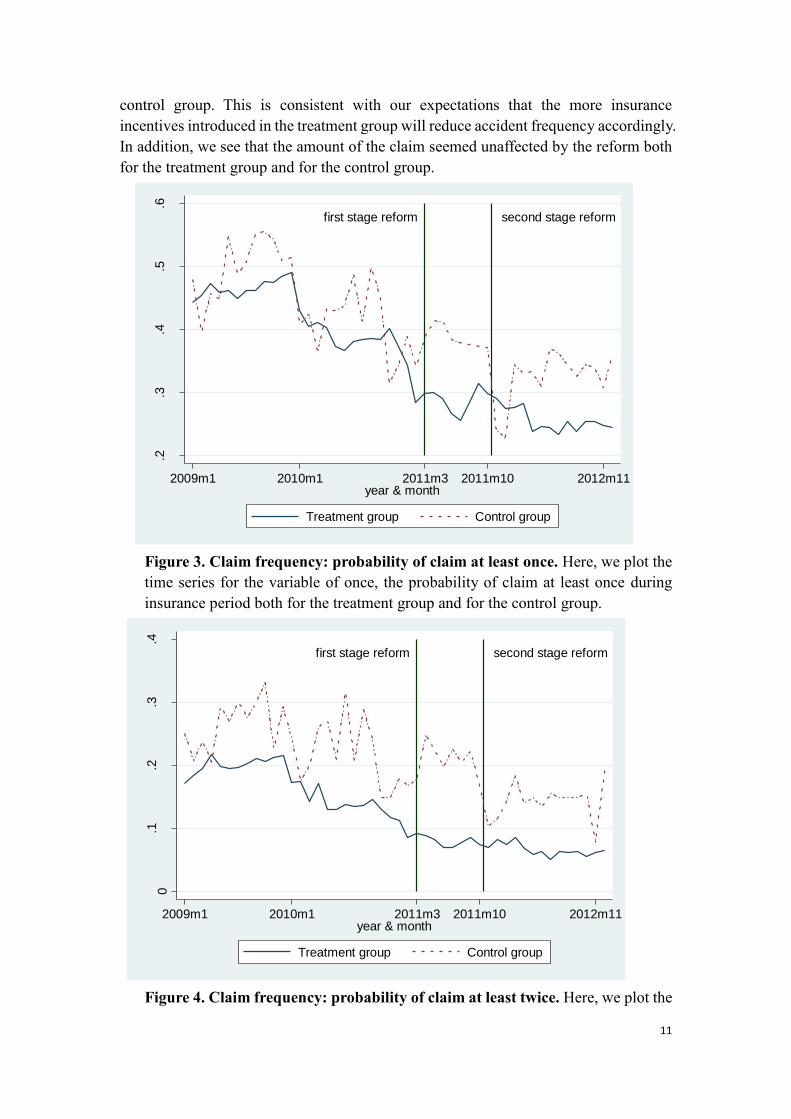
11
control group. This is consistent with our expectations that the more insurance
incentives introduced in the treatment group will reduce accident frequency accordingly.
In addition, we see that the amount of the claim seemed unaffected by the reform both
for the treatment group and for the control group.
Figure 3. Claim frequency: probability of claim at least once. Here, we plot the
time series for the variable of once, the probability of claim at least once during
insurance period both for the treatment group and for the control group.
Figure 4. Claim frequency: probability of claim at least twice. Here, we plot the
first stage reform second stage reform
.2.3
.4.5
.6
pro
bab
ility
of
whe
ther
to c
laim
at le
ast on
ce
2009m1 2010m1 2011m3 2011m10 2012m11year & month
Treatment group Control group
first stage reform second stage reform
0.1
.2.3
.4
pro
bab
ility
of
whe
ther
to c
laim
at le
ast tw
ice
2009m1 2010m1 2011m3 2011m10 2012m11year & month
Treatment group Control group
12
time series for the variable of twice, the probability of claim at least twice during
insurance period for both the treatment group and for the control group.
Figure 5. Claim frequency: number of claims. Here, we plot the time series for the
variable of number, the number of claims during insurance period both for the treatment
group and for the control group.
Figure 6. Claim severity: amount of claim. Here, we plot the time series for the
variable of amount, the amount of claim during insurance period both for the
first stage reform second stage reform
.2.4
.6.8
1
num
ber
of cla
im
2009m1 2010m1 2011m3 2011m10 2012m11year & month
Treatment group Control group
first stage reform second stage reform
.51
1.5
22.5
3
am
ount
of cla
im
2009m1 2010m1 2011m3 2011m10 2012m11year & month
Treatment group Control group
Note:in thousands of Chinese currency yuan

13
treatment group and for the control group.
Table 4 displays the averages for the treatment group and the control group, before and
after the reform, for the four abovementioned variables. The differences of mean tests
and DID estimates, which are the pooled versions of equation(1), (2), and (3) are also
provided. Panel A, Panel B, Panel C and Panel D report the results for once, twice,
number and amount respectively. As can be seen in Panel A, once declined by 0.04 and
0.03 more for the treatment group as compared to the control group for the first stage
reform and the second stage reform, respectively. In Panel B the variable of interest is
twice, it can be seen that the difference between the treatment group and the control
group declined 0.03 and 0.01, respectively. However, it is not significant for the second
stage reform. The results of number is in Panel C and it once again shows the bigger
drop for the treatment group than for the control group. Panel D reports the results for
amount of claim, which declined by 0.27 and 0.04 respectively after the first stage
reform and the second stage reform, but for the second stage reform the decline is not
statistically significant.
Table 4
“Pre” and “Post” Claim Average Test of the Reform for the Treatment Group and
the Control Group
This table reports the pre-after results both for the treatment group and for the control
group. First stage reform started from Mar 1st, 2011, when insurance pricing was
required by law to be based on past claims of insured. Second stage reform started from
Oct 15th, 2011, when insurance pricing was further required to be based on traffic
violations. Once, twice, number and amount are four proxies for accident history(once,
twice, and number are proxies for accident frequency and amount is a proxy for accident
severity), which stand for the probability of claim at least once, the probability of claim
at least twice, number of claims, amount of claims during insurance period respectively.
Standard errors are reported in brackets. *** implies significance at the 99% level.
First stage Reform Second Stage Reform
Panel A: once
before after difference before after difference
control 0.494 0.377 -0.117*** 0.477 0.356 -0.121***
(0.009) (0.006) (0.011) (0.007) (0.006) (0.010)
treatment 0.462 0.307 -0.156*** 0.435 0.285 -0.150***
(0.004) (0.002) (0.004) (0.003) (0.002) (0.004)
difference -0.031*** -0.070*** -0.039*** -0.041*** -0.071*** -0.029***
(0.010) (0.006) (0.012) (0.008) (0.007) (0.010)
before after difference before after difference
Panel B: twice
control 0.267 0.192 -0.075*** 0.262 0.173 -0.089***
(0.008) (0.005) (0.009) (0.006) (0.005) (0.008)
treatment 0.198 0.092 -0.107*** 0.178 0.078 -0.099***
(0.003) (0.001) (0.003) (0.002) (0.001) (0.002)
difference -0.068*** -0.100*** -0.032*** -0.084*** -0.095*** -0.011
(0.008) (0.004) (0.010) (0.006) (0.004) (0.007)
14
before after difference before after difference
Panel C: number
control 0.851 0.633 -0.217*** 0.832 0.584 -0.248***
(0.019) (0.011) (0.021) (0.015) (0.012) (0.019)
treatment 0.749 0.433 -0.316*** 0.695 0.389 -0.306***
(0.007) (0.003) (0.007) (0.006) (0.004) (0.006)
difference -0.102*** -0.201*** -0.099*** -0.137*** -0.195*** -0.058***
(0.020) (0.010) (0.023) (0.016) (0.011) (.021)
Panel D: amount
before after difference before after difference
control 0.947 1.051 0.104 1.067 0.983 -0.084
(0.050) (0.072) (0.116) (0.080) (0.070) (0.106)
treatment 1.260 1.092 -0.168*** 1.211 1.084 -0.127***
(0.042) (0.023) (0.045) (0.031) (0.027) (0.041)
difference 0.313*** 0.041 -0.272*** 0.144* 0.102 -0.043
(0.111) (0.067) (0.100) (0.086) (0.077) (0.114)
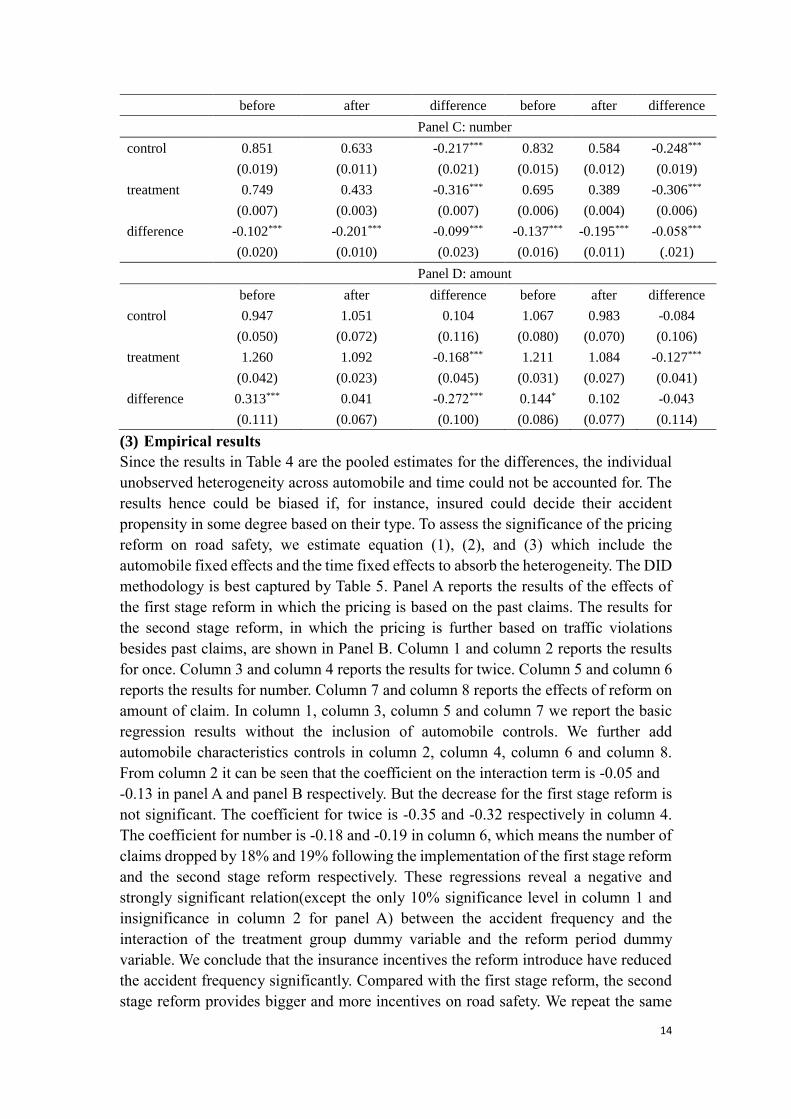
(3) Empirical results
Since the results in Table 4 are the pooled estimates for the differences, the individual
unobserved heterogeneity across automobile and time could not be accounted for. The
results hence could be biased if, for instance, insured could decide their accident
propensity in some degree based on their type. To assess the significance of the pricing
reform on road safety, we estimate equation (1), (2), and (3) which include the
automobile fixed effects and the time fixed effects to absorb the heterogeneity. The DID
methodology is best captured by Table 5. Panel A reports the results of the effects of
the first stage reform in which the pricing is based on the past claims. The results for
the second stage reform, in which the pricing is further based on traffic violations
besides past claims, are shown in Panel B. Column 1 and column 2 reports the results
for once. Column 3 and column 4 reports the results for twice. Column 5 and column 6
reports the results for number. Column 7 and column 8 reports the effects of reform on
amount of claim. In column 1, column 3, column 5 and column 7 we report the basic
regression results without the inclusion of automobile controls. We further add
automobile characteristics controls in column 2, column 4, column 6 and column 8.
From column 2 it can be seen that the coefficient on the interaction term is -0.05 and
-0.13 in panel A and panel B respectively. But the decrease for the first stage reform is
not significant. The coefficient for twice is -0.35 and -0.32 respectively in column 4.
The coefficient for number is -0.18 and -0.19 in column 6, which means the number of
claims dropped by 18% and 19% following the implementation of the first stage reform
and the second stage reform respectively. These regressions reveal a negative and
strongly significant relation(except the only 10% significance level in column 1 and
insignificance in column 2 for panel A) between the accident frequency and the
interaction of the treatment group dummy variable and the reform period dummy
variable. We conclude that the insurance incentives the reform introduce have reduced
the accident frequency significantly. Compared with the first stage reform, the second
stage reform provides bigger and more incentives on road safety. We repeat the same
15
analysis for amount of claim. The coefficient on the interaction in Column 8 of Panel A
is -0.22, which is only significant at the 10% significance level. The coefficient on the
interaction in Column 8 of Panel B is -0.11, which is not statistically significant. We
therefore conclude that the effects of the reform on accident severity is inconclusive
and insignificant.
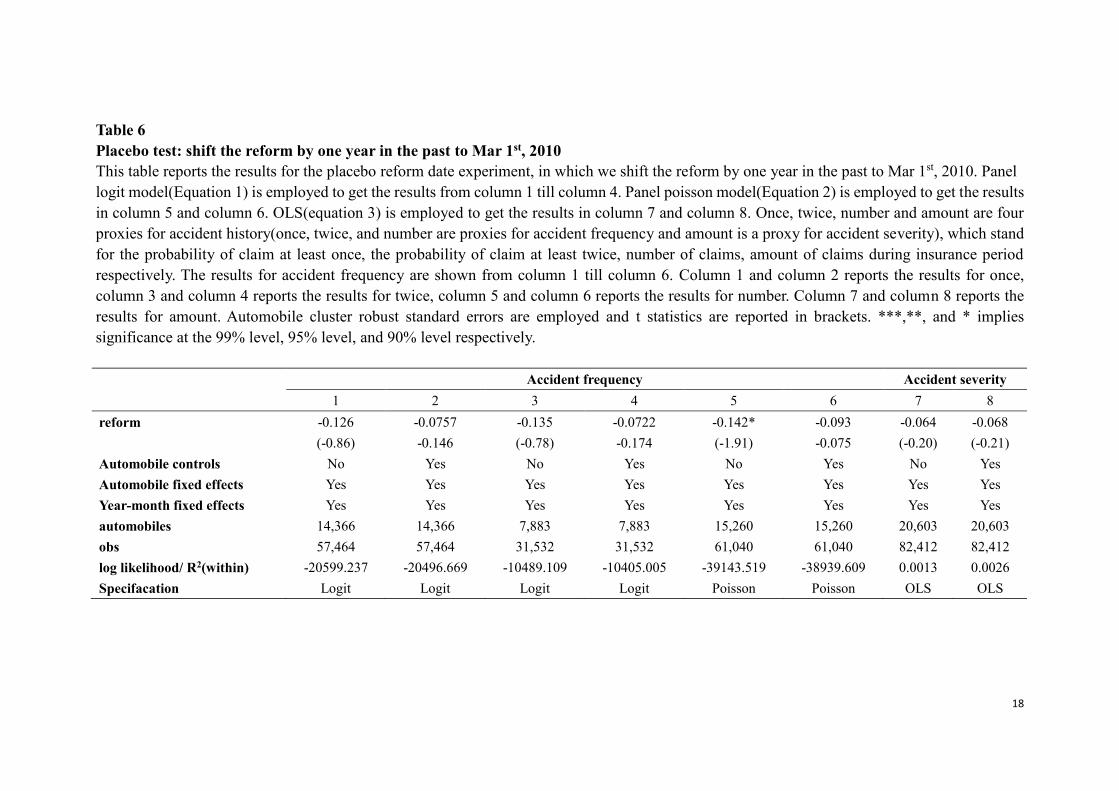
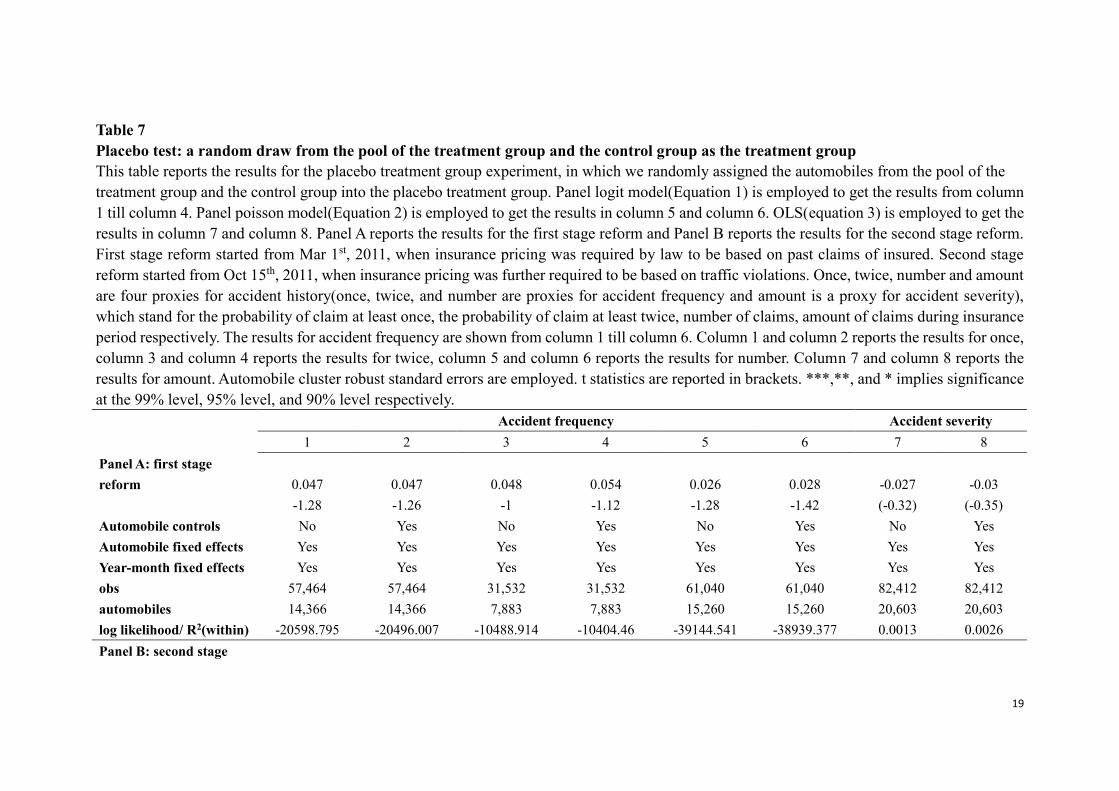
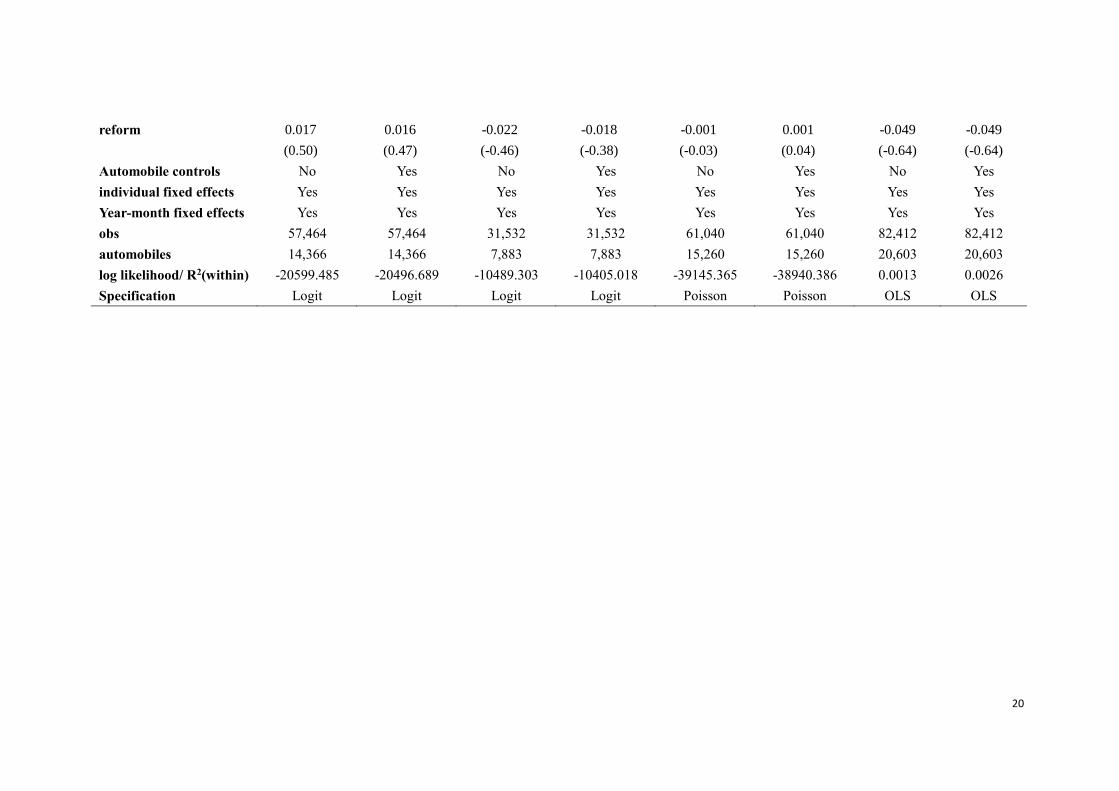
(4) Placebo Test
We rerun the regressions in table 5 and perform two placebo experiments to see whether
the empirical results we obtain in the previous section are at odds with the data. Table
6 reports the results for the placebo reform that shift the first stage reform date by one
year in the past, namely, March 1st, 2010. The reason why we do not conduct a placebo
reform that shift the second stage reform by one year in the past, namely, Oct 15, 2010,
is that the Shenzhen Insurance Association announced that it would seek advice
publicly for the forthcoming reform on Nov 4, 2010, which was very close to that date.
The driving behaviors of the public may be affected by the announcement although it
takes time for the reform to be taken into true practice. In Table 7 we further conduct a
placebo experiment where we randomly assigned the automobiles from the pool of the
treatment group and the control group into the placebo treatment group. These placebo
experiments are meant to show that the decreasing claim frequency is the effect of the
reform and not the effect of some artefact of other factors. This is confirmed by table 6
and table 7 since we do not find any significant effects both for the placebo reform
experiment and for the placebo treatment group experiment except in Table 6 the
negative coefficient on the interaction of the treatment group dummy variable and the
reform period dummy is only significant at the 10% significance level.

16
Table 5
Effects of insurance incentives on claim frequency and claim severity
This table reports the results for the significance of the reform. Panel logit model(Equation 1) is employed to get the results from column 1 till
column 4. Panel poisson model(Equation 2) is employed to get the results in column 5 and column 6. OLS(equation 3) is employed to get the
results in column 7 and column 8. Panel A reports the results for the first stage reform and Panel B reports the results for the second stage reform.
First stage reform started from Mar 1st, 2011, when insurance pricing was required by law to be based on past claims of insured. Second stage
reform started from Oct 15th, 2011, when insurance pricing was further required to be based on traffic violations. Once, twice, number and amount
are four proxies for accident history(once, twice, and number are proxies for accident frequency and amount is a proxy for accident severity),
which stand for the probability of claim at least once, the probability of claim at least twice, number of claims, amount of claims during insurance
period respectively. The results for accident frequency are shown from column 1 till column 6. Column 1 and column 2 reports the results for once,
column 3 and column 4 reports the results for twice, column 5 and column 6 reports the results for number. Column 7 and column 8 reports the
results for amount. Automobile cluster robust standard errors are employed and t statistics are reported in brackets. ***,**, and * implies
significance at the 99% level, 95% level, and 90% level respectively.
Accident frequency Accident severity
1 2 3 4 5 6 7 8
Panel A: first stage -0.107* -0.045 -0.441*** -0.353*** -0.231*** -0.182*** -0.216* -0.223*
reform (-1.85) (-0.77) (-6.69) (-5.28) (-7.80) (-6.17) (-1.67) (-1.71)
automobile controls No Yes No Yes No Yes No Yes
individual fixed effects Yes Yes Yes Yes Yes Yes Yes Yes
Year-month fixed effects Yes Yes Yes Yes Yes Yes Yes Yes
Number of Automobiles 14,366 14,366 7,883 7,883 15,260 15,260 20,603 20,603
observations 57,464 57,464 31,532 31,532 61,040 61,040 82,412 82,412
log likelihood/ R2(within) -20597.903 -20496.504 -10467.112 -10391.221 -38984.09 -38831.43 0.0014 0.0026
Panel B: second stage -0.173*** -0.129** -0.388*** -0.321*** -0.238*** -0.192*** -0.067 -0.109
reform (-3.46) (-2.55) (-6.41) (-5.22) (-8.63) (-6.98) (-0.59) (-0.96)
Automobile controls No Yes No Yes No Yes No Yes
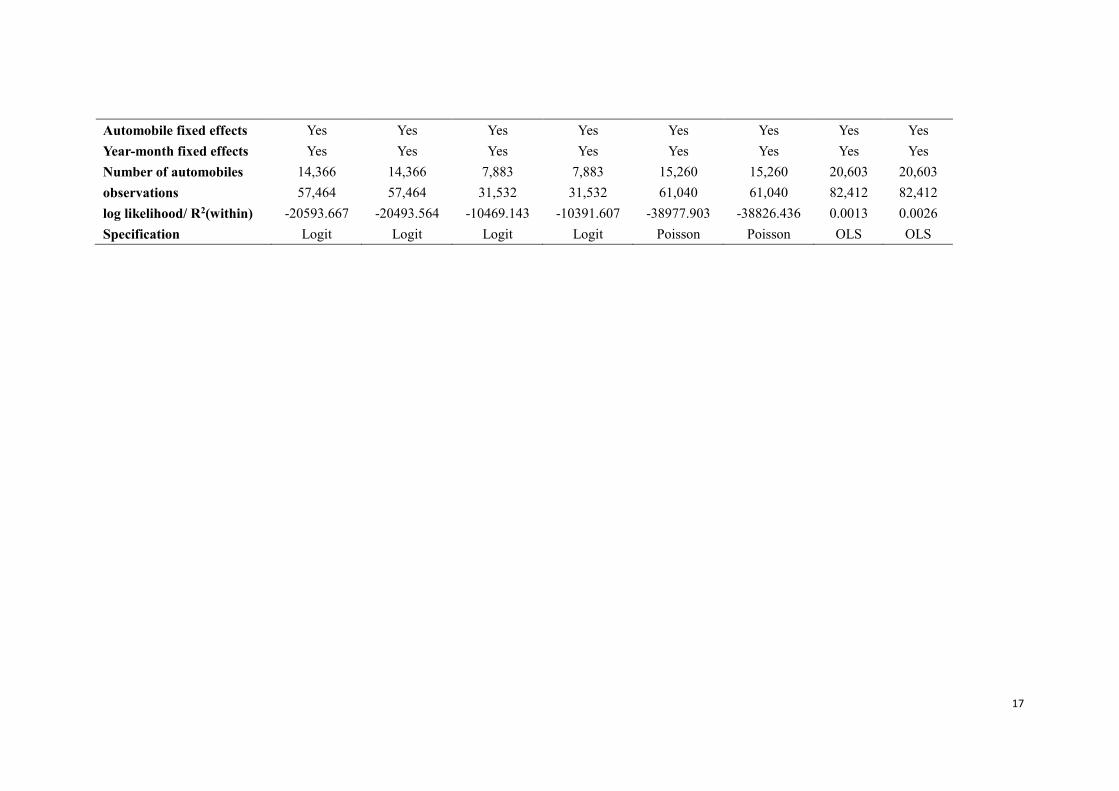
17
Automobile fixed effects Yes Yes Yes Yes Yes Yes Yes Yes
Year-month fixed effects Yes Yes Yes Yes Yes Yes Yes Yes
Number of automobiles 14,366 14,366 7,883 7,883 15,260 15,260 20,603 20,603
observations 57,464 57,464 31,532 31,532 61,040 61,040 82,412 82,412
log likelihood/ R2(within) -20593.667 -20493.564 -10469.143 -10391.607 -38977.903 -38826.436 0.0013 0.0026
Specification Logit Logit Logit Logit Poisson Poisson OLS OLS
18
Table 6
Placebo test: shift the reform by one year in the past to Mar 1st, 2010
This table reports the results for the placebo reform date experiment, in which we shift the reform by one year in the past to Mar 1st, 2010. Panel
logit model(Equation 1) is employed to get the results from column 1 till column 4. Panel poisson model(Equation 2) is employed to get the results
in column 5 and column 6. OLS(equation 3) is employed to get the results in column 7 and column 8. Once, twice, number and amount are four
proxies for accident history(once, twice, and number are proxies for accident frequency and amount is a proxy for accident severity), which stand
for the probability of claim at least once, the probability of claim at least twice, number of claims, amount of claims during insurance period
respectively. The results for accident frequency are shown from column 1 till column 6. Column 1 and column 2 reports the results for once,
column 3 and column 4 reports the results for twice, column 5 and column 6 reports the results for number. Column 7 and column 8 reports the
results for amount. Automobile cluster robust standard errors are employed and t statistics are reported in brackets. ***,**, and * implies
significance at the 99% level, 95% level, and 90% level respectively.
Accident frequency Accident severity
1 2 3 4 5 6 7 8
reform -0.126 -0.0757 -0.135 -0.0722 -0.142* -0.093 -0.064 -0.068
(-0.86) -0.146 (-0.78) -0.174 (-1.91) -0.075 (-0.20) (-0.21)
Automobile controls No Yes No Yes No Yes No Yes
Automobile fixed effects Yes Yes Yes Yes Yes Yes Yes Yes
Year-month fixed effects Yes Yes Yes Yes Yes Yes Yes Yes
automobiles 14,366 14,366 7,883 7,883 15,260 15,260 20,603 20,603
obs 57,464 57,464 31,532 31,532 61,040 61,040 82,412 82,412
log likelihood/ R2(within) -20599.237 -20496.669 -10489.109 -10405.005 -39143.519 -38939.609 0.0013 0.0026
Specifacation Logit Logit Logit Logit Poisson Poisson OLS OLS
19
Table 7
Placebo test: a random draw from the pool of the treatment group and the control group as the treatment group
This table reports the results for the placebo treatment group experiment, in which we randomly assigned the automobiles from the pool of the
treatment group and the control group into the placebo treatment group. Panel logit model(Equation 1) is employed to get the results from column
1 till column 4. Panel poisson model(Equation 2) is employed to get the results in column 5 and column 6. OLS(equation 3) is employed to get the
results in column 7 and column 8. Panel A reports the results for the first stage reform and Panel B reports the results for the second stage reform.
First stage reform started from Mar 1st, 2011, when insurance pricing was required by law to be based on past claims of insured. Second stage
reform started from Oct 15th, 2011, when insurance pricing was further required to be based on traffic violations. Once, twice, number and amount
are four proxies for accident history(once, twice, and number are proxies for accident frequency and amount is a proxy for accident severity),
which stand for the probability of claim at least once, the probability of claim at least twice, number of claims, amount of claims during insurance
period respectively. The results for accident frequency are shown from column 1 till column 6. Column 1 and column 2 reports the results for once,
column 3 and column 4 reports the results for twice, column 5 and column 6 reports the results for number. Column 7 and column 8 reports the
results for amount. Automobile cluster robust standard errors are employed. t statistics are reported in brackets. ***,**, and * implies significance
at the 99% level, 95% level, and 90% level respectively.
Accident frequency Accident severity
1 2 3 4 5 6 7 8
Panel A: first stage
reform 0.047 0.047 0.048 0.054 0.026 0.028 -0.027 -0.03
-1.28 -1.26 -1 -1.12 -1.28 -1.42 (-0.32) (-0.35)
Automobile controls No Yes No Yes No Yes No Yes
Automobile fixed effects Yes Yes Yes Yes Yes Yes Yes Yes
Year-month fixed effects Yes Yes Yes Yes Yes Yes Yes Yes
obs 57,464 57,464 31,532 31,532 61,040 61,040 82,412 82,412
automobiles 14,366 14,366 7,883 7,883 15,260 15,260 20,603 20,603
log likelihood/ R2(within) -20598.795 -20496.007 -10488.914 -10404.46 -39144.541 -38939.377 0.0013 0.0026
Panel B: second stage
20
reform 0.017
(0.50)
0.016
(0.47)
-0.022
(-0.46)
-0.018
(-0.38)
-0.001
(-0.03)
0.001
(0.04)
-0.049
(-0.64)
-0.049
(-0.64)
Automobile controls No Yes No Yes No Yes No Yes
individual fixed effects Yes Yes Yes Yes Yes Yes Yes Yes
Year-month fixed effects Yes Yes Yes Yes Yes Yes Yes Yes
obs 57,464 57,464 31,532 31,532 61,040 61,040 82,412 82,412
automobiles 14,366 14,366 7,883 7,883 15,260 15,260 20,603 20,603
log likelihood/ R2(within) -20599.485 -20496.689 -10489.303 -10405.018 -39145.365 -38940.386 0.0013 0.0026
Specification Logit Logit Logit Logit Poisson Poisson OLS OLS
21
6、Conclusion
This paper exploits a natural experiment in China, namely, a reform in Shenzhen
automobile insurance market to investigate the effects of insurance incentive
mechanisms on road safety. The approach taken in this paper permits a unique
identification of the causal effect of insurance incentives on safe driving. We take
advantage of the fact that only Shenzhen in the province of Guangdong introduced the
new pricing mechanism. Arguing that the treatment, i.e., introducing the new pricing
mechanism is exogenous, we can use the difference-in-differences approach to obtain
the causal effect of the insurance incentives on road safety. We find strong behavioral
effects of the reform. The results show that increasing the insurance incentives can
reduce the accident frequency. This conclusion is robust to alternative definitions for
accident frequency. The conclusion also passes the placebo experiments. Moreover, we
find that the effect of the second stage reform is more robust and conclusive as
compared to the first stage reform, which means that basing pricing on traffic violations
has the bigger incentive effects on safe driving than on past claims. The possible reason
is due to the presence of the asymmetric learning when the insured learn about their risk
by observing their accidents more rapidly than the insurer who can only observe the
claims instead of the accidents. Although being implemented with great difficulty
before the true set-up of the commercial automobile insurance information platform,
the experience-rated premium based on past claims has existed in China for a long time
and it is nothing new to the insured when it is put into effect by law. The insured has
enough time to learn and hence we see the comparatively smaller effects of the first
stage reform. Conversely, the experience-rated premium based on traffic violations is
completely new to insured. Hence the impact of basing pricing on traffic violations is
bigger than on past claims. We also evaluate the effects of the insurance incentives on
accident severity and we find that the effects are insignificant.
References
Abbring, J., P.A.Chiappori, and J.Pinquet, 2003, Moral Hazard and Dynamic Insurance
Data, Journal of the European Economic Association, 1(4): 767–820.
Arrow,K.,1963, Uncertainty and the Welfare Economics of Medical Care, American
Economic Review, 53(5): 941-973.
Bourgeon, J.M., and P.Picard, 2007, Point-Record Driver’s License and Road Safety:
An Economic Approach, Journal of Public Economics, 91, 235-258.
Boyer, M., and G. Dionne, 1989, An empirical analysis of Moral Hazard and Experience
Rating, The Review of Economics and Statistics, 71: 128-134.
Castillo-Manzano, J.I., and M. Castro-Nuño, 2012, Driving Licenses based on Points
Systems: Efficient Road Safety Strategy or Latest Fashion in Global Transport
Policy? A Worldwide Meta-analysis, Transport Policy, 21: 191-201.
Chiappori, P.A., and B.Salanié, 2000, Testing for Asymmetric Information in Insurance
Markets, Journal of Political Economy, 108(1):56-78.
Cohen,A., 2005, Asymmetric Information and Learning in the Automobile Insurance
Market, Review of Economics and Statistics, 87(2):197-207.
Cohen, A., and R. Dehejia, 2004, The Effect of Automobile Insurance and Accident

22
Liability Laws on Traffic Fatalities, Journal of Law and Economics, 47(2): 357-
393, 2004.
Cummins, D., R.Phillips, and M.Weiss, 2001, The Incentive Effects of No-Fault
Automobile Insurance, Journal of Law and Economics, 44(2):427-464.
Dionne,G, J.Pinquet, M.Maurice, and C.Vanasse, 2011, Incentive Mechanisms for Safe
Driving: A Comparative Analysis With Dynamic Data, Review of Economics and
Statistics, 93(1):218-227.
Dionne,G., P.C.Michaud, and J.Pinquet, 2013, A Review of Recent Theoretical and
Empirical Analyses of Asymmetric Information in Road Safety and Automobile
Insurance, Research in Transportation Economics, 43(1):85-97.
Israel,M., 2004, Do We Drive More Safely When Accidents are More Expensive?
Identifying Moral Hazard from Experience Rating Schemes,
http://www.econstor.eu/handle/10419/23472.
Li, C.S., C.C.Liu, and J.H.Yeh, 2007, The Incentive Effects of Increasing Per-claim
Deductible Contracts in Automobile Insurance, Journal of Risk and Insurance,
74(2):441-459.
Wang, J.L., C.F.Chung, and L.Y.Tzeng, 2008, An Empirical Analysis of the Effects of
Increasing Deductibles on Moral Hazard, Journal of Risk and Insurance,
75(3):551-566.