Embed Size (px)
Citation preview

Walton County School District5-Year Facilities Work Plan
2015-2020
September 15, 2015

Work Plan Considerations
• The Five-Year Facilities Work Plan submitted to FL DOE by October 1st
• Facilities Department can make adjustments to the Work Plan as directed by the School Board

5-Year Facilities Work PlanSchool Boards are required to adopt annual 5-Year Work Plans to address facilities needs for students. These plans are developed in accordance with the following:
• Demographic, revenue, and education estimating conferences are the basis of the plan as provided by the State
• Coordination with local governments to determine potential growth impacts on school facilities.
• Planning the expansions or closures of existing school sites. • Projected major repairs, renovations, and new construction.• Capital Outlay budget is prepared annually and financially feasible. • Relocatable/modular replacement plans are considered.
Note: Historical data indicates the District’s available revenue and student growth will surpass state estimates.

5-Year Facilities Work PlanSection Outline
• Expenditures• Revenue• Project Schedules• Tracking• Planning• Long Range Planning• Local Governments • Adoption / Submittal

5-Year Facilities Work PlanOutline
Expenditure Sections:• Expenditure for Maintenance, Repair and
Renovation from 1.5 Mills and PECO• Local 1.5 Mill Expenditure for Maintenance, Repair
and Renovation

5-Year Facilities Work PlanOutline
Revenue Sections :• Current / Projected Revenue Sources• PECO Revenue Source• Fair Share Revenue Source• Sales Surtax Revenue Sources• Additional Revenue Source• CO & DS Revenue Source

5-Year Facilities Work PlanOutline
Project Schedules:• Capacity Project Schedules• Other Project Schedules• Additional Project Schedules

5-Year Facilities Work PlanOutline
Capacity Tracking:• Relocatable Replacement• Charter Schools• Special Purpose Classrooms• Infrastructure • Net New Classrooms• Relocatable Student Stations• Leased Facilities • Failed Standard Relocatables

5-Year Facilities Work PlanOutline
Planning:• Class Size Reduction Planning • School Closure Planning
Long Range Planning:• Ten &Twenty-Year Maintenance and Repair • Ten & Twenty-Year Capacity• Ten & Twenty-Year Planned Utilization• Ten & Twenty-Year Infrastructure Planning

5-Year Facilities Work PlanOutline
Local Governments:• City of DeFuniak Springs• City of Freeport• City of Paxton• Walton County

Walton County Growth Trends

Walton County Residential Building Permits
2009 - July 2015Year # of Dwelling Units
2009 231
2010 388
2011 552
2012 872
2013 1,187
2014 1,076
2015 (through July) 773

Certificates of Occupancy
The following are certificates of occupancy for residential dwelling units issued by the Walton County Building Department from July 2004 through July 2015. Most newly constructed residential developments are south of Choctawhatchee Bay:• 82% issued to South Walton• 11% issued to Freeport area• 7% issued to North Walton(Caveat: These numbers include multi-family units, and the multi-family units are probably under reported.)

Residential Certificates of Occupancy July 2004 – July 2015
Year Region Totals
North Walton Central Walton South Walton
2004, July-Dec 33 64 506 603
2005 45 78 930 1,053
2006 107 81 878 1,066
2007 113 171 734 1,018
2008 81 90 473 644
2009 45 57 245 347
2010 18 24 185 227
2011 17 74 283 374
2012 39 72 568 679
2013 28 93 809 930
2014 33 70 852 955
2015, July 24 43 422 489
Cumulative Regional Totals,# & %
583 (7%) 917 (11%) 6,885 (82%) 8,385

Walton County School DistrictStudent Population

Six Year Student Growth: May 2009 – May 2015School Year Change
May 2009 May 2010 May2011
May2012
May2013
May2014
May2015
Student Growth Since May 2009
% of District Growth by Region Since May 2009
South WaltonBay Elementary * 291 331 314 315 309 325 330 +39
Butler Elementary * 709 801 877 904 909 925 977 +268
Emerald Coast Middle 332 346 359 504 636 693 771 +439
South Walton High 539 570 561 550 532 528 580 +60
Region Totals: 1,871 2,048 2,111 2,273 2,386 2,471 2,658 +806 (+64%)
Freeport
Freeport Elementary* 587 570 602 536 558 616 633 +76
Freeport Middle 283 280 274 389 430 426 464 +181
Freeport High 346 359 321 324 333 312 352 +6Region Totals: 1,216 1,209 1,197 1,249 1,321 1,354 1,479 +263 (+21%)
DeFuniak Springs
Maude Saunders Elem. 673 658 633 624 652 615 653 -20
West DeFuniak Elementary 635 605 596 625 662 664 663 +28
Walton Middle 666 635 611 605 646 657 640 -26
Walton High 663 717 751 722 656 655 684 +21Region Totals: 2,637 2,615 2,591 2,576 2,616 2,591 2,640 +3 (0%)
North/West Central Walton
Mossy Head Elementary 260 270 299 320 309 318 347 +87
Paxton 602 630 621 635 626 671 714 +112Region Totals: 862 900 920 955 935 989 1,061 +199 (+16%)
District Totals: 6,586 6,772 6,819 6,854 7,258 7,405 7,808 +1,271 (100%)

Recent Increases in Student Population
• From May 2015 to September 2015 district has added 517 students: 297 students in South Walton 62 students in Freeport area 158 students in North Walton
• District is monitoring student growth very closely
• Five Year Work Plan can be modified to address emerging growth trends

Student Population: September 4, 2015
School PK KG 1 2 3 4 5 6 7 8 9 10 11 12OT School TotalBay Elementary School 1 86 62 76 82 61 0 0 0 0 0 0 0 0 0 368Chautauqua School 0 0 0 0 0 0 0 0 0 0 0 0 0 5 0 5Emerald Coast K12 0 0 0 0 0 0 0 1 1 1 0 0 0 2 0 5Emerald Coast Middle School 0 0 0 0 0 0 228 221 199 201 0 0 0 0 0 849Emerald Coast Technical College 0 0 0 0 0 0 0 0 0 0 0 0 0 0 117 117Freeport Elementary 47 113 126 120 107 125 0 0 0 0 0 0 0 0 0 638Freeport High School 0 0 0 0 0 0 0 0 0 0 127 108 84 84 0 403Freeport Middle School 0 0 0 0 0 0 107 117 118 111 0 0 0 0 0 453Maude Saunders Elementary 0 117 115 124 117 101 97 0 0 0 0 0 0 0 0 671Mossy Head Elementary 24 42 70 61 56 45 37 0 0 0 0 0 0 0 0 335Paxton School 20 52 45 58 52 57 74 66 63 58 60 57 54 45 0 761South Walton High 0 0 0 0 0 0 0 0 0 0 219 169 161 140 0 689Van R Butler Elementary 106 175 183 213 191 180 0 0 0 0 0 0 0 0 0 1049Walton Alt Learning Center 0 0 0 0 0 0 0 0 0 0 0 0 0 0 0 0Walton County Jail Prog 0 0 0 0 0 0 0 0 0 0 1 2 0 0 0 3Walton High School 1 0 0 0 0 0 0 0 0 0 227 212 187 151 0 784Walton Initiative 85 0 0 0 0 0 0 0 0 0 0 0 0 0 0 85Walton Learning Center 0 0 0 0 0 0 0 0 0 4 15 8 3 1 0 31Walton Middle School 0 0 0 0 0 0 0 228 216 189 0 0 0 0 0 633West Defuniak Elementary 1 115 115 125 113 103 103 0 0 0 0 0 0 0 0 675* Non-Charter School Totals 285 700 716 777 718 672 646 633 597 564 649 556 489 428 117 8554
CHARTER SCHOOLSSeaside Neighborhood School 0 0 0 0 0 0 42 44 44 40 43 44 34 16 0 307Walton Academy & The Pathways Program 0 0 0 0 0 0 0 4 24 35 35 23 25 13 0 159* Charter School Totals 0 0 0 0 0 0 42 48 68 75 78 67 59 29 0 466
VIRTUAL SCHOOLSWalton Virtual School 0 0 0 0 0 0 0 1 0 1 1 3 4 3 0 13* Virtual School Totals 0 0 0 0 0 0 0 1 0 1 1 3 4 3 0 13
** District Totals ** 285 700 716 777 718 672 688 682 665 640 728 626 552 460 117 9033

Student Growth ProjectionsDOE - COFTE Projections
2015-16 2016-17 2017-18 2018-19 2019-20
7,969 8,211 8,455 8,744 8,995
• This year’s COFTE (Capital Outlay Full Time Equivalent) projections indicate a District-wide 1,026 student increase between 2015-16 and 2019-20.
• Walton County School District has experienced positive student growth over the past
five years. This trend is expected to continue.
• COFTE projections are based on a cohort survival method, which is based largely upon live births and deaths. To ensure accuracy, this method must be modified in districts experiencing rapid in-migration and robust new residential development – which the Walton School District has experienced over the past few years.
• These COFTE numbers include only pre-school children with disabilities (ESE) and pre-school age children whose parents are in the Teenage Parent Program. It does not include children in the District’s Voluntary Pre-K program.

Walton County School DistrictSchool Capacities
F.I.S.H.(Student Stations)


School Capacities by Student Stations
North Walton
School9-4-15
EnrollmentPermanent Capacity
& PercentageRelocatable Capacity
& Percentage
Maude Saunders Elementary 671 668 (100%) 812 (83%)West DeFuniak Elementary 675 662 (102%) 716 (94%)Mossy Head School 335 549 (61%) N/AWalton Middle 639 938 (68%) N/AWalton High 784 1,079 (73%) N/APaxton School 763 907 (84%) 959 (80%)
FreeportFreeport Elementary 638 787 (81%) N/AFreeport Middle 453 732 (62%) 776 (58%)Freeport High 403 741 (54%) N/A
South WaltonBay Elementary 368 286 (135%) 394 (93%)Butler Elementary 1,049 1,030 (102%) 1,246 (84%)Emerald Coast Middle 849 1,020 (83%) N/ASouth Walton High 689 739 (93%) N/A

Walton County School DistrictBond Issues - Debt Service
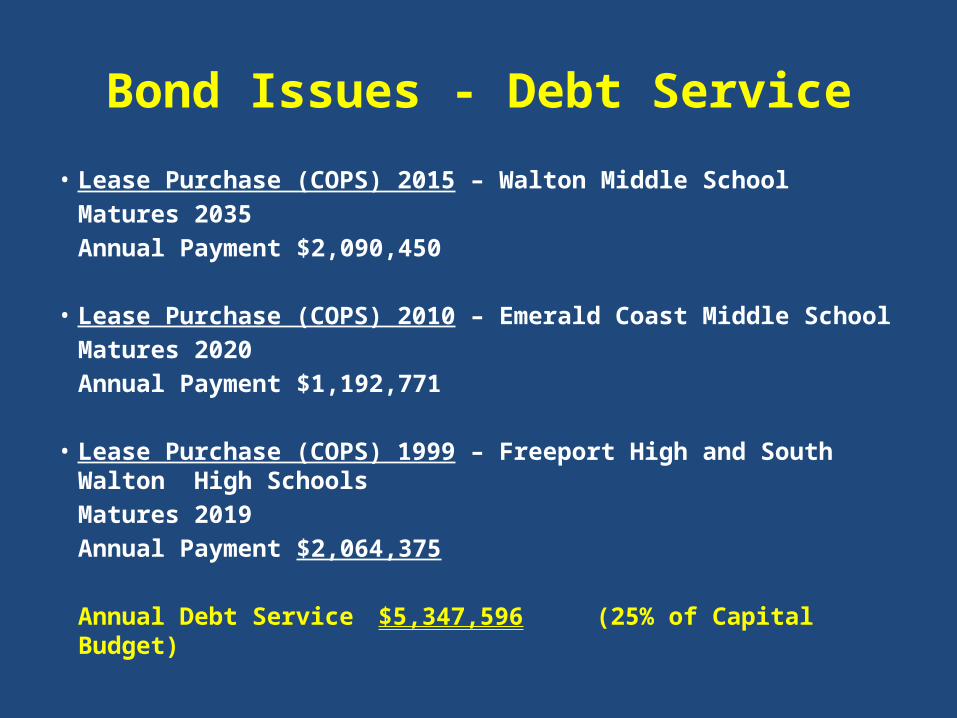
Bond Issues - Debt Service
• Lease Purchase (COPS) 2015 – Walton Middle School Matures 2035Annual Payment $2,090,450
• Lease Purchase (COPS) 2010 – Emerald Coast Middle School Matures 2020Annual Payment $1,192,771
• Lease Purchase (COPS) 1999 – Freeport High and South Walton High
SchoolsMatures 2019Annual Payment $2,064,375
Annual Debt Service $5,347,596 (25% of Capital Budget)

Walton County Property Values

Walton County Property Values
2004 - 2015
2004 8,157,752,492 2005 12,823,805,149 2006 16,264,761,110 2007 17,419,405,194 2008 16,729,382,232 2009 14,032,423,460 2010 11,715,722,283 2011 11,203,884,621 2012 11,237,782,014 2013 11,912,678,553 2014 13,359,897,363 2015 15,149,432,487

ConstructionRecommendations
(Proposed Schedule)2015 - 2020

SCHOOL/PROJECT 2015-16 2016-17 2017-18 2018-19 2019-20
South Walton High: 9th Grade Academy w/8 classrooms 300,000 3,000,000
New School - South: Elementary School - A & E Planning 1,100,000 Elementary School - Construction (COPS) 10,000,000 16,000,000
Bay Elementary School: Renovation / Safety / Parking 800,000 Pre-K Center 1,000,000
Freeport School - Hammock Bay: Architectural Design - Master Plan 250,000 Intermediate School - Construction 2,000,000 12,000,000 12,000,000
Freeport Transportation: Site Work - Ph I 2,000,000 Construction / Buildings - Ph II 2,000,000
Freeport Middle School: Renovation / ESE Center / Pre-K 1,000,000

SCHOOL/PROJECT 2015-16 2016-17 2017-18 2018-19 2019-20
Walton Middle School: Construction (COPS) 12,000,000 18,000,000
Maude Saunders Elementary: Planning 350,000 8 Classroom Addition/Renovation
Paxton School: Computer Lab/Classrooms 1,500,000
Walton High School: Athletic Complex - Phase II 2,000,000 Complex - Phase III 2,000,000
Emerald Cost Technical College: Career & Tech Education Programs 1,000,000
District - Wide: Technology Upgrades 2,300,000 1,000,000 1,000,000 1,000,000 1,000,000 Safety / Security Upgrades 700,000 1,000,000 500,000 500,000 500,000 Site Drainage 50,000 50,000 50,000 50,000 50,000
Master Planning & Design Services A & E Services 350,000 350,000 400,000 400,000 400,000
TOTALS 23,300,000 33,950,000 23,950,000 13,950,000 16,800,000

Walton County School BoardUndeveloped Properties

Freeport Transportation Site

Forest View Property

Hammock Bay Property


Work Plan Considerations
• The Five-Year Facilities Work Plan submitted to FL DOE by October 1st
• Facilities Department can make adjustments to the Work Plan as directed by the School Board