Embed Size (px)
Citation preview
March 2014
WALNEY
EXTENSION
OFFSHORE
WIND FARM
Walney Extension Offshore Wind Farm
Offshore Ornithology
Clarification Note: Lesser Black-backed Gull In-combination
Collision Risk Assessment and SPA Apportioning
Walney Extension Offshore Windfarm
Clarification Note – LBBG In-combination CRM
March 2014 Page 1
Walney Extension Offshore Wind Farm
Clarification Note–Offshore Ornithology lesser black-backed gull
DONG Energy Walney Extension (UK) Ltd.
33 Grosvenor Place, Belgravia, London, SW1X 7HY
Version: 2
Date: March 2014
© DONG Energy Power (UK) Ltd., 2014. All rights reserved.
Pictures: © DONG Energy Power (UK) Ltd., 2014.
Prepared by: Ian Ellis (NIRAS Consulting Ltd)
Checked: Robin Ward (NIRAS Consulting Ltd)
Accepted: Allen Risby (DONG Energy)
Approved: Sally Holroyd (DONG Energy)
Revision history
Version Date Author History
1 06/02/2014 Ian Ellis (NIRAS) First Draft
2 03/03/2014 Allen Risby (DONG Energy) Update and finalisation
Walney Extension Offshore Wind Farm
Clarification Note – LBBG in-combination CRM
March 2014 Page 2
1. Introduction
1.1 DONG Energy Walney Extension (UK) Ltd (‘the Applicant’) made an application to the Planning
Inspectorate (PINS) in June 2013 for a Development Consent Order (DCO) for the Walney
Extension Offshore Wind Farm (‘the Project’) located in the Irish Sea.
1.2 This Paper provides further clarification on the Walney Extension ornithological impact
assessment, specifically on the information presented concerning the in-combination
assessment for lesser black-backed gull. This Paper has been prepared in response to Natural
England’s Written Representations, dated 16 December 2013; particularly Dr Alex Banks’
Expert Report paragraphs 25–29, 78-79 and 129-135.
1.3 The focus of this paper is the refinement of the analysis of the potential in-combination effect
on Morecambe Bay, Ribble & Alt Estuaries and Bowland Fells SPAs, all of which support a
qualifying feature of breeding lesser black-backed gull. The analytical refinements described in
this paper provide a more accurate and robust interpretation of the potential in-combination
effects on lesser black-backed gull than has previously been available.
1.4 The Paper makes extensive reference to the parallel analysis undertaken for Burbo Bank
Extension Offshore Wind Farm (NIRAS Consulting 2013a&b; DONG Energy 2013a, DONG Energy
2014a&b1). The analysis undertaken for the Burbo Bank Extension project considers the same
set of in-combination projects as the Walney Extension Project and also considers the same set
of lesser black-backed gull SPA colonies. The development of the analysis presented for Burbo
Bank Extension included extensive consultation with Natural England, particular focusing on
the application of several detailed analytical stages with the outcome being a robust
assessment of the potential in-combination effects on this species.
1.5 A further objective of this paper is to update the in-combination assessment using the tiered
approach recently developed by JNCC and Natural England (JNCC and Natural England, 2013a).
1.6 In summary, this paper re-evaluates the in-combination assessment carried out for lesser
black-backed gull taking into account the following:
Updated regional population data;
A more accurate understanding of the location of the breeding colony in relation to the
proposed wind farm and the likelihood that foraging birds from the colony would be
exposed to collision risk;
More accurate information about the actual effects of existing wind farms within foraging
range of the breeding colony;
Apportionment of CRM estimates to all lesser black-backed gull colonies within foraging
range;
Inclusion of apportioned CRM estimates for Gwynt y Môr, Rhyl Flats, Burbo Bank and North
Hoyle offshore wind farms;
1 Documents submitted by DONG Energy to the Burbo Bank Extension Planning Inspectorate Examination and
available on the PINS website http://infrastructure.planningportal.gov.uk/projects/north-west/burbo-bank-extension-offshore-wind-farm/

Walney Extension Offshore Wind Farm
Clarification Note – LBBG in-combination CRM
March 2014 Page 3
Formulation of a CRM for Barrow Offshore Wind Farm;
Adjustment of the predicted effects of other wind farms in light of historical changes in SPA
population size; and
Application of JNCC and Natural England’s tiered approach to addressing in-combination
effects.
2. Methodology
2.1 For transparency the assessment is undertaken and presented in a series of analytical stages.
Stages A – G all refer to methodological updates to the assessment and investigate corrections
and adjustments applied to collision risk estimates for the Project Site and other sites
considered in the in-combination assessment. Once these refinements have been undertaken,
the tiered approach to in-combination assessment suggested by JNCC and Natural England
(JNCC and Natural England, 2013a) is defined and applied to the established results at each
stage.
2.2 Collision risk estimates for the Project site are taken from the Walney Extension HRA Report2 in
the first instance and are based, according to advice from Natural England3, on Option 24 of the
Band (2012) Collision Risk Model. The Applicant does however consider that Option 3 (or the
‘extended model’) of Band (2012) provides the most mathematically advanced representation
of potential collision risk to bird species currently available. Option 3 allows for consideration
of the distribution of birds within the wide Potential Collision Height (PCH) band in contrast to
the basic Option 1 model which assumes even distribution within this area. Option 3 results
are therefore also provided in this assessment and are fully detailed within Appendices 13.1
and 13.2.
2.3 The following analytical Stages are implemented in this paper:
Stage A : Update of population data, foraging range definition and ‘as built’ scenarios of in-
combination projects;
Stage B : Investigation of breeding period definition in historic CRM assessments;
Stage C : Apportionment of CRM estimates to all colonies within foraging range;
Stage D: Apportionment of CRM estimates as presented in the Gwynt y Môr Appropriate
Assessment;
Stage E: CRM for Barrow OWF and apportionment to source colonies;
Stage F: Investigation of potential effects of breeding colony size changes on historic CRM
estimates; and
2 Annex 2 : Assigning birds to SPAs and Potential Biological Removal (DONG Energy, 2013)
3 Natural England Relevant Representations Paragraph 4.1.5 (Natural England 20 September 2013)
4 There are considered to be too few flight records for this species at the Project site during the breeding
season to support the use of option 1 (DONG Energy, 2014c)
Walney Extension Offshore Wind Farm
Clarification Note – LBBG in-combination CRM
March 2014 Page 4
Stage G: Further considerations of CRM predictions – age structure within recorded gulls.
2.4 At each stage of the analysis the collision predictions will be presented and apportioned to
each of the three relevant SPAs5 which support a breeding lesser black-backed gull qualifying
feature and for which the Project site is considered to be within mean maximum foraging range
for this species (141 km (Thaxter et al., 2012)).
2.5 Consistent with the process undertaken for Appendix 2 of the HRA Report, the estimated
magnitude of collision risk on lesser black-backed gull is assessed through Potential Biological
Removal (PBR). The PBR is updated in this report to take account of the extensive data on
annual survival now available from the Skomer colony of lesser black-backed gull (JNCC, 2013).
All other parameters used to calculate the PBR remain identical to those presented in Appendix
2 of the HRA Report.
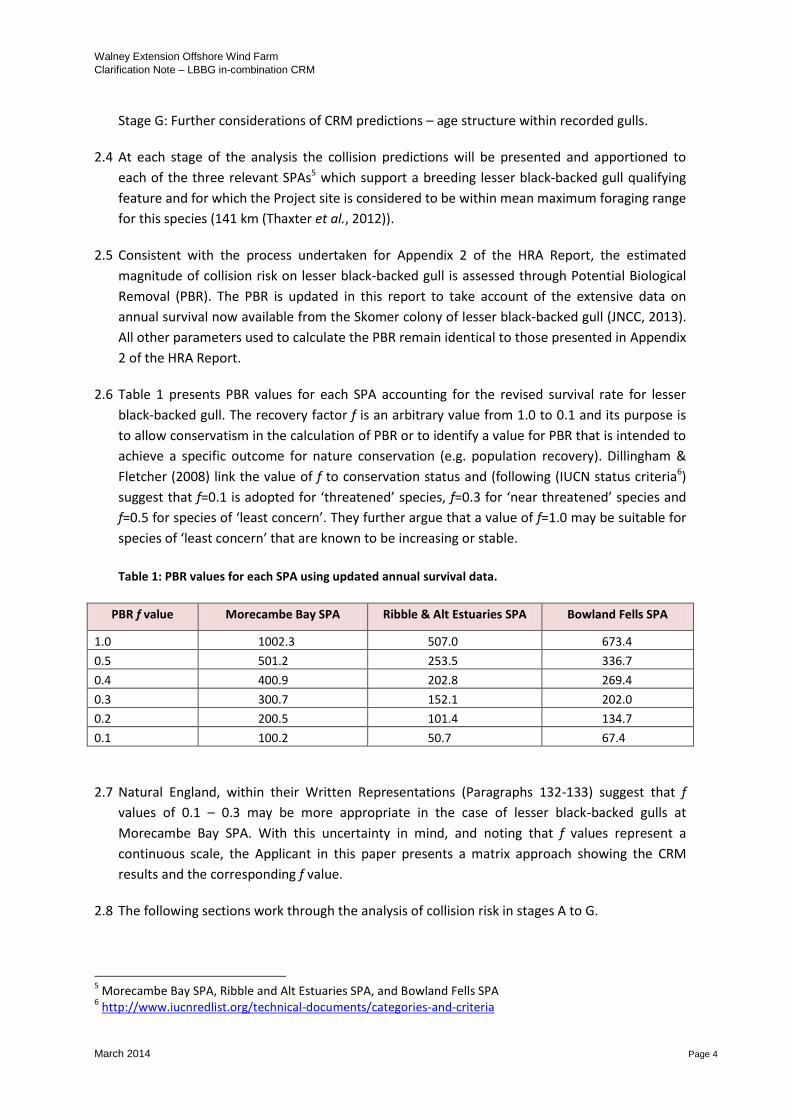
2.6 Table 1 presents PBR values for each SPA accounting for the revised survival rate for lesser
black-backed gull. The recovery factor f is an arbitrary value from 1.0 to 0.1 and its purpose is
to allow conservatism in the calculation of PBR or to identify a value for PBR that is intended to
achieve a specific outcome for nature conservation (e.g. population recovery). Dillingham &
Fletcher (2008) link the value of f to conservation status and (following (IUCN status criteria6)
suggest that f=0.1 is adopted for ‘threatened’ species, f=0.3 for ‘near threatened’ species and
f=0.5 for species of ‘least concern’. They further argue that a value of f=1.0 may be suitable for
species of ‘least concern’ that are known to be increasing or stable.
Table 1: PBR values for each SPA using updated annual survival data.
PBR f value Morecambe Bay SPA Ribble & Alt Estuaries SPA Bowland Fells SPA
1.0 1002.3 507.0 673.4
0.5 501.2 253.5 336.7
0.4 400.9 202.8 269.4
0.3 300.7 152.1 202.0
0.2 200.5 101.4 134.7
0.1 100.2 50.7 67.4
2.7 Natural England, within their Written Representations (Paragraphs 132-133) suggest that f
values of 0.1 – 0.3 may be more appropriate in the case of lesser black-backed gulls at
Morecambe Bay SPA. With this uncertainty in mind, and noting that f values represent a
continuous scale, the Applicant in this paper presents a matrix approach showing the CRM
results and the corresponding f value.
2.8 The following sections work through the analysis of collision risk in stages A to G.
5 Morecambe Bay SPA, Ribble and Alt Estuaries SPA, and Bowland Fells SPA
6 http://www.iucnredlist.org/technical-documents/categories-and-criteria
Walney Extension Offshore Wind Farm
Clarification Note – LBBG in-combination CRM
March 2014 Page 5
3. Stage A : Update of population data, foraging range definition and ‘as built’ scenarios of in-
combination projects
(i) Contemporary population data
3.1 The analysis presented in the HRA Report and Environmental Statement (DONG Energy, 2013)
apportioned collision estimates at the Project site to source colonies. To inform this analysis,
population data held within the JNCC SMP Database were used.
3.2 An atlas survey of the breeding birds of Lancashire and North Merseyside for the period 2008-
2011 (White et al. 2013), was published subsequent to the completion of the HRA Report. The
Atlas provides contemporary data on lesser black-backed gull populations not included in the
JNCC SMP database and, for some colonies, provides data that are more contemporaneous
with the date of the Project site-specific surveys. These data were considered as highly relevant
to the in-combination assessment and this complies with the overarching approach developed
with Natural England7. In some cases, White et al. (2013) count data are given for broadly
defined areas (e.g. ‘Liverpool population’) and not all or some of its constituent colonies. In
such cases, the number of breeding birds have been evenly distributed between the
constituent SMP sites, modified in accordance with any site specific information provided by
White et al. (2013). The inclusion of this updated regional population data of lesser black-
backed gulls leads to adjustment of the apportioning of collision effects predicted for the
Project site and the other wind farm sites considered in-combination.
(ii) Foraging range definition
3.3 The precise location of the breeding colony within the SPA is used to refine the understanding
of the distance between the breeding colony and the proposed wind farm and the likelihood
that birds from the colony will forage within the wind farm area. This updates previous analysis
which used the boundary of the SPA to determine foraging range.
3.4 This update is particularly relevant to Morecambe Bay SPA where the lesser black-backed gull
colony is confined to a single location (South Walney) within this extensive SPA. This allows for
greater precision in determining the likely source of lesser black-backed gulls in a given area.
3.5 In addition, at this stage, the collision risk results obtained for projects considered in-
combination have also been re-apportioned to take account of the colony size at the time of
the survey (e.g. surveys for the Ormonde offshore wind farm were undertaken in 2004 so that
apportionment is now based on the colony size during that year).
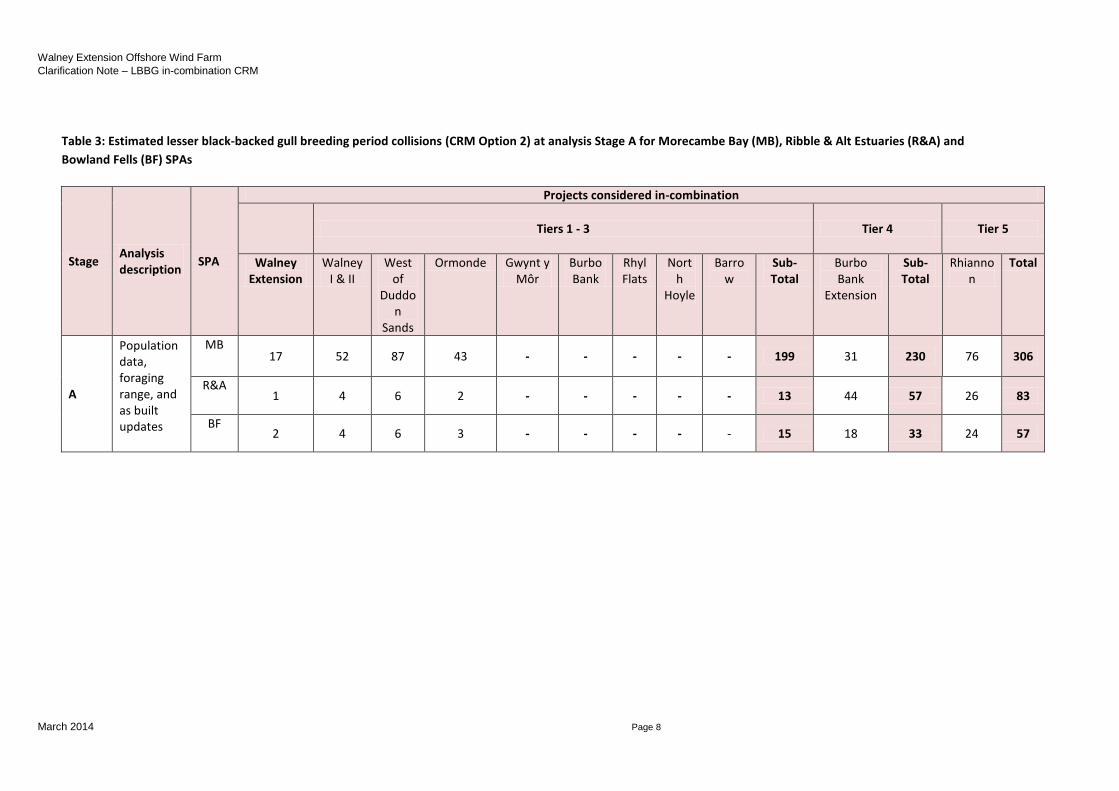
(iii) Correction of historic CRM estimates to account for revised built turbine scenarios
3.6 Collision risk estimates sourced from planning application documents were used and presented
in the HRA Report for the Project without further modification. These values were based upon
7 The Project site specific surveys covered the breeding seasons in 2011 and 2012, so colony census data
including those years are likely to be the most appropriate for the assessment of potential effects. This approach is in accordance with the advice received from Natural England.
Walney Extension Offshore Wind Farm
Clarification Note – LBBG in-combination CRM
March 2014 Page 6
collision risk modelling using turbine array design envelopes (the "Rochdale Envelope"),
typically worst case scenarios (for bird collision risk) involving the greatest rotor swept area.
3.7 Modelling outputs and the envelopes used to inform them are available for West of Duddon
Sands (RPS, 2006a) and Walney I and II (RPS, 2006b). The scenarios used in modelling for both
sites are notably different to the arrays that have actually been constructed, in both cases far
fewer turbines were constructed than had originally been proposed (and assessed in their
respective Environmental Statements). Consequently, the predicted collision risk rates of these
projects (as included in the Walney Extension HRA Report and ES Chapter 13) are significant
over-estimates.
3.8 Table 2 presents the number of turbines used in the CRMs presented in the Environmental
Statements for the West of Duddon Sands and Walney I and II offshore wind farms, and that
which was subsequently constructed. It is apparent that 3.6 MW Siemens turbines were used
in both the modelling process and subsequently then deployed at both sites.
Table 2: Walney I & II and West of Duddon Sands modelled and constructed turbine scenarios and the
resulting correction factor to be applied to the in-combination assessment.
Specification Walney I & II turbines West of Duddon Sands turbines
Rochdale Envelope modelled 152 139
As built scenario 102 108
Correction factor -32.9% -22.3%
3.9 The number of turbines constructed at Walney I and II (102) represents a 32.9% reduction from
the scenario modelled. The number of turbines being constructed at West of Duddon Sands
(108) represents a 22.3% reduction from the scenario modelled. It is assumed that a reduction
in turbines will translate into a corresponding reduction in collisions. To investigate the
relationship in the Band (2012) CRM of turbines and collision estimates experimental numbers
of turbines were entered into the model. This indicated a direct linear relationship between the
number of turbines and the collision estimates produced (i.e. if turbine number doubles,
collision risk also doubles). Therefore, for the purposes of this in-combination assessment the
predicted collision rates for Walney I&II and West of Duddon Sands are corrected by the values
given in Table 2.
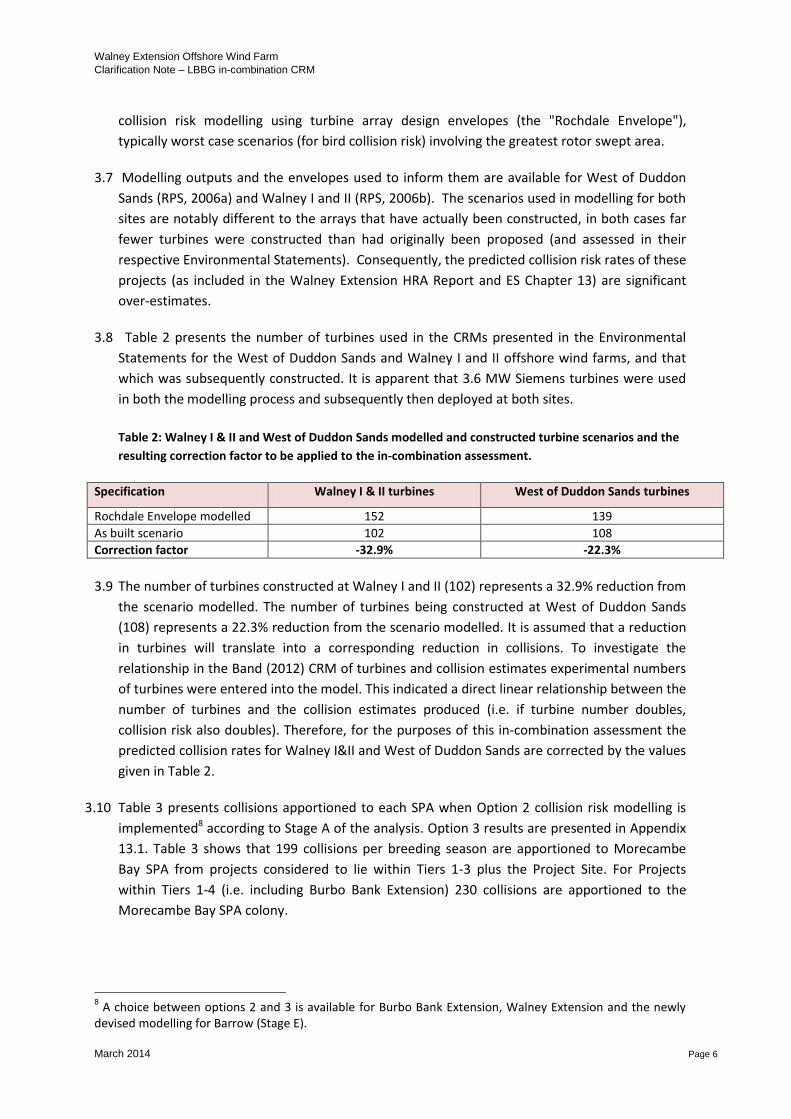
3.10 Table 3 presents collisions apportioned to each SPA when Option 2 collision risk modelling is
implemented8 according to Stage A of the analysis. Option 3 results are presented in Appendix
13.1. Table 3 shows that 199 collisions per breeding season are apportioned to Morecambe
Bay SPA from projects considered to lie within Tiers 1-3 plus the Project Site. For Projects
within Tiers 1-4 (i.e. including Burbo Bank Extension) 230 collisions are apportioned to the
Morecambe Bay SPA colony.
8 A choice between options 2 and 3 is available for Burbo Bank Extension, Walney Extension and the newly
devised modelling for Barrow (Stage E).

Walney Extension Offshore Wind Farm
Clarification Note – LBBG in-combination CRM
March 2014 Page 7
3.11 Thirteen collisions per breeding season are apportioned to Ribble & Alt Estuaries SPA from
projects considered to lie within Tiers 1-3 plus the Project Site. For Projects within Tiers 1-4 (i.e.
including Burbo Bank Extension) 57 collisions are apportioned to the SPA.
3.12 Fifteen collisions per breeding season are apportioned to Bowland Fells SPA from projects
considered to lie within Tiers 1-3 plus the Project Site. For Projects within Tiers 1-4 (i.e.
including Burbo Bank Extension) 33 collisions are apportioned to the SPA.
3.13 On day 1 of Burbo Bank Extension Issue Specific Hearing III (28th January 2014), the Examining
Authority requested clarification as to whether the analysis performed by the Applicant had
used, for those projects already operational or in-construction, the total consented capacity or
the as-built capacity. Having confirmed that it was the latter, the Applicant was asked by the
Examining Authority whether any of the built projects had ‘spare capacity’ (when comparing
consented vs as-built capacity) that might at some time in the future be built out without
further consent being required, and if that was possible then what implications this might have
for the conclusions drawn in the Applicants in-combination assessment for lesser black-backed
gull.
3.14 The consents granted for each of the relevant offshore wind farm projects have been reviewed
(sourced primarily from the DECC website9) and compared to the as-built characteristics set out
on the respective websites for each of the projects. The sites where there is potential for 'spare
capacity' to exist (based on these published sources) have been identified. For those projects
where ‘spare capacity’ theoretically exists, the as-built plans have been inspected to establish
whether it appears that the projects have been built out to the consented ‘red line area'.
3.15 However, when the areas covered by the built projects are compared to the consented red line
area, it is clear that Rhyl Flats10, Walney I and II and West of Duddon Sands have effectively
built out to the maximum permitted area (when accounting for technical or commercial
constraints). Additionally the Applicant has been advised by the Marine Management
Organisation that in principle any further development to an existing wind farm site would
require a further marine licence consent (and consultation) with a supporting assessment (Greg
Tomlinson, pers. com., dated 31/01/2014).
9 https://www.og.decc.gov.uk/EIP/pages/recent.htm
10 CRM data was not available for Rhyl Flats OWF to allow any correction of outputs
Walney Extension Offshore Wind Farm
Clarification Note – LBBG in-combination CRM
March 2014 Page 8
Table 3: Estimated lesser black-backed gull breeding period collisions (CRM Option 2) at analysis Stage A for Morecambe Bay (MB), Ribble & Alt Estuaries (R&A) and
Bowland Fells (BF) SPAs
Stage Analysis description
SPA
Projects considered in-combination
Tiers 1 - 3 Tier 4 Tier 5
Walney Extension
Walney I & II
West of
Duddon
Sands
Ormonde Gwynt y Môr
Burbo Bank
Rhyl Flats
North
Hoyle
Barrow
Sub-Total
Burbo Bank
Extension
Sub-Total
Rhiannon
Total
A
Population data, foraging range, and as built updates
MB 17 52 87 43 - - - - - 199 31 230 76 306
R&A 1 4 6 2 - - - - - 13 44 57 26 83
BF 2 4 6 3 - - - - - 15 18 33 24 57
Walney Extension Offshore Wind Farm
Clarification Note – LBBG in-combination CRM
March 2014 Page 9
4. Stage B : Definition of breeding period in historic CRM assessments
4.1 The collision risk to lesser black-backed gull within the breeding season presented in the West
of Duddon Sands Ornithological Impact Assessment (RPS, 2006a) is represented as summed
collisions from April to September. Throughout the assessment for Walney Extension, May to
August has been used to represent the breeding season for lesser black-backed gull having
been defined using appropriate literary sources (e.g. Wernham et al., 2002) and agreed with
Natural England. As such, in order to inform the in-combination collision risk assessment the
collision risk estimates for West of Duddon Sands are analysed to provide a revised estimate
for the likely number of collisions during the breeding season as defined for Walney Extension
(May-August).
4.2 The West of Duddon Sands Ornithological Impact Assessment presents population estimates
for lesser black-backed gull recorded within the study area during boat-based surveys between
May 2004 and September 2005. These population estimates are used to provide guidance on
the monthly number of birds at risk of collision at West of Duddon Sands. As such, the
assumption is made that a large population estimate will directly correspond with an increased
number of collisions calculated from collision risk modelling. Therefore the collision risk
estimate from the breeding season for West of Duddon Sands which is presented in Stage A is
divided proportionally based on average monthly population estimates. The number of
collisions attributed to May to August is then totalled to provide a breeding season collision
risk consistent with that used for Walney Extension.
4.3 A similar analysis had previously been conducted for Walney I & II. The analysis for Walney I
and II has been re-visited to ensure identical processes have been followed to that presented
here for West of Duddon Sands.
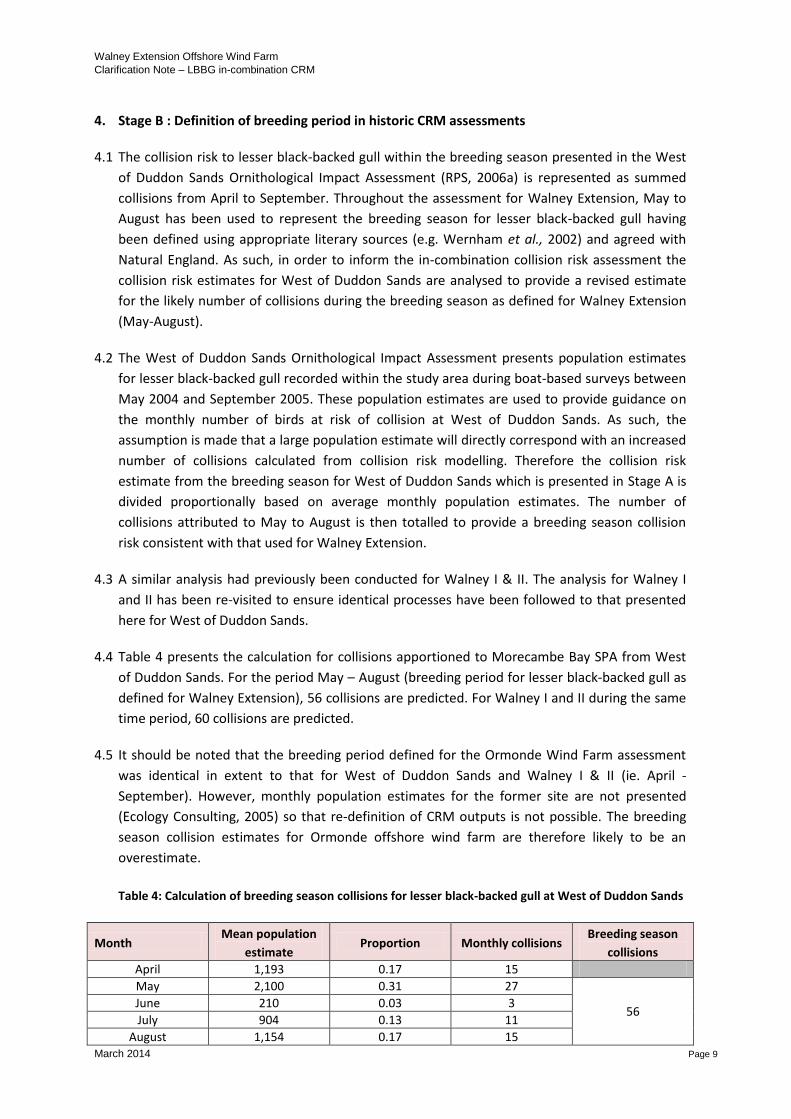
4.4 Table 4 presents the calculation for collisions apportioned to Morecambe Bay SPA from West
of Duddon Sands. For the period May – August (breeding period for lesser black-backed gull as
defined for Walney Extension), 56 collisions are predicted. For Walney I and II during the same
time period, 60 collisions are predicted.
4.5 It should be noted that the breeding period defined for the Ormonde Wind Farm assessment
was identical in extent to that for West of Duddon Sands and Walney I & II (ie. April -
September). However, monthly population estimates for the former site are not presented
(Ecology Consulting, 2005) so that re-definition of CRM outputs is not possible. The breeding
season collision estimates for Ormonde offshore wind farm are therefore likely to be an
overestimate.
Table 4: Calculation of breeding season collisions for lesser black-backed gull at West of Duddon Sands
Month Mean population
estimate Proportion Monthly collisions
Breeding season
collisions
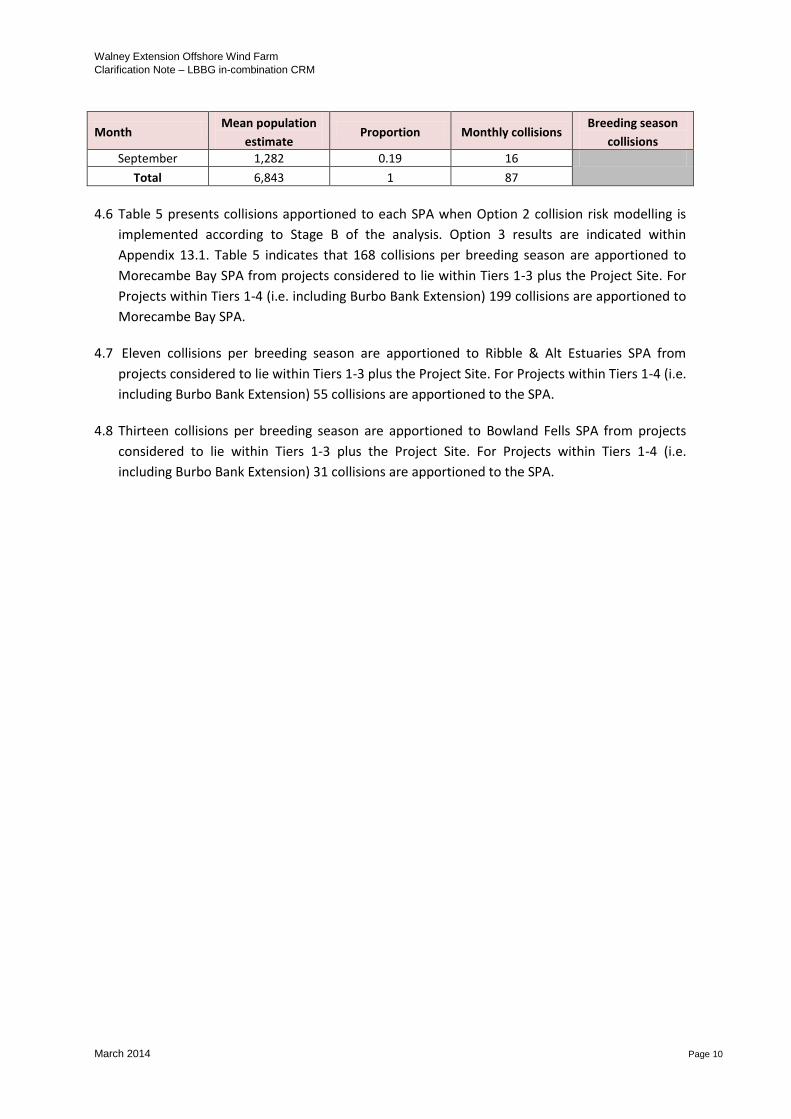
April 1,193 0.17 15
May 2,100 0.31 27
56 June 210 0.03 3
July 904 0.13 11
August 1,154 0.17 15
Walney Extension Offshore Wind Farm
Clarification Note – LBBG in-combination CRM
March 2014 Page 10
Month Mean population
estimate Proportion Monthly collisions
Breeding season
collisions
September 1,282 0.19 16
Total 6,843 1 87
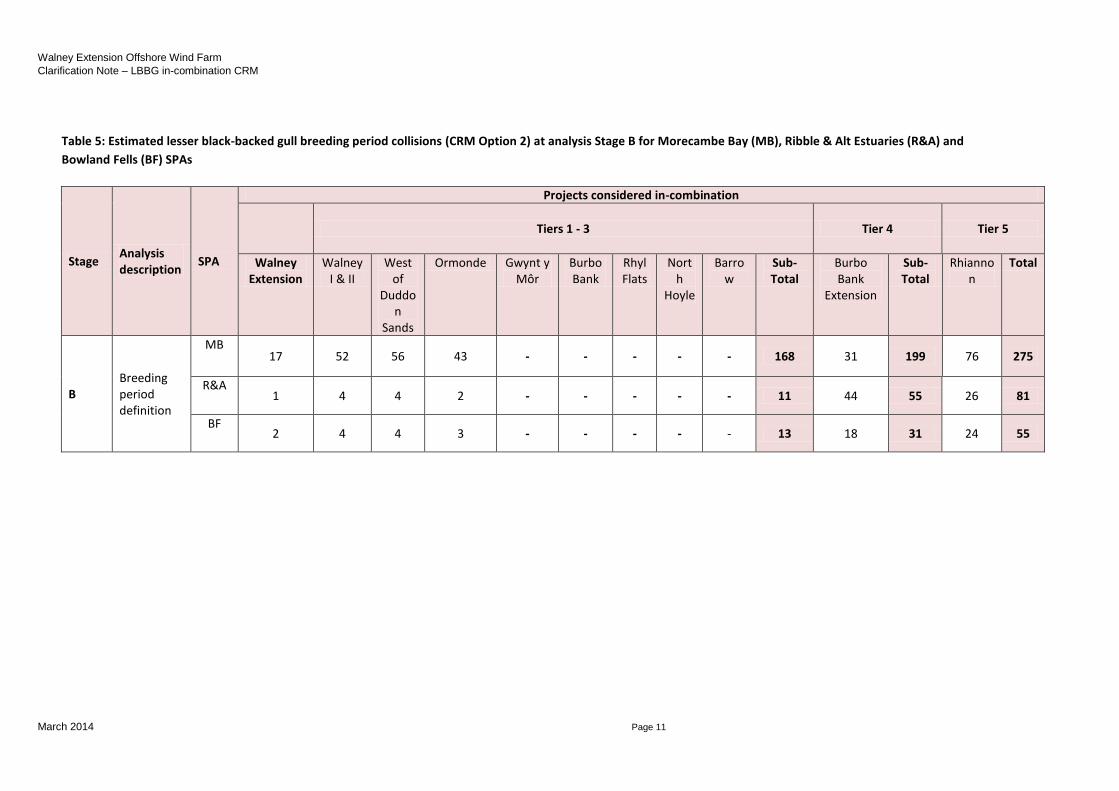
4.6 Table 5 presents collisions apportioned to each SPA when Option 2 collision risk modelling is
implemented according to Stage B of the analysis. Option 3 results are indicated within
Appendix 13.1. Table 5 indicates that 168 collisions per breeding season are apportioned to
Morecambe Bay SPA from projects considered to lie within Tiers 1-3 plus the Project Site. For
Projects within Tiers 1-4 (i.e. including Burbo Bank Extension) 199 collisions are apportioned to
Morecambe Bay SPA.
4.7 Eleven collisions per breeding season are apportioned to Ribble & Alt Estuaries SPA from
projects considered to lie within Tiers 1-3 plus the Project Site. For Projects within Tiers 1-4 (i.e.
including Burbo Bank Extension) 55 collisions are apportioned to the SPA.
4.8 Thirteen collisions per breeding season are apportioned to Bowland Fells SPA from projects
considered to lie within Tiers 1-3 plus the Project Site. For Projects within Tiers 1-4 (i.e.
including Burbo Bank Extension) 31 collisions are apportioned to the SPA.
Walney Extension Offshore Wind Farm
Clarification Note – LBBG in-combination CRM
March 2014 Page 11
Table 5: Estimated lesser black-backed gull breeding period collisions (CRM Option 2) at analysis Stage B for Morecambe Bay (MB), Ribble & Alt Estuaries (R&A) and
Bowland Fells (BF) SPAs
Stage Analysis description
SPA
Projects considered in-combination
Tiers 1 - 3 Tier 4 Tier 5
Walney Extension
Walney I & II
West of
Duddon
Sands
Ormonde Gwynt y Môr
Burbo Bank
Rhyl Flats
North
Hoyle
Barrow
Sub-Total
Burbo Bank
Extension
Sub-Total
Rhiannon
Total
B Breeding period definition
MB 17 52 56 43 - - - - - 168 31 199 76 275
R&A 1 4 4 2 - - - - - 11 44 55 26 81
BF 2 4 4 3 - - - - - 13 18 31 24 55
Walney Extension Offshore Wind Farm
Clarification Note – LBBG in-combination CRM
March 2014 Page 12
5. Stage C : Apportionment of predicted collisions to source colonies
5.1 The approach taken to apportioning in the Project Environmental Statement and HRA Report
was to apportion predicted lesser black-backed gull collisions between the three SPAs within
foraging range. There are however many smaller colonies also present in the Irish Sea region
(and also within foraging range) which have the potential to be the source of lesser black-
backed gulls found offshore.
5.2 To provide a robust interpretation of the source colony of gulls deemed to be at collision risk, a
GIS tool has been developed to apportion CRM outputs to all colonies within foraging range.
The overarching methodology is in essence identical to that first detailed in Annex 2 of the HRA
Report (DONG Energy, 2013).
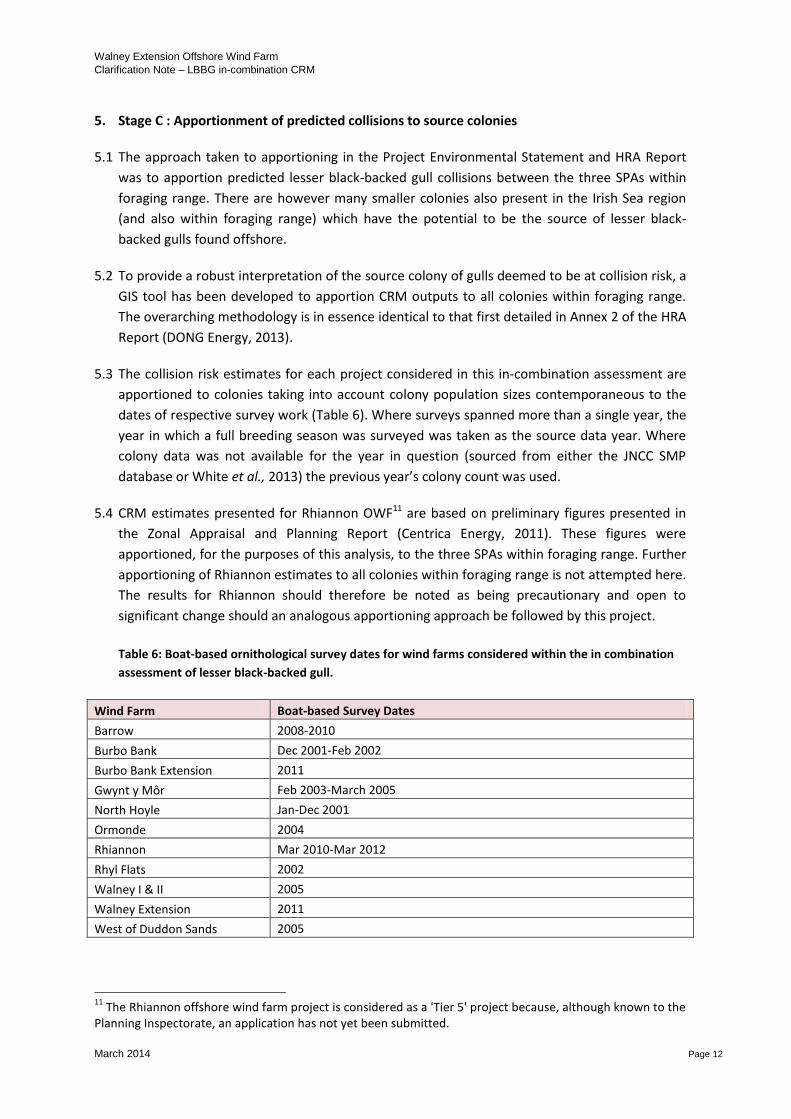
5.3 The collision risk estimates for each project considered in this in-combination assessment are
apportioned to colonies taking into account colony population sizes contemporaneous to the
dates of respective survey work (Table 6). Where surveys spanned more than a single year, the
year in which a full breeding season was surveyed was taken as the source data year. Where
colony data was not available for the year in question (sourced from either the JNCC SMP
database or White et al., 2013) the previous year’s colony count was used.
5.4 CRM estimates presented for Rhiannon OWF11 are based on preliminary figures presented in
the Zonal Appraisal and Planning Report (Centrica Energy, 2011). These figures were
apportioned, for the purposes of this analysis, to the three SPAs within foraging range. Further
apportioning of Rhiannon estimates to all colonies within foraging range is not attempted here.
The results for Rhiannon should therefore be noted as being precautionary and open to
significant change should an analogous apportioning approach be followed by this project.
Table 6: Boat-based ornithological survey dates for wind farms considered within the in combination
assessment of lesser black-backed gull.
Wind Farm Boat-based Survey Dates
Barrow 2008-2010
Burbo Bank Dec 2001-Feb 2002
Burbo Bank Extension 2011
Gwynt y Môr Feb 2003-March 2005
North Hoyle Jan-Dec 2001
Ormonde 2004
Rhiannon Mar 2010-Mar 2012
Rhyl Flats 2002
Walney I & II 2005
Walney Extension 2011
West of Duddon Sands 2005
11
The Rhiannon offshore wind farm project is considered as a 'Tier 5' project because, although known to the Planning Inspectorate, an application has not yet been submitted.
Walney Extension Offshore Wind Farm
Clarification Note – LBBG in-combination CRM
March 2014 Page 13
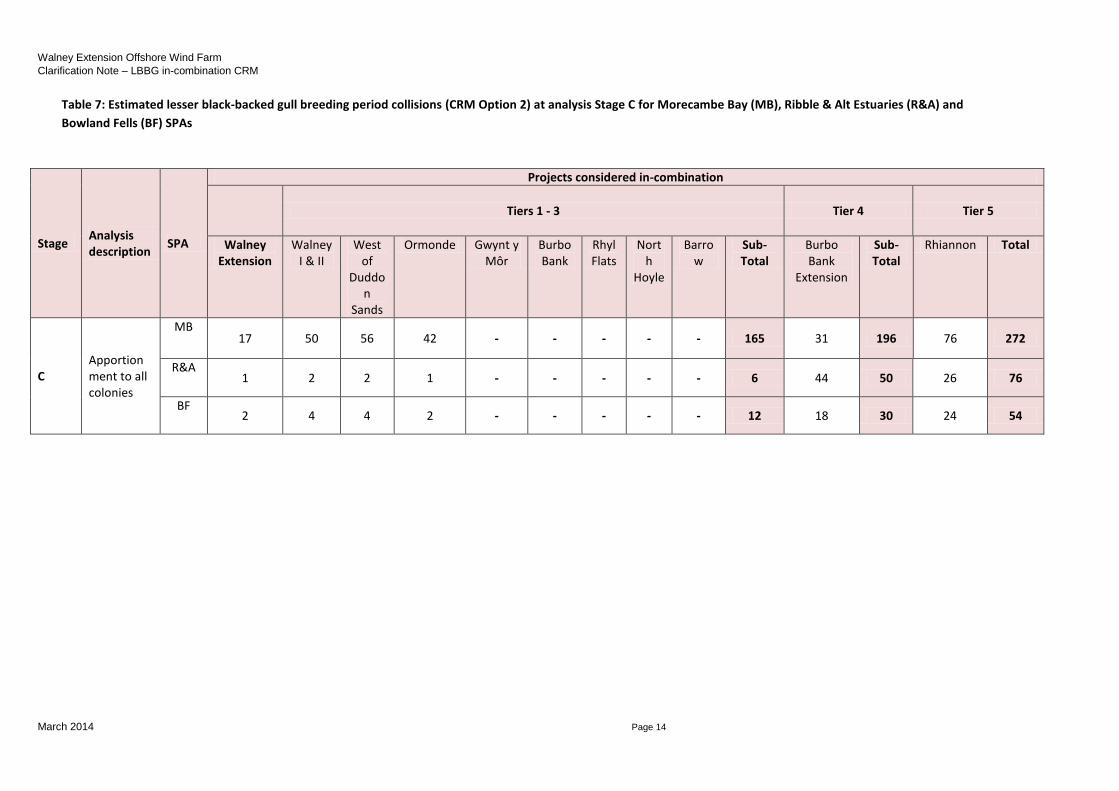
5.5 Table 7 presents collisions apportioned to each SPA when Option 2 collision risk modelling is
implemented according to Stage C of the analysis. Table 7 indicates that 165 collisions per
breeding season are apportioned to Morecambe Bay SPA from projects considered to lie within
Tiers 1-3 plus the Project Site. For Projects within Tiers 1-4 (i.e. including Burbo Bank Extension)
196 collisions are apportioned to Morecambe Bay SPA.
5.6 Six collisions per breeding season are apportioned to Ribble & Alt Estuaries SPA from projects
considered to lie within Tiers 1-3 plus the Project Site. For Projects within Tiers 1-4 (i.e.
including Burbo Bank Extension) 50 collisions are apportioned to the SPA.
5.7 Twelve collisions per breeding season are apportioned to Bowland Fells SPA from projects
considered to lie within Tiers 1-3 plus the Project Site. For Projects within Tiers 1-4 (i.e.
including Burbo Bank Extension) 30 collisions are apportioned to the SPA.
Walney Extension Offshore Wind Farm
Clarification Note – LBBG in-combination CRM
March 2014 Page 14
Table 7: Estimated lesser black-backed gull breeding period collisions (CRM Option 2) at analysis Stage C for Morecambe Bay (MB), Ribble & Alt Estuaries (R&A) and
Bowland Fells (BF) SPAs
Stage Analysis description
SPA
Projects considered in-combination
Tiers 1 - 3 Tier 4 Tier 5
Walney Extension
Walney I & II
West of
Duddon
Sands
Ormonde Gwynt y Môr
Burbo Bank
Rhyl Flats
North
Hoyle
Barrow
Sub-Total
Burbo Bank
Extension
Sub-Total
Rhiannon Total
C Apportionment to all colonies
MB 17 50 56 42 - - - - - 165 31 196 76 272
R&A 1 2 2 1 - - - - - 6 44 50 26 76
BF 2 4 4 2 - - - - - 12 18 30 24 54

Walney Extension Offshore Wind Farm
Clarification Note – LBBG in-combination CRM
March 2014 Page 15
6. Stage D : Apportionment of predicted collisions identified in the Gwynt y Môr Appropriate
Assessment
6.1 The Appropriate Assessment for Gwynt y Môr Offshore Wind Farm (DBERR, 2008) presents an
in-combination collision assessment for lesser black-backed gull. Collision estimates are
presented for Burbo Bank, North Hoyle and Rhyl Flats Offshore Wind Farms in addition to
Gwynt y Môr itself (Table 8). Collision risk values are presented for identified lesser black-
backed gulls and also for unidentified ‘black-backed gull species’, with the latter referring to
unidentified lesser or great black-backed gulls.
6.2 As agreed with Natural England for Burbo Bank Extension (Natural England, 2013) the CRM
estimates given in DBERR (2008) can be apportioned to relevant SPAs within foraging range of
the wind farms included and then added to the in-combination assessment carried out for
Walney Extension.
Table 8: CRM predictions for Irish Sea wind farms as presented in DBERR, 2008.
LBBG LBBG +
BBG
LBBG LBBG +
BBG
LBBG LBBG +
BBG
LBBG LBBG +
BBG
LBBG LBBG +
BBG
Wind farm Gwynt y Môr North Hoyle Rhyl Flats Burbo Bank
Total No. of turbines 250 30 25 25
Avoidance rate Predicted number of collisions per year
95% 27 53 3 6 3 5 10 20 43 84
99% 5 11 1 1 1 1 2 4 9 17
99.5% 3 5 0 1 0 1 1 2 4 9
99.9% 1 1 0 0 0 0 0 0 1 1
LBBG = lesser black-backed gull
BBG = Unidentified black backed gull species
6.3 Avoidance rates presented in DBERR (2008) did not include a 98% level as currently preferred
as the default rate by Natural England and JNCC. CRM predictions at 98% were calculated in
the following analysis alongside a partitioning exercise to account for the proportion of great
black-backed gulls within the values presented in Table 8. It also should be noted that the CRM
predictions in DBERR (2008) is presented on an annual basis rather than breeding season.
Without comprehensive monthly population data as used for Walney I & II and West of
Duddon Sands (Stage B of this Paper's analysis) a correction cannot be made with any degree
of certainty. It is therefore highlighted that the CRM rates taken forward from the DBERR
(2008) are highly precautionary and a likely overestimate.
6.4 To inform a partitioning exercise to correct for the presence of great black-backed gull in the
DBERR (2008) predictions, assessment and monitoring publications were consulted to source
appropriate data. The Environmental Statement for Gwynt y Môr (Npower Renewables,
2006a) presents data relating to the number of birds observed in flight. Surveys were
undertaken between February 2003 and March 2005 with data from June 2003 and March
2005 being used within the Appropriate Assessment. Flight height data was recorded for 385

Walney Extension Offshore Wind Farm
Clarification Note – LBBG in-combination CRM
March 2014 Page 16
lesser black-backed gulls and 262 great black-backed gulls. The values to be used to apportion
the collision risk attributed to lesser black-backed gull only are shown in Table 9.
Table 9: Partitioning values for black-backed gulls at Gwynt y Môr.
Species No. of birds Proportion
Lesser black-backed gull 385 0.6
Great black-backed gull 262 0.4
6.5 Data relating to the number of lesser black-backed gull and great black-backed gull at North
Hoyle are presented in the 2004-05 and 2005-06 monitoring reports for the site (Npower
Renewables, 2006b; Npower Renewables 2007). The combined data from these two data sets
and the resulting gull proportions are shown in Table 10.
Table 10: Partitioning values for black-backed gulls at North Hoyle.
Species No. of birds Proportion
Lesser black-backed gull 94 0.58
Great black-backed gull 69 0.42
6.6 The Rhyl Flats 2005-07 monitoring report (ESS Ltd., 2007) contains data relating to the number
of lesser black-backed gull and great black-backed gull observed in flight. These data and the
calculated proportions to be applied to collision risk estimates in the DBERR (2008) are shown
in Table 11.
Table 11: Partitioning values for black-backed gulls at Rhyl Flats.
Species No. of birds Proportion
Lesser black-backed gull 24 0.57
Great black-backed gull 18 0.43
6.7 Data relating to the number of lesser black-backed gull and great black-backed gull at Burbo
Bank is taken from Seascape Energy Ltd. (2002). These data and the calculated proportions to
be applied to collision risk estimates in DBERR (2008) are shown in Table 12.
Table 12: Partitioning values for black-backed gulls at Burbo Bank.
Species No. of birds Proportion
Lesser black-backed gull 143 0.36
Great black-backed gull 256 0.64
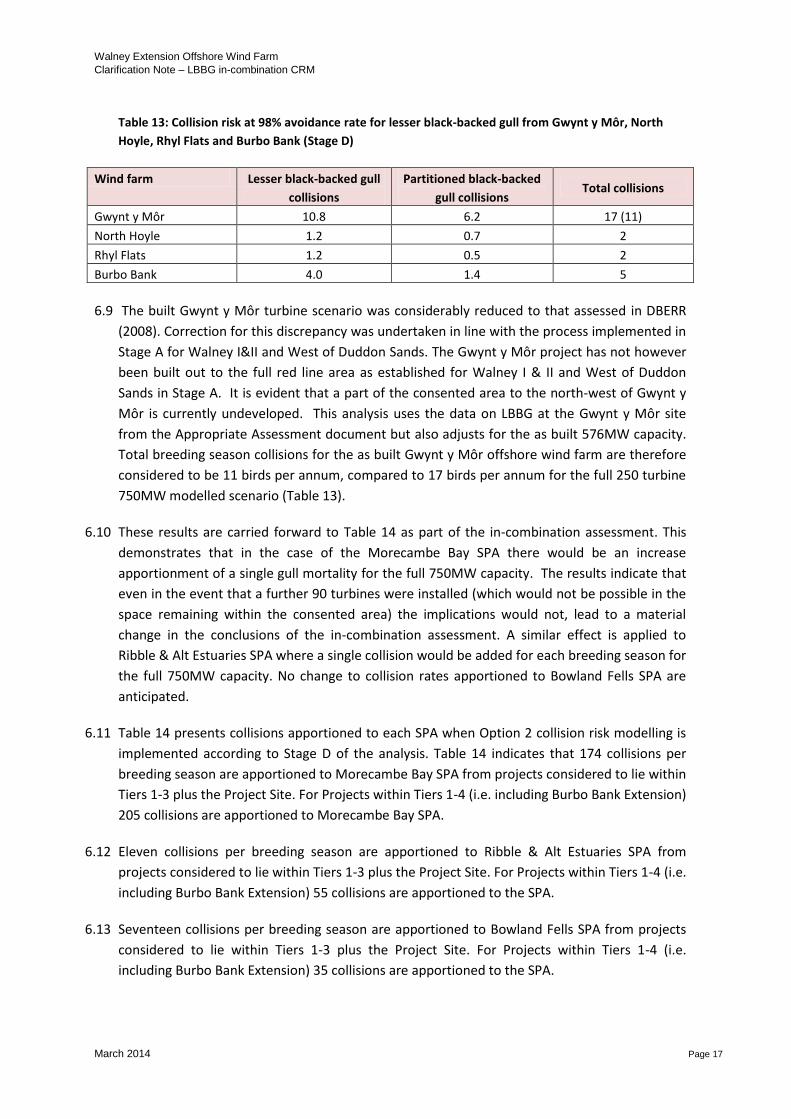
6.8 The overall collision estimates for lesser black-backed gull from the four sites included in
DBERR (2008) are shown in Table 13. These values are at 98% avoidance and include
partitioned ‘black-backed gulls’ using the portioning approach and data described above.
Walney Extension Offshore Wind Farm
Clarification Note – LBBG in-combination CRM
March 2014 Page 17
Table 13: Collision risk at 98% avoidance rate for lesser black-backed gull from Gwynt y Môr, North
Hoyle, Rhyl Flats and Burbo Bank (Stage D)
Wind farm Lesser black-backed gull
collisions
Partitioned black-backed
gull collisions Total collisions
Gwynt y Môr 10.8 6.2 17 (11)
North Hoyle 1.2 0.7 2
Rhyl Flats 1.2 0.5 2
Burbo Bank 4.0 1.4 5
6.9 The built Gwynt y Môr turbine scenario was considerably reduced to that assessed in DBERR
(2008). Correction for this discrepancy was undertaken in line with the process implemented in
Stage A for Walney I&II and West of Duddon Sands. The Gwynt y Môr project has not however
been built out to the full red line area as established for Walney I & II and West of Duddon
Sands in Stage A. It is evident that a part of the consented area to the north-west of Gwynt y
Môr is currently undeveloped. This analysis uses the data on LBBG at the Gwynt y Môr site
from the Appropriate Assessment document but also adjusts for the as built 576MW capacity.
Total breeding season collisions for the as built Gwynt y Môr offshore wind farm are therefore
considered to be 11 birds per annum, compared to 17 birds per annum for the full 250 turbine
750MW modelled scenario (Table 13).
6.10 These results are carried forward to Table 14 as part of the in-combination assessment. This
demonstrates that in the case of the Morecambe Bay SPA there would be an increase
apportionment of a single gull mortality for the full 750MW capacity. The results indicate that
even in the event that a further 90 turbines were installed (which would not be possible in the
space remaining within the consented area) the implications would not, lead to a material
change in the conclusions of the in-combination assessment. A similar effect is applied to
Ribble & Alt Estuaries SPA where a single collision would be added for each breeding season for
the full 750MW capacity. No change to collision rates apportioned to Bowland Fells SPA are
anticipated.
6.11 Table 14 presents collisions apportioned to each SPA when Option 2 collision risk modelling is
implemented according to Stage D of the analysis. Table 14 indicates that 174 collisions per
breeding season are apportioned to Morecambe Bay SPA from projects considered to lie within
Tiers 1-3 plus the Project Site. For Projects within Tiers 1-4 (i.e. including Burbo Bank Extension)
205 collisions are apportioned to Morecambe Bay SPA.
6.12 Eleven collisions per breeding season are apportioned to Ribble & Alt Estuaries SPA from
projects considered to lie within Tiers 1-3 plus the Project Site. For Projects within Tiers 1-4 (i.e.
including Burbo Bank Extension) 55 collisions are apportioned to the SPA.
6.13 Seventeen collisions per breeding season are apportioned to Bowland Fells SPA from projects
considered to lie within Tiers 1-3 plus the Project Site. For Projects within Tiers 1-4 (i.e.
including Burbo Bank Extension) 35 collisions are apportioned to the SPA.

Walney Extension Offshore Wind Farm
Clarification Note – LBBG in-combination CRM
March 2014 Page 18
Table 14: Estimated lesser black-backed gull breeding period collisions (CRM Option 2) at analysis Stage D for Morecambe Bay (MB), Ribble & Alt Estuaries (R&A) and
Bowland Fells (BF) SPAs
Stage Analysis description
SPA
Projects considered in-combination
Tiers 1 - 3 Tier 4 Tier 5
Walney Extension
Walney I & II
West of
Duddon
Sands
Ormonde Gwynt y Môr
12
Burbo Bank
Rhyl Flats
North
Hoyle
Barrow
Sub-Total
Burbo Bank
Extension
Sub-Total
Rhiannon Total
D
Apportionment of CRM figures in DBERR (2008)
MB 17 50 56 42 5 (6) 2 1 1 - 174 31 205 76 281
R&A 1 2 2 1 3 (4) 2 0 0 - 11 44 55 26 81
BF 2 4 4 2 2 1 1 1 - 17 18 35 24 59
12
Gwynt y Môr figures for full 750MW capacity are given in parentheses
Walney Extension Offshore Wind Farm
Clarification Note – LBBG in-combination CRM
March 2014 Page 19
7. Stage E : CRM for Barrow OWF using post-construction monitoring data
7.1 Following the request of Natural England in Issue Specific Hearing III for Burbo Bank Extension,
a collision risk modelling (CRM) exercise for Barrow Offshore Wind Farm (OWF) was
undertaken to inform the in-combination assessment for lesser black-backed gull at the
proposed Burbo Bank Extension offshore wind farm. In response to the Applicant's scope for
this assessment Natural England suggested (Natural England, 2013) that the CRM should:
“Refer to post-construction monitoring (PCM ) data from the OWF. This spans three years and
allows mean densities of LBBGs to be used in a Band Option 2 collision risk model. We are only
concerned with estimates of collision in the breeding season. The approach uses empirical data
from the OWF and makes fewest assumptions. It also inherently incorporates changes in colony
size as data were collected recently (2008-2010), and can reflect an ‘as built’ development
scenario.”
7.2 This analysis is carried forward in order to inform the in-combination assessment presented in
this paper.
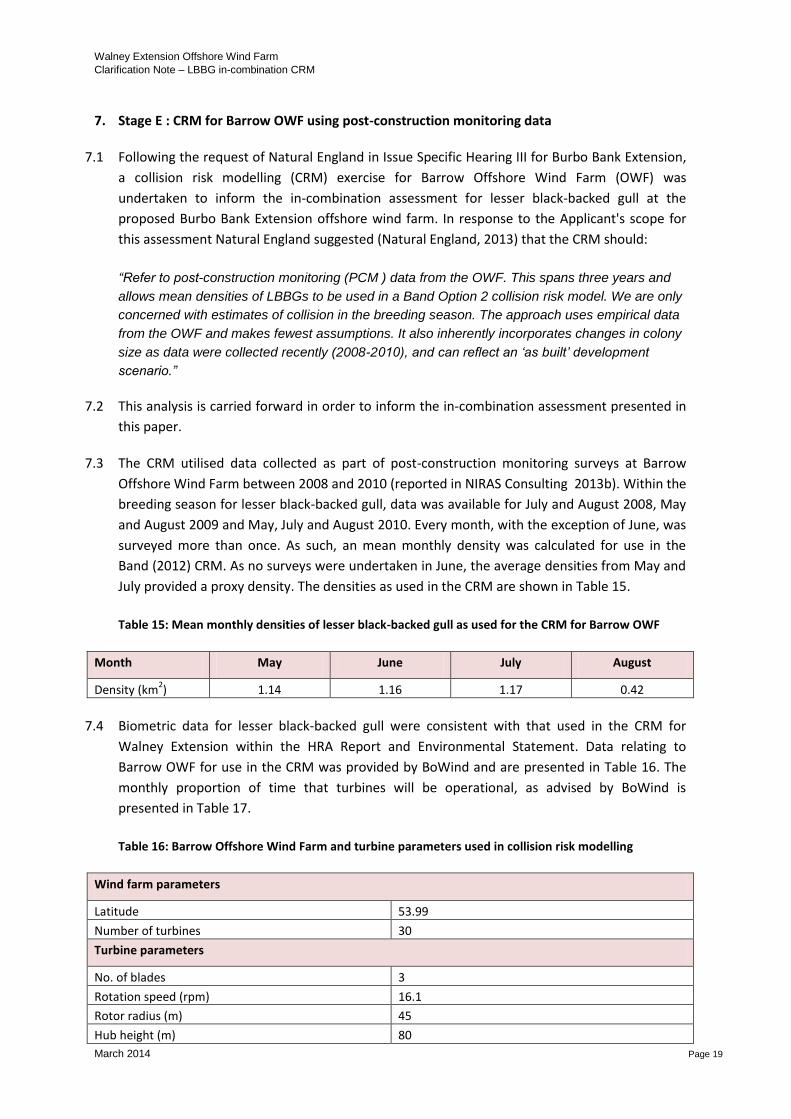
7.3 The CRM utilised data collected as part of post-construction monitoring surveys at Barrow
Offshore Wind Farm between 2008 and 2010 (reported in NIRAS Consulting 2013b). Within the
breeding season for lesser black-backed gull, data was available for July and August 2008, May
and August 2009 and May, July and August 2010. Every month, with the exception of June, was
surveyed more than once. As such, an mean monthly density was calculated for use in the
Band (2012) CRM. As no surveys were undertaken in June, the average densities from May and
July provided a proxy density. The densities as used in the CRM are shown in Table 15.
Table 15: Mean monthly densities of lesser black-backed gull as used for the CRM for Barrow OWF
Month May June July August
Density (km2) 1.14 1.16 1.17 0.42
7.4 Biometric data for lesser black-backed gull were consistent with that used in the CRM for
Walney Extension within the HRA Report and Environmental Statement. Data relating to
Barrow OWF for use in the CRM was provided by BoWind and are presented in Table 16. The
monthly proportion of time that turbines will be operational, as advised by BoWind is
presented in Table 17.
Table 16: Barrow Offshore Wind Farm and turbine parameters used in collision risk modelling
Wind farm parameters
Latitude 53.99
Number of turbines 30
Turbine parameters
No. of blades 3
Rotation speed (rpm) 16.1
Rotor radius (m) 45
Hub height (m) 80
Walney Extension Offshore Wind Farm
Clarification Note – LBBG in-combination CRM
March 2014 Page 20
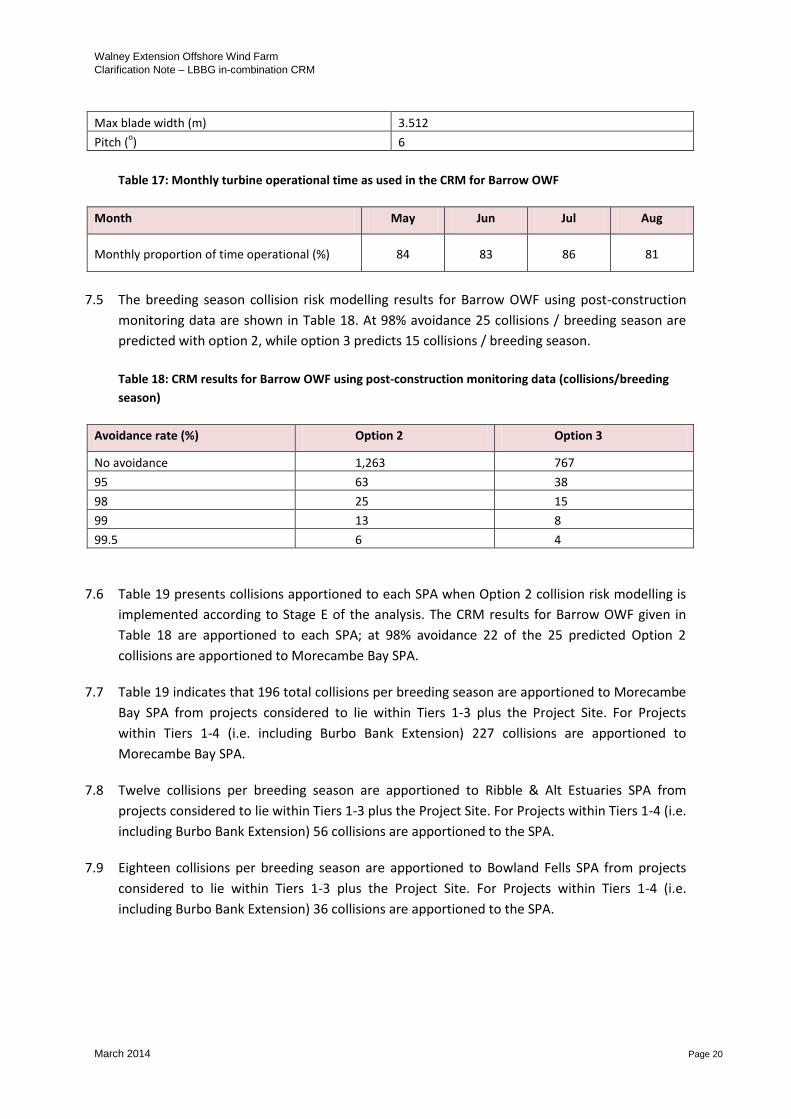
Max blade width (m) 3.512
Pitch (o) 6
Table 17: Monthly turbine operational time as used in the CRM for Barrow OWF
Month May Jun Jul Aug
Monthly proportion of time operational (%) 84 83 86 81
7.5 The breeding season collision risk modelling results for Barrow OWF using post-construction
monitoring data are shown in Table 18. At 98% avoidance 25 collisions / breeding season are
predicted with option 2, while option 3 predicts 15 collisions / breeding season.
Table 18: CRM results for Barrow OWF using post-construction monitoring data (collisions/breeding
season)
Avoidance rate (%) Option 2 Option 3
No avoidance 1,263 767
95 63 38
98 25 15
99 13 8
99.5 6 4
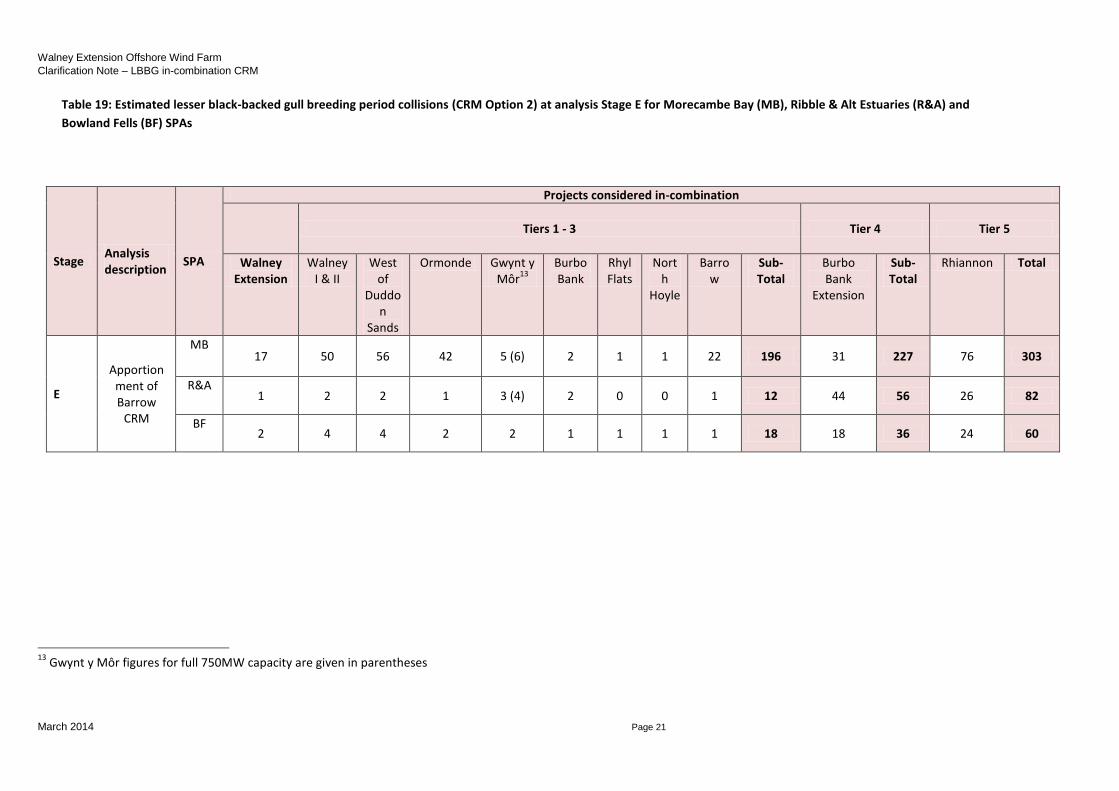
7.6 Table 19 presents collisions apportioned to each SPA when Option 2 collision risk modelling is
implemented according to Stage E of the analysis. The CRM results for Barrow OWF given in
Table 18 are apportioned to each SPA; at 98% avoidance 22 of the 25 predicted Option 2
collisions are apportioned to Morecambe Bay SPA.
7.7 Table 19 indicates that 196 total collisions per breeding season are apportioned to Morecambe
Bay SPA from projects considered to lie within Tiers 1-3 plus the Project Site. For Projects
within Tiers 1-4 (i.e. including Burbo Bank Extension) 227 collisions are apportioned to
Morecambe Bay SPA.
7.8 Twelve collisions per breeding season are apportioned to Ribble & Alt Estuaries SPA from
projects considered to lie within Tiers 1-3 plus the Project Site. For Projects within Tiers 1-4 (i.e.
including Burbo Bank Extension) 56 collisions are apportioned to the SPA.
7.9 Eighteen collisions per breeding season are apportioned to Bowland Fells SPA from projects
considered to lie within Tiers 1-3 plus the Project Site. For Projects within Tiers 1-4 (i.e.
including Burbo Bank Extension) 36 collisions are apportioned to the SPA.
Walney Extension Offshore Wind Farm
Clarification Note – LBBG in-combination CRM
March 2014 Page 21
Table 19: Estimated lesser black-backed gull breeding period collisions (CRM Option 2) at analysis Stage E for Morecambe Bay (MB), Ribble & Alt Estuaries (R&A) and
Bowland Fells (BF) SPAs
Stage Analysis description
SPA
Projects considered in-combination
Tiers 1 - 3 Tier 4 Tier 5
Walney Extension
Walney I & II
West of
Duddon
Sands
Ormonde Gwynt y Môr
13
Burbo Bank
Rhyl Flats
North
Hoyle
Barrow
Sub-Total
Burbo Bank
Extension
Sub-Total
Rhiannon Total
E
Apportionment of Barrow
CRM
MB 17 50 56 42 5 (6) 2 1 1 22 196 31 227 76 303
R&A 1 2 2 1 3 (4) 2 0 0 1 12 44 56 26 82
BF 2 4 4 2 2 1 1 1 1 18 18 36 24 60
13
Gwynt y Môr figures for full 750MW capacity are given in parentheses

Walney Extension Offshore Wind Farm
Clarification Note – LBBG in-combination CRM
March 2014 Page 22
8. Stage F : Collision risk tracking breeding population size
8.1 Stage F relates to the adjustment of historic CRM estimates to account for colony size changes
between the time of the baseline surveys to current estimates. This analysis makes the
assumption that colony size has a direct relationship with the density of birds at sea and
corrects previously presented CRM results to account for this projected change in density.
8.2 Stage F includes re-assessment of CRM estimates from the following consented projects:
Gwynt y Môr, North Hoyle, Ormonde, Rhyl Flats, Walney I & II and West of Duddon Sands. The
lesser black-backed gull population size for each of the three SPAs considered in this paper
was determined for each year between 2001 and 2012. This time period was delineated by the
year best representing the oldest pre-application surveys, and the latest census data available
via the JNCC SMP database. Where counts were not available for a year, the data was
extrapolated where possible or most recent count of a previous year used.
8.3 A collision risk conversion rate was calculated for each offshore wind farm by dividing the
number of collisions by each of the SPAs population size at the time of the pre-application
baseline surveys (or post-construction in the case of Barrow). For any other year, the calculated
number of collisions apportioned to a SPA is considered to be the latter’s population size for
the year multiplied by the respective collision risk conversion rate. For each combination of
offshore wind farm and SPA the number of collisions was calculated initially for the year 2011.
The latter year has been used in this in-combination assessment of offshore wind farms as that
contemporaneous with the Project site specific summer surveys (summer 2011). The calculated
number of collisions apportioned to a SPA was summed to provide a total for the year 2011 for
those offshore wind farms considered in combination for Tiers 1-5. When providing its view on
this assessment for Burbo Bank Extension, Natural England (23th January 2014) recommended
the Applicant revised the collision risk tracking of breeding populations of lesser black-backed
gulls with the addition of two survey datasets from 2012.
8.4 The 2012 datasets refer to West of Duddon Sands and Walney I & II wind farms where data has
been extracted from a West of Duddon Sands Pre-construction Monitoring Report (DONG
Energy/Scottish Power Renewables 2013) and a post-construction report for Walney I & II
Offshore Wind Farm (DONG Energy, 2013c).
8.5 In order to underpin the validity of undertaking CRM tracking of breeding populations of lesser
black-backed gulls whilst also describing the relationship, research was undertaken that
compared the Morecambe Bay SPA population with offshore density of this species at various
adjacent offshore wind farm projects. Densities used were from Project specific boat-based
surveys during the breeding season (May - August) at four offshore wind farms (Barrow,
Walney Extension, Walney I & II and West of Duddon Sands) situated in waters within 17 km of
the South Walney colony within Morecambe Bay SPA (Barrow Offshore Wind Limited 2012, RPS
2006, Walney Offshore Windfarm 2012, Walney Offshore Extension Windfarm, 2013). The
species mean-maximum foraging range is 141 km (Thaxter et al., 2012) although on a
precautionary basis only those Projects adjacent to South Walney were analysed in order to
prevent undue influence from other colonies.
Walney Extension Offshore Wind Farm
Clarification Note – LBBG in-combination CRM
March 2014 Page 23
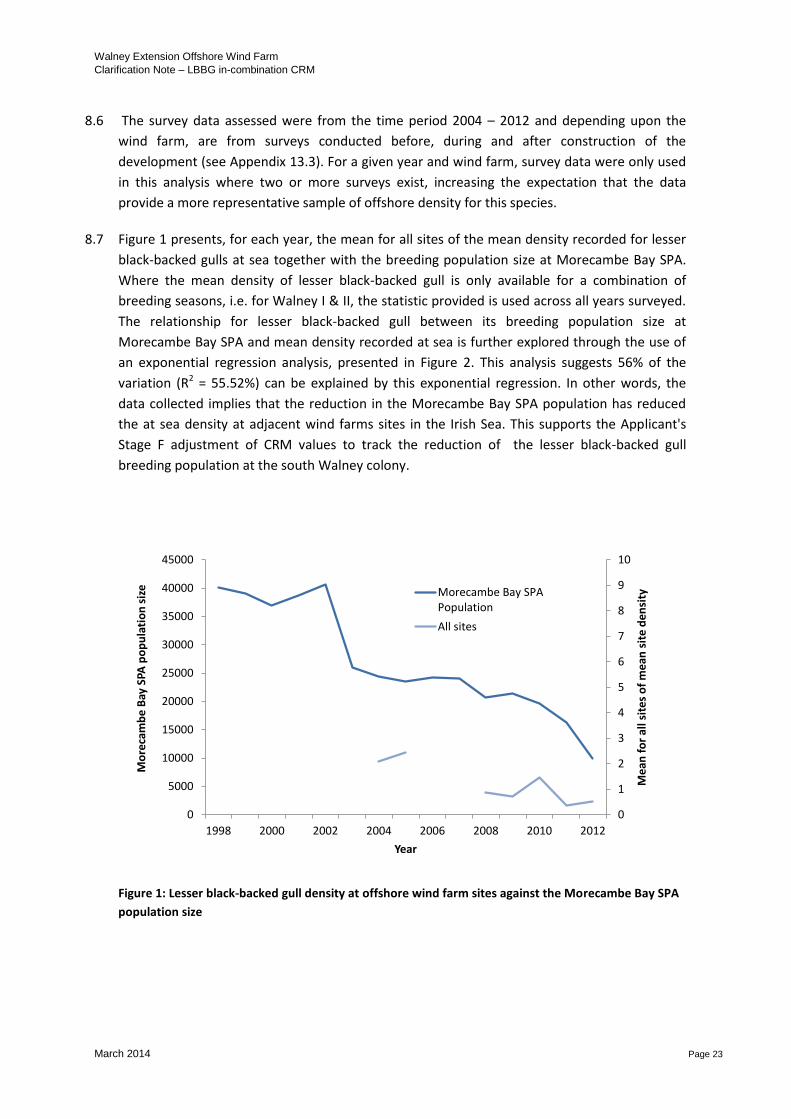
8.6 The survey data assessed were from the time period 2004 – 2012 and depending upon the
wind farm, are from surveys conducted before, during and after construction of the
development (see Appendix 13.3). For a given year and wind farm, survey data were only used
in this analysis where two or more surveys exist, increasing the expectation that the data
provide a more representative sample of offshore density for this species.
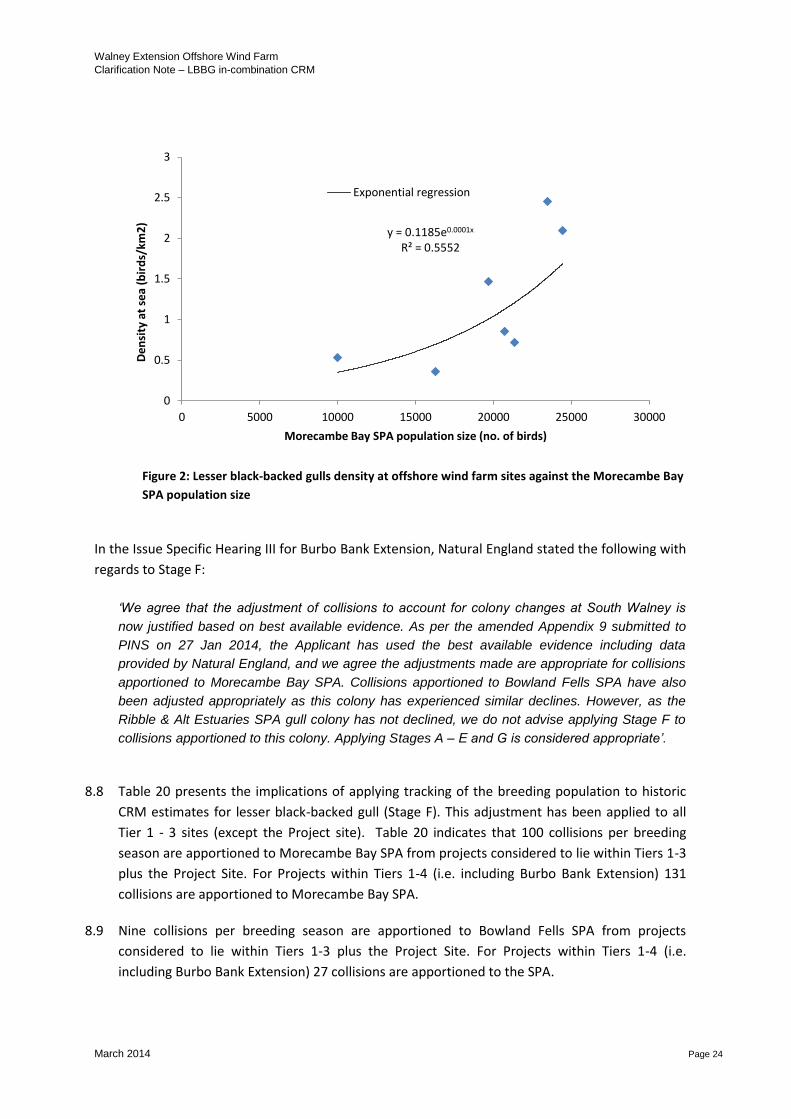
8.7 Figure 1 presents, for each year, the mean for all sites of the mean density recorded for lesser
black-backed gulls at sea together with the breeding population size at Morecambe Bay SPA.
Where the mean density of lesser black-backed gull is only available for a combination of
breeding seasons, i.e. for Walney I & II, the statistic provided is used across all years surveyed.
The relationship for lesser black-backed gull between its breeding population size at
Morecambe Bay SPA and mean density recorded at sea is further explored through the use of
an exponential regression analysis, presented in Figure 2. This analysis suggests 56% of the
variation (R2 = 55.52%) can be explained by this exponential regression. In other words, the
data collected implies that the reduction in the Morecambe Bay SPA population has reduced
the at sea density at adjacent wind farms sites in the Irish Sea. This supports the Applicant's
Stage F adjustment of CRM values to track the reduction of the lesser black-backed gull
breeding population at the south Walney colony.
Figure 1: Lesser black-backed gull density at offshore wind farm sites against the Morecambe Bay SPA
population size
0
1
2
3
4
5
6
7
8
9
10
0
5000
10000
15000
20000
25000
30000
35000
40000
45000
1998 2000 2002 2004 2006 2008 2010 2012
Mea
n f
or
all s
ites
of
mea
n s
ite
den
sity
Mo
reca
mb
e B
ay S
PA p
op
ula
tio
n s
ize
Year
Morecambe Bay SPAPopulation
All sites
Walney Extension Offshore Wind Farm
Clarification Note – LBBG in-combination CRM
March 2014 Page 24
Figure 2: Lesser black-backed gulls density at offshore wind farm sites against the Morecambe Bay
SPA population size
In the Issue Specific Hearing III for Burbo Bank Extension, Natural England stated the following with
regards to Stage F:
‘We agree that the adjustment of collisions to account for colony changes at South Walney is
now justified based on best available evidence. As per the amended Appendix 9 submitted to
PINS on 27 Jan 2014, the Applicant has used the best available evidence including data
provided by Natural England, and we agree the adjustments made are appropriate for collisions
apportioned to Morecambe Bay SPA. Collisions apportioned to Bowland Fells SPA have also
been adjusted appropriately as this colony has experienced similar declines. However, as the
Ribble & Alt Estuaries SPA gull colony has not declined, we do not advise applying Stage F to
collisions apportioned to this colony. Applying Stages A – E and G is considered appropriate’.
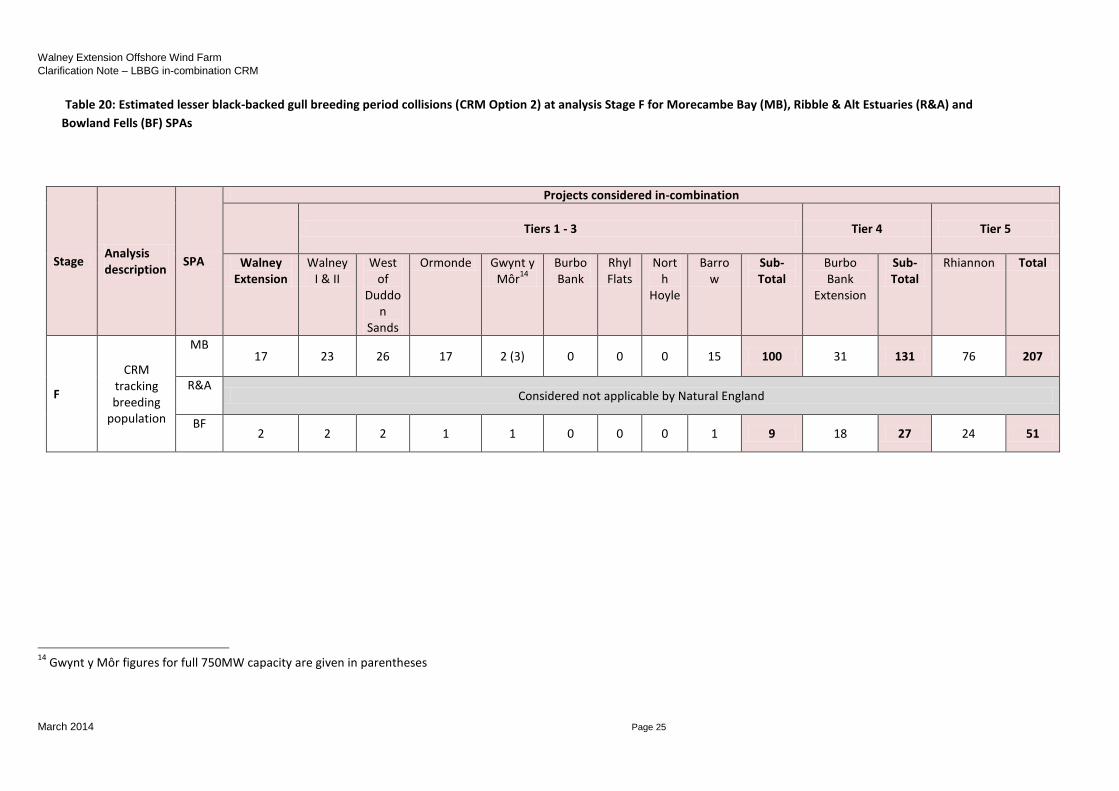
8.8 Table 20 presents the implications of applying tracking of the breeding population to historic
CRM estimates for lesser black-backed gull (Stage F). This adjustment has been applied to all
Tier 1 - 3 sites (except the Project site). Table 20 indicates that 100 collisions per breeding
season are apportioned to Morecambe Bay SPA from projects considered to lie within Tiers 1-3
plus the Project Site. For Projects within Tiers 1-4 (i.e. including Burbo Bank Extension) 131
collisions are apportioned to Morecambe Bay SPA.
8.9 Nine collisions per breeding season are apportioned to Bowland Fells SPA from projects
considered to lie within Tiers 1-3 plus the Project Site. For Projects within Tiers 1-4 (i.e.
including Burbo Bank Extension) 27 collisions are apportioned to the SPA.
y = 0.1185e0.0001x
R² = 0.5552
0
0.5
1
1.5
2
2.5
3
0 5000 10000 15000 20000 25000 30000
Den
sity
at
sea
(bir
ds/
km2
)
Morecambe Bay SPA population size (no. of birds)
Exponential regression
Walney Extension Offshore Wind Farm
Clarification Note – LBBG in-combination CRM
March 2014 Page 25
Table 20: Estimated lesser black-backed gull breeding period collisions (CRM Option 2) at analysis Stage F for Morecambe Bay (MB), Ribble & Alt Estuaries (R&A) and
Bowland Fells (BF) SPAs
Stage Analysis description
SPA
Projects considered in-combination
Tiers 1 - 3 Tier 4 Tier 5
Walney Extension
Walney I & II
West of
Duddon
Sands
Ormonde Gwynt y Môr
14
Burbo Bank
Rhyl Flats
North
Hoyle
Barrow
Sub-Total
Burbo Bank
Extension
Sub-Total
Rhiannon Total
F
CRM tracking breeding
population
MB 17 23 26 17 2 (3) 0 0 0 15 100 31 131 76 207
R&A Considered not applicable by Natural England
BF 2 2 2 1 1 0 0 0 1 9 18 27 24 51
14
Gwynt y Môr figures for full 750MW capacity are given in parentheses
Walney Extension Offshore Wind Farm
Clarification Note – LBBG in-combination CRM
March 2014 Page 26
9. Stage G : Population age structure
9.1 Collision risk modelling undertaken for the Project was undertaken using density data of all
lesser black-backed gulls recorded. Breeding adults are the most relevant aspect of the species
population in terms of this assessment; the breeding lesser black-backed gull qualifying
features of each of the three SPAs considered refer to the number of adult birds present. A
limited level of age class identification was undertaken within boat-based surveys of the
Project site where a minimum of 15% of lesser black-backed gulls recorded in the breeding
season referred to juvenile or sub-adult birds. Limited data are available from the other wind
farms considered in this assessment regarding gull age structure within their respective
baseline surveys (no differentiation of ages was made for Burbo Bank Extension for example).
9.2 Lesser black-backed gulls tend to first breed at four years of age (Cramp & Simmons, 2004)
which implies that a significant proportion of the population of this species does not contribute
to breeding on an annual basis. The Habitat Regulations Assessment of the now consented
Galloper Offshore Wind Farm (SSE Renewables / RWE Npower Renewables, 2011) investigated
the age structure of lesser black-backed gulls and sub-adult non-breeders were discounted
from the CRM. Age structure data were available to assign a proportion of the population that
was not part of the breeding population. From March to July the data were heavily skewed
towards adult birds (c.80%), with the proportion highest during June and July. These data
support the analysis from Walney Extension in that a proportion of 15-20% of individuals
recorded in the breeding season are likely to be non-breeding birds. Further supporting
evidence for this approach is given in the Habitats Regulations Assessment for East Anglia One
(SSE Renewables, 2012) which found that 78% of lesser black-backed gulls were adults. Sub-
adult or juvenile gulls were not considered within collision risk modelling of this site.
9.3 stage G of the analysis therefore provides a precautionary correction of 15% of the CRM
estimates to all sites considered, in order to account for the element of non-breeding birds
within the population. This correction was agreed to be suitably precautionary with Natural
England during Issue Specific Hearing III for Burbo Bank Extension.
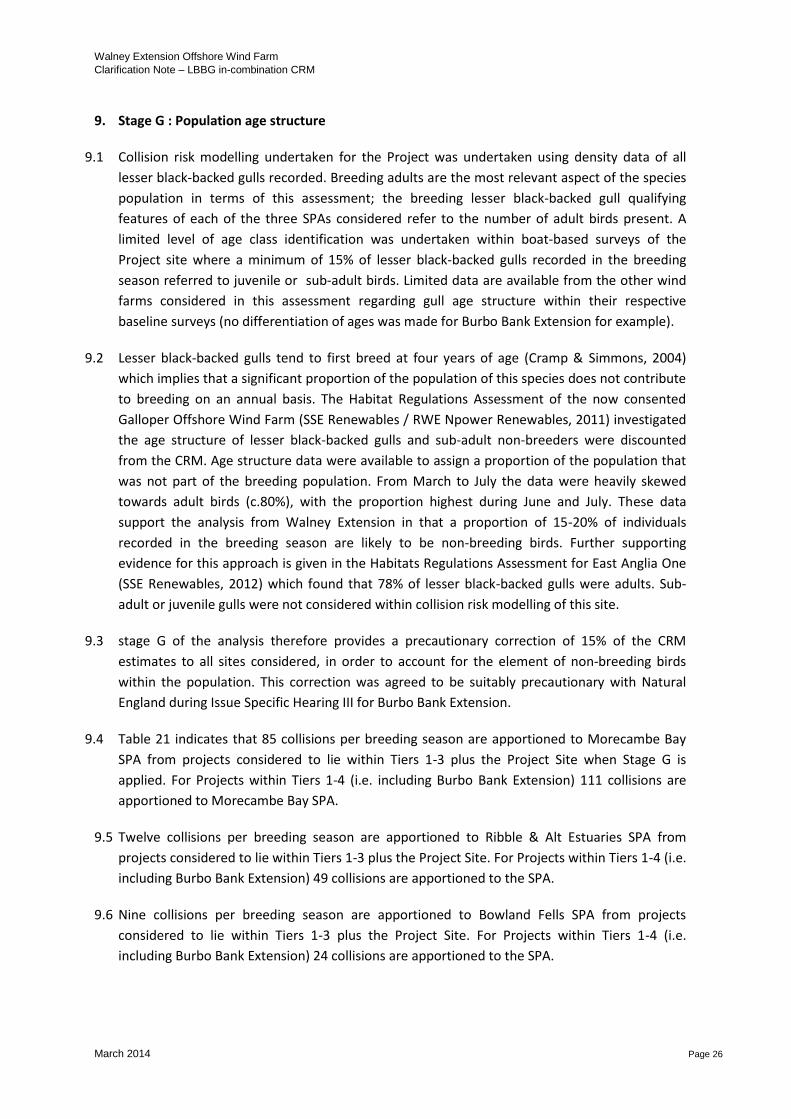
9.4 Table 21 indicates that 85 collisions per breeding season are apportioned to Morecambe Bay
SPA from projects considered to lie within Tiers 1-3 plus the Project Site when Stage G is
applied. For Projects within Tiers 1-4 (i.e. including Burbo Bank Extension) 111 collisions are
apportioned to Morecambe Bay SPA.
9.5 Twelve collisions per breeding season are apportioned to Ribble & Alt Estuaries SPA from
projects considered to lie within Tiers 1-3 plus the Project Site. For Projects within Tiers 1-4 (i.e.
including Burbo Bank Extension) 49 collisions are apportioned to the SPA.
9.6 Nine collisions per breeding season are apportioned to Bowland Fells SPA from projects
considered to lie within Tiers 1-3 plus the Project Site. For Projects within Tiers 1-4 (i.e.
including Burbo Bank Extension) 24 collisions are apportioned to the SPA.
Walney Extension Offshore Wind Farm
Clarification Note – LBBG in-combination CRM
March 2014 Page 27
Table 21: Estimated lesser black-backed gull breeding period collisions (CRM Option 2) at analysis Stage G for Morecambe Bay (MB), Ribble & Alt Estuaries (R&A) and
Bowland Fells (BF) SPAs
Stage Description SPA
Projects considered in-combination
Tiers 1 - 3 Tier 4 Tier 5
Walney Extension
Walney I & II
West of
Duddon
Sands
Ormonde Gwynt y Môr
15
Burbo Bank
Rhyl Flats
North
Hoyle
Barrow
Sub-Total
Burbo Bank
Extension
Sub-Total
Rhiannon Total
G
Correction for
immature birds
MB 14 20 22 14 2 (3) 0 0 0 13 85 26 111 76 187
R&A 1 2 2 1 3 (4) 2 0 0 1 12 37 49 26 75
BF 2 2 2 1 1 0 0 0 1 9 15 24 24 48
15
Gwynt y Môr figures for full 750MW capacity are given in parentheses
Walney Extension Offshore Wind Farm
Clarification Note – LBBG in-combination CRM
March 2014 Page 28
10. Potential Biological Removal
10.1 The various analysis stages presented in this paper are related in this section to PBR thresholds
and examination of the associated f value as given in Table 1. The context behind this
presentation is that f is a continuous spectrum from 1 to 0, and presentation in this way allows
greater insight into potential effects. The tables presented below represent all collisions
estimates using (where applicable) Option 2 outputs; Option 3 results are shown in Appendix
13.2.
Morecambe Bay SPA
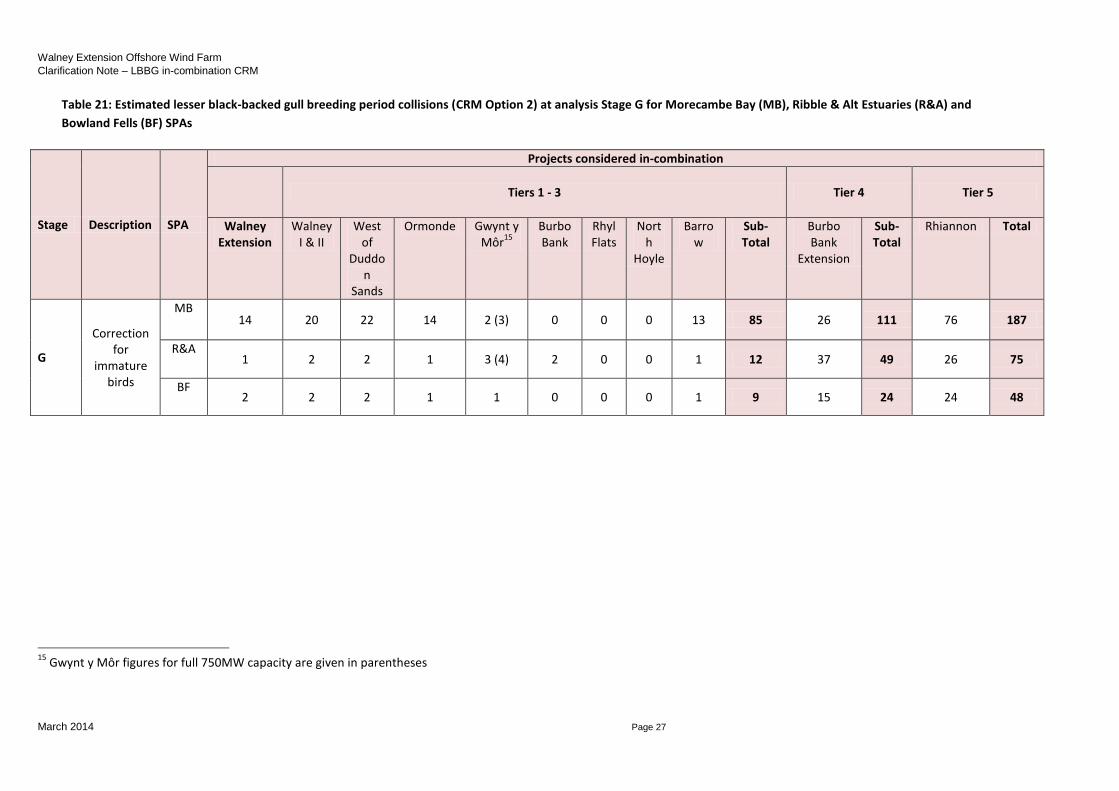
10.2 Table 22 presents PBR f values for Morecambe Bay SPA considering each analytical stage of this
Paper and also the JNCC and Natural England tiered approach. Following all Stages of the Paper
through to G, the in-combination collision estimate for lesser black-backed gull for projects
included in Tiers 1-3 (i.e. 85 adults / breeding season presented in Table 21) represents f =
0.085. For Tiers 1-4 the in-combination collision estimate of 111 adults / breeding season
represents f = 0.111.
Table 22: Matrix of PBR f values for Option 2 collisions apportioned to Morecambe Bay SPA
Analysis Stage Tiers 1-3 (including
Walney Extension) Tiers 1-4 Tiers 1-5
A 0.199 0.229 0.305
B 0.168 0.199 0.274
C 0.165 0.196 0.271
D 0.174 0.205 0.280
E 0.196 0.226 0.302
F 0.010 0.131 0.207
G 0.085 0.111 0.187
Ribble & Alt Estuaries SPA
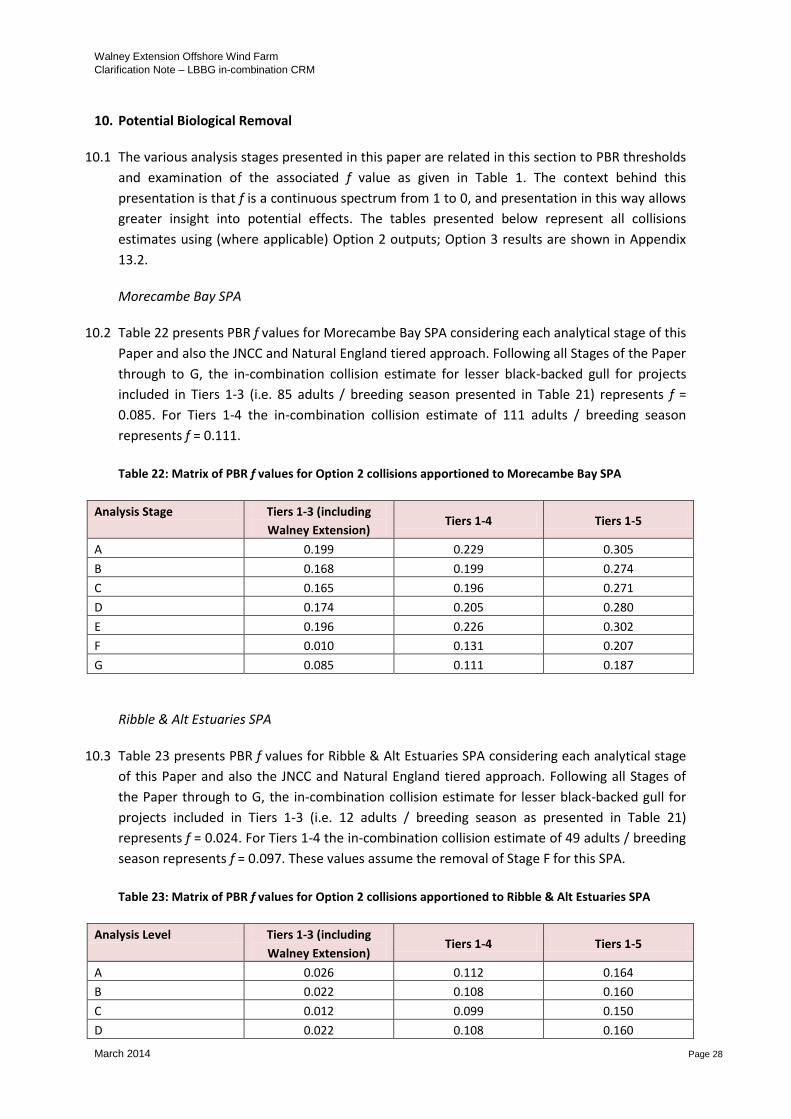
10.3 Table 23 presents PBR f values for Ribble & Alt Estuaries SPA considering each analytical stage
of this Paper and also the JNCC and Natural England tiered approach. Following all Stages of
the Paper through to G, the in-combination collision estimate for lesser black-backed gull for
projects included in Tiers 1-3 (i.e. 12 adults / breeding season as presented in Table 21)
represents f = 0.024. For Tiers 1-4 the in-combination collision estimate of 49 adults / breeding
season represents f = 0.097. These values assume the removal of Stage F for this SPA.
Table 23: Matrix of PBR f values for Option 2 collisions apportioned to Ribble & Alt Estuaries SPA
Analysis Level Tiers 1-3 (including
Walney Extension) Tiers 1-4 Tiers 1-5
A 0.026 0.112 0.164
B 0.022 0.108 0.160
C 0.012 0.099 0.150
D 0.022 0.108 0.160
Walney Extension Offshore Wind Farm
Clarification Note – LBBG in-combination CRM
March 2014 Page 29
Analysis Level Tiers 1-3 (including
Walney Extension) Tiers 1-4 Tiers 1-5
E 0.024 0.110 0.162
F Considered not applicable by Natural England
G 0.024 0.097 0.148
Bowland Fells SPA
10.4 Table 24 presents PBR f values for Bowland Fells SPA considering each analytical stage of this
Paper and also the JNCC and Natural England tiered approach. Following all Stages of the Paper
through to G, the in-combination collision estimate for lesser black-backed gull for projects
included in Tiers 1-3 (i.e. 9 adults / breeding season as presented in Table 21) represents f =
0.013. For Tiers 1-4 the in-combination collision estimate of 24 adults / breeding season
represents f = 0.036.
Table 24: Matrix of PBR f values for Option 2 collisions apportioned to Bowland Fells SPA
Analysis Level Tiers 1-3 (including
Walney Extension) Tiers 1-4 Tiers 1-5
A 0.022 0.049 0.085
B 0.019 0.046 0.082
C 0.018 0.045 0.080
D 0.025 0.052 0.088
E 0.027 0.053 0.089
F 0.013 0.040 0.076
G 0.013 0.036 0.071
Walney Extension Offshore Wind Farm
Clarification Note – LBBG in-combination CRM
March 2014 Page 30
11. Conclusion
11.1 This report has presented seven analytical stages (levels A – G) investigating the in-combination
lesser black-backed gull collision risk to Morecambe Bay, Ribble and Alt Estuaries and Bowland
Fells SPAs.
11.2 Collision estimates at each analytical level were related to PBR outputs and are presented to
take account of the tiered approach to in-combination assessment as detailed by Natural
England and JNCC (2013). The analysis is considered to include considerable precaution at all
stages of the assessment. Identified areas where precaution / potential overestimation of
collision effects include the following:
The constructed turbine scenarios for the Project Site and Burbo Bank are likely to
involve a fewer number of larger turbines than assessed here. This will result in a
smaller ‘risk window’ within which collisions are possible compared to the design
envelope assessed in the Environmental Statement.
Collision estimates for Ormonde are based on a broad six month definition for the
breeding period which contrasts with the agree and more accurately defined breeding
season used in analysis of the Project Site. Appropriate data for the Ormonde offshore
wind farm have not be found to be available to correct CRM figures to the refined
lesser black-backed gull breeding season definition. However if the same effect was
applied as determined for West of Duddon Sands it would imply that 37% of collisions
at Ormonde lie outside of the agreed breeding season.
Collision estimates presented in DBERR (2008) are given for the annual cycle. Data
could not be sourced to provide a correction for the agreed breeding season.
However, again if the correction for West of Duddon Sands is taken into consideration
a figure significantly higher than 37% of collisions are likely to be outside of the
breeding season for Gwynt y Môr, Rhyl Flats, Burbo Bank and North Hoyle.
Analysis of Stage F suggests an exponential relationship between colony size and
density at sea may be highly precautionary. The data collected implies that the
reduction in Morecambe Bay SPA population has had a disproportionately negative
effect of at sea density at adjacent wind farms sites in the Irish Sea.
The collision risk values used in this report, that are calculated using the Band (2012)
CRM, are focussed on Option 2 of that model as requested by Natural England.
However, the Applicant maintains that Option 3 provides the most mathematically
advanced model available and its use remains valid. As such, the assessment
incorporating results from Option 3, where applicable16, is presented in Appendices
13.1 and 13.2. For Morecambe Bay SPA, 86 breeding adults at risk of collision using
16
Option 3 results are available for Barrow, Burbo Bank Extension and Walney Extension
Walney Extension Offshore Wind Farm
Clarification Note – LBBG in-combination CRM
March 2014 Page 31
Option 3 estimates for projects within Tiers 1-4 (compared to 111 for Option 2
modelling). Comparable figures for Ribble & Alt Estuaries SPA and Bowland Fells SPA
are 29 and 15 adult Option 3 collisions per breeding season (compared to 49 and 24
Option 2 collisions respectively) (Appendix 13.1).
Collision figures for Rhiannon are estimates based on published ZAP data (Centrica
Energy 2011) and are unrefined with the exception of simple apportioning to the three
SPAs (i.e. Other gull colonies were not considered). The Rhiannon project has not yet
published its assessment and the values presented here can only be considered
provisional and precautionary at this stage.
11.3 Option 2 collisions apportioned to Morecambe Bay SPA represent an f value of between 0.085
(Tiers 1 – 3) and 0.111 (Tiers 1-4). In using Option 3 outputs for the Project Site, Burbo Bank
Extension and Barrow collisions apportioned to Morecambe Bay SPA represent an f value of
between 0.073 (Tiers 1 – 3) and 0.086 (Tiers 1-4).
11.4 Option 2 collisions apportioned to Ribble & Alt Estuaries SPA represent an f value of between
0.024 (Tiers 1 – 3) and 0.097 (Tiers 1-4). In using Option 3 outputs for the Project Site, Burbo
Bank Extension and Barrow collisions apportioned to Morecambe Bay SPA represent an f value
of between 0.022 (Tiers 1 – 3) and 0.057 (Tiers 1-4).
11.5 Option 2 collisions apportioned to Bowland Fells SPA represent an f value of between 0.013
(Tiers 1 – 3) and 0.036 (Tiers 1-4). In using Option 3 outputs for the Project Site, Burbo Bank
Extension and Barrow collisions apportioned to Morecambe Bay SPA represent an f value of
between 0.010(Tiers 1 – 3) and 0.022 (Tiers 1-4).
11.6 This analysis supports a conclusion of "no adverse effect" on the breeding lesser black-backed
gull interest feature of the Morecambe Bay, Ribble and Alt Estuaries, and Bowland Fells SPAs
for the Project alone and in-combination with other projects.
Walney Extension Offshore Wind Farm
Clarification Note – LBBG in-combination CRM
March 2014 Page 32
12. References
Band, B., 2012. Using a collision risk model to assess bird collision risks for offshore wind farms –
with extended method. Report to Strategic Ornithological Support Services, March 2012.
Barrow Offshore Wind Farm Limited, 2012. Post Construction Ornithological Monitoring – Third
Year Report and Overall Conclusions. Barrow Offshore Wind Farm Limited.
Centrica Energy, 2011. Irish Sea Zone Zonal Appraisal and Planning Report : Chapter 13
Ornithology.
DBERR, 2008. Appropriate Assessment with regard to Gwynt y Môr. Department for Business
Enterprise & Regulatory Reform.
Dillingham, P.W. and Fletcher, D. (2008) ‘Estimating the ability of birds to sustain additional
human-caused mortalities using a simple decision rule and allometric relationships’, Biological
Conservation, 141, pp. 1783-1792.
DONG Energy, 2013. Walney Extension offshore wind farm Habitats Regulations Assessment
DONG Energy, 2013a. Burbo Bank Extension Clarification Note: Lesser black-backed gull feature of
Morecambe Bay SPA. NIRAS Consulting Ltd report to DONG Energy.
DONG Energy, 2013b. Walney Extension Clarification Note: SPA apportioning and PBR analysis.
NIRAS Consulting Ltd report to DONG Energy.
DONG Energy, 2013c Walney I & II, post construction monitoring report.
DONG Energy, 2014a. Burbo Bank Extension: Appendix 9 – lesser black-backed gull collision risk
modelling. An update to the in-combination assessment. Amendment 27th January 2014. NIRAS
Consulting Ltd report to DONG Energy.
DONG Energy, 2014b. Burbo Bank Extension: Appendix 7 – updated lesser black-backed gull in-
combination collision risk assessment, following questions related to Issue Specific Hearing #3,
including apportioning of colony data. NIRAS Consulting Ltd report to DONG Energy.
DONG Energy, 2014c. Walney Extension Clarification Note: Collision risk modelling options and
potential collision height - updated. NIRAS Consulting Ltd report to DONG Energy, January 2014.
DONG Energy/Scottish Power Renewables 2013 West of Duddon Sands pre-construction monitoring
report
ESS Ltd. (2007). Rhyl Flats Offshore Wind Farm: Annual FEPA Monitoring Report (2005-6). Interim
report to RWE Group.
JNCC and Natural England, 2013a. JNCC and Natural England Suggested Tiers for Cumulative Impact
Assessment.
Walney Extension Offshore Wind Farm
Clarification Note – LBBG in-combination CRM
March 2014 Page 33
JNCC, 2013. Seabird Population Trends and Causes of Change: 1986-2012 Report (http://www.jncc.defra.gov.uk/page-3201). Joint Nature Conservation Committee. Updated July 2013
Natural England, 2013. Natural England views on revised assessment of lesser black-backed gull
collision mortality in the Irish Sea – in relation to Burbo Bank Extension OWF.
NIRAS Consulting, 2013a. Burbo Bank Extension Offshore Wind Farm Clarification Note: lesser
black-backed gull feature of Morecambe Bay SPA. Cambridge: NIRAS Consulting Ltd.
NIRAS Consulting, 2013b. Burbo Bank Extension Offshore Wind Farm Scope of Works: Further consideration of lesser black-backed gull Morecambe Bay SPA. Cambridge: NIRAS Consulting Ltd.
NIRAS Consulting, 2013c. Barrow Offshore Wind Farm: Post Construction Boat-based Ornithological Monitoring –Third Year Report and Overall Conclusions. Cambridge: NIRAS Consulting Ltd.
Npower Renewables, 2006a. Gwynt y Môr Offshore Wind Farm: Environmental Statement.
Npower Renewables, 2006b. North Hoyle Offshore Wind Farm: Ornithological Monitoring 2004-
2005.
Npower Renewables 2007. North Hoyle Offshore Wind Farm: Ornithological Monitoring 2005-2006.
RPS, 2006a. West of Duddon Sands Offshore Windfarm Ornithological Impact Assessment. St Ives:
RPS.
RWE Npower & SSE Renewables, 2011. Galloper Wind Farm Project: Habitats Regulations
Assessment Report.
Seascape Energy Ltd., 2002. Burbo Offshore Wind Farm – Ornithology Final Report.
SSE Renewables, 2012. East Anglia One Wind Farm: Habitat Regulations Assessment Report.
Thaxter, C.B., Lascelles, B., Sugar, K., Cook, A.S.C.P., Roos, S., Bolton, M., Langston, R.H.W. and
Burton, N.H.K., 2012. Seabird foraging ranges as a preliminary tool for identifying candidate Marine
Protected Areas. Biological Conservation 156, 53-61.
Walney Offshore Windfarm, 2012. Walney Construction Boat-based Bird Monitoring Report.
Walney Offshore Windfarm.
Walney Offshore Extension Windfarm, 2013. Walney Extension Offshore Wind Farm Environmental
Statement Chapter 13 Offshore Ornithology. DONG Energy Walney Extension (UK) Ltd..
Wernham, C.V., Toms M.P., Marchant, J.H., Clark, J.A., Siriwardena, G.M. and Baillie, S.R. eds.,
2002. The Migration Atlas: movements of the birds of Britain and Ireland. T. & A.D. Poyser, London.
White, S., McCarthy, B., Dunstan, S., Martin, S., Harris, B., Hulme, G. and Marsh, P., 2013. The state
of Lancashire’s birds. An atlas survey of the breeding and wintering birds of Lancashire and North
Merseyside, 2007-2011. [Online]. Available at: http://www.lacfs.org.uk/Lancs%20Birds.html
(Accessed October 2013).
Walney Extension Offshore Wind Farm
Clarification Note – LBBG in-combination CRM
March 2014 Page 34
13. Appendices
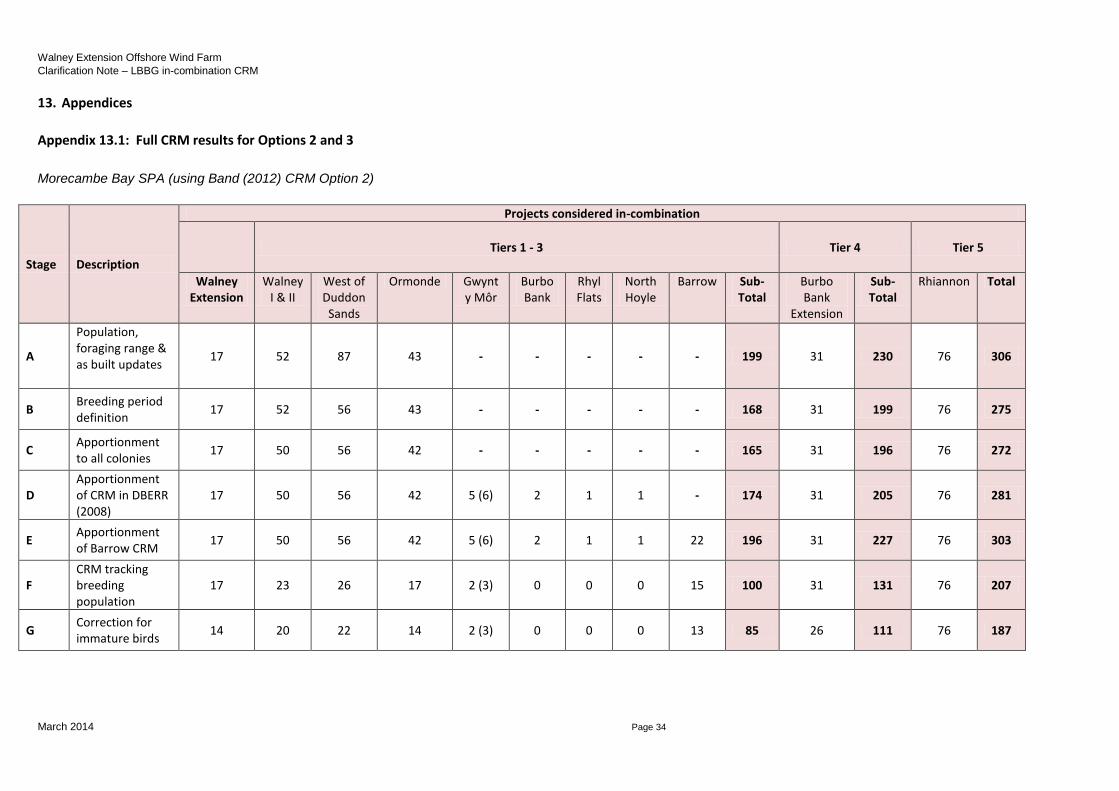
Appendix 13.1: Full CRM results for Options 2 and 3
Morecambe Bay SPA (using Band (2012) CRM Option 2)
Stage Description
Projects considered in-combination
Tiers 1 - 3 Tier 4 Tier 5
Walney Extension
Walney I & II
West of Duddon Sands
Ormonde Gwynt y Môr
Burbo Bank
Rhyl Flats
North Hoyle
Barrow Sub-Total
Burbo Bank
Extension
Sub-Total
Rhiannon Total
A
Population, foraging range & as built updates
17 52 87 43 - - - - - 199 31 230 76 306
B Breeding period definition
17 52 56 43 - - - - - 168 31 199 76 275
C Apportionment to all colonies
17 50 56 42 - - - - - 165 31 196 76 272
D Apportionment of CRM in DBERR (2008)
17 50 56 42 5 (6) 2 1 1 - 174 31 205 76 281
E Apportionment of Barrow CRM
17 50 56 42 5 (6) 2 1 1 22 196 31 227 76 303
F CRM tracking breeding population
17 23 26 17 2 (3) 0 0 0 15 100 31 131 76 207
G Correction for immature birds
14 20 22 14 2 (3) 0 0 0 13 85 26 111 76 187
Walney Extension Offshore Wind Farm
Clarification Note – LBBG in-combination CRM
March 2014 Page 35
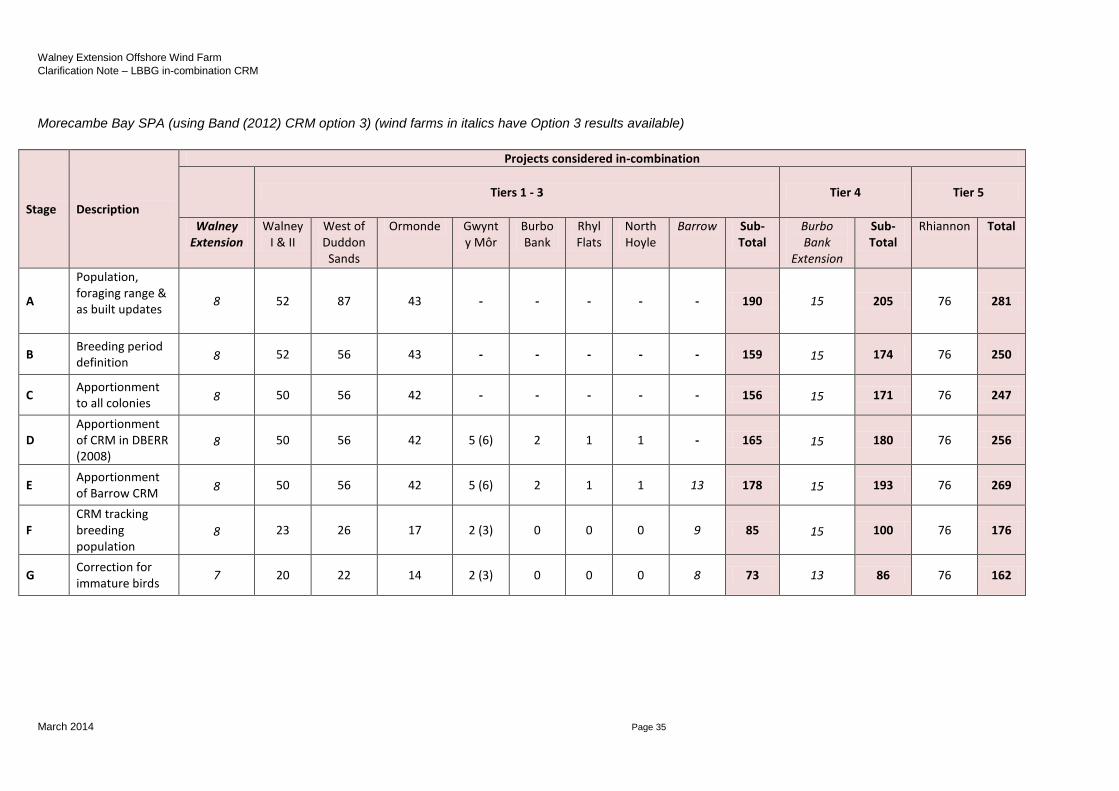
Morecambe Bay SPA (using Band (2012) CRM option 3) (wind farms in italics have Option 3 results available)
Stage Description
Projects considered in-combination
Tiers 1 - 3 Tier 4 Tier 5
Walney Extension
Walney I & II
West of Duddon Sands
Ormonde Gwynt y Môr
Burbo Bank
Rhyl Flats
North Hoyle
Barrow Sub-Total
Burbo Bank
Extension
Sub-Total
Rhiannon Total
A
Population, foraging range & as built updates
8 52 87 43 - - - - - 190 15 205 76 281
B Breeding period definition
8 52 56 43 - - - - - 159 15 174 76 250
C Apportionment to all colonies
8 50 56 42 - - - - - 156 15 171 76 247
D Apportionment of CRM in DBERR (2008)
8 50 56 42 5 (6) 2 1 1 - 165 15 180 76 256
E Apportionment of Barrow CRM
8 50 56 42 5 (6) 2 1 1 13 178 15 193 76 269
F CRM tracking breeding population
8 23 26 17 2 (3) 0 0 0 9 85 15 100 76 176
G Correction for immature birds
7 20 22 14 2 (3) 0 0 0 8 73 13 86 76 162

Walney Extension Offshore Wind Farm
Clarification Note – LBBG in-combination CRM
March 2014 Page 36
Ribble & Alt Estuaries SPA (using Band (2012) CRM Option 2)
Stage Description
Projects considered in-combination
Tiers 1 - 3 Tier 4 Tier 5
Walney Extension
Walney I & II
West of Duddon Sands
Ormonde Gwynt y Môr
Burbo Bank
Rhyl Flats
North Hoyle
Barrow Sub-Total
Burbo Bank
Extension
Sub-Total
Rhiannon Total
A
Population, foraging range & as built updates
1 4 6 2 - - - - - 13 44 57 26 83
B Breeding period definition
1 4 4 2 - - - - - 11 44 55 26 81
C Apportionment to all colonies
1 2 2 1 - - - - - 6 44 50 26 76
D Apportionment of CRM in DBERR (2008)
1 2 2 1 3 (4) 2 0 0 - 11 44 55 26 81
E Apportionment of Barrow CRM
1 2 2 1 3 (4) 2 0 0 1 12 44 56 26 82
F CRM tracking breeding population
Considered not applicable by Natural England
G Correction for immature birds
1 2 2 1 3 (4) 2 0 0 1 12 37 49 26 75
Walney Extension Offshore Wind Farm
Clarification Note – LBBG in-combination CRM
March 2014 Page 37
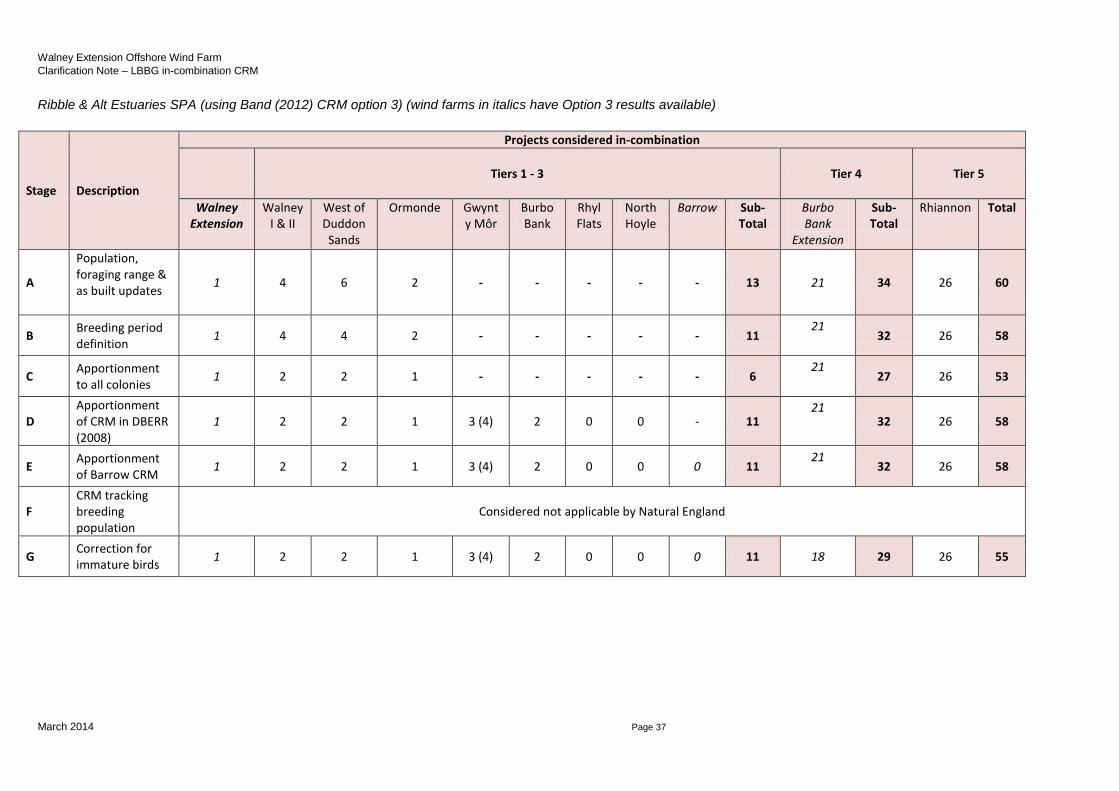
Ribble & Alt Estuaries SPA (using Band (2012) CRM option 3) (wind farms in italics have Option 3 results available)
Stage Description
Projects considered in-combination
Tiers 1 - 3 Tier 4 Tier 5
Walney Extension
Walney I & II
West of Duddon Sands
Ormonde Gwynt y Môr
Burbo Bank
Rhyl Flats
North Hoyle
Barrow Sub-Total
Burbo Bank
Extension
Sub-Total
Rhiannon Total
A
Population, foraging range & as built updates
1 4 6 2 - - - - - 13 21 34 26 60
B Breeding period definition
1 4 4 2 - - - - - 11 21
32 26 58
C Apportionment to all colonies
1 2 2 1 - - - - - 6 21
27 26 53
D Apportionment of CRM in DBERR (2008)
1 2 2 1 3 (4) 2 0 0 - 11 21
32 26 58
E Apportionment of Barrow CRM
1 2 2 1 3 (4) 2 0 0 0 11 21
32 26 58
F CRM tracking breeding population
Considered not applicable by Natural England
G Correction for immature birds
1 2 2 1 3 (4) 2 0 0 0 11 18 29 26 55
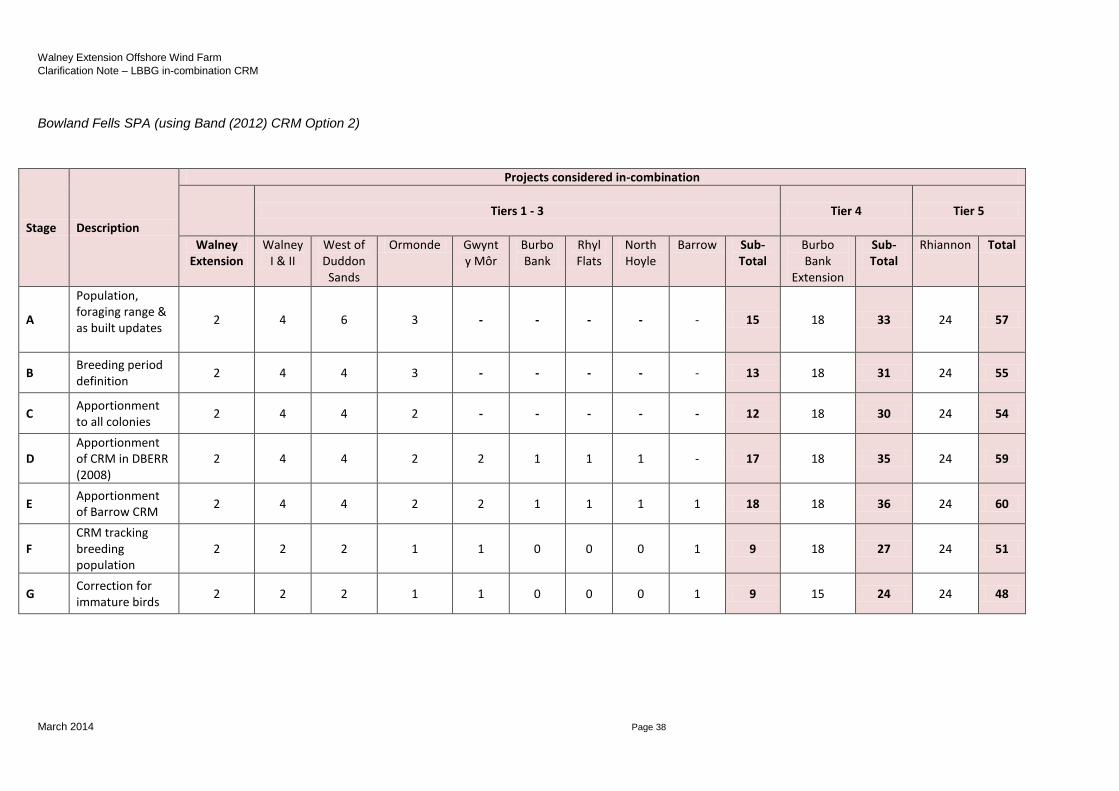
Walney Extension Offshore Wind Farm
Clarification Note – LBBG in-combination CRM
March 2014 Page 38
Bowland Fells SPA (using Band (2012) CRM Option 2)
Stage Description
Projects considered in-combination
Tiers 1 - 3 Tier 4 Tier 5
Walney Extension
Walney I & II
West of Duddon Sands
Ormonde Gwynt y Môr
Burbo Bank
Rhyl Flats
North Hoyle
Barrow Sub-Total
Burbo Bank
Extension
Sub-Total
Rhiannon Total
A
Population, foraging range & as built updates
2 4 6 3 - - - - - 15 18 33 24 57
B Breeding period definition
2 4 4 3 - - - - - 13 18 31 24 55
C Apportionment to all colonies
2 4 4 2 - - - - - 12 18 30 24 54
D Apportionment of CRM in DBERR (2008)
2 4 4 2 2 1 1 1 - 17 18 35 24 59
E Apportionment of Barrow CRM
2 4 4 2 2 1 1 1 1 18 18 36 24 60
F CRM tracking breeding population
2 2 2 1 1 0 0 0 1 9 18 27 24 51
G Correction for immature birds
2 2 2 1 1 0 0 0 1 9 15 24 24 48

Walney Extension Offshore Wind Farm
Clarification Note – LBBG in-combination CRM
March 2014 Page 39
Bowland Fells SPA (using Band (2012) CRM option 3) (wind farms in italics have Option 3 results available)
Stage Description
Projects considered in-combination
Tiers 1 - 3 Tier 4 Tier 5
Walney Extension
Walney I & II
West of Duddon Sands
Ormonde Gwynt y Môr
Burbo Bank
Rhyl Flats
North Hoyle
Barrow Sub-Total
Burbo Bank
Extension
Sub-Total
Rhiannon Total
A
Population, foraging range & as built updates
1 4 6 3 - - - - - 14 9 23 24 47
B Breeding period definition
1 4 4 3 - - - - - 12 9 21 24 45
C Apportionment to all colonies
1 4 4 2 - - - - - 11 9 20 24 44
D Apportionment of CRM in DBERR (2008)
1 4 4 2 2 1 1 1 - 16 9 25 24 49
E Apportionment of Barrow CRM
1 4 4 2 2 1 1 1 0 16 9 25 24 49
F CRM tracking breeding population
1 2 2 1 1 0 0 0 0 7 9 16 24 40
G Correction for immature birds
1 2 2 1 1 0 0 0 0 7 8 15 24 39
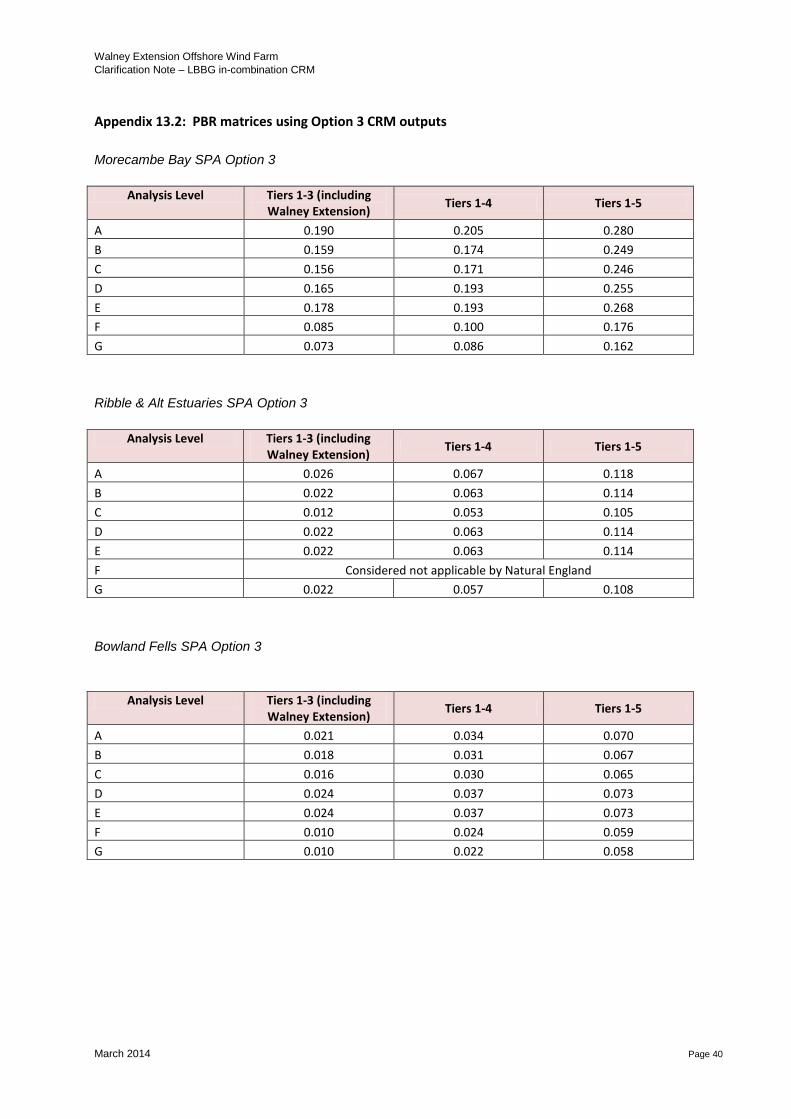
Walney Extension Offshore Wind Farm
Clarification Note – LBBG in-combination CRM
March 2014 Page 40
Appendix 13.2: PBR matrices using Option 3 CRM outputs
Morecambe Bay SPA Option 3
Analysis Level Tiers 1-3 (including Walney Extension)
Tiers 1-4 Tiers 1-5
A 0.190 0.205 0.280
B 0.159 0.174 0.249
C 0.156 0.171 0.246
D 0.165 0.193 0.255
E 0.178 0.193 0.268
F 0.085 0.100 0.176
G 0.073 0.086 0.162
Ribble & Alt Estuaries SPA Option 3
Analysis Level Tiers 1-3 (including Walney Extension)
Tiers 1-4 Tiers 1-5
A 0.026 0.067 0.118
B 0.022 0.063 0.114
C 0.012 0.053 0.105
D 0.022 0.063 0.114
E 0.022 0.063 0.114
F Considered not applicable by Natural England
G 0.022 0.057 0.108
Bowland Fells SPA Option 3
Analysis Level Tiers 1-3 (including Walney Extension)
Tiers 1-4 Tiers 1-5
A 0.021 0.034 0.070
B 0.018 0.031 0.067
C 0.016 0.030 0.065
D 0.024 0.037 0.073
E 0.024 0.037 0.073
F 0.010 0.024 0.059
G 0.010 0.022 0.058
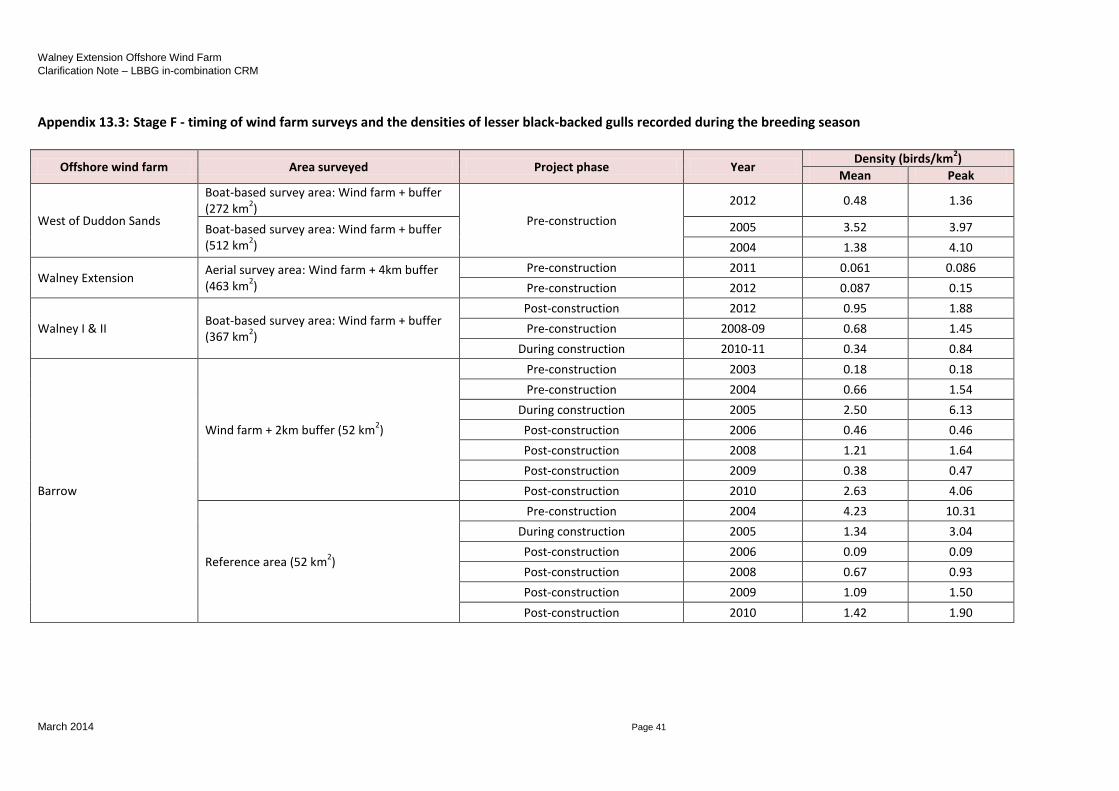
Walney Extension Offshore Wind Farm
Clarification Note – LBBG in-combination CRM
March 2014 Page 41
Appendix 13.3: Stage F - timing of wind farm surveys and the densities of lesser black-backed gulls recorded during the breeding season
Offshore wind farm Area surveyed Project phase Year Density (birds/km
2)
Mean Peak
West of Duddon Sands
Boat-based survey area: Wind farm + buffer (272 km
2)
Pre-construction
2012 0.48 1.36
Boat-based survey area: Wind farm + buffer (512 km
2)
2005 3.52 3.97
2004 1.38 4.10
Walney Extension Aerial survey area: Wind farm + 4km buffer (463 km
2)
Pre-construction 2011 0.061 0.086
Pre-construction 2012 0.087 0.15
Walney I & II Boat-based survey area: Wind farm + buffer (367 km
2)
Post-construction 2012 0.95 1.88
Pre-construction 2008-09 0.68 1.45
During construction 2010-11 0.34 0.84
Barrow
Wind farm + 2km buffer (52 km2)
Pre-construction 2003 0.18 0.18
Pre-construction 2004 0.66 1.54
During construction 2005 2.50 6.13
Post-construction 2006 0.46 0.46
Post-construction 2008 1.21 1.64
Post-construction 2009 0.38 0.47
Post-construction 2010 2.63 4.06
Reference area (52 km2)
Pre-construction 2004 4.23 10.31
During construction 2005 1.34 3.04
Post-construction 2006 0.09 0.09
Post-construction 2008 0.67 0.93
Post-construction 2009 1.09 1.50
Post-construction 2010 1.42 1.90