Embed Size (px)
Citation preview
Conference Paper NREL/CP-550-48295 August 2010
Walmart Experimental Store Performance Stories Preprint Michael Deru, Eric Kozubal, and Paul Norton Presented at ACEEE Summer Study Pacific Grove, California August 15–20, 2010
NOTICE
The submitted manuscript has been offered by an employee of the Alliance for Sustainable Energy, LLC (Alliance), a contractor of the US Government under Contract No. DE-AC36-08GO28308. Accordingly, the US Government and Alliance retain a nonexclusive royalty-free license to publish or reproduce the published form of this contribution, or allow others to do so, for US Government purposes.
This report was prepared as an account of work sponsored by an agency of the United States government. Neither the United States government nor any agency thereof, nor any of their employees, makes any warranty, express or implied, or assumes any legal liability or responsibility for the accuracy, completeness, or usefulness of any information, apparatus, product, or process disclosed, or represents that its use would not infringe privately owned rights. Reference herein to any specific commercial product, process, or service by trade name, trademark, manufacturer, or otherwise does not necessarily constitute or imply its endorsement, recommendation, or favoring by the United States government or any agency thereof. The views and opinions of authors expressed herein do not necessarily state or reflect those of the United States government or any agency thereof.
Available electronically at http://www.osti.gov/bridge
Available for a processing fee to U.S. Department of Energy and its contractors, in paper, from:
U.S. Department of Energy Office of Scientific and Technical Information P.O. Box 62 Oak Ridge, TN 37831-0062 phone: 865.576.8401 fax: 865.576.5728 email: mailto:[email protected]
Available for sale to the public, in paper, from: U.S. Department of Commerce National Technical Information Service 5285 Port Royal Road Springfield, VA 22161 phone: 800.553.6847 fax: 703.605.6900 email: [email protected] online ordering: http://www.ntis.gov/ordering.htm
Printed on paper containing at least 50% wastepaper, including 20% postconsumer waste
1
Walmart Experimental Store Performance Stories
Michael Deru, Eric Kozubal, and Paul Norton, National Renewable Energy Laboratory
ABSTRACT
Walmart opened two experimental stores—one in Colorado and one in Texas—in 2005 to serve as test beds for several advanced building systems. Each store embodied more than 50 experiments covering materials, water systems, energy systems, and renewable energy production. Walmart worked for three years with the National Renewable Energy Laboratory for the Colorado Store and Oak Ridge National Laboratory for the Texas store to monitor, analyze, and report on their performance. This paper presents the performance of the energy system in the Colorado store.
HVAC experiments included waste oil boilers, a microturbine/absorption chiller combined heat and power system, evaporative cooling, and a transpired solar collector. The refrigeration systems integrated a medium-temperature secondary loop, evaporatively cooled condenser, doors on medium-temperature cases, and light-emitting diodes on cases. Experiments in the lighting systems included a redesigned roof for clerestory daylighting and T-5 fluorescent lamps. Three photovoltaic systems for a total of 135 kW and a 50-kW wind turbine are also included.
The energy system performance was compared to the measured performance of a prototypical Walmart store and to other benchmarks where appropriate. Many worked well and continue to save energy. Some did not perform well and have been altered, or have been removed and replaced with other systems. Many lessons learned have been incorporated into the prototype design and help Walmart save energy in new stores. The revised systems have been monitored for the past year and show excellent energy performance.
Introduction Walmart has stated that it is committed to environmental responsibility, and that it wants
to be a leader in building and operating retail facilities that minimize the use of energy and natural resources. Since 1993, Walmart has constructed a series of experimental stores designed to test technologies and techniques for reducing its buildings’ energy and environmental impacts. Walmart continued this effort with the construction of two experimental supercenters—one in a hot climate (McKinney, Texas) and one in a cold climate (Aurora, Colorado) (see Figure 1). Each supercenter incorporated a wide range of advanced efficiency technologies to reduce its energy needs and employ solar and wind energy generated on site to meet some of the remaining energy needs. The two experimental stores were meant to be test beds for innovative technologies and employed mixes of “experiments” appropriate for the different climates.
The performance of these stores was monitored for three years (January 2006 through December 2008) by two U.S. Department of Energy national laboratories: the National Renewable Energy Laboratory (NREL) for the cold climate site in Aurora, Colorado, and Oak Ridge National Laboratory for the hot climate site in McKinney, Texas (Deru & MacDonald 2007; MacDonald & Deru 2007). For comparison, a prototypical Walmart supercenter near each experimental store was monitored during the same period. The reference stores were nearly identical in size and function to the experimental stores, but contained the Walmart prototypical
2
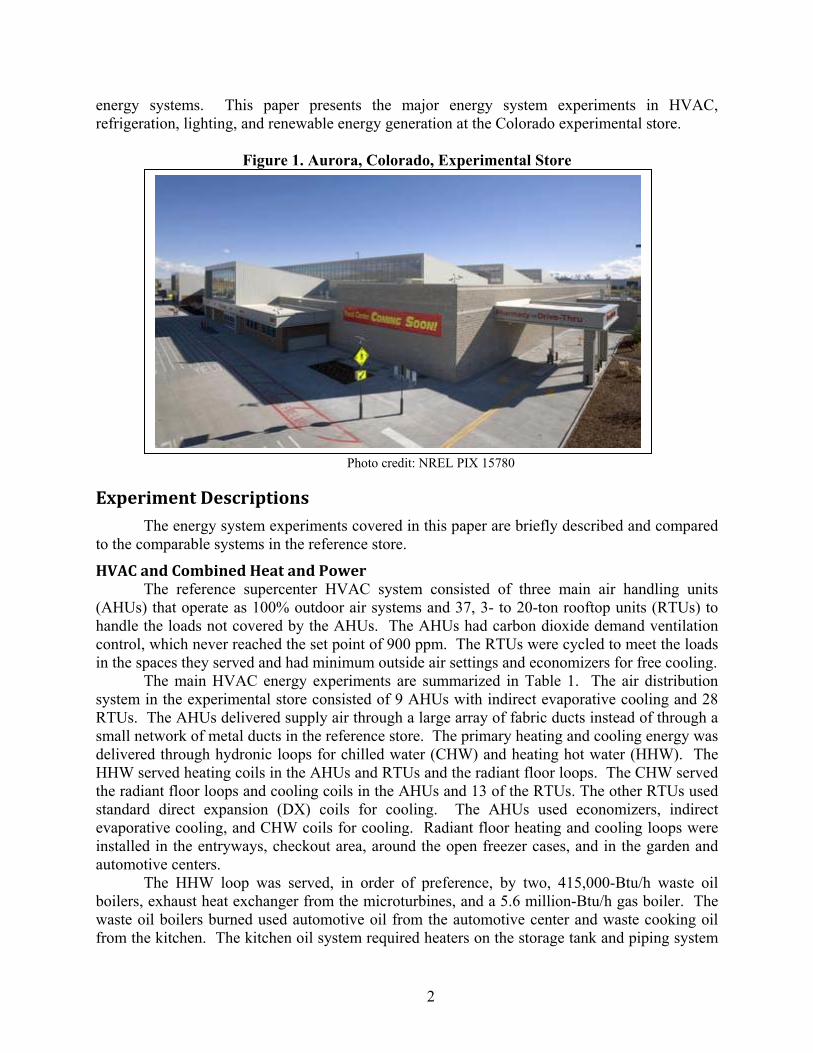
energy systems. This paper presents the major energy system experiments in HVAC, refrigeration, lighting, and renewable energy generation at the Colorado experimental store.
Figure 1. Aurora, Colorado, Experimental Store
Photo credit: NREL PIX 15780
Experiment Descriptions The energy system experiments covered in this paper are briefly described and compared
to the comparable systems in the reference store.
HVAC and Combined Heat and Power The reference supercenter HVAC system consisted of three main air handling units
(AHUs) that operate as 100% outdoor air systems and 37, 3- to 20-ton rooftop units (RTUs) to handle the loads not covered by the AHUs. The AHUs had carbon dioxide demand ventilation control, which never reached the set point of 900 ppm. The RTUs were cycled to meet the loads in the spaces they served and had minimum outside air settings and economizers for free cooling.
The main HVAC energy experiments are summarized in Table 1. The air distribution system in the experimental store consisted of 9 AHUs with indirect evaporative cooling and 28 RTUs. The AHUs delivered supply air through a large array of fabric ducts instead of through a small network of metal ducts in the reference store. The primary heating and cooling energy was delivered through hydronic loops for chilled water (CHW) and heating hot water (HHW). The HHW served heating coils in the AHUs and RTUs and the radiant floor loops. The CHW served the radiant floor loops and cooling coils in the AHUs and 13 of the RTUs. The other RTUs used standard direct expansion (DX) coils for cooling. The AHUs used economizers, indirect evaporative cooling, and CHW coils for cooling. Radiant floor heating and cooling loops were installed in the entryways, checkout area, around the open freezer cases, and in the garden and automotive centers.
The HHW loop was served, in order of preference, by two, 415,000-Btu/h waste oil boilers, exhaust heat exchanger from the microturbines, and a 5.6 million-Btu/h gas boiler. The waste oil boilers burned used automotive oil from the automotive center and waste cooking oil from the kitchen. The kitchen oil system required heaters on the storage tank and piping system
3
to prevent the oil from solidifying. The CHW water loop was served by a 120-ton double-effect absorption chiller driven by heat reclaim from the microturbine exhaust. A transpired solar collector covered most of the south wall (back) of the store and preheated the ventilation air for 2 of the AHUs and 11 of the RTUs near the back of the store.
Table 1. HVAC Experiments
System Experimental Store Reference Store
Radiant floor Radiant floor heating and cooling in the checkout area, entrances, frozen food aisles, garden center, auto center.
None
Combined heat and power
Six, 60-kW microturbines, a 1 0-ton double-effect absorption chiller, an air-to-water heat exchanger, and a cooling tower.
2 None
Indirect evaporative cooling
Main sales floor was served by 9 AHUs with indirect evaporative cooling. The AHUs also have cooling coil supplied by chiller for hottest days.
All cooling was from packaged DX units.
Air distribution system
Main sales floor had fabric ducts to induce stratification in the store and reduce the conditioned volume.
Air distribution from the AHUs and RTUs was through short metal ducts with diffusers near the ceiling.
Transpired solar collector air preheater
Two AHUs and 11RTUs along the south wall of the store received preheated air from the transpired solar collector in colder weather.
None
Recovered waste oil boilers
Burned used vehicle oil from auto shop and recovered cooking oil from the kitchen for HHW generation
All space heating was from gas fired furnace sections in the RTUs and unit heaters.
Refrigeration The sizes of the refrigerated cases and walk-in coolers and freezers were very similar
between the two stores; however, there were several experiments in the refrigeration systems (see Table 2). The reference supercenter used a standard distributed case refrigeration system with four compressor racks and air-cooled condensers. All of the medium-temperature cases were open and all used linear fluorescent lighting. The experimental store incorporated an evaporatively cooled condenser, a glycol secondary loop for the medium-temperature system, doors on all medium-temperature dairy and deli cases, light-emitting diodes (LEDs) in all cases, enhanced evaporator coil surfaces, and high-efficiency electrically commutated fan motors.
Table 2. Refrigeration Experiments
System Experimental Store Reference Store Condenser evaporative condenser air-cooled condensers
Secondary loop A heat exchanger and a secondary glycol loop were added to the medium-temperature refrigerant system.
Refrigerant was distributed to the cases.
Refrigeration cases
Cases had high-efficiency, enhanced coil surfaces and electrically commutated high-efficiency fan/motor packs in the medium-temperature cases. Doors were added to dairy and deli cases.
Standard efficiency cases and no doors on medium-temperature cases.
Case lights All cases used LEDs T8 linear fluorescent lights
4
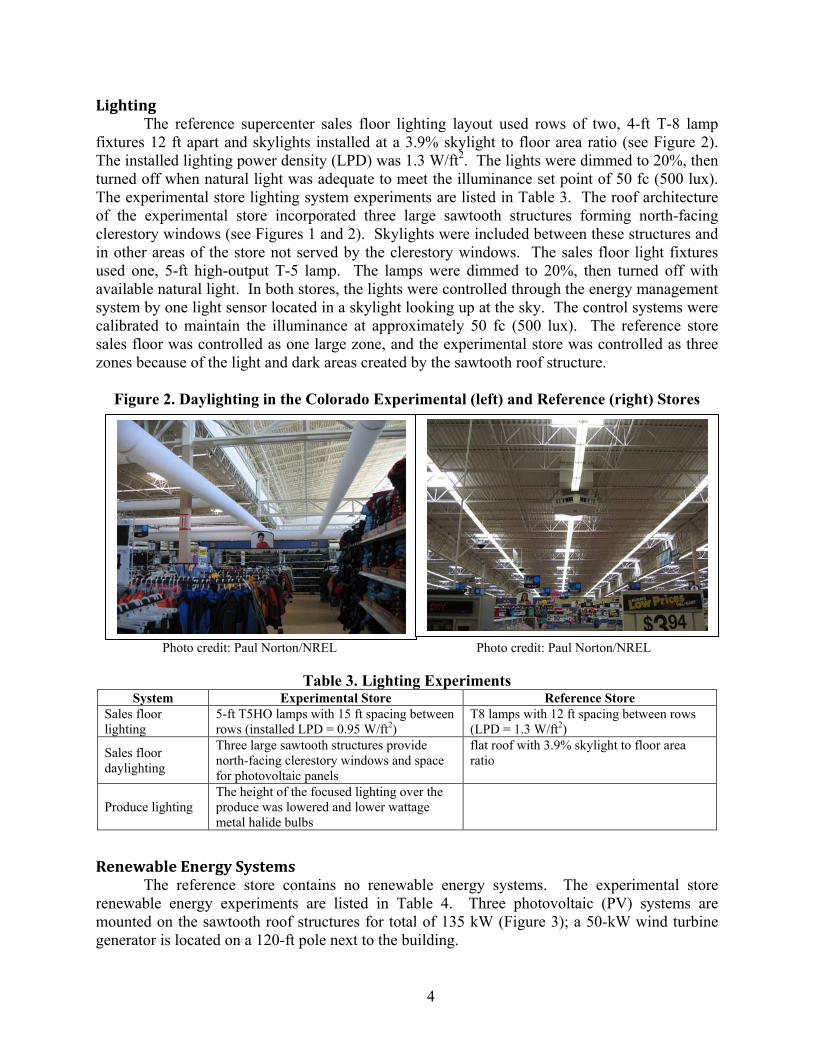
Lighting The reference supercenter sales floor lighting layout used rows of two, 4-ft T-8 lamp
fixtures 12 ft apart and skylights installed at a 3.9% skylight to floor area ratio (see Figure 2). The installed lighting power density (LPD) was 1.3 W/ft2. The lights were dimmed to 20%, then turned off when natural light was adequate to meet the illuminance set point of 50 fc (500 lux). The experimental store lighting system experiments are listed in Table 3. The roof architecture of the experimental store incorporated three large sawtooth structures forming north-facing clerestory windows (see Figures 1 and 2). Skylights were included between these structures and in other areas of the store not served by the clerestory windows. The sales floor light fixtures used one, 5-ft high-output T-5 lamp. The lamps were dimmed to 20%, then turned off with available natural light. In both stores, the lights were controlled through the energy management system by one light sensor located in a skylight looking up at the sky. The control systems were calibrated to maintain the illuminance at approximately 50 fc (500 lux). The reference store sales floor was controlled as one large zone, and the experimental store was controlled as three zones because of the light and dark areas created by the sawtooth roof structure.
Figure 2. Daylighting in the Colorado Experimental (left) and Reference (right) Stores
Photo credit: Paul Norton/NREL Photo credit: Paul Norton/NREL
Table 3. Lighting Experiments System Experimental Store Reference Store
Sales floor lighting
5-ft T5HO lamps with 15 ft spacing between rows (installed LPD = 0.95 W/ft2)
T8 lamps with 12 ft spacing between rows (LPD = 1.3 W/ft2)
Sales floor daylighting
Three large sawtooth structures provide north-facing clerestory windows and space for photovoltaic panels
flat roof with 3.9% skylight to floor area ratio
Produce lighting The height of the focused lighting over the produce was lowered and lower wattage metal halide bulbs
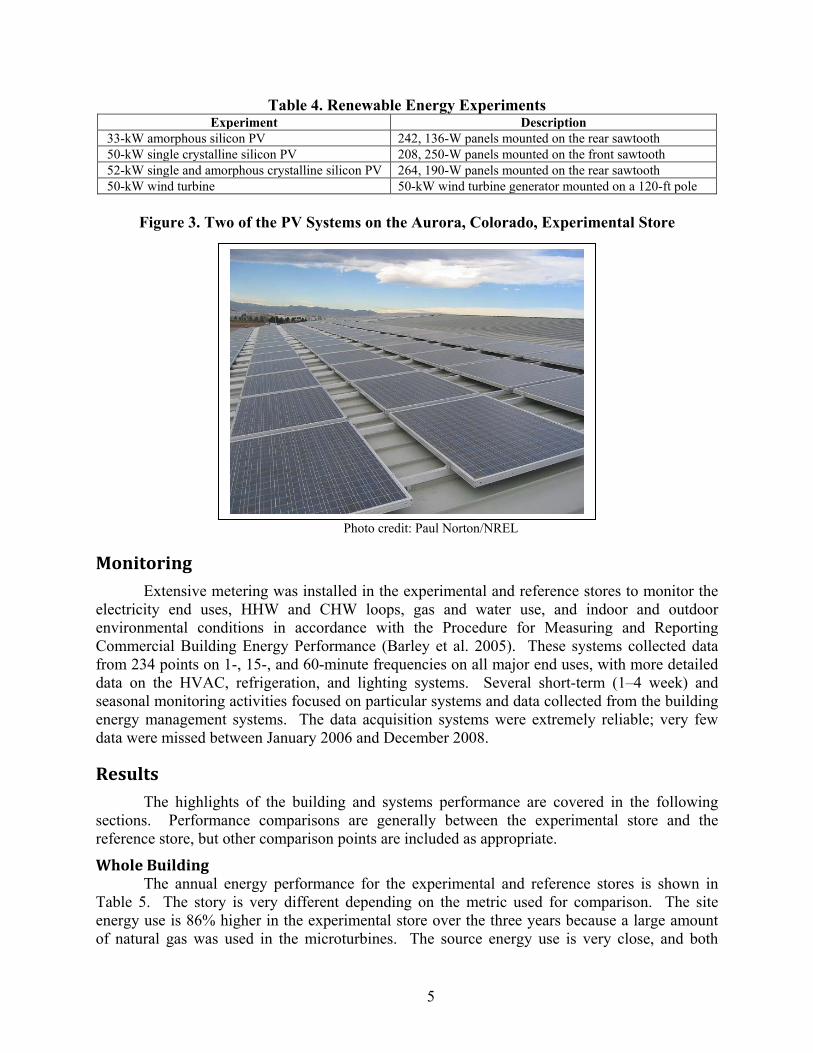
Renewable Energy Systems The reference store contains no renewable energy systems. The experimental store
renewable energy experiments are listed in Table 4. Three photovoltaic (PV) systems are mounted on the sawtooth roof structures for total of 135 kW (Figure 3); a 50-kW wind turbine generator is located on a 120-ft pole next to the building.
5
Table 4. Renewable Energy Experiments Experiment Description
33-kW amorphous silicon PV 242, 136-W panels mounted on the rear sawtooth 50-kW single crystalline silicon PV 208, 250-W panels mounted on the front sawtooth 52-kW single and amorphous crystalline silicon PV 264, 190-W panels mounted on the rear sawtooth 50-kW wind turbine 50-kW wind turbine generator mounted on a 120-ft pole
Figure 3. Two of the PV Systems on the Aurora, Colorado, Experimental Store
Photo credit: Paul Norton/NREL
Monitoring Extensive metering was installed in the experimental and reference stores to monitor the
electricity end uses, HHW and CHW loops, gas and water use, and indoor and outdoor environmental conditions in accordance with the Procedure for Measuring and Reporting Commercial Building Energy Performance (Barley et al. 2005). These systems collected data from 234 points on 1-, 15-, and 60-minute frequencies on all major end uses, with more detailed data on the HVAC, refrigeration, and lighting systems. Several short-term (1–4 week) and seasonal monitoring activities focused on particular systems and data collected from the building energy management systems. The data acquisition systems were extremely reliable; very few data were missed between January 2006 and December 2008.
Results The highlights of the building and systems performance are covered in the following
sections. Performance comparisons are generally between the experimental store and the reference store, but other comparison points are included as appropriate.
Whole Building The annual energy performance for the experimental and reference stores is shown in
Table 5. The story is very different depending on the metric used for comparison. The site energy use is 86% higher in the experimental store over the three years because a large amount of natural gas was used in the microturbines. The source energy use is very close, and both
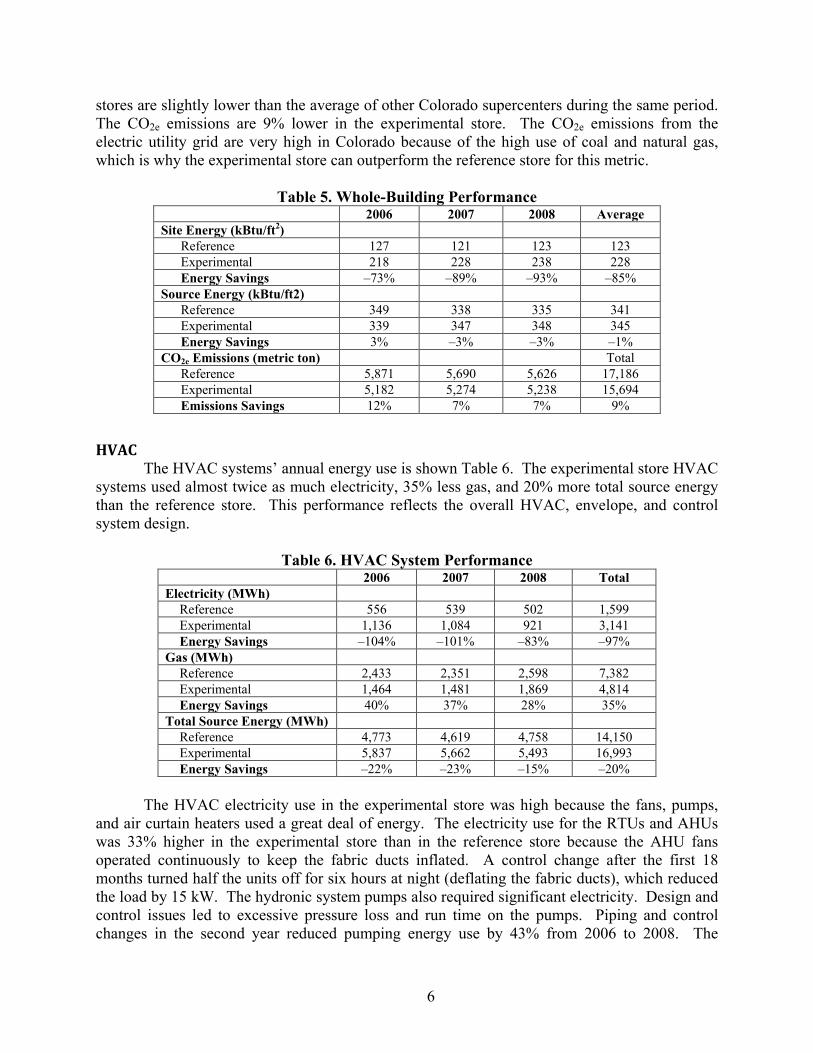
6
stores are slightly lower than the average of other Colorado supercenters during the same period. The CO2e emissions are 9% lower in the experimental store. The CO2e emissions from the electric utility grid are very high in Colorado because of the high use of coal and natural gas, which is why the experimental store can outperform the reference store for this metric.
Table 5. Whole-Building Performance
2006 2007 2008 Average Site Energy (kBtu/ft2)
Reference 127 121 123 123 Experimental 218 228 238 228 Energy Savings –73% –89% –93% –85%
Source Energy (kBtu/ft2) Reference 349 338 335 341 Experimental 339 347 348 345 Energy Savings 3% –3% –3% –1%
CO2e Emissions (metric ton) Total Reference 5,871 5,690 5,626 17,186 Experimental 5,182 5,274 5,238 15,694 Emissions Savings 12% 7% 7% 9%
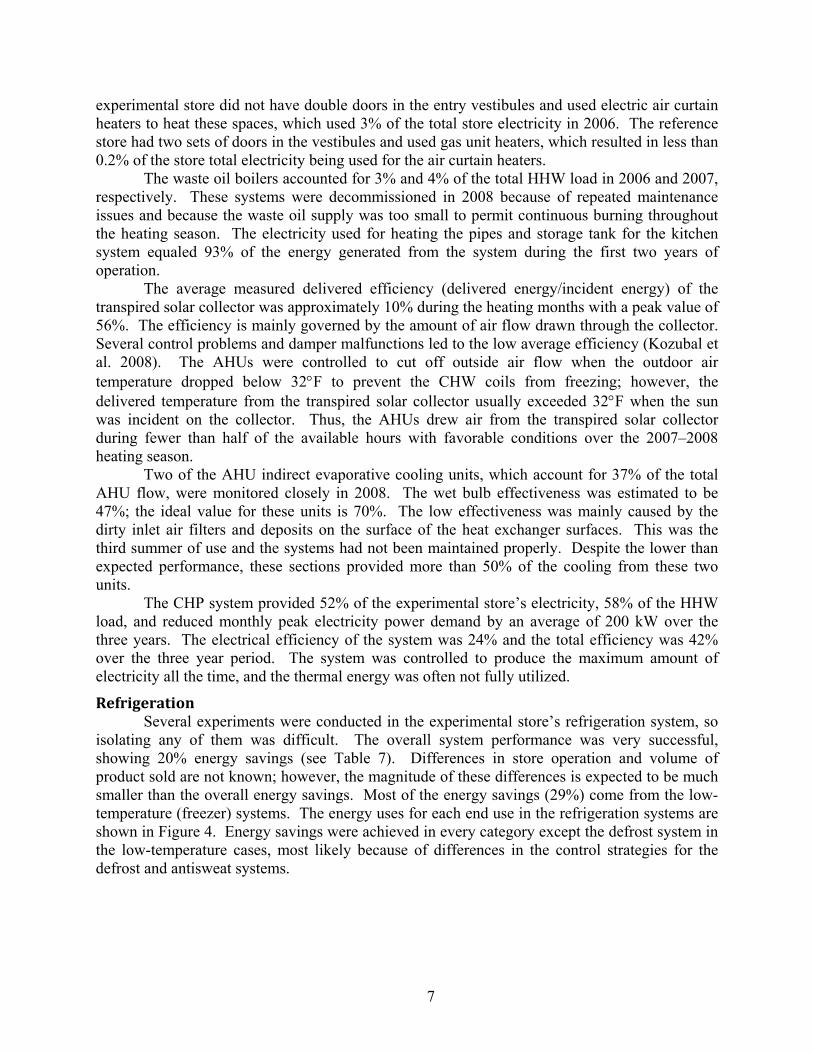
HVAC The HVAC systems’ annual energy use is shown Table 6. The experimental store HVAC
systems used almost twice as much electricity, 35% less gas, and 20% more total source energy than the reference store. This performance reflects the overall HVAC, envelope, and control system design.
Table 6. HVAC System Performance
2006 2007 2008 Total Electricity (MWh)
Reference 556 539 502 1,599 Experimental 1,136 1,084 921 3,141 Energy Savings –104% –101% –83% –97%
Gas (MWh) Reference 2,433 2,351 2,598 7,382 Experimental 1,464 1,481 1,869 4,814 Energy Savings 40% 37% 28% 35%
Total Source Energy (MWh) Reference 4,773 4,619 4,758 14,150 Experimental 5,837 5,662 5,493 16,993 Energy Savings –22% –23% –15% –20%
The HVAC electricity use in the experimental store was high because the fans, pumps,
and air curtain heaters used a great deal of energy. The electricity use for the RTUs and AHUs was 33% higher in the experimental store than in the reference store because the AHU fans operated continuously to keep the fabric ducts inflated. A control change after the first 18 months turned half the units off for six hours at night (deflating the fabric ducts), which reduced the load by 15 kW. The hydronic system pumps also required significant electricity. Design and control issues led to excessive pressure loss and run time on the pumps. Piping and control changes in the second year reduced pumping energy use by 43% from 2006 to 2008. The
7
experimental store did not have double doors in the entry vestibules and used electric air curtain heaters to heat these spaces, which used 3% of the total store electricity in 2006. The reference store had two sets of doors in the vestibules and used gas unit heaters, which resulted in less than 0.2% of the store total electricity being used for the air curtain heaters.
The waste oil boilers accounted for 3% and 4% of the total HHW load in 2006 and 2007, respectively. These systems were decommissioned in 2008 because of repeated maintenance issues and because the waste oil supply was too small to permit continuous burning throughout the heating season. The electricity used for heating the pipes and storage tank for the kitchen system equaled 93% of the energy generated from the system during the first two years of operation.
The average measured delivered efficiency (delivered energy/incident energy) of the transpired solar collector was approximately 10% during the heating months with a peak value of 56%. The efficiency is mainly governed by the amount of air flow drawn through the collector. Several control problems and damper malfunctions led to the low average efficiency (Kozubal et al. 2008). The AHUs were controlled to cut off outside air flow when the outdoor air temperature dropped below 32°F to prevent the CHW coils from freezing; however, the delivered temperature from the transpired solar collector usually exceeded 32°F when the sun was incident on the collector. Thus, the AHUs drew air from the transpired solar collector during fewer than half of the available hours with favorable conditions over the 2007–2008 heating season.
Two of the AHU indirect evaporative cooling units, which account for 37% of the total AHU flow, were monitored closely in 2008. The wet bulb effectiveness was estimated to be 47%; the ideal value for these units is 70%. The low effectiveness was mainly caused by the dirty inlet air filters and deposits on the surface of the heat exchanger surfaces. This was the third summer of use and the systems had not been maintained properly. Despite the lower than expected performance, these sections provided more than 50% of the cooling from these two units.
The CHP system provided 52% of the experimental store’s electricity, 58% of the HHW load, and reduced monthly peak electricity power demand by an average of 200 kW over the three years. The electrical efficiency of the system was 24% and the total efficiency was 42% over the three year period. The system was controlled to produce the maximum amount of electricity all the time, and the thermal energy was often not fully utilized.
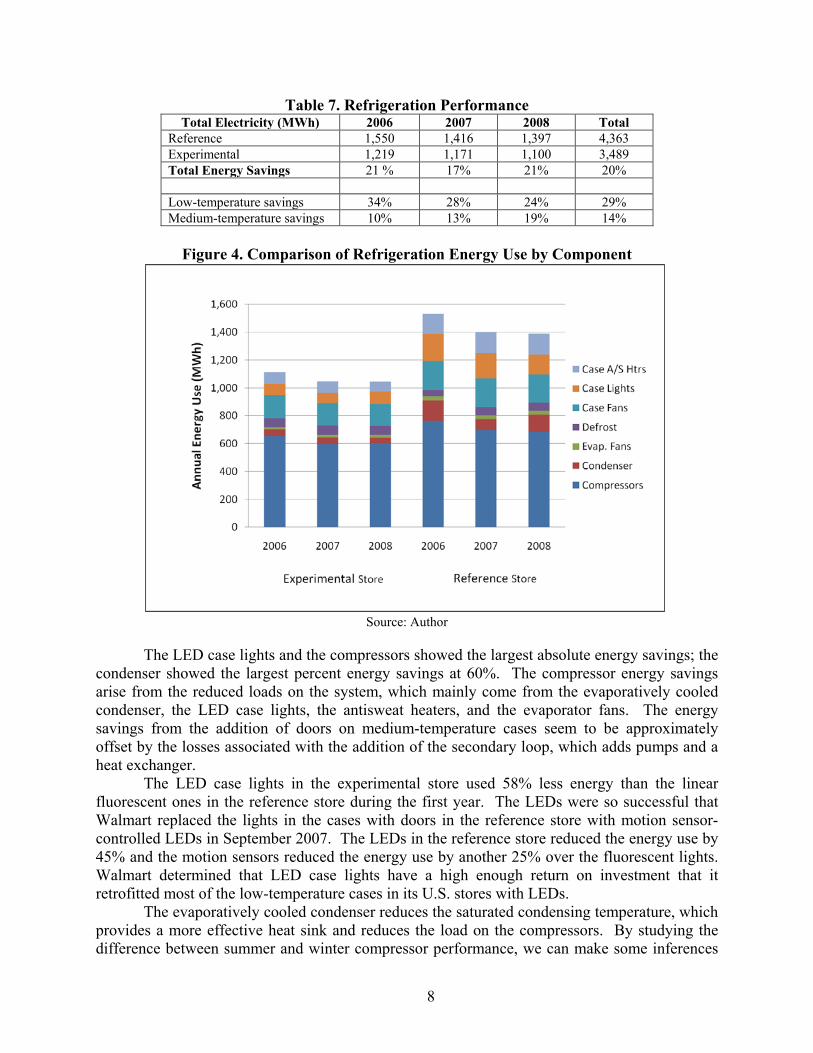
Refrigeration Several experiments were conducted in the experimental store’s refrigeration system, so
isolating any of them was difficult. The overall system performance was very successful, showing 20% energy savings (see Table 7). Differences in store operation and volume of product sold are not known; however, the magnitude of these differences is expected to be much smaller than the overall energy savings. Most of the energy savings (29%) come from the low-temperature (freezer) systems. The energy uses for each end use in the refrigeration systems are shown in Figure 4. Energy savings were achieved in every category except the defrost system in the low-temperature cases, most likely because of differences in the control strategies for the defrost and antisweat systems.
8
Table 7. Refrigeration Performance Total Electricity (MWh) 2006 2007 2008 Total
Reference 1,550 1,416 1,397 4,363 Experimental 1,219 1,171 1,100 3,489 Total Energy Savings 21 % 17% 21% 20% Low-temperature savings 34% 28% 24% 29% Medium-temperature savings 10% 13% 19% 14%
Figure 4. Comparison of Refrigeration Energy Use by Component
Source: Author
The LED case lights and the compressors showed the largest absolute energy savings; the condenser showed the largest percent energy savings at 60%. The compressor energy savings arise from the reduced loads on the system, which mainly come from the evaporatively cooled condenser, the LED case lights, the antisweat heaters, and the evaporator fans. The energy savings from the addition of doors on medium-temperature cases seem to be approximately offset by the losses associated with the addition of the secondary loop, which adds pumps and a heat exchanger.
The LED case lights in the experimental store used 58% less energy than the linear fluorescent ones in the reference store during the first year. The LEDs were so successful that Walmart replaced the lights in the cases with doors in the reference store with motion sensor-controlled LEDs in September 2007. The LEDs in the reference store reduced the energy use by 45% and the motion sensors reduced the energy use by another 25% over the fluorescent lights. Walmart determined that LED case lights have a high enough return on investment that it retrofitted most of the low-temperature cases in its U.S. stores with LEDs.
The evaporatively cooled condenser reduces the saturated condensing temperature, which provides a more effective heat sink and reduces the load on the compressors. By studying the difference between summer and winter compressor performance, we can make some inferences
9
about the impacts of the evaporatively cooled condenser. The compressor peak power demand for both stores was very similar in the winter, but the difference in the summer ranged from 20 kW to 30 kW. The difference in monthly compressor energy use (reference store – experimental store) ranged from 4,000 kWh in the winter to 16,000 kWh in the summer. Both effects are primarily attributed to the evaporatively cooled condenser compared to the air-cooled condenser.
The addition of doors to multideck refrigerated cases is an important efficiency measure, but it was difficult to separate out the effect. Previous research has shown a 68% load reduction and better product temperature control (Faramarzi et al. 2002).
The main reason for using a secondary loop is to reduce the refrigerant charge. In fact, because of the losses in the heat exchanger and the added pumping energy for the glycol, the secondary loop likely increased the energy use in this store. Recent more compact and more efficient secondary loop designs show more than 90% reduction in refrigerant charge and are very close to being energy neutral compared to the distributed design.
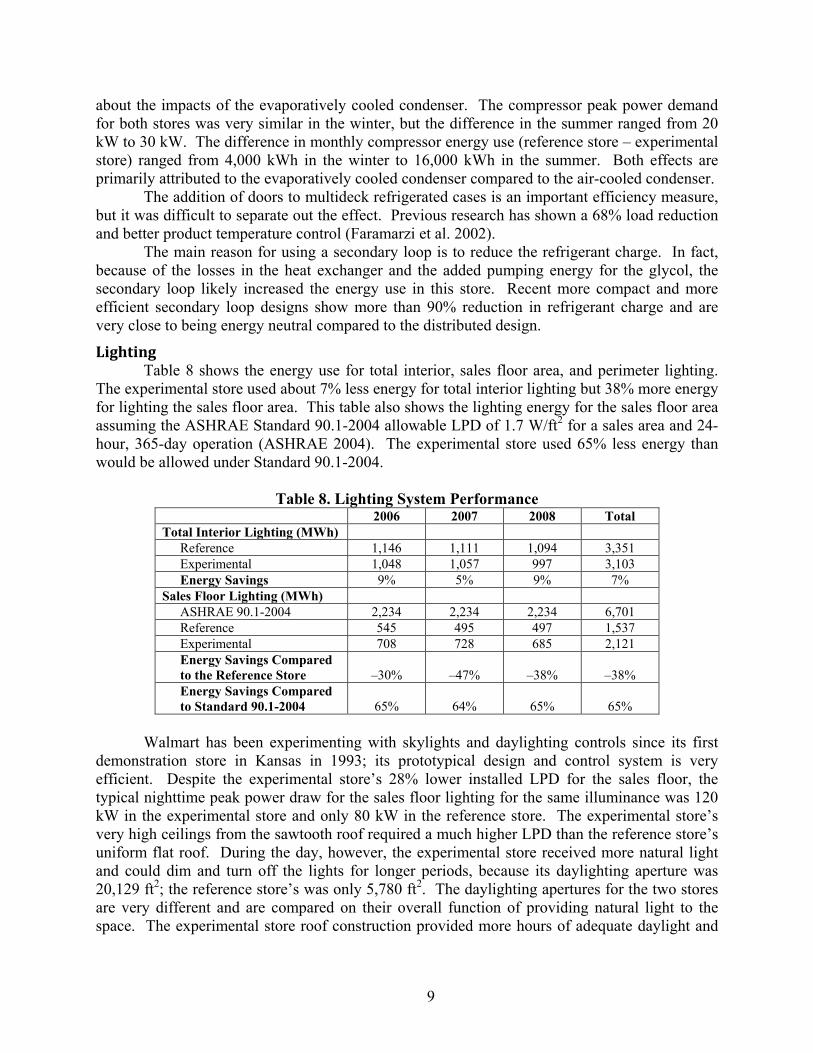
Lighting Table 8 shows the energy use for total interior, sales floor area, and perimeter lighting.
The experimental store used about 7% less energy for total interior lighting but 38% more energy for lighting the sales floor area. This table also shows the lighting energy for the sales floor area assuming the ASHRAE Standard 90.1-2004 allowable LPD of 1.7 W/ft2 for a sales area and 24-hour, 365-day operation (ASHRAE 2004). The experimental store used 65% less energy than would be allowed under Standard 90.1-2004.
Table 8. Lighting System Performance
2006 2007 2008 Total Total Interior Lighting (MWh)
Reference 1,146 1,111 1,094 3,351 Experimental 1,048 1,057 997 3,103 Energy Savings 9% 5% 9% 7%
Sales Floor Lighting (MWh) ASHRAE 90.1-2004 2,234 2,234 2,234 6,701 Reference 545 495 497 1,537 Experimental 708 728 685 2,121 Energy Savings Compared to the Reference Store –30% –47% –38% –38% Energy Savings Compared to Standard 90.1-2004 65% 64% 65% 65%
Walmart has been experimenting with skylights and daylighting controls since its first
demonstration store in Kansas in 1993; its prototypical design and control system is very efficient. Despite the experimental store’s 28% lower installed LPD for the sales floor, the typical nighttime peak power draw for the sales floor lighting for the same illuminance was 120 kW in the experimental store and only 80 kW in the reference store. The experimental store’s very high ceilings from the sawtooth roof required a much higher LPD than the reference store’s uniform flat roof. During the day, however, the experimental store received more natural light and could dim and turn off the lights for longer periods, because its daylighting aperture was 20,129 ft2; the reference store’s was only 5,780 ft2. The daylighting apertures for the two stores are very different and are compared on their overall function of providing natural light to the space. The experimental store roof construction provided more hours of adequate daylight and
10
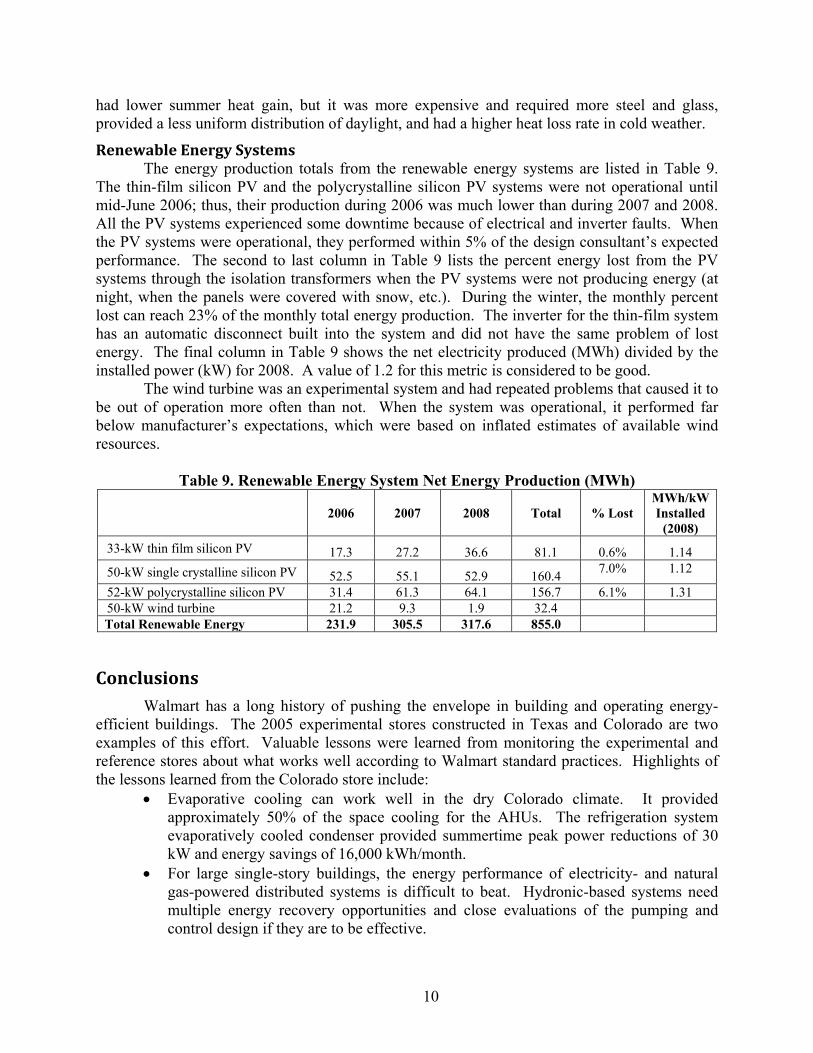
had lower summer heat gain, but it was more expensive and required more steel and glass, provided a less uniform distribution of daylight, and had a higher heat loss rate in cold weather.
Renewable Energy Systems The energy production totals from the renewable energy systems are listed in Table 9.
The thin-film silicon PV and the polycrystalline silicon PV systems were not operational until mid-June 2006; thus, their production during 2006 was much lower than during 2007 and 2008. All the PV systems experienced some downtime because of electrical and inverter faults. When the PV systems were operational, they performed within 5% of the design consultant’s expected performance. The second to last column in Table 9 lists the percent energy lost from the PV systems through the isolation transformers when the PV systems were not producing energy (at night, when the panels were covered with snow, etc.). During the winter, the monthly percent lost can reach 23% of the monthly total energy production. The inverter for the thin-film system has an automatic disconnect built into the system and did not have the same problem of lost energy. The final column in Table 9 shows the net electricity produced (MWh) divided by the installed power (kW) for 2008. A value of 1.2 for this metric is considered to be good.
The wind turbine was an experimental system and had repeated problems that caused it to be out of operation more often than not. When the system was operational, it performed far below manufacturer’s expectations, which were based on inflated estimates of available wind resources.
Table 9. Renewable Energy System Net Energy Production (MWh)
2006 2007 2008 Total % Lost MWh/kW Installed
(2008) 33-kW thin film silicon PV 17.3 27.2 36.6 81.1 0.6% 1.14 50-kW single crystalline silicon PV 52.5 55.1 52.9 160.4 7.0% 1.12
52-kW polycrystalline silicon PV 31.4 61.3 64.1 156.7 6.1% 1.31 50-kW wind turbine 21.2 9.3 1.9 32.4 Total Renewable Energy 231.9 305.5 317.6 855.0
Conclusions Walmart has a long history of pushing the envelope in building and operating energy-
efficient buildings. The 2005 experimental stores constructed in Texas and Colorado are two examples of this effort. Valuable lessons were learned from monitoring the experimental and reference stores about what works well according to Walmart standard practices. Highlights of the lessons learned from the Colorado store include:
• Evaporative cooling can work well in the dry Colorado climate. It provided approximately 50% of the space cooling for the AHUs. The refrigeration system evaporatively cooled condenser provided summertime peak power reductions of 30 kW and energy savings of 16,000 kWh/month.
• For large single-story buildings, the energy performance of electricity- and natural gas-powered distributed systems is difficult to beat. Hydronic-based systems need multiple energy recovery opportunities and close evaluations of the pumping and control design if they are to be effective.
11
• The transpired solar collector effectively delivered preheated ventilation air, but it must be controlled properly to optimize performance.
• Combined heat and power systems must have consistent thermal and electrical loads. This store did not have a consistent thermal load and was costly to operate.
• Secondary refrigeration loops significantly reduce refrigerant charge and can provide at least equal energy performance to standard refrigeration systems.
• LED case lights can provide significant energy savings (about 50%) over linear fluorescent lighting.
• T5HO lamps in this application did not show energy savings over properly controlled T8 lamps.
• North-facing clerestories did not deliver more energy savings than the standard skylights already used by Walmart.
• Control sequences should be simple and robust so operators can easily understand how they work and interact with other system controls.
• Renewable energy systems should be monitored continuously so problems can be corrected in a timely fashion.
• Renewable energy systems should be designed to eliminate or minimize parasitic power draws.
Walmart is continually improving the design and operation of its buildings. Its latest
efforts for high-efficiency buildings combine lessons from these experimental stores and applied them with lessons from other projects in integrated and climate-sensitive designs. The Aurora, Colorado, experimental store has been retrofitted to remove some of the failed experiments and improve on the operation of other systems based on the lessons learned. The store will be monitored for one more year with the new configurations and compared to the first three years of operation.
References ASHRAE. 2004. Energy Standard for Buildings Except Low-Rise Residential Buildings.
ANSI/ASHRAE/ IESNA Standard 90.1–2004. Atlanta, Ga: American Society of Heating, Refrigerating and Air-Conditioning Engineers.
Barley, C.D., M. Deru, S. Pless, P. Torcellini, and S. Hayter. 2005. Procedure for Measuring and Reporting Commercial Building Energy Performance. Golden, Colo: National Renewable Energy Laboratory.
Deru, M., and M. MacDonald. 2007. “Wal-Mart Experience: Part Two.” ASHRAE Journal Vol. 49(10), 22-27.
Faramarzi, R.T., B.A. Coburn, and R. Sarhadian. 2002. “Performance and Energy Impact of Installing Glass Doors on an Open Vertical Deli/Dairy Display Case.” ASHRAE AC-02-7-2, ASHRAE 2002 Winter Meeting.
Kozubal, E., M. Deru, S. Slayzak, P. Norton, G. Barker, and J. McClendon. 2008. “Evaluating the Performance and Economics of Transpired Solar Collectors for Commercial Applications. Pacific Grove, Calif.: 2008 ACEEE Summer Studies.
MacDonald, M., and M. Deru. 2007. “Wal-Mart Experience: Part One.” ASHRAE Journal Vol. 49(9).
F1147-E(10/2008)
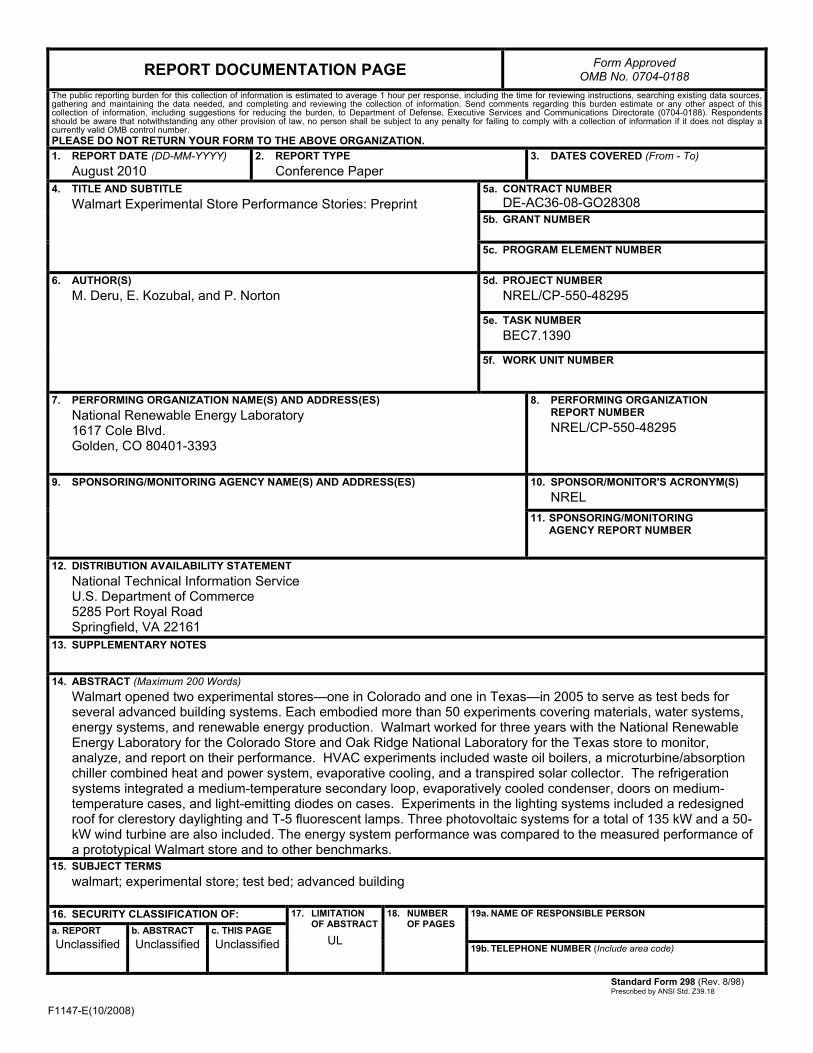
REPORT DOCUMENTATION PAGE Form Approved OMB No. 0704-0188
The public reporting burden for this collection of information is estimated to average 1 hour per response, including the time for reviewing instructions, searching existing data sources, gathering and maintaining the data needed, and completing and reviewing the collection of information. Send comments regarding this burden estimate or any other aspect of this collection of information, including suggestions for reducing the burden, to Department of Defense, Executive Services and Communications Directorate (0704-0188). Respondents should be aware that notwithstanding any other provision of law, no person shall be subject to any penalty for failing to comply with a collection of information if it does not display a currently valid OMB control number. PLEASE DO NOT RETURN YOUR FORM TO THE ABOVE ORGANIZATION. 1. REPORT DATE (DD-MM-YYYY)
August 2010 2. REPORT TYPE
Conference Paper 3. DATES COVERED (From - To)
4. TITLE AND SUBTITLE
Walmart Experimental Store Performance Stories: Preprint 5a. CONTRACT NUMBER
DE-AC36-08-GO28308 5b. GRANT NUMBER
5c. PROGRAM ELEMENT NUMBER
6. AUTHOR(S)
M. Deru, E. Kozubal, and P. Norton 5d. PROJECT NUMBER
NREL/CP-550-48295
5e. TASK NUMBER BEC7.1390
5f. WORK UNIT NUMBER
7. PERFORMING ORGANIZATION NAME(S) AND ADDRESS(ES) National Renewable Energy Laboratory 1617 Cole Blvd. Golden, CO 80401-3393
8. PERFORMING ORGANIZATION REPORT NUMBER NREL/CP-550-48295
9. SPONSORING/MONITORING AGENCY NAME(S) AND ADDRESS(ES)
10. SPONSOR/MONITOR'S ACRONYM(S) NREL
11. SPONSORING/MONITORING AGENCY REPORT NUMBER
12. DISTRIBUTION AVAILABILITY STATEMENT National Technical Information Service U.S. Department of Commerce 5285 Port Royal Road Springfield, VA 22161
13. SUPPLEMENTARY NOTES
14. ABSTRACT (Maximum 200 Words) Walmart opened two experimental stores—one in Colorado and one in Texas—in 2005 to serve as test beds for several advanced building systems. Each embodied more than 50 experiments covering materials, water systems, energy systems, and renewable energy production. Walmart worked for three years with the National Renewable Energy Laboratory for the Colorado Store and Oak Ridge National Laboratory for the Texas store to monitor, analyze, and report on their performance. HVAC experiments included waste oil boilers, a microturbine/absorption chiller combined heat and power system, evaporative cooling, and a transpired solar collector. The refrigeration systems integrated a medium-temperature secondary loop, evaporatively cooled condenser, doors on medium-temperature cases, and light-emitting diodes on cases. Experiments in the lighting systems included a redesigned roof for clerestory daylighting and T-5 fluorescent lamps. Three photovoltaic systems for a total of 135 kW and a 50-kW wind turbine are also included. The energy system performance was compared to the measured performance of a prototypical Walmart store and to other benchmarks.
15. SUBJECT TERMS walmart; experimental store; test bed; advanced building
16. SECURITY CLASSIFICATION OF: 17. LIMITATION OF ABSTRACT
UL
18. NUMBER OF PAGES
19a. NAME OF RESPONSIBLE PERSON a. REPORT
Unclassified b. ABSTRACT Unclassified
c. THIS PAGE Unclassified 19b. TELEPHONE NUMBER (Include area code)
Standard Form 298 (Rev. 8/98) Prescribed by ANSI Std. Z39.18