Embed Size (px)
Citation preview
6/23/2015 Walmart announces Q4 underlying EPS of $1.61 and additional strategic investments in people & e-commerce; Walmart U.S. comp sales increased 1.5 percent
http://news.walmart.com/news-archive/investors/2015/02/19/walmart-announces-q4-underlying-eps-of-161-and-additional-strategic-investments-in-people-e-comm… 1/13
Walmart announces Q4 underlying EPS of $1.61 and
additional strategic investments in people & e-
commerce;; Walmart U.S. comp sales increased 1.5
percent
Fourth quarter highlights
Underlying EPS: Wal-Mart Stores, Inc. (Walmart) reported fourth quarter fiscal year 2015underlying diluted earnings per share from continuing operations (EPS) of $1.61, comparedto last year's underlying EPS of $1.60.
Reported EPS: Reported EPS was $1.53, which includes a negative impact of $0.08 pershare from certain discrete items. The company incurred a charge of $0.05 for a wage andhour litigation matter, and a charge of $0.03 for Walmart Japan store closures, both previouslydisclosed. Last year's EPS was $1.34, which includes a negative impact from discrete itemstotaling $0.26.
Comps: Walmart U.S. comp sales increased 1.5 percent for the 13-week period ended Jan.30, 2015. Comp sales for the Neighborhood Market format increased approximately 7.7percent. Sam's Club comp sales, without fuel, increased 2.0 percent for the same 13-weekperiod.
Revenue: Consolidated revenue reached $131.6 billion, an increase of $1.9 billion, or 1.4percent. Currency exchange rate fluctuations negatively impacted revenue by approximately$2.6 billion.
Full year fiscal 2015 highlights
EPS: Walmart's underlying EPS was $5.07, and reported EPS was $4.99, which includes thenegative impact of $0.08 from the discrete items noted above.
Revenue: Consolidated revenue reached $485.7 billion, an increase of $9.4 billion, or 2.0percent. Currency exchange rate fluctuations negatively impacted revenue by approximately$5.3 billion. Constant currency revenue was almost $491 billion. E-commerce sales globallyrose approximately 22 percent for the year, to $12.2 billion.
New store growth: The company added nearly 33 million square feet of retail space in fiscal2015, with 511 net new units globally.
Shareholder returns: The company returned $7.2 billion to shareholders through dividendsand share repurchases. [Note: Please see separate Feb. 19, 2015 news release on FY 16dividend.]
Guidance: The company issued full fiscal 2016 EPS guidance range of $4.70 to $5.05, and afirst quarter forecast of $0.95 to $1.10. This guidance reflects additional strategic wage andtraining investments for U.S. associates that were announced today, as well as incrementalinvestments for Global eCommerce initiatives, totaling between $0.26 and $0.29 per share.
See additional information at the end of this release regarding non-GAAP financial measures.
BENTONVILLE, Ark.--(BUSINESS WIRE)--Feb. 19, 2015-- Wal-Mart Stores, Inc. (NYSE: WMT)
today reported financial results for the fourth quarter and fiscal year ended Jan. 31, 2015. The
company also announced a significant investment in its people and e-commerce businesses for
the new fiscal year, along with its annual shareholder dividend.
Consolidated net sales for the fourth quarter were $130.7 billion, an increase of 1.4 percent over
last year. This quarter included the negative impact of approximately $2.6 billion from currency
exchange rate fluctuations. On a constant currency basis, net sales increased 3.5 percent to
$133.2 billion. Membership and other income decreased 0.5 percent. Total revenue was $131.6
billion, an increase of approximately $1.9 billion, or 1.4 percent.
Consolidated net income attributable to Walmart was $5.0 billion, a 12.1 percent increase. Diluted
earnings per share from continuing operations attributable to Walmart were $1.53, compared to
last year's $1.34. Underlying diluted earnings per share from continuing operations attributable to
Walmart were $1.61, compared to $1.60 last year.
1
1
1
1
1
1
Fourth quarter
1
1
Fiscal year 2015
6/23/2015 Walmart announces Q4 underlying EPS of $1.61 and additional strategic investments in people & e-commerce; Walmart U.S. comp sales increased 1.5 percent
http://news.walmart.com/news-archive/investors/2015/02/19/walmart-announces-q4-underlying-eps-of-161-and-additional-strategic-investments-in-people-e-comm… 2/13
Consolidated net sales for the year were $482.2 billion, an increase of 1.9 percent over fiscal year2014. Net sales included approximately $5.3 billion of negative impact from currency exchangerate fluctuations. Membership and other income increased 6.3 percent. Total revenue was $485.7billion, an increase of approximately $9.4 billion, or 2.0 percent. Constant currency revenue wasalmost $491 billion.
Consolidated net income attributable to Walmart was $16.4 billion, up 2.1 percent. Dilutedearnings per share from continuing operations attributable to Walmart were $4.99, or 2.9 percentabove last year's $4.85. Underlying diluted earnings per share from continuing operationsattributable to Walmart were $5.07, compared to $5.11 last year.
The EPS impact of certain discrete items on the company's reported fourth quarter and fiscal yearresults from continuing operations was $0.08 per share. The discrete items, both of which werepreviously disclosed, and the respective EPS impact was as follows:
Last year, the total EPS impact of discrete items on the company's reported fourth quarter and fullyear results from continuing operations was $0.26 per share. [Note: Details provided in pressrelease issued Feb. 20, 2014.]
"We had a good fourth quarter to close out our fiscal year, with underlying EPS of $1.61. WalmartU.S. delivered better than expected comp sales. Sam's Club had its best performance of the year,and Walmart International had solid sales and profitability," said Doug McMillon, Wal-Mart Stores,Inc. president and CEO. "Like many other global companies, we faced significant headwinds fromcurrency exchange rate fluctuations, so I'm pleased that we delivered fiscal year revenue of $486billion. But, we're not satisfied."
See additional information at the end of this release regarding non-GAAP financial measures.
According to McMillon, the leadership teams are very focused on improving customer experiencesthrough various investments and program initiatives, and for several months, developed andtested new ideas to reward associates for serving customers.
"We have work to do to grow the business. We know what customers want from a shoppingexperience, and we're investing strategically to exceed their expectations and better positionWalmart for the future," said McMillon. "Our first priority is to run great stores and clubs. We willcontinue to integrate our physical locations with a great e-commerce and mobile commercebusiness. We're strengthening investments in our people to engage and inspire them to deliversuperior customer experiences. We will earn the trust of all Walmart stakeholders by operatinggreat retail businesses, ensuring world-class compliance, and doing good in the world throughsocial and environmental programs in our communities."
McMillon announced a bold new initiative on pay and training for U.S. associates. Approximately500,000 full-time and part-time associates at Walmart U.S. stores and Sam's Clubs will receivepay raises in the first half of the current fiscal year. Current and future associates will benefit fromthis initiative, which ensures that Walmart hourly associates earn at least $1.75 above today'sfederal minimum wage, or $9.00 per hour, in April. The following year, by Feb. 1, 2016, currentassociates will earn at least $10.00 per hour.
"Today, we announced comprehensive changes to our hiring, training, compensation andscheduling programs, as well as to our store management structure. These changes will give ourU.S. associates the opportunity to earn higher pay and advance in their careers. We're pursuing acomprehensive approach that is sustainable over the long term," explained McMillon. "Byrealigning our store operational structure, associates can enjoy a closer relationship with theirsupervisors. In addition, associates will have more control over their schedules. The investment inthese initiatives is more than $1 billion for this fiscal year."
Walmart associates already have the opportunity for competitive health-care and 401(k) benefits,sick leave, and access to bonus incentive opportunities, discounts and educational programs.These benefits and programs will continue to be available to current and future associates.
"Sam Walton knew that an inspired, dedicated team of associates was the way to exceed ourcustomers' expectations," said McMillon. "He often said 'Our people make the difference.' I feel abig responsibility to carry on what that phrase represents: the care and commitment that Sam hadfor Walmart associates."
As part of today's announcement, Walmart and the Walmart Foundation also committed $100million over five years to help increase the economic mobility for entry level workers by advancingtheir careers. This initiative will benefit the retail and service industries. The Walmart Foundationwill work with other foundations, employers, community colleges and non-profit organizations to
1
∙
Wage and hour litigation matter $0.05∙
Closure of approximately 30 underperforming stores in Japan $0.03
Investing for FY 2016
1
6/23/2015 Walmart announces Q4 underlying EPS of $1.61 and additional strategic investments in people & e-commerce; Walmart U.S. comp sales increased 1.5 percent
http://news.walmart.com/news-archive/investors/2015/02/19/walmart-announces-q4-underlying-eps-of-161-and-additional-strategic-investments-in-people-e-comm… 3/13
address a fundamental challenge in America -- how to better train and advance workers in theretail and adjacent sectors. Today, more than 15 million people, including 7 million women, work inretail.
"Beyond this commitment, Walmart is also piloting a new, comprehensive on-boarding and trainingprogram to create clear career pathways for associates, so they can earn more and seekpromotions," McMillon explained. "We're encouraging our associates to continue their educationby providing no-cost access for them to complete their high school diploma or GED, as well as freeand low-cost college credit to reduce the time and cost of earning a college degree. The skills andtraining that an associate receives through this program will be transferable outside of Walmart."
"Walmart has represented a ladder of opportunity since Sam started the business, and we want tomake sure that's the case going forward everywhere we operate, including here in the UnitedStates," added McMillon. "Globally, we have ongoing efforts in place to review our associates'compensation on a yearly basis in each of our markets. We're also proud of the growthopportunities we provide our associates around the world through training and careeradvancement programs."
The company provided guidance for EPS and updated its estimate for fiscal year 2016 salesgrowth.
"Given the investments we're making in our worldwide e-commerce initiatives and in ourassociates through higher wages and training, we expect operating income to be pressured infiscal 2016," said Charles Holley, Wal-Mart Stores, Inc. chief financial officer. "We will investapproximately $0.02 per share in the first quarter and approximately $0.20 per share for the fullyear in the new wage structure, comprehensive associate training and educational programs. Ourincremental investment in global e-commerce initiatives will range between $0.06 and $0.09 pershare this year. Together, we're investing between $0.26 and $0.29 per share for these initiativesin fiscal year 2016.
"Along with these significant investments, we expect ongoing headwinds from currency exchangerates during the year. We also consider economic conditions in our various markets and ourestimated tax rate in establishing our guidance ranges for the year," added Holley. "Afterevaluating these factors, we are forecasting earnings per share for the full year of fiscal 2016 torange between $4.70 and $5.05. For the first quarter, EPS will range from $0.95 to $1.10."
This guidance compares to $1.10 per share Walmart reported for the first quarter of fiscal 2015and $4.99 per share for the full year. In addition, Holley said that if currency exchange ratesremain where they are today, this would cause a negative impact to fiscal year 2016 net sales ofapproximately $10 billion, as well as a negative impact on operating income of around $0.10 pershare.
"Given the potential impact of currency headwinds, we expect that our fiscal year 2016 salesgrowth will be between 1 and 2 percent, versus the 2 to 4 percent we provided at our Octoberinvestor conference," said Holley. "Our capital expenditure guidance of $11.6 billion to $12.9billion, which includes investments for stores and e-commerce, remains unchanged. Our netsquare footage store growth target, excluding future acquisitions, remains unchanged at 26 to 30million square feet for this year."
The company paid $6.2 billion in dividends and repurchased approximately 13.4 million shares for$1.0 billion during the year. In total, the company returned $7.2 billion to shareholders throughdividends and share repurchases.
Return on investment (ROI) for the trailing 12-months ended Jan. 31, 2015 was 16.9 percent,which was relatively flat compared to ROI for the fiscal year ended Jan. 31, 2014. The slightchange in ROI was primarily due to continued investments in store growth and e-commerceinitiatives, offset by currency exchange rate fluctuations.
Free cash flow was $16.4 billion for the 12-months ended Jan. 31, 2015, compared to $10.1billion in the prior year. The increase in free cash flow was primarily due to the timing of paymentsfor accounts payable and accrued liabilities, as well as the timing of income tax payments,combined with lower capital expenditures.
See additional information at the end of this release regarding non-GAAP financial measures.
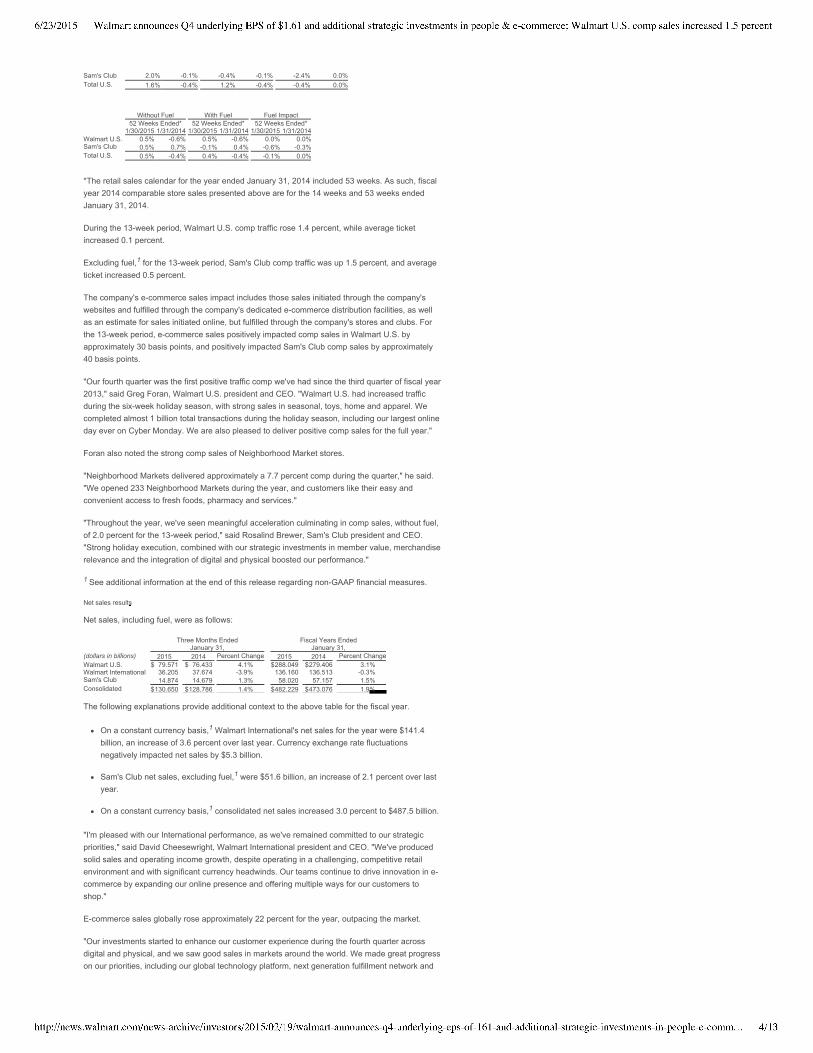
The company reported U.S. comparable store sales based on its 13-week and 52-week retailcalendar for the period ended Jan. 30, 2015 and its 14-week and 53-week retail calendar for theperiod ended Jan. 31, 2014 as follows:
Guidance
Returns
1
1
1
U.S. comparable store sales results
Without Fuel With Fuel Fuel Impact
13 Weeks Ended* 13 Weeks Ended* 13 Weeks Ended*1/30/2015 1/31/2014 1/30/2015 1/31/2014 1/30/2015 1/31/2014
Walmart U.S. 1.5% -0.4% 1.5% -0.4% 0.0% 0.0%
6/23/2015 Walmart announces Q4 underlying EPS of $1.61 and additional strategic investments in people & e-commerce; Walmart U.S. comp sales increased 1.5 percent
http://news.walmart.com/news-archive/investors/2015/02/19/walmart-announces-q4-underlying-eps-of-161-and-additional-strategic-investments-in-people-e-comm… 4/13
*The retail sales calendar for the year ended January 31, 2014 included 53 weeks. As such, fiscal
year 2014 comparable store sales presented above are for the 14 weeks and 53 weeks ended
January 31, 2014.
During the 13-week period, Walmart U.S. comp traffic rose 1.4 percent, while average ticket
increased 0.1 percent.
Excluding fuel, for the 13-week period, Sam's Club comp traffic was up 1.5 percent, and average
ticket increased 0.5 percent.
The company's e-commerce sales impact includes those sales initiated through the company's
websites and fulfilled through the company's dedicated e-commerce distribution facilities, as well
as an estimate for sales initiated online, but fulfilled through the company's stores and clubs. For
the 13-week period, e-commerce sales positively impacted comp sales in Walmart U.S. by
approximately 30 basis points, and positively impacted Sam's Club comp sales by approximately
40 basis points.
"Our fourth quarter was the first positive traffic comp we've had since the third quarter of fiscal year
2013," said Greg Foran, Walmart U.S. president and CEO. "Walmart U.S. had increased traffic
during the six-week holiday season, with strong sales in seasonal, toys, home and apparel. We
completed almost 1 billion total transactions during the holiday season, including our largest online
day ever on Cyber Monday. We are also pleased to deliver positive comp sales for the full year."
Foran also noted the strong comp sales of Neighborhood Market stores.
"Neighborhood Markets delivered approximately a 7.7 percent comp during the quarter," he said.
"We opened 233 Neighborhood Markets during the year, and customers like their easy and
convenient access to fresh foods, pharmacy and services."
"Throughout the year, we've seen meaningful acceleration culminating in comp sales, without fuel,
of 2.0 percent for the 13-week period," said Rosalind Brewer, Sam's Club president and CEO.
"Strong holiday execution, combined with our strategic investments in member value, merchandise
relevance and the integration of digital and physical boosted our performance."
See additional information at the end of this release regarding non-GAAP financial measures.
Net sales, including fuel, were as follows:
The following explanations provide additional context to the above table for the fiscal year.
On a constant currency basis, Walmart International's net sales for the year were $141.4
billion, an increase of 3.6 percent over last year. Currency exchange rate fluctuations
negatively impacted net sales by $5.3 billion.
Sam's Club net sales, excluding fuel, were $51.6 billion, an increase of 2.1 percent over last
year.
On a constant currency basis, consolidated net sales increased 3.0 percent to $487.5 billion.
"I'm pleased with our International performance, as we've remained committed to our strategic
priorities," said David Cheesewright, Walmart International president and CEO. "We've produced
solid sales and operating income growth, despite operating in a challenging, competitive retail
environment and with significant currency headwinds. Our teams continue to drive innovation in e-
commerce by expanding our online presence and offering multiple ways for our customers to
shop."
E-commerce sales globally rose approximately 22 percent for the year, outpacing the market.
"Our investments started to enhance our customer experience during the fourth quarter across
digital and physical, and we saw good sales in markets around the world. We made great progress
on our priorities, including our global technology platform, next generation fulfillment network and
Sam's Club 2.0% -0.1% -0.4% -0.1% -2.4% 0.0%
Total U.S. 1.6% -0.4% 1.2% -0.4% -0.4% 0.0%
Without Fuel With Fuel Fuel Impact
52 Weeks Ended* 52 Weeks Ended* 52 Weeks Ended*
1/30/2015 1/31/2014 1/30/2015 1/31/2014 1/30/2015 1/31/2014
Walmart U.S. 0.5% -0.6% 0.5% -0.6% 0.0% 0.0%
Sam's Club 0.5% 0.7% -0.1% 0.4% -0.6% -0.3%
Total U.S. 0.5% -0.4% 0.4% -0.4% -0.1% 0.0%
1
1
Net sales results
Three Months Ended Fiscal Years Ended
January 31, January 31,
(dollars in billions) 2015 2014 Percent Change 2015 2014 Percent Change
Walmart U.S. $ 79.571 $ 76.433 4.1% $288.049 $279.406 3.1%
Walmart International 36.205 37.674 -3.9% 136.160 136.513 -0.3%
Sam's Club 14.874 14.679 1.3% 58.020 57.157 1.5%
Consolidated $130.650 $128.786 1.4% $482.229 $473.076 1.9%
1
1
1
6/23/2015 Walmart announces Q4 underlying EPS of $1.61 and additional strategic investments in people & e-commerce; Walmart U.S. comp sales increased 1.5 percent
http://news.walmart.com/news-archive/investors/2015/02/19/walmart-announces-q4-underlying-eps-of-161-and-additional-strategic-investments-in-people-e-comm… 5/13
the integration of digital and physical," said Neil Ashe, Global eCommerce president and CEO."We have significant opportunities to grow, as our core capabilities continue rolling out tocustomers around the world, and we further expand mobile offerings and our fulfillment centers.Fiscal year 2016 will continue to be a building year, and we expect sales to grow globally in themid 20s."
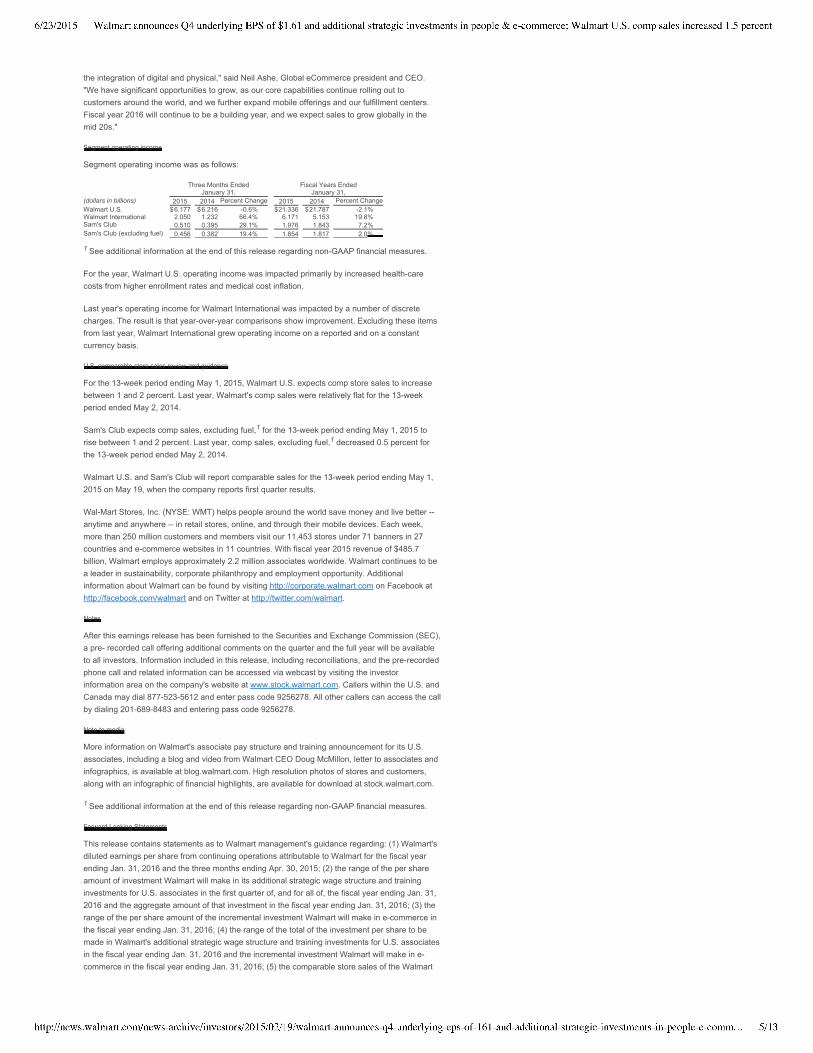
Segment operating income was as follows:
See additional information at the end of this release regarding non-GAAP financial measures.
For the year, Walmart U.S. operating income was impacted primarily by increased health-carecosts from higher enrollment rates and medical cost inflation.
Last year's operating income for Walmart International was impacted by a number of discretecharges. The result is that year-over-year comparisons show improvement. Excluding these itemsfrom last year, Walmart International grew operating income on a reported and on a constantcurrency basis.
For the 13-week period ending May 1, 2015, Walmart U.S. expects comp store sales to increasebetween 1 and 2 percent. Last year, Walmart's comp sales were relatively flat for the 13-weekperiod ended May 2, 2014.
Sam's Club expects comp sales, excluding fuel, for the 13-week period ending May 1, 2015 torise between 1 and 2 percent. Last year, comp sales, excluding fuel, decreased 0.5 percent forthe 13-week period ended May 2, 2014.
Walmart U.S. and Sam's Club will report comparable sales for the 13-week period ending May 1,2015 on May 19, when the company reports first quarter results.
Wal-Mart Stores, Inc. (NYSE: WMT) helps people around the world save money and live better --anytime and anywhere -- in retail stores, online, and through their mobile devices. Each week,more than 250 million customers and members visit our 11,453 stores under 71 banners in 27countries and e-commerce websites in 11 countries. With fiscal year 2015 revenue of $485.7billion, Walmart employs approximately 2.2 million associates worldwide. Walmart continues to bea leader in sustainability, corporate philanthropy and employment opportunity. Additionalinformation about Walmart can be found by visiting http://corporate.walmart.com on Facebook athttp://facebook.com/walmart and on Twitter at http://twitter.com/walmart.
After this earnings release has been furnished to the Securities and Exchange Commission (SEC),a pre- recorded call offering additional comments on the quarter and the full year will be availableto all investors. Information included in this release, including reconciliations, and the pre-recordedphone call and related information can be accessed via webcast by visiting the investorinformation area on the company's website at www.stock.walmart.com. Callers within the U.S. andCanada may dial 877-523-5612 and enter pass code 9256278. All other callers can access the callby dialing 201-689-8483 and entering pass code 9256278.
More information on Walmart's associate pay structure and training announcement for its U.S.associates, including a blog and video from Walmart CEO Doug McMillon, letter to associates andinfographics, is available at blog.walmart.com. High resolution photos of stores and customers,along with an infographic of financial highlights, are available for download at stock.walmart.com.
See additional information at the end of this release regarding non-GAAP financial measures.
This release contains statements as to Walmart management's guidance regarding: (1) Walmart'sdiluted earnings per share from continuing operations attributable to Walmart for the fiscal yearending Jan. 31, 2016 and the three months ending Apr. 30, 2015;; (2) the range of the per shareamount of investment Walmart will make in its additional strategic wage structure and traininginvestments for U.S. associates in the first quarter of, and for all of, the fiscal year ending Jan. 31,2016 and the aggregate amount of that investment in the fiscal year ending Jan. 31, 2016;; (3) therange of the per share amount of the incremental investment Walmart will make in e-commerce inthe fiscal year ending Jan. 31, 2016;; (4) the range of the total of the investment per share to bemade in Walmart's additional strategic wage structure and training investments for U.S. associatesin the fiscal year ending Jan. 31, 2016 and the incremental investment Walmart will make in e-commerce in the fiscal year ending Jan. 31, 2016;; (5) the comparable store sales of the Walmart
Segment operating income
Three Months Ended Fiscal Years EndedJanuary 31, January 31,
(dollars in billions) 2015 2014 Percent Change 2015 2014 Percent ChangeWalmart U.S. $6.177 $6.216 -0.6% $21.336 $21.787 -2.1%Walmart International 2.050 1.232 66.4% 6.171 5.153 19.8%Sam's Club 0.510 0.395 29.1% 1.976 1.843 7.2%Sam's Club (excluding fuel) 0.456 0.382 19.4% 1.854 1.817 2.0%
1
U.S. comparable store sales review and guidance
1
1
Notes
Note to media
1
Forward Looking Statements
6/23/2015 Walmart announces Q4 underlying EPS of $1.61 and additional strategic investments in people & e-commerce; Walmart U.S. comp sales increased 1.5 percent
http://news.walmart.com/news-archive/investors/2015/02/19/walmart-announces-q4-underlying-eps-of-161-and-additional-strategic-investments-in-people-e-comm… 6/13
U.S. segment and the comparable club sales, excluding fuel, of the Sam's Club segment for the13-week period ending May 1, 2015;; (6) the growth in consolidated net sales and the possiblenegative impact of currency exchange rates on consolidated net sales for the fiscal year endingJan. 31, 2016;; (7) the expected global growth in e-commerce sales in the fiscal year ending Jan.31, 2016;; and (8) the range of aggregate capital expenditures and the range of growth in squarefootage for the fiscal year ended Jan. 31, 2015, as well as management's expectations thatWalmart's operating income will be pressured in the fiscal year ending Jan. 31, 2016 and thatWalmart will continue to integrate Walmart's physical locations with its e-commerce and mobilecommerce business (and assumptions underlying certain of such guidance and expectations), thatWalmart believes are "forward-looking statements" within the meaning of the Private SecuritiesLitigation Reform Act of 1995, as amended.
These statements are intended to enjoy the protection of the safe harbor for forward-lookingstatements provided by that act and can be identified by the use of the word or phrase "expect,""expects," "forecasting," "growth target," "guidance," "will invest," "will continue," "will range" or"would cause" in or relating to such statements. Walmart's actual results may differ materially fromthe guidance provided and the expected results discussed in such forward-looking statements as aresult of changes in facts, assumptions not being realized or other risks, uncertainties and factors,including:
economic, geo-political, capital markets and business conditions, trends and events aroundthe world and in the markets in which Walmart operates, including unemployment andunderemployment levels;;
competitive initiatives of other retailers and other competitive pressures;;
inflation or deflation, generally and in particular product categories;;
consumer confidence, disposable income, credit availability, spending levels, shoppingpatterns, debt levels and demand for certain merchandise;;
customer traffic and average ticket in Walmart's stores and clubs and on its e-commercewebsites;;
the mix of merchandise Walmart sells;;
availability of attractive opportunities for investment in e-commerce acquisitions andinitiatives;;
consumer acceptance of Walmart's stores and clubs, e-commerce websites, mobile apps,initiatives, programs and merchandise offerings;;
disruption of and changes in seasonal buying patterns in Walmart's markets;;
changes in the level of public assistance payments;;
effects of weather conditions and events, catastrophes, natural disasters, public healthemergencies, civil disturbances, and terrorist attacks;;
commodity prices and the cost of goods Walmart sells;;
transportation, energy and utility costs;;
selling prices of gasoline and diesel fuel;;
disruption of Walmart's supply chain, including disruption of the transport of goods fromforeign suppliers to Walmart’s facilities;;
information security events and information security-related costs;;
trade restrictions, changes in tariff and freight rates;;
the size and turnover of Walmart’s hourly workforce in the U.S.;;
labor costs, including healthcare and other benefit costs;;
casualty and accident-related costs and insurance costs;;
the availability and cost of appropriate locations for new and relocated stores, clubs and otherfacilities;;
local real estate, zoning, land use and other laws, ordinances, legal restrictions and initiativesthat impose limitations on Walmart's ability to build, relocate or expand stores in certainlocations;;
delays in construction or opening of new, expanded or relocated units;;
the availability of persons with the necessary skills and abilities necessary to meet thecompany's needs for managing and staffing new units and conducting their operations and to
6/23/2015 Walmart announces Q4 underlying EPS of $1.61 and additional strategic investments in people & e-commerce; Walmart U.S. comp sales increased 1.5 percent
http://news.walmart.com/news-archive/investors/2015/02/19/walmart-announces-q4-underlying-eps-of-161-and-additional-strategic-investments-in-people-e-comm… 7/13
meet seasonal associate hiring needs;;
the availability of necessary utilities for new units;;
the availability of skilled labor in areas in which new units are to be constructed or existing
units are to be relocated, expanded or remodeled;;
changes in tax and other laws, including changes in individual or corporate tax rates and labor
laws;;
developments in, outcomes of, and costs incurred in legal proceedings to which Walmart is a
party;;
Walmart’s expenditures for FCPA- and compliance-related matters;;
currency exchange rate fluctuations and changes in market interest rates;;
the amount of Walmart's net sales denominated in particular currencies other than the U.S.
dollar;;
Walmart's effective tax rate and factors affecting that rate;; and
changes in generally accepted accounting principles and unanticipated changes in accounting
estimates or judgments.
Walmart discusses certain of the foregoing factors more fully and other risks relating to its
operations and financial performance in its most recent annual report on Form 10-K filed with the
SEC and certain of its other filings with the SEC. You should read this release in conjunction with
that annual report on Form 10-K and Walmart’s quarterly reports on Form 10-Q and current
reports on Form 8-K filed with the SEC through this release's date. Walmart urges you to consider
all of these risks, uncertainties and other factors carefully in evaluating the forward-looking
statements in this release. Walmart cannot assure you that the results reflected or implied by any
forward-looking statement will be realized or, even if substantially realized, that those results will
have the forecast or expected consequences and effects for or on Walmart’s operations or
financial performance. The forward-looking statements contained in this release are as of the date
of this release. Walmart undertakes no obligation to update these forward-looking statements to
reflect subsequent events or circumstances.
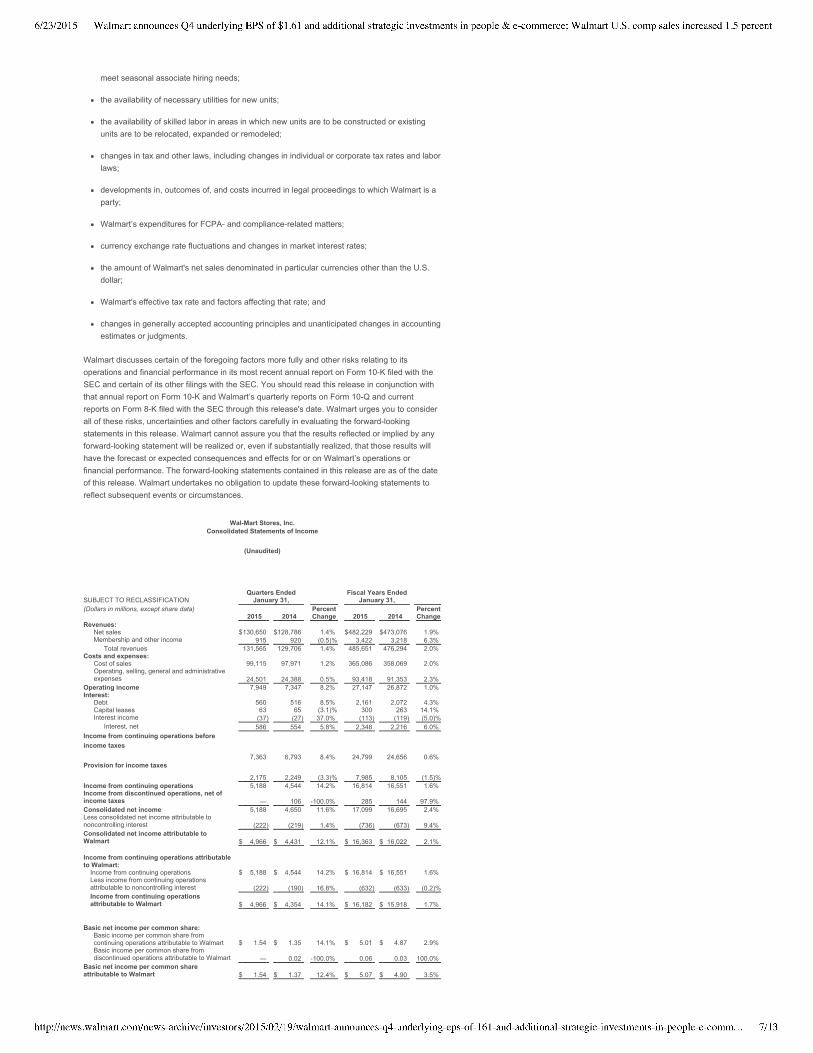
Wal-Mart Stores, Inc.
Consolidated Statements of Income
(Unaudited)
Quarters Ended Fiscal Years Ended
SUBJECT TO RECLASSIFICATION January 31, January 31,
(Dollars in millions, except share data) 2015
2014
Percent
Change 2015
2014
Percent
Change
Revenues:
Net sales $130,650 $128,786 1.4% $482,229 $473,076 1.9%
Membership and other income 915 920 (0.5)% 3,422 3,218 6.3%
Total revenues 131,565 129,706 1.4% 485,651 476,294 2.0%
Costs and expenses:
Cost of sales 99,115 97,971 1.2% 365,086 358,069 2.0%
Operating, selling, general and administrative
expenses 24,501
24,388
0.5%
93,418
91,353
2.3%
Operating income 7,949 7,347 8.2% 27,147 26,872 1.0%
Interest:
Debt 560 516 8.5% 2,161 2,072 4.3%
Capital leases 63 65 (3.1)% 300 263 14.1%
Interest income (37) (27) 37.0% (113) (119) (5.0)%
Interest, net 586 554 5.8% 2,348 2,216 6.0%
Income from continuing operations before
income taxes
7,363 6,793 8.4% 24,799 24,656 0.6%
Provision for income taxes
2,175
2,249
(3.3)%
7,985
8,105
(1.5)%
Income from continuing operations 5,188 4,544 14.2% 16,814 16,551 1.6%
Income from discontinued operations, net of
income taxes
—
106
-100.0%
285
144
97.9%
Consolidated net income 5,188 4,650 11.6% 17,099 16,695 2.4%
Less consolidated net income attributable to
noncontrolling interest
(222)
(219) 1.4%
(736)
(673) 9.4%
Consolidated net income attributable to
Walmart $ 4,966 $ 4,431
12.1% $ 16,363
$ 16,022
2.1%
Income from continuing operations attributable
to Walmart:
Income from continuing operations $ 5,188 $ 4,544 14.2% $ 16,814 $ 16,551 1.6%
Less income from continuing operations
attributable to noncontrolling interest
(222)
(190) 16.8%
(632)
(633) (0.2)%
Income from continuing operations
attributable to Walmart $ 4,966 $ 4,354
14.1% $ 16,182
$ 15,918
1.7%
Basic net income per common share:
Basic income per common share from
continuing operations attributable to Walmart $ 1.54 $ 1.35 14.1% $ 5.01 $ 4.87 2.9%
Basic income per common share from
discontinued operations attributable to Walmart
—
0.02
-100.0%
0.06
0.03
100.0%
Basic net income per common share
attributable to Walmart $ 1.54 $ 1.37
12.4% $ 5.07
$ 4.90
3.5%
6/23/2015 Walmart announces Q4 underlying EPS of $1.61 and additional strategic investments in people & e-commerce; Walmart U.S. comp sales increased 1.5 percent
http://news.walmart.com/news-archive/investors/2015/02/19/walmart-announces-q4-underlying-eps-of-161-and-additional-strategic-investments-in-people-e-comm… 8/13
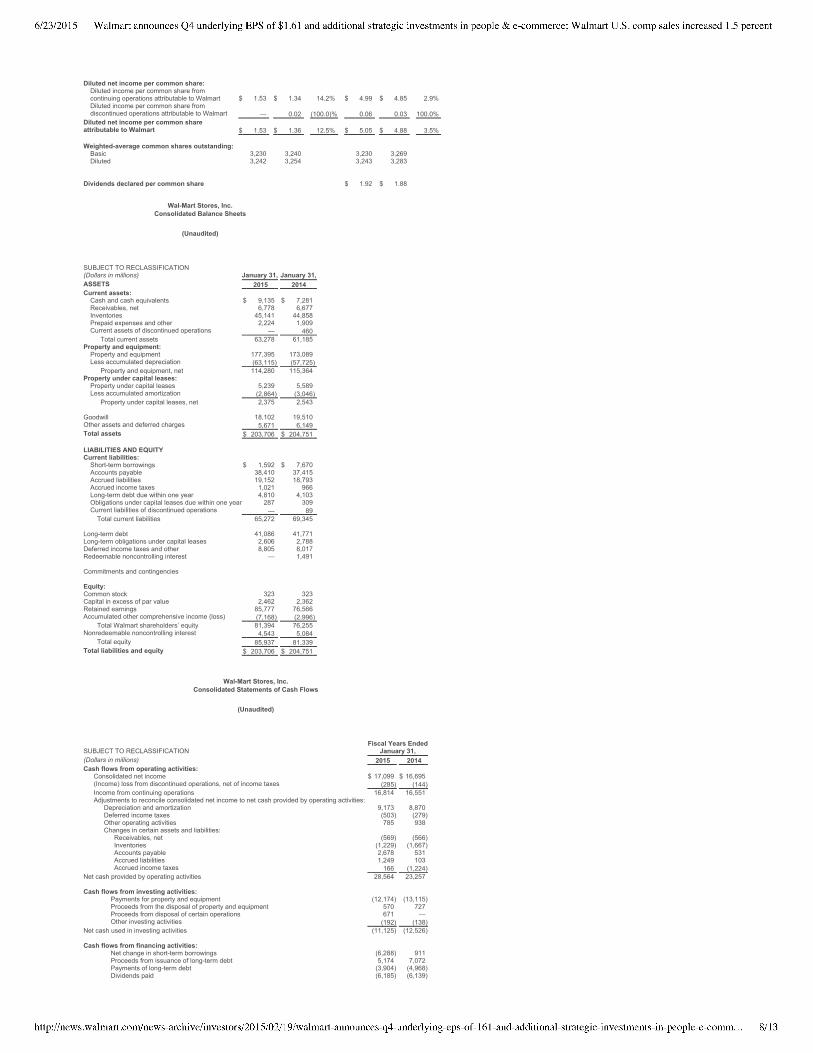
Diluted net income per common share:Diluted income per common share from
continuing operations attributable to Walmart $ 1.53 $ 1.34 14.2% $ 4.99 $ 4.85 2.9%
Diluted income per common share from
discontinued operations attributable to Walmart
—
0.02
(100.0)%
0.06
0.03
100.0%
Diluted net income per common shareattributable to Walmart $ 1.53
$ 1.36
12.5% $ 5.05
$ 4.88
3.5%
Weighted-average common shares outstanding:Basic 3,230 3,240 3,230 3,269
Diluted 3,242 3,254 3,243 3,283
Dividends declared per common share $ 1.92 $ 1.88
Wal-Mart Stores, Inc.Consolidated Balance Sheets
(Unaudited)
SUBJECT TO RECLASSIFICATION
(Dollars in millions) January 31, January 31,ASSETS 2015 2014
Current assets:Cash and cash equivalents $ 9,135 $ 7,281
Receivables, net 6,778 6,677
Inventories 45,141 44,858
Prepaid expenses and other 2,224 1,909
Current assets of discontinued operations — 460
Total current assets 63,278 61,185
Property and equipment:Property and equipment 177,395 173,089
Less accumulated depreciation (63,115) (57,725)
Property and equipment, net 114,280 115,364
Property under capital leases:Property under capital leases 5,239 5,589
Less accumulated amortization (2,864) (3,046)
Property under capital leases, net 2,375 2,543
Goodwill 18,102 19,510
Other assets and deferred charges 5,671 6,149
Total assets $ 203,706 $ 204,751
LIABILITIES AND EQUITYCurrent liabilities:Short-term borrowings $ 1,592 $ 7,670
Accounts payable 38,410 37,415
Accrued liabilities 19,152 18,793
Accrued income taxes 1,021 966
Long-term debt due within one year 4,810 4,103
Obligations under capital leases due within one year 287 309
Current liabilities of discontinued operations — 89
Total current liabilities 65,272 69,345
Long-term debt 41,086 41,771
Long-term obligations under capital leases 2,606 2,788
Deferred income taxes and other 8,805 8,017
Redeemable noncontrolling interest — 1,491
Commitments and contingencies
Equity:Common stock 323 323
Capital in excess of par value 2,462 2,362
Retained earnings 85,777 76,566
Accumulated other comprehensive income (loss) (7,168) (2,996)
Total Walmart shareholders’ equity 81,394 76,255
Nonredeemable noncontrolling interest 4,543 5,084
Total equity 85,937 81,339
Total liabilities and equity $ 203,706 $ 204,751
Wal-Mart Stores, Inc.Consolidated Statements of Cash Flows
(Unaudited)
Fiscal Years EndedSUBJECT TO RECLASSIFICATION January 31,(Dollars in millions) 2015 2014
Cash flows from operating activities:Consolidated net income $ 17,099 $ 16,695
(Income) loss from discontinued operations, net of income taxes (285) (144)
Income from continuing operations 16,814 16,551
Adjustments to reconcile consolidated net income to net cash provided by operating activities:
Depreciation and amortization 9,173 8,870
Deferred income taxes (503) (279)
Other operating activities 785 938
Changes in certain assets and liabilities:
Receivables, net (569) (566)
Inventories (1,229) (1,667)
Accounts payable 2,678 531
Accrued liabilities 1,249 103
Accrued income taxes 166 (1,224)
Net cash provided by operating activities 28,564 23,257
Cash flows from investing activities:Payments for property and equipment (12,174) (13,115)
Proceeds from the disposal of property and equipment 570 727
Proceeds from disposal of certain operations 671 —
Other investing activities (192) (138)
Net cash used in investing activities (11,125) (12,526)
Cash flows from financing activities:Net change in short-term borrowings (6,288) 911
Proceeds from issuance of long-term debt 5,174 7,072
Payments of long-term debt (3,904) (4,968)
Dividends paid (6,185) (6,139)
6/23/2015 Walmart announces Q4 underlying EPS of $1.61 and additional strategic investments in people & e-commerce; Walmart U.S. comp sales increased 1.5 percent
http://news.walmart.com/news-archive/investors/2015/02/19/walmart-announces-q4-underlying-eps-of-161-and-additional-strategic-investments-in-people-e-comm… 9/13
Wal-Mart Stores, Inc.
Reconciliations of and Other Information Regarding Non-GAAP Financial Measures
(Unaudited)
(In millions, except per share data)
The following information provides reconciliations of certain non-GAAP financial measures
presented in the press release to which this reconciliation is attached to the most directly
comparable financial measures calculated and presented in accordance with generally accepted
accounting principles (GAAP). The company has provided the non-GAAP financial information
presented in the press release, which is not calculated or presented in accordance with GAAP, as
information supplemental and in addition to the financial measures presented in the press release
that are calculated and presented in accordance with GAAP. Such non-GAAP financial measures
should not be considered superior to, as a substitute for or alternative to, and should be
considered in conjunction with the GAAP financial measures presented in the press release. The
non-GAAP financial measures in the press release may differ from similar measures used by other
companies.
Calculation of Return on Investment and Return on Assets
Management believes return on investment (ROI) is a meaningful metric to share with investors
because it helps investors assess how effectively Walmart is deploying its assets. Trends in ROI
can fluctuate over time as management balances long-term potential strategic initiatives with
possible short-term impacts.
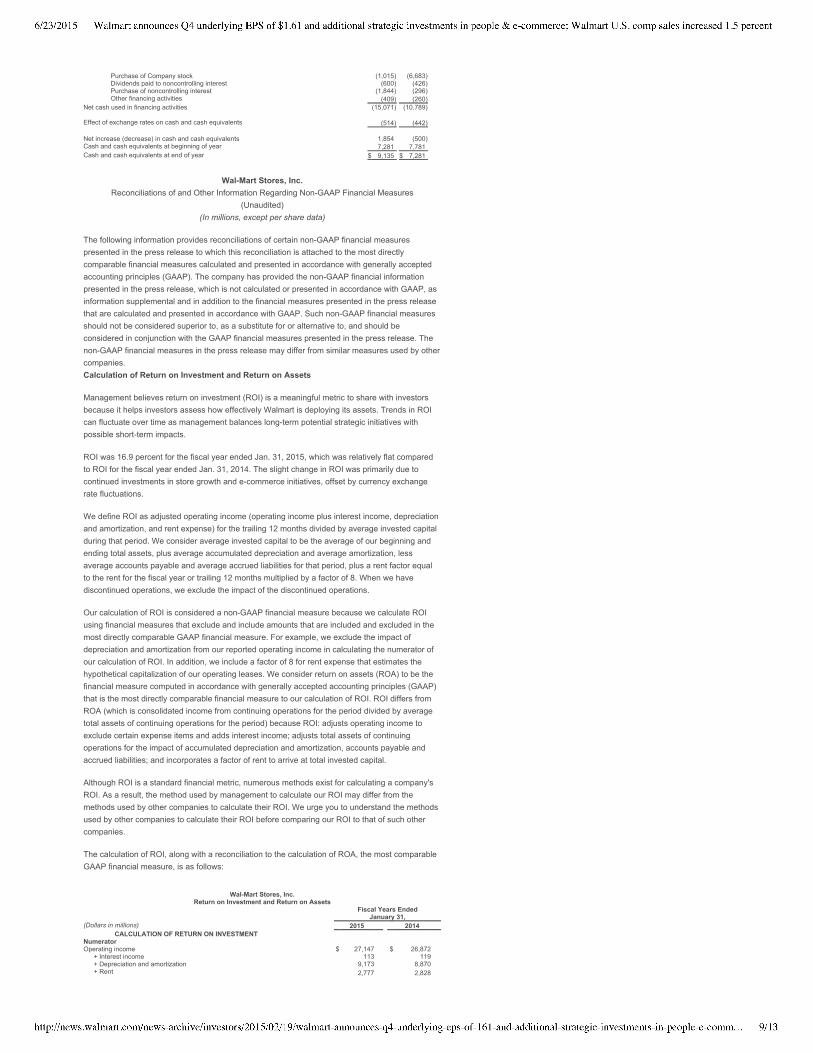
ROI was 16.9 percent for the fiscal year ended Jan. 31, 2015, which was relatively flat compared
to ROI for the fiscal year ended Jan. 31, 2014. The slight change in ROI was primarily due to
continued investments in store growth and e-commerce initiatives, offset by currency exchange
rate fluctuations.
We define ROI as adjusted operating income (operating income plus interest income, depreciation
and amortization, and rent expense) for the trailing 12 months divided by average invested capital
during that period. We consider average invested capital to be the average of our beginning and
ending total assets, plus average accumulated depreciation and average amortization, less
average accounts payable and average accrued liabilities for that period, plus a rent factor equal
to the rent for the fiscal year or trailing 12 months multiplied by a factor of 8. When we have
discontinued operations, we exclude the impact of the discontinued operations.
Our calculation of ROI is considered a non-GAAP financial measure because we calculate ROI
using financial measures that exclude and include amounts that are included and excluded in the
most directly comparable GAAP financial measure. For example, we exclude the impact of
depreciation and amortization from our reported operating income in calculating the numerator of
our calculation of ROI. In addition, we include a factor of 8 for rent expense that estimates the
hypothetical capitalization of our operating leases. We consider return on assets (ROA) to be the
financial measure computed in accordance with generally accepted accounting principles (GAAP)
that is the most directly comparable financial measure to our calculation of ROI. ROI differs from
ROA (which is consolidated income from continuing operations for the period divided by average
total assets of continuing operations for the period) because ROI: adjusts operating income to
exclude certain expense items and adds interest income;; adjusts total assets of continuing
operations for the impact of accumulated depreciation and amortization, accounts payable and
accrued liabilities;; and incorporates a factor of rent to arrive at total invested capital.
Although ROI is a standard financial metric, numerous methods exist for calculating a company's
ROI. As a result, the method used by management to calculate our ROI may differ from the
methods used by other companies to calculate their ROI. We urge you to understand the methods
used by other companies to calculate their ROI before comparing our ROI to that of such other
companies.
The calculation of ROI, along with a reconciliation to the calculation of ROA, the most comparable
GAAP financial measure, is as follows:
Purchase of Company stock (1,015) (6,683)
Dividends paid to noncontrolling interest (600) (426)
Purchase of noncontrolling interest (1,844) (296)
Other financing activities (409) (260)
Net cash used in financing activities (15,071) (10,789)
Effect of exchange rates on cash and cash equivalents (514) (442)
Net increase (decrease) in cash and cash equivalents 1,854 (500)
Cash and cash equivalents at beginning of year 7,281 7,781
Cash and cash equivalents at end of year $ 9,135 $ 7,281
Wal-Mart Stores, Inc.
Return on Investment and Return on Assets
Fiscal Years Ended
January 31,
(Dollars in millions) 2015 2014
CALCULATION OF RETURN ON INVESTMENT
Numerator
Operating income $ 27,147 $ 26,872
+ Interest income 113 119
+ Depreciation and amortization 9,173 8,870
+ Rent 2,777 2,828
6/23/2015 Walmart announces Q4 underlying EPS of $1.61 and additional strategic investments in people & e-commerce; Walmart U.S. comp sales increased 1.5 percent
http://news.walmart.com/news-archive/investors/2015/02/19/walmart-announces-q4-underlying-eps-of-161-and-additional-strategic-investments-in-people-e-com… 10/13
Free Cash Flow
We define free cash flow as net cash provided by operating activities in a period minus paymentsfor property and equipment made in that period. Free cash flow was $16.4 billion and $10.1 billionfor the fiscal years ended Jan. 31, 2015 and 2014, respectively. The increase in free cash flowwas primarily due to the timing of payments for accounts payable and accrued liabilities, as well asthe timing of income tax payments, combined with lower capital expenditures.
Free cash flow is considered a non-GAAP financial measure. Management believes, however, thatfree cash flow, which measures our ability to generate additional cash from our businessoperations, is an important financial measure for use in evaluating the company's financialperformance. Free cash flow should be considered in addition to, rather than as a substitute for,consolidated income from continuing operations as a measure of our performance and net cashprovided by operating activities as a measure of our liquidity.
Additionally, Walmart's definition of free cash flow is limited, in that it does not represent residualcash flows available for discretionary expenditures, due to the fact that the measure does notdeduct the payments required for debt service and other contractual obligations or payments madefor business acquisitions. Therefore, we believe it is important to view free cash flow as a measurethat provides supplemental information to our Consolidated Statements of Cash Flows.
Although other companies report their free cash flow, numerous methods may exist for calculatinga company's free cash flow. As a result, the method used by Walmart's management to calculateour free cash flow may differ from the methods used by other companies to calculate their freecash flow. We urge you to understand the methods used by other companies to calculate their freecash flow before comparing our free cash flow to that of such other companies.
The following table sets forth a reconciliation of free cash flow, a non-GAAP financial measure, tonet cash provided by operating activities, which we believe to be the GAAP financial measuremost directly comparable to free cash flow, as well as information regarding net cash used ininvesting activities and net cash used in financing activities.
"Net cash used in investing activities" includes payments for property and equipment, which isalso included in our computation of free cash flow.
Constant Currency
In discussing our operating results, the term currency exchange rates refers to the currencyexchange rates we use to convert the operating results for all countries where the functionalcurrency is not the U.S. dollar. We calculate the effect of changes in currency exchange rates asthe difference between current period activity translated using the current period's currencyexchange rates, and the comparable prior year period's currency exchange rates. Throughout ourdiscussion, we refer to the results of this calculation as the impact of currency exchange ratefluctuations. When we refer to constant currency operating results, this means operating resultswithout the impact of the currency exchange rate fluctuations and without the impact ofacquisitions, if any, until the acquisitions are included in both comparable periods. The disclosureof constant currency amounts or results permits investors to understand better Walmart'sunderlying performance without the effects of currency exchange rate fluctuations or acquisitions.
Adjusted operating income $ 39,210 $ 38,689
Denominator
Average total assets of continuing operations1 $ 203,999 $ 203,680+ Average accumulated depreciation and amortization1 63,375 57,907- Average accounts payable1 37,913 37,748- Average accrued liabilities1 18,973 18,802+ Rent x 8 22,216 22,624 Average invested capital $ 232,704 $ 227,661
Return on investment (ROI) 16.9% 17.0%
CALCULATION OF RETURN ON ASSETS
Numerator
Income from continuing operations $ 16,814 $ 16,551 Denominator
Average total assets of continuing operations1 $ 203,999 $ 203,680 Return on assets (ROA) 8.2% 8.1%
As of January 31,
Certain Balance Sheet Data 2015 2014 2013 Total assets of continuing operations $ 203,706 $ 204,291 $ 203,068Accumulated depreciation and amortization 65,979 60,771 55,043Accounts payable 38,410 37,415 38,080Accrued liabilities 19,152 18,793 18,808
The average is based on the addition of the account balance at the end of the current period to the account balance atthe end of the prior period and dividing by 2.1
Fiscal Years Ended
January 31,
(Dollars in millions) 2015 2014 Net cash provided by operating activities $ 28,564 $ 23,257Payments for property and equipment (12,174) (13,115)
Free cash flow $ 16,390 $ 10,142
Net cash used in investing activities1 $(11,125) $(12,526)Net cash used in financing activities $(15,071) $(10,789)
1
6/23/2015 Walmart announces Q4 underlying EPS of $1.61 and additional strategic investments in people & e-commerce; Walmart U.S. comp sales increased 1.5 percent
http://news.walmart.com/news-archive/investors/2015/02/19/walmart-announces-q4-underlying-eps-of-161-and-additional-strategic-investments-in-people-e-com… 11/13
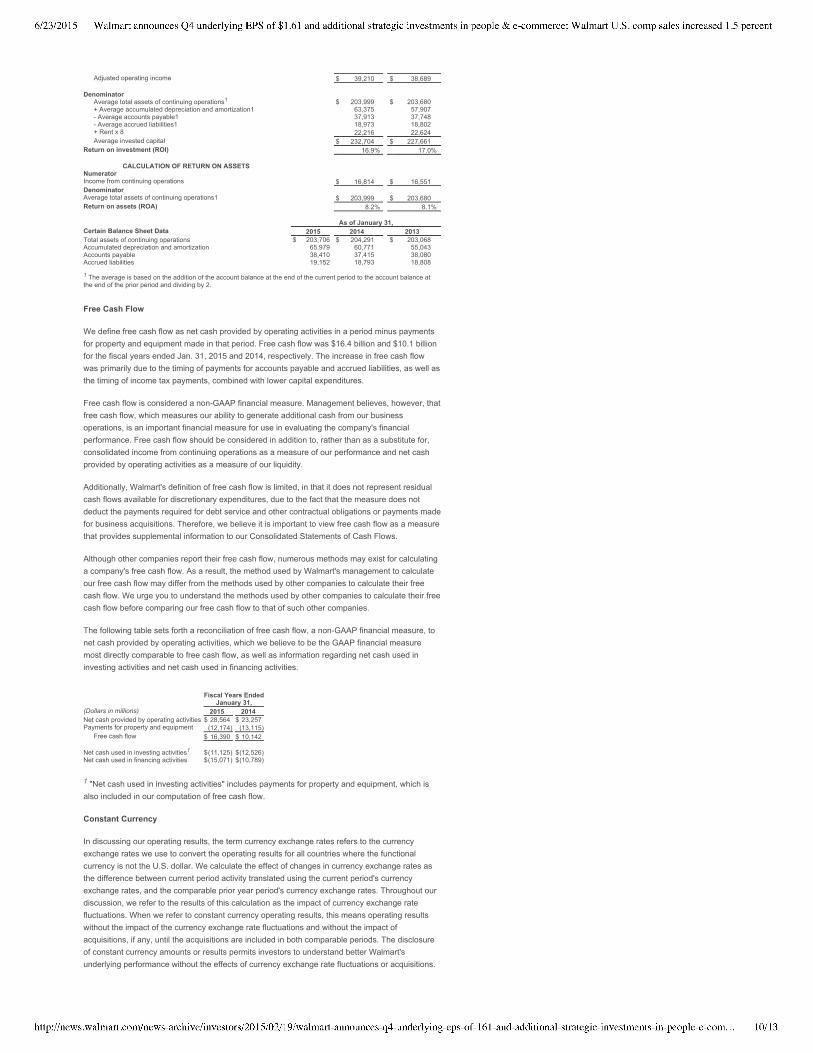
The table below reflects the calculation of constant currency for total revenues, net sales andoperating income for the three months and fiscal year ended Jan. 31, 2015.
Underlying EPS
The underlying diluted earnings per share from continuing operations attributable to Walmart(Underlying EPS) for each of the three-month periods and fiscal years ended Jan. 31, 2015 and2014 is considered a non-GAAP financial measure under the SEC's rules because the UnderlyingEPS for each such period includes certain amounts not included in the diluted earnings per sharefrom continuing operations attributable to Walmart calculated in accordance with GAAP (EPS) foreach of the three-month periods and fiscal years ended Jan. 31, 2015 and 2014. Managementbelieves that the Underlying EPS for each of the three-month periods and fiscal years ended Jan.31, 2015 and 2014 is a meaningful metric to share with investors because that metric, whichadjusts EPS for such period for certain items recorded in such period, is the metric that best allowscomparison of the performance for the comparable period. In addition, the metric affords investorsa view of what management considers Walmart's core earnings performance for each of the three-month periods and fiscal years ended Jan. 31, 2015 and 2014 and also affords investors the abilityto make a more informed assessment of such core earnings performance for the comparableperiod.
We have calculated the Underlying EPS for the three months and the fiscal year ended Jan. 31,2015 by adjusting the EPS for each period for the amount of the dilutive impact of: (1) the effect ofthe wage and hour litigation matter (Wage and Hour Litigation Matter) and (2) the closure ofapproximately 30 underperforming stores in Japan (Japan Store Closures).
Underlying EPS for each of the three months and the fiscal year ended Jan. 31, 2015 is a non-GAAP financial measure. The most directly comparable financial measure calculated inaccordance with GAAP is EPS for the three months and the fiscal year ended Jan. 31, 2015,respectively.
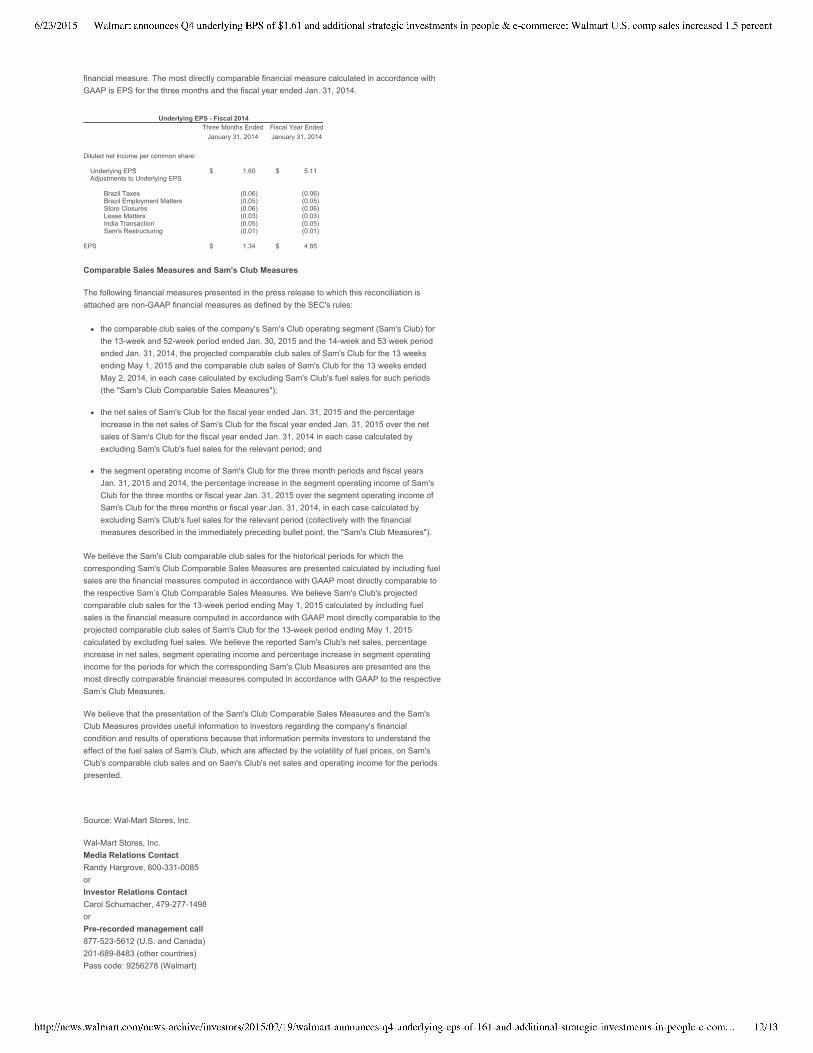
As previously disclosed in our fiscal year ended Jan. 31, 2014 press release, we have calculatedthe Underlying EPS for the three months and the fiscal year ended Jan. 31, 2014 by adjusting theEPS for each period for the amount of the dilutive impact of: (1) Brazil non-income taxcontingencies (Brazil Taxes);; (2) Brazil employment claim contingencies (Brazil EmploymentMatters);; (3) the closure of 54 underperforming Brazil and China stores (Store Closures);; (4) Chinastore lease expense charges (Lease Matters);; (5) the India transaction (India Transaction);; and (6)Sam's Club U.S. staff restructuring and club closure (Sam's Restructuring).
Underlying EPS for the three months and the fiscal year ended Jan. 31, 2014 is a non-GAAP
Three Months Ended January 31, 2015 Fiscal Year Ended January 31, 2015
Walmart
International
Consolidated
Walmart
International
Consolidated
(Dollars in millions) 2015 PercentChange 2015 Percent
Change 2015 PercentChange 2015 PercentChange
Total revenues: As reported $36,537 (3.8)% $131,565 1.4% $137,424 (0.1)% $485,651 2.0%Currency exchange ratefluctuations1 2,626 2,626 5,323 5,323
39,163 134,191 142,747 490,974Total revenues fromacquisitions — — — —
Constant currency totalrevenues $39,163 3.1% $134,191 3.5% $142,747 3.7% $490,974 3.1%
Net sales:
As reported $36,205 (3.9)% $130,650 1.4% $136,160 (0.3)% $482,229 1.9%Currency exchange ratefluctuations1 2,599 2,599 5,267 5,267
38,804 133,249 141,427 487,496Net sales from acquisitions — — — — Constant currency net sales $38,804 3.0% $133,249 3.5% $141,427 3.6% $487,496 3.0%
Operating income:
As reported $ 2,050 66.4% $ 7,949 8.2% $ 6,171 19.8% $ 27,147 1.0%Currency exchange ratefluctuations1 163 163 225 225
2,213 8,112 6,396 27,372Operating income (loss) fromacquisitions — — — —
Constant currency operatingincome $ 2,213 79.6% $ 8,112 10.4% $ 6,396 24.1% $ 27,372 1.9%
1 Excludes currency exchange rate fluctuations related to acquisitions until the acquisitions are included in bothcomparable periods.
Underlying EPS - Fiscal 2015
Three Months EndedJanuary 31, 2015
Fiscal Year EndedJanuary 31, 2015
Diluted net income per common share:
Underlying EPS $ 1.61 $ 5.07Adjustments to Underlying EPS
Wage and Hour Litigation Matter (0.05) (0.05)Japan Store Closures (0.03) (0.03)
EPS $ 1.53 $ 4.99
6/23/2015 Walmart announces Q4 underlying EPS of $1.61 and additional strategic investments in people & e-commerce; Walmart U.S. comp sales increased 1.5 percent
http://news.walmart.com/news-archive/investors/2015/02/19/walmart-announces-q4-underlying-eps-of-161-and-additional-strategic-investments-in-people-e-com… 12/13
financial measure. The most directly comparable financial measure calculated in accordance with
GAAP is EPS for the three months and the fiscal year ended Jan. 31, 2014.
Comparable Sales Measures and Sam's Club Measures
The following financial measures presented in the press release to which this reconciliation is
attached are non-GAAP financial measures as defined by the SEC's rules:
the comparable club sales of the company's Sam's Club operating segment (Sam's Club) for
the 13-week and 52-week period ended Jan. 30, 2015 and the 14-week and 53 week period
ended Jan. 31, 2014, the projected comparable club sales of Sam's Club for the 13 weeks
ending May 1, 2015 and the comparable club sales of Sam's Club for the 13 weeks ended
May 2, 2014, in each case calculated by excluding Sam's Club's fuel sales for such periods
(the "Sam's Club Comparable Sales Measures");;
the net sales of Sam's Club for the fiscal year ended Jan. 31, 2015 and the percentage
increase in the net sales of Sam's Club for the fiscal year ended Jan. 31, 2015 over the net
sales of Sam's Club for the fiscal year ended Jan. 31, 2014 in each case calculated by
excluding Sam's Club's fuel sales for the relevant period;; and
the segment operating income of Sam's Club for the three month periods and fiscal years
Jan. 31, 2015 and 2014, the percentage increase in the segment operating income of Sam's
Club for the three months or fiscal year Jan. 31, 2015 over the segment operating income of
Sam's Club for the three months or fiscal year Jan. 31, 2014, in each case calculated by
excluding Sam's Club's fuel sales for the relevant period (collectively with the financial
measures described in the immediately preceding bullet point, the "Sam's Club Measures").
We believe the Sam's Club comparable club sales for the historical periods for which the
corresponding Sam's Club Comparable Sales Measures are presented calculated by including fuel
sales are the financial measures computed in accordance with GAAP most directly comparable to
the respective Sam’s Club Comparable Sales Measures. We believe Sam's Club's projected
comparable club sales for the 13-week period ending May 1, 2015 calculated by including fuel
sales is the financial measure computed in accordance with GAAP most directly comparable to the
projected comparable club sales of Sam's Club for the 13-week period ending May 1, 2015
calculated by excluding fuel sales. We believe the reported Sam's Club's net sales, percentage
increase in net sales, segment operating income and percentage increase in segment operating
income for the periods for which the corresponding Sam's Club Measures are presented are the
most directly comparable financial measures computed in accordance with GAAP to the respective
Sam’s Club Measures.
We believe that the presentation of the Sam's Club Comparable Sales Measures and the Sam's
Club Measures provides useful information to investors regarding the company's financial
condition and results of operations because that information permits investors to understand the
effect of the fuel sales of Sam's Club, which are affected by the volatility of fuel prices, on Sam's
Club's comparable club sales and on Sam's Club's net sales and operating income for the periods
presented.
Source: Wal-Mart Stores, Inc.
Wal-Mart Stores, Inc.
Media Relations ContactRandy Hargrove, 800-331-0085
or
Investor Relations ContactCarol Schumacher, 479-277-1498
or
Pre-recorded management call877-523-5612 (U.S. and Canada)
201-689-8483 (other countries)
Pass code: 9256278 (Walmart)
Underlying EPS - Fiscal 2014
Three Months Ended
January 31, 2014
Fiscal Year Ended
January 31, 2014
Diluted net income per common share:
Underlying EPS $ 1.60 $ 5.11
Adjustments to Underlying EPS
Brazil Taxes (0.06) (0.06)
Brazil Employment Matters (0.05) (0.05)
Store Closures (0.06) (0.06)
Lease Matters (0.03) (0.03)
India Transaction (0.05) (0.05)
Sam's Restructuring (0.01) (0.01)
EPS $ 1.34 $ 4.85

6/23/2015 Walmart announces Q4 underlying EPS of $1.61 and additional strategic investments in people & e-commerce; Walmart U.S. comp sales increased 1.5 percent
http://news.walmart.com/news-archive/investors/2015/02/19/walmart-announces-q4-underlying-eps-of-161-and-additional-strategic-investments-in-people-e-com… 13/13


![Dispute management plan [docx 1.61 MB]](https://img.pdfslide.us/doc/110x75/5868d1fa1a28ab427d8b7bcd/dispute-management-plan-docx-161-mb.jpg)