Embed Size (px)
Citation preview
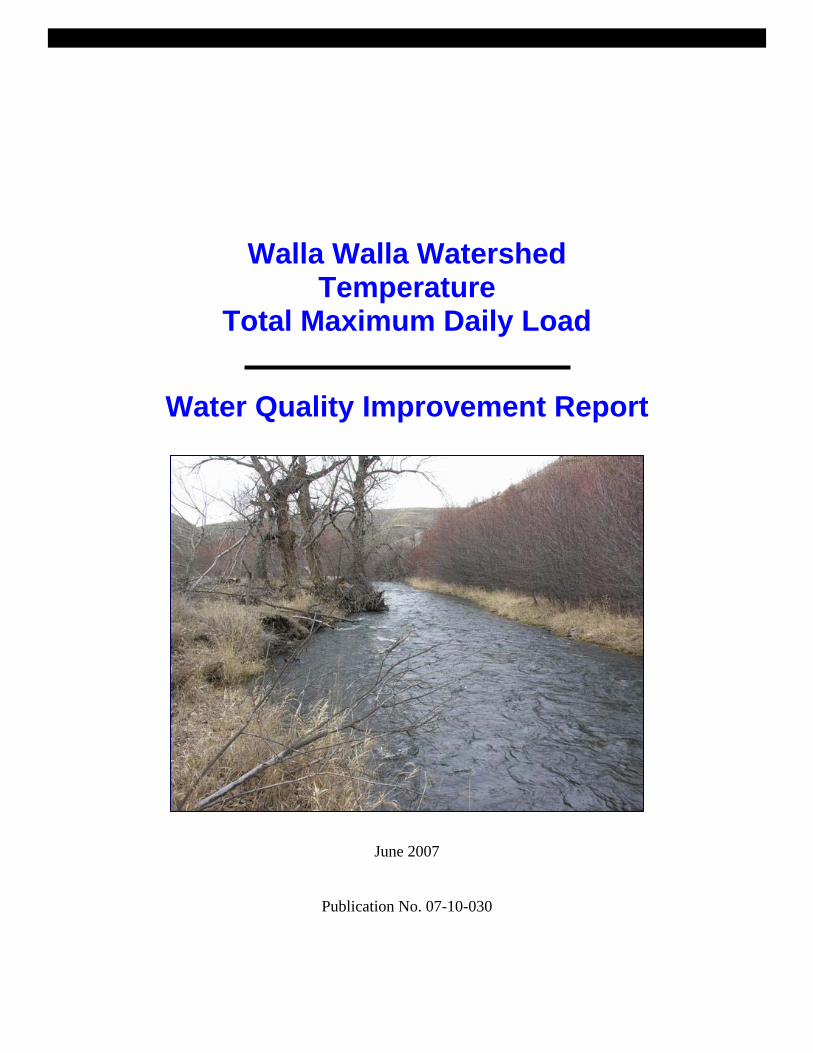
Walla Walla Watershed Temperature
Total Maximum Daily Load
Water Quality Improvement Report
June 2007
Publication No. 07-10-030
Publication Information This report is available on the Department of Ecology’s website at www.ecy.wa.gov/biblio/0710030.html. For more information contact: Water Quality Program Eastern Regional Office N. 4601 Monroe Spokane, WA 99205-1295 E-mail: [email protected] Phone: (509) 329-3472
Data for this project are available at Ecology’s Environmental Information Management (EIM) website at www.ecy.wa.gov/eim/index.htm. Search User Study ID, (ASTO0003). The Study Tracker Code for this study is (02-071-01).
Any use of product or firm names in this publication is for descriptive purposes only and does not imply endorsement by the author or the Department of Ecology.
If you need this publication in an alternate format, call us at (509) 329-3557. Persons with hearing loss can call 711 for Washington Relay Service. Persons with a speech disability can call 877-833-6341.
Walla Walla Watershed Temperature
Total Maximum Daily Load
Water Quality Improvement Report
By
Karin Baldwin & Anita Stohr
Water Quality Program and
Environmental Assessment Program Washington State Department of Ecology
Olympia, Washington 98504-7710
With help from Don Butcher
Walla Walla Basin Coordinator Oregon Department of Environmental Quality
Pendleton, OR 97801
Waterbody No.: See Table 1 Publication No. 07-10-030

Walla Walla Temperature WQIR Page i
Table of Contents
Page
List of Figures and Tables.................................................................................................. iii
Abstract ............................................................................................................................. vii
Acknowledgements.......................................................................................................... viii
Executive Summary ........................................................................................................... ix Introduction.................................................................................................................. ix Study area.......................................................................................................................x Allocations summary / recommendations......................................................................x Implementation strategy............................................................................................... xi Next steps..................................................................................................................... xi
What is a Total Maximum Daily Load (TMDL)? ...............................................................1 Federal Clean Water Act requirements..........................................................................1 TMDL process overview ...............................................................................................1 Elements required in a TMDL .......................................................................................2 What part of the process are we in? ...............................................................................2
Why is Ecology Conducting a TMDL Study in this Watershed?.......................................3 Overview........................................................................................................................3 Study area.......................................................................................................................3 Why are we doing this TMDL now? .............................................................................6 Overview of stream heating processes...........................................................................7 Pollutants and surrogate measures ...............................................................................18
Water Quality Standards and Beneficial Uses ...................................................................21 New 2006 temperature standards.................................................................................23
Watershed Description.......................................................................................................27
TMDL Analyses.................................................................................................................31 Tributaries ....................................................................................................................31 Mainstem......................................................................................................................63 Allocation for future growth ........................................................................................82
Implementation Strategy....................................................................................................83 Introduction..................................................................................................................83 What needs to be done? ...............................................................................................83 Who needs to participate?............................................................................................95 What is the schedule for achieving water quality standards? ....................................102 Reasonable assurances ...............................................................................................103 Adaptive management ...............................................................................................105 Monitoring progress...................................................................................................106 Potential funding sources...........................................................................................107 Summary of public involvement methods .................................................................109 Next steps...................................................................................................................110
References........................................................................................................................111
Page ii Walla Walla Temperature WQIR
Appendices.......................................................................................................................119 Appendix A. Glossary and Acronyms .......................................................................119 Appendix B. Record of Public Participation..............................................................123 Appendix C. Walla Walla Tributaries Temperature TMDL......................................133 Appendix D. Load allocations for effective shade for the Walla Walla River
tributaries ............................................................................................135 Appendix E. Stream Temperature Analysis for the Walla Walla River ....................149 Appendix A: Stream Temperature Analysis: Vegetation, Hydrology and
Morphology Walla Walla Subbasin ....................................................149
Walla Walla Temperature WQIR Page iii
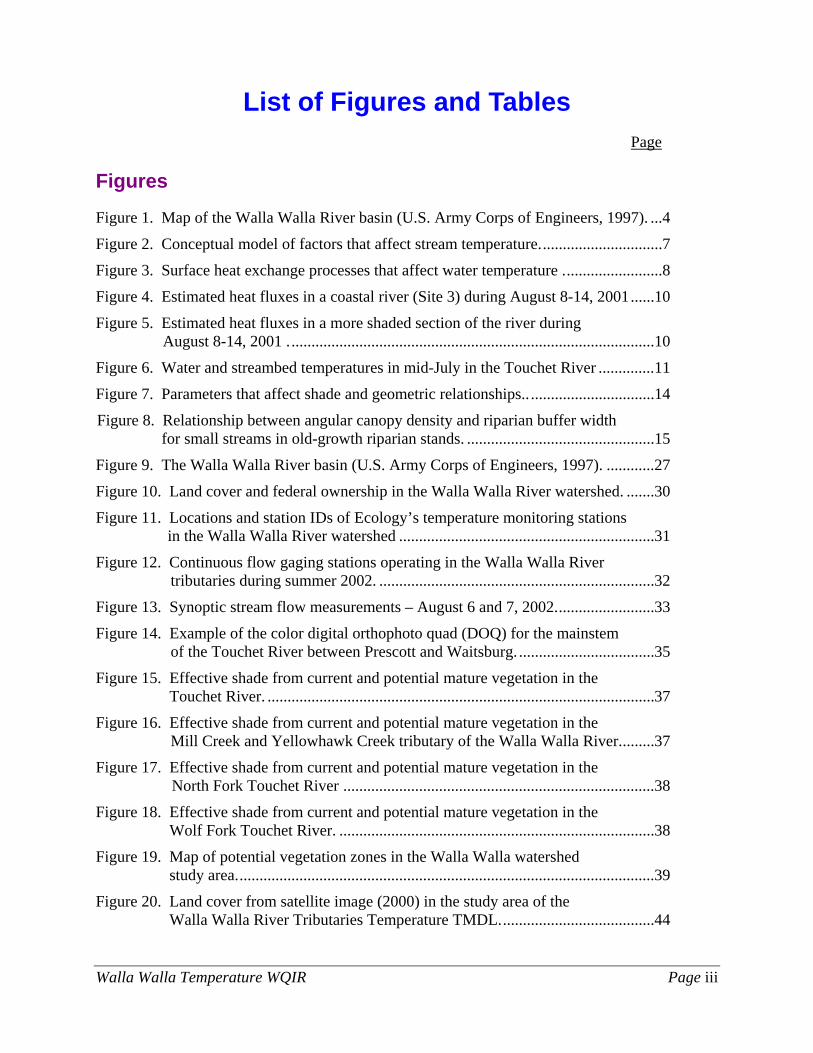
List of Figures and Tables Page
Figures
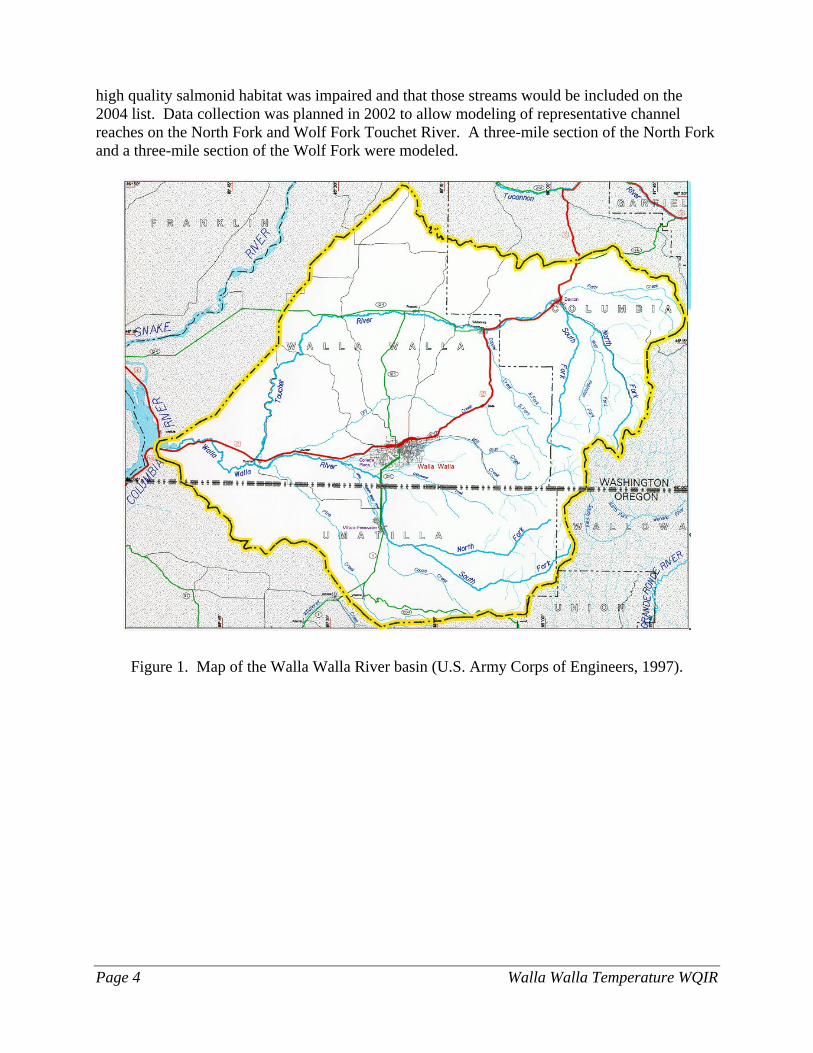
Figure 1. Map of the Walla Walla River basin (U.S. Army Corps of Engineers, 1997). ...4
Figure 2. Conceptual model of factors that affect stream temperature...............................7
Figure 3. Surface heat exchange processes that affect water temperature .........................8
Figure 4. Estimated heat fluxes in a coastal river (Site 3) during August 8-14, 2001......10
Figure 5. Estimated heat fluxes in a more shaded section of the river during August 8-14, 2001 ............................................................................................10
Figure 6. Water and streambed temperatures in mid-July in the Touchet River ..............11
Figure 7. Parameters that affect shade and geometric relationships.. ...............................14
Figure 8. Relationship between angular canopy density and riparian buffer width for small streams in old-growth riparian stands. ...............................................15
Figure 9. The Walla Walla River basin (U.S. Army Corps of Engineers, 1997). ............27
Figure 10. Land cover and federal ownership in the Walla Walla River watershed. .......30
Figure 11. Locations and station IDs of Ecology’s temperature monitoring stations in the Walla Walla River watershed ................................................................31
Figure 12. Continuous flow gaging stations operating in the Walla Walla River tributaries during summer 2002. .....................................................................32
Figure 13. Synoptic stream flow measurements – August 6 and 7, 2002.........................33
Figure 14. Example of the color digital orthophoto quad (DOQ) for the mainstem of the Touchet River between Prescott and Waitsburg. ..................................35
Figure 15. Effective shade from current and potential mature vegetation in the Touchet River. .................................................................................................37
Figure 16. Effective shade from current and potential mature vegetation in the Mill Creek and Yellowhawk Creek tributary of the Walla Walla River.........37
Figure 17. Effective shade from current and potential mature vegetation in the North Fork Touchet River ..............................................................................38
Figure 18. Effective shade from current and potential mature vegetation in the Wolf Fork Touchet River. ...............................................................................38
Figure 19. Map of potential vegetation zones in the Walla Walla watershed study area.........................................................................................................39
Figure 20. Land cover from satellite image (2000) in the study area of the Walla Walla River Tributaries Temperature TMDL.......................................44
Page iv Walla Walla Temperature WQIR
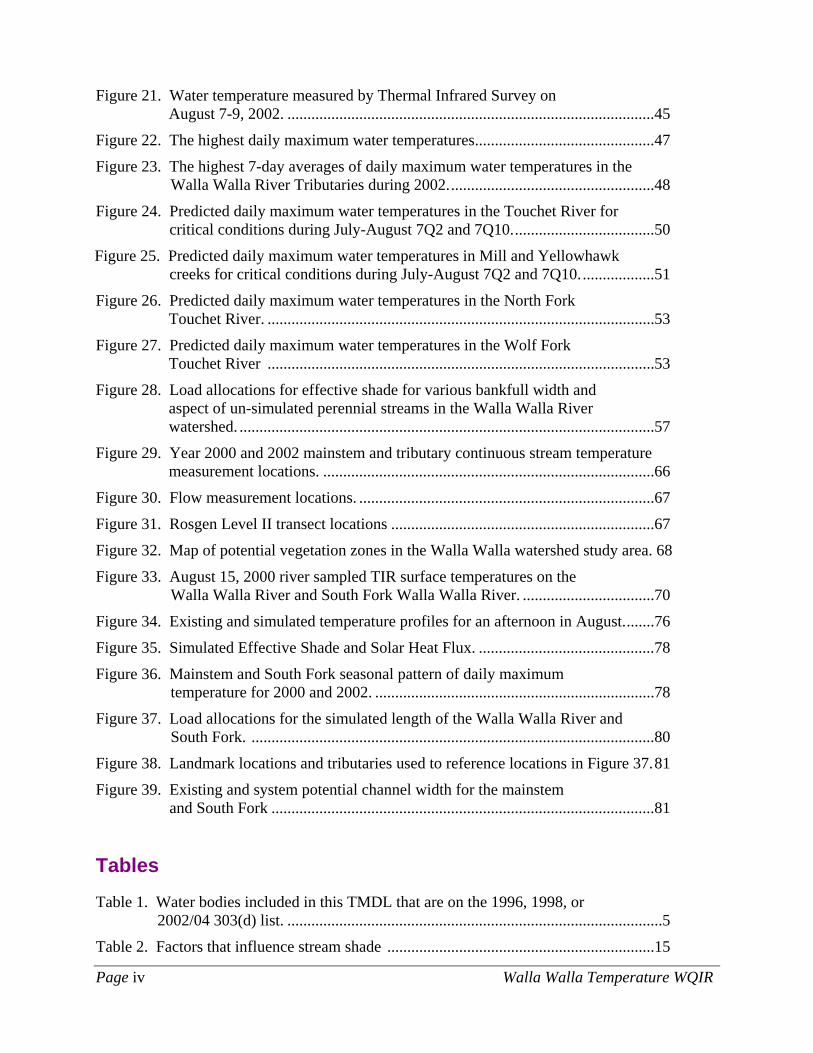
Figure 21. Water temperature measured by Thermal Infrared Survey on August 7-9, 2002. ............................................................................................45
Figure 22. The highest daily maximum water temperatures.............................................47
Figure 23. The highest 7-day averages of daily maximum water temperatures in the Walla Walla River Tributaries during 2002....................................................48
Figure 24. Predicted daily maximum water temperatures in the Touchet River for critical conditions during July-August 7Q2 and 7Q10....................................50
Figure 25. Predicted daily maximum water temperatures in Mill and Yellowhawk creeks for critical conditions during July-August 7Q2 and 7Q10...................51
Figure 26. Predicted daily maximum water temperatures in the North Fork Touchet River. .................................................................................................53
Figure 27. Predicted daily maximum water temperatures in the Wolf Fork Touchet River .................................................................................................53
Figure 28. Load allocations for effective shade for various bankfull width and aspect of un-simulated perennial streams in the Walla Walla River watershed. ........................................................................................................57
Figure 29. Year 2000 and 2002 mainstem and tributary continuous stream temperature measurement locations. ...................................................................................66
Figure 30. Flow measurement locations. ..........................................................................67
Figure 31. Rosgen Level II transect locations ..................................................................67
Figure 32. Map of potential vegetation zones in the Walla Walla watershed study area. 68
Figure 33. August 15, 2000 river sampled TIR surface temperatures on the Walla Walla River and South Fork Walla Walla River. .................................70
Figure 34. Existing and simulated temperature profiles for an afternoon in August........76
Figure 35. Simulated Effective Shade and Solar Heat Flux. ............................................78
Figure 36. Mainstem and South Fork seasonal pattern of daily maximum temperature for 2000 and 2002. ......................................................................78
Figure 37. Load allocations for the simulated length of the Walla Walla River and South Fork. .....................................................................................................80
Figure 38. Landmark locations and tributaries used to reference locations in Figure 37.81
Figure 39. Existing and system potential channel width for the mainstem and South Fork ................................................................................................81
Tables
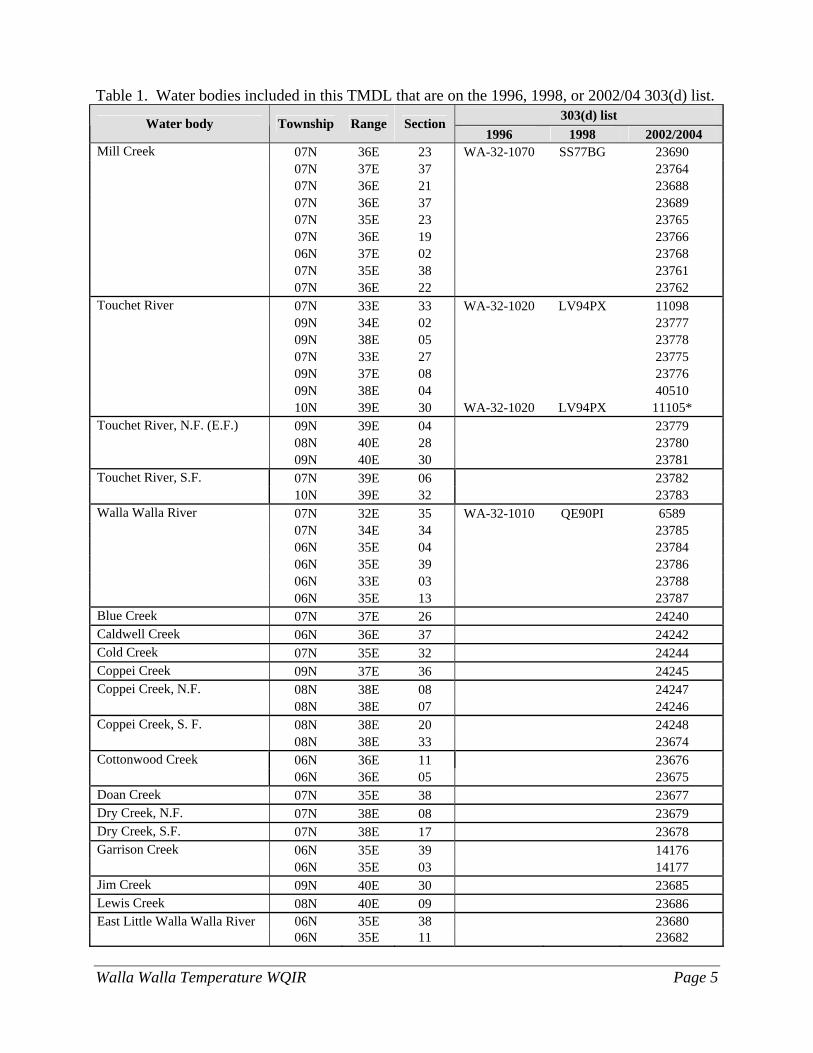
Table 1. Water bodies included in this TMDL that are on the 1996, 1998, or 2002/04 303(d) list. ..............................................................................................5
Table 2. Factors that influence stream shade ...................................................................15
Walla Walla Temperature WQIR Page v
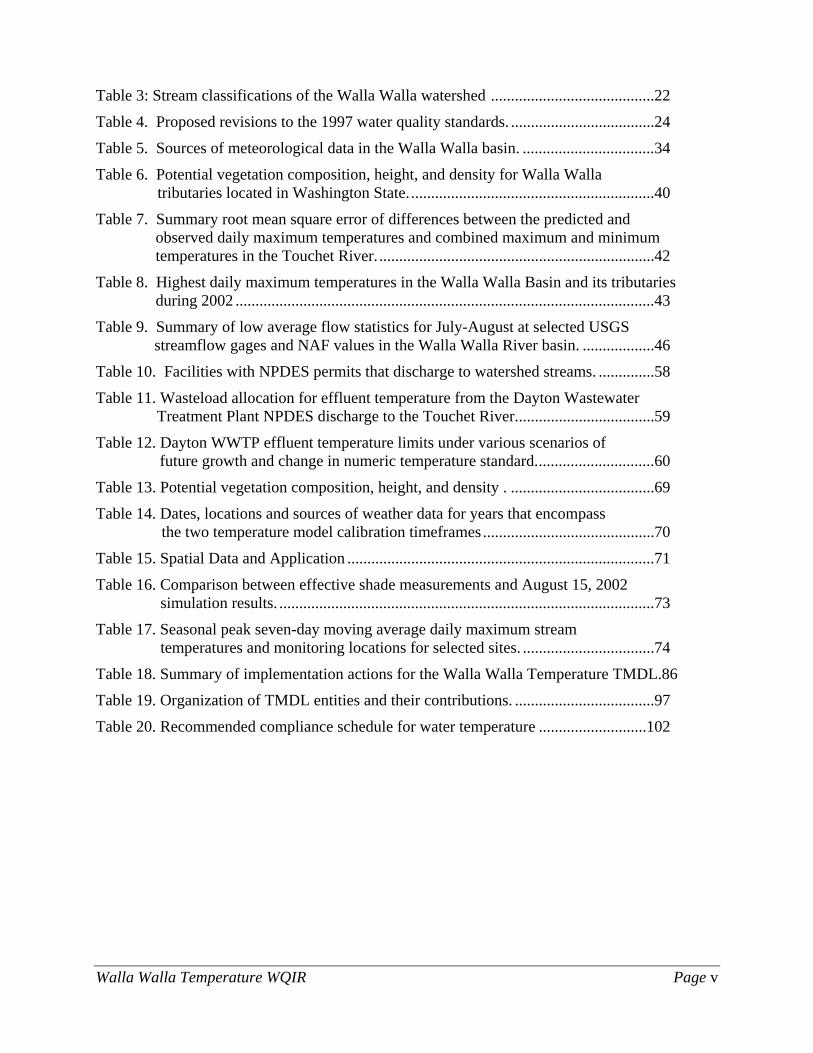
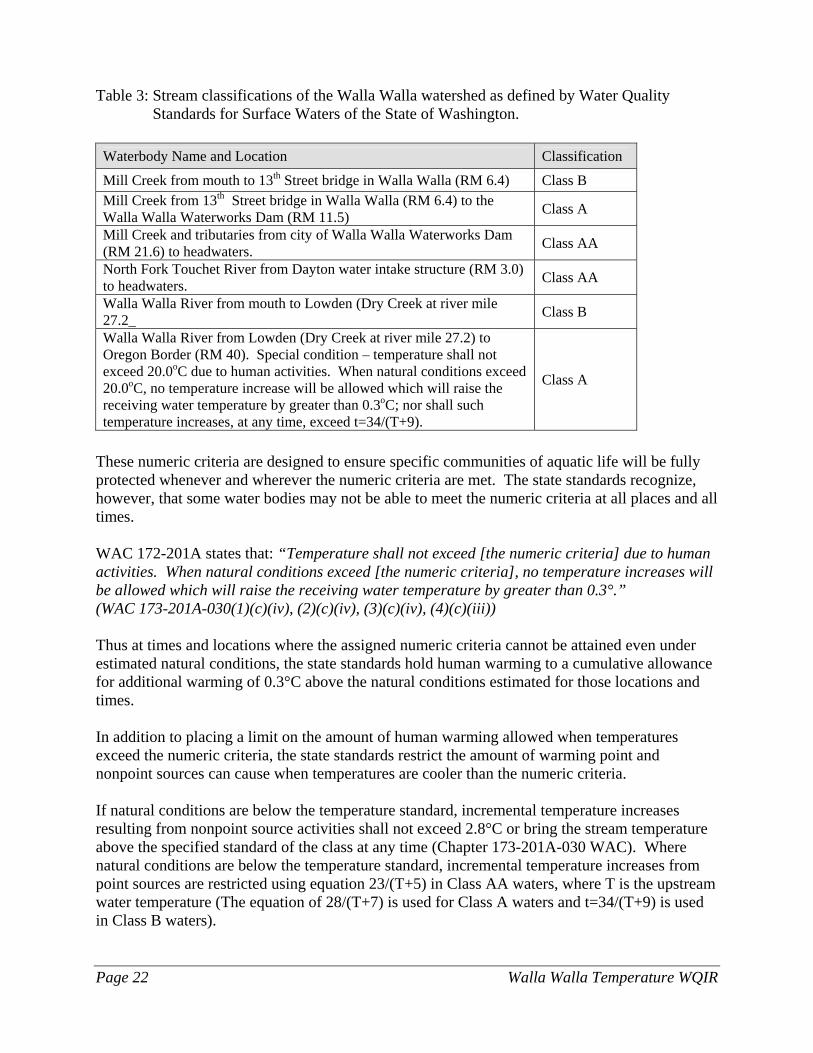
Table 3: Stream classifications of the Walla Walla watershed .........................................22
Table 4. Proposed revisions to the 1997 water quality standards. ....................................24
Table 5. Sources of meteorological data in the Walla Walla basin. .................................34
Table 6. Potential vegetation composition, height, and density for Walla Walla tributaries located in Washington State..............................................................40
Table 7. Summary root mean square error of differences between the predicted and observed daily maximum temperatures and combined maximum and minimum temperatures in the Touchet River......................................................................42
Table 8. Highest daily maximum temperatures in the Walla Walla Basin and its tributaries during 2002 .........................................................................................................43
Table 9. Summary of low average flow statistics for July-August at selected USGS streamflow gages and NAF values in the Walla Walla River basin. ..................46
Table 10. Facilities with NPDES permits that discharge to watershed streams. ..............58
Table 11. Wasteload allocation for effluent temperature from the Dayton Wastewater Treatment Plant NPDES discharge to the Touchet River...................................59
Table 12. Dayton WWTP effluent temperature limits under various scenarios of future growth and change in numeric temperature standard..............................60
Table 13. Potential vegetation composition, height, and density . ....................................69
Table 14. Dates, locations and sources of weather data for years that encompass the two temperature model calibration timeframes ...........................................70
Table 15. Spatial Data and Application .............................................................................71
Table 16. Comparison between effective shade measurements and August 15, 2002 simulation results. ..............................................................................................73
Table 17. Seasonal peak seven-day moving average daily maximum stream temperatures and monitoring locations for selected sites. .................................74
Table 18. Summary of implementation actions for the Walla Walla Temperature TMDL.86
Table 19. Organization of TMDL entities and their contributions. ...................................97
Table 20. Recommended compliance schedule for water temperature ...........................102

Page vi Walla Walla Temperature WQIR
Walla Walla Temperature WQIR Page vii
Abstract The study area for the Walla Walla Temperature Total Maximum Daily Load (TMDL) includes the Walla Walla River and all its major tributaries in Washington State. The Walla Walla River basin contains anadromous fish habitat that support Spring Chinook, Rainbow/ Steelhead Trout, Bull Trout, and Mountain Whitefish. The 303(d) listings for temperature in the study area include the Walla Walla River, Touchet River, Mill Creek, and twenty-three additional streams. As part of the Walla Walla River TMDL study for temperature, the Washington State Department of Ecology (Ecology) conducted field work during 2002-2004 on the tributaries. The Oregon Department of Environmental Quality (ODEQ) conducted field work during 2000 and 2002 on the entire length of the Walla Walla River. This report presents the analysis performed by Ecology and ODEQ. Effective shade is used as a surrogate measure of heat flux to fulfill the requirements of Section 303(d) for a Total Maximum Daily Load (TMDL) for temperature. Effective shade is defined as the solar short wave radiation that is blocked by vegetation and topography from reaching the stream surface. In general, site potential effective shade is needed to meet water quality standards in the Walla Walla watershed. In addition to effective shade, landowners should take measures to increase channel stability and channel complexity. Implementation of this TMDL will involve prioritizing sites for implementation, finding funding, educating watershed residents, and implementing best management practices. More specifically, the implementation strategy calls for landowners to install riparian buffers, reduce sediment and increase stream flow. Since implementation involves growing mature trees along the streams and allowing for stream channels to restore to more healthy configurations, it may take fifty years to fully implement this TMDL. To ensure the TMDL will be met in the shortest practical time, the implementation strategy also includes: • Some reasonable assurances that the strategy will be followed. • A monitoring plan to evaluate progress. • An adaptive management strategy that will make mid-course corrections in the strategy if
the TMDL interim targets are not met throughout the watershed. Once implemented, the average maximum temperature during July through August is expected to be 4.6ºC to 6.6ºC cooler than present conditions, with an average temperature decrease of 5.9ºC.
Page viii Walla Walla Temperature WQIR
Acknowledgements We would like to thank the following for their contributions to this study:
• Don Butcher, Oregon Department of Environmental Quality, for performing stream temperature modeling work on the mainstem Walla Walla River and reviewing this document.
• The Walla Walla Water Quality Subcommittee for volunteering all their time to provide guidance and assistance with the implementation strategy.
Walla Walla Temperature WQIR Page ix
Executive Summary
Introduction The Clean Water Act requires that a Total Maximum Daily Load (TMDL) be developed for each of the water bodies on the 303(d) list. A TMDL includes a written, quantitative assessment of water quality problems and of the pollutant sources that cause the problem. The TMDL determines the amount of a given pollutant that can be discharged to the water body and still meet the state standards and allocates that load among the various sources. The TMDL must also consider seasonal variations and include a margin of safety that takes into account lack of knowledge about the causes of the water quality problem. The Washington State Department of Ecology (Ecology) then works with the local community to develop an overall approach to control the pollution, called the Implementation Strategy, and a monitoring plan to assess effectiveness of the water quality improvement activities. The implementation strategy is intended to describe the roles of organizations to improve water quality and programs or other means through which they will address the water temperature issue. We are in the part of the process where the technical assessment and implementation strategy are combined into the Water Quality Improvement Report. This Water Quality Improvement Report will be submitted to the U.S. Environmental Protection Agency (EPA) for review and approval. Interested and responsible parties will then work to develop a Water Quality Implementation Plan. That plan will describe and prioritize specific actions planned to improve water quality. The Walla Walla River Basin is in Water Resource Inventory Area (WRIA) 32 located in Walla Walla and Columbia Counties in Washington State. The purpose of the Walla Walla River Tributaries Temperature TMDL is to characterize water temperature in the basin and establish load and wasteload allocations for heat sources to meet water quality standards for water temperature. Ecology’s Environmental Assessment Program studied major tributaries to the Walla Walla River in Washington State. The Walla Walla mainstem analysis was performed by the Oregon Department of Environmental Quality (ODEQ) in collaboration with Ecology, as part of a larger project to address the entire Walla Walla mainstem, which lies in both states (ODEQ, 2005). This study was initiated because of 303(d) listings for temperature on the Walla Walla River, Touchet River and Mill Creek. The original exceedances were found during routine monitoring at three Ecology Ambient Monitoring stations during 1991-1996. Work by others in the watershed showed that exceedances were common throughout the watershed and many of these stream segments are on the 2002/04 303(d) list. The TMDL include load allocations to address 57 segments that are documented as not meeting the water quality standard for temperature in the 2002/2004 list.
Page x Walla Walla Temperature WQIR
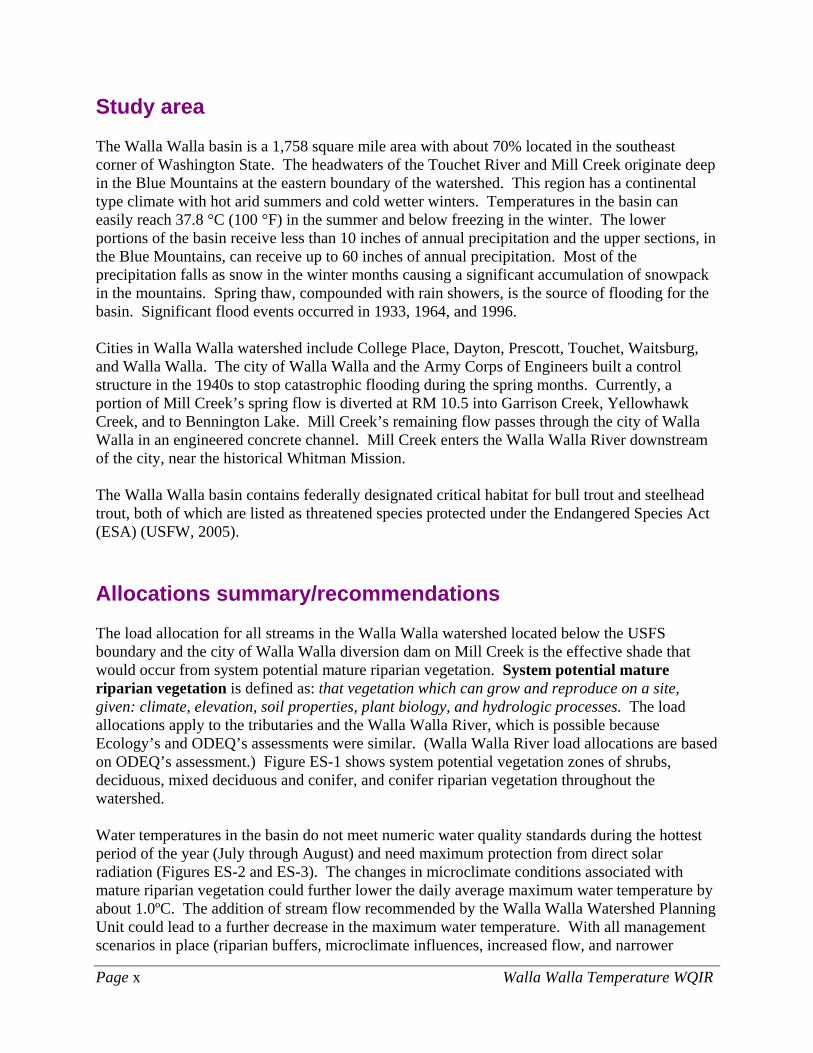
Study area The Walla Walla basin is a 1,758 square mile area with about 70% located in the southeast corner of Washington State. The headwaters of the Touchet River and Mill Creek originate deep in the Blue Mountains at the eastern boundary of the watershed. This region has a continental type climate with hot arid summers and cold wetter winters. Temperatures in the basin can easily reach 37.8 °C (100 °F) in the summer and below freezing in the winter. The lower portions of the basin receive less than 10 inches of annual precipitation and the upper sections, in the Blue Mountains, can receive up to 60 inches of annual precipitation. Most of the precipitation falls as snow in the winter months causing a significant accumulation of snowpack in the mountains. Spring thaw, compounded with rain showers, is the source of flooding for the basin. Significant flood events occurred in 1933, 1964, and 1996. Cities in Walla Walla watershed include College Place, Dayton, Prescott, Touchet, Waitsburg, and Walla Walla. The city of Walla Walla and the Army Corps of Engineers built a control structure in the 1940s to stop catastrophic flooding during the spring months. Currently, a portion of Mill Creek’s spring flow is diverted at RM 10.5 into Garrison Creek, Yellowhawk Creek, and to Bennington Lake. Mill Creek’s remaining flow passes through the city of Walla Walla in an engineered concrete channel. Mill Creek enters the Walla Walla River downstream of the city, near the historical Whitman Mission. The Walla Walla basin contains federally designated critical habitat for bull trout and steelhead trout, both of which are listed as threatened species protected under the Endangered Species Act (ESA) (USFW, 2005).
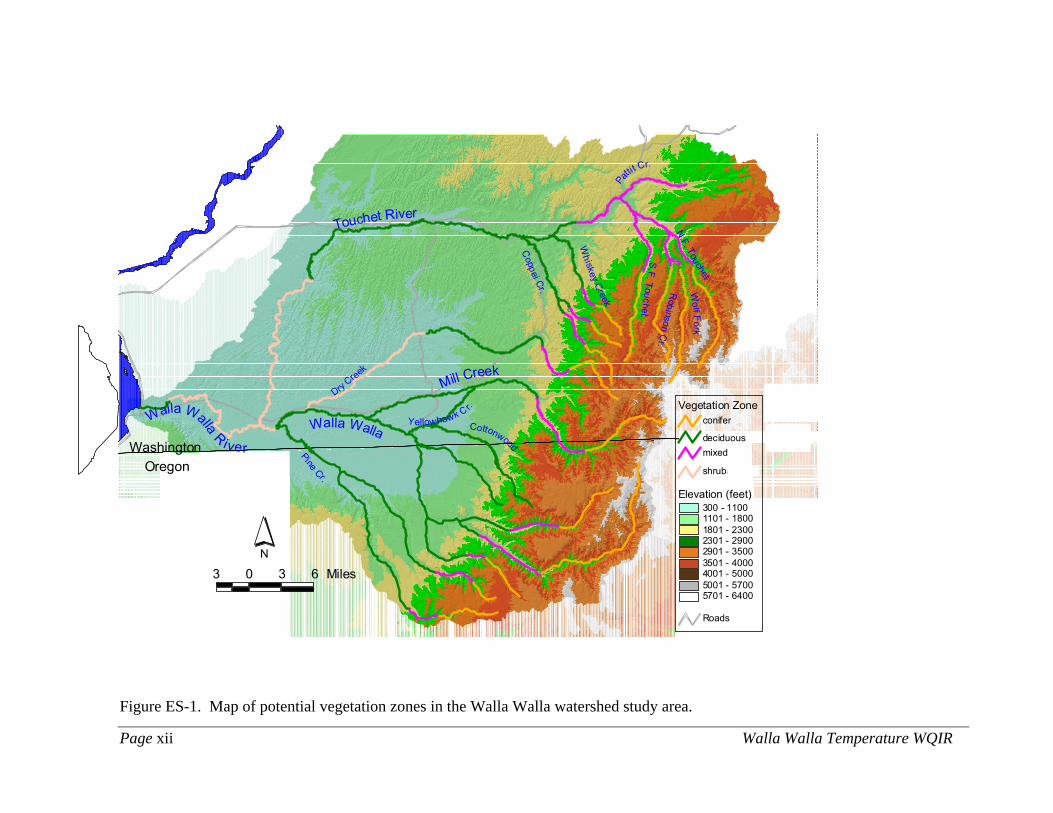
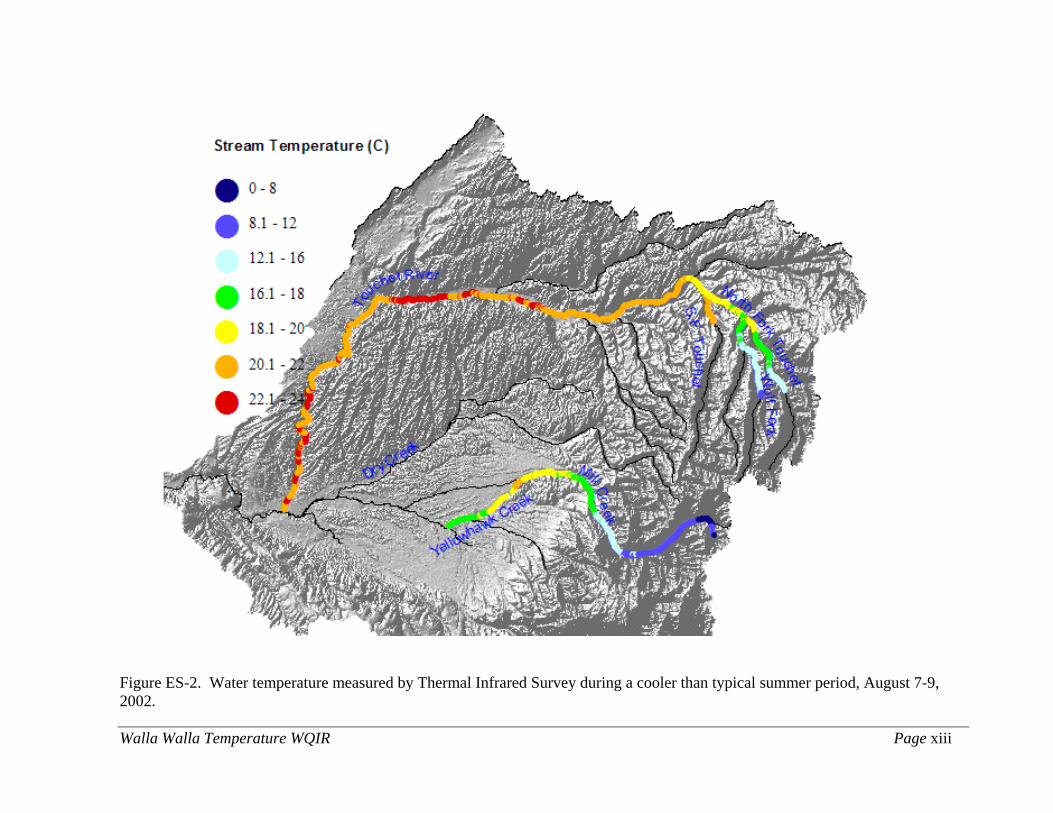
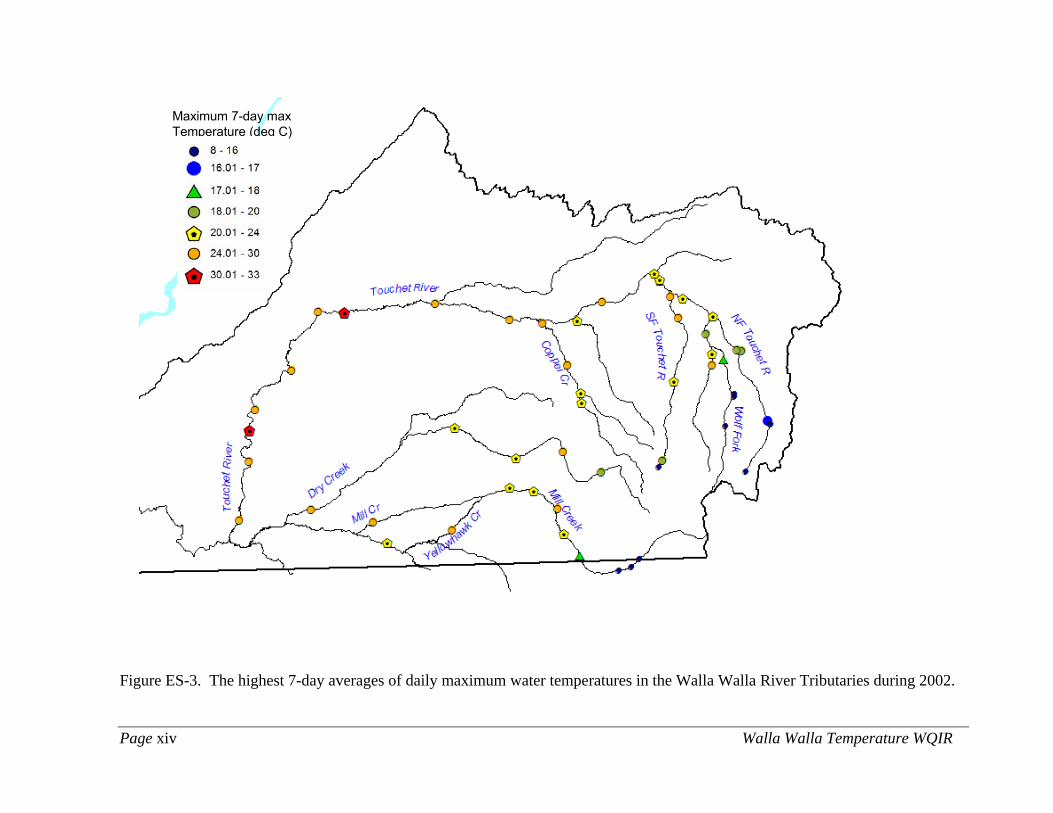
Allocations summary/recommendations The load allocation for all streams in the Walla Walla watershed located below the USFS boundary and the city of Walla Walla diversion dam on Mill Creek is the effective shade that would occur from system potential mature riparian vegetation. System potential mature riparian vegetation is defined as: that vegetation which can grow and reproduce on a site, given: climate, elevation, soil properties, plant biology, and hydrologic processes. The load allocations apply to the tributaries and the Walla Walla River, which is possible because Ecology’s and ODEQ’s assessments were similar. (Walla Walla River load allocations are based on ODEQ’s assessment.) Figure ES-1 shows system potential vegetation zones of shrubs, deciduous, mixed deciduous and conifer, and conifer riparian vegetation throughout the watershed. Water temperatures in the basin do not meet numeric water quality standards during the hottest period of the year (July through August) and need maximum protection from direct solar radiation (Figures ES-2 and ES-3). The changes in microclimate conditions associated with mature riparian vegetation could further lower the daily average maximum water temperature by about 1.0ºC. The addition of stream flow recommended by the Walla Walla Watershed Planning Unit could lead to a further decrease in the maximum water temperature. With all management scenarios in place (riparian buffers, microclimate influences, increased flow, and narrower
Walla Walla Temperature WQIR Page xi
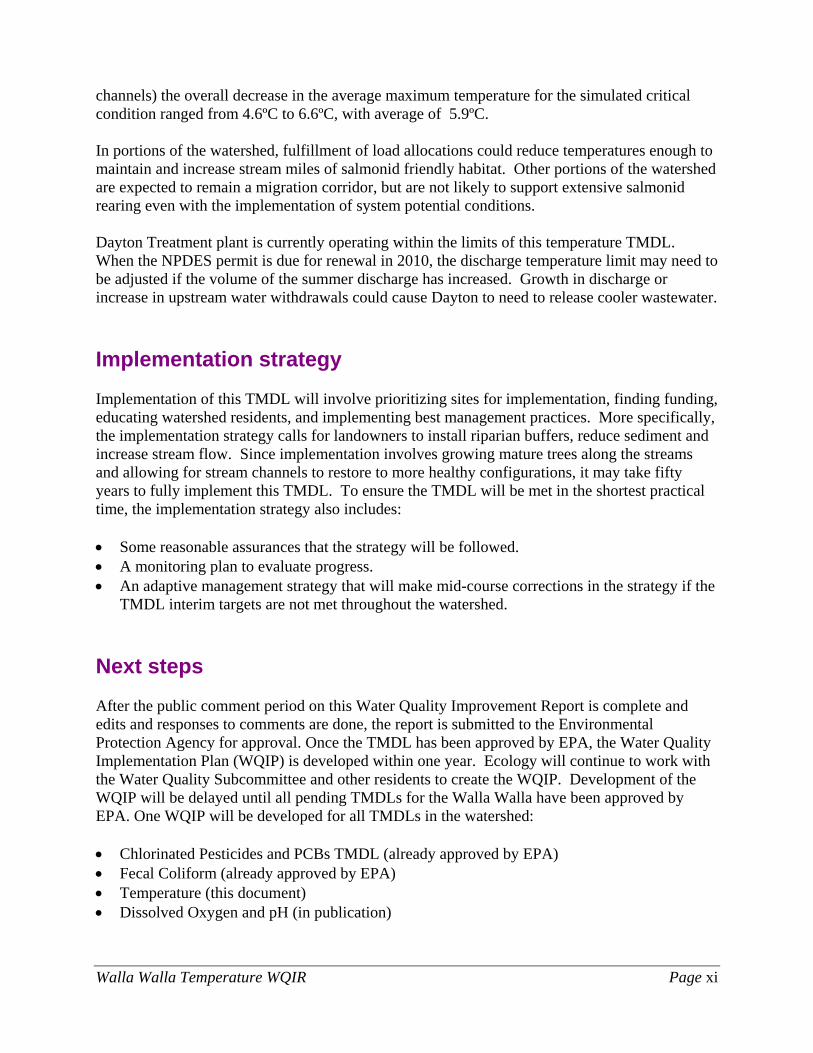
channels) the overall decrease in the average maximum temperature for the simulated critical condition ranged from 4.6ºC to 6.6ºC, with average of 5.9ºC. In portions of the watershed, fulfillment of load allocations could reduce temperatures enough to maintain and increase stream miles of salmonid friendly habitat. Other portions of the watershed are expected to remain a migration corridor, but are not likely to support extensive salmonid rearing even with the implementation of system potential conditions. Dayton Treatment plant is currently operating within the limits of this temperature TMDL. When the NPDES permit is due for renewal in 2010, the discharge temperature limit may need to be adjusted if the volume of the summer discharge has increased. Growth in discharge or increase in upstream water withdrawals could cause Dayton to need to release cooler wastewater.
Implementation strategy Implementation of this TMDL will involve prioritizing sites for implementation, finding funding, educating watershed residents, and implementing best management practices. More specifically, the implementation strategy calls for landowners to install riparian buffers, reduce sediment and increase stream flow. Since implementation involves growing mature trees along the streams and allowing for stream channels to restore to more healthy configurations, it may take fifty years to fully implement this TMDL. To ensure the TMDL will be met in the shortest practical time, the implementation strategy also includes: • Some reasonable assurances that the strategy will be followed. • A monitoring plan to evaluate progress. • An adaptive management strategy that will make mid-course corrections in the strategy if the
TMDL interim targets are not met throughout the watershed.
Next steps After the public comment period on this Water Quality Improvement Report is complete and edits and responses to comments are done, the report is submitted to the Environmental Protection Agency for approval. Once the TMDL has been approved by EPA, the Water Quality Implementation Plan (WQIP) is developed within one year. Ecology will continue to work with the Water Quality Subcommittee and other residents to create the WQIP. Development of the WQIP will be delayed until all pending TMDLs for the Walla Walla have been approved by EPA. One WQIP will be developed for all TMDLs in the watershed: • Chlorinated Pesticides and PCBs TMDL (already approved by EPA) • Fecal Coliform (already approved by EPA) • Temperature (this document) • Dissolved Oxygen and pH (in publication)
Page xii Walla Walla Temperature WQIR
Touchet River
Dry Cree
k
Mill Creek
Walla Walla R iver
Coppei Cr.
Wh iskey Creek
Yellowhawk C r.
WashingtonOregon
N.F. Touchet
S.F. Touchet
Wo lf Fork
Robinson C
r.
Pattit
Cr.
Walla Walla
Pine Cr.
Cottonwood
3 0 3 6 Miles
Elevation (feet)300 - 11001101 - 18001801 - 23002301 - 29002901 - 35003501 - 40004001 - 50005001 - 57005701 - 6400
Roads
Vegetation Zoneconifer
deciduousmixed
shrubanddec
N
Figure ES-1. Map of potential vegetation zones in the Walla Walla watershed study area.
Walla Walla Temperature WQIR Page xiii
Figure ES-2. Water temperature measured by Thermal Infrared Survey during a cooler than typical summer period, August 7-9, 2002.
Page xiv Walla Walla Temperature WQIR
Maximum 7-day max Temperature (deg C)
Figure ES-3. The highest 7-day averages of daily maximum water temperatures in the Walla Walla River Tributaries during 2002.
Walla Walla Temperature WQIR Page 1
What is a Total Maximum Daily Load (TMDL)?
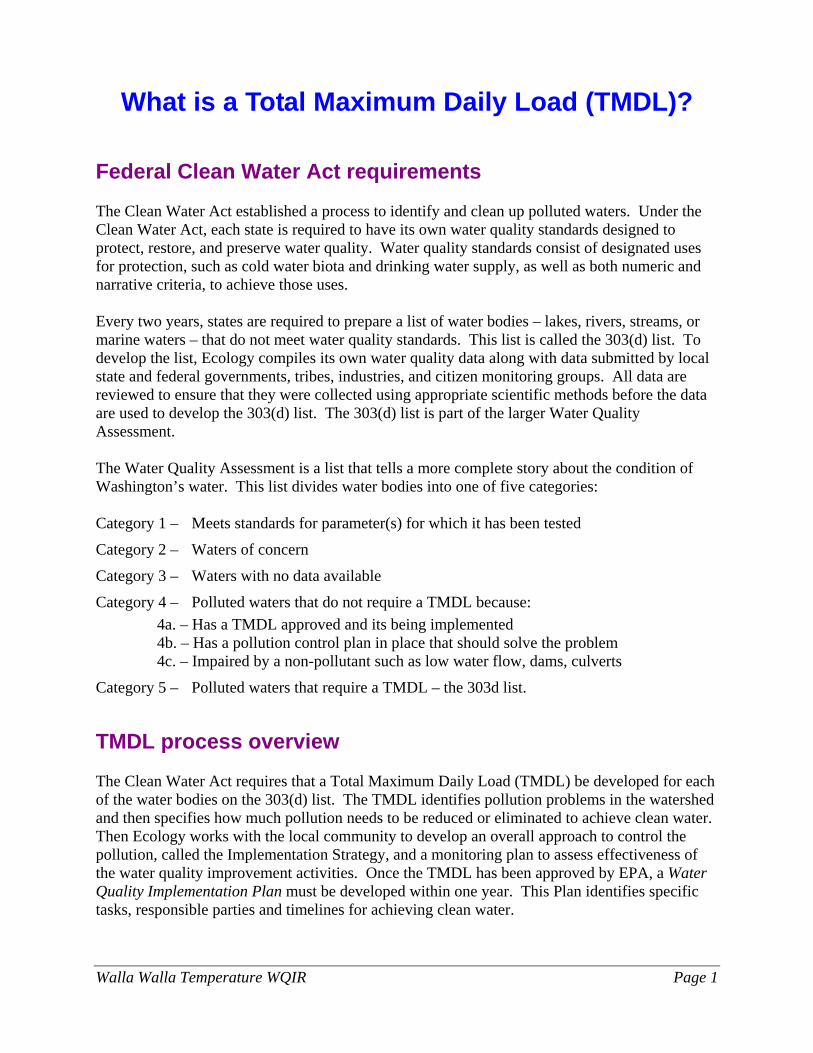
Federal Clean Water Act requirements The Clean Water Act established a process to identify and clean up polluted waters. Under the Clean Water Act, each state is required to have its own water quality standards designed to protect, restore, and preserve water quality. Water quality standards consist of designated uses for protection, such as cold water biota and drinking water supply, as well as both numeric and narrative criteria, to achieve those uses. Every two years, states are required to prepare a list of water bodies – lakes, rivers, streams, or marine waters – that do not meet water quality standards. This list is called the 303(d) list. To develop the list, Ecology compiles its own water quality data along with data submitted by local state and federal governments, tribes, industries, and citizen monitoring groups. All data are reviewed to ensure that they were collected using appropriate scientific methods before the data are used to develop the 303(d) list. The 303(d) list is part of the larger Water Quality Assessment. The Water Quality Assessment is a list that tells a more complete story about the condition of Washington’s water. This list divides water bodies into one of five categories: Category 1 – Meets standards for parameter(s) for which it has been tested
Category 2 – Waters of concern
Category 3 – Waters with no data available
Category 4 – Polluted waters that do not require a TMDL because: 4a. – Has a TMDL approved and its being implemented 4b. – Has a pollution control plan in place that should solve the problem 4c. – Impaired by a non-pollutant such as low water flow, dams, culverts
Category 5 – Polluted waters that require a TMDL – the 303d list. TMDL process overview The Clean Water Act requires that a Total Maximum Daily Load (TMDL) be developed for each of the water bodies on the 303(d) list. The TMDL identifies pollution problems in the watershed and then specifies how much pollution needs to be reduced or eliminated to achieve clean water. Then Ecology works with the local community to develop an overall approach to control the pollution, called the Implementation Strategy, and a monitoring plan to assess effectiveness of the water quality improvement activities. Once the TMDL has been approved by EPA, a Water Quality Implementation Plan must be developed within one year. This Plan identifies specific tasks, responsible parties and timelines for achieving clean water.
Page 2 Walla Walla Temperature WQIR
Elements required in a TMDL The goal of a TMDL is to ensure the impaired water will attain water quality standards. A TMDL includes a written, quantitative assessment of water quality problems and of the pollutant sources that cause the problem. The TMDL determines the amount of a given pollutant that can be discharged to the water body and still meet standards (the loading capacity) and allocates that load among the various sources. If the pollutant comes from a discrete source (referred to as a point source) such as a municipal or industrial facility’s discharge pipe, that facility’s share of the loading capacity is called a wasteload allocation. If it comes from a set of diffuse sources (referred to as a nonpoint source) such as general urban, residential, or farm runoff, the cumulative share is called a load allocation. The TMDL must also consider seasonal variations and include a margin of safety that takes into account any lack of knowledge about the causes of the water quality problem or its loading capacity. A reserve capacity for future loads from growth pressures is sometimes included as well. The sum of the wasteload and load allocations, the margin of safety and any reserve capacity must be equal to or less than the loading capacity. Identification of the contaminant loading capacity for a water body is an important step in developing a TMDL. EPA defines the loading capacity as “the greatest amount of loading that a water body can receive without violating water quality standards” (EPA, 2001). The loading capacity provides a reference for calculating the amount of pollution reduction needed to bring a water body into compliance with standards. The portion of the receiving water’s loading capacity assigned to a particular source is a load or wasteload allocation. By definition, a TMDL is the sum of the allocations, which must not exceed the loading capacity. TMDL = Loading Capacity = sum of all Wasteload Allocations + sum of all Load Allocations + Margin of Safety
What part of the process are we in? We are in the part of the process where the technical assessment and implementation strategy are combined into the Water Quality Improvement Report. The implementation strategy is intended to describe the general framework for improving water quality in the watershed. It describes the roles of organizations with responsibility to improve water quality and describes the means through which they will address the water temperature issues. The Water Quality Improvement Report will be submitted to the U.S. Environmental Protection Agency (EPA) for review and approval. Once all the TMDLs for the Walla Walla watershed have been approved, interested and responsible parties will then work to develop a Water Quality Implementation Plan. That plan will describe and prioritize specific actions planned to improve water quality.
Walla Walla Temperature WQIR Page 3
Why is Ecology Conducting a TMDL Study in this Watershed?
Overview Ecology is conducting a TMDL study in this watershed because the Walla Walla River, Touchet River and Mill Creek have been placed on Washington State’s 303(d) list in 1996 and 1998 for having high water temperatures. The high temperatures which led to these listings were found during routine monitoring at three Ecology Ambient Monitoring stations from 1991 through 1996. Additional locations monitored by the Washington Department of Fish and Wildlife (WDFW) (Mendel et al., 2000, 2001, 2002) showed that high temperatures were common throughout the watershed. Analysis of the data from these additional monitoring efforts led to several additional stream segments being included on the 2002/04 303(d) list. In addition to the segments listed in 1996 and 1998, the present TMDL also includes load allocations to address segments that are documented as not meeting the water quality standard for temperature in the 2002/2004 list. Table 1 provides a list of the water segments found to exceed the water quality temperature standards. This watershed has other water quality issues that will not be addressed in this TMDL. In particular, 303(d) listings for pH, dissolved oxygen, PCBs, chlorinated pesticides and fecal coliform occur in the study area. TMDLs for PCBs, chlorinated pesticides and fecal coliform have been approved by the Environmental Protection Agency (EPA), and the TMDL for pH and dissolved oxygen is under development.
Study area The Walla Walla watershed is located in southeast Washington State and northeast Oregon. The Walla Walla watershed is a 1,758 square mile area with about 70 percent located in Washington State. The study area for this TMDL is the portion of the Walla Walla watershed in Washington State. This area is also known as Water Resource Inventory Area (WRIA) 32. The Walla Walla watershed includes Walla Walla County and a portion of Columbia County (Figure 1). The TMDL study includes major tributaries to the Walla Walla River in Washington State, specifically the Touchet River, Mill Creek and Dry Creek. In collaboration with Ecology, the Walla Walla River mainstem was studied by the Oregon Department of Environmental Quality (ODEQ) for interstate coordination. Ecology contributed funding and technical expertise and review to the effort. ODEQ used the analysis to establish a TMDL for the portion of the watershed in Oregon (ODEQ, 2005). ODEQ’s study is being used by Ecology to set allocations for the Walla Walla River’s 303(d) listings in Washington State. Therefore, excerpts from ODEQ’s analysis are included in this TMDL. Although locations in the Upper Touchet River Forks were not 303(d) listed as temperature impaired at the time of original project design, monitoring by WDFW had indicated that this
Page 4 Walla Walla Temperature WQIR
high quality salmonid habitat was impaired and that those streams would be included on the 2004 list. Data collection was planned in 2002 to allow modeling of representative channel reaches on the North Fork and Wolf Fork Touchet River. A three-mile section of the North Fork and a three-mile section of the Wolf Fork were modeled.
Figure 1. Map of the Walla Walla River basin (U.S. Army Corps of Engineers, 1997).
Walla Walla Temperature WQIR Page 5
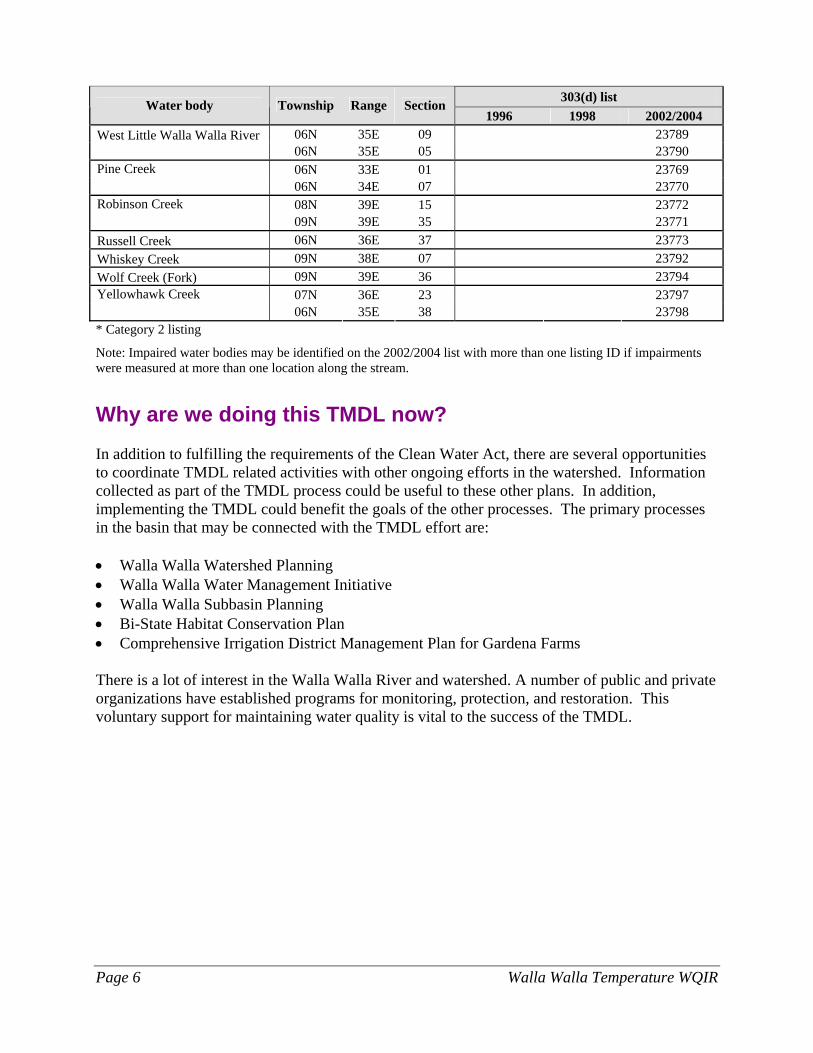
Table 1. Water bodies included in this TMDL that are on the 1996, 1998, or 2002/04 303(d) list. 303(d) list Water body Township Range Section
1996 1998 2002/2004 07N 36E 23 WA-32-1070 SS77BG 23690 07N 37E 37 23764 07N 36E 21 23688 07N 36E 37 23689 07N 35E 23 23765 07N 36E 19 23766 06N 37E 02 23768 07N 35E 38 23761
Mill Creek
07N 36E 22 23762 07N 33E 33 WA-32-1020 LV94PX 11098 09N 34E 02 23777 09N 38E 05 23778 07N 33E 27 23775 09N 37E 08 23776 09N 38E 04 40510
Touchet River
10N 39E 30 WA-32-1020 LV94PX 11105* 09N 39E 04 23779 08N 40E 28 23780
Touchet River, N.F. (E.F.)
09N 40E 30 23781 07N 39E 06 23782 Touchet River, S.F. 10N 39E 32 23783 07N 32E 35 WA-32-1010 QE90PI 6589 07N 34E 34 23785 06N 35E 04 23784 06N 35E 39 23786 06N 33E 03 23788
Walla Walla River
06N 35E 13 23787 Blue Creek 07N 37E 26 24240 Caldwell Creek 06N 36E 37 24242 Cold Creek 07N 35E 32 24244 Coppei Creek 09N 37E 36 24245
08N 38E 08 24247 Coppei Creek, N.F. 08N 38E 07 24246 08N 38E 20 24248 Coppei Creek, S. F. 08N 38E 33 23674 06N 36E 11 23676 Cottonwood Creek 06N 36E 05 23675
Doan Creek 07N 35E 38 23677 Dry Creek, N.F. 07N 38E 08 23679 Dry Creek, S.F. 07N 38E 17 23678
06N 35E 39 14176 Garrison Creek 06N 35E 03 14177
Jim Creek 09N 40E 30 23685 Lewis Creek 08N 40E 09 23686 East Little Walla Walla River 06N 35E 38 23680 06N 35E 11 23682
Page 6 Walla Walla Temperature WQIR
303(d) list Water body Township Range Section 1996 1998 2002/2004
West Little Walla Walla River 06N 35E 09 23789 06N 35E 05 23790
06N 33E 01 23769 Pine Creek 06N 34E 07 23770 08N 39E 15 23772 Robinson Creek 09N 39E 35 23771
Russell Creek 06N 36E 37 23773 Whiskey Creek 09N 38E 07 23792 Wolf Creek (Fork) 09N 39E 36 23794
07N 36E 23 23797 Yellowhawk Creek 06N 35E 38 23798
* Category 2 listing
Note: Impaired water bodies may be identified on the 2002/2004 list with more than one listing ID if impairments were measured at more than one location along the stream.
Why are we doing this TMDL now? In addition to fulfilling the requirements of the Clean Water Act, there are several opportunities to coordinate TMDL related activities with other ongoing efforts in the watershed. Information collected as part of the TMDL process could be useful to these other plans. In addition, implementing the TMDL could benefit the goals of the other processes. The primary processes in the basin that may be connected with the TMDL effort are: • Walla Walla Watershed Planning • Walla Walla Water Management Initiative • Walla Walla Subbasin Planning • Bi-State Habitat Conservation Plan • Comprehensive Irrigation District Management Plan for Gardena Farms There is a lot of interest in the Walla Walla River and watershed. A number of public and private organizations have established programs for monitoring, protection, and restoration. This voluntary support for maintaining water quality is vital to the success of the TMDL.
Walla Walla Temperature WQIR Page 7
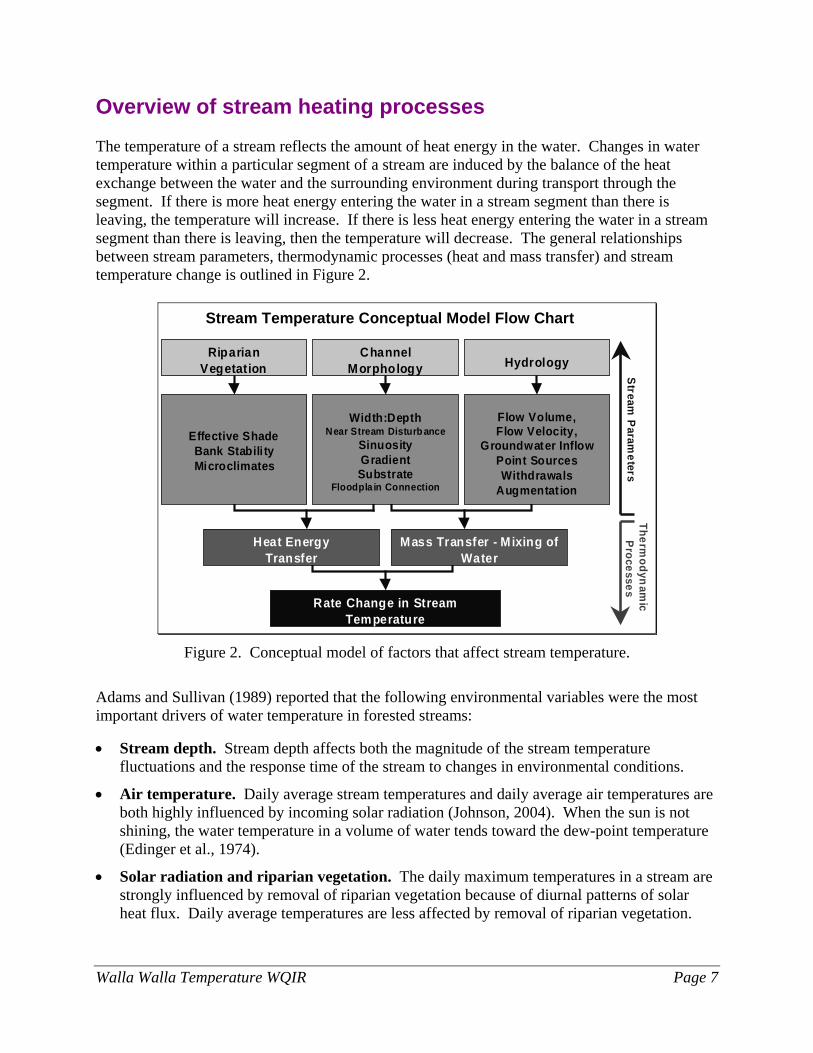
Overview of stream heating processes The temperature of a stream reflects the amount of heat energy in the water. Changes in water temperature within a particular segment of a stream are induced by the balance of the heat exchange between the water and the surrounding environment during transport through the segment. If there is more heat energy entering the water in a stream segment than there is leaving, the temperature will increase. If there is less heat energy entering the water in a stream segment than there is leaving, then the temperature will decrease. The general relationships between stream parameters, thermodynamic processes (heat and mass transfer) and stream temperature change is outlined in Figure 2.
RiparianVegetation
ChannelMorphology Hydrology
Rate Change in StreamTemperature
Effective ShadeBank Stabili tyMicroclimates
Flow Volume,Flow Velocity,
Groundwater InflowPoint SourcesWithdrawals
Augmentat ion
Width:DepthNear Stream Disturb ance
SinuosityGradientSubstrate
Floodpla in Connection
Mass Transfer - Mixing ofWater
Heat EnergyTransfer
Thermodyn
amic
Processes
Stream P
arameters
Stream Temperature Conceptual Model Flow Chart
Figure 2. Conceptual model of factors that affect stream temperature.
Adams and Sullivan (1989) reported that the following environmental variables were the most important drivers of water temperature in forested streams:
• Stream depth. Stream depth affects both the magnitude of the stream temperature fluctuations and the response time of the stream to changes in environmental conditions.
• Air temperature. Daily average stream temperatures and daily average air temperatures are both highly influenced by incoming solar radiation (Johnson, 2004). When the sun is not shining, the water temperature in a volume of water tends toward the dew-point temperature (Edinger et al., 1974).
• Solar radiation and riparian vegetation. The daily maximum temperatures in a stream are strongly influenced by removal of riparian vegetation because of diurnal patterns of solar heat flux. Daily average temperatures are less affected by removal of riparian vegetation.
Page 8 Walla Walla Temperature WQIR
• Groundwater. Inflows of groundwater can have an important cooling effect on stream temperature. This effect will depend on the rate of groundwater inflow relative the flow in the stream and the difference in temperatures between the groundwater and the stream.
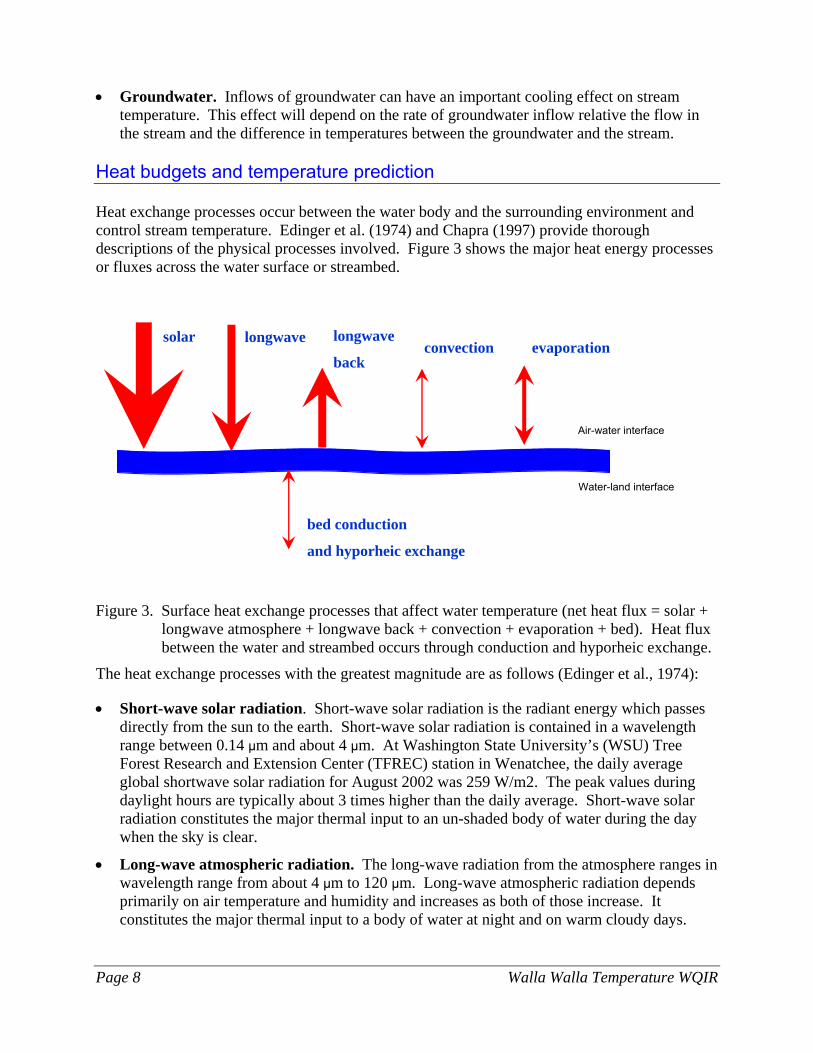
Heat budgets and temperature prediction Heat exchange processes occur between the water body and the surrounding environment and control stream temperature. Edinger et al. (1974) and Chapra (1997) provide thorough descriptions of the physical processes involved. Figure 3 shows the major heat energy processes or fluxes across the water surface or streambed.
Figure 3. Surface heat exchange processes that affect water temperature (net heat flux = solar +
longwave atmosphere + longwave back + convection + evaporation + bed). Heat flux between the water and streambed occurs through conduction and hyporheic exchange.
The heat exchange processes with the greatest magnitude are as follows (Edinger et al., 1974): • Short-wave solar radiation. Short-wave solar radiation is the radiant energy which passes
directly from the sun to the earth. Short-wave solar radiation is contained in a wavelength range between 0.14 μm and about 4 μm. At Washington State University’s (WSU) Tree Forest Research and Extension Center (TFREC) station in Wenatchee, the daily average global shortwave solar radiation for August 2002 was 259 W/m2. The peak values during daylight hours are typically about 3 times higher than the daily average. Short-wave solar radiation constitutes the major thermal input to an un-shaded body of water during the day when the sky is clear.
• Long-wave atmospheric radiation. The long-wave radiation from the atmosphere ranges in wavelength range from about 4 μm to 120 μm. Long-wave atmospheric radiation depends primarily on air temperature and humidity and increases as both of those increase. It constitutes the major thermal input to a body of water at night and on warm cloudy days.
bed conduction
and hyporheic exchange
Air-water interface
solar longwave longwave
back convection evaporation
Water-land interface
Walla Walla Temperature WQIR Page 9
The daily average heat flux from long-wave atmospheric radiation typically ranges from about 300 to 450 W/m2 at mid latitudes (Edinger et al., 1974).
• Long-wave back radiation from the water to the atmosphere. Water sends heat energy back to the atmosphere in the form of long-wave radiation in the wavelength range from about 4 μm to 120 μm. Back radiation accounts for a major portion of the heat loss from a body of water. Back radiation increases as water temperature increases. The daily average heat flux out of the water from long-wave back radiation typically ranges from about 300 to 500 W/m2 (Edinger et al., 1974).
The remaining heat exchange processes generally have less magnitude and are as follows:
• Evaporation flux at the air-water interface is influenced mostly by the wind speed and the vapor pressure gradient between the water surface and the air. When the air is saturated, the evaporation stops. When the gradient is negative (vapor pressure at the water surface is less than the vapor pressure of the air), condensation, the reversal of evaporation takes place, and this term then becomes a gain component in the heat balance.
• Convection flux at the air-water interface is driven by the temperature difference between water and air and by the wind speed. Heat is transferred in the direction of decreasing temperature
• Bed conduction flux and hyporheic exchange component of the heat budget represents the heat exchange through conduction between the bed and the water body and the influence of hyporheic exchange. The magnitude of bed conduction is driven by the size and conductance properties of the substrate. The heat transfer through conduction is more pronounced when thermal differences between the substrate and water column are higher and usually affects the temperature diel profile, rather than affecting the magnitude of the maximum daily water temperature. Hyporheic exchange recently received increased attention as a possible important mechanism for stream cooling (Johnson and Jones, 2000, Poole and Berman, 2000, Johnson, 2004). The hyporheic zone is defined as the region located beneath the channel characterized by complex hydrodynamic processes that combine stream water and groundwater. The resulting fluxes can have significant implications for stream temperature at different spatial and temporal scales.
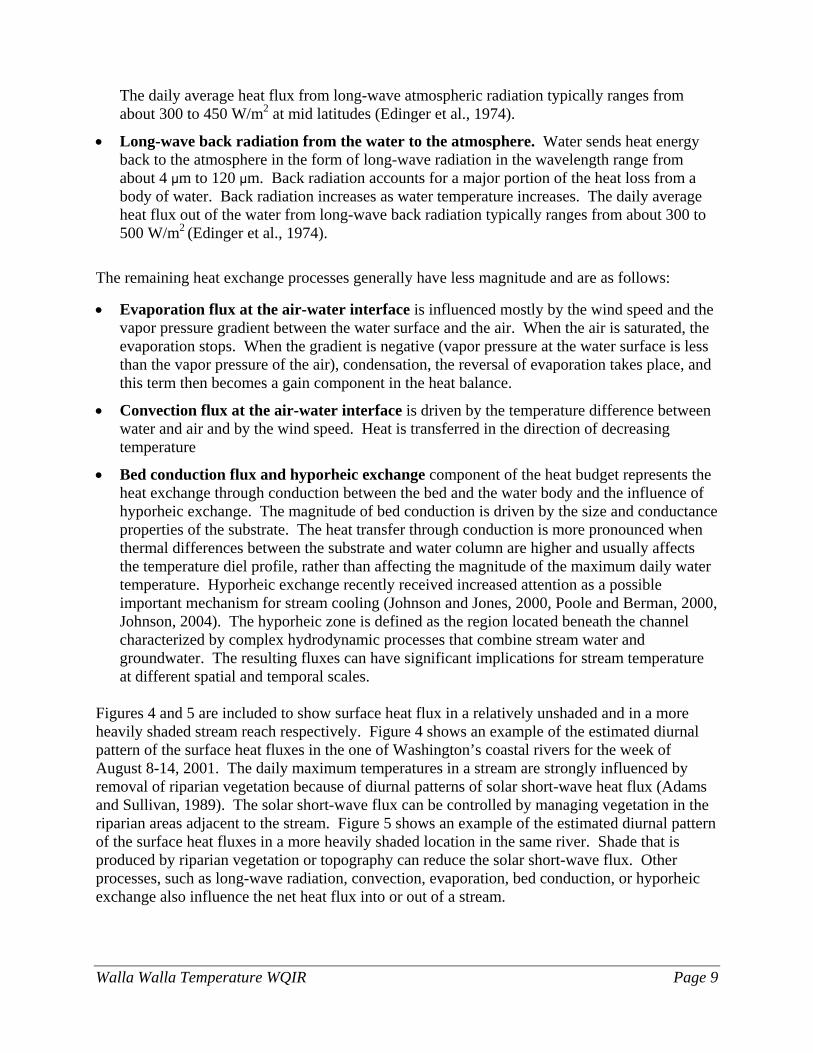
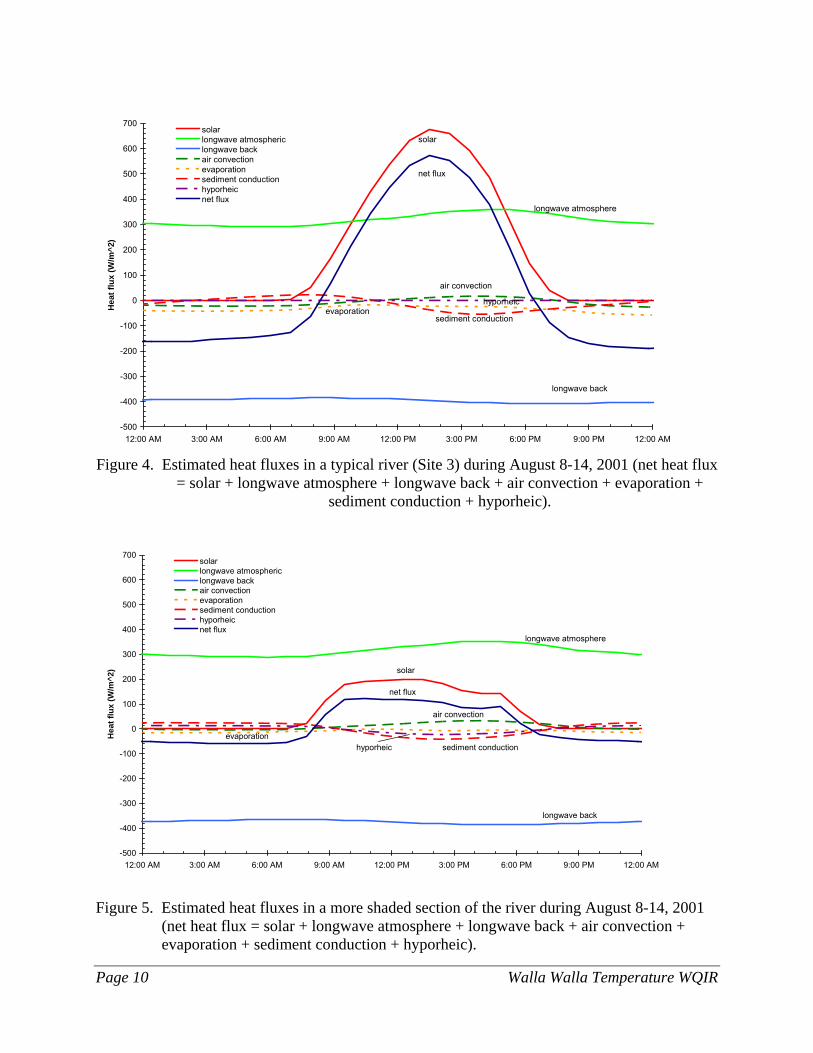
Figures 4 and 5 are included to show surface heat flux in a relatively unshaded and in a more heavily shaded stream reach respectively. Figure 4 shows an example of the estimated diurnal pattern of the surface heat fluxes in the one of Washington’s coastal rivers for the week of August 8-14, 2001. The daily maximum temperatures in a stream are strongly influenced by removal of riparian vegetation because of diurnal patterns of solar short-wave heat flux (Adams and Sullivan, 1989). The solar short-wave flux can be controlled by managing vegetation in the riparian areas adjacent to the stream. Figure 5 shows an example of the estimated diurnal pattern of the surface heat fluxes in a more heavily shaded location in the same river. Shade that is produced by riparian vegetation or topography can reduce the solar short-wave flux. Other processes, such as long-wave radiation, convection, evaporation, bed conduction, or hyporheic exchange also influence the net heat flux into or out of a stream.
Page 10 Walla Walla Temperature WQIR
-500
-400
-300
-200
-100
0
100
200
300
400
500
600
700
12:00 AM 3:00 AM 6:00 AM 9:00 AM 12:00 PM 3:00 PM 6:00 PM 9:00 PM 12:00 AM
Hea
t flu
x (W
/m^2
)
solarlongwave atmosphericlongwave backair convectionevaporationsediment conductionhyporheicnet flux
longwave atmosphere
solar
net flux
longwave back
sediment conduction
air convection
evaporationhyporheic
Figure 4. Estimated heat fluxes in a typical river (Site 3) during August 8-14, 2001 (net heat flux
= solar + longwave atmosphere + longwave back + air convection + evaporation + sediment conduction + hyporheic).
-500
-400
-300
-200
-100
0
100
200
300
400
500
600
700
12:00 AM 3:00 AM 6:00 AM 9:00 AM 12:00 PM 3:00 PM 6:00 PM 9:00 PM 12:00 AM
Hea
t flu
x (W
/m^2
)
solarlongwave atmosphericlongwave backair convectionevaporationsediment conductionhyporheicnet flux
longwave atmosphere
solar
net flux
longwave back
sediment conduction
air convection
evaporationhyporheic
Figure 5. Estimated heat fluxes in a more shaded section of the river during August 8-14, 2001 (net heat flux = solar + longwave atmosphere + longwave back + air convection + evaporation + sediment conduction + hyporheic).
Walla Walla Temperature WQIR Page 11
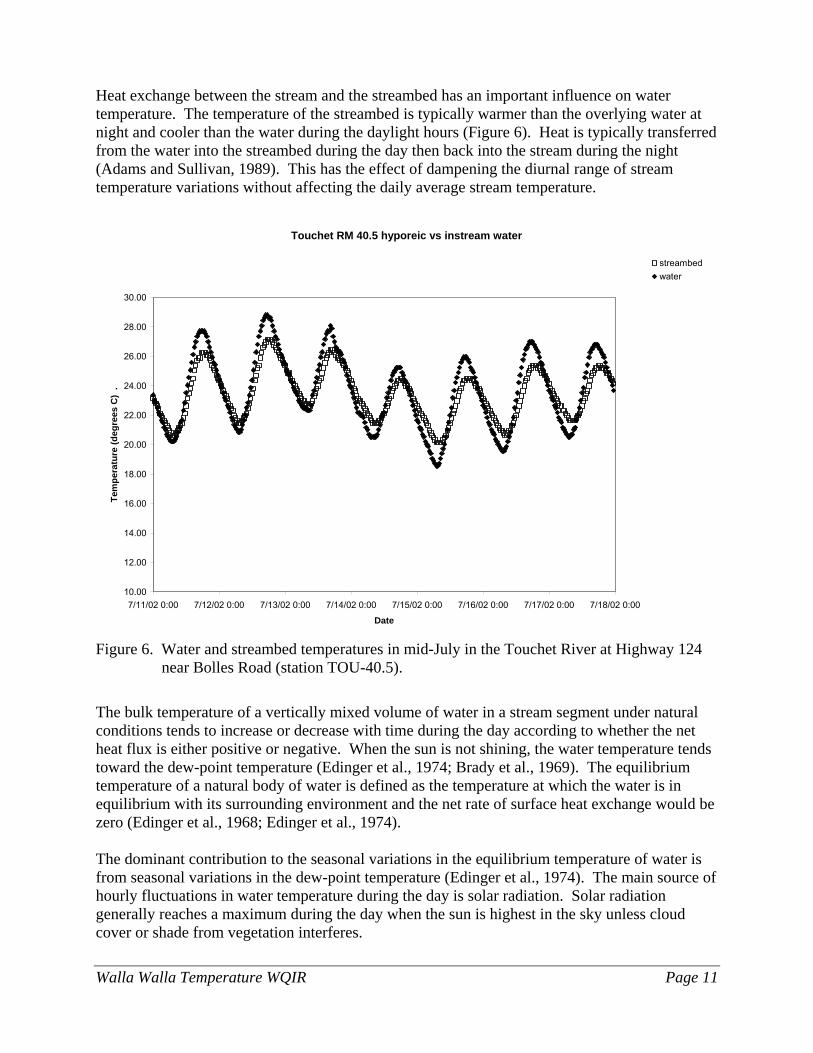
Heat exchange between the stream and the streambed has an important influence on water temperature. The temperature of the streambed is typically warmer than the overlying water at night and cooler than the water during the daylight hours (Figure 6). Heat is typically transferred from the water into the streambed during the day then back into the stream during the night (Adams and Sullivan, 1989). This has the effect of dampening the diurnal range of stream temperature variations without affecting the daily average stream temperature.
Touchet RM 40.5 hyporeic vs instream water
10.00
12.00
14.00
16.00
18.00
20.00
22.00
24.00
26.00
28.00
30.00
7/11/02 0:00 7/12/02 0:00 7/13/02 0:00 7/14/02 0:00 7/15/02 0:00 7/16/02 0:00 7/17/02 0:00 7/18/02 0:00
Date
Tem
pera
ture
(deg
rees
C)
.
streambed water
Figure 6. Water and streambed temperatures in mid-July in the Touchet River at Highway 124
near Bolles Road (station TOU-40.5).
The bulk temperature of a vertically mixed volume of water in a stream segment under natural conditions tends to increase or decrease with time during the day according to whether the net heat flux is either positive or negative. When the sun is not shining, the water temperature tends toward the dew-point temperature (Edinger et al., 1974; Brady et al., 1969). The equilibrium temperature of a natural body of water is defined as the temperature at which the water is in equilibrium with its surrounding environment and the net rate of surface heat exchange would be zero (Edinger et al., 1968; Edinger et al., 1974). The dominant contribution to the seasonal variations in the equilibrium temperature of water is from seasonal variations in the dew-point temperature (Edinger et al., 1974). The main source of hourly fluctuations in water temperature during the day is solar radiation. Solar radiation generally reaches a maximum during the day when the sun is highest in the sky unless cloud cover or shade from vegetation interferes.
Page 12 Walla Walla Temperature WQIR
The complete heat budget for a stream also accounts for the mass transfer processes which depend on the amount of flow and the temperature of water flowing into and out of a particular volume of water in a segment of a stream. Mass transfer processes in open channel systems can occur through advection, dispersion, and mixing with tributaries and groundwater inflows and outflows. Mass transfer relates to transport of flow volume downstream, instream mixing and the introduction or removal of water from a stream. For instance, flow from a tributary will cause a temperature change if the temperature is different from the receiving water. Thermal role of riparian vegetation The role of riparian vegetation in maintaining a healthy stream condition and water quality is well documented and accepted in the scientific literature. Summer stream temperature increases due to the removal of riparian vegetation is well documented (e.g., Holtby, 1988; Lynch et al., 1984; Rishel et al., 1982; Patric, 1980; Swift and Messer, 1971; Brown et al., 1971; and Levno and Rothacher, 1967). These studies generally support the findings of Brown and Krygier (1970) that loss of riparian vegetation results in larger daily temperature variations and elevated monthly and annual temperatures. Adams and Sullivan (1989) also concluded that daily maximum temperatures are strongly influenced by the removal or riparian vegetation because of the effect of diurnal fluctuations in solar heat flux. Summaries of the scientific literature on the thermal role of riparian vegetation in forested and agricultural areas are provided by Belt et al., 1992; Beschta et al., 1987; Bolton and Monahan, 2001; Castelle and Johnson, 2000; CH2M Hill, 2000; GEI, 2002; Ice, 2001; and Wenger, 1999. All of these summaries recognize that the scientific literature indicates that riparian vegetation plays an important role in controlling stream temperature. The list of important benefits that riparian vegetation has upon the stream temperature includes:
• Near-stream vegetation height, width and density combine to produce shadows that can reduce solar heat flux to the surface of the water
• Riparian vegetation creates a thermal microclimate that generally maintains cooler air temperatures, higher relative humidity, lower wind speeds, and cooler ground temperatures along stream corridors.
• Bank stability is largely a function of near stream vegetation. Specifically, channel morphology is often highly influenced by land-cover type and condition by affecting flood plain and instream roughness, contributing coarse woody debris and influencing sedimentation, stream substrate compositions and stream bank stability.
The warming of water temperatures as a stream flows downstream is a natural process. However, the rates of heating can be dramatically reduced when high levels of shade exist and heat flux from solar radiation is minimized. The overriding justification for increases in shade from riparian vegetation is to minimize the contribution of solar heat flux in stream heating. There is a natural maximum level of shade that a given stream is capable of attaining, and the importance of shade decreases as the width of a stream increases. The distinction between reduced heating of streams and actual cooling is important. Shade can significantly reduce the amount of heat flux that enters a stream. Whether there is a reduction in
Walla Walla Temperature WQIR Page 13
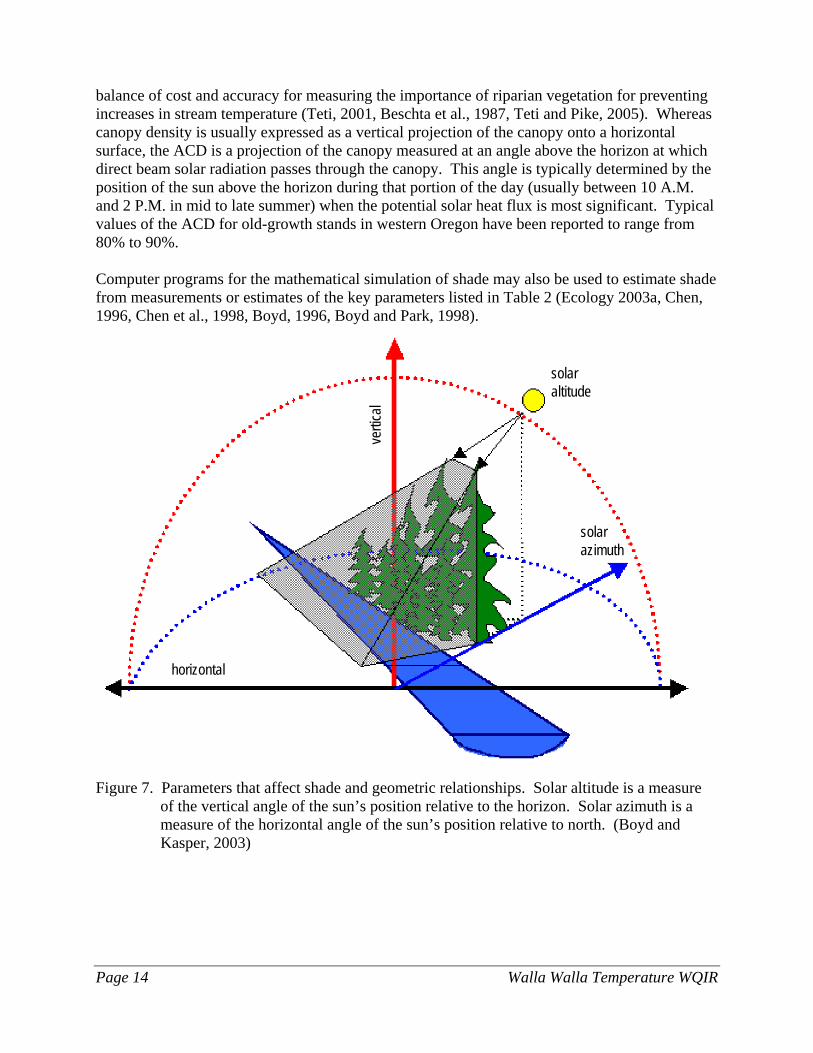
the amount of warming of the stream, maintenance of inflowing temperatures, or cooling of a stream as it flows downstream depends on the balance of all of the heat exchange and mass transfer processes in the stream. Effective shade Shade is an important parameter that controls the stream heating derived from solar radiation. Solar radiation has the potential to be one of the largest heat-transfer mechanisms in a stream system. Human activities can degrade near-stream vegetation and/or channel morphology, and in turn, decrease shade. Reductions in stream surface shade have the potential to cause significant increases in heat delivery to a stream system. Stream shade is an important factor in describing the heat budget for the present analysis. Stream shade may be measured or calculated using a variety of methods (Chen, 1996; Chen et al., 1998; Ice, 2001; OWEB, 1999; Teti, 2001; Teti and Pike, 2005). Shade is the amount of solar energy that is obscured or reflected by vegetation or topography above a stream. Effective shade is defined as the fraction or percentage of the total possible solar radiation heat energy that is prevented from reaching the surface of the water: effective shade = (J1 – J2)/J1 where J1 is the potential solar heat flux above the influence of riparian vegetation and topography and J2 is the solar heat flux at the stream surface. In the Northern Hemisphere, the earth tilts on its axis toward the sun during summer months, allowing longer day length and higher solar altitude, both of which are functions of solar declination (i.e., a measure of the earth’s tilt toward the sun) (Figure 7). Geographic position (i.e., latitude and longitude) fixes the stream to a position on the globe, while aspect provides the stream/riparian orientation (direction of streamflow). Near-stream vegetation height, width, and density describe the physical barriers between the stream and sun that can attenuate and scatter incoming solar radiation (i.e., produce shade) (Table 2). The solar position has a vertical component (i.e., solar altitude) and a horizontal component (i.e., solar azimuth) that are both functions of time/date (i.e., solar declination) and the earth’s rotation. While the interaction of these shade variables may seem complex, the mathematics that describes them is relatively straightforward geometry. Using solar tables or mathematical simulations, the potential daily solar load can be quantified. The shade from riparian vegetation can be measured with a variety of methods, including (Ice, 2001, OWEB, 1999; Boyd, 1996; Teti, 2001, Teti and Pike, 2005):
• Hemispherical photography • Angular canopy densiometer • Solar pathfinder Hemispherical photography is generally regarded as the most accurate method for measuring shade, although the equipment that is required is significantly more expensive compared with other methods. Angular canopy densiometers (ACD) and Solar pathfinders provide a good
Page 14 Walla Walla Temperature WQIR
balance of cost and accuracy for measuring the importance of riparian vegetation for preventing increases in stream temperature (Teti, 2001, Beschta et al., 1987, Teti and Pike, 2005). Whereas canopy density is usually expressed as a vertical projection of the canopy onto a horizontal surface, the ACD is a projection of the canopy measured at an angle above the horizon at which direct beam solar radiation passes through the canopy. This angle is typically determined by the position of the sun above the horizon during that portion of the day (usually between 10 A.M. and 2 P.M. in mid to late summer) when the potential solar heat flux is most significant. Typical values of the ACD for old-growth stands in western Oregon have been reported to range from 80% to 90%. Computer programs for the mathematical simulation of shade may also be used to estimate shade from measurements or estimates of the key parameters listed in Table 2 (Ecology 2003a, Chen, 1996, Chen et al., 1998, Boyd, 1996, Boyd and Park, 1998).
vertic
al
horizontal
solarazimuth
solaraltitude
Figure 7. Parameters that affect shade and geometric relationships. Solar altitude is a measure of the vertical angle of the sun’s position relative to the horizon. Solar azimuth is a measure of the horizontal angle of the sun’s position relative to north. (Boyd and Kasper, 2003)
Walla Walla Temperature WQIR Page 15
Table 2. Factors that influence stream shade (bold indicates influenced by human activities):
Description Parameter Season/time Date/time Stream characteristics Aspect, channel width Geographic position Latitude, longitude Vegetative characteristics Riparian vegetation height, width, and density Solar position Solar altitude, solar azimuth
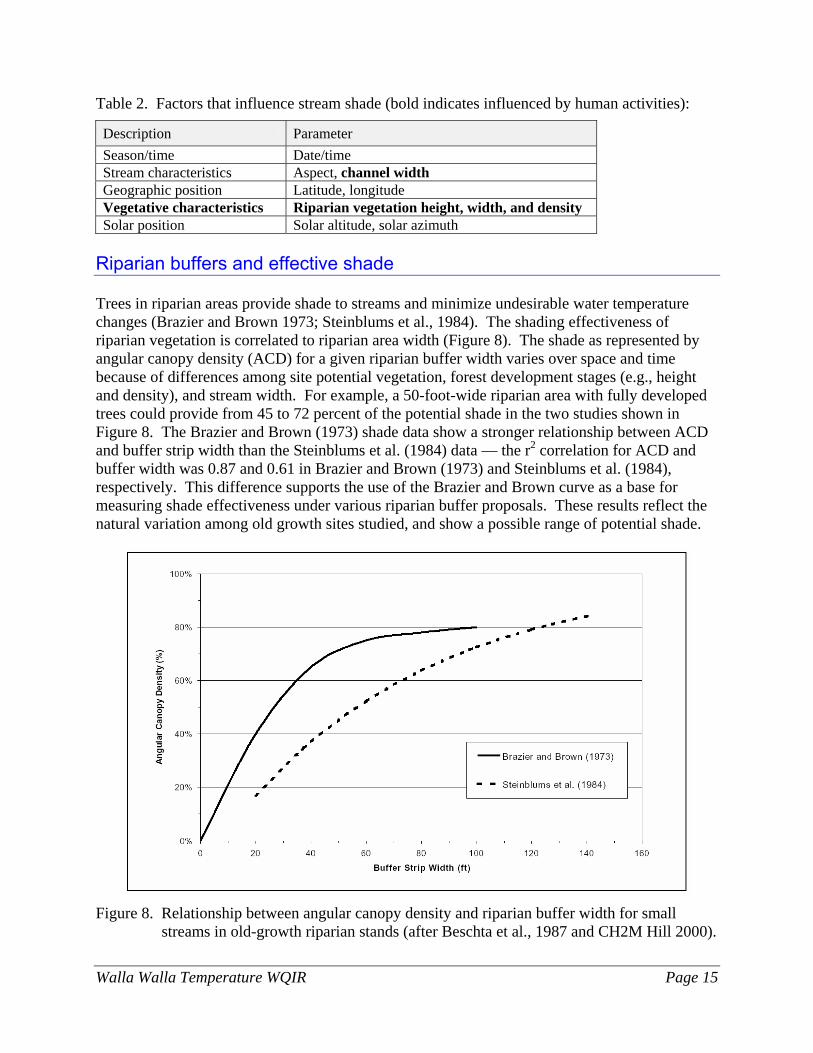
Riparian buffers and effective shade Trees in riparian areas provide shade to streams and minimize undesirable water temperature changes (Brazier and Brown 1973; Steinblums et al., 1984). The shading effectiveness of riparian vegetation is correlated to riparian area width (Figure 8). The shade as represented by angular canopy density (ACD) for a given riparian buffer width varies over space and time because of differences among site potential vegetation, forest development stages (e.g., height and density), and stream width. For example, a 50-foot-wide riparian area with fully developed trees could provide from 45 to 72 percent of the potential shade in the two studies shown in Figure 8. The Brazier and Brown (1973) shade data show a stronger relationship between ACD and buffer strip width than the Steinblums et al. (1984) data — the r2 correlation for ACD and buffer width was 0.87 and 0.61 in Brazier and Brown (1973) and Steinblums et al. (1984), respectively. This difference supports the use of the Brazier and Brown curve as a base for measuring shade effectiveness under various riparian buffer proposals. These results reflect the natural variation among old growth sites studied, and show a possible range of potential shade.
Figure 8. Relationship between angular canopy density and riparian buffer width for small
streams in old-growth riparian stands (after Beschta et al., 1987 and CH2M Hill 2000).
Page 16 Walla Walla Temperature WQIR
Several studies of stream shading report that most of the potential shade comes from the riparian area within about 75 feet (23 m) of the channel (CH2M Hill, 2000; Castelle and Johnson, 2000):
• Beschta et al. (1987) report that a 98-foot-wide (30-m) buffer provides the same level of shading as that of an old-growth stand.
• Brazier and Brown (1973) found that a 79-foot (24-m) buffer would provide maximum shade to streams.
• Steinblums et al. (1984) concluded that a 56-foot (17-m) buffer provides 90 percent of the maximum ACD.
• Corbett and Lynch (1985) concluded that a 39-foot (12-m) buffer should adequately protect small streams from large temperature changes following logging.
• Broderson (1973) reported that a 49-foot-wide (15-m) buffer provides 85 percent of the maximum shade for small streams.
• Lynch et al. (1984) found that a 98-foot-wide (30-m) buffer maintains water temperatures within 2°F (1°C) of their former average temperature in small streams (channel width less than 3 m).
• GEI (2002) reviewed the scientific literature related to the effectiveness of buffers for shade protection in agricultural areas in Washington and concluded that buffer widths of 10 m (33 feet) provide nearly 80 percent of the maximum potential shade in agricultural areas.
• Wenger (1999) concluded that a minimum continuous buffer width of 10-30 m should be preserved or restored along each side of all streams on a municipal or county-wide scale to provide stream temperature control and maintain aquatic habitat. GEI (2002) considered the recommendations of Wenger (1999) to be relevant for agricultural areas in Washington.
Steinblums et al. (1984) concluded that that shade could be delivered to forest streams from beyond 75 feet (22 m) and potentially out to 140 feet (43 m). In some site-specific cases, forest practices between 75 and 140 feet from the channel have the potential to reduce shade delivery by up to 25 percent of maximum. However, any reduction in shade beyond 75 feet would probably be relatively low on the horizon, and the impact on stream heating would be relatively low because the potential solar radiation decreases significantly as solar elevation decreases. Microclimate - surrounding thermal environment A secondary consequence of near stream vegetation is its effect on the riparian microclimate. Riparian corridors often produce a microclimate that surrounds the stream where cooler air temperatures, higher relative humidity, and lower wind speeds are characteristic. Riparian microclimates tend to moderate daily air temperatures. Relative humidity increases result from the evapotranspiration that is occurring by riparian plant communities. Wind speed is reduced by the physical blockage produced by riparian vegetation.
Walla Walla Temperature WQIR Page 17
Riparian buffers commonly occur on both sides of the stream, compounding the edge influence on the microclimate. Brosofske et al. (1997) reported that a buffer width of at least 150 feet (45 m) on each side of the stream was required to maintain a natural riparian microclimate environment in small forest streams (channel width less than 4 m) in the foothills of the western slope of the Cascade Mountains in western Washington with predominantly Douglas-fir and western hemlock. Bartholow (2000) provided a thorough summary of literature of documented changes to the environment of streams and watersheds associated with extensive forest clearing. Changes summarized by Bartholow (2000) are representative of hot summer days and indicate the mean daily effect unless otherwise indicated:
• Air temperature. Edgerton and McConnell (1976) showed that removing all or a portion of the tree canopy resulted in cooler terrestrial air temperatures at night and warmer temperatures during the day, enough to influence thermal cover sought by elk (Cervus canadensis) on their eastern Oregon summer range. Increases in maximum air temperature varied from 5 to 7ºC for the hottest days (estimate). However, the mean daily air temperature did not appear to have changed substantially since the maximum temperatures were offset by almost equal changes to the minima. Similar temperatures have been commonly reported (Childs and Flint, 1987; Fowler et al., 1987), even with extensive clearcuts (Holtby, 1988). In an evaluation of buffer strip width, Brosofske et al. (1997) found that air temperatures immediately adjacent to the ground increased 4.5ºC during the day and about 0.5ºC at night (estimate). Fowler and Anderson (1987) measured a 0.9ºC air temperature increase in clearcut areas, but temperatures were also 3ºC higher in the adjacent forest. Chen et al. (1993) found similar (2.1ºC) increases. All measurements reported here were made over land instead of water, but in aggregate support about a 2ºC increase in ambient mean daily air temperature resulting from extensive clearcutting.
• Relative humidity. Brosofske et al. (1997) examined changes in relative humidity within 17 to 72 m buffer strips. The focus of their study was to document changes along the gradient from forested to clearcut areas, so they did not explicitly report pre- to post-harvest changes at the stream. However, there appeared to be a reduction in relative humidity at the stream of 7% during the day and 6% at night (estimate). Relative humidity at stream sites increased exponentially with buffer width. Similarly, a study by Chen et al. (1993) showed a decrease of about 11% in mean daily relative humidity on clear days at the edges of clearcuts.
• Wind speed. Brosofske et al. (1997) reported almost no change in wind speed at stream locations within buffer strips adjacent to clearcuts. Speeds quickly approached upland conditions toward the edges of the buffers, with an indication that wind actually increased substantially at distances of about 15 m from the edge of the strip, and then declined farther upslope to pre-harvest conditions. Chen et al. (1993) documented increases in both peak and steady winds in clearcut areas; increments ranged from 0.7 to 1.2 m/s (estimated).
Page 18 Walla Walla Temperature WQIR
Thermal role of channel morphology Changes in channel morphology, namely channel widening, impacts stream temperatures. As a stream widens, the surface area exposed to heat flux increases, resulting in increased energy exchange between a stream and its environment (Chapra, 1997). Further, wide channels are likely to have decreased levels of shade due to the increased distance created between vegetation and the wetted channel and the decreased fraction of the stream width that could potentially be covered by shadows from riparian vegetation. Conversely, narrow channels are more likely to experience higher levels of shade. Channel widening is often related to degraded riparian conditions that allow increased stream bank erosion and sedimentation of the streambed, both of which correlate strongly with riparian vegetation type and condition (Rosgen 1996). Channel morphology is not solely dependent on riparian conditions. Sedimentation can deposit material in the channel, fill pools and aggrade the streambed, reducing channel depth and increasing channel width. Channel straightening can increase flow velocities and lead to deeply incised stream banks and washout of gravel and cobble substrate. Channel modification usually occurs during high flow events. Land uses that affect the magnitude and timing of high flow events may negatively impact channel width and depth. Riparian vegetation conditions will affect the resilience of the stream banks/flood plain during periods of sediment introduction and high flow. Disturbance processes may have differing results depending on the ability of riparian vegetation to shape and protect channels. Channel morphology is related to riparian vegetation composition and condition by:
• Building stream banks. Traps suspended sediments, encourages deposition of sediment in the flood plain and reduces incoming sources of sediment.
• Maintaining stable stream banks. High rooting strength and high stream bank and flood plain roughness prevents stream bank erosion.
• Reducing flow velocity (erosive kinetic energy). Supplies large woody debris to the active channel, provides a high pool to riffle ratio and adds channel complexity that reduces shear stress exposure to stream bank soil particles.
Pollutants and surrogate measures Heat loads to the stream are calculated in this TMDL in units of calories per square centimeter per day (cal/cm²/day) or watts per square meter (W/m2). However, heat loads are of limited value in guiding management activities needed to solve identified water quality problems. The Walla Walla River Tributaries temperature TMDL incorporates measures other than “daily loads” to fulfill the requirements of Section 303(d). This TMDL allocates other appropriate measures, or “surrogate measures” as provided under EPA regulations [40 CFR 130.2(i)]. The “Report of the Federal Advisory Committee on the Total Maximum Daily Load (TMDL) Program” (EPA, 1998) includes the following guidance on the use of surrogate measures for TMDL development:
Walla Walla Temperature WQIR Page 19
“When the impairment is tied to a pollutant for which a numeric criterion is not possible, or where the impairment is identified but cannot be attributed to a single traditional “pollutant,” the state should try to identify another (surrogate) environmental indicator that can be used to develop a quantified TMDL, using numeric analytical techniques where they are available, and best professional judgment (BPJ) where they are not.” This technical assessment for the Walla Walla River temperature TMDL uses riparian effective shade as a surrogate measure of heat flux to fulfill the requirements of Section 303(d). Effective shade is defined as the fraction of the potential solar shortwave radiation that is blocked by vegetation and topography before it reaches the stream surface. Other factors influencing heat flux and water temperature were also considered, including microclimate, channel geometry, groundwater recharge, and instream flow.

Page 20 Walla Walla Temperature WQIR
Walla Walla Temperature WQIR Page 21
Water Quality Standards and Beneficial Uses This TMDL is designed to address impairments of characteristic uses caused by high temperatures. Chapter 173-201A of the Washington Administrative Code (WAC) designated the following characteristic uses for protection in Walla Walla River basin streams:
• Recreation - Primary contact recreation, sport fishing, boating, and aesthetic enjoyment.
• Fish and Shellfish - Salmonid migration, rearing, spawning, and harvesting; and Other fish migration, rearing, spawning, and harvesting: Spring Chinook salmon (Oncorhynchus tshawytscha) and Rainbow/Steelhead Trout (Oncorhynchus mykiss) and Bull Trout (Salvelinus confluentus), and Mountain Whitefish (Prosopium williamsoni) are the salmonid species in the Walla Walla Basin. The lower reaches of the Basin are mainly used by these species for migration and some rearing, while the headwaters provide a majority of the spawning habitat.
• Water Supply (domestic, industrial, and agricultural) and Stock Watering: Agriculture extracts water for irrigation and stock watering, and the city of Walla Walla uses Mill Creek as a drinking water source.
• Wildlife Habitat: Riparian areas are used by a variety of wildlife species, which are dependent on the habitat.
• Commerce and navigation Water quality standards are established to protect these beneficial uses. Water quality standards consist of specific numeric and narrative criteria for parameters such as water temperature. The criteria are intended to define the level of protection necessary to support the beneficial uses. Prior to 2003, the water quality standards were divided into classes of waters that protected beneficial uses. According to Ecology’s Implementation Plan for the Revisions to Chapter 173-201A WAC, Water Quality Standards for Surface Waters of the State of Washington (2006), TMDLs that aren’t approved, but have all the field work completed are to proceed with TMDL submittal prior to effective date of newly adopted standards. Since the studies for this TMDL began in 2001 and finished before Nov. 2006, the water quality standards classes (1997 version of the water quality standards) are being used for this TMDL. Table 3 provides a list of the water quality standard classification for Walla Walla watershed streams. All streams that are not specifically named in Table 3 that are tributaries to Class AA waters are classified Class AA. All surface waters lying within national parks, national forests and or wilderness areas are classified Class AA. All other non-specified surface waters are classified Class A. Numeric freshwater water quality criteria for Class AA, Class A, and Class B state that temperature shall not exceed the following:
AA (extraordinary) 16.0°C A (excellent) 18.0°C B (good) 21.0°C
Page 22 Walla Walla Temperature WQIR
Table 3: Stream classifications of the Walla Walla watershed as defined by Water Quality Standards for Surface Waters of the State of Washington.
Waterbody Name and Location Classification
Mill Creek from mouth to 13th Street bridge in Walla Walla (RM 6.4) Class B Mill Creek from 13th Street bridge in Walla Walla (RM 6.4) to the Walla Walla Waterworks Dam (RM 11.5) Class A
Mill Creek and tributaries from city of Walla Walla Waterworks Dam (RM 21.6) to headwaters. Class AA
North Fork Touchet River from Dayton water intake structure (RM 3.0) to headwaters. Class AA
Walla Walla River from mouth to Lowden (Dry Creek at river mile 27.2_ Class B
Walla Walla River from Lowden (Dry Creek at river mile 27.2) to Oregon Border (RM 40). Special condition – temperature shall not exceed 20.0oC due to human activities. When natural conditions exceed 20.0oC, no temperature increase will be allowed which will raise the receiving water temperature by greater than 0.3oC; nor shall such temperature increases, at any time, exceed t=34/(T+9).
Class A
These numeric criteria are designed to ensure specific communities of aquatic life will be fully protected whenever and wherever the numeric criteria are met. The state standards recognize, however, that some water bodies may not be able to meet the numeric criteria at all places and all times. WAC 172-201A states that: “Temperature shall not exceed [the numeric criteria] due to human activities. When natural conditions exceed [the numeric criteria], no temperature increases will be allowed which will raise the receiving water temperature by greater than 0.3°.” (WAC 173-201A-030(1)(c)(iv), (2)(c)(iv), (3)(c)(iv), (4)(c)(iii)) Thus at times and locations where the assigned numeric criteria cannot be attained even under estimated natural conditions, the state standards hold human warming to a cumulative allowance for additional warming of 0.3°C above the natural conditions estimated for those locations and times. In addition to placing a limit on the amount of human warming allowed when temperatures exceed the numeric criteria, the state standards restrict the amount of warming point and nonpoint sources can cause when temperatures are cooler than the numeric criteria. If natural conditions are below the temperature standard, incremental temperature increases resulting from nonpoint source activities shall not exceed 2.8°C or bring the stream temperature above the specified standard of the class at any time (Chapter 173-201A-030 WAC). Where natural conditions are below the temperature standard, incremental temperature increases from point sources are restricted using equation 23/(T+5) in Class AA waters, where T is the upstream water temperature (The equation of 28/(T+7) is used for Class A waters and t=34/(T+9) is used in Class B waters).
Walla Walla Temperature WQIR Page 23
Temperature is a water quality concern because most aquatic organisms, including salmonids, are cold-blooded and are strongly influenced by water temperature (Schuett-Hames et al., 1999). Temperature affects the physiology and behavior of fish and other aquatic life. Temperature is a major concern in the Walla Walla River and its tributaries because of the use of its waters by steelhead and bull trout, and their listing as a threatened species under the Endangered Species Act. Elevated temperature and altered channel morphology resulting from various land-use activities, such as timber harvest, flood control, and agriculture in the area limit available spawning and rearing habitat for salmonids. In the Walla Walla basin, temperature has been noted as being the most critical physiological barrier to salmonids, particularly for passage or rearing (Mendel et al., 2000).
New 2006 temperature standards Fresh waters In July 2003, the state Department of Ecology (Ecology) made significant revisions to the state’s surface water quality standards (Chapter 173-201A WAC). These changes included eliminating the classification system the state used for decades to designate uses for protection by water quality criteria (e.g., temperature, dissolved oxygen, turbidity, bacteria). Ecology also revised the numeric temperature criteria assigned to waters to protect specific types of aquatic life uses (e.g., native char, trout and salmon spawning and rearing, warm water fish habitat). Ecology submitted the revised water quality standards regulation to the U.S. Environmental Protection Agency (EPA) for federal approval. EPA was not satisfied that Ecology’s 2003 standards met the requirements of the federal Clean Water Act (CWA) and the federal Endangered Species Act (ESA). Their main concerns were over the temperature criteria applied to waters that support endangered fish species (e.g., bull trout, salmon, and steelhead). As a consequence, EPA formally disapproved portions of the revised standards. Ecology agreed to initiate state rule revision proceedings that proposed making the changes EPA highlighted as necessary. This revision was completed in November 2006. The result of the corrective state rulemaking is that a number of streams and stream segments received more stringent temperature and dissolved oxygen criteria. The state adopted its revised standards in 2006 and submitted the new standards to EPA for approval. EPA expects to conclude its review of Washington’s standards rulemaking proceedings by October 2007. Since the studies for this TMDL began in 2001 and 2002, this TMDL is being based on the EPA approved 1997 standards. However, TMDL technical studies completed during this transition period must include a scenario evaluating what would be required to meet the criteria in the 2006 rule. The 2006 revisions to the existing standards are online at Ecology’s water quality standards Web site: http://www.ecy.wa.gov/programs/wq/swqs. Table 4 provides a general structure for understanding the expected changes:
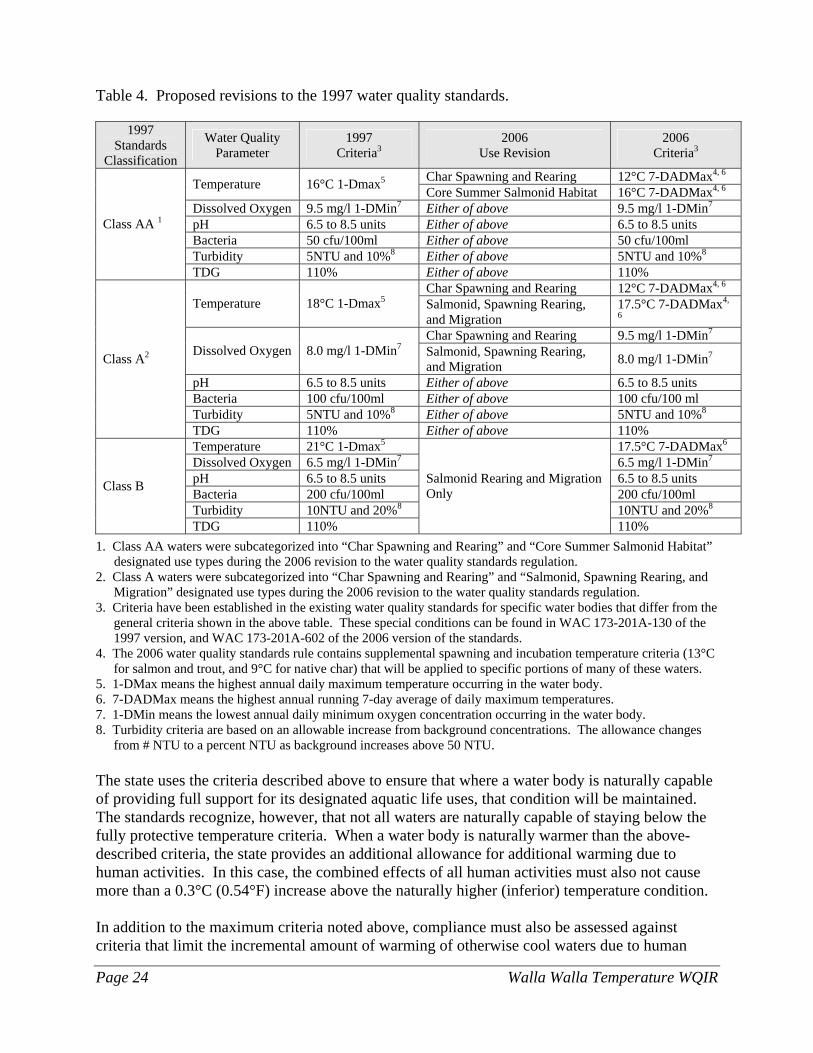
Page 24 Walla Walla Temperature WQIR
Table 4. Proposed revisions to the 1997 water quality standards.
1997 Standards
Classification
Water Quality Parameter
1997 Criteria3
2006 Use Revision
2006 Criteria3
Char Spawning and Rearing 12°C 7-DADMax4, 6 Temperature 16°C 1-Dmax5 Core Summer Salmonid Habitat 16°C 7-DADMax4, 6 Dissolved Oxygen 9.5 mg/l 1-DMin7 Either of above 9.5 mg/l 1-DMin7 pH 6.5 to 8.5 units Either of above 6.5 to 8.5 units Bacteria 50 cfu/100ml Either of above 50 cfu/100ml Turbidity 5NTU and 10%8 Either of above 5NTU and 10%8
Class AA 1
TDG 110% Either of above 110% Char Spawning and Rearing 12°C 7-DADMax4, 6
Temperature 18°C 1-Dmax5 Salmonid, Spawning Rearing, and Migration
17.5°C 7-DADMax4,
6 Char Spawning and Rearing 9.5 mg/l 1-DMin7
Dissolved Oxygen 8.0 mg/l 1-DMin7 Salmonid, Spawning Rearing, and Migration 8.0 mg/l 1-DMin7
pH 6.5 to 8.5 units Either of above 6.5 to 8.5 units Bacteria 100 cfu/100ml Either of above 100 cfu/100 ml Turbidity 5NTU and 10%8 Either of above 5NTU and 10%8
Class A2
TDG 110% Either of above 110% Temperature 21°C 1-Dmax5 17.5°C 7-DADMax6 Dissolved Oxygen 6.5 mg/l 1-DMin7 6.5 mg/l 1-DMin7 pH 6.5 to 8.5 units 6.5 to 8.5 units Bacteria 200 cfu/100ml 200 cfu/100ml Turbidity 10NTU and 20%8 10NTU and 20%8
Class B
TDG 110%
Salmonid Rearing and Migration Only
110% 1. Class AA waters were subcategorized into “Char Spawning and Rearing” and “Core Summer Salmonid Habitat”
designated use types during the 2006 revision to the water quality standards regulation. 2. Class A waters were subcategorized into “Char Spawning and Rearing” and “Salmonid, Spawning Rearing, and
Migration” designated use types during the 2006 revision to the water quality standards regulation. 3. Criteria have been established in the existing water quality standards for specific water bodies that differ from the
general criteria shown in the above table. These special conditions can be found in WAC 173-201A-130 of the 1997 version, and WAC 173-201A-602 of the 2006 version of the standards.
4. The 2006 water quality standards rule contains supplemental spawning and incubation temperature criteria (13°C for salmon and trout, and 9°C for native char) that will be applied to specific portions of many of these waters.
5. 1-DMax means the highest annual daily maximum temperature occurring in the water body. 6. 7-DADMax means the highest annual running 7-day average of daily maximum temperatures. 7. 1-DMin means the lowest annual daily minimum oxygen concentration occurring in the water body. 8. Turbidity criteria are based on an allowable increase from background concentrations. The allowance changes from # NTU to a percent NTU as background increases above 50 NTU. The state uses the criteria described above to ensure that where a water body is naturally capable of providing full support for its designated aquatic life uses, that condition will be maintained. The standards recognize, however, that not all waters are naturally capable of staying below the fully protective temperature criteria. When a water body is naturally warmer than the above-described criteria, the state provides an additional allowance for additional warming due to human activities. In this case, the combined effects of all human activities must also not cause more than a 0.3°C (0.54°F) increase above the naturally higher (inferior) temperature condition. In addition to the maximum criteria noted above, compliance must also be assessed against criteria that limit the incremental amount of warming of otherwise cool waters due to human
Walla Walla Temperature WQIR Page 25
activities. When water is cooler than the criteria noted above, the allowable rate of warming up to, but not exceeding, the numeric criteria from human actions is restricted to: (A) incremental temperature increases resulting from individual point source activities must not, at any time, exceed 28/T+7 as measured at the edge of a mixing zone boundary (where “T” represents the background temperature as measured at a point or points unaffected by the discharge), and B) Incremental temperature increases resulting from the combined effect of all nonpoint source activities in the water body must not at any time exceed 2.8°C (5.04°F). Special consideration is also required to protect spawning and incubation of salmonid species. Where the department determines the temperature criteria established for a water body would likely not result in protective spawning and incubation temperatures, the following criteria apply: A) Maximum 7-DADMax temperatures of 9°C (48.2°F) at the initiation of spawning and at fry emergence for char; and B) Maximum 7-DADMax temperatures of 13°C (55.4°F) at the initiation of spawning for salmon and at fry emergence for salmon and trout. Waters and times at which these spawning criteria apply are shown in Ecology Publication 06-10-038, which was adopted by reference into the 2006 standards. Supplemental seasonal spawning criteria of 13ºC (7-DADMax) were adopted for portions of the upper Walla Walla watershed. Additionally, portions of the upper watershed were upgraded in the 2006 rulemaking to the category of core summer salmonid habitat (16ºC 7-DADMax) and char spawning (12ºC 7-DADMax) and rearing based on information submitted by the state Department of Fish and Wildlife. The state treats lakes differently for protecting temperature conditions. For all lakes, and for reservoirs with a mean annual retention time of greater than 15 days, human actions considered cumulatively may not increase the 7-DADMax temperature more than 0.3°C (0.54°F) above natural conditions. While the criteria generally applies throughout a water body, it is not intended to apply to discretely anomalous areas such as in shallow stagnant eddy pools where natural features unrelated to human influences are the cause of not meeting the criteria. For this reason the standards direct that one take measurements from well-mixed portions of rivers and streams. For similar reasons, do not take samples from anomalously cold areas such as at discrete points where cold groundwaters flow into the water body. Global Warming Changes in climate associated with global warming are expected to affect both water quantity and quality in the Pacific Northwest (Casola et al., 2005). Summer streamflows depend on the snowpack stored during the wet season. Studies of the region’s hydrology indicate a declining tendency in snow water storage coupled with earlier spring snowmelt and earlier peak spring streamflows (Hamlet et al., 2005). Factors affecting these changes include climate influences at both annual and decadal scales, and air temperature increases associated with global warming. Increases in air temperatures result in more precipitation falling as rain rather than snow and earlier melting of the winter snowpack.
Page 26 Walla Walla Temperature WQIR
Ten climate change models were used to predict the average rate of climatic warming in the Pacific Northwest (Mote et al., 2005). The average warming rate is expected to be in the range of 0.1-0.6°C (0.2-1.0°F) per decade, with a best estimate of 0.3°C (0.5°F) (Mote et al., 2005). Eight of the ten models predicted proportionately higher summer temperatures, with three indicating summer temperature increases at least two times higher than winter increases. Summer streamflows are also predicted to decrease as a consequence of global warming (Hamlet and Lettenmaier, 1999). The expected changes coming to our region’s climate highlight the importance of protecting and restoring the mechanisms that help keep stream temperatures cool. Stream temperature improvements obtained by growing mature riparian vegetation corridors along stream banks, reducing channel widths, and enhancing summer baseflows may all help offset the changes expected from global warming – keeping conditions from getting worse. It will take considerable time, however, to reverse those human actions that contribute to excess stream warming. The sooner such restoration actions begin and the more complete they are, the more effective we will be in offsetting some of the detrimental effects on our stream resources. These efforts may not cause streams to meet the numeric temperature criteria everywhere or in all years. However, they will maximize the extent and frequency of healthy temperature conditions, creating long-term and crucial benefits for fish and other aquatic species. As global warming progresses, the thermal regime of the stream itself will change due to reduced summer streamflows and increased air temperatures. The state is writing this TMDL to meet Washington State’s water quality standards based on current and historic patterns of climate. Changes in stream temperature associated with global warming may require further modifications to the human-source allocations at some time in the future. However, the best way to preserve our aquatic resources and to minimize future disturbance to human industry would be to begin now to protect as much of the thermal health of our streams as possible. Citations related to global warming Casola, J.H., J.E. Kay, A.K. Snover, R.A. Norheim, L.C. Whitely Binder, and the Climate Impacts Group, 2005. Climate Impacts on Washington’s Hydropower, Water Supply, Forests, Fish, and Agriculture. A report prepared for King County (Washington) by the Climate Impacts Group (Center for Science in the Earth System, Joint Institute for the Study of the Atmosphere and Ocean, University of Washington, Seattle). Hamlet A.F. and D.P. Lettenmaier, 1999. Effects of climate change on hydrology and water resources in the Columbia River Basin. Journal of the American Water Resources Association, 35(6):1597- 1623. Hamlet, A.F., P.W. Mote, M. Clark, and D.P. Lettenmaier, 2005. Effects of temperature and precipitation variability on snowpack trends in the western U.S. Journal of Climate, 18 (21): 4545-4561. Mote, P.W., E. Salathé, and C. Peacock, 2005. Scenarios of future climate for the Pacific Northwest, Climate Impacts Group, University of Washington, Seattle, WA. 13 pp.
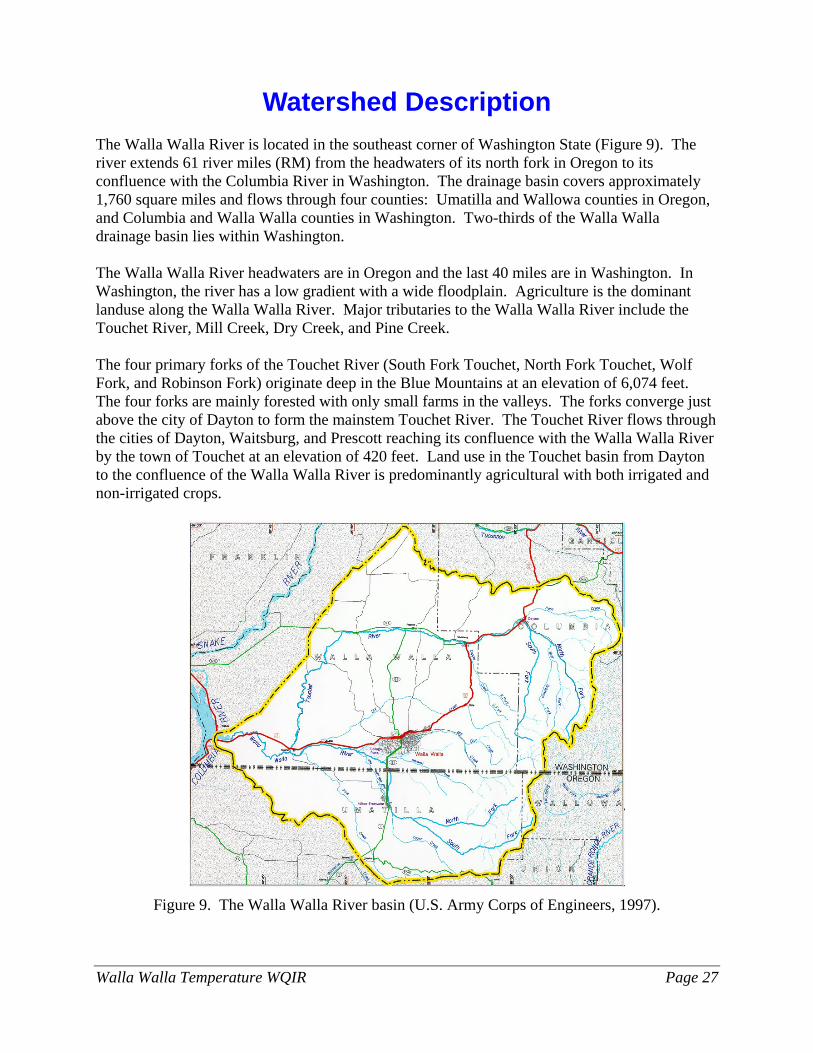
Walla Walla Temperature WQIR Page 27
Watershed Description The Walla Walla River is located in the southeast corner of Washington State (Figure 9). The river extends 61 river miles (RM) from the headwaters of its north fork in Oregon to its confluence with the Columbia River in Washington. The drainage basin covers approximately 1,760 square miles and flows through four counties: Umatilla and Wallowa counties in Oregon, and Columbia and Walla Walla counties in Washington. Two-thirds of the Walla Walla drainage basin lies within Washington. The Walla Walla River headwaters are in Oregon and the last 40 miles are in Washington. In Washington, the river has a low gradient with a wide floodplain. Agriculture is the dominant landuse along the Walla Walla River. Major tributaries to the Walla Walla River include the Touchet River, Mill Creek, Dry Creek, and Pine Creek. The four primary forks of the Touchet River (South Fork Touchet, North Fork Touchet, Wolf Fork, and Robinson Fork) originate deep in the Blue Mountains at an elevation of 6,074 feet. The four forks are mainly forested with only small farms in the valleys. The forks converge just above the city of Dayton to form the mainstem Touchet River. The Touchet River flows through the cities of Dayton, Waitsburg, and Prescott reaching its confluence with the Walla Walla River by the town of Touchet at an elevation of 420 feet. Land use in the Touchet basin from Dayton to the confluence of the Walla Walla River is predominantly agricultural with both irrigated and non-irrigated crops.
Figure 9. The Walla Walla River basin (U.S. Army Corps of Engineers, 1997).
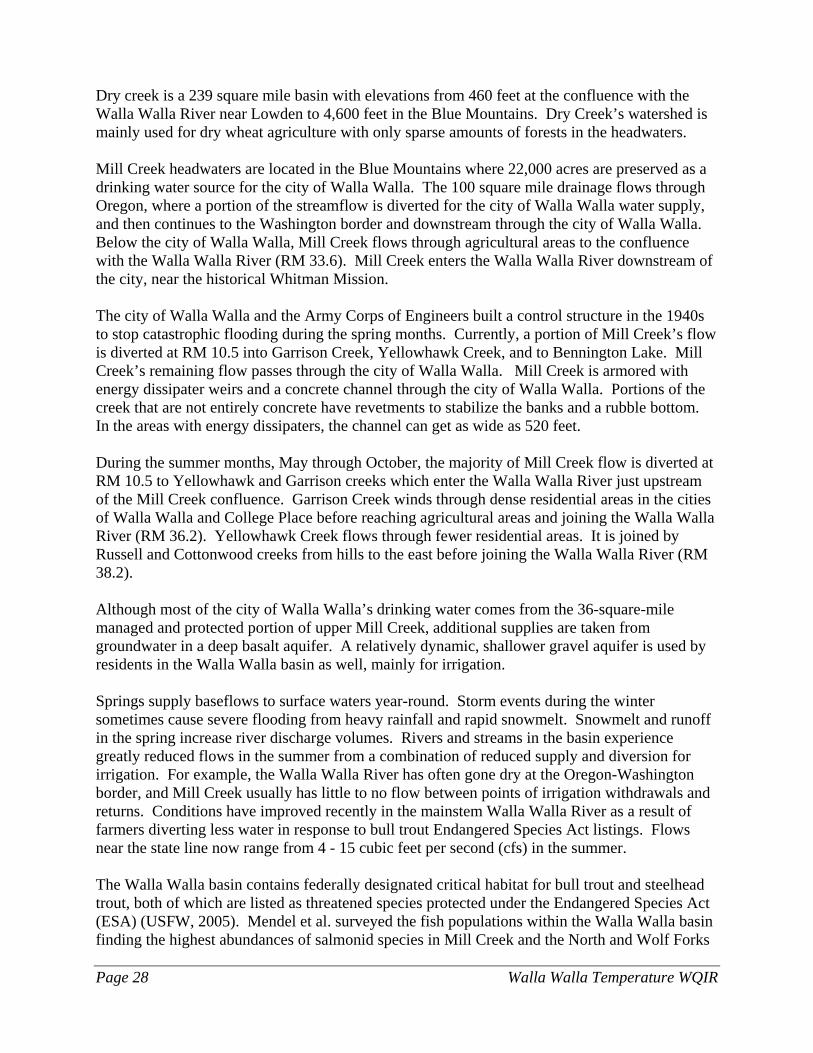
Page 28 Walla Walla Temperature WQIR
Dry creek is a 239 square mile basin with elevations from 460 feet at the confluence with the Walla Walla River near Lowden to 4,600 feet in the Blue Mountains. Dry Creek’s watershed is mainly used for dry wheat agriculture with only sparse amounts of forests in the headwaters. Mill Creek headwaters are located in the Blue Mountains where 22,000 acres are preserved as a drinking water source for the city of Walla Walla. The 100 square mile drainage flows through Oregon, where a portion of the streamflow is diverted for the city of Walla Walla water supply, and then continues to the Washington border and downstream through the city of Walla Walla. Below the city of Walla Walla, Mill Creek flows through agricultural areas to the confluence with the Walla Walla River (RM 33.6). Mill Creek enters the Walla Walla River downstream of the city, near the historical Whitman Mission. The city of Walla Walla and the Army Corps of Engineers built a control structure in the 1940s to stop catastrophic flooding during the spring months. Currently, a portion of Mill Creek’s flow is diverted at RM 10.5 into Garrison Creek, Yellowhawk Creek, and to Bennington Lake. Mill Creek’s remaining flow passes through the city of Walla Walla. Mill Creek is armored with energy dissipater weirs and a concrete channel through the city of Walla Walla. Portions of the creek that are not entirely concrete have revetments to stabilize the banks and a rubble bottom. In the areas with energy dissipaters, the channel can get as wide as 520 feet. During the summer months, May through October, the majority of Mill Creek flow is diverted at RM 10.5 to Yellowhawk and Garrison creeks which enter the Walla Walla River just upstream of the Mill Creek confluence. Garrison Creek winds through dense residential areas in the cities of Walla Walla and College Place before reaching agricultural areas and joining the Walla Walla River (RM 36.2). Yellowhawk Creek flows through fewer residential areas. It is joined by Russell and Cottonwood creeks from hills to the east before joining the Walla Walla River (RM 38.2). Although most of the city of Walla Walla’s drinking water comes from the 36-square-mile managed and protected portion of upper Mill Creek, additional supplies are taken from groundwater in a deep basalt aquifer. A relatively dynamic, shallower gravel aquifer is used by residents in the Walla Walla basin as well, mainly for irrigation. Springs supply baseflows to surface waters year-round. Storm events during the winter sometimes cause severe flooding from heavy rainfall and rapid snowmelt. Snowmelt and runoff in the spring increase river discharge volumes. Rivers and streams in the basin experience greatly reduced flows in the summer from a combination of reduced supply and diversion for irrigation. For example, the Walla Walla River has often gone dry at the Oregon-Washington border, and Mill Creek usually has little to no flow between points of irrigation withdrawals and returns. Conditions have improved recently in the mainstem Walla Walla River as a result of farmers diverting less water in response to bull trout Endangered Species Act listings. Flows near the state line now range from 4 - 15 cubic feet per second (cfs) in the summer. The Walla Walla basin contains federally designated critical habitat for bull trout and steelhead trout, both of which are listed as threatened species protected under the Endangered Species Act (ESA) (USFW, 2005). Mendel et al. surveyed the fish populations within the Walla Walla basin finding the highest abundances of salmonid species in Mill Creek and the North and Wolf Forks
Walla Walla Temperature WQIR Page 29
of the Touchet River. Native salmonid species identified were: Mountain whitefish (Prosopium williamsoni), bull trout (Salvelinus confluentues), and rainbow/steelhead trout (Oncorhynchus mykiss). Most spawning habitat was found in the upper reaches, while the lower reaches of the Touchet and Walla Walla rivers are mainly used for fish migration with little rearing capability. Bull Trout redds counted by WDFW, USFS, and ODFW staff in 2002 were 161 redds in Mill Creek, 29 redds in the North Fork Touchet River, and 92 redds in the Wolf Fork Touchet River (Mendel et al., 2004). Chinook salmon were originally native to this basin with some reintroduction work being done in recent years by the Confederated Tribe of the Umatilla Indian Reservation (CTUIR). This region has a continental type climate with hot arid summers and cold wetter winters. Temperatures in the basin can easily reach 37.8 °C (100 °F) in the summer and below freezing in the winter. The lower portions of the basin receive less than 10 inches of annual precipitation and the upper sections, in the Blue Mountains, can receive up to 60 inches of annual precipitation. Most of the precipitation falls as snow in the winter months causing a significant accumulation of snowpack in the mountains. Spring thaw, compounded with rain showers, is the source of flooding for the basin. Significant flood events occurred in 1933, 1964, and 1996. The Walla Walla basin consists primarily of rolling hills interspersed with valleys and is underlain by loess (windblown silt) formations up to 250 feet thick, except to the west where the soils are sandy. The valley floors are underlain by floodplain alluvium. Beneath the floodplain alluvium are clay units up to 500 feet thick. Under all the sediment, and exposed at the surface locally, are the Columbia River Basalts. There are two major aquifers in the area. The basalts are the deep confined aquifer. The gravels are the shallow unconfined aquifer. In general, streams are in hydraulic continuity with the shallow gravel aquifer (Newcomb, 1965, and Carson and Pogue, 1996). Much of the land area in the upper Touchet River and upper Mill Creek watersheds is covered with forest (Figure 10). Federally owned forest land is managed by the US Forest Service. Forest land in the watershed that is not owned and managed by the USFS is subject to the state forest practices rules. Forest-based land uses are present in the upper watersheds, but commercial agriculture is the dominant land use in the basin. Some small farms can be found in the vicinity of urban areas. Starting as early as the 1920s, the principal form of land use was production of small grains (such as wheat and barley), forage crops (like alfalfa), and row crops (Mapes, 1969). Currently, wheat, pasture, potatoes, alfalfa seed, and hay are the largest percentage of the irrigated crops. Pasture makes up roughly a quarter of irrigated lands on the Washington side of the Walla Walla basin. Other crops include onions, peas, grapes, apples, asparagus, and barley. Roughly 12 percent of the total acreage of the Walla Walla basin in Washington State is enrolled in the Conservation Reserve Program (CRP). Just less than one percent is under the Conservation Reserve Enhancement Program or CREP (Walla Walla County and Walla Walla Basin Watershed Council, 2004). About 91 percent of land on the Washington side of the Walla Walla basin is privately owned. Approximately six percent and two percent owned by federal and state entities respectively (Hashim and Stalmaster, 2004).
Page 30 Walla Walla Temperature WQIR
Figure 10. Land cover and federal ownership in the Walla Walla River watershed.
Much natural habitat is highly altered due to historical grazing, prescribed burning, wildfires, and agriculture. Riparian vegetation is limited in most areas throughout the basin, but considerable riparian enhancement has occurred through efforts by the local community. Most people in the Walla Walla basin live in urban areas. The Washington State Office of Financial Management’s most recent census results show there were about 56,700 people living in Walla Walla County in 2004. The major cities are Walla Walla and College Place, with a combined population of less than 40,000. The cities of Waitsburg, Dayton, College Place, and Walla Walla are the principal urban population centers. The latter three cities have wastewater treatment plants (WWTP) that discharge to surface water. These are regulated by National Pollutant Discharge Elimination System (NPDES) permits. The area in and around College Place and Walla Walla qualify to apply for municipal stormwater permits. Smaller towns of Dayton, Waitsburg, and Milton-Freewater (Oregon) support surrounding agriculture.
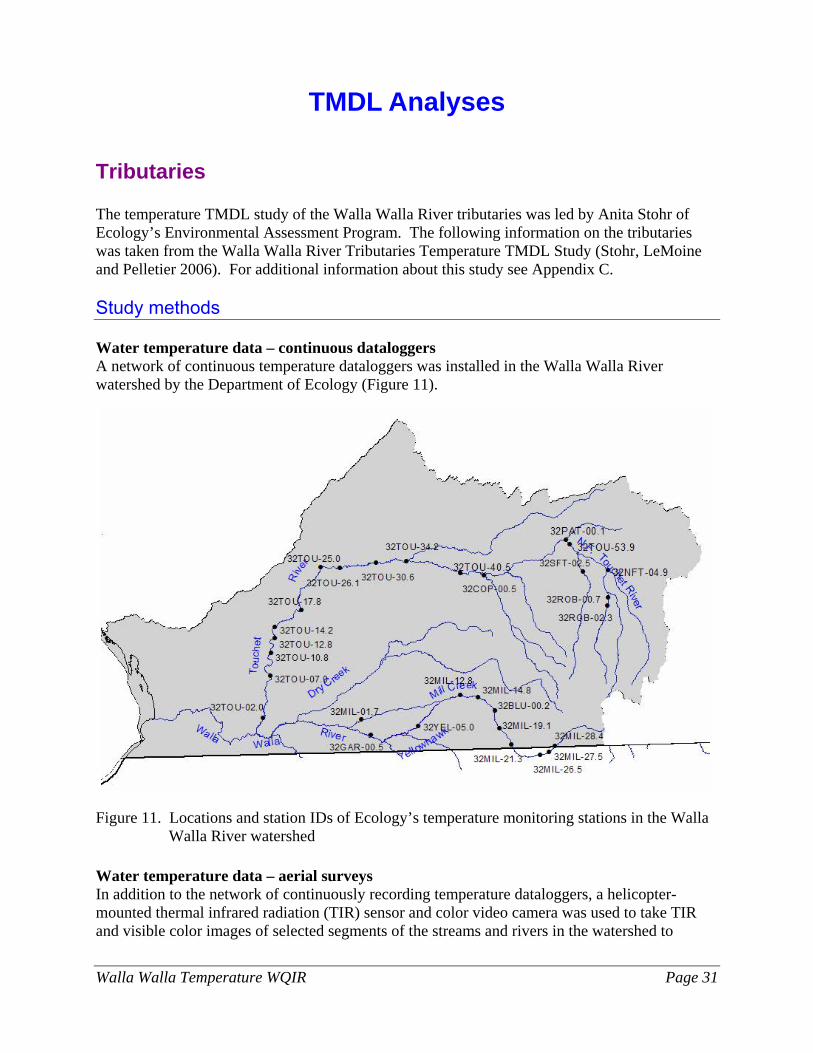
Walla Walla Temperature WQIR Page 31
TMDL Analyses
Tributaries The temperature TMDL study of the Walla Walla River tributaries was led by Anita Stohr of Ecology’s Environmental Assessment Program. The following information on the tributaries was taken from the Walla Walla River Tributaries Temperature TMDL Study (Stohr, LeMoine and Pelletier 2006). For additional information about this study see Appendix C. Study methods Water temperature data – continuous dataloggers A network of continuous temperature dataloggers was installed in the Walla Walla River watershed by the Department of Ecology (Figure 11).
Figure 11. Locations and station IDs of Ecology’s temperature monitoring stations in the Walla
Walla River watershed Water temperature data – aerial surveys In addition to the network of continuously recording temperature dataloggers, a helicopter-mounted thermal infrared radiation (TIR) sensor and color video camera was used to take TIR and visible color images of selected segments of the streams and rivers in the watershed to
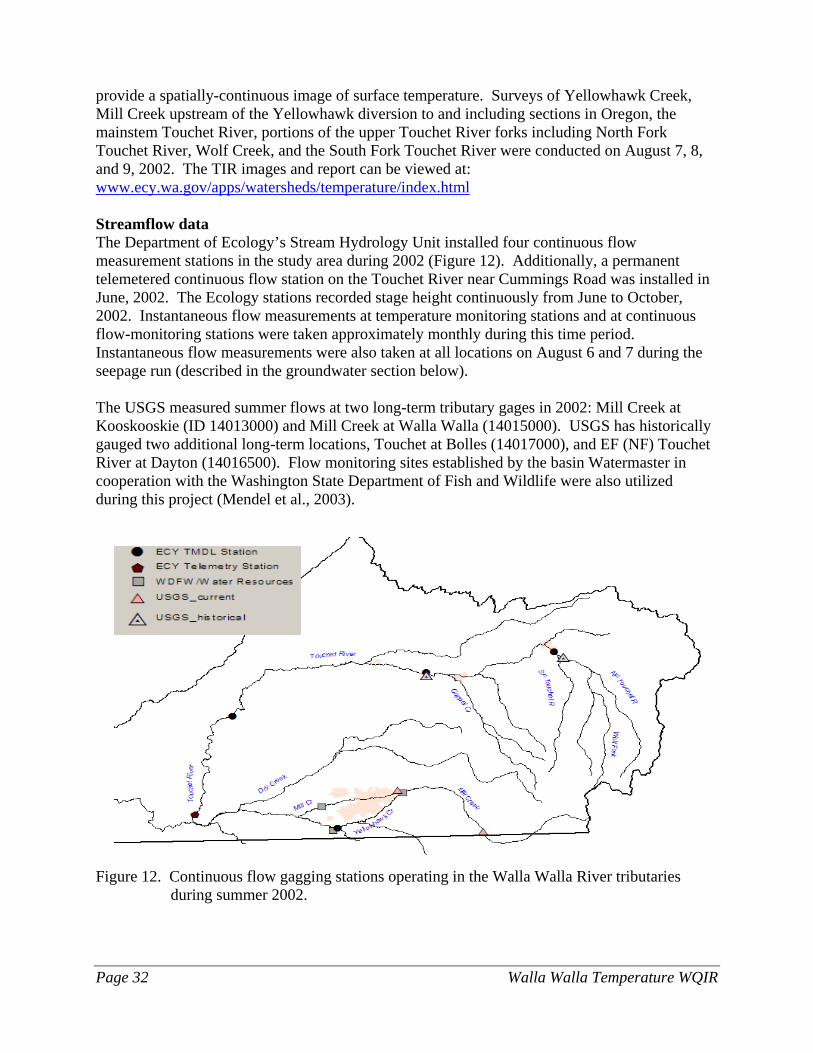
Page 32 Walla Walla Temperature WQIR
provide a spatially-continuous image of surface temperature. Surveys of Yellowhawk Creek, Mill Creek upstream of the Yellowhawk diversion to and including sections in Oregon, the mainstem Touchet River, portions of the upper Touchet River forks including North Fork Touchet River, Wolf Creek, and the South Fork Touchet River were conducted on August 7, 8, and 9, 2002. The TIR images and report can be viewed at: www.ecy.wa.gov/apps/watersheds/temperature/index.html Streamflow data The Department of Ecology’s Stream Hydrology Unit installed four continuous flow measurement stations in the study area during 2002 (Figure 12). Additionally, a permanent telemetered continuous flow station on the Touchet River near Cummings Road was installed in June, 2002. The Ecology stations recorded stage height continuously from June to October, 2002. Instantaneous flow measurements at temperature monitoring stations and at continuous flow-monitoring stations were taken approximately monthly during this time period. Instantaneous flow measurements were also taken at all locations on August 6 and 7 during the seepage run (described in the groundwater section below). The USGS measured summer flows at two long-term tributary gages in 2002: Mill Creek at Kooskooskie (ID 14013000) and Mill Creek at Walla Walla (14015000). USGS has historically gauged two additional long-term locations, Touchet at Bolles (14017000), and EF (NF) Touchet River at Dayton (14016500). Flow monitoring sites established by the basin Watermaster in cooperation with the Washington State Department of Fish and Wildlife were also utilized during this project (Mendel et al., 2003).
Figure 12. Continuous flow gagging stations operating in the Walla Walla River tributaries
during summer 2002.
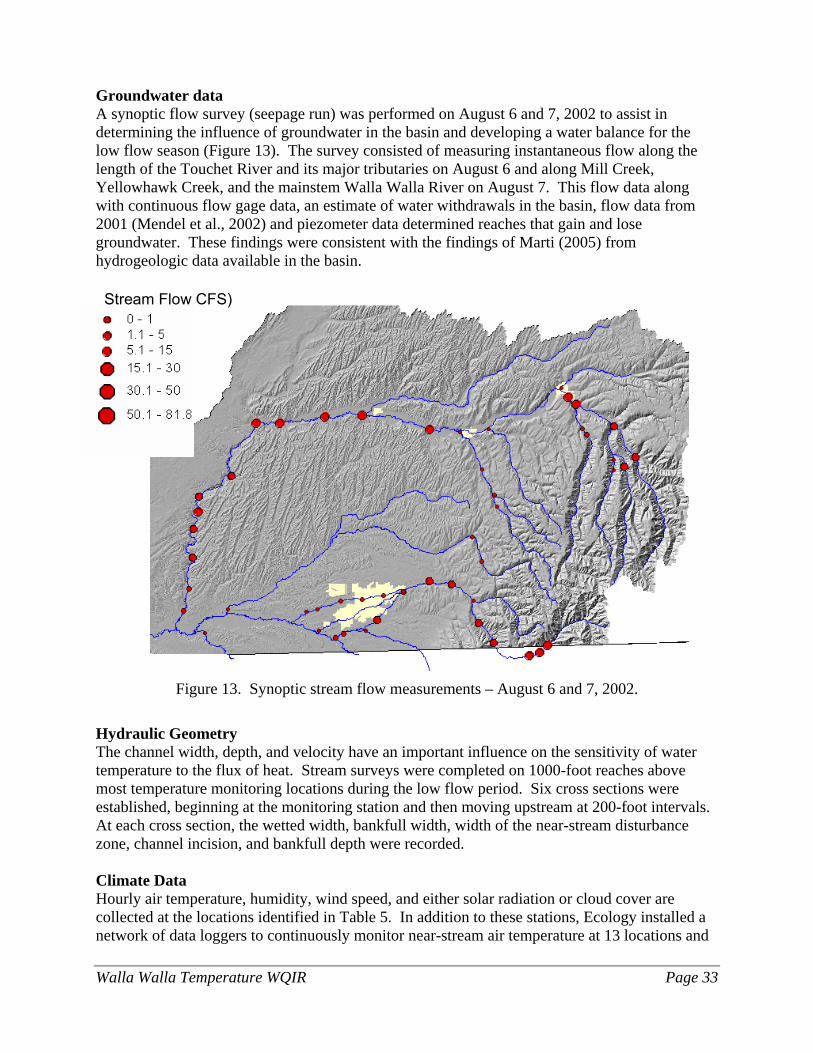
Walla Walla Temperature WQIR Page 33
Groundwater data A synoptic flow survey (seepage run) was performed on August 6 and 7, 2002 to assist in determining the influence of groundwater in the basin and developing a water balance for the low flow season (Figure 13). The survey consisted of measuring instantaneous flow along the length of the Touchet River and its major tributaries on August 6 and along Mill Creek, Yellowhawk Creek, and the mainstem Walla Walla River on August 7. This flow data along with continuous flow gage data, an estimate of water withdrawals in the basin, flow data from 2001 (Mendel et al., 2002) and piezometer data determined reaches that gain and lose groundwater. These findings were consistent with the findings of Marti (2005) from hydrogeologic data available in the basin. Stream Flow CFS)
Figure 13. Synoptic stream flow measurements – August 6 and 7, 2002.
Hydraulic Geometry The channel width, depth, and velocity have an important influence on the sensitivity of water temperature to the flux of heat. Stream surveys were completed on 1000-foot reaches above most temperature monitoring locations during the low flow period. Six cross sections were established, beginning at the monitoring station and then moving upstream at 200-foot intervals. At each cross section, the wetted width, bankfull width, width of the near-stream disturbance zone, channel incision, and bankfull depth were recorded. Climate Data Hourly air temperature, humidity, wind speed, and either solar radiation or cloud cover are collected at the locations identified in Table 5. In addition to these stations, Ecology installed a network of data loggers to continuously monitor near-stream air temperature at 13 locations and
Page 34 Walla Walla Temperature WQIR
relative humidity at five locations throughout the study area. Because of an unusually high failure rate with the relative humidity sensors, data from just one of the five Ecology sites was used in this study.
Table 5. Sources of meteorological data in the Walla Walla basin.
Site Data Source Type LeGrow, WA Agrimet Temperature, humidity, wind, solar radiation Walla Walla PAWS Temperature, humidity, wind, solar radiation Walla Walla National Weather Service Temperature, humidity, wind, cloud cover Welland PAWS Temperature, humidity, wind, solar radiation Touchet PAWS Temperature, humidity, wind, solar radiation K2H PAWS Temperature, humidity, wind, solar radiation College Place PAWS Temperature, humidity, wind, solar radiation
The National Weather Service Site at the Walla Walla Airport provides a long term (54-year) record of climate data. The PAWS and AGRIMET stations usually do not have data prior to 1989. Comparison of data collected at the airport with data collected near stream by Ecology and at PAWS and Agriment stations show that all stations measure similar air temperature and relative humidity, except for the airport station. Mid-day (high) air temperatures and relative humidities (low) are similar at all stations. Early-morning (low) air temperatures and relative humidities (high) are much different at the airport. Near-stream temperatures for years not sampled by Ecology will be derived from the PAWS stations. The airport will be used to determine which are hot and cold years and to derive the typical (50% percentile) and the extreme (90% percentile) years for climate conditions. Then actual data from the PAWS/Agrimet will be used for near stream temperature. Riparian Vegetation and Effective Shade Near-stream vegetation cover, along with channel morphology and stream hydrology, represents the most important factors that influence stream temperature. To obtain a detailed description of the existing riparian conditions in the Walla Walla River basin, a combination of field collected riparian vegetation data, GIS analysis, and aerial photography interpretation was used. Riparian vegetation data was collected during stream surveys of approximately 30 thermal reaches during 2002. An adapted form of the Timber-Fish-Wildlife Stream Temperature Survey methodology was followed to collect this data (Schuett-Hames et al., 1999). Surveys to collect both channel morphology and riparian vegetation information took place above each of the temperature sites established by Ecology (Figure 11). Additionally WDFW collected some of this data above their temperature monitors. Stream surveys began at the location of the temperature monitor and continued upstream for 1000 feet. Measurements were taken at 0, 200, 400, 600, 800, and 1000 feet above the temperature monitor. Data collected consisted of bankfull width and depth, wetted width and depth, effective shade (using a Solar Pathfinder), canopy cover, active channel width, vegetation height, vegetation density, general vegetation type, distance that vegetation covers the stream channel, and bank incision. Hemispherical photography was used to measure effective shade
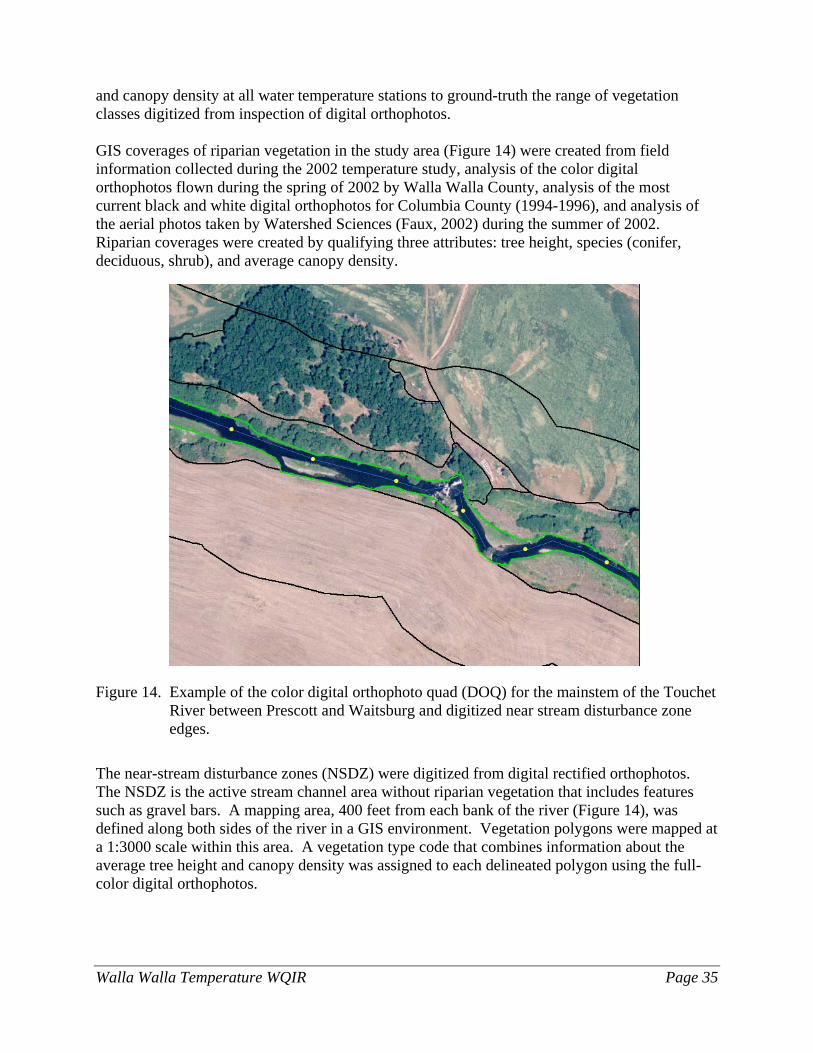
Walla Walla Temperature WQIR Page 35
and canopy density at all water temperature stations to ground-truth the range of vegetation classes digitized from inspection of digital orthophotos. GIS coverages of riparian vegetation in the study area (Figure 14) were created from field information collected during the 2002 temperature study, analysis of the color digital orthophotos flown during the spring of 2002 by Walla Walla County, analysis of the most current black and white digital orthophotos for Columbia County (1994-1996), and analysis of the aerial photos taken by Watershed Sciences (Faux, 2002) during the summer of 2002. Riparian coverages were created by qualifying three attributes: tree height, species (conifer, deciduous, shrub), and average canopy density.
Figure 14. Example of the color digital orthophoto quad (DOQ) for the mainstem of the Touchet
River between Prescott and Waitsburg and digitized near stream disturbance zone edges.
The near-stream disturbance zones (NSDZ) were digitized from digital rectified orthophotos. The NSDZ is the active stream channel area without riparian vegetation that includes features such as gravel bars. A mapping area, 400 feet from each bank of the river (Figure 14), was defined along both sides of the river in a GIS environment. Vegetation polygons were mapped at a 1:3000 scale within this area. A vegetation type code that combines information about the average tree height and canopy density was assigned to each delineated polygon using the full-color digital orthophotos.
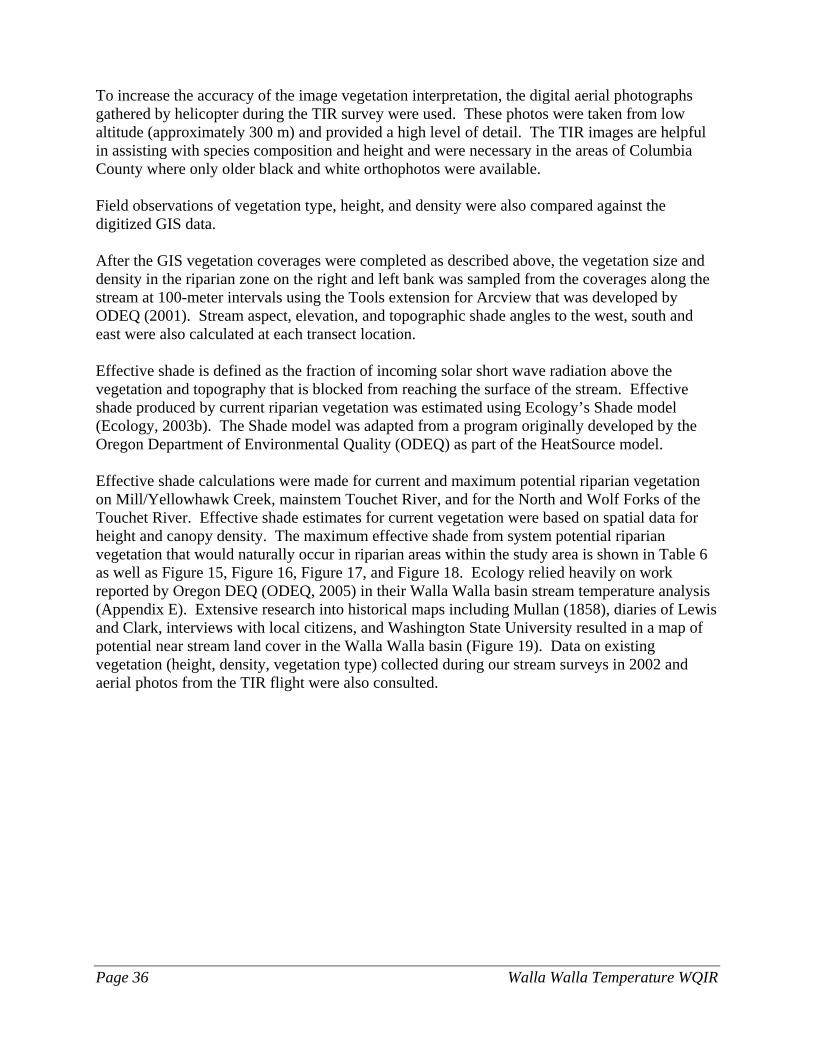
Page 36 Walla Walla Temperature WQIR
To increase the accuracy of the image vegetation interpretation, the digital aerial photographs gathered by helicopter during the TIR survey were used. These photos were taken from low altitude (approximately 300 m) and provided a high level of detail. The TIR images are helpful in assisting with species composition and height and were necessary in the areas of Columbia County where only older black and white orthophotos were available. Field observations of vegetation type, height, and density were also compared against the digitized GIS data. After the GIS vegetation coverages were completed as described above, the vegetation size and density in the riparian zone on the right and left bank was sampled from the coverages along the stream at 100-meter intervals using the Tools extension for Arcview that was developed by ODEQ (2001). Stream aspect, elevation, and topographic shade angles to the west, south and east were also calculated at each transect location. Effective shade is defined as the fraction of incoming solar short wave radiation above the vegetation and topography that is blocked from reaching the surface of the stream. Effective shade produced by current riparian vegetation was estimated using Ecology’s Shade model (Ecology, 2003b). The Shade model was adapted from a program originally developed by the Oregon Department of Environmental Quality (ODEQ) as part of the HeatSource model. Effective shade calculations were made for current and maximum potential riparian vegetation on Mill/Yellowhawk Creek, mainstem Touchet River, and for the North and Wolf Forks of the Touchet River. Effective shade estimates for current vegetation were based on spatial data for height and canopy density. The maximum effective shade from system potential riparian vegetation that would naturally occur in riparian areas within the study area is shown in Table 6 as well as Figure 15, Figure 16, Figure 17, and Figure 18. Ecology relied heavily on work reported by Oregon DEQ (ODEQ, 2005) in their Walla Walla basin stream temperature analysis (Appendix E). Extensive research into historical maps including Mullan (1858), diaries of Lewis and Clark, interviews with local citizens, and Washington State University resulted in a map of potential near stream land cover in the Walla Walla basin (Figure 19). Data on existing vegetation (height, density, vegetation type) collected during our stream surveys in 2002 and aerial photos from the TIR flight were also consulted.
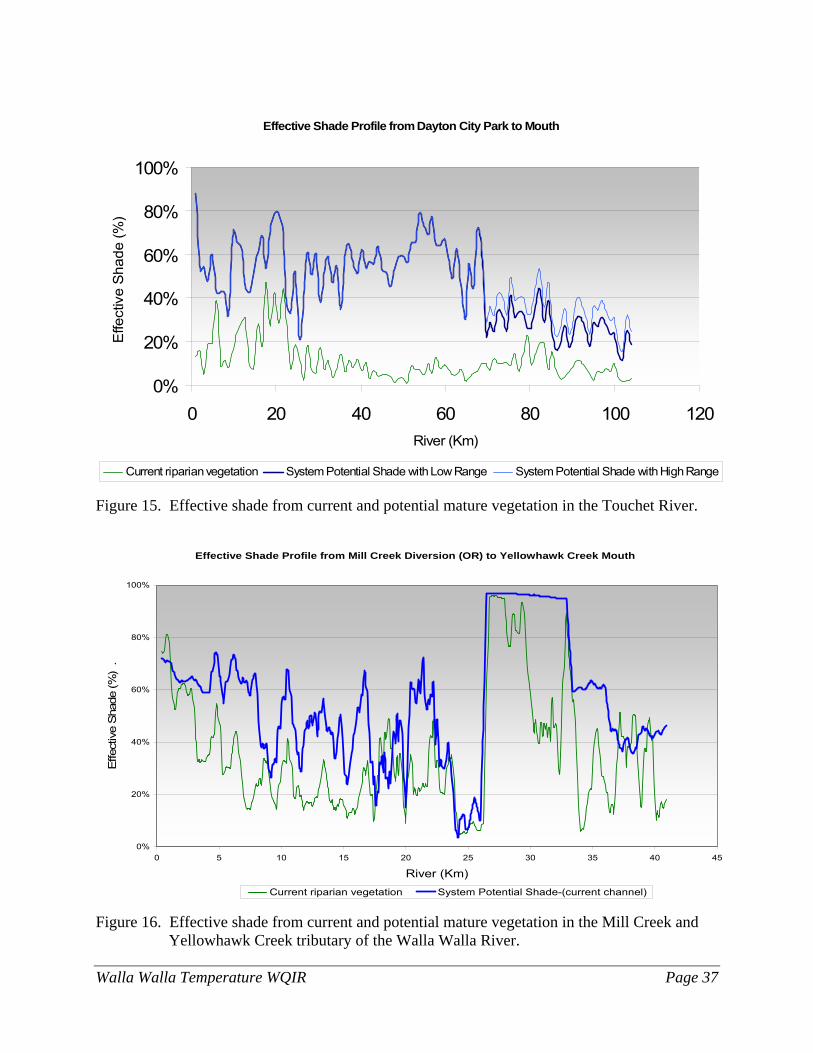
Walla Walla Temperature WQIR Page 37
Effective Shade Profile from Dayton City Park to Mouth
0%
20%
40%
60%
80%
100%
0 20 40 60 80 100 120River (Km)
Effe
ctiv
e S
hade
(%)
Current riparian vegetation System Potential Shade with Low Range System Potential Shade with High Range
Figure 15. Effective shade from current and potential mature vegetation in the Touchet River.
Effective Shade Profile from Mill Creek Diversion (OR) to Yellowhawk Creek Mouth
0%
20%
40%
60%
80%
100%
0 5 10 15 20 25 30 35 40 45
River (Km)
Effe
ctiv
e Sh
ade
(%)
.
Current riparian vegetation System Potential Shade-(current channel)
Figure 16. Effective shade from current and potential mature vegetation in the Mill Creek and Yellowhawk Creek tributary of the Walla Walla River.
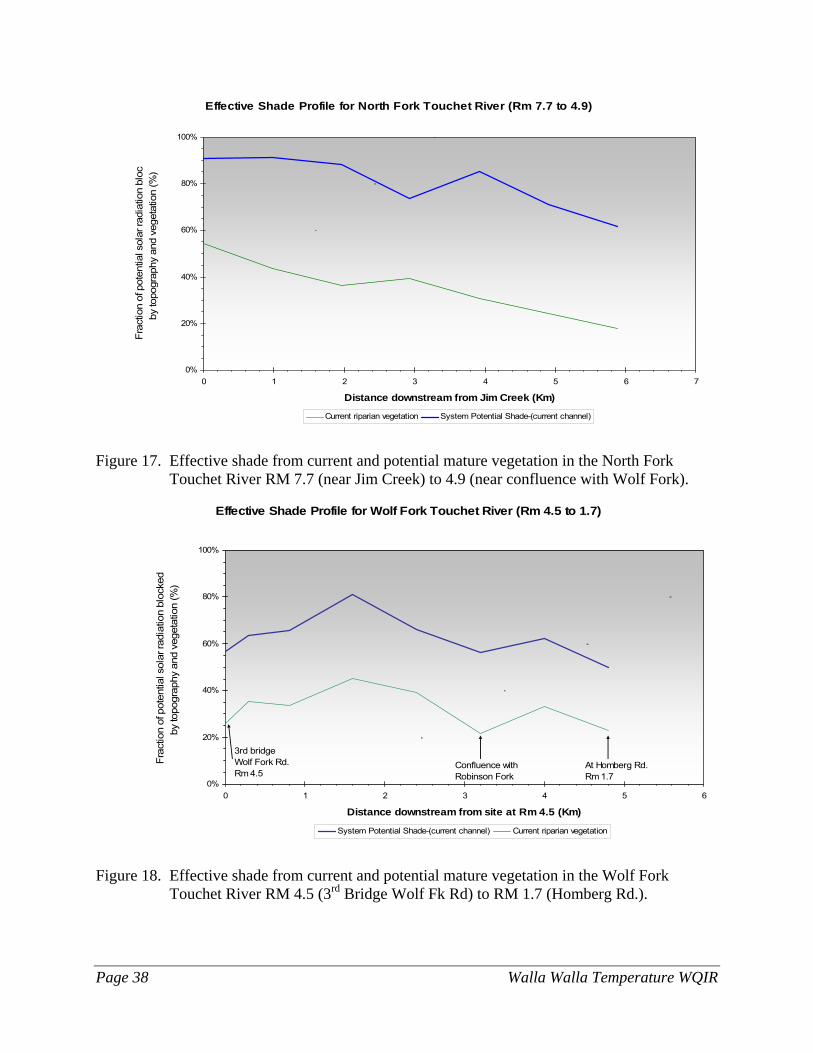
Page 38 Walla Walla Temperature WQIR
Effective Shade Profile for North Fork Touchet River (Rm 7.7 to 4.9)
0%
20%
40%
60%
80%
100%
0 1 2 3 4 5 6 7
Distance downstream from Jim Creek (Km)
Frac
tion
of p
oten
tial s
olar
radi
atio
n bl
ocby
topo
grap
hy a
nd v
eget
atio
n (%
)
Current riparian vegetation System Potential Shade-(current channel)
Figure 17. Effective shade from current and potential mature vegetation in the North Fork Touchet River RM 7.7 (near Jim Creek) to 4.9 (near confluence with Wolf Fork).
Effective Shade Profile for Wolf Fork Touchet River (Rm 4.5 to 1.7)
0%
20%
40%
60%
80%
100%
0 1 2 3 4 5 6
Distance downstream from site at Rm 4.5 (Km)
Frac
tion
of p
oten
tial s
olar
radi
atio
n bl
ocke
d
by to
pogr
aphy
and
veg
etat
ion
(%)
System Potential Shade-(current channel) Current riparian vegetation
3rd bridge Wolf Fork Rd. Rm 4.5
Confluence with Robinson Fork
At Homberg Rd. Rm 1.7
Figure 18. Effective shade from current and potential mature vegetation in the Wolf Fork Touchet River RM 4.5 (3rd Bridge Wolf Fk Rd) to RM 1.7 (Homberg Rd.).
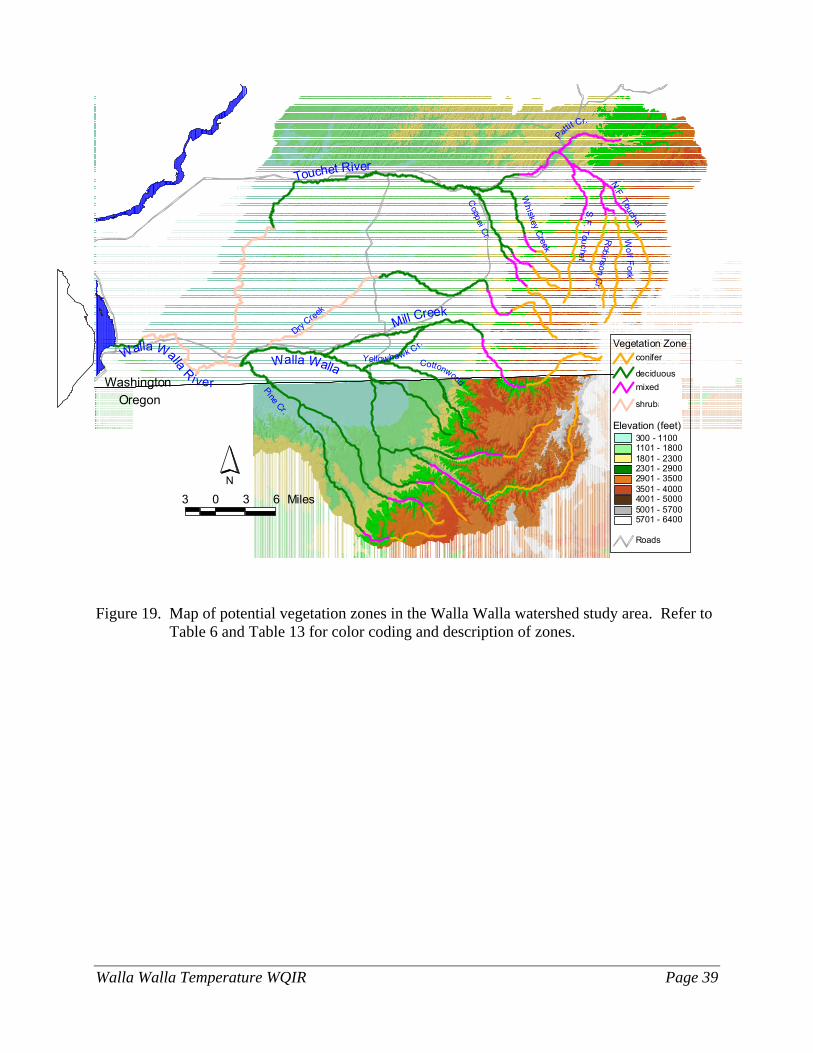
Walla Walla Temperature WQIR Page 39
Touchet River
Dry Cree
k
Mill Creek
Walla Walla R iver
Coppei Cr.
Wh iskey Creek
Yellowhawk C r.
WashingtonOregon
N.F. Touchet
S.F. Touchet
Wo lf Fork
Robinson C
r.
Pattit
Cr.
Walla Walla
Pine Cr.
Cottonwood
3 0 3 6 Miles
Elevation (feet)300 - 11001101 - 18001801 - 23002301 - 29002901 - 35003501 - 40004001 - 50005001 - 57005701 - 6400
Roads
Vegetation Zoneconifer
deciduousmixed
shrubanddec
N
Figure 19. Map of potential vegetation zones in the Walla Walla watershed study area. Refer to
Table 6 and Table 13 for color coding and description of zones.
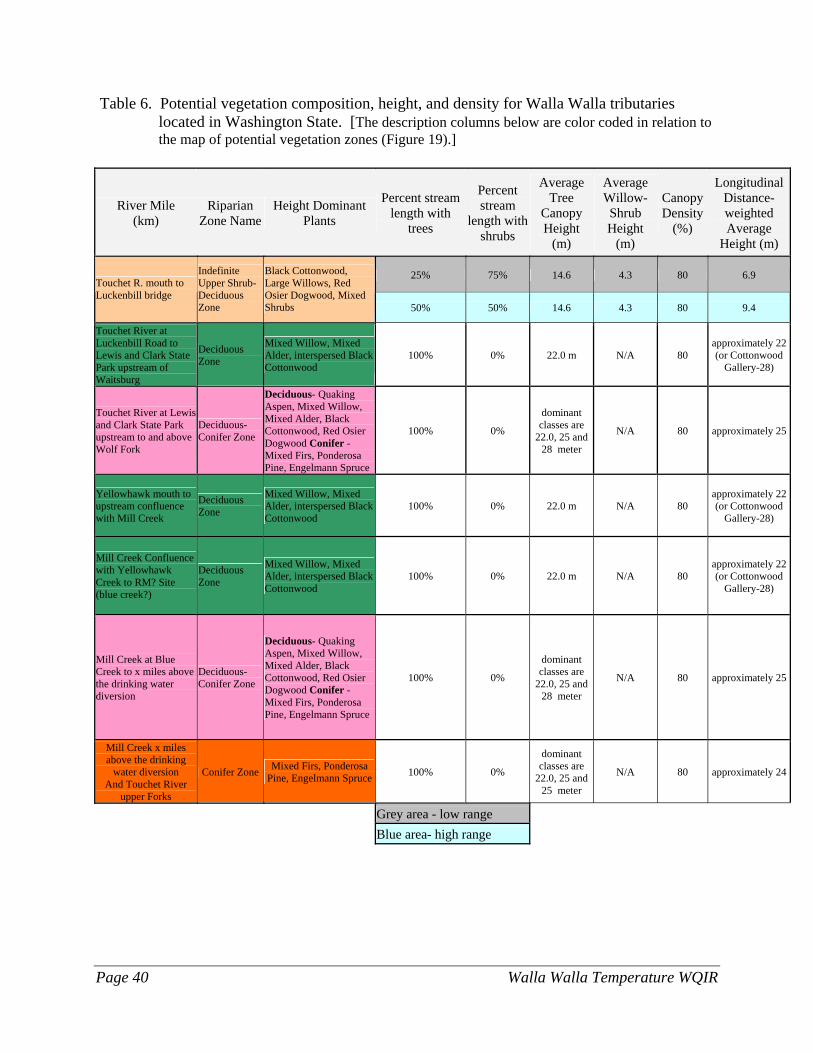
Page 40 Walla Walla Temperature WQIR
Table 6. Potential vegetation composition, height, and density for Walla Walla tributaries located in Washington State. [The description columns below are color coded in relation to the map of potential vegetation zones (Figure 19).]
River Mile (km)
Riparian Zone Name
Height Dominant Plants
Percent stream length with
trees
Percent stream
length with shrubs
Average Tree
Canopy Height
(m)
Average Willow-Shrub Height
(m)
Canopy Density
(%)
Longitudinal Distance-weighted Average
Height (m)
25% 75% 14.6 4.3 80 6.9 Touchet R. mouth to Luckenbill bridge
Indefinite Upper Shrub- Deciduous Zone
Black Cottonwood, Large Willows, Red Osier Dogwood, Mixed Shrubs 50% 50% 14.6 4.3 80 9.4
Touchet River at Luckenbill Road to Lewis and Clark State Park upstream of Waitsburg
Deciduous Zone
Mixed Willow, Mixed Alder, interspersed Black Cottonwood
100% 0% 22.0 m N/A 80 approximately 22 (or Cottonwood
Gallery-28)
Touchet River at Lewis and Clark State Park upstream to and above Wolf Fork
Deciduous-Conifer Zone
Deciduous- Quaking Aspen, Mixed Willow, Mixed Alder, Black Cottonwood, Red Osier Dogwood Conifer -Mixed Firs, Ponderosa Pine, Engelmann Spruce
100% 0%
dominant classes are
22.0, 25 and 28 meter
N/A 80 approximately 25
Yellowhawk mouth to upstream confluence with Mill Creek
Deciduous Zone
Mixed Willow, Mixed Alder, interspersed Black Cottonwood
100% 0% 22.0 m N/A 80 approximately 22 (or Cottonwood
Gallery-28)
Mill Creek Confluence with Yellowhawk Creek to RM? Site (blue creek?)
Deciduous Zone
Mixed Willow, Mixed Alder, interspersed Black Cottonwood
100% 0% 22.0 m N/A 80 approximately 22(or Cottonwood
Gallery-28)
Mill Creek at Blue Creek to x miles above the drinking water diversion
Deciduous-Conifer Zone
Deciduous- Quaking Aspen, Mixed Willow, Mixed Alder, Black Cottonwood, Red Osier Dogwood Conifer -Mixed Firs, Ponderosa Pine, Engelmann Spruce
100% 0%
dominant classes are
22.0, 25 and 28 meter
N/A 80 approximately 25
Mill Creek x miles above the drinking
water diversion And Touchet River
upper Forks
Conifer Zone Mixed Firs, Ponderosa Pine, Engelmann Spruce 100% 0%
dominant classes are
22.0, 25 and 25 meter
N/A 80 approximately 24
Grey area - low range Blue area- high range
Walla Walla Temperature WQIR Page 41
Analytical framework Data collected during this TMDL effort has been used to simulate temperatures continuously along streams using a methodology that is both spatially continuous and which spans full-day timeframes. The GIS and modeling analysis was conducted using three specialized software tools:
• ODEQ’s Tools extension for Arcview (ODEQ, 2001) was used to sample and process GIS data for input to the QUAL2Kw model.
• Ecology’s Shade model (Ecology, 2003a) was used to estimate effective shade along the mainstems of the Touchet River (Figure 15), Mill Creek, and Yellowhawk Creek (Figure 16), and along selected segments of the North and Wolf Fork Touchet River (Figure 17 and Figure 18). Effective shade was calculated at 100-meter intervals along the streams and then averaged over 1000-meter intervals for input to the QUAL2Kw model.
• The QUAL2Kw model (Chapra, 2001; Chapra and Pelletier, 2003; and Pelletier and Chapra, 2003) was used to calculate the components of the heat budget and simulate water temperatures. QUAL2Kw simulates diurnal variations in stream temperature for a steady flow condition. QUAL2Kw was applied by assuming that flow remains constant for a given condition such as a 7-day or 1-day period, but key variables are allowed to vary with time over the course of a day. For temperature simulation, the solar radiation, air temperature, relative humidity, headwater temperature, and tributary water temperatures were specified or simulated as diurnally varying functions. QUAL2Kw uses the kinetic formulations for the components of the surface water heat budget that are shown in Figure 3 and described in Chapra (1997). Complete model documentation and software can be found at www.ecy.wa.gov/programs/eap/models/index.html. Diurnally varying water temperatures at 1000 meter intervals along the streams in the Walla Walla River basin were simulated using a finite difference numerical method. The water temperature model was calibrated and confirmed to in-stream data.
All input data for the Shade and QUAL2Kw models are longitudinally referenced, allowing spatial and/or continuous inputs to apply to certain zones or specific river segments. Model input data were determined from available GIS coverages using the Tools extension for Arcview, or from data collected by Ecology or other data sources. Calibration of the QUAL2Kw Model The hottest 7-day period of 2002 occurred from July 11-17, 2002 and was used for calibration of the Touchet River QUAL2Kw model. An aerial survey of thermal infrared radiation (TIR) was conducted during a cooler period during August 7, 8, and 9, 2002. The TIR survey covered Mill Creek on August 7, the mainstem Touchet River on August 8, and the Upper Touchet Forks on August 9. The next warm week following the TIR flight was August 9-15 and was used to assist in model calibration. The Touchet model was confirmed with data from July 22-28, 1998. The 1998 week was a warm low-flow period when numerous streamflow and field measurements were taken by WDFW.
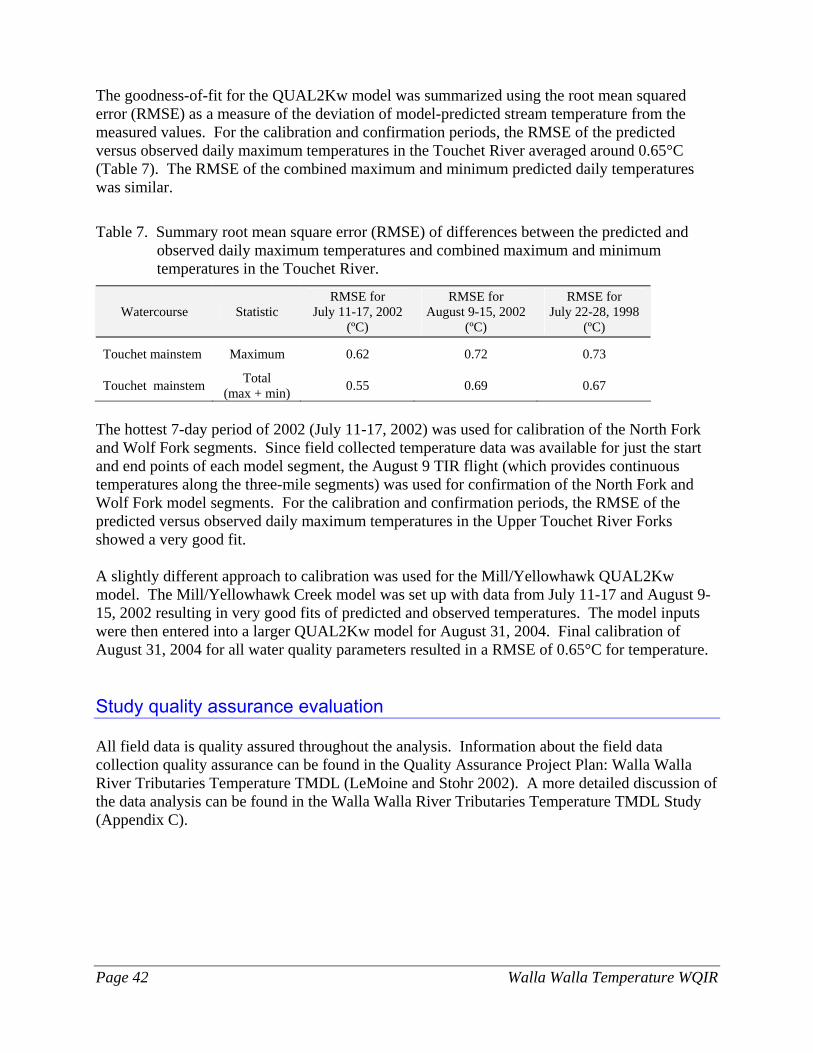
Page 42 Walla Walla Temperature WQIR
The goodness-of-fit for the QUAL2Kw model was summarized using the root mean squared error (RMSE) as a measure of the deviation of model-predicted stream temperature from the measured values. For the calibration and confirmation periods, the RMSE of the predicted versus observed daily maximum temperatures in the Touchet River averaged around 0.65°C (Table 7). The RMSE of the combined maximum and minimum predicted daily temperatures was similar.
Table 7. Summary root mean square error (RMSE) of differences between the predicted and observed daily maximum temperatures and combined maximum and minimum temperatures in the Touchet River.
Watercourse Statistic RMSE for
July 11-17, 2002 (ºC)
RMSE for August 9-15, 2002
(ºC)
RMSE for July 22-28, 1998
(ºC)
Touchet mainstem Maximum 0.62 0.72 0.73
Touchet mainstem Total (max + min) 0.55 0.69 0.67
The hottest 7-day period of 2002 (July 11-17, 2002) was used for calibration of the North Fork and Wolf Fork segments. Since field collected temperature data was available for just the start and end points of each model segment, the August 9 TIR flight (which provides continuous temperatures along the three-mile segments) was used for confirmation of the North Fork and Wolf Fork model segments. For the calibration and confirmation periods, the RMSE of the predicted versus observed daily maximum temperatures in the Upper Touchet River Forks showed a very good fit. A slightly different approach to calibration was used for the Mill/Yellowhawk QUAL2Kw model. The Mill/Yellowhawk Creek model was set up with data from July 11-17 and August 9-15, 2002 resulting in very good fits of predicted and observed temperatures. The model inputs were then entered into a larger QUAL2Kw model for August 31, 2004. Final calibration of August 31, 2004 for all water quality parameters resulted in a RMSE of 0.65°C for temperature. Study quality assurance evaluation All field data is quality assured throughout the analysis. Information about the field data collection quality assurance can be found in the Quality Assurance Project Plan: Walla Walla River Tributaries Temperature TMDL (LeMoine and Stohr 2002). A more detailed discussion of the data analysis can be found in the Walla Walla River Tributaries Temperature TMDL Study (Appendix C).
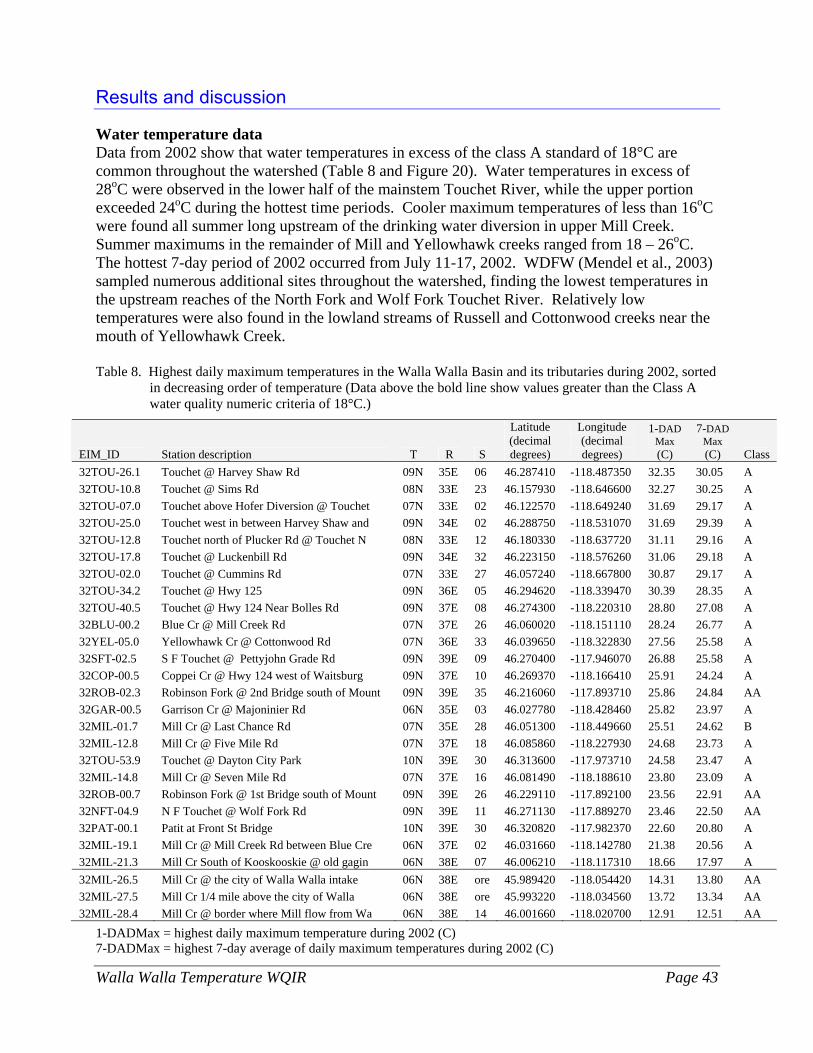
Walla Walla Temperature WQIR Page 43
Results and discussion Water temperature data Data from 2002 show that water temperatures in excess of the class A standard of 18°C are common throughout the watershed (Table 8 and Figure 20). Water temperatures in excess of 28oC were observed in the lower half of the mainstem Touchet River, while the upper portion exceeded 24oC during the hottest time periods. Cooler maximum temperatures of less than 16oC were found all summer long upstream of the drinking water diversion in upper Mill Creek. Summer maximums in the remainder of Mill and Yellowhawk creeks ranged from 18 – 26oC. The hottest 7-day period of 2002 occurred from July 11-17, 2002. WDFW (Mendel et al., 2003) sampled numerous additional sites throughout the watershed, finding the lowest temperatures in the upstream reaches of the North Fork and Wolf Fork Touchet River. Relatively low temperatures were also found in the lowland streams of Russell and Cottonwood creeks near the mouth of Yellowhawk Creek. Table 8. Highest daily maximum temperatures in the Walla Walla Basin and its tributaries during 2002, sorted
in decreasing order of temperature (Data above the bold line show values greater than the Class A water quality numeric criteria of 18°C.)
EIM_ID Station description T R S
Latitude (decimal degrees)
Longitude (decimal degrees)
1-DAD Max (C)
7-DAD Max (C) Class
32TOU-26.1 Touchet @ Harvey Shaw Rd 09N 35E 06 46.287410 -118.487350 32.35 30.05 A 32TOU-10.8 Touchet @ Sims Rd 08N 33E 23 46.157930 -118.646600 32.27 30.25 A 32TOU-07.0 Touchet above Hofer Diversion @ Touchet 07N 33E 02 46.122570 -118.649240 31.69 29.17 A 32TOU-25.0 Touchet west in between Harvey Shaw and 09N 34E 02 46.288750 -118.531070 31.69 29.39 A 32TOU-12.8 Touchet north of Plucker Rd @ Touchet N 08N 33E 12 46.180330 -118.637720 31.11 29.16 A 32TOU-17.8 Touchet @ Luckenbill Rd 09N 34E 32 46.223150 -118.576260 31.06 29.18 A 32TOU-02.0 Touchet @ Cummins Rd 07N 33E 27 46.057240 -118.667800 30.87 29.17 A 32TOU-34.2 Touchet @ Hwy 125 09N 36E 05 46.294620 -118.339470 30.39 28.35 A 32TOU-40.5 Touchet @ Hwy 124 Near Bolles Rd 09N 37E 08 46.274300 -118.220310 28.80 27.08 A 32BLU-00.2 Blue Cr @ Mill Creek Rd 07N 37E 26 46.060020 -118.151110 28.24 26.77 A 32YEL-05.0 Yellowhawk Cr @ Cottonwood Rd 07N 36E 33 46.039650 -118.322830 27.56 25.58 A 32SFT-02.5 S F Touchet @ Pettyjohn Grade Rd 09N 39E 09 46.270400 -117.946070 26.88 25.58 A 32COP-00.5 Coppei Cr @ Hwy 124 west of Waitsburg 09N 37E 10 46.269370 -118.166410 25.91 24.24 A 32ROB-02.3 Robinson Fork @ 2nd Bridge south of Mount 09N 39E 35 46.216060 -117.893710 25.86 24.84 AA 32GAR-00.5 Garrison Cr @ Majoninier Rd 06N 35E 03 46.027780 -118.428460 25.82 23.97 A 32MIL-01.7 Mill Cr @ Last Chance Rd 07N 35E 28 46.051300 -118.449660 25.51 24.62 B 32MIL-12.8 Mill Cr @ Five Mile Rd 07N 37E 18 46.085860 -118.227930 24.68 23.73 A 32TOU-53.9 Touchet @ Dayton City Park 10N 39E 30 46.313600 -117.973710 24.58 23.47 A 32MIL-14.8 Mill Cr @ Seven Mile Rd 07N 37E 16 46.081490 -118.188610 23.80 23.09 A 32ROB-00.7 Robinson Fork @ 1st Bridge south of Mount 09N 39E 26 46.229110 -117.892100 23.56 22.91 AA 32NFT-04.9 N F Touchet @ Wolf Fork Rd 09N 39E 11 46.271130 -117.889270 23.46 22.50 AA 32PAT-00.1 Patit at Front St Bridge 10N 39E 30 46.320820 -117.982370 22.60 20.80 A 32MIL-19.1 Mill Cr @ Mill Creek Rd between Blue Cre 06N 37E 02 46.031660 -118.142780 21.38 20.56 A 32MIL-21.3 Mill Cr South of Kooskooskie @ old gagin 06N 38E 07 46.006210 -118.117310 18.66 17.97 A 32MIL-26.5 Mill Cr @ the city of Walla Walla intake 06N 38E ore 45.989420 -118.054420 14.31 13.80 AA 32MIL-27.5 Mill Cr 1/4 mile above the city of Walla 06N 38E ore 45.993220 -118.034560 13.72 13.34 AA 32MIL-28.4 Mill Cr @ border where Mill flow from Wa 06N 38E 14 46.001660 -118.020700 12.91 12.51 AA
1-DADMax = highest daily maximum temperature during 2002 (C) 7-DADMax = highest 7-day average of daily maximum temperatures during 2002 (C)
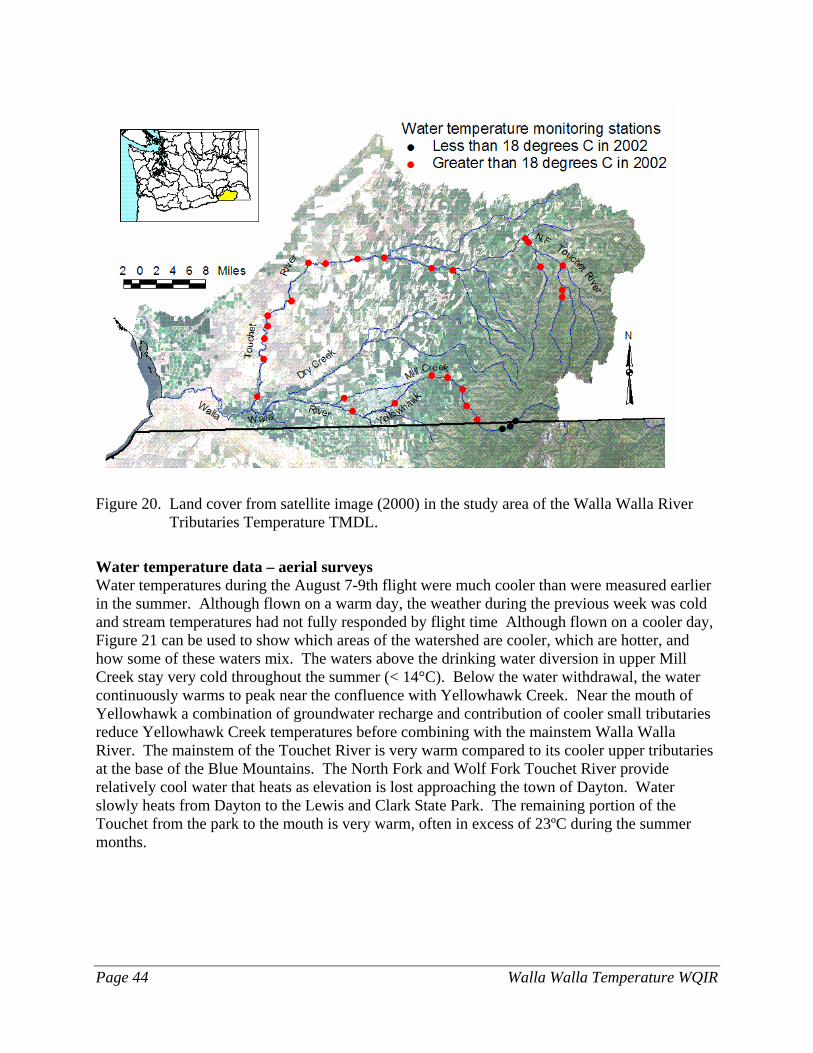
Page 44 Walla Walla Temperature WQIR
Figure 20. Land cover from satellite image (2000) in the study area of the Walla Walla River Tributaries Temperature TMDL.
Water temperature data – aerial surveys Water temperatures during the August 7-9th flight were much cooler than were measured earlier in the summer. Although flown on a warm day, the weather during the previous week was cold and stream temperatures had not fully responded by flight time Although flown on a cooler day, Figure 21 can be used to show which areas of the watershed are cooler, which are hotter, and how some of these waters mix. The waters above the drinking water diversion in upper Mill Creek stay very cold throughout the summer (< 14°C). Below the water withdrawal, the water continuously warms to peak near the confluence with Yellowhawk Creek. Near the mouth of Yellowhawk a combination of groundwater recharge and contribution of cooler small tributaries reduce Yellowhawk Creek temperatures before combining with the mainstem Walla Walla River. The mainstem of the Touchet River is very warm compared to its cooler upper tributaries at the base of the Blue Mountains. The North Fork and Wolf Fork Touchet River provide relatively cool water that heats as elevation is lost approaching the town of Dayton. Water slowly heats from Dayton to the Lewis and Clark State Park. The remaining portion of the Touchet from the park to the mouth is very warm, often in excess of 23ºC during the summer months.
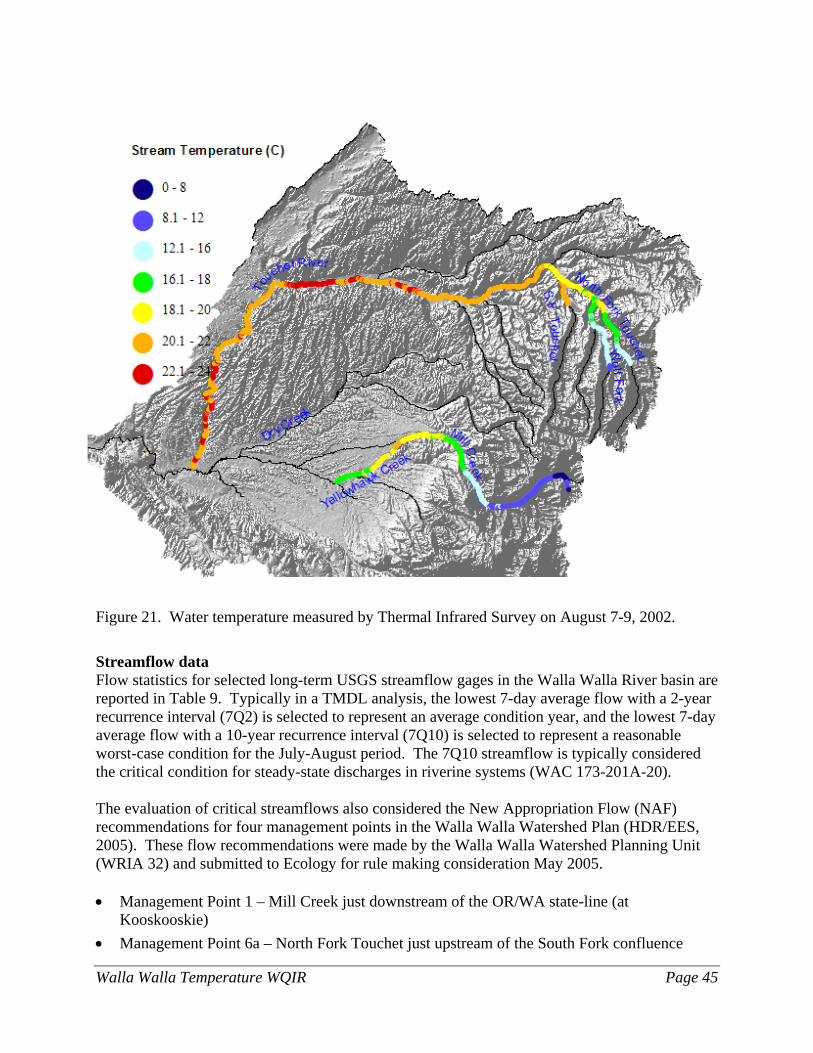
Walla Walla Temperature WQIR Page 45
Figure 21. Water temperature measured by Thermal Infrared Survey on August 7-9, 2002.
Streamflow data Flow statistics for selected long-term USGS streamflow gages in the Walla Walla River basin are reported in Table 9. Typically in a TMDL analysis, the lowest 7-day average flow with a 2-year recurrence interval (7Q2) is selected to represent an average condition year, and the lowest 7-day average flow with a 10-year recurrence interval (7Q10) is selected to represent a reasonable worst-case condition for the July-August period. The 7Q10 streamflow is typically considered the critical condition for steady-state discharges in riverine systems (WAC 173-201A-20). The evaluation of critical streamflows also considered the New Appropriation Flow (NAF) recommendations for four management points in the Walla Walla Watershed Plan (HDR/EES, 2005). These flow recommendations were made by the Walla Walla Watershed Planning Unit (WRIA 32) and submitted to Ecology for rule making consideration May 2005. • Management Point 1 – Mill Creek just downstream of the OR/WA state-line (at
Kooskooskie) • Management Point 6a – North Fork Touchet just upstream of the South Fork confluence
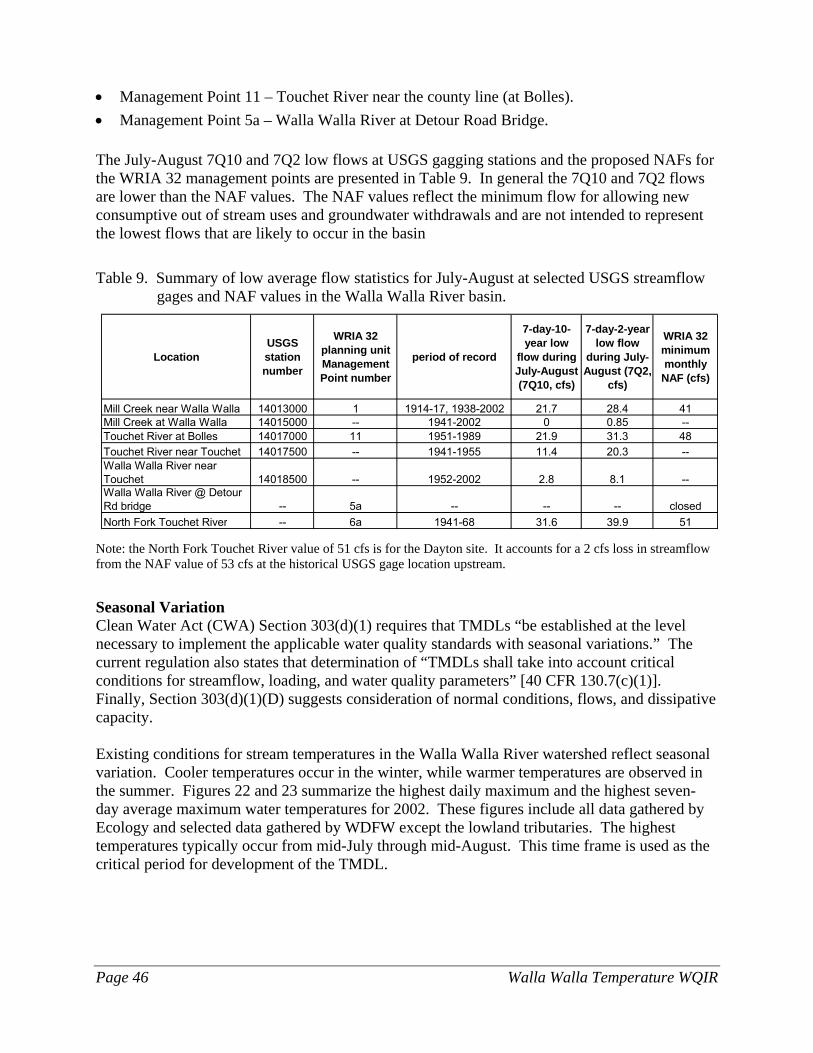
Page 46 Walla Walla Temperature WQIR
• Management Point 11 – Touchet River near the county line (at Bolles). • Management Point 5a – Walla Walla River at Detour Road Bridge. The July-August 7Q10 and 7Q2 low flows at USGS gagging stations and the proposed NAFs for the WRIA 32 management points are presented in Table 9. In general the 7Q10 and 7Q2 flows are lower than the NAF values. The NAF values reflect the minimum flow for allowing new consumptive out of stream uses and groundwater withdrawals and are not intended to represent the lowest flows that are likely to occur in the basin
Table 9. Summary of low average flow statistics for July-August at selected USGS streamflow gages and NAF values in the Walla Walla River basin.
Note: the North Fork Touchet River value of 51 cfs is for the Dayton site. It accounts for a 2 cfs loss in streamflow from the NAF value of 53 cfs at the historical USGS gage location upstream.
Seasonal Variation Clean Water Act (CWA) Section 303(d)(1) requires that TMDLs “be established at the level necessary to implement the applicable water quality standards with seasonal variations.” The current regulation also states that determination of “TMDLs shall take into account critical conditions for streamflow, loading, and water quality parameters” [40 CFR 130.7(c)(1)]. Finally, Section 303(d)(1)(D) suggests consideration of normal conditions, flows, and dissipative capacity. Existing conditions for stream temperatures in the Walla Walla River watershed reflect seasonal variation. Cooler temperatures occur in the winter, while warmer temperatures are observed in the summer. Figures 22 and 23 summarize the highest daily maximum and the highest seven-day average maximum water temperatures for 2002. These figures include all data gathered by Ecology and selected data gathered by WDFW except the lowland tributaries. The highest temperatures typically occur from mid-July through mid-August. This time frame is used as the critical period for development of the TMDL.
LocationUSGS station number
WRIA 32 planning unit Management Point number
period of record
7-day-10-year low
flow during July-August (7Q10, cfs)
7-day-2-year low flow
during July-August (7Q2,
cfs)
WRIA 32 minimum monthly
NAF (cfs)
Mill Creek near Walla Walla 14013000 1 1914-17, 1938-2002 21.7 28.4 41Mill Creek at Walla Walla 14015000 -- 1941-2002 0 0.85 --Touchet River at Bolles 14017000 11 1951-1989 21.9 31.3 48Touchet River near Touchet 14017500 -- 1941-1955 11.4 20.3 --Walla Walla River near Touchet 14018500 -- 1952-2002 2.8 8.1 --Walla Walla River @ Detour Rd bridge -- 5a -- -- -- closedNorth Fork Touchet River -- 6a 1941-68 31.6 39.9 51
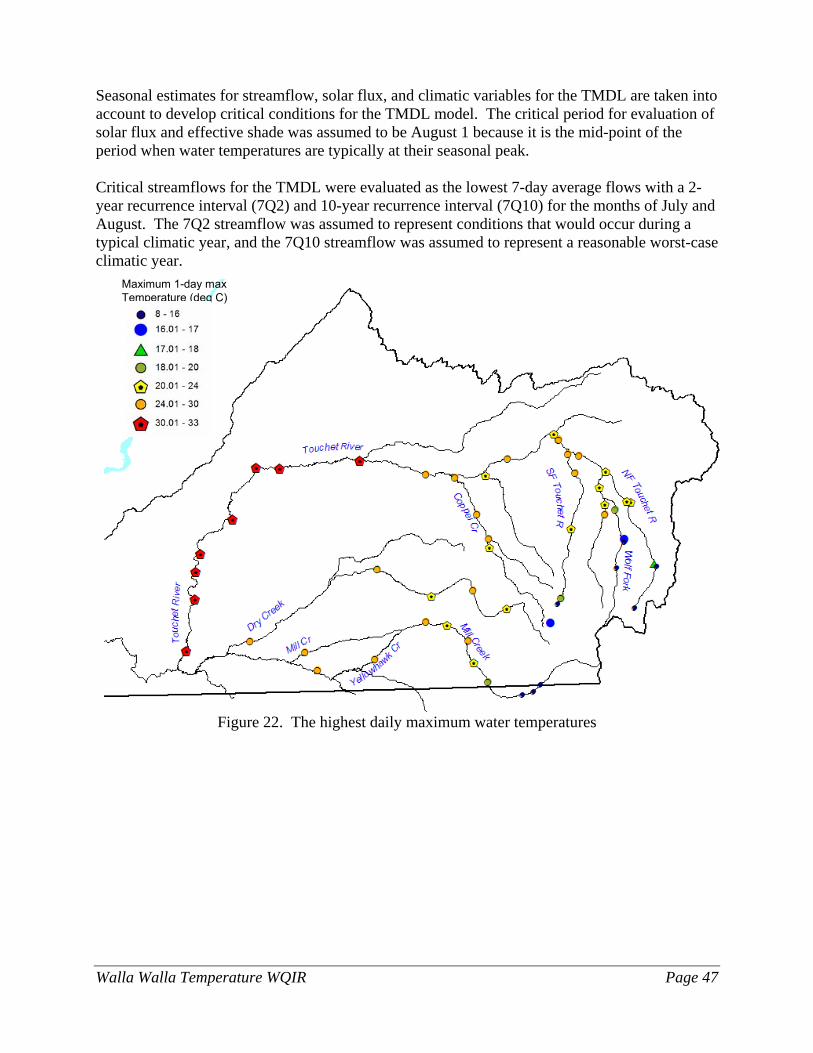
Walla Walla Temperature WQIR Page 47
Seasonal estimates for streamflow, solar flux, and climatic variables for the TMDL are taken into account to develop critical conditions for the TMDL model. The critical period for evaluation of solar flux and effective shade was assumed to be August 1 because it is the mid-point of the period when water temperatures are typically at their seasonal peak. Critical streamflows for the TMDL were evaluated as the lowest 7-day average flows with a 2-year recurrence interval (7Q2) and 10-year recurrence interval (7Q10) for the months of July and August. The 7Q2 streamflow was assumed to represent conditions that would occur during a typical climatic year, and the 7Q10 streamflow was assumed to represent a reasonable worst-case climatic year.
Maximum 1-day max Temperature (deg C)
Figure 22. The highest daily maximum water temperatures
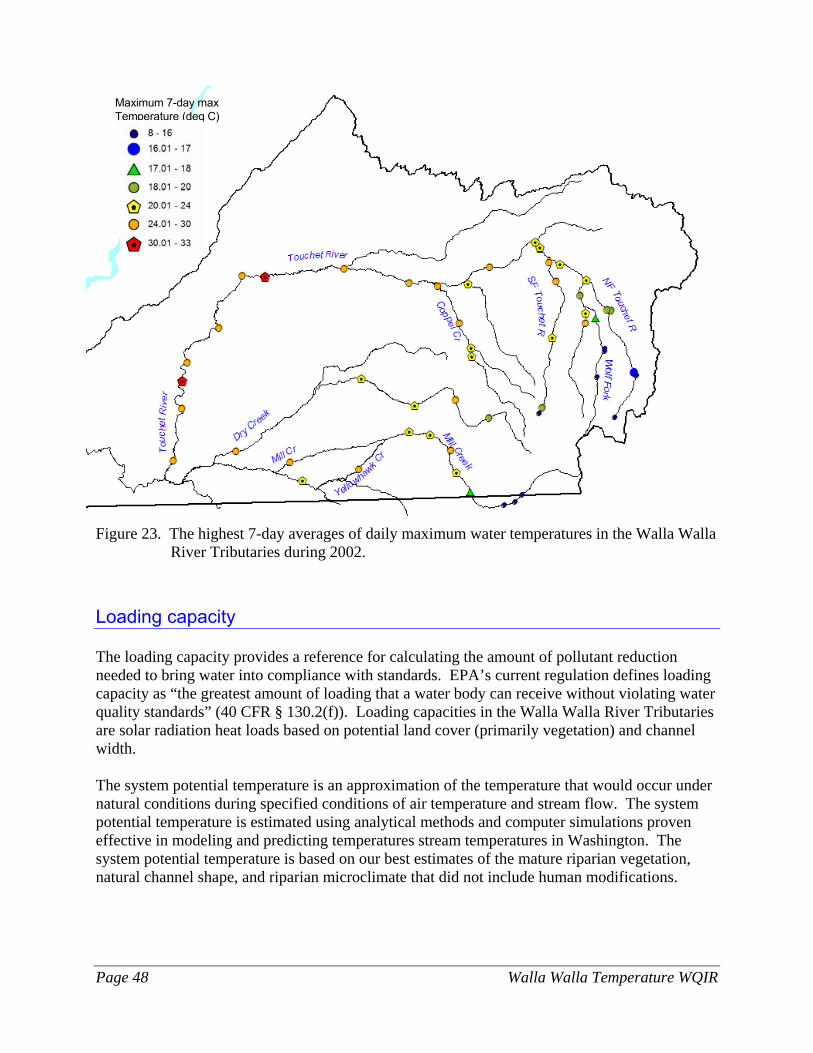
Page 48 Walla Walla Temperature WQIR
Maximum 7-day max Temperature (deg C)
Figure 23. The highest 7-day averages of daily maximum water temperatures in the Walla Walla
River Tributaries during 2002.
Loading capacity The loading capacity provides a reference for calculating the amount of pollutant reduction needed to bring water into compliance with standards. EPA’s current regulation defines loading capacity as “the greatest amount of loading that a water body can receive without violating water quality standards” (40 CFR § 130.2(f)). Loading capacities in the Walla Walla River Tributaries are solar radiation heat loads based on potential land cover (primarily vegetation) and channel width. The system potential temperature is an approximation of the temperature that would occur under natural conditions during specified conditions of air temperature and stream flow. The system potential temperature is estimated using analytical methods and computer simulations proven effective in modeling and predicting temperatures stream temperatures in Washington. The system potential temperature is based on our best estimates of the mature riparian vegetation, natural channel shape, and riparian microclimate that did not include human modifications.
Walla Walla Temperature WQIR Page 49
A system potential temperature is estimated for both an average year (50th percentiles of climate and low stream flows) and a critical condition year (upper 90th percentile air temperature and low flows that occur only once every ten years). The system potential temperature does not, however, replace the numeric criteria, nor invalidate the need to meet the numeric criteria at other times of the year and at other less extreme low flows and warm climatic conditions. At locations and times where the system potential temperature is greater than the numeric criterion assigned to the water body (e.g., 18ºC in Class A or 16ºC in Class AA waters), the loading capacity and load allocations in this TMDL are to be based on not allowing human sources to warm the water by more than an additional 0.3°C. In all waters where the system potential temperature is higher than the assigned criterion, maximum riparian shade and best channel and flow conditions possible are needed. The calibrated QUAL2Kw model was used to determine the loading capacity for effective shade for tributary streams in the Walla Walla River basin. Loading capacity was determined based on prediction of water temperatures under typical and extreme flow and climate conditions combined with a range of effective shade conditions. The lowest 7-day average flow with a 2-year recurrence interval (7Q2) was selected to represent a typical climatic year, and the lowest 7-day average flow with a 10-year recurrence interval (7Q10) was selected to represent a reasonable worst-case condition for the July-August period. Mill/Yellowhawk Creeks and Mainstem Touchet River Air temperature values for the 7Q2 condition were assumed to be represented by the average of the hottest week of 1997, which was the median condition from the historical record at Walla Walla. The air temperature values for the 7Q10 condition were the average of the hottest week of 1998, which was the 90th percentile condition from Walla Walla. The corresponding median and 90th percentile air temperature conditions for the near-stream conditions near the mouth of the Touchet River were calculated from measurements taken at the Touchet PAWS weather station during 1997 and 1998. Critical and average air temperatures for the remainder of the Touchet system were calculated by applying a regression equation to the Touchet PAWS temperature data. The Mill Creek/Yellowhawk Creek model utilized air temperatures measured at the Walla Walla PAWS station during 1997 and 1998. The Walla Walla PAWS station is located in the middle of the watershed near the confluence of Mill and Yellowhawk creeks. The results of the model runs at the system potential condition for the critical 7Q2 and 7Q10 conditions are presented in Figures 24 and 25. (Figure 24 shows modeling results when the beginning stream temperature is 18oC and the Dayton wastewater treatment plant is not included.) The current condition in the Walla Walla watershed is expected to result in daily maximum water temperatures that are greater than 18°C in most of the evaluated reaches. Under current riparian conditions, portions of the evaluated streams could be hotter than the approximate lethality threshold of 23°C for salmonids. The “lethality” limit or threshold is discussed in the following excerpt from an Ecology study (Hicks, 2002) that evaluates lethal temperatures for coldwater fish: “For evaluating the effects of discrete human actions, a 7-day average of the daily maximum temperatures greater than 22°C or a 1-day maximum greater than 23°C should be considered lethal to
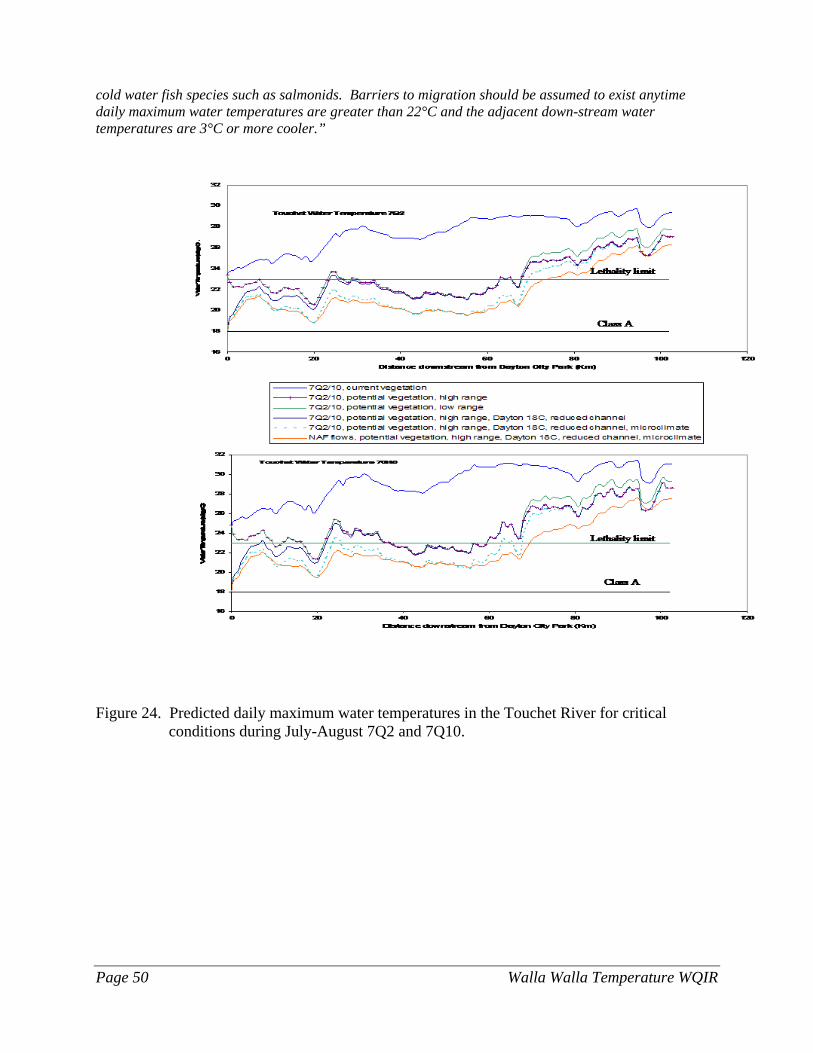
Page 50 Walla Walla Temperature WQIR
cold water fish species such as salmonids. Barriers to migration should be assumed to exist anytime daily maximum water temperatures are greater than 22°C and the adjacent down-stream water temperatures are 3°C or more cooler.”
Figure 24. Predicted daily maximum water temperatures in the Touchet River for critical conditions during July-August 7Q2 and 7Q10.
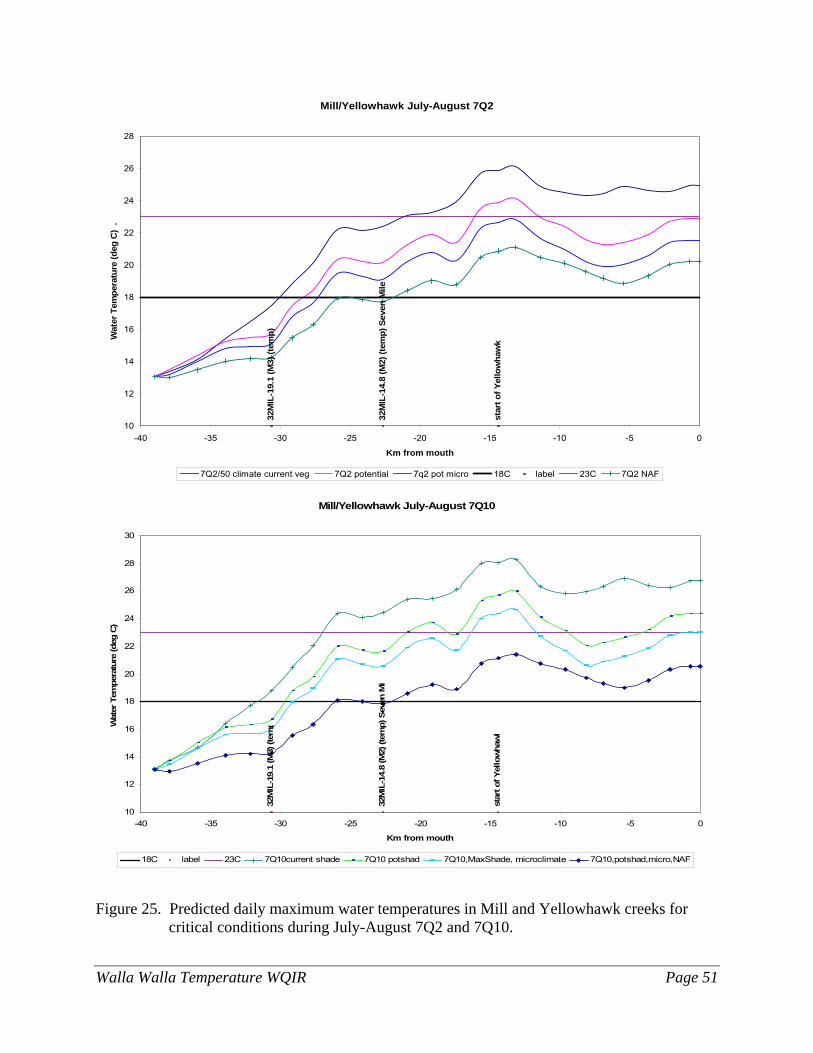
Walla Walla Temperature WQIR Page 51
Mill/Yellowhawk July-August 7Q2
star
t of Y
ello
wha
wk
32M
IL-1
4.8
(M2)
(tem
p) S
even
Mile
32M
IL-1
9.1
(M3)
(tem
p)
10
12
14
16
18
20
22
24
26
28
-40 -35 -30 -25 -20 -15 -10 -5 0
Km from mouth
Wat
er T
empe
ratu
re (d
eg C
) .
7Q2/50 climate current veg 7Q2 potential 7q2 pot micro 18C label 23C 7Q2 NAF Mill/Yellowhawk July-August 7Q10
32M
IL-1
9.1
(M3)
(tem
p
32M
IL-1
4.8
(M2)
(tem
p) S
even
Mi
star
t of Y
ello
wha
wk
10
12
14
16
18
20
22
24
26
28
30
-40 -35 -30 -25 -20 -15 -10 -5 0
Km from mouth
Wat
er T
empe
ratu
re (d
eg C
)
18C label 23C 7Q10current shade 7Q10 potshad 7Q10,MaxShade, microclimate 7Q10,potshad,micro,NAF
Figure 25. Predicted daily maximum water temperatures in Mill and Yellowhawk creeks for critical conditions during July-August 7Q2 and 7Q10.
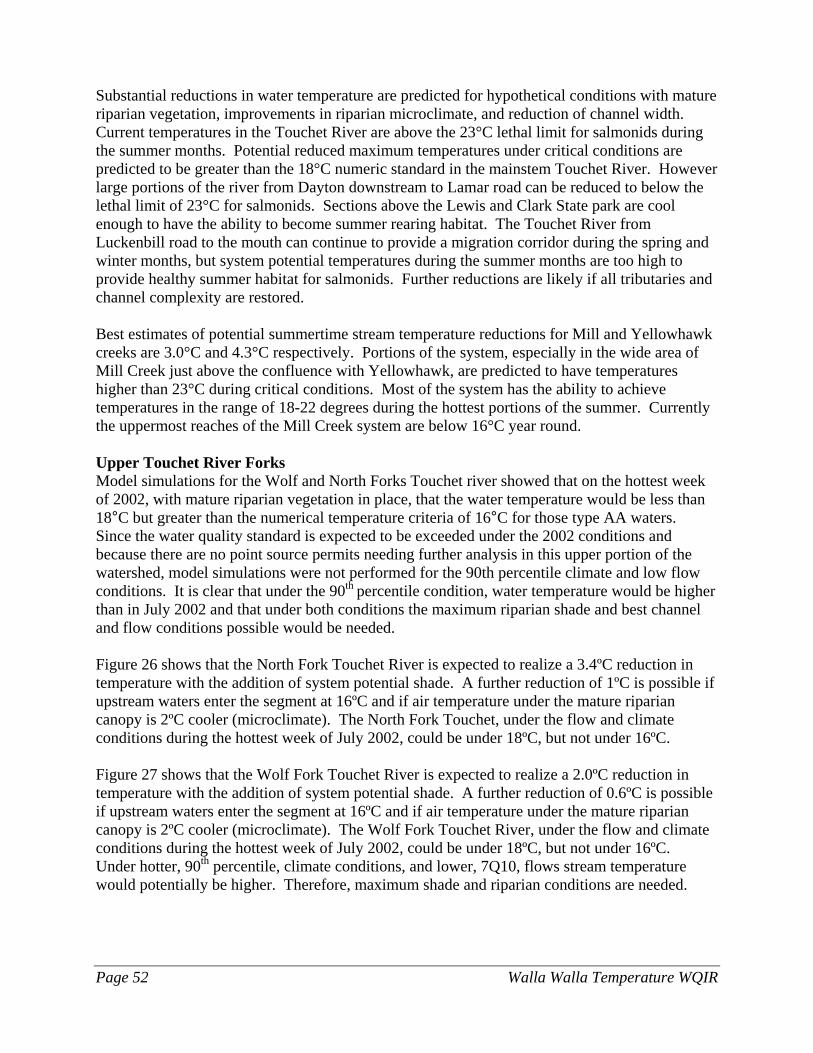
Page 52 Walla Walla Temperature WQIR
Substantial reductions in water temperature are predicted for hypothetical conditions with mature riparian vegetation, improvements in riparian microclimate, and reduction of channel width. Current temperatures in the Touchet River are above the 23°C lethal limit for salmonids during the summer months. Potential reduced maximum temperatures under critical conditions are predicted to be greater than the 18°C numeric standard in the mainstem Touchet River. However large portions of the river from Dayton downstream to Lamar road can be reduced to below the lethal limit of 23°C for salmonids. Sections above the Lewis and Clark State park are cool enough to have the ability to become summer rearing habitat. The Touchet River from Luckenbill road to the mouth can continue to provide a migration corridor during the spring and winter months, but system potential temperatures during the summer months are too high to provide healthy summer habitat for salmonids. Further reductions are likely if all tributaries and channel complexity are restored. Best estimates of potential summertime stream temperature reductions for Mill and Yellowhawk creeks are 3.0°C and 4.3°C respectively. Portions of the system, especially in the wide area of Mill Creek just above the confluence with Yellowhawk, are predicted to have temperatures higher than 23°C during critical conditions. Most of the system has the ability to achieve temperatures in the range of 18-22 degrees during the hottest portions of the summer. Currently the uppermost reaches of the Mill Creek system are below 16°C year round. Upper Touchet River Forks Model simulations for the Wolf and North Forks Touchet river showed that on the hottest week of 2002, with mature riparian vegetation in place, that the water temperature would be less than 18°C but greater than the numerical temperature criteria of 16°C for those type AA waters. Since the water quality standard is expected to be exceeded under the 2002 conditions and because there are no point source permits needing further analysis in this upper portion of the watershed, model simulations were not performed for the 90th percentile climate and low flow conditions. It is clear that under the 90th percentile condition, water temperature would be higher than in July 2002 and that under both conditions the maximum riparian shade and best channel and flow conditions possible would be needed. Figure 26 shows that the North Fork Touchet River is expected to realize a 3.4ºC reduction in temperature with the addition of system potential shade. A further reduction of 1ºC is possible if upstream waters enter the segment at 16ºC and if air temperature under the mature riparian canopy is 2ºC cooler (microclimate). The North Fork Touchet, under the flow and climate conditions during the hottest week of July 2002, could be under 18ºC, but not under 16ºC. Figure 27 shows that the Wolf Fork Touchet River is expected to realize a 2.0ºC reduction in temperature with the addition of system potential shade. A further reduction of 0.6ºC is possible if upstream waters enter the segment at 16ºC and if air temperature under the mature riparian canopy is 2ºC cooler (microclimate). The Wolf Fork Touchet River, under the flow and climate conditions during the hottest week of July 2002, could be under 18ºC, but not under 16ºC. Under hotter, 90th percentile, climate conditions, and lower, 7Q10, flows stream temperature would potentially be higher. Therefore, maximum shade and riparian conditions are needed.
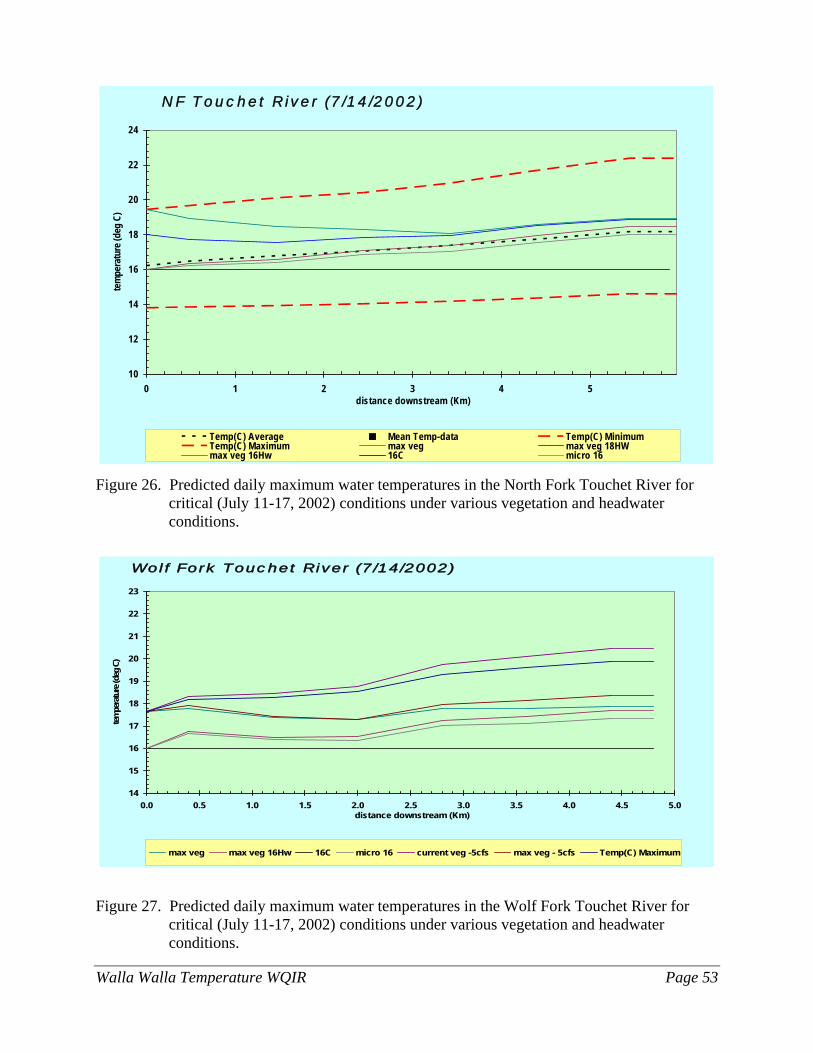
Walla Walla Temperature WQIR Page 53
NF Touchet River (7/14/2002)
10
12
14
16
18
20
22
24
0 1 2 3 4 5distance downstream (Km)
tem
pera
ture
(deg
C)
Temp(C) Average Mean Temp-data Temp(C) MinimumTemp(C) Maximum max veg max veg 18HWmax veg 16Hw 16C micro 16
Figure 26. Predicted daily maximum water temperatures in the North Fork Touchet River for critical (July 11-17, 2002) conditions under various vegetation and headwater conditions.
Wolf Fork Touchet River (7/14/2002)
14
15
16
17
18
19
20
21
22
23
0.0 0.5 1.0 1.5 2.0 2.5 3.0 3.5 4.0 4.5 5.0distance downstream (Km)
tem
pera
ture
(deg
C)
max veg max veg 16Hw 16C micro 16 current veg -5cfs max veg - 5cfs Temp(C) Maximum
Figure 27. Predicted daily maximum water temperatures in the Wolf Fork Touchet River for critical (July 11-17, 2002) conditions under various vegetation and headwater conditions.
Page 54 Walla Walla Temperature WQIR
Load allocations Load allocations (for nonpoint sources) and wasteload allocations (for point sources) are established in this TMDL to meet both the numeric threshold criteria, and the allowances for human warming under conditions that are naturally warmer than those criteria. Since system potential water temperatures would not meet numeric water quality standards during the hottest period of the year throughout most of the Walla Walla basin, there is a widespread need to achieve maximum protection from direct solar radiation. An exception to this may be the portion of Mill Creek located in the preserved watershed above the city of Walla Walla diversion dam in Oregon. (Upstream of the diversion dam in Washington, Mill Creek is located within the Umatilla National Forest.) This section of Mill Creek currently meets the numeric water quality standard of 16°C year round. The highest seven-day-average maximum (7-DADMax) temperature measured at the site immediately upstream of the dam was 13.8°C during the summer of 2002. However, due to bull trout using this portion of the watershed for spawning, the water quality criteria for upper Mill Creek changed to 12°C in the 2006 revised state water quality standards. The load allocation for all streams in the Walla Walla tributaries study area located below the USFS boundary and the city of Walla Walla diversion dam on Mill Creek is the effective shade that would occur from system potential mature riparian vegetation. System potential mature riparian vegetation is defined as: that vegetation which can grow and reproduce on a site, given: climate, elevation, soil properties, plant biology and hydrologic processes. Load allocations for effective shade are quantified in Appendix D for the Touchet River, Mill Creek and Yellowhawk Creek. For lowland perennial streams in the watershed, the load allocations for shade are represented in Figure 28 (the next three pages). Perennial streams include those that would naturally have flow year round but are currently dry part of the year due to withdrawals. The load allocations are based on the estimated relationship between shade, channel width, and stream aspect at the assumed maximum riparian vegetation condition (shown in Figure 19 and Table 6). The importance of shade decreases as the width of the channel increases. The load allocations are expected to result in water temperatures that are equivalent to the temperatures that would occur under natural conditions. Therefore, the load allocations are expected to result in water temperatures that meet the water quality standard. This TMDL should also achieve compliance with the 2006 water quality standards since load allocations are expected to result in stream temperatures found under natural conditions. Establishment of mature riparian vegetation is also expected to have a secondary benefit of reducing channel widths. Narrower stream channels result in less stream surface area exposed to solar radiation. So, channel width reductions result in higher “effective shade” load allocations. For this TMDL, channel width load allocations are not assigned but are taken into consideration in the effective shade allocations.
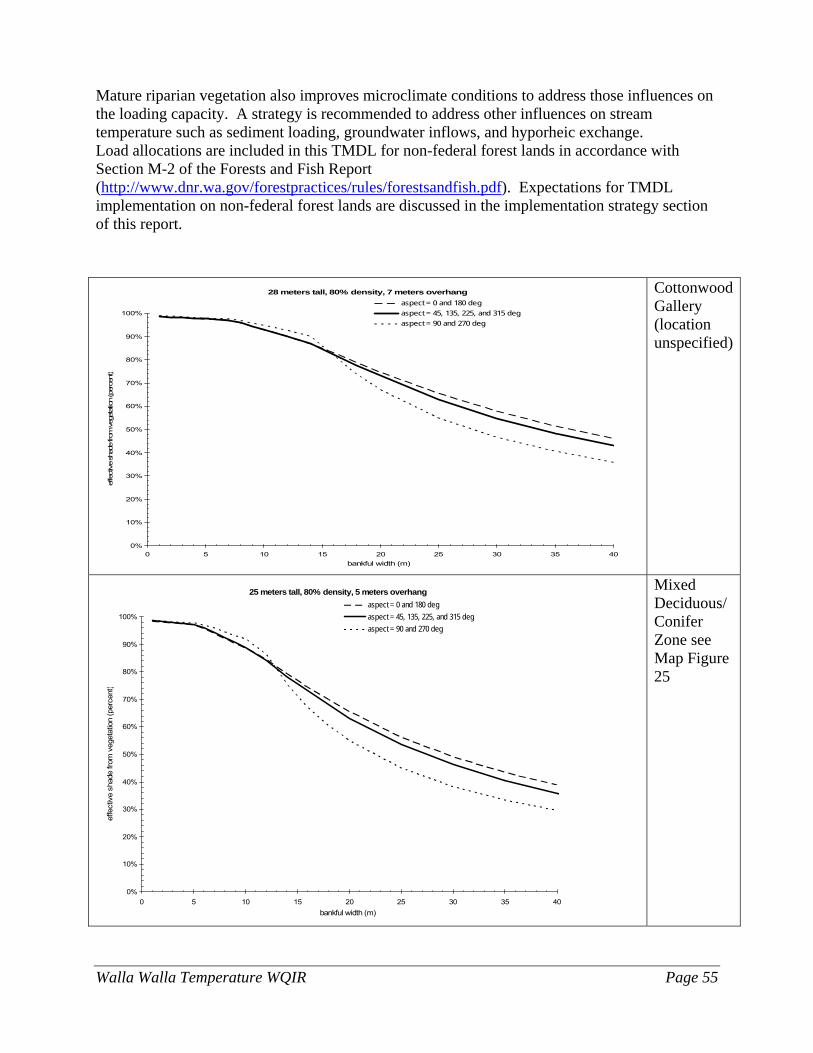
Walla Walla Temperature WQIR Page 55
Mature riparian vegetation also improves microclimate conditions to address those influences on the loading capacity. A strategy is recommended to address other influences on stream temperature such as sediment loading, groundwater inflows, and hyporheic exchange. Load allocations are included in this TMDL for non-federal forest lands in accordance with Section M-2 of the Forests and Fish Report (http://www.dnr.wa.gov/forestpractices/rules/forestsandfish.pdf). Expectations for TMDL implementation on non-federal forest lands are discussed in the implementation strategy section of this report.
28 meters tall, 80% density, 7 meters overhang
0%
10%
20%
30%
40%
50%
60%
70%
80%
90%
100%
0 5 10 15 20 25 30 35 40bankful width (m)
effective sh
ade
from
veg
etation (p
erce
nt)
aspect = 0 and 180 degaspect = 45, 135, 225, and 315 degaspect = 90 and 270 deg
Cottonwood Gallery (location unspecified)
25 meters tall, 80% density, 5 meters overhang
0%
10%
20%
30%
40%
50%
60%
70%
80%
90%
100%
0 5 10 15 20 25 30 35 40bankful width (m)
effe
ctiv
e sh
ade
from
veg
etat
ion
(per
cent
)
aspect = 0 and 180 degaspect = 45, 135, 225, and 315 degaspect = 90 and 270 deg
Mixed Deciduous/ Conifer Zone see Map Figure 25
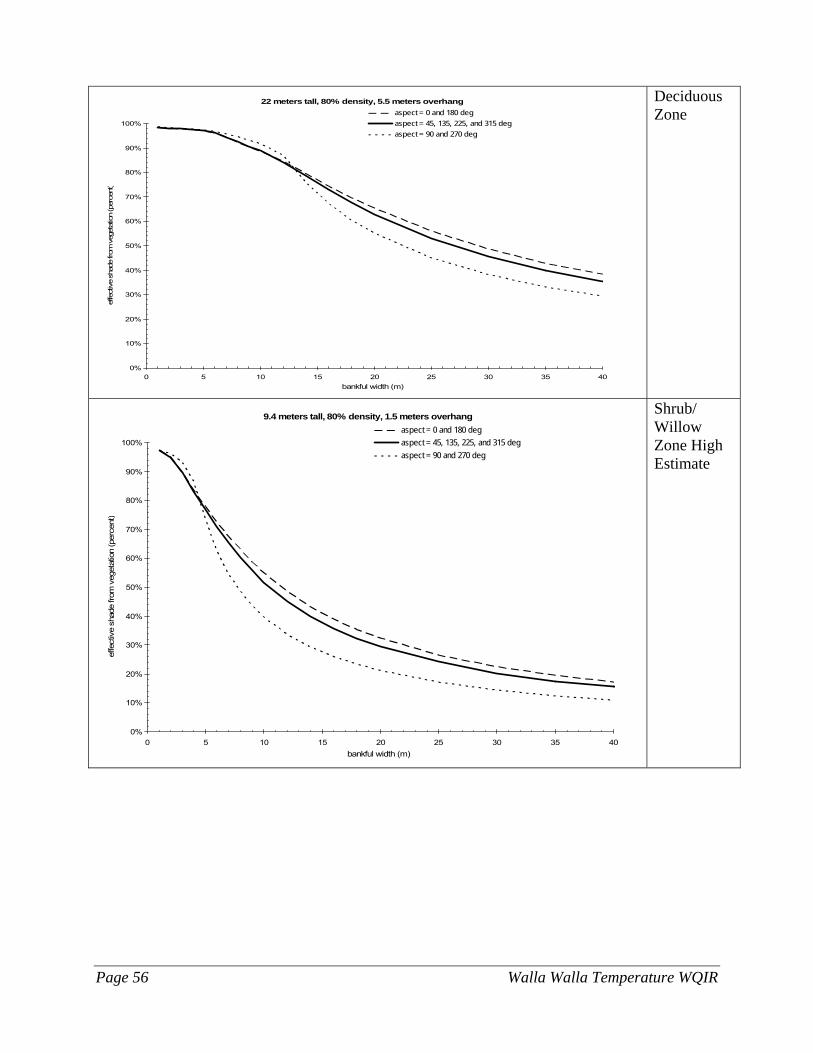
Page 56 Walla Walla Temperature WQIR
22 meters tall, 80% density, 5.5 meters overhang
0%
10%
20%
30%
40%
50%
60%
70%
80%
90%
100%
0 5 10 15 20 25 30 35 40bankful width (m)
effe
ctive
shad
e fro
m v
eget
ation
(per
cent
)aspect = 0 and 180 degaspect = 45, 135, 225, and 315 degaspect = 90 and 270 deg
Deciduous Zone
9.4 meters tall, 80% density, 1.5 meters overhang
0%
10%
20%
30%
40%
50%
60%
70%
80%
90%
100%
0 5 10 15 20 25 30 35 40bankful width (m)
effe
ctiv
e sh
ade
from
veg
etat
ion
(per
cent
)
aspect = 0 and 180 degaspect = 45, 135, 225, and 315 degaspect = 90 and 270 deg
Shrub/ Willow Zone High Estimate
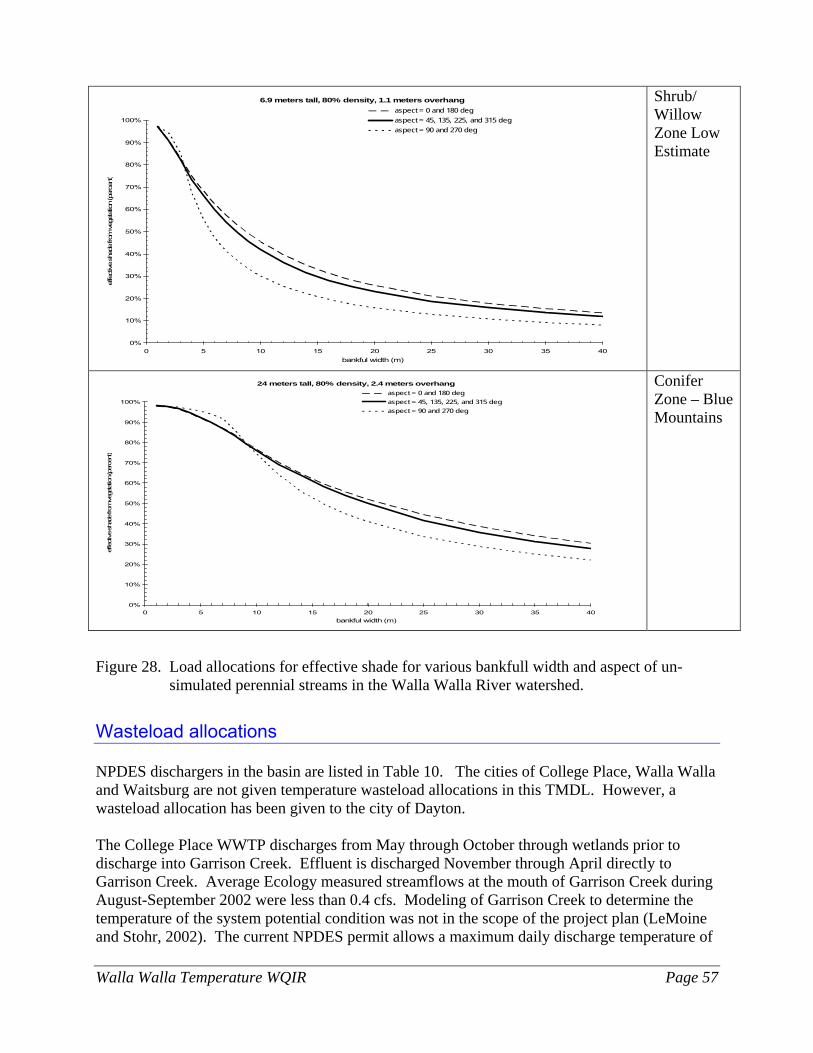
Walla Walla Temperature WQIR Page 57
6.9 meters tall, 80% density, 1.1 meters overhang
0%
10%
20%
30%
40%
50%
60%
70%
80%
90%
100%
0 5 10 15 20 25 30 35 40bankful width (m)
effective sh
ade fro
m veg
etation (p
erce
nt)
aspect = 0 and 180 degaspect = 45, 135, 225, and 315 degaspect = 90 and 270 deg
Shrub/ Willow Zone Low Estimate
24 meters tall, 80% density, 2.4 meters overhang
0%
10%
20%
30%
40%
50%
60%
70%
80%
90%
100%
0 5 10 15 20 25 30 35 40bankful width (m)
effective sh
ade fro
m veg
etation (perce
nt)
aspect = 0 and 180 degaspect = 45, 135, 225, and 315 degaspect = 90 and 270 deg
Conifer Zone – Blue Mountains
Figure 28. Load allocations for effective shade for various bankfull width and aspect of un-simulated perennial streams in the Walla Walla River watershed.
Wasteload allocations NPDES dischargers in the basin are listed in Table 10. The cities of College Place, Walla Walla and Waitsburg are not given temperature wasteload allocations in this TMDL. However, a wasteload allocation has been given to the city of Dayton. The College Place WWTP discharges from May through October through wetlands prior to discharge into Garrison Creek. Effluent is discharged November through April directly to Garrison Creek. Average Ecology measured streamflows at the mouth of Garrison Creek during August-September 2002 were less than 0.4 cfs. Modeling of Garrison Creek to determine the temperature of the system potential condition was not in the scope of the project plan (LeMoine and Stohr, 2002). The current NPDES permit allows a maximum daily discharge temperature of
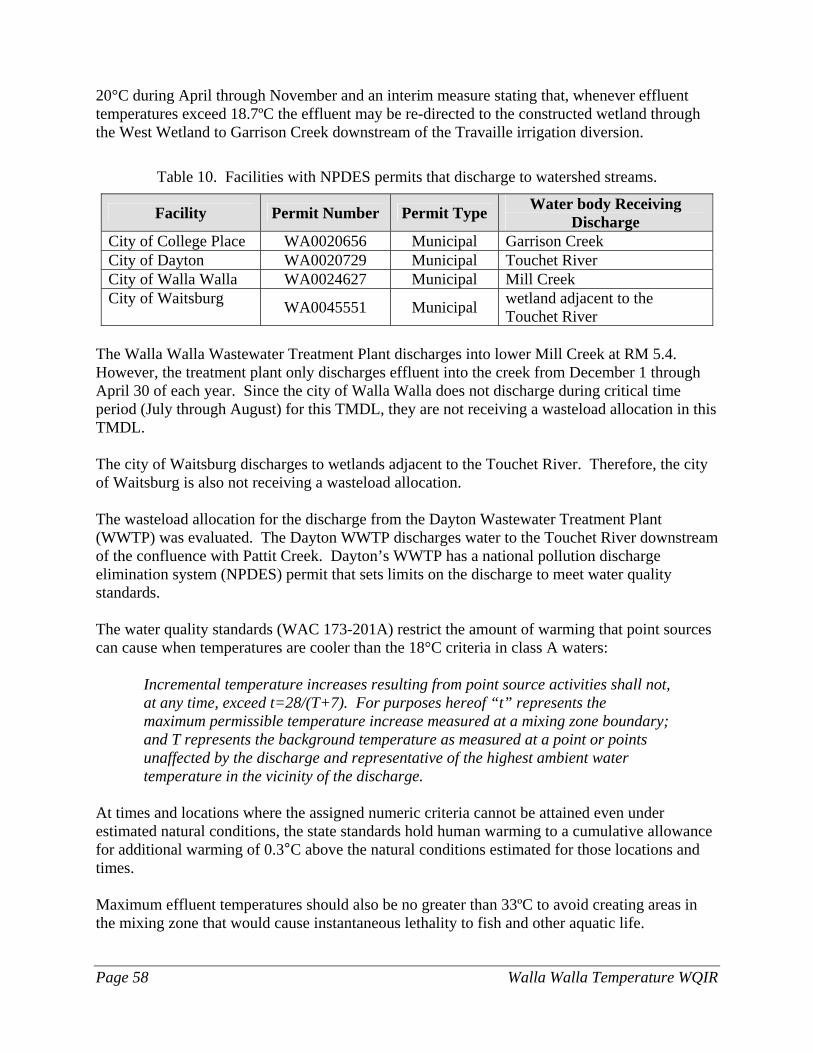
Page 58 Walla Walla Temperature WQIR
20°C during April through November and an interim measure stating that, whenever effluent temperatures exceed 18.7ºC the effluent may be re-directed to the constructed wetland through the West Wetland to Garrison Creek downstream of the Travaille irrigation diversion.
Table 10. Facilities with NPDES permits that discharge to watershed streams.
Facility Permit Number Permit Type Water body Receiving Discharge
City of College Place WA0020656 Municipal Garrison Creek City of Dayton WA0020729 Municipal Touchet River City of Walla Walla WA0024627 Municipal Mill Creek City of Waitsburg WA0045551 Municipal wetland adjacent to the
Touchet River The Walla Walla Wastewater Treatment Plant discharges into lower Mill Creek at RM 5.4. However, the treatment plant only discharges effluent into the creek from December 1 through April 30 of each year. Since the city of Walla Walla does not discharge during critical time period (July through August) for this TMDL, they are not receiving a wasteload allocation in this TMDL. The city of Waitsburg discharges to wetlands adjacent to the Touchet River. Therefore, the city of Waitsburg is also not receiving a wasteload allocation. The wasteload allocation for the discharge from the Dayton Wastewater Treatment Plant (WWTP) was evaluated. The Dayton WWTP discharges water to the Touchet River downstream of the confluence with Pattit Creek. Dayton’s WWTP has a national pollution discharge elimination system (NPDES) permit that sets limits on the discharge to meet water quality standards. The water quality standards (WAC 173-201A) restrict the amount of warming that point sources can cause when temperatures are cooler than the 18°C criteria in class A waters:
Incremental temperature increases resulting from point source activities shall not, at any time, exceed t=28/(T+7). For purposes hereof “t” represents the maximum permissible temperature increase measured at a mixing zone boundary; and T represents the background temperature as measured at a point or points unaffected by the discharge and representative of the highest ambient water temperature in the vicinity of the discharge.
At times and locations where the assigned numeric criteria cannot be attained even under estimated natural conditions, the state standards hold human warming to a cumulative allowance for additional warming of 0.3°C above the natural conditions estimated for those locations and times. Maximum effluent temperatures should also be no greater than 33ºC to avoid creating areas in the mixing zone that would cause instantaneous lethality to fish and other aquatic life.
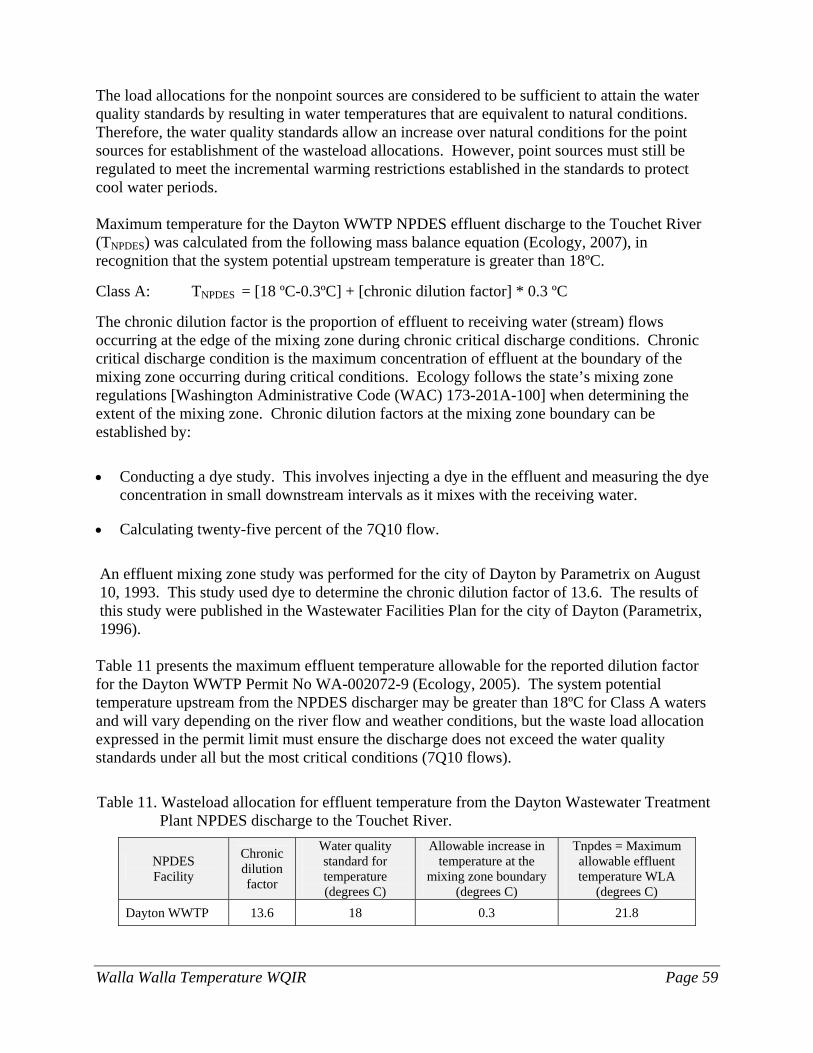
Walla Walla Temperature WQIR Page 59
The load allocations for the nonpoint sources are considered to be sufficient to attain the water quality standards by resulting in water temperatures that are equivalent to natural conditions. Therefore, the water quality standards allow an increase over natural conditions for the point sources for establishment of the wasteload allocations. However, point sources must still be regulated to meet the incremental warming restrictions established in the standards to protect cool water periods. Maximum temperature for the Dayton WWTP NPDES effluent discharge to the Touchet River (TNPDES) was calculated from the following mass balance equation (Ecology, 2007), in recognition that the system potential upstream temperature is greater than 18ºC. Class A: TNPDES = [18 ºC-0.3ºC] + [chronic dilution factor] * 0.3 ºC The chronic dilution factor is the proportion of effluent to receiving water (stream) flows occurring at the edge of the mixing zone during chronic critical discharge conditions. Chronic critical discharge condition is the maximum concentration of effluent at the boundary of the mixing zone occurring during critical conditions. Ecology follows the state’s mixing zone regulations [Washington Administrative Code (WAC) 173-201A-100] when determining the extent of the mixing zone. Chronic dilution factors at the mixing zone boundary can be established by:
• Conducting a dye study. This involves injecting a dye in the effluent and measuring the dye concentration in small downstream intervals as it mixes with the receiving water.
• Calculating twenty-five percent of the 7Q10 flow.
An effluent mixing zone study was performed for the city of Dayton by Parametrix on August 10, 1993. This study used dye to determine the chronic dilution factor of 13.6. The results of this study were published in the Wastewater Facilities Plan for the city of Dayton (Parametrix, 1996). Table 11 presents the maximum effluent temperature allowable for the reported dilution factor for the Dayton WWTP Permit No WA-002072-9 (Ecology, 2005). The system potential temperature upstream from the NPDES discharger may be greater than 18ºC for Class A waters and will vary depending on the river flow and weather conditions, but the waste load allocation expressed in the permit limit must ensure the discharge does not exceed the water quality standards under all but the most critical conditions (7Q10 flows).
Table 11. Wasteload allocation for effluent temperature from the Dayton Wastewater Treatment Plant NPDES discharge to the Touchet River.
NPDES Facility
Chronic dilution factor
Water quality standard for temperature (degrees C)
Allowable increase in temperature at the
mixing zone boundary (degrees C)
Tnpdes = Maximum allowable effluent temperature WLA
(degrees C) Dayton WWTP 13.6 18 0.3 21.8
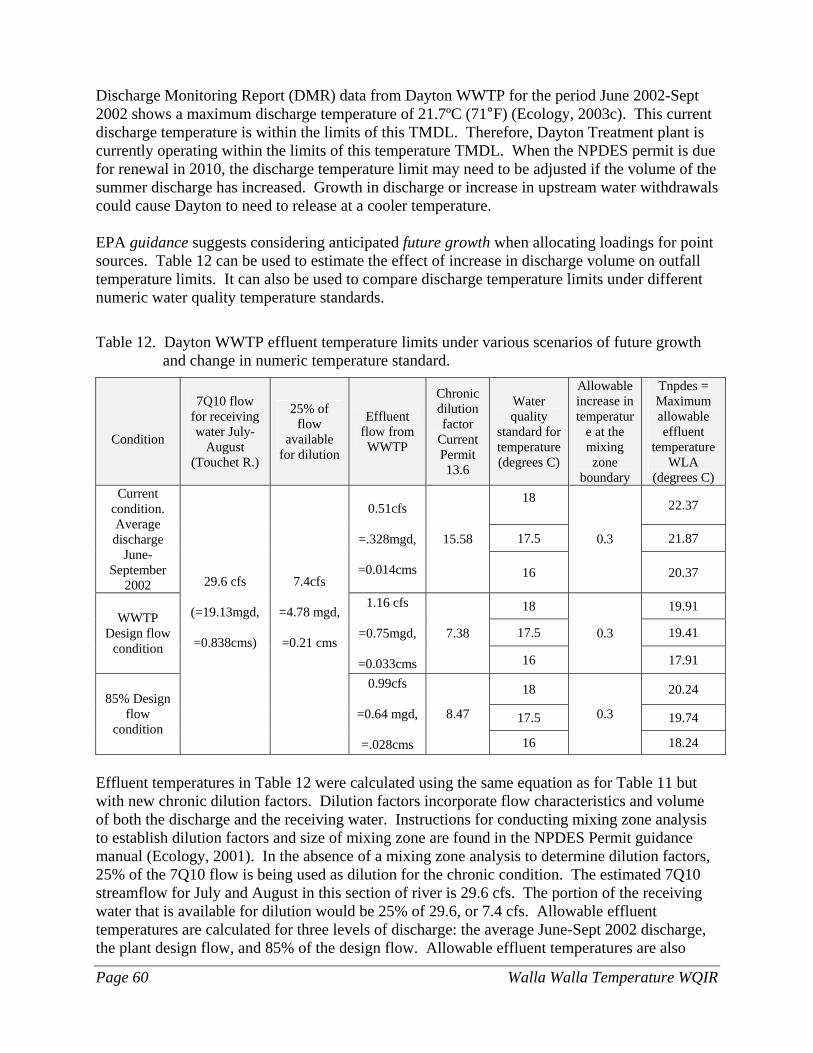
Page 60 Walla Walla Temperature WQIR
Discharge Monitoring Report (DMR) data from Dayton WWTP for the period June 2002-Sept 2002 shows a maximum discharge temperature of 21.7ºC (71°F) (Ecology, 2003c). This current discharge temperature is within the limits of this TMDL. Therefore, Dayton Treatment plant is currently operating within the limits of this temperature TMDL. When the NPDES permit is due for renewal in 2010, the discharge temperature limit may need to be adjusted if the volume of the summer discharge has increased. Growth in discharge or increase in upstream water withdrawals could cause Dayton to need to release at a cooler temperature. EPA guidance suggests considering anticipated future growth when allocating loadings for point sources. Table 12 can be used to estimate the effect of increase in discharge volume on outfall temperature limits. It can also be used to compare discharge temperature limits under different numeric water quality temperature standards.
Table 12. Dayton WWTP effluent temperature limits under various scenarios of future growth and change in numeric temperature standard.
Condition
7Q10 flow for receiving water July-
August (Touchet R.)
25% of flow
available for dilution
Effluent flow from WWTP
Chronic dilution factor
Current Permit 13.6
Water quality
standard for temperature (degrees C)
Allowable increase in temperatur
e at the mixing zone
boundary
Tnpdes = Maximum allowable effluent
temperature WLA
(degrees C) 18
22.37
17.5 21.87
Current condition. Average discharge
June-September
2002
0.51cfs
=.328mgd,
=0.014cms
15.58
16
0.3
20.37
18 19.91
17.5 19.41 WWTP
Design flow condition
1.16 cfs
=0.75mgd,
=0.033cms
7.38
16
0.3
17.91
18 20.24
17.5 19.74 85% Design
flow condition
29.6 cfs
(=19.13mgd,
=0.838cms)
7.4cfs
=4.78 mgd,
=0.21 cms
0.99cfs
=0.64 mgd,
=.028cms
8.47
16
0.3
18.24
Effluent temperatures in Table 12 were calculated using the same equation as for Table 11 but with new chronic dilution factors. Dilution factors incorporate flow characteristics and volume of both the discharge and the receiving water. Instructions for conducting mixing zone analysis to establish dilution factors and size of mixing zone are found in the NPDES Permit guidance manual (Ecology, 2001). In the absence of a mixing zone analysis to determine dilution factors, 25% of the 7Q10 flow is being used as dilution for the chronic condition. The estimated 7Q10 streamflow for July and August in this section of river is 29.6 cfs. The portion of the receiving water that is available for dilution would be 25% of 29.6, or 7.4 cfs. Allowable effluent temperatures are calculated for three levels of discharge: the average June-Sept 2002 discharge, the plant design flow, and 85% of the design flow. Allowable effluent temperatures are also
Walla Walla Temperature WQIR Page 61
calculated using the equation above and three numeric WQ standards. Dilution factors for this analysis are calculated using the following equation from mixing zone guidance (Ecology, 2006b) DF = (Qa +Qe) Qe Where: DF = volumetric dilution factor Qa = receiving water design flow (e.g., 25% of 7Q10) Qe = effluent design flow
Conclusions and recommendations 1. A buffer of mature riparian vegetation along the banks of the rivers is expected to decrease
the average daily maximum temperatures. At 7Q10 flow conditions, a 4.6ºC reduction is expected for the Touchet River. Significant reductions of 1.7ºC and 2.9ºC are expected for Upper Mill Creek and Yellowhawk Creek, respectively.
2. The changes in microclimate conditions associated with mature riparian vegetation could further lower the daily average maximum water temperature by about 1.0ºC.
3. Improvements in riparian vegetation above kilometer 60 in the Touchet River system can reduce temperatures below the lethal limit to salmonids although daily highs will still not be healthy for salmonids. Below the 60 kilometer marker (between Luckenbill and Lamar roads) water temperatures during the July-August time period are expected to be very high except in localized areas of groundwater input.
4. A reduction of the widest areas in the channel to a maximum of 41m (120 feet) in the Touchet River results in little reduction of temperature, because the channel at those locations is still difficult to shade.
5. The addition of streamflow to recommended NAF levels led to a further decrease in the maximum (across all reaches) simulated water temperature ranging from 0.7ºC in the Touchet to 2.2ºC in the Mill Creek/Yellowhawk Creek system.
6. With all management scenarios in place (those listed in 1 through 5 above), the overall decrease in the average maximum temperature for the simulated critical condition ranged from 4.6ºC to 6.6ºC, with average of 5.9ºC.
7. The North Fork Touchet River is expected to realize a 3.4ºC reduction in temperature with the addition of system potential shade. A further reduction of 1ºC is possible if cooler upstream waters enter the segment at 16ºC and if air temperature under the riparian canopy (microclimate) is 2ºC cooler.
8. The Wolf Fork Touchet River is expected to realize a 2.0ºC reduction in temperature with the addition of system potential shade. A further reduction of 0.6ºC is possible if cooler upstream waters enter the segment at 16ºC and if air temperature under the riparian canopy (microclimate) is 2ºC cooler.
Page 62 Walla Walla Temperature WQIR
Other recommendations
• The South Fork Touchet River has much higher stream temperatures than the North and Wolf Forks. System potential shade is required to reduce stream temperatures. The stream substrate in the South Fork site sampled by Ecology was primarily bedrock. Because of the lack of cobble and gravels to encourage subsurface streamflow and exchange, the South Fork likely will not be able to reach temperatures as low as those found in the other upper forks.
• Mill Creek channel widths were not reduced (as they were for the Touchet) because of
difficulty in predicting a restored channel width. Numerous flood control measures are in place, and water diversions at both the drinking water intake and at Bennington Dam normalize flows during portions of the year. Additional simulations could be performed to estimate further temperature reductions associated with a narrower channel. However, recommended restoration measures for system potential conditions will be the same under either scenario because temperatures under critical conditions exceed the numeric water quality standard.
• The Upper Touchet River subbasin is a vulnerable system. Current conditions are supporting
communities of bull trout. Improvements in shading should increase the usable area by salmonids. This system will be very vulnerable to development that impacts or removes riparian shading, reduces streamflow, or results in channel alterations, such as diking, that would reduce channel complexity.
Currently the Wolf Fork and North Fork Touchet streams are staying cooler than some systems with similar levels of shading because of a high level of intergravel mixing and contact with cooler springs and groundwater. Reduction in summer flows, reduction in spring input, or increase of fine sediment in the gravel and cobbles could cause this system to heat instead of maintaining or improving temperature. Further development should favor off stream setbacks to sustain as natural a riparian corridor as possible, and maintenance of summer streamflows at the current level.
• Channel widths were not reduced in the upper forks. Because flood events are fairly
common, reduction of channel widths may or may not be a byproduct of adding riparian vegetation that would stabilize the banks. If restoration results in healthy channels that are narrower or deeper with proper sinuosity, the cooling effects may be larger than those shown with the temperature model. Research generally shows that it is not the large floods that control channel shape (ODEQ, 2005):
Within the Walla Walla Basin, research has identified the bankfull discharge recurrence interval for the Walla Walla River, based on the Touchet gage-site on the Walla Walla River (1.03 year) and the Touchet River (1.15 year) gage-site (Castro and Jackson, 2001). A 100-year flood occurred during 1996. Research conducted following the 100-year 1996 flood (Clifton, et. al, 1999) stated that channel adjustments in cross section area, volume of stored sediment, and particle size distributions appear to be more related to reach-level controls such as large wood jams and local mass wasting sources than to overall flood magnitude. Locally channels may be modified by a 25-100 year flood, but overall it is not the large floods
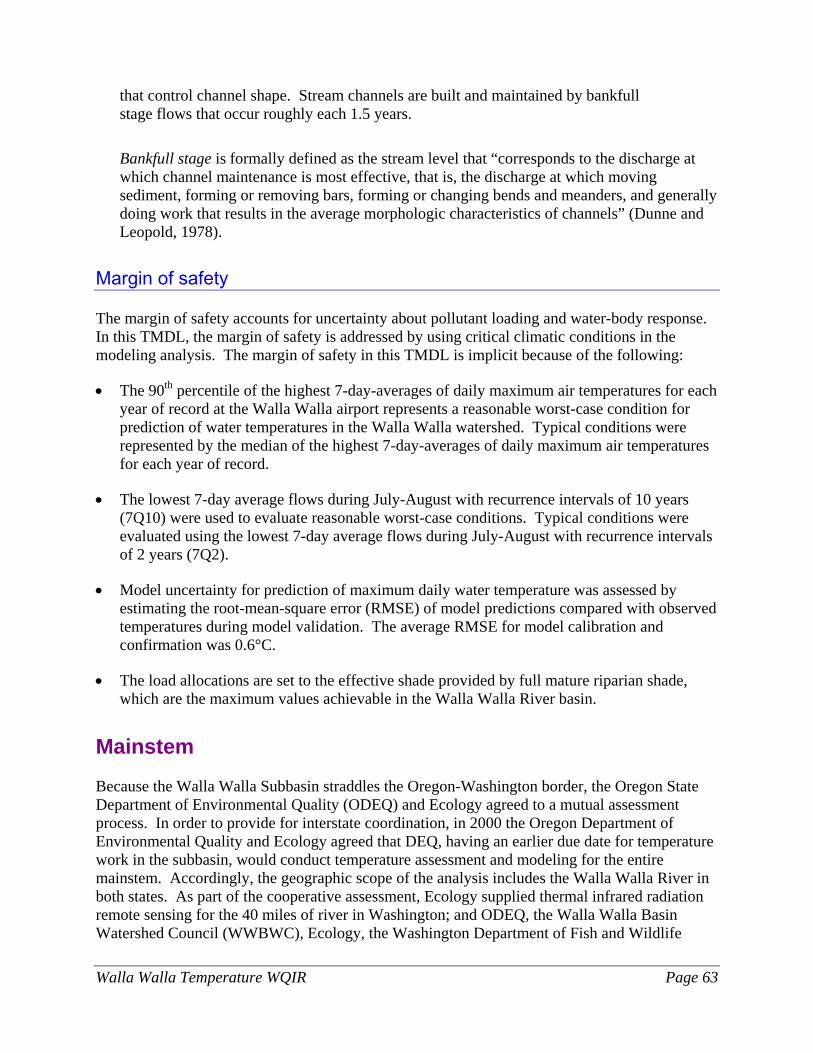
Walla Walla Temperature WQIR Page 63
that control channel shape. Stream channels are built and maintained by bankfull stage flows that occur roughly each 1.5 years.
Bankfull stage is formally defined as the stream level that “corresponds to the discharge at which channel maintenance is most effective, that is, the discharge at which moving sediment, forming or removing bars, forming or changing bends and meanders, and generally doing work that results in the average morphologic characteristics of channels” (Dunne and Leopold, 1978).
Margin of safety The margin of safety accounts for uncertainty about pollutant loading and water-body response. In this TMDL, the margin of safety is addressed by using critical climatic conditions in the modeling analysis. The margin of safety in this TMDL is implicit because of the following:
• The 90th percentile of the highest 7-day-averages of daily maximum air temperatures for each year of record at the Walla Walla airport represents a reasonable worst-case condition for prediction of water temperatures in the Walla Walla watershed. Typical conditions were represented by the median of the highest 7-day-averages of daily maximum air temperatures for each year of record.
• The lowest 7-day average flows during July-August with recurrence intervals of 10 years (7Q10) were used to evaluate reasonable worst-case conditions. Typical conditions were evaluated using the lowest 7-day average flows during July-August with recurrence intervals of 2 years (7Q2).
• Model uncertainty for prediction of maximum daily water temperature was assessed by estimating the root-mean-square error (RMSE) of model predictions compared with observed temperatures during model validation. The average RMSE for model calibration and confirmation was 0.6°C.
• The load allocations are set to the effective shade provided by full mature riparian shade, which are the maximum values achievable in the Walla Walla River basin.
Mainstem Because the Walla Walla Subbasin straddles the Oregon-Washington border, the Oregon State Department of Environmental Quality (ODEQ) and Ecology agreed to a mutual assessment process. In order to provide for interstate coordination, in 2000 the Oregon Department of Environmental Quality and Ecology agreed that DEQ, having an earlier due date for temperature work in the subbasin, would conduct temperature assessment and modeling for the entire mainstem. Accordingly, the geographic scope of the analysis includes the Walla Walla River in both states. As part of the cooperative assessment, Ecology supplied thermal infrared radiation remote sensing for the 40 miles of river in Washington; and ODEQ, the Walla Walla Basin Watershed Council (WWBWC), Ecology, the Washington Department of Fish and Wildlife
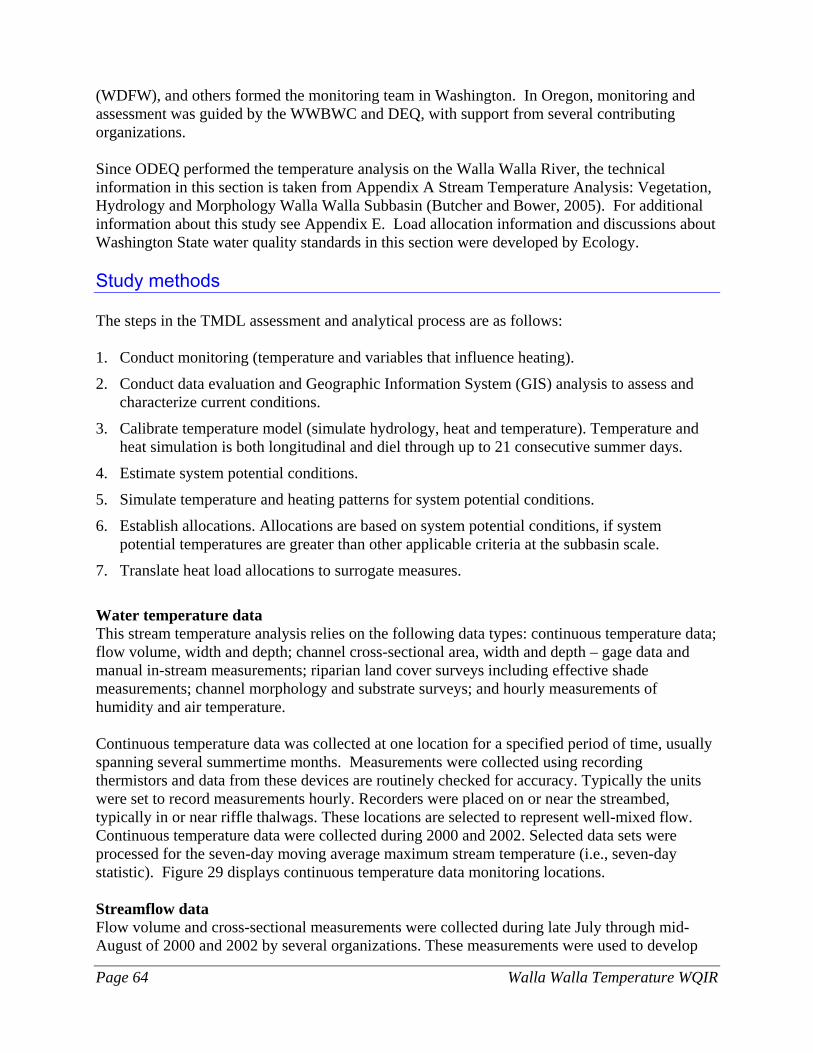
Page 64 Walla Walla Temperature WQIR
(WDFW), and others formed the monitoring team in Washington. In Oregon, monitoring and assessment was guided by the WWBWC and DEQ, with support from several contributing organizations. Since ODEQ performed the temperature analysis on the Walla Walla River, the technical information in this section is taken from Appendix A Stream Temperature Analysis: Vegetation, Hydrology and Morphology Walla Walla Subbasin (Butcher and Bower, 2005). For additional information about this study see Appendix E. Load allocation information and discussions about Washington State water quality standards in this section were developed by Ecology. Study methods The steps in the TMDL assessment and analytical process are as follows: 1. Conduct monitoring (temperature and variables that influence heating).
2. Conduct data evaluation and Geographic Information System (GIS) analysis to assess and characterize current conditions.
3. Calibrate temperature model (simulate hydrology, heat and temperature). Temperature and heat simulation is both longitudinal and diel through up to 21 consecutive summer days.
4. Estimate system potential conditions.
5. Simulate temperature and heating patterns for system potential conditions.
6. Establish allocations. Allocations are based on system potential conditions, if system potential temperatures are greater than other applicable criteria at the subbasin scale.
7. Translate heat load allocations to surrogate measures.
Water temperature data This stream temperature analysis relies on the following data types: continuous temperature data; flow volume, width and depth; channel cross-sectional area, width and depth – gage data and manual in-stream measurements; riparian land cover surveys including effective shade measurements; channel morphology and substrate surveys; and hourly measurements of humidity and air temperature. Continuous temperature data was collected at one location for a specified period of time, usually spanning several summertime months. Measurements were collected using recording thermistors and data from these devices are routinely checked for accuracy. Typically the units were set to record measurements hourly. Recorders were placed on or near the streambed, typically in or near riffle thalwags. These locations are selected to represent well-mixed flow. Continuous temperature data were collected during 2000 and 2002. Selected data sets were processed for the seven-day moving average maximum stream temperature (i.e., seven-day statistic). Figure 29 displays continuous temperature data monitoring locations. Streamflow data Flow volume and cross-sectional measurements were collected during late July through mid-August of 2000 and 2002 by several organizations. These measurements were used to develop
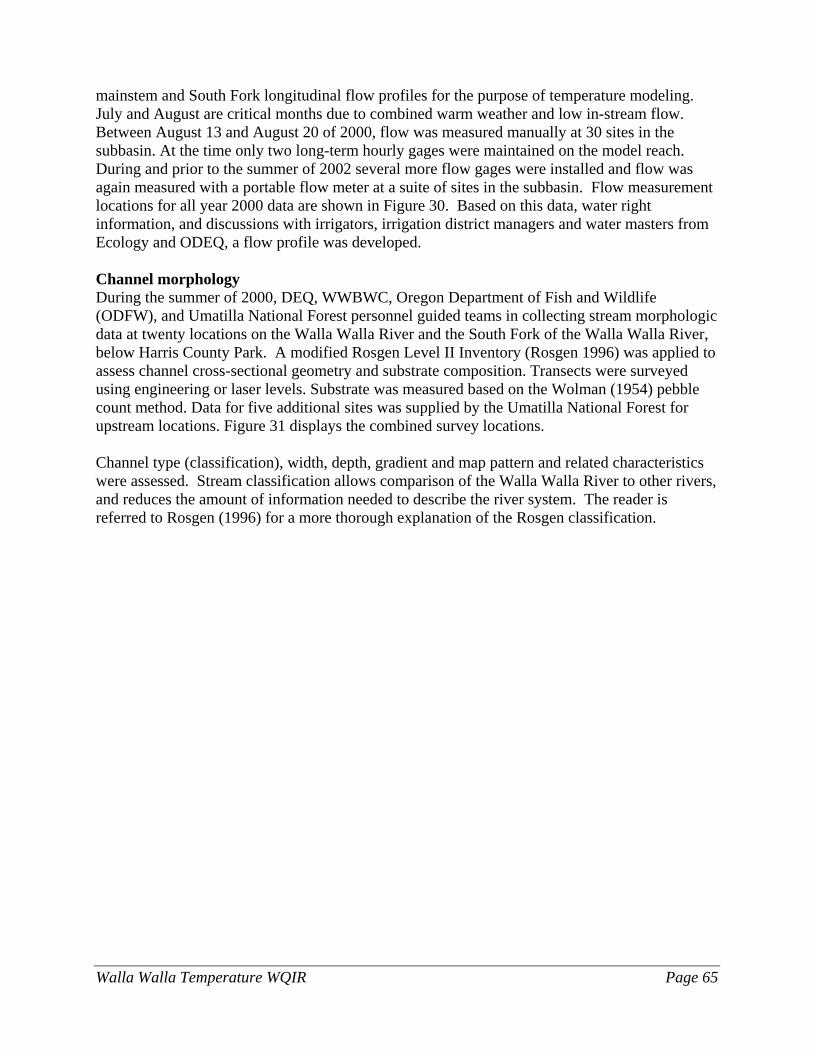
Walla Walla Temperature WQIR Page 65
mainstem and South Fork longitudinal flow profiles for the purpose of temperature modeling. July and August are critical months due to combined warm weather and low in-stream flow. Between August 13 and August 20 of 2000, flow was measured manually at 30 sites in the subbasin. At the time only two long-term hourly gages were maintained on the model reach. During and prior to the summer of 2002 several more flow gages were installed and flow was again measured with a portable flow meter at a suite of sites in the subbasin. Flow measurement locations for all year 2000 data are shown in Figure 30. Based on this data, water right information, and discussions with irrigators, irrigation district managers and water masters from Ecology and ODEQ, a flow profile was developed. Channel morphology During the summer of 2000, DEQ, WWBWC, Oregon Department of Fish and Wildlife (ODFW), and Umatilla National Forest personnel guided teams in collecting stream morphologic data at twenty locations on the Walla Walla River and the South Fork of the Walla Walla River, below Harris County Park. A modified Rosgen Level II Inventory (Rosgen 1996) was applied to assess channel cross-sectional geometry and substrate composition. Transects were surveyed using engineering or laser levels. Substrate was measured based on the Wolman (1954) pebble count method. Data for five additional sites was supplied by the Umatilla National Forest for upstream locations. Figure 31 displays the combined survey locations. Channel type (classification), width, depth, gradient and map pattern and related characteristics were assessed. Stream classification allows comparison of the Walla Walla River to other rivers, and reduces the amount of information needed to describe the river system. The reader is referred to Rosgen (1996) for a more thorough explanation of the Rosgen classification.

Page 66 Walla Walla Temperature WQIR
Figure 29. Year 2000 and 2002 mainstem and tributary continuous stream temperature
measurement locations.
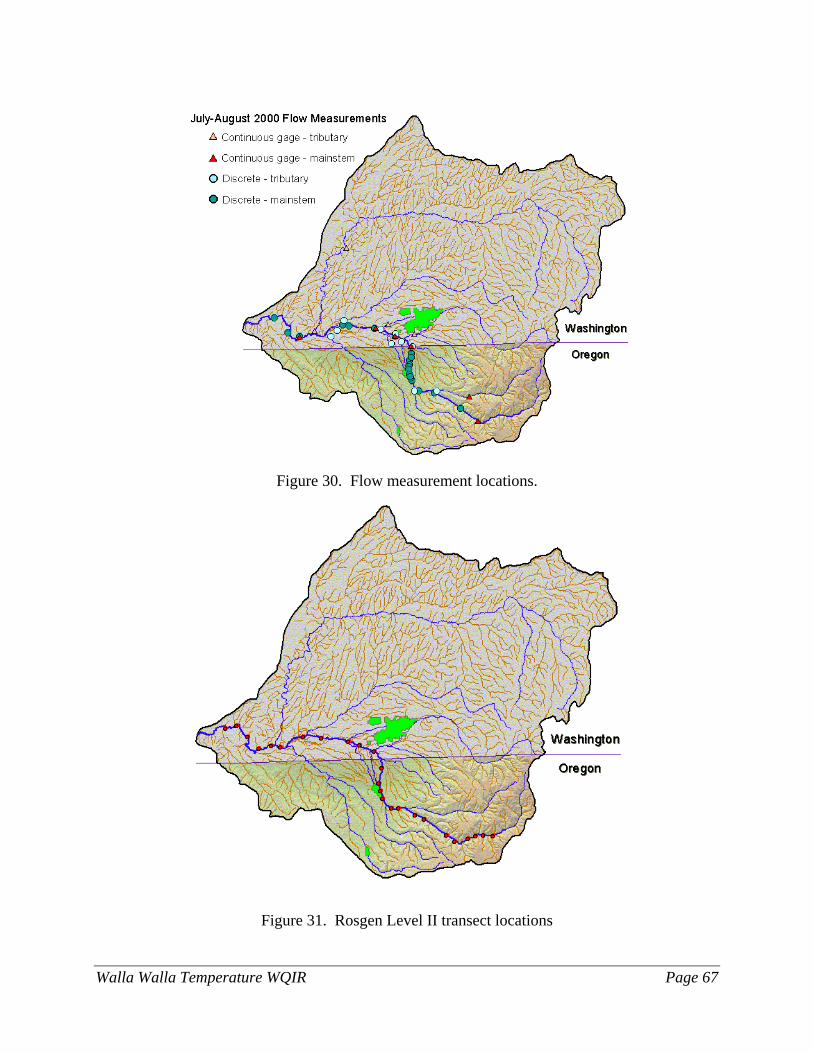
Walla Walla Temperature WQIR Page 67
Figure 30. Flow measurement locations.
Figure 31. Rosgen Level II transect locations
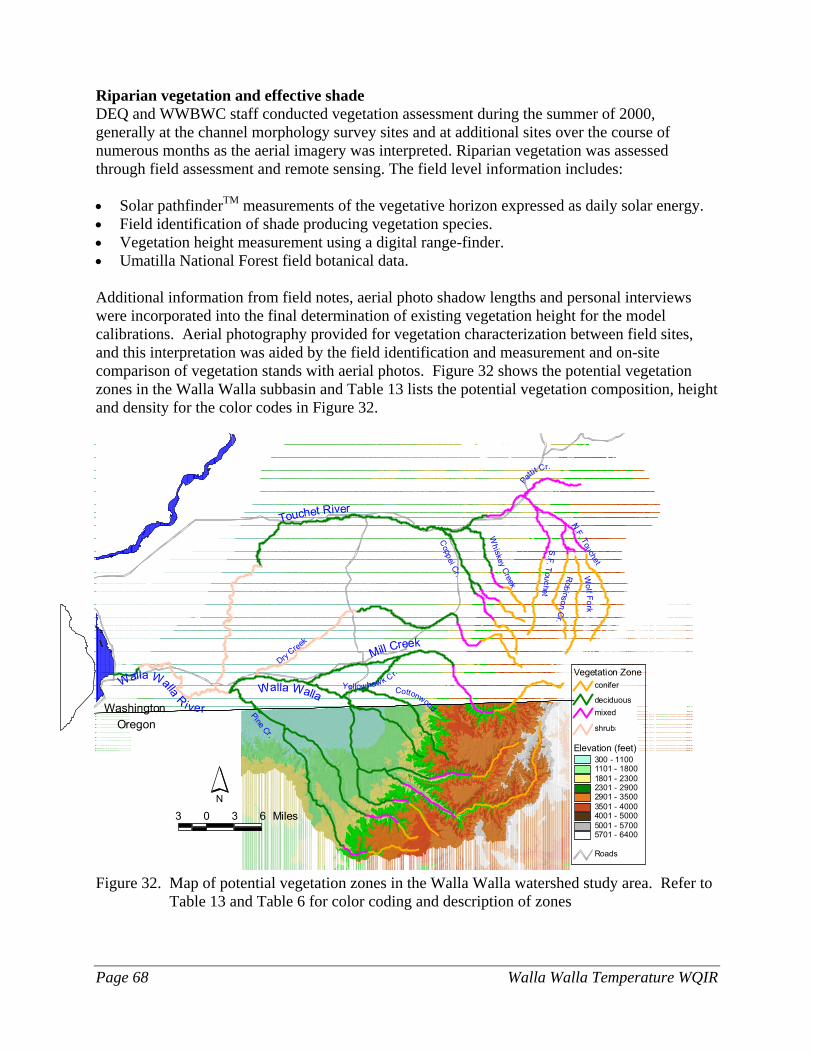
Page 68 Walla Walla Temperature WQIR
Riparian vegetation and effective shade DEQ and WWBWC staff conducted vegetation assessment during the summer of 2000, generally at the channel morphology survey sites and at additional sites over the course of numerous months as the aerial imagery was interpreted. Riparian vegetation was assessed through field assessment and remote sensing. The field level information includes: • Solar pathfinderTM measurements of the vegetative horizon expressed as daily solar energy. • Field identification of shade producing vegetation species. • Vegetation height measurement using a digital range-finder. • Umatilla National Forest field botanical data. Additional information from field notes, aerial photo shadow lengths and personal interviews were incorporated into the final determination of existing vegetation height for the model calibrations. Aerial photography provided for vegetation characterization between field sites, and this interpretation was aided by the field identification and measurement and on-site comparison of vegetation stands with aerial photos. Figure 32 shows the potential vegetation zones in the Walla Walla subbasin and Table 13 lists the potential vegetation composition, height and density for the color codes in Figure 32.
Touchet River
Dry Cree
k
Mill Creek
Walla Walla R iver
Coppei Cr.
Wh iskey Creek
Yellowhawk C r.
WashingtonOregon
N.F. Touchet
S.F. Touchet
Wolf Fork
Robinson C
r.
Pattit
Cr.
Walla Walla
Pine Cr.
Cottonwood
3 0 3 6 Miles
Elevation (feet)300 - 11001101 - 18001801 - 23002301 - 29002901 - 35003501 - 40004001 - 50005001 - 57005701 - 6400
Roads
Vegetation Zoneconifer
deciduousmixed
shrubanddec
N
Figure 32. Map of potential vegetation zones in the Walla Walla watershed study area. Refer to
Table 13 and Table 6 for color coding and description of zones
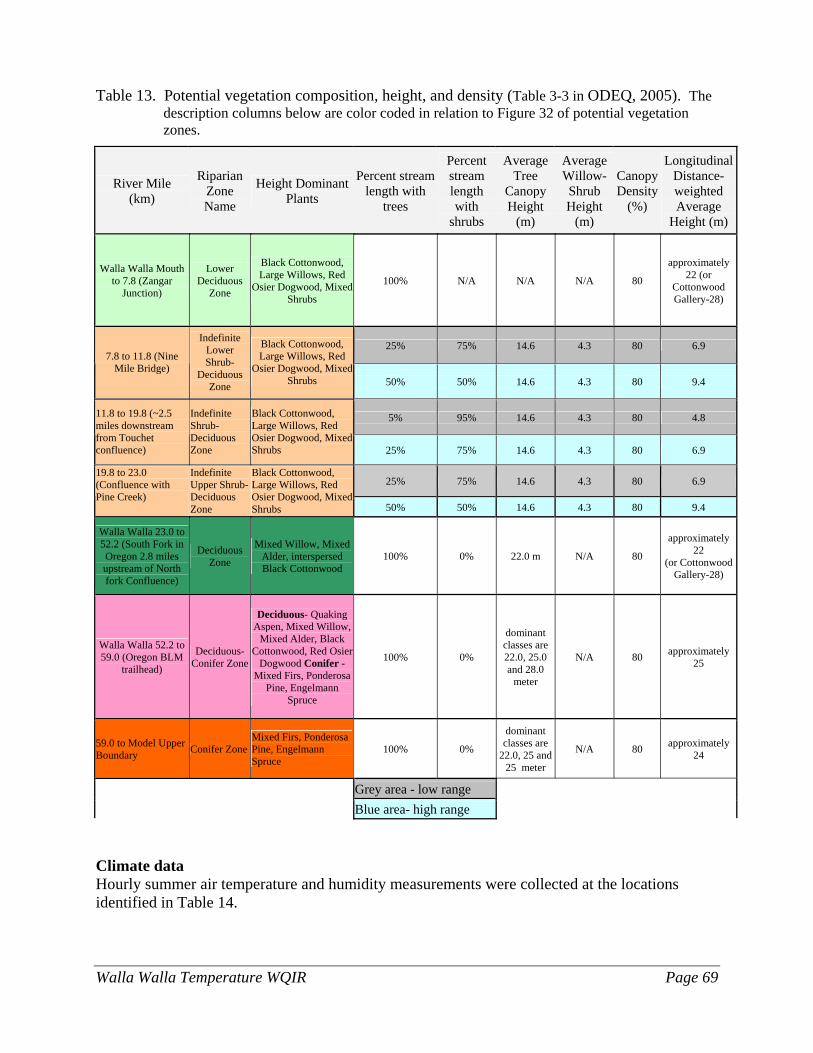
Walla Walla Temperature WQIR Page 69
Table 13. Potential vegetation composition, height, and density (Table 3-3 in ODEQ, 2005). The description columns below are color coded in relation to Figure 32 of potential vegetation zones.
River Mile (km)
Riparian Zone Name
Height Dominant Plants
Percent stream length with
trees
Percent stream length with
shrubs
Average Tree
Canopy Height
(m)
Average Willow-Shrub Height
(m)
Canopy Density
(%)
Longitudinal Distance-weighted Average
Height (m)
Walla Walla Mouth to 7.8 (Zangar
Junction)
Lower Deciduous
Zone
Black Cottonwood, Large Willows, Red
Osier Dogwood, Mixed Shrubs
100% N/A N/A N/A 80
approximately 22 (or
Cottonwood Gallery-28)
25% 75% 14.6 4.3 80 6.9 7.8 to 11.8 (Nine
Mile Bridge)
Indefinite Lower Shrub-
Deciduous Zone
Black Cottonwood, Large Willows, Red
Osier Dogwood, Mixed Shrubs 50% 50% 14.6 4.3 80 9.4
5% 95% 14.6 4.3 80 4.8 11.8 to 19.8 (~2.5 miles downstream from Touchet confluence)
Indefinite Shrub- Deciduous Zone
Black Cottonwood, Large Willows, Red Osier Dogwood, Mixed Shrubs 25% 75% 14.6 4.3 80 6.9
25% 75% 14.6 4.3 80 6.9 19.8 to 23.0 (Confluence with Pine Creek)
Indefinite Upper Shrub- Deciduous Zone
Black Cottonwood, Large Willows, Red Osier Dogwood, Mixed Shrubs 50% 50% 14.6 4.3 80 9.4
Walla Walla 23.0 to 52.2 (South Fork in Oregon 2.8 miles upstream of North fork Confluence)
Deciduous Zone
Mixed Willow, Mixed Alder, interspersed Black Cottonwood
100% 0% 22.0 m N/A 80
approximately 22
(or Cottonwood Gallery-28)
Walla Walla 52.2 to 59.0 (Oregon BLM
trailhead)
Deciduous-Conifer Zone
Deciduous- Quaking Aspen, Mixed Willow,
Mixed Alder, Black Cottonwood, Red Osier
Dogwood Conifer -Mixed Firs, Ponderosa
Pine, Engelmann Spruce
100% 0%
dominant classes are 22.0, 25.0 and 28.0
meter
N/A 80 approximately 25
59.0 to Model Upper Boundary Conifer Zone
Mixed Firs, Ponderosa Pine, Engelmann Spruce
100% 0%
dominant classes are
22.0, 25 and 25 meter
N/A 80 approximately 24
Grey area - low range Blue area- high range Climate data Hourly summer air temperature and humidity measurements were collected at the locations identified in Table 14.
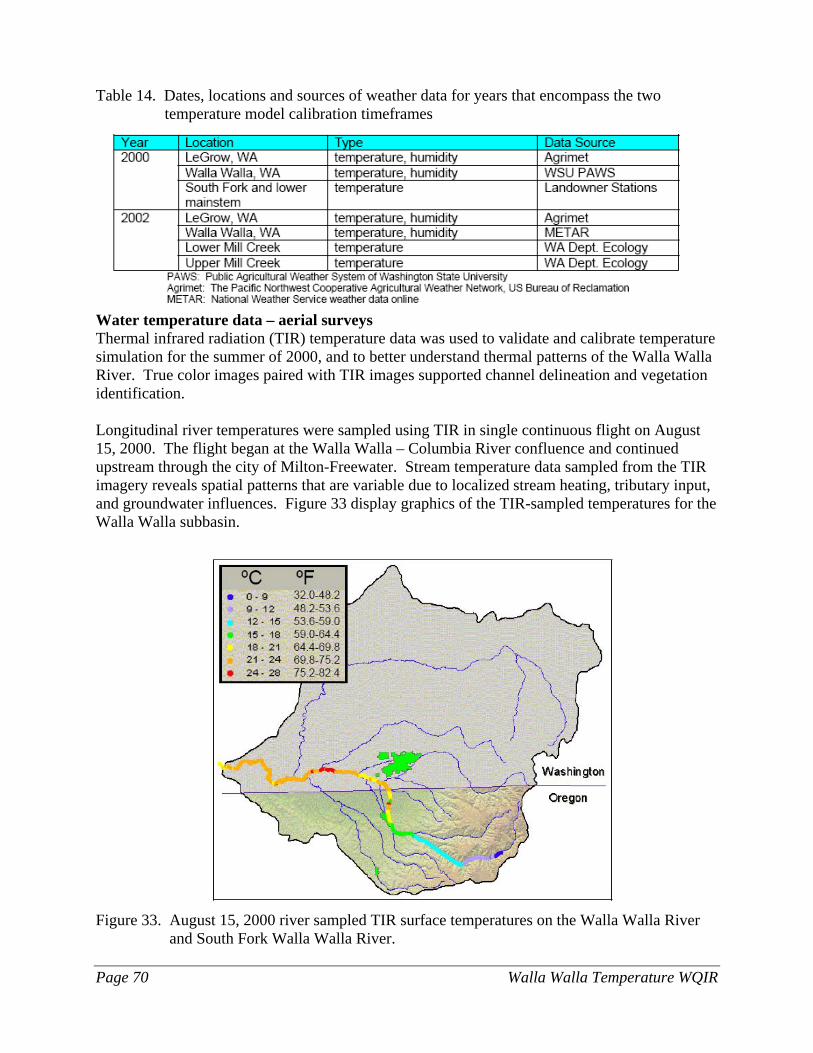
Page 70 Walla Walla Temperature WQIR
Table 14. Dates, locations and sources of weather data for years that encompass the two temperature model calibration timeframes
Water temperature data – aerial surveys Thermal infrared radiation (TIR) temperature data was used to validate and calibrate temperature simulation for the summer of 2000, and to better understand thermal patterns of the Walla Walla River. True color images paired with TIR images supported channel delineation and vegetation identification. Longitudinal river temperatures were sampled using TIR in single continuous flight on August 15, 2000. The flight began at the Walla Walla – Columbia River confluence and continued upstream through the city of Milton-Freewater. Stream temperature data sampled from the TIR imagery reveals spatial patterns that are variable due to localized stream heating, tributary input, and groundwater influences. Figure 33 display graphics of the TIR-sampled temperatures for the Walla Walla subbasin.
Figure 33. August 15, 2000 river sampled TIR surface temperatures on the Walla Walla River
and South Fork Walla Walla River.
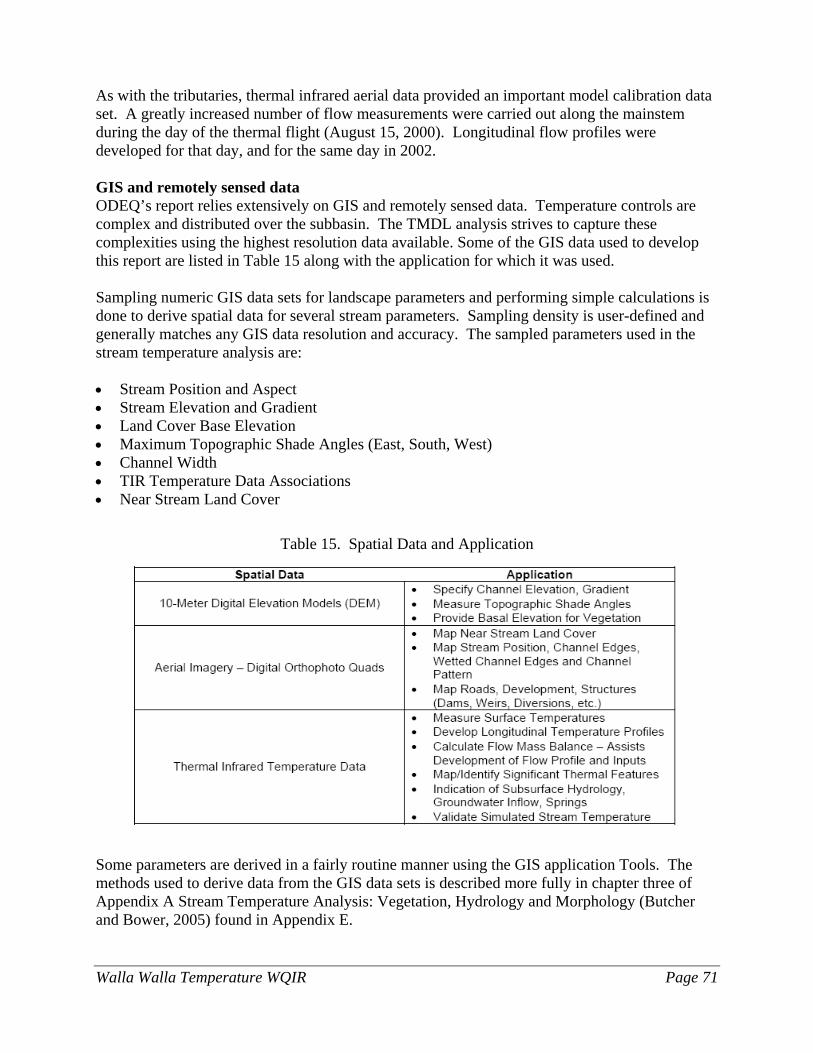
Walla Walla Temperature WQIR Page 71
As with the tributaries, thermal infrared aerial data provided an important model calibration data set. A greatly increased number of flow measurements were carried out along the mainstem during the day of the thermal flight (August 15, 2000). Longitudinal flow profiles were developed for that day, and for the same day in 2002. GIS and remotely sensed data ODEQ’s report relies extensively on GIS and remotely sensed data. Temperature controls are complex and distributed over the subbasin. The TMDL analysis strives to capture these complexities using the highest resolution data available. Some of the GIS data used to develop this report are listed in Table 15 along with the application for which it was used. Sampling numeric GIS data sets for landscape parameters and performing simple calculations is done to derive spatial data for several stream parameters. Sampling density is user-defined and generally matches any GIS data resolution and accuracy. The sampled parameters used in the stream temperature analysis are: • Stream Position and Aspect • Stream Elevation and Gradient • Land Cover Base Elevation • Maximum Topographic Shade Angles (East, South, West) • Channel Width • TIR Temperature Data Associations • Near Stream Land Cover
Table 15. Spatial Data and Application
Some parameters are derived in a fairly routine manner using the GIS application Tools. The methods used to derive data from the GIS data sets is described more fully in chapter three of Appendix A Stream Temperature Analysis: Vegetation, Hydrology and Morphology (Butcher and Bower, 2005) found in Appendix E.
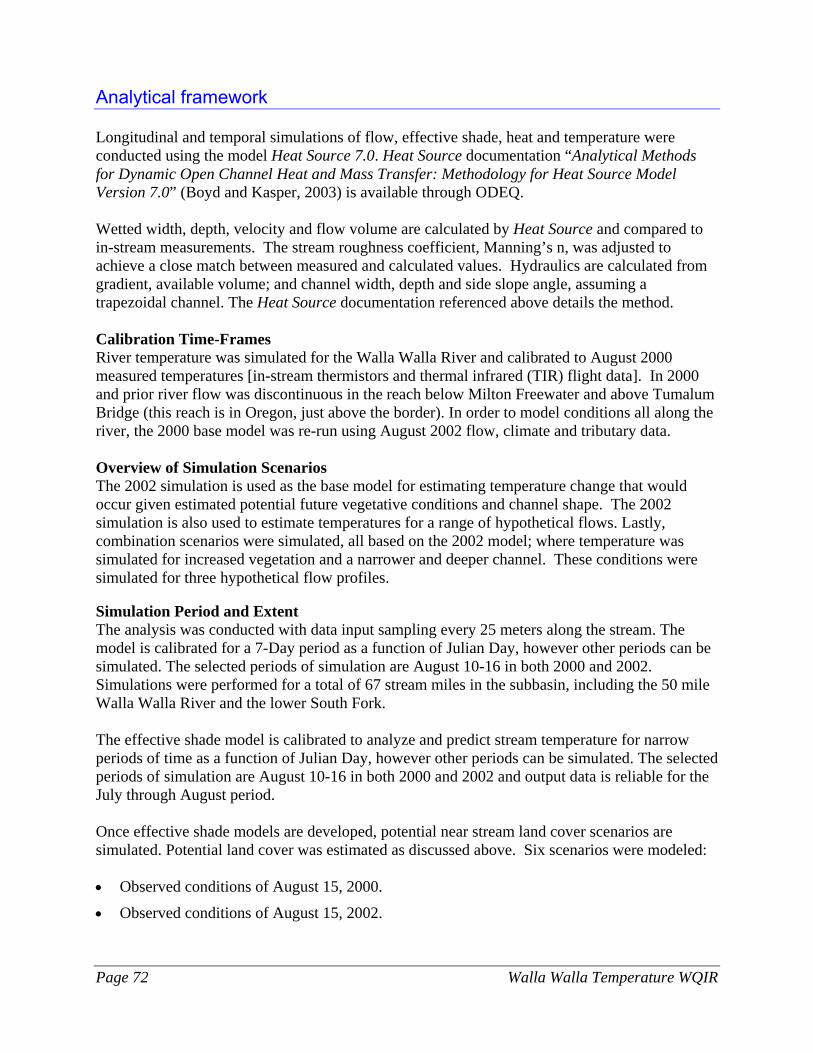
Page 72 Walla Walla Temperature WQIR
Analytical framework Longitudinal and temporal simulations of flow, effective shade, heat and temperature were conducted using the model Heat Source 7.0. Heat Source documentation “Analytical Methods for Dynamic Open Channel Heat and Mass Transfer: Methodology for Heat Source Model Version 7.0” (Boyd and Kasper, 2003) is available through ODEQ. Wetted width, depth, velocity and flow volume are calculated by Heat Source and compared to in-stream measurements. The stream roughness coefficient, Manning’s n, was adjusted to achieve a close match between measured and calculated values. Hydraulics are calculated from gradient, available volume; and channel width, depth and side slope angle, assuming a trapezoidal channel. The Heat Source documentation referenced above details the method. Calibration Time-Frames River temperature was simulated for the Walla Walla River and calibrated to August 2000 measured temperatures [in-stream thermistors and thermal infrared (TIR) flight data]. In 2000 and prior river flow was discontinuous in the reach below Milton Freewater and above Tumalum Bridge (this reach is in Oregon, just above the border). In order to model conditions all along the river, the 2000 base model was re-run using August 2002 flow, climate and tributary data. Overview of Simulation Scenarios The 2002 simulation is used as the base model for estimating temperature change that would occur given estimated potential future vegetative conditions and channel shape. The 2002 simulation is also used to estimate temperatures for a range of hypothetical flows. Lastly, combination scenarios were simulated, all based on the 2002 model; where temperature was simulated for increased vegetation and a narrower and deeper channel. These conditions were simulated for three hypothetical flow profiles. Simulation Period and Extent The analysis was conducted with data input sampling every 25 meters along the stream. The model is calibrated for a 7-Day period as a function of Julian Day, however other periods can be simulated. The selected periods of simulation are August 10-16 in both 2000 and 2002. Simulations were performed for a total of 67 stream miles in the subbasin, including the 50 mile Walla Walla River and the lower South Fork. The effective shade model is calibrated to analyze and predict stream temperature for narrow periods of time as a function of Julian Day, however other periods can be simulated. The selected periods of simulation are August 10-16 in both 2000 and 2002 and output data is reliable for the July through August period. Once effective shade models are developed, potential near stream land cover scenarios are simulated. Potential land cover was estimated as discussed above. Six scenarios were modeled: • Observed conditions of August 15, 2000.
• Observed conditions of August 15, 2002.
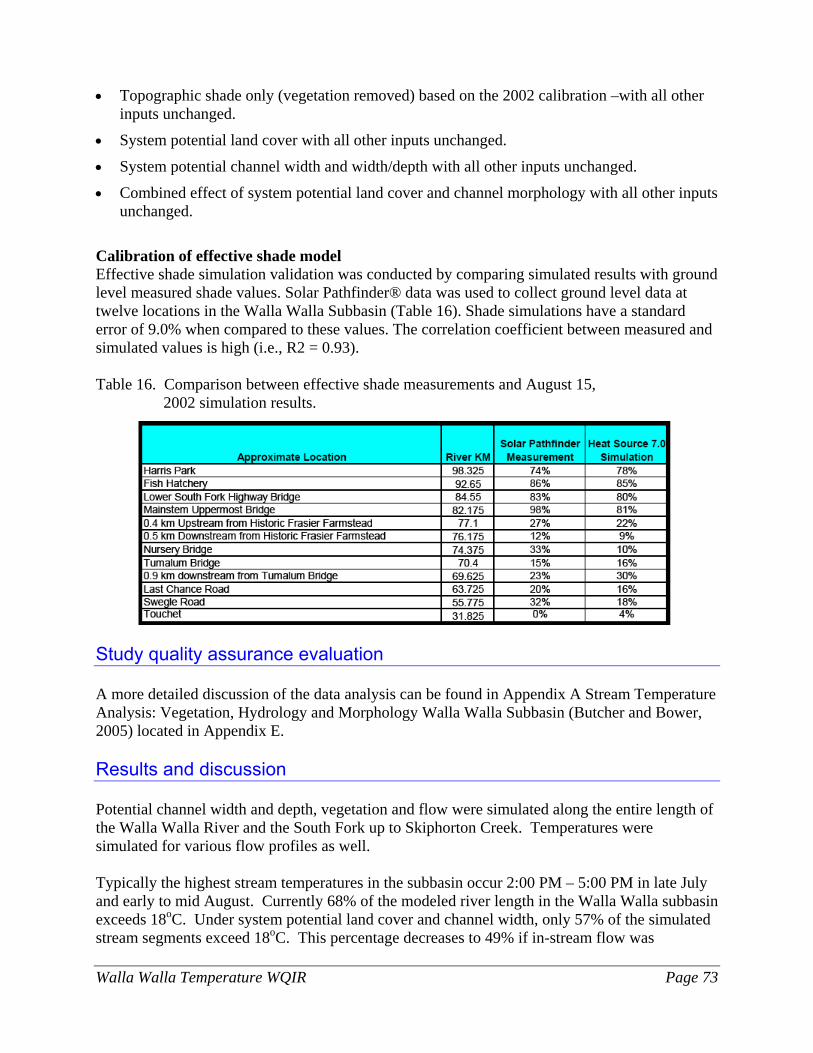
Walla Walla Temperature WQIR Page 73
• Topographic shade only (vegetation removed) based on the 2002 calibration –with all other inputs unchanged.
• System potential land cover with all other inputs unchanged.
• System potential channel width and width/depth with all other inputs unchanged.
• Combined effect of system potential land cover and channel morphology with all other inputs unchanged.
Calibration of effective shade model Effective shade simulation validation was conducted by comparing simulated results with ground level measured shade values. Solar Pathfinder® data was used to collect ground level data at twelve locations in the Walla Walla Subbasin (Table 16). Shade simulations have a standard error of 9.0% when compared to these values. The correlation coefficient between measured and simulated values is high (i.e., R2 = 0.93). Table 16. Comparison between effective shade measurements and August 15,
2002 simulation results.
Study quality assurance evaluation A more detailed discussion of the data analysis can be found in Appendix A Stream Temperature Analysis: Vegetation, Hydrology and Morphology Walla Walla Subbasin (Butcher and Bower, 2005) located in Appendix E. Results and discussion Potential channel width and depth, vegetation and flow were simulated along the entire length of the Walla Walla River and the South Fork up to Skiphorton Creek. Temperatures were simulated for various flow profiles as well. Typically the highest stream temperatures in the subbasin occur 2:00 PM – 5:00 PM in late July and early to mid August. Currently 68% of the modeled river length in the Walla Walla subbasin exceeds 18oC. Under system potential land cover and channel width, only 57% of the simulated stream segments exceed 18oC. This percentage decreases to 49% if in-stream flow was
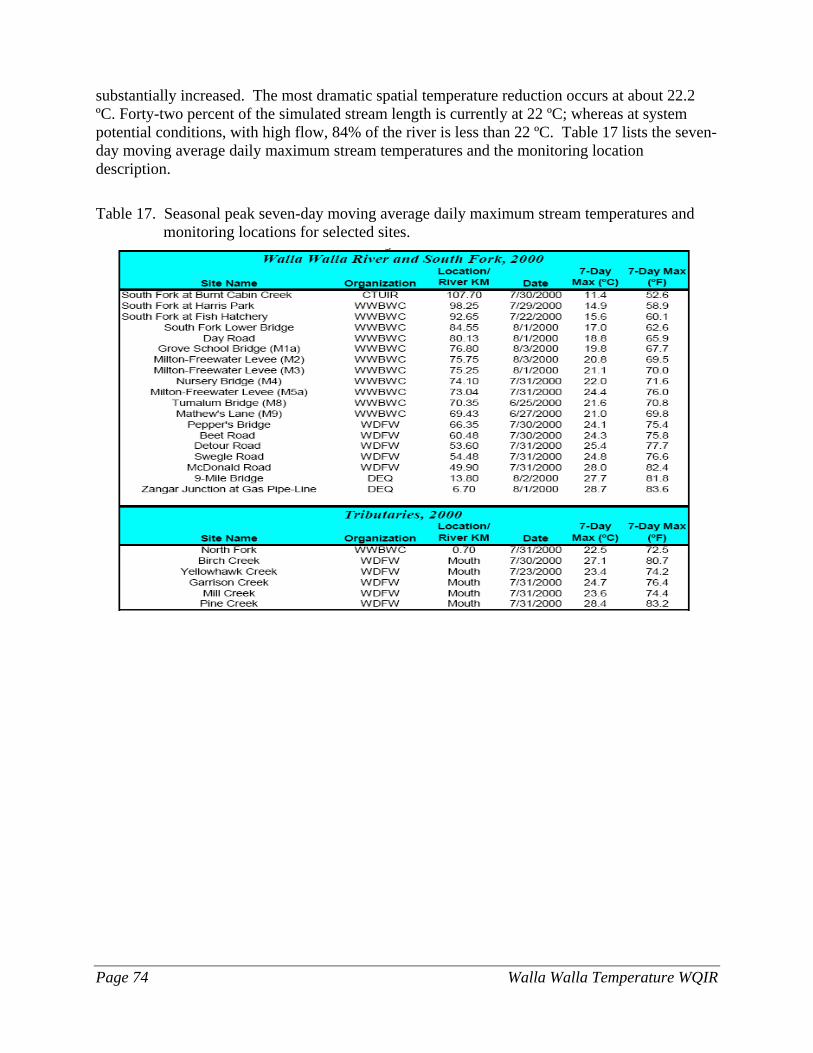
Page 74 Walla Walla Temperature WQIR
substantially increased. The most dramatic spatial temperature reduction occurs at about 22.2 ºC. Forty-two percent of the simulated stream length is currently at 22 ºC; whereas at system potential conditions, with high flow, 84% of the river is less than 22 ºC. Table 17 lists the seven-day moving average daily maximum stream temperatures and the monitoring location description.
Table 17. Seasonal peak seven-day moving average daily maximum stream temperatures and monitoring locations for selected sites.
Walla Walla Temperature WQIR Page 75
Figure 34 illustrates the estimate of natural thermal potential temperature for the modeled corridor, based on system potential. The August 15, 2002 simulation is calibrated to measured temperature and represents the existing condition. Blue circles show points of maximum deviation from system potential temperatures. The red (top) line represents the existing condition (August 15, 2002 flow levels). The second represents improved vegetation and channel shape at the same flow level. Flows of 45 to 100 CFS represent a range of natural heating scenarios. Nursery Bridge, referred to in the figure, is located on the mainstem in Milton-Freewater, OR and is a key measurement point. Figure 34 shows that during critical summer periods, even with system potential channel and vegetation in place, stream temperature is not expected to meet the numeric temperature criteria. Therefore, the best channel and riparian condition possible needs to be in place, and the effective shade produced by system potential channel and vegetation is the basis for load allocations.
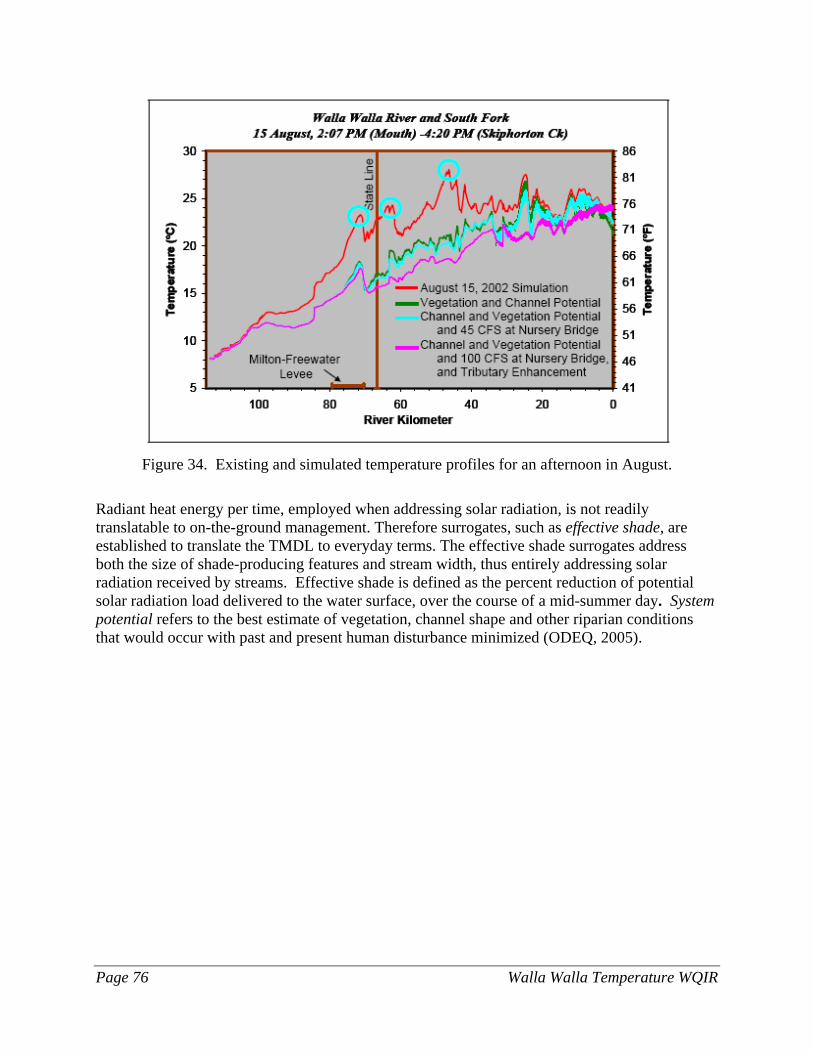
Page 76 Walla Walla Temperature WQIR
Figure 34. Existing and simulated temperature profiles for an afternoon in August.
Radiant heat energy per time, employed when addressing solar radiation, is not readily translatable to on-the-ground management. Therefore surrogates, such as effective shade, are established to translate the TMDL to everyday terms. The effective shade surrogates address both the size of shade-producing features and stream width, thus entirely addressing solar radiation received by streams. Effective shade is defined as the percent reduction of potential solar radiation load delivered to the water surface, over the course of a mid-summer day. System potential refers to the best estimate of vegetation, channel shape and other riparian conditions that would occur with past and present human disturbance minimized (ODEQ, 2005).
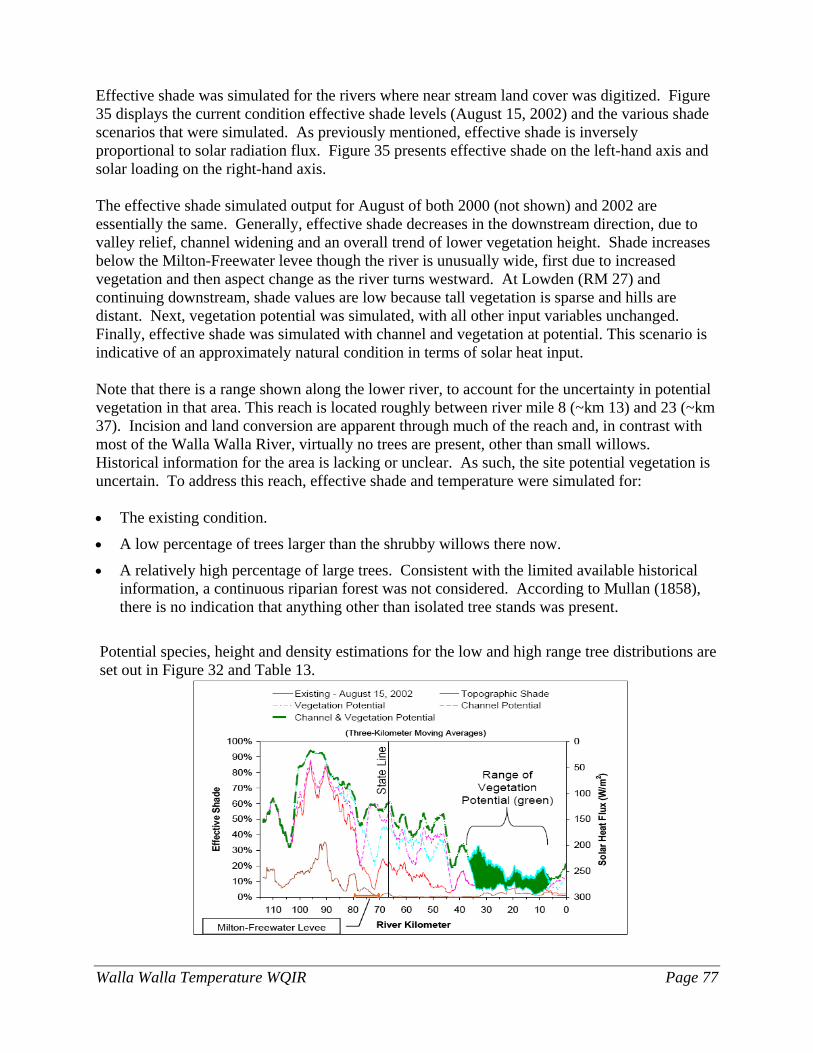
Walla Walla Temperature WQIR Page 77
Effective shade was simulated for the rivers where near stream land cover was digitized. Figure 35 displays the current condition effective shade levels (August 15, 2002) and the various shade scenarios that were simulated. As previously mentioned, effective shade is inversely proportional to solar radiation flux. Figure 35 presents effective shade on the left-hand axis and solar loading on the right-hand axis. The effective shade simulated output for August of both 2000 (not shown) and 2002 are essentially the same. Generally, effective shade decreases in the downstream direction, due to valley relief, channel widening and an overall trend of lower vegetation height. Shade increases below the Milton-Freewater levee though the river is unusually wide, first due to increased vegetation and then aspect change as the river turns westward. At Lowden (RM 27) and continuing downstream, shade values are low because tall vegetation is sparse and hills are distant. Next, vegetation potential was simulated, with all other input variables unchanged. Finally, effective shade was simulated with channel and vegetation at potential. This scenario is indicative of an approximately natural condition in terms of solar heat input. Note that there is a range shown along the lower river, to account for the uncertainty in potential vegetation in that area. This reach is located roughly between river mile 8 (~km 13) and 23 (~km 37). Incision and land conversion are apparent through much of the reach and, in contrast with most of the Walla Walla River, virtually no trees are present, other than small willows. Historical information for the area is lacking or unclear. As such, the site potential vegetation is uncertain. To address this reach, effective shade and temperature were simulated for: • The existing condition.
• A low percentage of trees larger than the shrubby willows there now.
• A relatively high percentage of large trees. Consistent with the limited available historical information, a continuous riparian forest was not considered. According to Mullan (1858), there is no indication that anything other than isolated tree stands was present.
Potential species, height and density estimations for the low and high range tree distributions are set out in Figure 32 and Table 13.
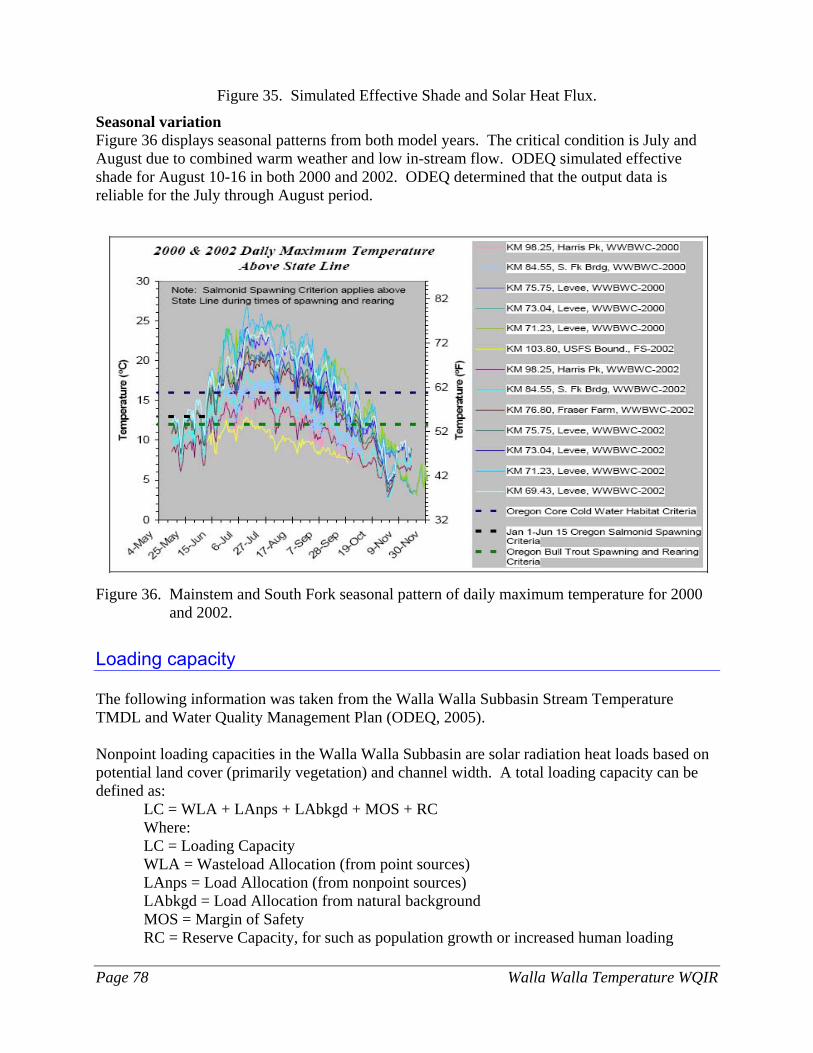
Page 78 Walla Walla Temperature WQIR
Figure 35. Simulated Effective Shade and Solar Heat Flux.
Seasonal variation Figure 36 displays seasonal patterns from both model years. The critical condition is July and August due to combined warm weather and low in-stream flow. ODEQ simulated effective shade for August 10-16 in both 2000 and 2002. ODEQ determined that the output data is reliable for the July through August period.
Figure 36. Mainstem and South Fork seasonal pattern of daily maximum temperature for 2000
and 2002.
Loading capacity The following information was taken from the Walla Walla Subbasin Stream Temperature TMDL and Water Quality Management Plan (ODEQ, 2005). Nonpoint loading capacities in the Walla Walla Subbasin are solar radiation heat loads based on potential land cover (primarily vegetation) and channel width. A total loading capacity can be defined as:
LC = WLA + LAnps + LAbkgd + MOS + RC Where: LC = Loading Capacity WLA = Wasteload Allocation (from point sources) LAnps = Load Allocation (from nonpoint sources) LAbkgd = Load Allocation from natural background MOS = Margin of Safety RC = Reserve Capacity, for such as population growth or increased human loading
Walla Walla Temperature WQIR Page 79
Nonpoint loading capacities in the Walla Walla subbasin are solar radiation heat loads based on potential land cover (primarily vegetation) and channel width. For the mainstem in Washington where computer modeling was performed, the bulk loading capacity without the Reserve Capacity (RC) is a maximum daily heating rate of 161.3 megawatt – the amount of solar energy that the stream is exposed to (ODEQ Heat Source Model runs). This is translated into site-specific load allocations and other objectives. Don Butcher with ODEQ calculated the Washington fraction from the Heat Source 2002 model. The potential is 161.3 MW, whereas the current (2002) mid-August load is 236.1. Therefore, human sources are contributing 31.2 % of the heat loading. ODEQ has specified that the target of the temperature TMDL in Oregon is “natural thermal potential temperatures” within a 0.3 ºC (0.5 ºF) human use allowance. If interstate streams originating in Oregon meet the natural thermal potential temperature, then when the streams cross the border the natural conditions represent the lowest feasible temperatures attainable. Load allocations Allocated conditions are expressed as heat per unit time (e.g., megawatt per stream surface area). However, heat energy per time is not easily translated to on-the-ground management. Therefore surrogates, such as effective shade, are established to translate the TMDL to everyday terms. The nonpoint source heat allocation is translated into effective shade surrogate measures. Effective shade surrogate measures provide site-specific targets that are readily measurable locally. Attainment of the surrogate measures ensures compliance with the nonpoint source allocations (megawatt per stream surface area). For purposes of this TMDL, effective shade is defined as the percent reduction of solar radiation load delivered to the water surface, over the course of a mid-summer day. Attainment of the effective shade surrogates below fulfills the Walla Walla Subbasin load allocation. The effective shade surrogates address both the size of shade-producing features and stream width, thus entirely addressing solar radiation received by streams. The load allocation for the Walla Walla River in Washington is represented by the blue line shown in Figure 37 (effective shade axis, channel and vegetation potential). In the area of uncertainty (from approximately RM 37 to RM 5 or Dry Creek to Touchet) the upper limit of the range of potential effective shade is the load allocation, since modeling results show that as much riparian vegetation as possible is needed to achieve natural conditions and meet water quality standards. This approach is also consistent with that used in the Touchet River shrub zone. Figure 38 provides a location reference for Figure 37. The load allocations are expected to result in water temperatures that are equivalent to the temperatures that would occur under natural conditions. Therefore, the load allocations are expected to result in water temperatures that meet the water quality standard. This TMDL should also achieve compliance with the 2006 water quality standards since load allocations are expected to result in stream temperatures found under natural conditions. In addition to system potential vegetation, Figure 37 also addresses the estimated system potential channel width and width/depth ratios. Figure 39 illustrates the existing and system
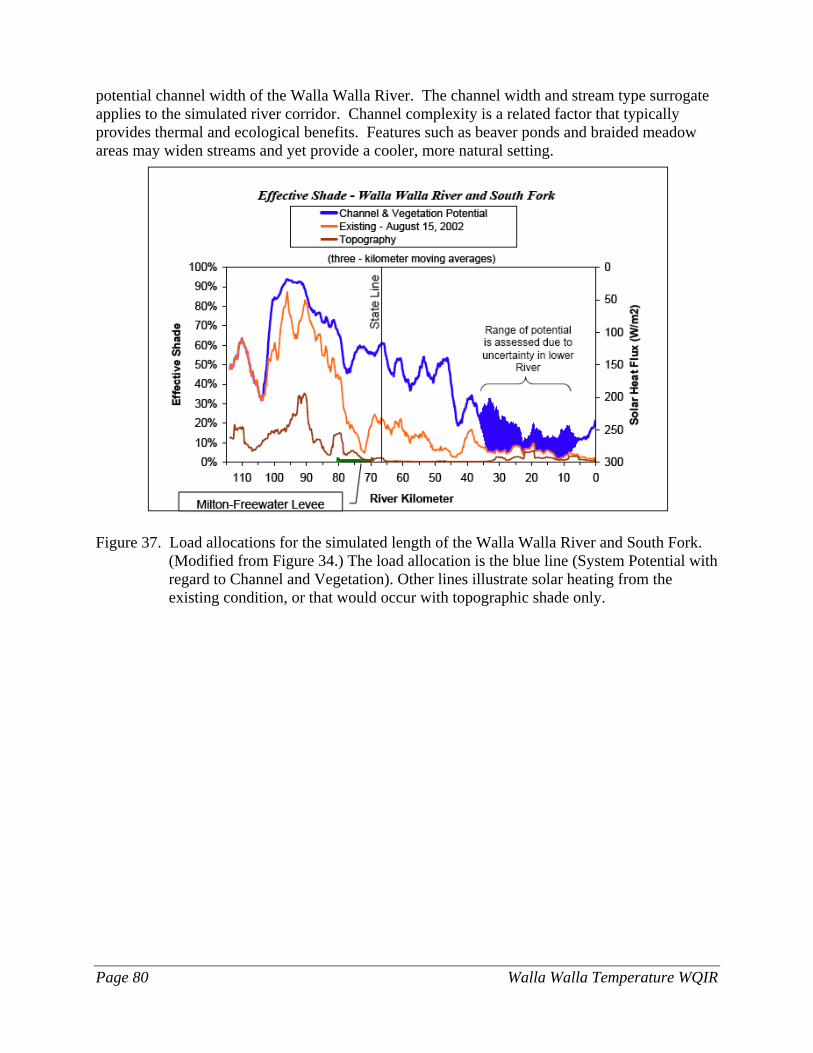
Page 80 Walla Walla Temperature WQIR
potential channel width of the Walla Walla River. The channel width and stream type surrogate applies to the simulated river corridor. Channel complexity is a related factor that typically provides thermal and ecological benefits. Features such as beaver ponds and braided meadow areas may widen streams and yet provide a cooler, more natural setting.
Figure 37. Load allocations for the simulated length of the Walla Walla River and South Fork. (Modified from Figure 34.) The load allocation is the blue line (System Potential with regard to Channel and Vegetation). Other lines illustrate solar heating from the existing condition, or that would occur with topographic shade only.
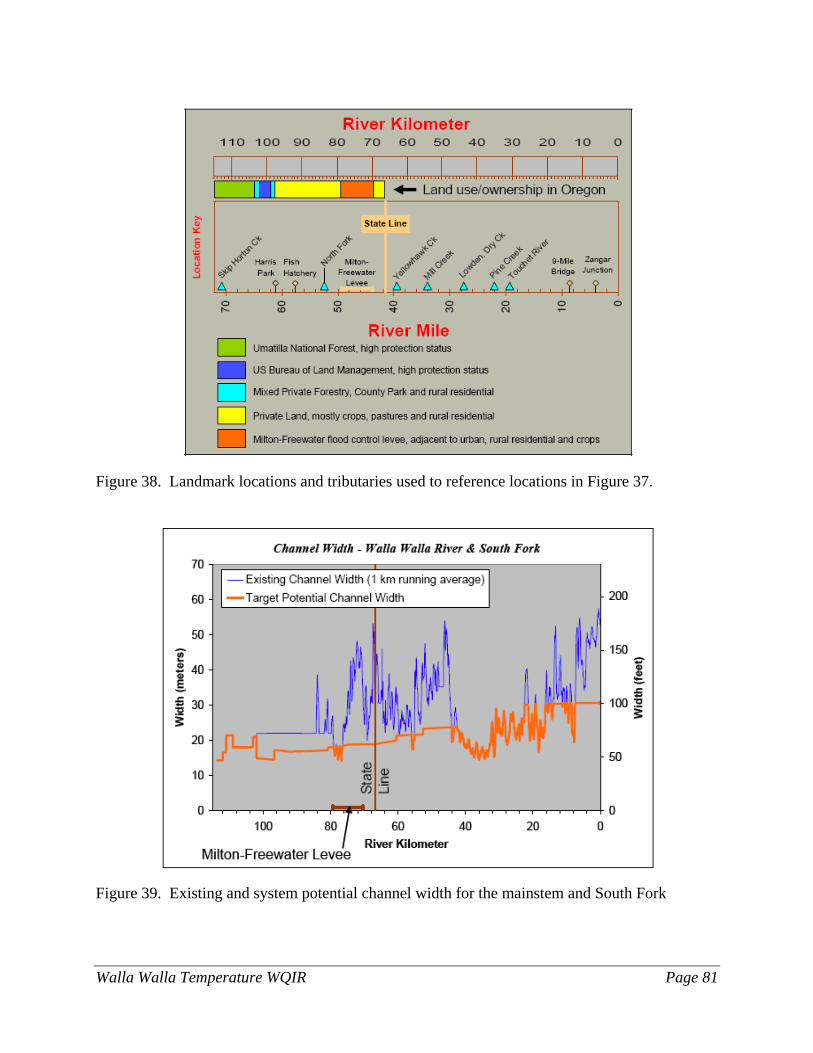
Walla Walla Temperature WQIR Page 81
Figure 38. Landmark locations and tributaries used to reference locations in Figure 37.
Figure 39. Existing and system potential channel width for the mainstem and South Fork
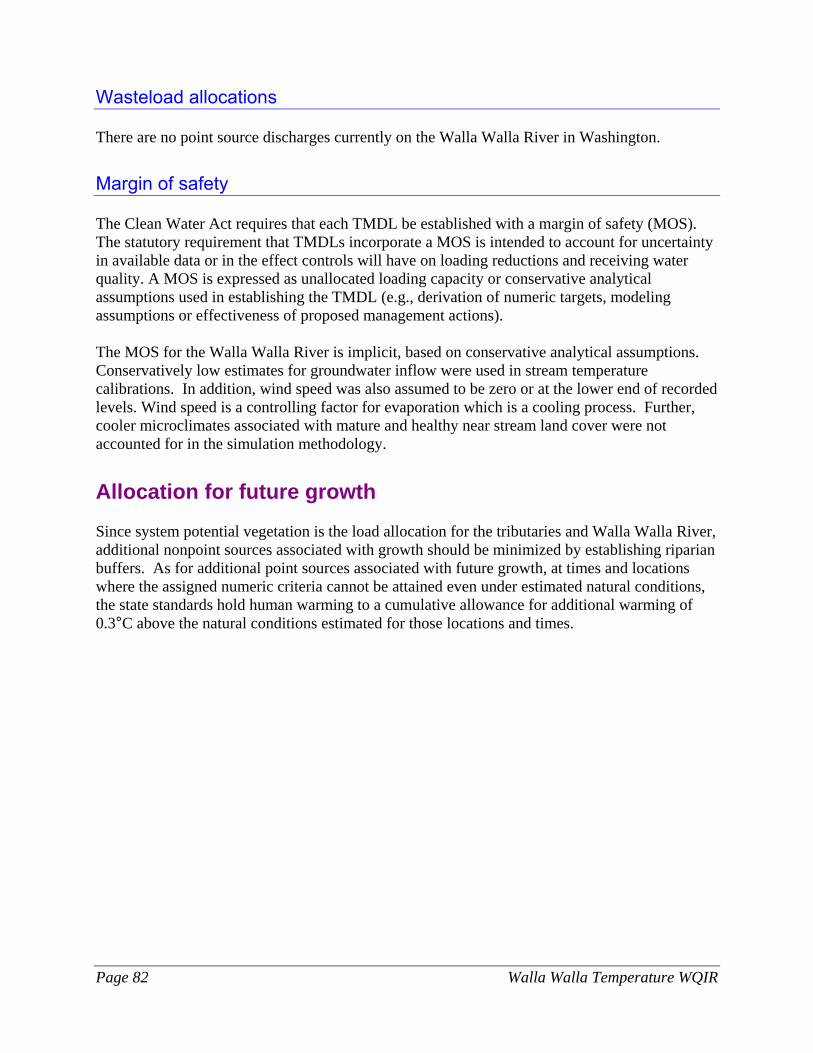
Page 82 Walla Walla Temperature WQIR
Wasteload allocations There are no point source discharges currently on the Walla Walla River in Washington.
Margin of safety The Clean Water Act requires that each TMDL be established with a margin of safety (MOS). The statutory requirement that TMDLs incorporate a MOS is intended to account for uncertainty in available data or in the effect controls will have on loading reductions and receiving water quality. A MOS is expressed as unallocated loading capacity or conservative analytical assumptions used in establishing the TMDL (e.g., derivation of numeric targets, modeling assumptions or effectiveness of proposed management actions). The MOS for the Walla Walla River is implicit, based on conservative analytical assumptions. Conservatively low estimates for groundwater inflow were used in stream temperature calibrations. In addition, wind speed was also assumed to be zero or at the lower end of recorded levels. Wind speed is a controlling factor for evaporation which is a cooling process. Further, cooler microclimates associated with mature and healthy near stream land cover were not accounted for in the simulation methodology.
Allocation for future growth Since system potential vegetation is the load allocation for the tributaries and Walla Walla River, additional nonpoint sources associated with growth should be minimized by establishing riparian buffers. As for additional point sources associated with future growth, at times and locations where the assigned numeric criteria cannot be attained even under estimated natural conditions, the state standards hold human warming to a cumulative allowance for additional warming of 0.3°C above the natural conditions estimated for those locations and times.
Walla Walla Temperature WQIR Page 83
Implementation Strategy
Introduction An implementation strategy is needed to meet the TMDL requirements as outlined in the 1997 Memorandum of Agreement between the U.S. Environmental Protection Agency (EPA) and the Washington State Department of Ecology (Ecology). This Implementation Strategy is intended to describe the general framework for how to improve water quality. It describes the roles and responsibilities of cleanup partners (i.e., organizations with jurisdiction, authority, or direct responsibility for cleanup) and the programs or means through which they will address these water quality issues. This implementation strategy includes a: • List of recommended actions to improve water quality. • Description of implementation activities already underway. • Strategy for monitoring progress and changes in water quality. • Summary of public involvement methods. • Description of potential funding sources to help implement the activities. Following U.S. Environmental Protection Agency (EPA) approval of this TMDL, interested and responsible parties will work together to develop a Water Quality Implementation Plan. That plan will describe and prioritize specific actions planned to improve water quality and achieve water quality standards.
What needs to be done? The Walla Walla Watershed Planning Unit’s Water Quality Subcommittee is providing guidance, advice and recommendations in the development of all the TMDLs in the Walla Walla watershed. The group’s goal for the temperature TMDL is to extend cooler water as far downstream as possible and meet water quality standards. The following paragraphs describe what actions should be performed to achieve this goal. Many Walla Walla watershed residents and local government agencies are involved with planning and implementation activities outside of the TMDL process to improve instream flow, bull trout and steelhead habitat and water quality. These other planning efforts identified implementation activities which will help achieve the load allocations set by this TMDL. The following plans were consulted during the development of this implementation strategy: • Bi-State Habitat Conservation Plan (HCP) • Walla Walla Watershed Plan • Walla Walla Subbasin Plan • Snake River Salmon Recovery Plan • Comprehensive Irrigation District Management Plan (CIDMP)
Page 84 Walla Walla Temperature WQIR
Bi-State Habitat Conservation Plan In June 2000, a settlement agreement led to the development of the HCP process. The goal of the HCP process is to increase conservation and habitat restoration measures while allowing residents to continue using surface water. The United States Fish and Wildlife Service and National Oceanic and Atmospheric Administration, National Marine Fisheries Service will begin drafting an environmental impact statement (EIS) and other HCP documents in 2007. Stakeholders from Oregon (Walla Walla Basin Watershed Council) and Washington (Walla Walla Watershed Planning Unit) will work with representatives from these agencies to develop the documents. The product of the process is a document (called an HCP) that identifies actions people can take to minimize the potential of harming a threatened or endangered fish species. HCP documents will be attached to applications for an incidental take permit (Walla Walla Watershed Planning Web site 2007). For more information please see http://www.wallawallawatershed.org/hcp.html. Walla Walla Watershed Plan The Walla Walla Watershed Plan (HDR/EES 2005) provides local guidance to identify, prioritize and develop solutions to water resource management issues. A group of local residents and groups partnered with local governments and tribes formed the Planning Unit in 2000 to develop the plan. In May 2005, the final Walla Walla Watershed Plan was adopted. The Plan includes strategies to improve water quantity, water quality and fish habitat. Walla Walla Subbasin Plan The Walla Walla Subbasin Plan is a locally developed amendment to the Northwest Power and Conservation Council’s Columbia River Basin Fish and Wildlife Program. The plan (Walla Walla Watershed Planning Unit & Walla Walla Basin Watershed Council, 2004) identified seven characteristics of watershed streams that limit habitat of threatened fish: • Too much sediment • Lack of large woody debris • Lack of pools • Limited riparian function/confinement • High summer water temperature • Increased bed scour • Not enough stream flow The Subbasin Plan suggests several strategies to address these problems. Several strategies in the plan call for improving riparian corridors and reducing sediment, which this TMDL also prescribes. Therefore, the strategies in the Subbasin plan may also be applied to this TMDL. Additional information about the Subbasin plan is available at: http://www.wallawallawatershed.org/subbasin.html Snake River Salmon Recovery Plan The Snake River Salmon Recovery Plan identifies actions that will assist in the overall effort to restore salmon populations that are “biologically, culturally and economically viable” (Snake River Salmon Recovery Board, 2006). The Snake River Salmon Recovery Board (Board) finalized and submitted the recovery plan for listed steelhead, bull trout and salmon to the National Marine Fisheries Service. The Board is made up of county elected officials, citizens, tribes and a regional
Walla Walla Temperature WQIR Page 85
technical team, is working to restore native salmonids. As a subbasin of the Snake River, the plan includes several recommended actions for the Walla Walla watershed. The Snake River Salmon Recovery Plan presents priority areas for protection and restoration as well as identifies significant limiting factors that need to be addressed. The objectives, strategies, and actions in the plan are based on assessments of fish and habitat reported in the various watershed plans and assessments. The plan addresses threats, limiting factors, cost, commitments, monitoring and adaptive management to recover these fish populations. This comprehensive plan has and will continue to be used to guide investments of public and private money and policy based on the information it provides. Implementation of many of the actions in the TMDL will likely occur through implementation of the actions called for in the plan. For more information on the plan, visit the following Web site: http://www.snakeriverboard.org/resources/library.htm. Comprehensive Irrigation District Management Plan (CIDMP) The CIDMP is a planning process that allows landowners to construct and carry out a plan for their property that can (if the right programs are included) meet water quality and Endangered Species Act regulations. The Washington State Department of Agriculture provides funding for this process with local organizations providing technical assistance. The Gardena Farms Irrigation District completed a plan in 2004 which calls for piping open channels. For more information about CIDMP, visit http://www.wallawallawatershed.org/cidmp.html. Since all these plans include actions or best management practices (BMPs) to improve water quality in the Walla Walla watershed, those actions related to reducing temperature are included in this implementation strategy. Table 18 provides a list of the actions recommended by the Watershed, Subbasin, and Snake River Recovery plans that will also increase shade and reduce sediment levels. The following paragraphs describe what actions should be performed to achieve temperature standards.
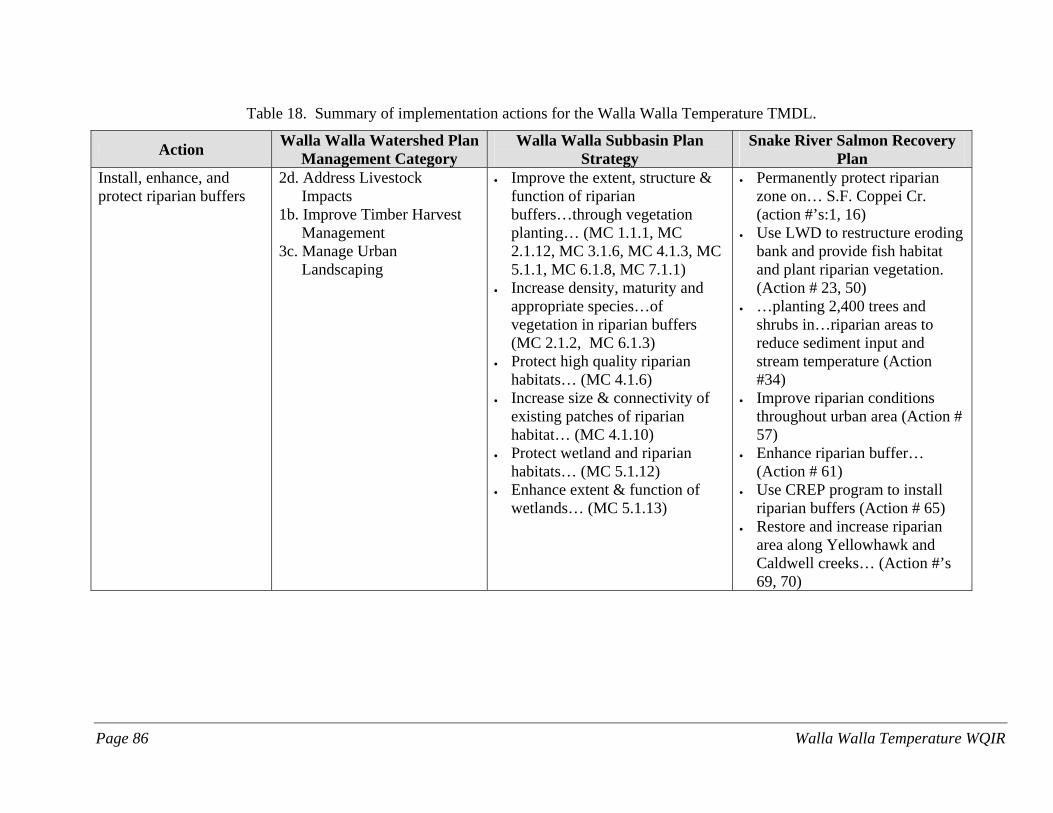
Page 86 Walla Walla Temperature WQIR
Table 18. Summary of implementation actions for the Walla Walla Temperature TMDL.
Action Walla Walla Watershed PlanManagement Category
Walla Walla Subbasin Plan Strategy
Snake River Salmon Recovery Plan
Install, enhance, and protect riparian buffers
2d. Address Livestock Impacts 1b. Improve Timber Harvest
Management 3c. Manage Urban
Landscaping
• Improve the extent, structure & function of riparian buffers…through vegetation planting… (MC 1.1.1, MC 2.1.12, MC 3.1.6, MC 4.1.3, MC 5.1.1, MC 6.1.8, MC 7.1.1)
• Increase density, maturity and appropriate species…of vegetation in riparian buffers (MC 2.1.2, MC 6.1.3)
• Protect high quality riparian habitats… (MC 4.1.6)
• Increase size & connectivity of existing patches of riparian habitat… (MC 4.1.10)
• Protect wetland and riparian habitats… (MC 5.1.12)
• Enhance extent & function of wetlands… (MC 5.1.13)
• Permanently protect riparian zone on… S.F. Coppei Cr. (action #’s:1, 16)
• Use LWD to restructure eroding bank and provide fish habitat and plant riparian vegetation. (Action # 23, 50)
• …planting 2,400 trees and shrubs in…riparian areas to reduce sediment input and stream temperature (Action #34)
• Improve riparian conditions throughout urban area (Action # 57)
• Enhance riparian buffer… (Action # 61)
• Use CREP program to install riparian buffers (Action # 65)
• Restore and increase riparian area along Yellowhawk and Caldwell creeks… (Action #’s 69, 70)
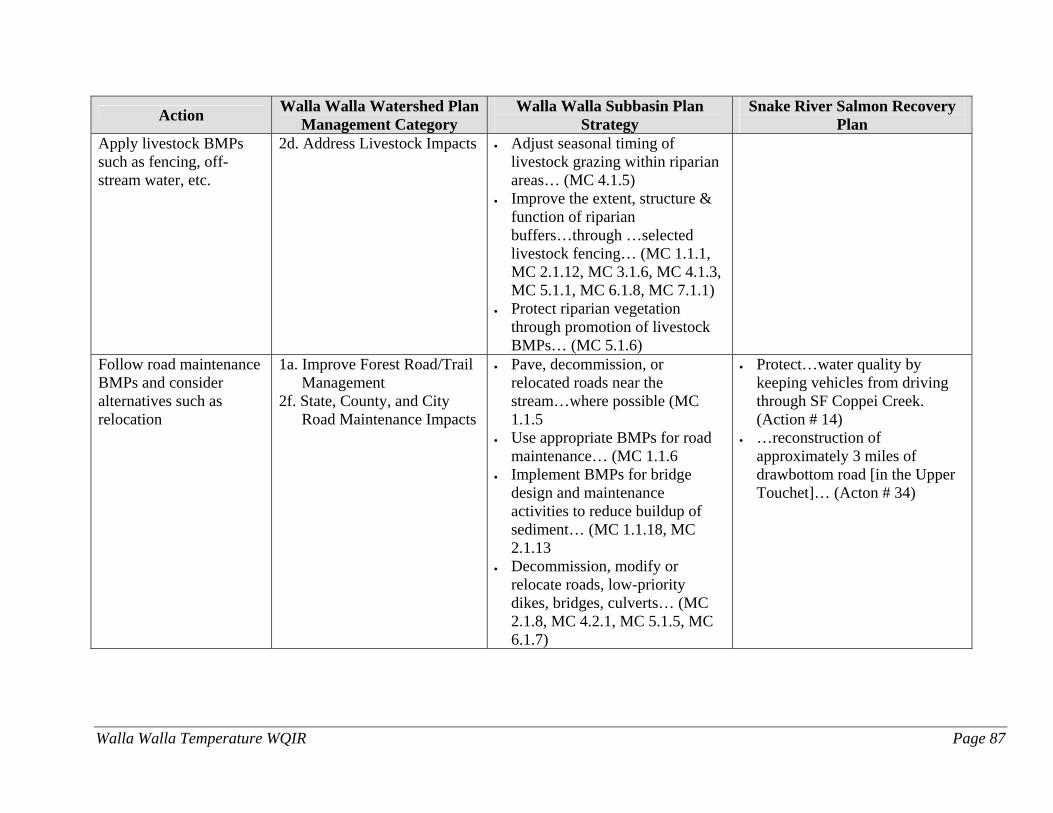
Walla Walla Temperature WQIR Page 87
Action Walla Walla Watershed PlanManagement Category
Walla Walla Subbasin Plan Strategy
Snake River Salmon Recovery Plan
Apply livestock BMPs such as fencing, off-stream water, etc.
2d. Address Livestock Impacts • Adjust seasonal timing of livestock grazing within riparian areas… (MC 4.1.5)
• Improve the extent, structure & function of riparian buffers…through …selected livestock fencing… (MC 1.1.1, MC 2.1.12, MC 3.1.6, MC 4.1.3, MC 5.1.1, MC 6.1.8, MC 7.1.1)
• Protect riparian vegetation through promotion of livestock BMPs… (MC 5.1.6)
Follow road maintenance BMPs and consider alternatives such as relocation
1a. Improve Forest Road/Trail Management
2f. State, County, and City Road Maintenance Impacts
• Pave, decommission, or relocated roads near the stream…where possible (MC 1.1.5
• Use appropriate BMPs for road maintenance… (MC 1.1.6
• Implement BMPs for bridge design and maintenance activities to reduce buildup of sediment… (MC 1.1.18, MC 2.1.13
• Decommission, modify or relocate roads, low-priority dikes, bridges, culverts… (MC 2.1.8, MC 4.2.1, MC 5.1.5, MC 6.1.7)
• Protect…water quality by keeping vehicles from driving through SF Coppei Creek. (Action # 14)
• …reconstruction of approximately 3 miles of drawbottom road [in the Upper Touchet]… (Acton # 34)
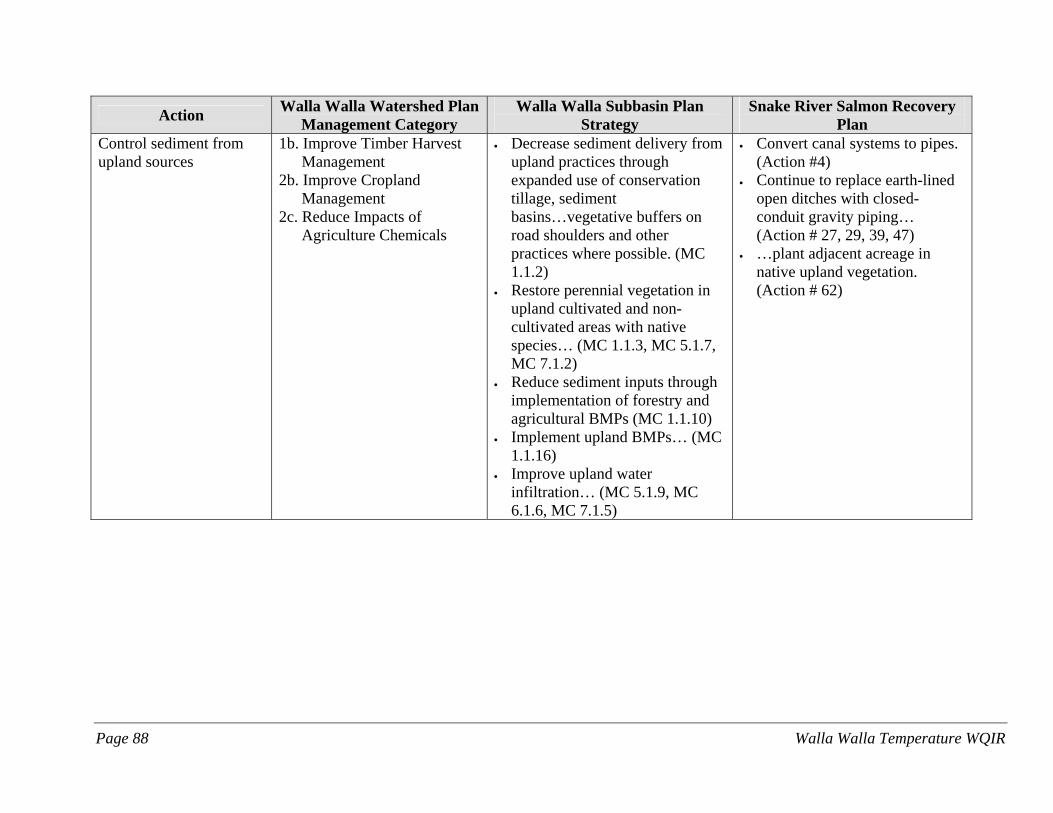
Page 88 Walla Walla Temperature WQIR
Action Walla Walla Watershed PlanManagement Category
Walla Walla Subbasin Plan Strategy
Snake River Salmon Recovery Plan
Control sediment from upland sources
1b. Improve Timber Harvest Management
2b. Improve Cropland Management
2c. Reduce Impacts of Agriculture Chemicals
• Decrease sediment delivery from upland practices through expanded use of conservation tillage, sediment basins…vegetative buffers on road shoulders and other practices where possible. (MC 1.1.2)
• Restore perennial vegetation in upland cultivated and non-cultivated areas with native species… (MC 1.1.3, MC 5.1.7, MC 7.1.2)
• Reduce sediment inputs through implementation of forestry and agricultural BMPs (MC 1.1.10)
• Implement upland BMPs… (MC 1.1.16)
• Improve upland water infiltration… (MC 5.1.9, MC 6.1.6, MC 7.1.5)
• Convert canal systems to pipes. (Action #4)
• Continue to replace earth-lined open ditches with closed-conduit gravity piping… (Action # 27, 29, 39, 47)
• …plant adjacent acreage in native upland vegetation. (Action # 62)
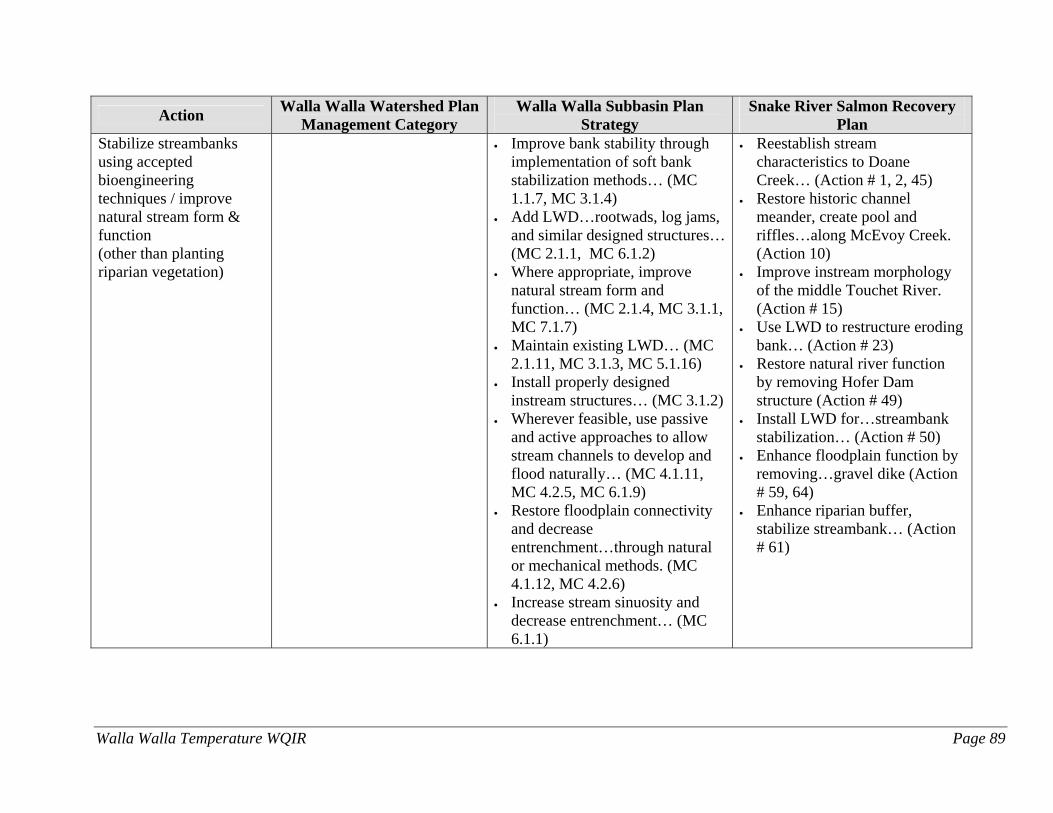
Walla Walla Temperature WQIR Page 89
Action Walla Walla Watershed PlanManagement Category
Walla Walla Subbasin Plan Strategy
Snake River Salmon Recovery Plan
Stabilize streambanks using accepted bioengineering techniques / improve natural stream form & function (other than planting riparian vegetation)
• Improve bank stability through implementation of soft bank stabilization methods… (MC 1.1.7, MC 3.1.4)
• Add LWD…rootwads, log jams, and similar designed structures… (MC 2.1.1, MC 6.1.2)
• Where appropriate, improve natural stream form and function… (MC 2.1.4, MC 3.1.1, MC 7.1.7)
• Maintain existing LWD… (MC 2.1.11, MC 3.1.3, MC 5.1.16)
• Install properly designed instream structures… (MC 3.1.2)
• Wherever feasible, use passive and active approaches to allow stream channels to develop and flood naturally… (MC 4.1.11, MC 4.2.5, MC 6.1.9)
• Restore floodplain connectivity and decrease entrenchment…through natural or mechanical methods. (MC 4.1.12, MC 4.2.6)
• Increase stream sinuosity and decrease entrenchment… (MC 6.1.1)
• Reestablish stream characteristics to Doane Creek… (Action # 1, 2, 45)
• Restore historic channel meander, create pool and riffles…along McEvoy Creek. (Action 10)
• Improve instream morphology of the middle Touchet River. (Action # 15)
• Use LWD to restructure eroding bank… (Action # 23)
• Restore natural river function by removing Hofer Dam structure (Action # 49)
• Install LWD for…streambank stabilization… (Action # 50)
• Enhance floodplain function by removing…gravel dike (Action # 59, 64)
• Enhance riparian buffer, stabilize streambank… (Action # 61)
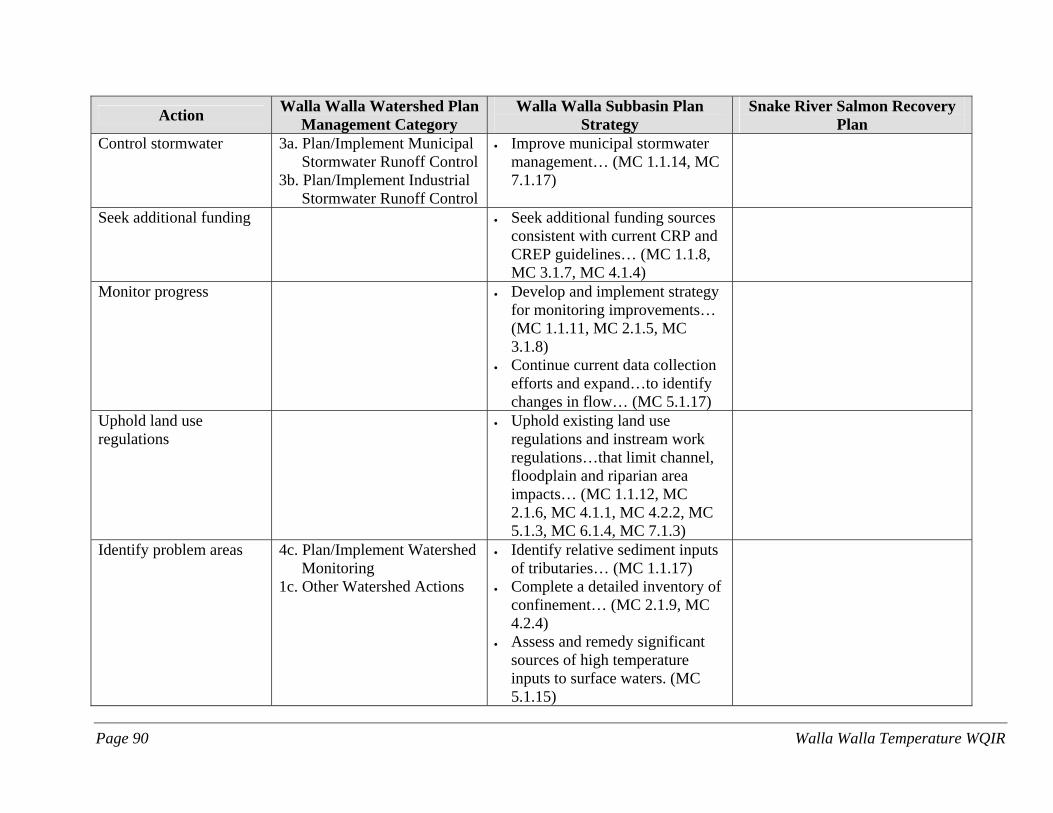
Page 90 Walla Walla Temperature WQIR
Action Walla Walla Watershed PlanManagement Category
Walla Walla Subbasin Plan Strategy
Snake River Salmon Recovery Plan
Control stormwater 3a. Plan/Implement Municipal Stormwater Runoff Control
3b. Plan/Implement Industrial Stormwater Runoff Control
• Improve municipal stormwater management… (MC 1.1.14, MC 7.1.17)
Seek additional funding • Seek additional funding sources consistent with current CRP and CREP guidelines… (MC 1.1.8, MC 3.1.7, MC 4.1.4)
Monitor progress • Develop and implement strategy for monitoring improvements… (MC 1.1.11, MC 2.1.5, MC 3.1.8)
• Continue current data collection efforts and expand…to identify changes in flow… (MC 5.1.17)
Uphold land use regulations
• Uphold existing land use regulations and instream work regulations…that limit channel, floodplain and riparian area impacts… (MC 1.1.12, MC 2.1.6, MC 4.1.1, MC 4.2.2, MC 5.1.3, MC 6.1.4, MC 7.1.3)
Identify problem areas 4c. Plan/Implement Watershed Monitoring
1c. Other Watershed Actions
• Identify relative sediment inputs of tributaries… (MC 1.1.17)
• Complete a detailed inventory of confinement… (MC 2.1.9, MC 4.2.4)
• Assess and remedy significant sources of high temperature inputs to surface waters. (MC 5.1.15)
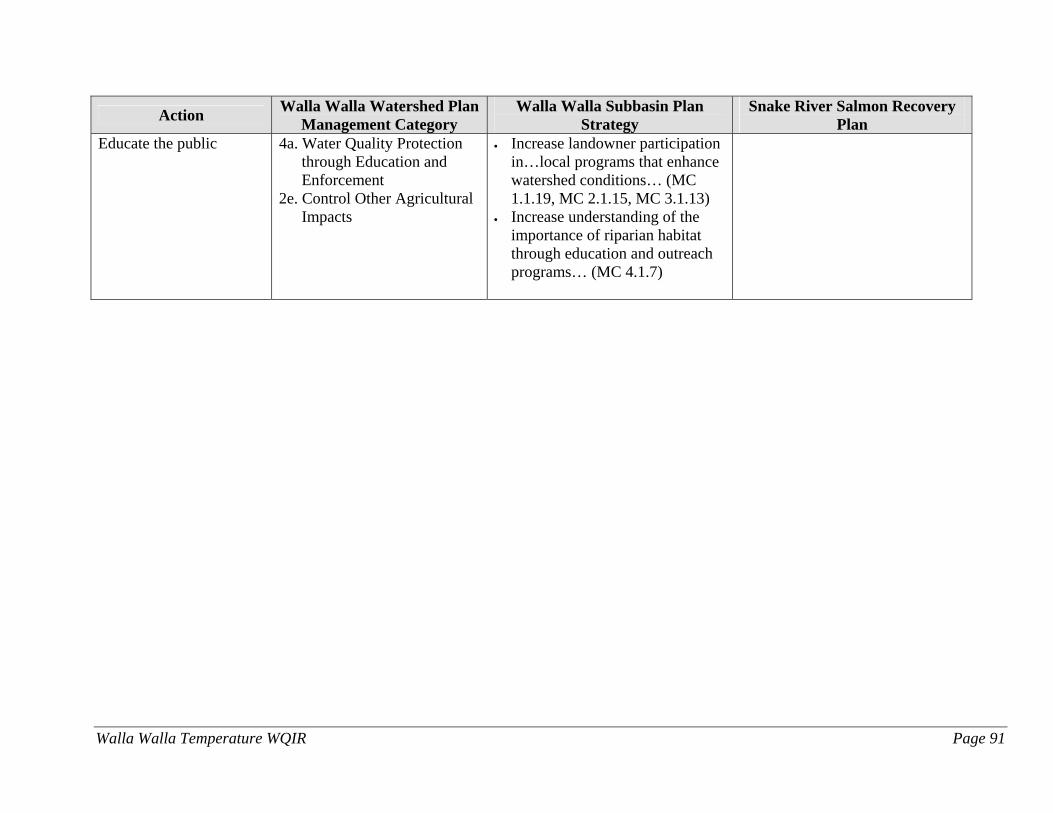
Walla Walla Temperature WQIR Page 91
Action Walla Walla Watershed PlanManagement Category
Walla Walla Subbasin Plan Strategy
Snake River Salmon Recovery Plan
Educate the public 4a. Water Quality Protection through Education and Enforcement
2e. Control Other Agricultural Impacts
• Increase landowner participation in…local programs that enhance watershed conditions… (MC 1.1.19, MC 2.1.15, MC 3.1.13)
• Increase understanding of the importance of riparian habitat through education and outreach programs… (MC 4.1.7)
Page 92 Walla Walla Temperature WQIR
Point sources TMDLs must allocate pollutant loads to point sources in the watershed. In the Walla Walla watershed, the point sources are the Dayton, College Place, and Walla Walla wastewater treatment plants; however, only Dayton discharges effluent during the critical period. Point sources are addressed through the National Pollutant Discharge Elimination System (NPDES) permitting process. The city of Dayton has been given a wasteload allocation in this TMDL, which provides the basis for permit limits when the NPDES permit is reissued. The cities of College Place and Walla Walla did not receive wasteload allocations since they do not discharge effluent during the critical period. Nonpoint sources TMDLs must also assign pollutant loads to nonpoint sources in the watershed. Nonpoint sources are assigned load allocations (LAs) which will be addressed using a variety of approaches to reduce stream temperatures. The approaches that will be used are discussed below. Increase amount of mature riparian vegetation The most important action to reduce stream temperatures is to create or enhance riparian buffers with mature native trees and shrubs to block the amount of sun reaching streams. In some areas, such as the headwaters of the Touchet River and Mill Creek, it is important to protect the existing riparian plants and amount of shade they provide. Riparian buffers that contain a variety of trees, shrubs, and grasses help to decrease temperature in other ways such as: • Reducing the amount of erosion from (increasing stability of) streambanks. The roots of the
riparian vegetation act as a web that holds the soil in place. So, the amount of suspended sediment that can heat up the water is reduced.
• Helping water to infiltrate into the ground, which also helps cool streams when it re-enters as ground water. This increase in groundwater is important to maintain stream flows into the summer months.
• Helping maintain narrow and deep stream channels so that the amount of stream surface subjected to solar radiation is reduced.
Appendix D and Figure 37 lists the percent increase in shade needed for stream segments which can be used to prioritize restoration activities. Prioritizing areas to begin restoration work may be needed since time and available resources to achieve restoration goals are often limited. A prioritized list may be created during the development of the Water Quality Implementation Plan (WQIP). Areas providing habitat or existing migration barriers for bull trout and steelhead should also be considered when prioritizing restoration activities. The Snake River Salmon Recovery Plan, Walla Walla Subbasin Plan, and the Walla Walla Watershed Plan should also be considered in the prioritization of stream restoration areas. Forest practices regulations (Forests and Fish rules) were established as a result of Washington State’s Forest Practices Act. These regulations provide direction on how to manage state and private forests and will be used to meet the shade allocations established in this TMDL for
Walla Walla Temperature WQIR Page 93
private and state forestlands. The effectiveness of the Forests and Fish rules will be measured through the adaptive management process and monitoring of streams in the watershed. If by 2009, the rules do not seem protective enough to allow shade levels to increase and eventually meet the TMDL allocations, Ecology will suggest changes to the Forest Practices Board. Protect or enhance surface and ground water flows Instream flows and water withdrawals are managed through regulatory avenues separate from TMDLs. However, stream temperature is related to the amount of instream flow, and increases in flow generally result in decreases in maximum temperatures. Future projects in the watershed that have the potential to increase surface or ground water flows to streams should be encouraged. For example: • Irrigators should continue their efforts to increase the efficiency of their systems.
• Scientists should perform hydrologic studies to investigate groundwater recharge.
• Residents should locate and protect cool water springs.
• Hydrologists should study effects of surface versus ground water withdrawals on water quantity and quality.
Improve stream channel structure The width to depth ratio of a stream channel is a factor for how much sunlight can reach the stream. Wide, shallow streams are warmer than narrow, deep stream channels. When streams have a high amount of erosion, they have a high sediment load. That sediment load gets deposited on the bottom of the creeks, resulting in a shallower stream. Therefore, management activities that reduce the sediment loading from upland areas and stream channels are recommended. Activities that increase sinuosity and create pools in the creeks, such as increasing the amount of large woody debris, will also help to cool maximum temperatures. Establishing riparian vegetation will also help to improve channel structure by trapping sediments. These trapped sediments build up the streambanks leading to a narrower and deeper stream channel. In the early 1900s, the Army Corps of Engineers built the flood control project on Mill Creek through the city of Walla Walla. Due to the impacts the cement structure is having on threatened fish populations and water quality, the Water Quality Subcommittee supports research on alternatives for notching weirs and decreasing the width of the creek upstream of Walla Walla. Currently there are efforts underway to assess the Mill Creek channel. There is also support for researching alternatives to reduce temperature along the Touchet River through the cities of Dayton and Waitsburg. The Touchet River is channelized through these cities for flood control. Any solution should not compromise the flood protection that these channels provide for the cities of Dayton and Waitsburg. Allow runoff or stormwater to infiltrate While temperature is not included in stormwater permits issued by Ecology at this time, infiltration or retention stormwater BMPs could be beneficial. These BMPs allow water to infiltrate into the ground, rather than directing stormwater over cement or asphalt heated by the sun before entering streams. Examples of BMPs include bio-infiltration swales or detention
Page 94 Walla Walla Temperature WQIR
ponds. Water conservation techniques that prevent runoff from occurring could be considered another BMP. Residents should water lawns or landscaping at a rate that allows infiltration rather than cause water to run off into streets. Apply upland BMPs Applying upland BMPs is important to control erosion and decrease the amount of suspended sediment that can heat up streams. Erosion that begins in the uplands can carry large amounts of sediment to streams, particularly during severe storms. By installing BMPs, such as grassed water ways, using minimum tillage, etc. that slows the rate of runoff and erosion, the risk of sediment entering streams is reduced. In addition, erosion and sediment associated with roads should be prevented. The amount of sediment from roads, road cut and fill slopes, and ditches should be reduced by using native vegetation, ensuring stable cut and fill slopes, and controlling sediment from uplands that fill road ditches. Efforts should be taken to eliminate road damage and erosion from people driving through and playing on muddy roads with their off road vehicles and four wheel drive trucks. Areas far away from surface water need to be designated for people to use their recreational off road vehicles. Perform education and outreach activities Education/outreach is a significant component to the success of any TMDL project. Education efforts should focus not only on informing, but more importantly on behavior change in order to reach water quality goals. For an educational strategy to change peoples’ behavior, surveys should be conducted to identify the reasons (or barriers) why streamside landowners do not have a riparian buffer with mature native plants and trees. Once barriers are identified, an educational strategy that promotes solutions to the barriers can be put into action. This educational approach is called social marketing. Appendix I of the Walla Walla Watershed Plan (HDR/EES, 2005) was prepared by Kooskooskie Commons and lays a foundation for effective outreach programs in the Walla Walla watershed. Groups interested in educating the public should consult this appendix before beginning work. Social marketing strategies may be aimed at streamside landowners and developers. However, a more widespread education campaign should be directed at all landowners since people typically recreate near streams and lakes. In addition, everyone has the ability to impact the quality of the water within the watershed they live in. Education and outreach may be achieved through a variety of methods such as: • Workshops • Newsletters • Informational brochures • Public meetings • Tours • Demonstration projects • One-on-one contact Prevent impacts from recreation Outdoor recreational vehicle (ORV) use on dirt roads can be a significant source of sediment. One particular area of concern is the head of Tiger Canyon to Black Rock. Efforts should be
Walla Walla Temperature WQIR Page 95
made to control water quality impacts from ORV use by educating riders and designating ORV areas that do not have surface water. In addition campers should be educated to avoid actions that will impair water quality. For example, educational campaign should explain why campers should not: • Use riparian vegetation for firewood. • Place rocks in the creek to create pools. • Use riparian trees and shrubs in place of outhouses.
Who needs to participate? There are numerous opportunities to coordinate actions to reduce stream temperature with other planning efforts. This should help to achieve water quality improvements more efficiently and effectively. Ecology will continue to work closely with these groups to improve water quality in the basin. Table 19 lists entities that may take actions to reduce water temperature. The information listed in the table may change as personnel and available funding are better defined during the development of the WQIP. (See Appendix A for a glossary and list of acronyms.) Organizations or agencies that are involved with the activities mentioned above will assist with actions to reduce stream temperatures and are listed below. County and city governments Local regulatory programs involving land use planning and permitting are expected to help reduce water temperatures in the Walla Walla watershed. Shorelines of streams with mean annual flows greater than 20 cubic feet per second (cfs) are protected under the Shoreline Management Act. (Larger rivers greater than 200 cfs east of the Cascade crest are defined as shorelines of statewide significance.) The counties as well as cities develop and manage plans for streams protected by the Shoreline Management Act. In addition, land management practices next to streams may be limited by cities or counties if there are local critical areas ordinances. These ordinances are established by cities and counties and typically prescribe buffer widths for streams or wetlands. County and city governments are tasked with protecting these buffer requirements while permitting activities. City and county governments must periodically update their Shoreline Management Plans and critical areas ordinances. Local governments in the Walla Walla watershed have agreed to consider the Snake River Salmon Recovery Plan when updating their plans and ordinances. Steps should be taken by local governments to encourage a proactive approach to protect water quality. Columbia Conservation District Conservation Districts have authority under Chapter 89.08 of the Revised Code of Washington (RCW) to develop farm plans that protect water quality. Conservation Districts also provide information, education, and technical assistance to residents on a voluntary basis. In 1988 Ecology signed a Memorandum of Agreement (MOA) with conservation districts. This MOA
Page 96 Walla Walla Temperature WQIR
establishes a process for conservation districts to address and resolve agriculture-related water quality complaints received by Ecology. The Columbia Conservation District offers a variety of technical and financial assistance programs to private landowners to address water quality and quantity issues within the Touchet River subbasin. The District has also worked cooperatively with Washington State University and the Washington Department of Fish and Wildlife to monitor and collect temperature data in the Touchet River Subbasin. The District is an active participant in the promotion and installation of the United States Department of Agriculture Farm Service Agency’s Conservation Reserve Enhancement Program (CREP) which enhances riparian buffers. Currently there are 56 contracts in effect, encompassing 1007 acres and 50 stream miles. The District has provided technical and cost-share assistance funding in the past and continues to pursue grant funding for future programmatic needs. The District is also involved in: • Irrigation efficiency projects. • Irrigation diversion screens and metering. • Upland sediment reduction projects. • Livestock best management practice (BMP) projects to improve water quality. Confederated Tribes of the Umatilla Indian Reservation The Confederated Tribes of the Umatilla Indian Reservation (CTUIR) are made up of the Umatilla, Cayuse, and Walla Walla Tribes. The Confederated Tribes of the Umatilla Indian Reservation (CTUIR) have co-management responsibilities in the Walla Walla River basin. Some CTUIR lands are located on the Rainwater Wildlife Area in the upper South Fork Touchet watershed. The CTUIR has expressed interest the Walla Walla watershed TMDLs and are concerned with salmon and steelhead production in the Walla Walla River basin. In 1995, the CTUIR wrote a Salmon Policy that includes a number of actions to improve water quality and enhance steelhead production (CTUIR, 1995). Some actions included in the plan include protecting floodplains and returning beaver to area rivers. CTUIR is currently involved with a number of habitat, hatchery, harvest, and hydrologic restoration actions. These efforts often help improve water quality. For more information, visit: www.umatilla.nsn.us. Natural Resources Conservation Service (NRCS) The United States Department of Agriculture (USDA) NRCS offers technical and financial assistance to landowners for water quality related projects through a variety of programs. One program seeks the input of a local work group to help NRCS establish priority conservation practices for Environmental Quality Improvement Program (EQIP) funding. For more information on the funding available through NRCS and other USDA programs, please see the Funding section in this report.
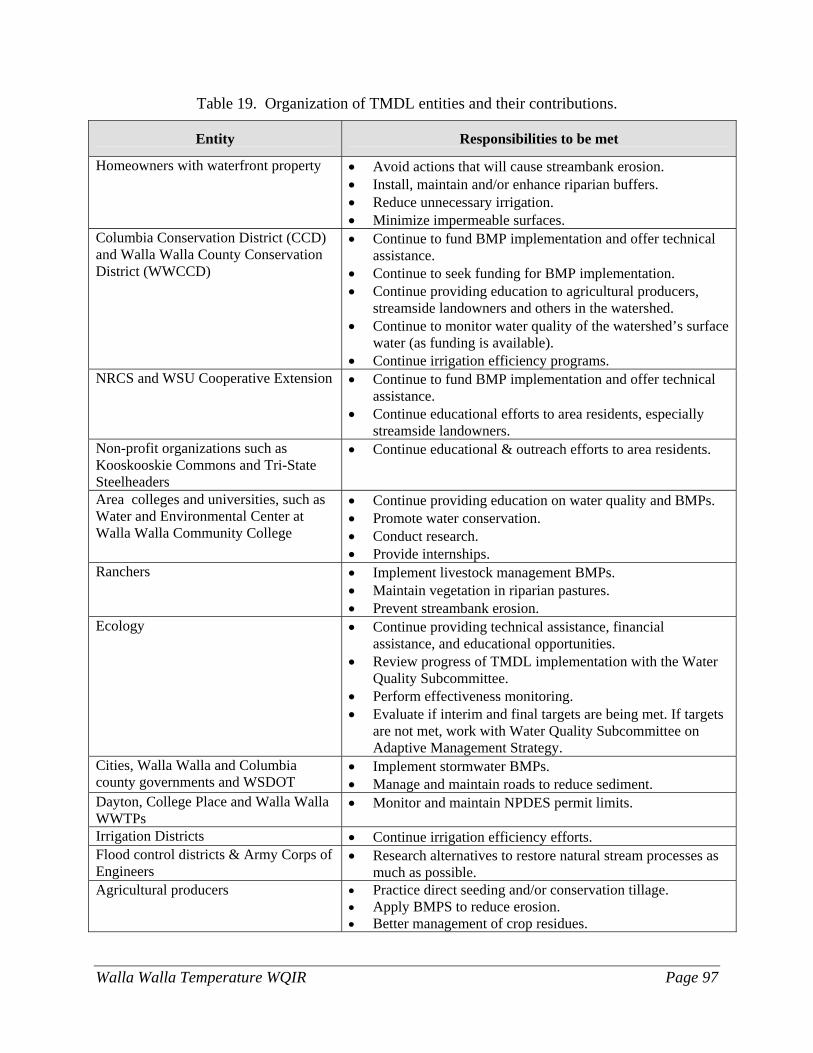
Walla Walla Temperature WQIR Page 97
Table 19. Organization of TMDL entities and their contributions.
Entity Responsibilities to be met
Homeowners with waterfront property • Avoid actions that will cause streambank erosion. • Install, maintain and/or enhance riparian buffers. • Reduce unnecessary irrigation. • Minimize impermeable surfaces.
Columbia Conservation District (CCD) and Walla Walla County Conservation District (WWCCD)
• Continue to fund BMP implementation and offer technical assistance.
• Continue to seek funding for BMP implementation. • Continue providing education to agricultural producers,
streamside landowners and others in the watershed. • Continue to monitor water quality of the watershed’s surface
water (as funding is available). • Continue irrigation efficiency programs.
NRCS and WSU Cooperative Extension • Continue to fund BMP implementation and offer technical assistance.
• Continue educational efforts to area residents, especially streamside landowners.
Non-profit organizations such as Kooskooskie Commons and Tri-State Steelheaders
• Continue educational & outreach efforts to area residents.
Area colleges and universities, such as Water and Environmental Center at Walla Walla Community College
• Continue providing education on water quality and BMPs. • Promote water conservation. • Conduct research. • Provide internships.
Ranchers • Implement livestock management BMPs. • Maintain vegetation in riparian pastures. • Prevent streambank erosion.
Ecology • Continue providing technical assistance, financial assistance, and educational opportunities.
• Review progress of TMDL implementation with the Water Quality Subcommittee.
• Perform effectiveness monitoring. • Evaluate if interim and final targets are being met. If targets
are not met, work with Water Quality Subcommittee on Adaptive Management Strategy.
Cities, Walla Walla and Columbia county governments and WSDOT
• Implement stormwater BMPs. • Manage and maintain roads to reduce sediment.
Dayton, College Place and Walla Walla WWTPs
• Monitor and maintain NPDES permit limits.
Irrigation Districts • Continue irrigation efficiency efforts. Flood control districts & Army Corps of Engineers
• Research alternatives to restore natural stream processes as much as possible.
Agricultural producers • Practice direct seeding and/or conservation tillage. • Apply BMPS to reduce erosion. • Better management of crop residues.
Page 98 Walla Walla Temperature WQIR
Oregon Department of Environmental Quality (ODEQ) Approximately a quarter of the Walla Walla basin lies in Oregon. ODEQ published the Walla Walla Subbasin Stream Temperature Total Maximum Daily Load and Water Quality Management Plan in August 2005 (ODEQ, 2005). EPA approved this TMDL on September 29, 2005. ODEQ’s TMDL includes several actions Oregon residents may use to reduce water temperature. Implementation work underway in Oregon has the potential to positively affect water quality in the Washington portion of the river. BMPs recommended to reduce temperature problems include increasing riparian vegetation and decreasing channel width to depth ratios. Designated agencies then develop plans for how they will implement the TMDL. These plans may call for a variety of BMPs. For more information, please visit: http://www.deq.state.or.us/wq/TMDLs/wallawalla.htm#wwb. Umatilla National Forest This TMDL does not address the Umatilla National Forest in Washington. However, ODEQ did address the Umatilla National Forest in their TMDL. The Umatilla National Forest participated and contributed to the development of TMDL and Water Quality Management Plan for the Walla Walla Subbasin in Oregon. In general, documentation of water quality conditions and management practices have been successful in demonstrating commitment to improving water quality. Any actions the Forest Service takes to maintain or enhance riparian areas and control erosion will help provide cleaner water downstream. Region 6 of the United States Forest Service (Forest Service) and Ecology signed a memorandum of agreement for Meeting Responsibilities under Federal and State Water Quality Laws. This document recognizes the Forest Service as the designated management agency for meeting Clean Water Act requirements on National Forest Lands. Forest Service and Ecology staff meet annually to review progress on the MOA. Forest Plan standards, guidelines and amendments, including the aquatic conservation strategy contained in Pacfish, are the foundation for water quality protection and management on the Umatilla National Forest. Project design, BMPs, monitoring activities, restoration programs, and collaboration are the mechanisms for achieving water quality protection. Long-term monitoring programs have been successful in identifying impaired water quality. Significant progress has been made addressing water quality problems over the last 10 years through a variety of means including changes in management practices, riparian protection, BMPs, and watershed/aquatic restoration. The Umatilla National Forest Land and Resource Management Plan (USDA Forest Service, 1990) is currently being revised to account for resource and social changes as well as include new scientific information. The current plan was developed in 1990. For more information visit: www.fs.fed.us/r6/uma/blue_mtn_planrevision/index.shtml.
Walla Walla Temperature WQIR Page 99
Walla Walla County Conservation District Conservation Districts have authority under Chapter 89.08 RCW to develop farm plans that protect water quality. Conservation Districts also provide information, education, and technical assistance to residents on a voluntary basis. In 1988 Ecology signed a Memorandum of Agreement (MOA) with conservation districts. This MOA establishes a process for conservation districts to address and resolve agriculture-related water quality complaints received by Ecology. The Walla Walla County Conservation District has been active in installing riparian buffers along watershed streams. The District also provides technical and financial assistance for: • Irrigation efficiency projects. • Fish passage barrier removal. • Fish screen design and installation. • Metering of pumps for surface and shallow groundwater withdrawals. • Sediment reduction. • Livestock influenced water quality improvement projects. • Stream restoration projects. In addition, the District participates in educational programs. The District also applied for and received a grant to expand their riparian buffer program to urban areas in the watershed. Walla Walla Watershed Planning Unit The watershed planning process offers a tool to allow local guidance in identifying, prioritizing and developing solutions to water resource management issues. The Planning Unit has been active since the year 2000. In May 2005, the final Walla Walla Watershed Plan was adopted. The Planning Unit has been awarded grants for various activities listed in their plan and they anticipate additional grants will be received in the future for other activities in the plan. The Walla Walla Watershed Planning Unit works with other local planning and advocacy groups such as the Walla Walla Basin Watershed Council and Walla Walla Watershed Alliance to address a variety of water resource issues. These groups have coordinated to varying degrees on the following planning processes:
• Bi-State Habitat Conservation Plan (HCP) • Walla Walla Subbasin Plan • Comprehensive Irrigation District Management Plan (CIDMP) • Walla Walla Basin Water Management Initiative (WMI) • Snake River Salmon Recovery Plan
All of these plans include strategies to improve water quantity, water quality or fish habitat that could be used to meet the TMDL load allocations.
Page 100 Walla Walla Temperature WQIR
Washington State Department of Ecology (Ecology) Ecology has been delegated authority under the federal Clean Water Act by the U.S. EPA to: • Establish water quality standards • Administer the NPDES wastewater permitting program • Enforce water quality regulations under Chapter 90.48 RCW. Ecology responds to complaints, conducts inspections, and issues NPDES and State Waste Discharge permits as part of its responsibilities under state and federal laws and regulations. Ecology recently completed a stormwater management manual for eastern Washington. This is designed to guide local authorities on how to meet new stormwater discharge regulations. Ecology is in the process of developing the municipal general stormwater discharge permit which may be required for the cities of Walla Walla and College Place. When the permits are implemented they will help regulate stormwater related water quality problems. In cooperation with conservation districts and other local organizations, Ecology will pursue implementation of BMPs for agricultural and other land uses. Ecology provides technical and financial assistance to people interested in installing BMPs. Ecology has a competitive grant and loan process for local governments and non-profit organizations. Grant money can be used to plan and install BMPs and loans can be used to purchase direct seed equipment or improve wastewater treatment facilities. The agency’s Environmental Assistance Program conducts effectiveness monitoring to determine if water quality is improving. Ecology is authorized under Chapter 90.48 RCW to initiate enforcement actions if voluntary compliance with state water quality standards is unsuccessful. However, it is the goal of all participants in the Walla Walla River TMDL process to achieve clean water through voluntary control actions. Washington State Department of Fish and Wildlife The Washington State Department of Fish and Wildlife (WDFW) is actively involved with habitat improvement, hatchery production, technical assistance, and assessments in the watershed. Habitat improvement activities include dam removal and passage projects, identifying areas in need of fish screens and installing them, developing a native plant nursery and assisting with Habitat Conservation Plans. WDFW’s hatchery production activities include releasing trout and steelhead, evaluating hatchery fish success, and performing habitat surveys. WDFW provides technical assistance on habitat improvement projects beginning with project identification and design through the permit process. WDFW also gives technical assistance to regional planning efforts. WDFW has an extensive assessment role in the watershed, including spawning surveys, monitoring species distribution, measuring stream flows, conducting instream flow studies, and monitoring stream temperature. WDFW staff also works to obtain funding for habitat improvement projects, and offers financial assistance to landowners for similar projects. WDFW will need to make sure permits issued for habitat projects do not impact water quality. Also as WDFW acquires new land they should maintain the same BMPs necessary for healthy riparian corridors.
Walla Walla Temperature WQIR Page 101
Washington State Department of Natural Resources (DNR) DNR has primary administrative and enforcement responsibilities for the Forest Practices Act (Ch. 76.09 RCW), which includes implementation of the 1999 "Forests and Fish Report." The Forests and Fish Report (ESHB 2091) was adopted by the state legislature to protect salmon listed under the federal Endangered Species Act, other aquatic species and clean water, while keeping the timber industry economically viable. The resulting rules address forest roads, unstable slopes, riparian shading, and effectiveness monitoring. This report can be found online at: http://www.dnr.wa.gov/forestpractices/rules/forestsandfish.pdf . Load allocations are included in this TMDL for non-federal forest lands in accordance with Section M-2 of the Forests and Fish Report. DNR is encouraged to condition forest practices to prohibit any further reduction of stream shade and not waive or modify any shade requirements for timber harvesting activities on state and private lands. DNR is also responsible for oversight of activities on forest roads. New forest practices rules also apply for roads, including standards for new road construction and upgrading existing roads. Under the new rules, roads must provide for better control of road-related sediments, provide better streambank stability protection, and meet current best management practices. Washington State University Extension WSU Cooperative Extension offers educational opportunities on a wide range of topics about water quality. Many of the educational materials offered by WSU Extension are located on the internet at http://wawater.wsu.edu/. Meetings and satellite conferences with specific topics related to water quality are also held periodically. Anyone interested in participating in these events should contact the local WSU Extension office to be notified when they are offered. WSU Extension has an ongoing commitment to develop educational publications on emerging issues. Notices about these publications and funding opportunities are also posted on the above Web site. WSU Extension staff members are willing to help inform watershed residents about this TMDL implementation strategy and BMPs that may be voluntarily applied to improve water quality. Washington Water Trust (WWT) WWT is a private, nonprofit organization whose mission is to restore instream flows to benefit water quality, fisheries and recreation in Washington’s rivers and streams. WWT cooperates with landowners, tribes and local organizations to obtain existing water rights from people willing to sell, lease, or donate their water right. The group’s focus is on small streams with endangered or threatened fish stocks. WWT believes that focusing their efforts on smaller streams will result in significant environmental benefits. For more information visit: http://www.thewatertrust.org.
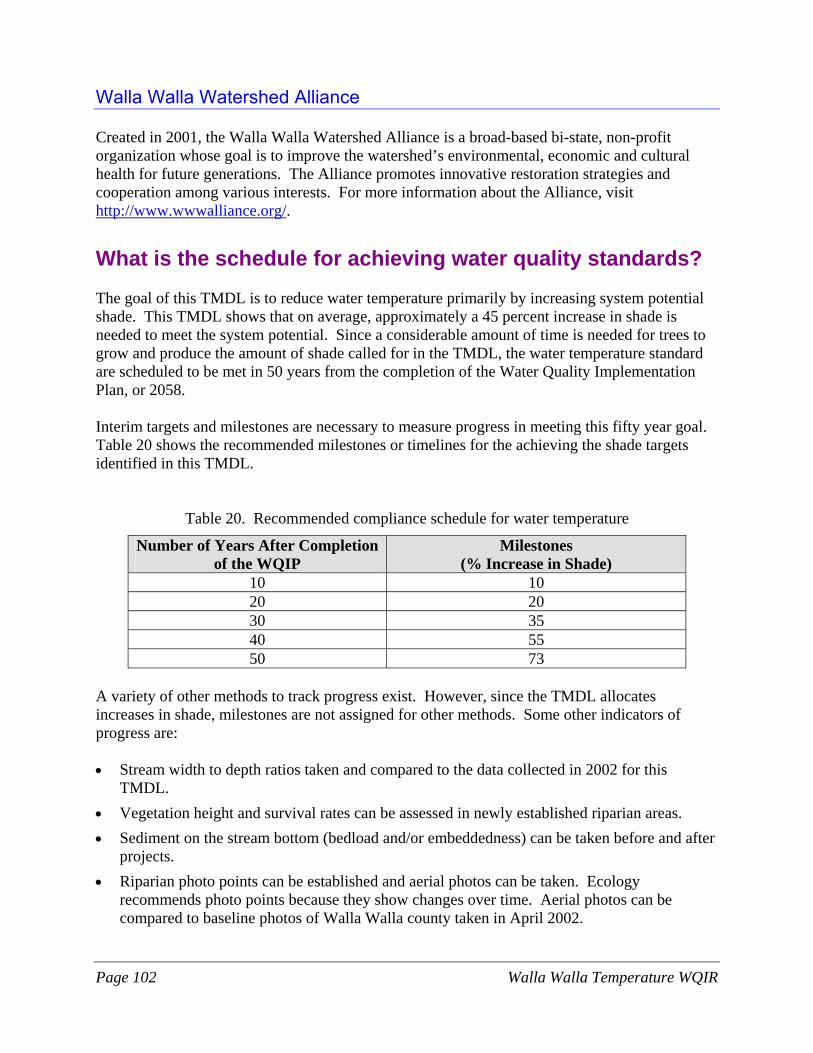
Page 102 Walla Walla Temperature WQIR
Walla Walla Watershed Alliance Created in 2001, the Walla Walla Watershed Alliance is a broad-based bi-state, non-profit organization whose goal is to improve the watershed’s environmental, economic and cultural health for future generations. The Alliance promotes innovative restoration strategies and cooperation among various interests. For more information about the Alliance, visit http://www.wwwalliance.org/.
What is the schedule for achieving water quality standards? The goal of this TMDL is to reduce water temperature primarily by increasing system potential shade. This TMDL shows that on average, approximately a 45 percent increase in shade is needed to meet the system potential. Since a considerable amount of time is needed for trees to grow and produce the amount of shade called for in the TMDL, the water temperature standard are scheduled to be met in 50 years from the completion of the Water Quality Implementation Plan, or 2058. Interim targets and milestones are necessary to measure progress in meeting this fifty year goal. Table 20 shows the recommended milestones or timelines for the achieving the shade targets identified in this TMDL.
Table 20. Recommended compliance schedule for water temperature
Number of Years After Completion of the WQIP
Milestones (% Increase in Shade)
10 10 20 20 30 35 40 55 50 73
A variety of other methods to track progress exist. However, since the TMDL allocates increases in shade, milestones are not assigned for other methods. Some other indicators of progress are: • Stream width to depth ratios taken and compared to the data collected in 2002 for this
TMDL. • Vegetation height and survival rates can be assessed in newly established riparian areas. • Sediment on the stream bottom (bedload and/or embeddedness) can be taken before and after
projects. • Riparian photo points can be established and aerial photos can be taken. Ecology
recommends photo points because they show changes over time. Aerial photos can be compared to baseline photos of Walla Walla county taken in April 2002.
Walla Walla Temperature WQIR Page 103
• Stream temperature can also be used to show progress. However, unless there has been a considerable change in stream flow or stream restoration work, lower temperatures may be difficult to detect.
• Increase in the number of steelhead and bull trout in a given stream reach. This could also be a redd count.
Reasonable assurances When establishing a TMDL, reductions of a particular pollutant are allocated among the pollutant sources (both point and nonpoint sources) in the water body. For the Walla Walla Watershed Temperature TMDL, both point and nonpoint sources exist. TMDLs (and related Action Plans) must show “reasonable assurance” that these sources will be reduced to their allocated amount. Education, outreach, technical and financial assistance, permit administration, and enforcement will all be used to ensure that the goals of this water clean up plan are met. Organizations and their commitments under permits, laws, rules, and programs to reduce stream temperatures in the watershed are also expected to result in improved water quality. Ecology believes that the following activities are already supporting this TMDL and add to the assurance that temperature in the Walla Walla Watershed will meet conditions provided by Washington State water quality standards. This assumes that the activities described below are continued and maintained. The goal of the Walla Walla Watershed Water Quality Improvement Report for temperature is for the waters of the basin to meet the state’s water quality standards. There is considerable interest and local involvement toward resolving the water quality problems in the Walla Walla watershed. Numerous organizations and agencies are already engaged in stream restoration and source correction actions that will help resolve the temperature problem. The following rationale helps provide reasonable assurance that the Walla Walla watershed nonpoint source TMDL goals will be met in fifty years after completion of the Water Quality Implementation Plan.
• Ecology will work with the city of Dayton to develop a compliance schedule in their NPDES permit to meet the requirements of this TMDL.
• In 1998 through 2001, the city of College Place restored approximately a third of a mile of Garrison Creek (HDR/EES, 2005). The City planted native vegetation in a buffer about 150 feet wide on both sides of the creek.
• In the Columbia County portion of the watershed, the Columbia Conservation District, FSA
and NRCS have 56 CREP contracts totaling 1007 acres along 50 stream miles.
• The Confederated Tribes of the Umatilla Indian Reservation (CTUIR) received 400,000 dollars in funding from the Washington Department of Ecology under the new Columbia River Management Initiative. CTUIR in partnership with the United States Army Corps of Engineers will use the money to help fund a feasibility study researching methods to enhance flows in the Walla Walla watershed with water from the Columbia River. CTUIR is also working on stream restoration activities. For example, in 300 trees were planted along five
Page 104 Walla Walla Temperature WQIR
miles of the South Fork Touchet River. In an effort led by the Walla Walla County Conservation District, CTUIR staff helped remove a fish passage barrier from the Walla Walla River at Gose Street (CTUIR Dept. of Natural Resources, 2006).
• As part of implementing the Snake River Salmon Recovery Plan, local governments in the Walla Walla watershed committed to restore and/or protect 30 acres of road right away per year for the next 15 years. In addition, the counties agreed to restore perennial grass to road ditches and cut slopes.
• Tri-State Steelheaders have planted countless trees and shrubs along streams to improve fish habitat. The group of volunteers also removed illegally dumped concrete and other debris. The group also teaches conservation to hundreds of local students in elementary and high school, and has also conducted the course in Spanish at a Walla Walla County farm-labor camp (Ecology, 2002).
• Upland BMPs are also being applied in the watershed. Dryland farmers are transitioning from traditional farming techniques, which involve intense soil tillage, to a more sustainable practice of direct seeding or minimum tillage practices. By limiting tillage trips through the field, the soil not only maintains its structure, but the relatively undisturbed crop residue from the previous crop shields the soil from wind and rain erosion. Other BMPs, such as grassed waterways, divided slope farming, and strip cropping are being installed as further measures to keep the soil in place. These BMPs, coupled with direct seeding, become an effective system which results in a dramatic reduction in total runoff.
• The Washington State Department of Fish and Wildlife has been working to improve fish habitat and monitor water quality. WDFW helped remove two dams and funded two Landowner Incentive Program grants along McEvoy and Yellowhawk creeks to improve stream flow and riparian vegetation. Stream flow is measured during low flow every two weeks and numerous temperature probes are also deployed in the summer. WDFW also provides technical assistance and permitting for stream restoration projects.
• The city of Walla Walla and the Walla Walla Basin Watershed Council are working on a shallow and deep aquifer recharge program. The program’s goal is to supplement natural recharge of the shallow aquifer, and potentially increase the groundwater flow return to the Walla Walla River (Walla Walla Basin Watershed Council Web site, 2007).
• The Walla Walla Backyard Stream Team is a group of citizens volunteering time to promote stream and riparian restoration in urban areas. One of the Team’s projects is called the Pledge Project, which gathers pledges from residents to perform actions that protect surface and ground water. The Pledge project aims to change the way people maintain their lawns, care for their septic system, reduce toxics, dispose of animal waste, reduce stormwater, and protect streamside vegetation. The Team’s second major effort is to coordinate the restoration of 1,000 feet of riparian vegetation in Fort Walla Walla Park along Garrison Creek (Walla Walla Watershed Planning Website, 2006).
• In Walla Walla County, approximately 181 stream miles of riparian buffer have been installed through the Conservation Reserve Enhancement Program (CREP). Funding and assistance for this project is provided by the Walla Walla County Conservation District
Walla Walla Temperature WQIR Page 105
through Washington State, the Farm Service Agency (FSA) and Natural Resources Conservation Service (NRCS) (NACD, 2004).
• During Ecology’s 2006 funding cycle, the Walla Walla County Conservation District applied for and received a grant for their proposed Create Urban Riparian Buffers (CURB) program. This project will focus on Yellowhawk and Garrison creeks.
• The Walla Walla Water Management Initiative is an Ecology pilot project designed to identify innovative solutions to water management in the watershed.
• Working with the Walla Walla Watershed Planning Unit, Ecology is developing an instream flow rule that protects flows for fish and supplies the water needed for current demand and growth.
• The Walla Walla Watershed Planning Unit passes some of their grant funding to other entities to perform activities identified in the Watershed Plan. The Planning Unit is paying for a signage project to increase resident’s awareness of watershed boundaries. Planning Unit funds are also paying for some riparian planting on Cottonwood, Yellowhawk, and Russel creeks and a part of the Gose Street Project led by the Walla Walla County Conservation District.
• Since 2003, the Washington Water Trust (WWT) has obtained an estimated eight cubic feet per second of water rights in the Walla Walla basin. Included in this estimate is the purchase of a water right on the Touchet River, one lease on Mill Creek, and two leases on Cold Creek (WWT Web site: www.thewatertrust.org).
These examples of implementation activities provide evidence of the funding commitments made by several agencies and organizations over the past 10 or more years to improve water quality and fish habitat. The Bonneville Power Administration, Salmon Recovery Funding Board, United States Army Corps of Engineers, and the Confederated Tribes of the Umatilla Indian Reservation are just a few of the entities that dedicate funds to restore healthy habitat and good water quality for native salmonids. Financial assistance from these and other groups are likely to continue and are discussed further under the Potential Funding Sources section below. Whenever applicable BMPs are not being used and Ecology has reason to believe that individual sites or facilities are causing pollution in violation of RCW 90.48.080, Ecology may pursue orders, directives, permits, or enforcement actions to gain compliance with the state’s water quality standards. Ecology will enforce water quality regulations under Chapter 90.48 RCW in pursuit of the objectives of this TMDL. While Ecology has the authority to carry out these actions, it is the goal of all participants in the Walla Walla Watershed TMDL process (including Ecology) to achieve clean water through voluntary control actions.
Adaptive management TMDL reductions should be achieved in 50 years after the completion of the Water Quality Implementation Plan (WQIP). However, if water quality standards are met without meeting the
Page 106 Walla Walla Temperature WQIR
percent increase in shade determined in this document, then the objectives of this TMDL are met. This report has identified interim targets described in percent increase in shade. The Water Quality Implementation Plan will also identify targets in terms of implemented cleanup actions. Partners will work together to monitor progress towards these goals, evaluate successes, obstacles, and changing needs. Adjustments will be made to the cleanup strategy as needed. It is ultimately Ecology’s responsibility to assure that cleanup is being actively pursued and water standards are achieved. Adaptive management has been defined in state law as “…scientific methods to test the results of actions taken so that the management and related policy can be changed promptly and appropriately” (RCW 79.09.020). So, adaptive management is a continuing attempt to adapt to uncertainty associated with management actions. The key stages of the adaptive management cycle are to monitor, evaluate, and implement. The Water Quality Subcommittee and Ecology will use adaptive management when water monitoring data shows that the TMDL targets are not being met or implementation activities are not producing the desired result. A feedback loop consisting of the following steps will be implemented:
Step 1. The activities in the water quality implementation plan are put into practice.
Step 2. Programs and BMPs are evaluated for technical adequacy of design and installation. The effectiveness of the activities (or WQIP) is evaluated by assessing new monitoring data and comparing it to the data used to set the TMDL targets.
Step 3. If the goals and objectives are achieved, the implementation efforts (or WQIP) are adequate as designed, installed, and maintained. Project success and accomplishments should be publicized and reported to continue project implementation and increase public support. If not, then BMPs (or the WQIP) could be modified or new actions identified. The new or modified actions are then applied as in Step 1.
Monitoring progress EPA (1991) guidance calls for a monitoring program for evaluating progress on TMDLs. Monitoring is an important component of any implementation strategy. Monitoring is needed to keep track of what activities have or have not been done, as well as to measure the success or failure of management actions. Monitoring should also be done after water quality standards are achieved to ensure implementation measures are effective and water quality standards continue to be met. A quality assurance project plan (QAPP) should be prepared for whatever monitoring is conducted. The QAPP should follow Ecology guidelines (Lombard and Kirchmer, 2004) paying particular attention to consistency in sampling and analytical methods.
Walla Walla Temperature WQIR Page 107
Monitoring activities associated with this TMDL includes interim monitoring, effectiveness monitoring, and implementation plan monitoring. These monitoring activities are described below: Interim monitoring This temperature TMDL calls for an increase in system potential shade, which will take several years to establish. Interim monitoring of water temperatures during summer is recommended. This interim monitoring may be as infrequent as five-year intervals because of the long time needed for trees to grow. Monitoring of the type and extent of riparian vegetation is also recommended. Methods that could be used to measure shade at the center of various stream locations are hemispherical photography, or solar pathfinder instruments. Implementation Plan monitoring After the Water Quality Implementation Plan is completed, Ecology will track which activities are completed. Tracking implementation plan activities is important so actions that did not work can be identified. This is particularly important if an adaptive management is employed. The Water Quality Implementation Plan will give additional details about the process Ecology will use to track progress in applying identified actions. However, Ecology expects that those entities conducting restoration projects or installing BMPs will be responsible for monitoring plant survival rates and maintaining the BMPs installed. Effectiveness monitoring Effectiveness monitoring results are used to determine if the interim targets and/or water quality standards are being achieved. Ecology usually performs this monitoring five years after the Water Quality Implementation Plan is finished. The ability for Ecology to conduct this monitoring depends upon the availability of resources. However, volunteers and local groups can also perform monitoring to measure progress of this TMDL. They can monitor the suggested items found in the ‘What is the Schedule for Achieving Water Quality Standards?’ section above. If the streams are found to not meet the interim targets and/or water quality criteria, an adaptive management strategy will be adopted and future effectiveness monitoring will need to be scheduled.
Potential funding sources A wide variety of potential funding sources exist for the water quality improvement projects in the Walla Walla basin. There is also the potential for collaborating with other planning processes to maximize efficiency. Implementation activities are varied and funding sources appropriate for some projects may not be suitable for others. Therefore a more detailed analysis of available funding sources is needed as part of the Water Quality Implementation Plan. Public sources of funding are administered by federal and state government programs. Private sources of funding normally come from private foundations. Foundations provide funding to nonprofit organizations with tax-exempt status. Forming partnerships with government agencies, nonprofit organizations, and private businesses can effectively maximize funding opportunities.

Page 108 Walla Walla Temperature WQIR
The U.S. Department of Agriculture (USDA) – Natural Resources Conservation Service (NRCS) and USDA Farm Service Agency (FSA) administer federal non-regulatory programs such as the:
• Conservation Reserve Program (CRP) • Conservation Reserve Enhancement Program (CREP) • Continuous Conservation Reserve Program (CCRP) • Environmental Quality Incentives Program (EQIP) • Wildlife Habitat Incentives Program (WHIP) • Grassland Reserve Program (GRP) • Wetlands Reserve Program (WRP) • Conservation Security Program (CSP) The NRCS programs provide technical, educational, and financial assistance to eligible farmers and ranchers. The programs aid landowners in addressing natural resource concerns on their lands in an environmentally beneficial and cost-effective manner. The USDA FSA administers CREP and CRP, both of which the NRCS has technical responsibility over. These are both voluntary cost share programs designed to restore and enhance habitat and increase bank stability along waterways on private lands. These programs offer payments for annual rental, signing, cost share, practice, and maintenance. In exchange landowners must remove land from production and grazing, under 10-15 year contracts. For more information about these programs, please visit NRCS’ Web site at: http://www.wa.nrcs.usda.gov/programs/index.html. Potential funding sources available through Ecology’s water quality financial assistance program include: • Centennial Clean Water Fund grants • Section 319 grants under the federal Clean Water Act • State Revolving Fund (SRF) loans • Terry Husseman (Coastal Protection Funds) The Walla Walla County and Columbia Conservation Districts provide cost-share programs to irrigators and ranchers. Implementing BMPs on private property usually requires that individual landowners make an investment in the practice. Conservation Districts can apply for Washington State Conservation Commission and Ecology grants to provide funding for these cost-share programs. The Confederated Tribes of the Umatilla Indian Reservation’s involvement in the subbasin provides additional opportunities for funding. These include but are not limited to cost-matching from non-federal rate payer Bonneville Power Administration, EPA tribal gap, and Bureau of Indian Affairs money. These resources may be available to assist in on-the-ground research. CTUIR is ready to develop and implement habitat restoration projects that may ultimately result in temperature reductions. Other funding sources available to some groups in the Walla Walla watershed are the Salmon Recovery Funding Board, the Bonneville Power Administration, and the Bonneville Power Foundation.
Walla Walla Temperature WQIR Page 109
Landowners are using their own money to install BMPs, convert to minimum tillage practices, etc. Landowners can contribute 25 percent of project costs in a cost-share program to 100 of the cost to purchase direct seed equipment. In either case, funding agencies should continue to help ease the economic burden landowners face when making changes to improve water quality.
Summary of public involvement methods Public involvement is vital in any TMDL. Nonpoint TMDLs are successful only when the watershed landowners and other residents are involved. They are the closest to and most knowledgeable of the watershed resources. The Walla Walla Basin has a host of local, state, federal and tribal agencies, and non-governmental organizations involved in water resource protection. Many private landowners in the area are intimately involved with these efforts. A focus sheet on the thermal infrared flight performed as part of the technical study was distributed by Ecology in July 2002 (Ecology 2002b). Ecology’s temperature technical report was reviewed by the Walla Walla Watershed Planning Unit’s Water Quality Subcommittee (Water Quality Subcommittee), the CTUIR and the EPA. The draft technical study report was distributed in June 2006 and edited based on the groups’ comments. Ecology published the technical study in April 2007. The TMDL advisory group merged into the Water Quality Subcommittee in June 2006. The Water Quality Subcommittee has provided invaluable assistance with the creation of the implementation strategy. This Water Quality Improvement Report has been reviewed at Water Quality Subcommittee meetings held in the winter of 2006 and spring of 2007. All Water Quality Subcommittee meetings are open to the public. Meeting announcements and past meeting notes are sent to a mailing list of approximately seventy people. Ecology also maintains a website on the TMDL at http://www.ecy.wa.gov/programs/wq/tmdl/wallawalla/index.html. A 30-day public comment period for this report was held from April 18 through May 21, 2007. A news release was sent to all local media in the Walla Walla watershed. Advertisements about the comment period were placed in the following publications: • Walla Walla Union-Bulletin • Dayton Chronicle • The Times Ecology and the Columbia and Walla Walla County conservation districts developed a flyer to mail to watershed residents. The flyer provided information about the Walla Walla Temperature and pH and Dissolved Oxygen TMDLs and on the comment period. Approximately 1,000 flyers were mailed the week of May 7, 2007. Four comments were received during the comment period. Responses to the comments are found in Appendix B.
Page 110 Walla Walla Temperature WQIR
Next steps After the public comment period on this Water Quality Improvement Report is complete and edits and responses to comments are done, the report is submitted to the Environmental Protection Agency (EPA) for approval. Once the TMDL has been approved by EPA, the Water Quality Implementation Plan (WQIP) is developed within one year. Ecology will continue to work with the Water Quality Subcommittee and other residents to create the WQIP. The WQIP expands on information provided in this plan and includes a(n): • Table of who will do what, where, and when. • Strategy of how to monitor progress • Adaptive management strategy • List of potential funding sources Development of the WQIP will be delayed until all TMDLs in the watershed have been approved by EPA. One WQIP will be developed for all Walla Walla watershed TMDLs: • Chlorinated Pesticides and PCBs TMDL (already approved by EPA) • Fecal Coliform (already approved by EPA) • Temperature (this document) • Dissolved Oxygen and pH (in publication) The Water Quality Subcommittee decided to write only one multi-parameter WQIP because many of the BMPs recommend for this TMDL will also help to improve fecal coliform, dissolved oxygen, pH, etc. This approach will allow the most effective implementation strategy to address all the water quality impairments in the watershed. Once the WQIP is in place, Ecology will strive to ensure that there continues to be good cooperation and coordination with other agencies and entities regarding implementation activities in the region.
Walla Walla Temperature WQIR Page 111
References Adams, T.N. and K Sullivan, 1989. The physics of forest stream heating: a simple model. Timber, Fish, and Wildlife, Report No TFW-WQ3-90-007. Washington State Department of Natural Resources, Olympia, WA. Bartholow, J.M., 2000. Estimating cumulative effects of clearcutting on stream temperatures, Rivers, 7(4), 284-297. Belt, G.H., J. O'Laughlin, and W.T. Merrill, 1992. Design of Forest Riparian Buffer Strips for the Protection of Water Quality: Analysis of Scientific Literature. Report No. 8. Idaho Forest, Wildlife, and Range Policy Analysis Group, University of Idaho, Moscow, ID. Beschta, R.L., R.E. Bilby, G.W.Brown, L.B. Holtby, and T.D. Hofstra, 1987. Stream temperature and aquatic habitat: fisheries and forestry interactions. In: Streamside management: forestry and fisher interactions, E.O. Salo and T.W. Cundy, editors, pp 192-232. Proceedings of a conference sponsored by the College of Forest Resources, University of Washington, Seattle WA. Contribution No. 57 – 1987. Bolton, S. and C. Monohan, 2001. A review of the literature and assessment of research needs in agricultural streams in the Pacific Northwest as it pertains to freshwater habitat for salmonids. Prepared for: Snohomish County, King County, Skagit County, and Whatcom County. Prepared by: Center for Streamside Studies, University of Washington, Seattle, WA. Boyd, M.S., 1996. Heat source: stream, river, and open channel temperature prediction. Oregon State University. M.S. Thesis. October 1996. Boyd, M. and C. Park, 1998. Sucker-Grayback Total Daily Maximum Load. Oregon Department of Environmental Quality and U.S. Forest Service. Boyd, M., and Kasper, B. 2003. Analytical methods for dynamic open channel heat and mass transfer: Methodology for heat source model Version 7.0. http://www.deq.state.or.us/wq/TMDLs/tools.htm Brady, D.K., W.L. Graves, and J.C. Geyer, 1969. Surface heat exchange at power plant cooling lakes. Cooling water discharge project report No. 5. Edison Electric Institute, New York, NY. Publication No. 69-901. Brazier, J.R. and G.W. Brown, 1973. Buffer strips for stream temperature control. Res. Pap. 15. Forest Research Laboratory, Oregon State University. 9 p. Broderson, J.M., 1973. Sizing buffer strips to maintain water quality. M.S. Thesis, University of Washington, Seattle, WA.
Page 112 Walla Walla Temperature WQIR
Brosofske, K.D., J. Chen, R.J. Naiman, and J.F. Franklin, 1997. Harvesting effects on microclimate gradients from small streams to uplands in western Washington. Ecol. Appl. 7(4): 1188-1200. Brown, G.W. and J.T. Krygier, 1970. Effects of clear-cutting on stream temperature. Water Resources Research 6(4):1133-1140. Brown, G.W., G.W. Swank, and J. Rothacher, 1971. Water temperature in the Steamboat drainage. USDA Forest Service Research Paper PNW-119, Portland, OR. 17 p. Butcher, D. and B. Bower, 2005. Walla Walla Subbasin Stream Temperature Total Maximum Daily Load and Water Quality Management Plan. Oregon Department of Environmental Quality. http://www.deq.state.or.us/wq/tmdls/docs/wallawallabasin/tmdlwqmp.pdf Carson, R. J. and K. R. Pogue, 1996. Flood Basalts and Glacier Floods: Roadside Geology of Parts of Walla Walla, Franklin, and Columbia Counties, Washington. Division of Geology and Earth Resources Information Circular 90, Washington State Department of Natural Resources, Olympia, WA. Castelle, A.J. and A.W. Johnson, 2000. Riparian vegetation effectiveness. Technical Bulletin No. 799. National Council for Air and Stream Improvement, Research Triangle Park, NC. February 2000. Castro, J.M., and Jackson, P.L., 2001, Bankfull discharge recurrence intervals and regional hydraulic geometry relationships: Patterns in the Pacific Northwest, USA: Journal of the American Water Resources Association, v. 37, no. 5. CH2M Hill, 2000. Review of the scientific foundations of the forests and fish plan. Prepared for the Washington Forest Protection Association. www.wfpa.org/ Chapra, S.C., 1997. Surface water quality modeling. McGraw-Hill Companies, Inc. Chapra, S.C., 2001. Water-Quality Modeling Workshop for TMDLs, Washington State Department of Ecology, Olympia, WA. June 25-28, 2001. Chapra, S.C. and G.J. Pelletier, 2003. QUAL2K: A Modeling Framework for Simulating River and Stream Water Quality: Documentation and Users Manual. Civil and Environmental Engineering Dept., Tufts University, Medford, MA [email protected] www.epa.gov/athens/wwqtsc/html/qual2k.html Chen, J., J.F. Franklin, and T.A. Spies, 1993. Contrasting microclimates among clearcut, edge, and interior of old-growth Douglas-fir forest. Agricultural and Forest Meteorology 63, 219-237. Chen, Y.D., 1996. Hydrologic and water quality modeling for aquatic ecosystem protection and restoration in forest watersheds: a case study of stream temperature in the Upper Grande Ronde River, Oregon. PhD dissertation. University of Georgia, Athens, GA.
Walla Walla Temperature WQIR Page 113
Chen, Y.D., R.F. Carsel, S.C. McCutcheon, and W.L Nutter, 1998. Stream temperature simulation of forested riparian areas: I. watershed-scale model development. Journal of Environmental Engineering. April 1998. pp 304-315. Childs, S.W. and L.E. Flint, 1987. Effect of shadecards, shelterwoods, and clearcuts on temperature and moisture environments. Forest Ecology and Management, 18, 205-217. Clifton, C.F., R.M. Harris, and J.K. Fitzgerald, 1999. Flood effects and watershed response in the Northern Blue Mountains, Oregon and Washington. 1999 Annual Summer Specialty Conference Proceedings, June 30-July 2, 1999. Bozeman, MT. Corbett, E.S. and J.A. Lynch, 1985. Management of streamside zones on municipal watersheds. P. 187-190 In: R.R. Johnson, C.D. Ziebell, D.R. Patton, P.F. Folliott, and R.H. Hamre (eds.). Riparian ecosystems and their management: reconciling conflicting uses. First North American Riparian Conference, April 16-18, 1985. Tucson, AZ. Confederated Tribes of the Umatilla Indian Reservation (CTUIR), 1995. Columbia Basin Salmon Policy. Pendleton, OR. http://www.umatilla.nsn.us/salmonpolicy.html Confederated Tribes of the Umatilla Indian Reservation (CTUIR) Dept. of Natural Resources, 2006. Report to General Council, November 2006. www.umatilla.nsn.us/DNRreport11-06.pdf) Dunne and Leopold, 1978. Water in Environmental Planning. W.H. Freeman, New York, 818p. Ecology, 2002. Tri-State Steelheaders to receive Ecology's highest award. Press release: May 14,2002. www.ecy.wa.gov/news/2002news/2002-078.html Ecology, 2002b. Water Cleanup Plans: Taking the temperature of the Walla Walla watershed. Washington State Department of Ecology, Olympia, WA. Publication No. 02-10-035. http://www.ecy.wa.gov/pubs/0210035.pdf. Ecology, 2003a. Shade.xls - a tool for estimating shade from riparian vegetation. Washington State Department of Ecology, Olympia, WA. www.ecy.wa.gov/programs/eap/models/ Ecology, 2003b. QUAL2Kw.xls - a diurnal model of water quality for steady flow conditions. Washington State Department of Ecology, Olympia, WA. www.ecy.wa.gov/programs/eap/models/ Ecology, 2003c. City of Dayton Wastewater Treatment Plant discharge monitoring reports. Permit WA-002072-9. June 2002 through June 2003. Washington State Department of Ecology, Eastern Regional Office, Spokane, WA. Ecology, 2005. City of Dayton National Pollutant Discharge Elimination System Waste Discharge Permit No. WA-002072-9. Issuance Date: April 28, 2005. Washington State Department of Ecology, Eastern Regional Office, Spokane, WA.
Page 114 Walla Walla Temperature WQIR
Ecology, 2006. Implementation Plan for the Revisions to Chapter 173-201A WAC, Water Quality Standards for Surface Waters of the State of Washington: as required by the Washington State Administrative Act, RCW 34.05. Washington State Department of Ecology Water Quality Program, Olympia, WA. Publication No. 06-10-072. http://www.ecy.wa.gov/biblio/0610072.html Ecology, 2006b. Water Quality Program Permit Writer’s Manual. Washington State Department of Ecology, Olympia, WA. Publication No. 92-109. http://www.ecy.wa.gov/pubs/92109.pdf Ecology, 2007 in publication. Implementing the Sate's Temperature Standards through TMDLs and NPDES Permits. Publication Number 06-10-100. Draft. Edgerton, P.J. and B.R. McConnell, 1976. Diurnal temperature regimes of logged and unlogged mixed conifer stands on elk summer range. Station Research Note PNW-277. Portland, OR. U.S. Department of Agriculture, Forest Service, Pacific Northwest Research Station. 6 pp. Edinger, J.E., D.W. Duttweiler, and J.C. Geyer, 1968. The response of water temperatures to meteorological conditions. Water Resources Research, Vol. 4, No. 5. Edinger, J.E., D.K. Brady, and J.C. Geyer, 1974. Heat exchange and transport in the environment. EPRI Publication No. 74-049-00-3, Electric Power Research Institute, Palo Alto, CA. EPA, 1991. Guidance for Water Quality-based Decisions: The TMDL Process. U.S. Environmental Protection Agency. EPA 440/4-91-001. EPA, 1998. Report of the Federal Advisory Committee on the Total Maximum Daily Load (TMDL) Program. The National Advisory Council for Environmental Policy and Technology (NACEPT). U.S. Environmental Protection Agency, Office of the Administrator. EPA 100-R-98-006. EPA, 2001. Overview of Current Total Maximum Daily Load - TMDL - Program and Regulations. U.S. Environmental Protection Agency. www.epa.gov/owow/tmdl/overviewfs.html Faux, R., 2002. Aerial surveys in the Walla Walla River Basin, thermal infrared and color videography. May 14, 2002. Report to: Washington State Department of Ecology. Watershed Sciences LLC, Corvallis, OR. Fowler, W.B. and T.D. Anderson, 1987. Illustrating harvest effects on site microclimate in a high-elevation forest stand. Research Note PNW-RN-466. Portland, OR. U.S. Department of Agriculture, Forest Service, Pacific Northwest Research Station. 10 pp. Fowler, W.B., J.D. Helvey, and E. N. Felix, 1987. Hydrologic and climatic changes in three small watersheds after timber harvest. Res. Pap. PNW-RP-379. Portland, OR: U.S. Department of Agriculture, Forest Service, Pacific Northwest Research Station. 13 pp.
Walla Walla Temperature WQIR Page 115
GEI, 2002. Efficacy and economics of riparian buffers on agricultural lands, State of Washington. Prepared for the Washington Hop Growers Association. Prepared by GEI Consultants, Englewood, CO. Hashim, W.A. and L. Stalmaster, 2004. Washington’s Water Quality Management Plan to Control Nonpoint Sources of Pollution Volume 1: Water Quality Summaries for Watersheds in Washington State. Washington State Department of Ecology, Olympia, WA. Publication No. 04-10-063. HDR/EES, Inc., 2005. Walla Walla Watershed Plan. Pasco, WA. http://www.wallawallawatershed.org/wplan.html#WP Hicks, M., 2002. Evaluating Standards for Protecting Aquatic Life in Washington's Surface Water Quality Standards - Temperature Criteria - Draft Discussion Paper and Literature Summary. Washington State Department of Ecology, Olympia WA. Publication No. 00-10-070. www.ecy.wa.gov/biblio/0010070.html Holtby, L.B., 1988. Effects of logging on stream temperatures in Carnation Creek, B.C., and associated impacts on the coho salmon. Canadian Journal of Fisheries and Aquatic Sciences 45:502-515. Ice, G., 2001. How direct solar radiation and shade influences temperatures in forest streams and relaxation of changes in stream temperature. In: Cooperative Monitoring, Evaluation, and Research (CMER) workshop: heat transfer processes in forested watershed and their effects on surface water temperature, Lacey, WA. February 2001. Johnson, S.L., and J.A. Jones. 2000. Stream temperature response to forest harvest and debris flows in western Cascades, Oregon. Canadian Journal of Fisheries and Aquatic Sciences 57(supplement 2): 30-39. Johnson, S.L., 2004. Factors influencing stream temperatures in small streams: substrate effects and a shading experiment. Canadian Journal of Fisheries and Aquatic Sciences 61:913-923. LeMoine, M. and A. Stohr, 2002. Quality Assurance Project Plan: Walla Walla River Tributaries Temperature Total Maximum Daily Load. Washington State Department of Ecology, Olympia WA. Publication No. 02-03-066. www.ecy.wa.gov/biblio/0203066.html Leopold, L., 1994. A view of the river. Harvard University Press. Levno, A. and J. Rothacher, 1967. Increases in maximum stream temperatures after logging in old growth Douglas-fir watersheds. USDA Forest Service PNW-65, Portland, OR. 12 p. Lombard, S. and C. Kirchmer, 2004. Guidelines for Preparing Quality Assurance Project Plans for Environmental Studies. Washington State Department of Ecology, Olympia, WA. Publication No. 04-03-030. www.ecy.wa.gov/biblio/0403030.html.
Page 116 Walla Walla Temperature WQIR
Lynch, J.A., G.B. Rishel, and E.S. Corbett, 1984. Thermal alterations of streams draining clearcut watersheds: quantification and biological implications. Hydrobiologia 111:161-169. Mapes, B.E., 1969. Sediment Transport by Streams in the Walla Walla River Basin, Washington and Oregon July 1962-June 1965. U.S. Geological Survey Water-Supply Paper 1868. U.S. Department of Interior, Washington, D.C. 32 p. Marti, P., 2005. Assessment of Surface Water and Groundwater Interchange within the Walla Walla River Watershed. Washington State Department of Ecology, Olympia WA. Publication No. 05-03-020. www.ecy.wa.gov/biblio/0503020.html Mendel, G., D. Karl, and T. Coyle, 2000. Assessment of Salmonid Fishes and their Habitat Conditions in the Walla Walla River Basin of Washington: 1999 Annual Report. Washington Department of Fish and Wildlife. Project Report to Bonneville Power Administration. DOE/BP-07035-2. July 2000. Mendel, G., D. Karl, and T. Coyle, 2001. Assessment of Salmonids and their Habitat Conditions in the Walla Walla River Basin of Washington: 2000 Annual Report. Washington Department of Fish and Wildlife. Project Report to Bonneville Power Administration. DOE/BP-00000485-1. November 2001. Mendel, G., J. Trump, and D. Karl, 2002. Assessment of Salmonids and their Habitat Conditions in the Walla Walla River Basin within Washington: 2001 Annual Report. Washington Department of Fish and Wildlife. Project Report to Bonneville Power Administration. DOE/BP-00004616-1. December 2002. Mendel, G., J. Trump, and M. Gembala, 2003. Assessment of Salmonids and their Habitat Conditions in the Walla Walla River Basin within Washington: 2002 Annual Report. Washington Department of Fish and Wildlife. Project Report to Bonneville Power Administration. DOE/BP-00006502-1. September 2003. Mullan, 1858. 1858 Mapping for Military Road Reconnaissance. Washington Territory. National Association of Conservation Districts (NACD), 2004. Riparian Buffers Doing the Trick in Walla Walla. Buffer Notes. http://www.nacdnet.org/buffers/04Aug/index.html Newcomb, R.C., 1965. Geology and Ground-Water Resources of the Walla Walla River Basin, Washington-Oregon. Washington Division of Water Resources Water Supply Bulletin. No. 21, 151 p. ODEQ, 2001. Tools 3.0 User Manual. Oregon Department of Environmental Quality. Portland, OR. ODEQ, 2005. Walla Walla Subbasin Stream Temperature Total Maximum Daily Load and Water Quality Management Plan. Oregon Department of Environmental Quality, Pendleton, OR. http://www.deq.state.or.us/wq/TMDLs/docs/wallawallabasin/tmdlwqmp.pdf
Walla Walla Temperature WQIR Page 117
OWEB, 1999. Water quality monitoring technical guidebook: chapter 14, stream shade and canopy cover monitoring methods. Oregon Watershed Enhancement Board. www.oweb.state.or.us/pdfs/monitoring_guide/monguide2001_ch14.pdf Parametrix, 1996. Wastewater Facilities Plan: City of Dayton. Parametrix, Inc, Sumner, WA. Publication No. 21-2386-01. Patric, J.H., 1980. Effects of wood products harvest on forest soil and water relations. Journal of Environmental Quality 9(1):73-79. Pelletier, G. and S. Chapra, 2003. QUAL2Kw: Documentation and User Manual for a Modeling Framework to Simulate River and Stream Water Quality. Draft Publication. Washington State Department of Ecology, Olympia, WA. www.ecy.wa.gov/programs/eap/models/ Poole, G.C., and C.H. Berman. 2000. Pathways of Human Influence on Water Temperature Dynamics in Stream Channels. U.S. Environmental Protection Agency, Region 10. Seattle, WA. 20 p. Rishel, G.B., J.A. Lynch, and E.S. Corbett, 1982. Seasonal stream temperature changes following forest harvesting. Journal of Environmental Quality 11(1):112-116. Rosgen, D., 1996. Applied river morphology. Wildland Hydrology publishers. Pagosa Springs, CO. Schuett-Hames, D., A. Pleus, E. Rashin, and J. Matthews. 1999. TFW Monitoring Program Method Manual for the Stream Temperature Survey. Prepared for the Washington State Department of Natural Resources under the Timber, Fish and Wildlife Agreement. TFW-AM9-99-005. DNR # 107. June. Snake River Salmon Recovery Board, 2006. Technical Document: Snake River Salmon Recovery Plan for SE Washington. Dayton, WA http://www.snakeriverboard.org/resources/library.htm. Steinblums, I., H. Froehlich, and J. Lyons, 1984. Designing stable buffer strips for stream protection. Journal of Forestry 821(1): 49-52. Stohr, A., M. LeMoine, and G. Pelletier, 2007. Walla Walla River Tributaries Temperature Total Maximum Daily Load Study. Washington State Department of Ecology, Olympia, WA. Publication No. 06-03-020. www.ecy.wa.gov/biblio/0603020.html. Swift, L.W. and J.B. Messer, 1971. Forest cuttings raise water temperatures of a small stream in the southern Appalachians. Journal of Soil and Water Conservation 26:11-15. Teti, P., 2001. A new instrument for measuring shade provided by overhead vegetation. Cariboo Forest Region Research Section, British Columbia Ministry of Forests, Extension note No. 34. www.for.gov.bc.ca/cariboo/research/extnotes/extnot34.htm
Page 118 Walla Walla Temperature WQIR
Teti, P.A. and R.G. Pike, 2005. Selecting and testing an instrument for surveying stream shade. BC Journal of Ecosystems and Management 6(2):1-16. URL: www.forrex.org/jem/2005/vol6_no2_art1.pdf USFW Service, 2005. Endangered and Threatened Wildlife Plants; Designation of Critical Habitat for the Bull Trout; Final Rule. Federal Register Monday September 26, 2005. U.S. Fish & Wildlife Service. www.fws.gov/pacific/bulltrout/final/pdf/Bull%20Trout%20CH%20FR%20notice.pdf USDA Forest Service, 1990. Land and Resource Management Plan: Umatilla National Forest. U.S. Department of Agriculture, Forest Service, Pacific Northwest Region. http://www.fs.fed.us/r6/uma/blue_mtn_planrevision/documents.shtml Walla Walla Watershed Planning Unit, and Walla Walla Basin Watershed Council. Walla Walla Subbasin Plan. Walla Walla, WA, November 2004.
Walla Walla Watershed Planning Website, 2006. Walla Walla Backyard Stream Team. www.wallawallawatershed.org/streamteam.html.
Walla Walla Watershed Planning Website, 2007. http://www.wallawallawatershed.org.
Washington Water Trust Website. Visited 03-06-2007. www.thewatertrust.org. Wenger, S., 1999. A review of the scientific literature on riparian buffer width, extent, and vegetation. Office of Public Service and Outreach, Institute of Ecology, University of Georgia, Athens, GA. Wolman, M.G., 1954. A Method of Sampling Coarse River-Bed Material. Transaction of American Geophysical Union. 35:951-956.
Walla Walla Temperature WQIR Page 119
Appendices
Appendix A. Glossary and Acronyms 1-DMax or 1-day maximum temperature is the highest water temperature reached on any given day. This measure can be obtained using calibrated maximum/minimum thermometers or continuous monitoring probes having sampling intervals of thirty minutes or less. 7-DADMax or 7-day average of the daily maximum temperatures is the arithmetic average of seven consecutive measures of daily maximum temperatures. The 7-DADMax for any individual day is calculated by averaging that day's daily maximum temperature with the daily maximum temperatures of the three days prior and the three days after that date.
7Q2 flow: A typical low flow condition. The 7Q2 is a statistical estimate of the lowest 7-day average flow that can be expected to occur once every other year on average. The 7Q2 flow is commonly used to represent the average low flow condition in a water body and is typically calculated from long-term flow data collected in each basin. For temperature TMDL work, the 7Q2 is usually calculated for the months of July and August as these typically represent the critical months for temperature in our state.
7Q10 flow: A critical low flow condition. The 7Q10 is a statistical estimate of the lowest 7-day average flow that can be expected to occur once every ten years on average. The 7Q10 flow is commonly used to represent the critical flow condition in a water body and is typically calculated from long-term flow data collected in each basin. For temperature TMDL work, the 7Q10 is usually calculated for the months of July and August as these typically represent the critical months for temperature in our state.
90th percentile: A statistical number obtained from a distribution of a data set, above which 10% of the data exists and below which 90% of the data exists.
303(d) list: Section 303(d) of the federal Clean Water Act requires Washington State periodically to prepare a list of all surface waters in the state for which beneficial uses of the water – such as for drinking, recreation, aquatic habitat, and industrial use – are impaired by pollutants. These are water quality limited estuaries, lakes, and streams that fall short of state surface water quality standards, and are not expected to improve within the next two years.
Bankfull Stage: Formally defined as the stream level that “corresponds to the discharge at which channel maintenance is most effective, that is, the discharge at which moving sediment, forming or removing bars, forming or changing bends and meanders, and generally doing work that results in the average morphologic characteristics of channels” (Dunne and Leopold, 1978).
Best Management Practices (BMPs): Physical, structural, and/or operational practices that, when used singularly or in combination, prevent or reduce pollutant discharges.
Page 120 Walla Walla Temperature WQIR
Chronic critical effluent concentration: The maximum concentration of effluent during critical conditions at the boundary of the mixing zone assigned in accordance with WAC 173-201A-100. The boundary may be based on distance or a percentage of flow. Where no mixing zone is allowed, the chronic critical effluent concentration shall be one hundred percent effluent.
Clean Water Act (CWA): Federal Act passed in 1972 that contains provisions to restore and maintain the quality of the nation’s waters. Section 303(d) of the CWA establishes the TMDL program.
Critical condition: When the physical, chemical, and biological characteristics of the receiving water environment interact with the effluent to produce the greatest potential adverse impact on aquatic biota and existing or designated water uses. For steady-state discharges to riverine systems the critical condition may be assumed to be equal to the 7Q10 flow event unless determined otherwise by the department.
Designated Uses: Those uses specified in Chapter 173-201A WAC (Water Quality Standards for Surface Waters of the State of Washington) for each water body or segment, regardless of whether or not the uses are currently attained.
Dilution Factor: The relative proportion of effluent to stream (receiving water) flows occurring at the edge of a mixing zone during critical discharge conditions as authorized in accordance with the state’s mixing zone regulations at WAC 173-201A-100. http://apps.leg.wa.gov/WAC/default.aspx?cite=173-201A-020
Effective Shade: The fraction of incoming solar shortwave radiation that is blocked from reaching the surface of a stream or other defined area.
Existing Uses: Those uses actually attained in fresh and marine waters on or after November 28, 1975, whether or not they are designated uses. Introduced species that are not native to Washington, and put-and-take fisheries comprised of non-self-replicating introduced native species, do not need to receive full support as an existing use.
Load Allocation (LA): The portion of a receiving waters’ loading capacity attributed to one or more of its existing or future sources of nonpoint pollution or to natural background sources.
Loading Capacity: The greatest amount of a substance that a water body can receive and still meet water quality standards.
Margin of Safety (MOS): Required component of TMDLs that accounts for uncertainty about the relationship between pollutant loads and quality of the receiving water body.
National Pollutant Discharge Elimination System (NPDES): National program for issuing, modifying, revoking and reissuing, terminating, monitoring and enforcing permits, and imposing and enforcing pretreatment requirements under the Clean Water Act. The NPDES program regulates discharges from wastewater treatment plants, large factories, and other facilities that use, process, and discharge water back into lakes, streams, rivers, bays, and oceans.
Walla Walla Temperature WQIR Page 121
Near Stream Disturbance Zone (NSDZ): The active channel area without riparian vegetation that includes features such as gravel bars
Nonpoint Source: Pollution that enters any waters of the state from any dispersed land-based or water-based activities, including but not limited to atmospheric deposition, surface water runoff from agricultural lands, urban areas, or forest lands, subsurface or underground sources, or discharges from boats or marine vessels not otherwise regulated under the National Pollutant Discharge Elimination System Program. Generally, any unconfined and diffuse source of contamination. Legally, any source of water pollution that does not meet the legal definition of “point source” in section 502(14) of the Clean Water Act.
Phase II Stormwater Permit: The second phase of stormwater regulation required under the federal Clean Water Act. The permit is issued to smaller municipal separate storm sewer systems (MS4s) and construction sites over one acre.
Point Source: Sources of pollution that discharge at a specific location from pipes, outfalls, and conveyance channels to a surface water. Examples of point source discharges include municipal wastewater treatment plants, municipal stormwater systems, industrial waste treatment facilities, and construction sites that clear more than 5 acres of land.
Pollution: Such contamination, or other alteration of the physical, chemical, or biological properties, of any waters of the state, including change in temperature, taste, color, turbidity, or odor of the waters, or such discharge of any liquid, gaseous, solid, radioactive, or other substance into any waters of the state as will or is likely to create a nuisance or render such waters harmful, detrimental, or injurious to the public health, safety, or welfare, or to domestic, commercial, industrial, agricultural, recreational, or other legitimate beneficial uses, or to livestock, wild animals, birds, fish, or other aquatic life.
Stormwater: The portion of precipitation that does not naturally percolate into the ground or evaporate but instead runs off roads, pavement, and roofs during rainfall or snow melt. Stormwater can also come from hard or saturated grass surfaces such as lawns, pastures, playfields, and from gravel roads and parking lots.
Surface waters of the state: Lakes, rivers, ponds, streams, inland waters, salt waters, wetlands and all other surface waters and watercourses within the jurisdiction of Washington State.
System potential temperature: An approximation of the temperatures that would occur under natural conditions. System potential is our best understanding of natural conditions that can be supported by available analytical methods. The simulation of the system potential condition uses best estimates of mature riparian vegetation, system potential channel morphology, and system potential riparian microclimate that would occur absent any human alteration. System potential mature riparian vegetation is that vegetation which can grow and reproduce on a site, given: climate, elevation, soil properties, plant biology and hydrologic processes.
System potential channel morphology is the more stable configuration that would occur with less human disturbance.
Page 122 Walla Walla Temperature WQIR
System potential riparian microclimate is a best estimate of air temperature reductions that are expected under mature riparian vegetation. System potential riparian microclimate can also include expected changes to wind speed and relative humidity.
System potential is the design condition used for TMDL analysis.
Total Maximum Daily Load (TMDL): A distribution of a substance in a water body designed to protect it from exceeding water quality standards. A TMDL is equal to the sum of all of the following: 1) individual wasteload allocations (WLAs) for point sources, 2) the load allocations (LAs) for nonpoint sources, 3) the contribution of natural sources, and 4) a Margin of Safety to allow for uncertainty in the wasteload determination. A reserve for future growth is also generally provided.
Wasteload Allocation (WLA): The portion of a receiving water’s loading capacity allocated to existing or future point sources of pollution. WLAs constitute one type of water quality-based effluent limitation.
Watershed: A drainage area or basin in which all land and water areas drain or flow toward a central collector such as a stream, river, or lake at a lower elevation.
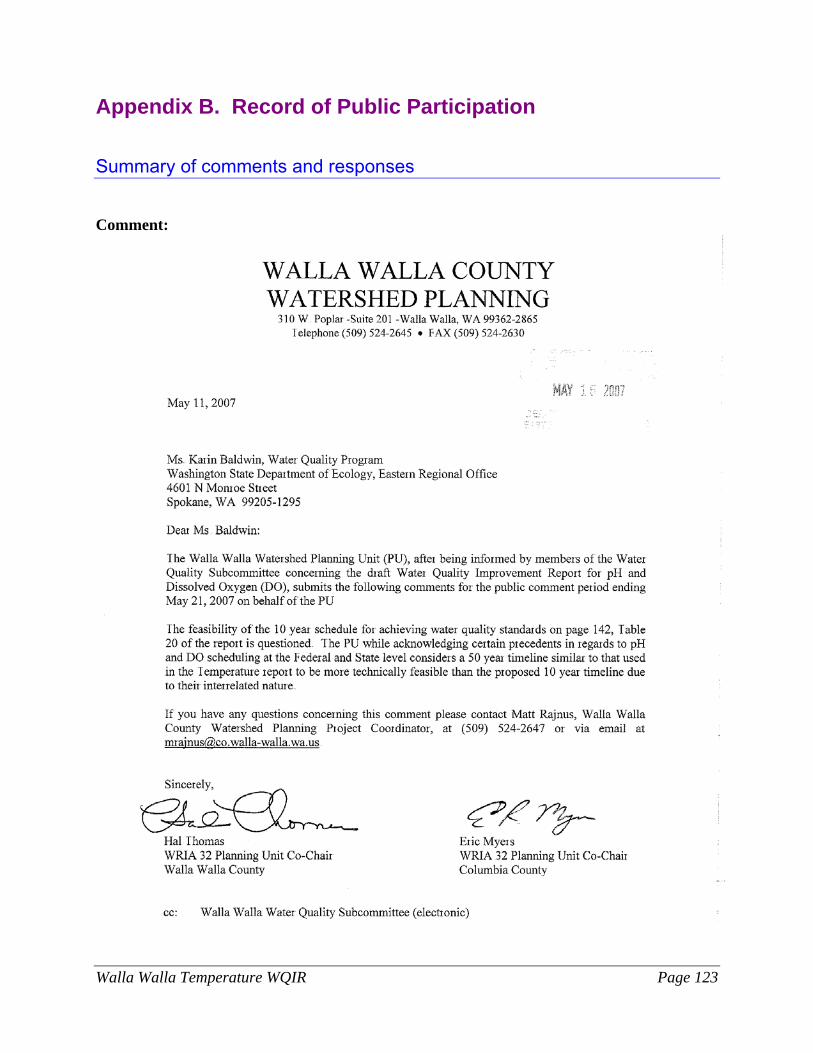
Walla Walla Temperature WQIR Page 123
Appendix B. Record of Public Participation Summary of comments and responses Comment:
Page 124 Walla Walla Temperature WQIR
Response: Thank you for commenting. While it is true that cooler water contains more dissolved oxygen, data shows the low dissolved oxygen and high pH levels in the Walla Walla watershed are a result of abundant aquatic vegetation taking oxygen out of the water at night, and increasing pH levels during the day. So, to decrease the amount of aquatic vegetation it is necessary to reduce nutrients. Ten years should be enough time to see increased dissolved oxygen and reduced pH levels by substantially cutting down on nutrient loads from point and diffuse sources. Minimizing aquatic vegetation growth by decreasing the amount of nutrients will take much less time to achieve than growing a tree to produce the greatest amount of shade possible. The temperature TMDL has a 50 year timeline because it will take that many years for a tree to become full-grown and produce the maximum amount of shade. However, many planting projects are showing significant improvements within the first 10 years in creating shade, taking up subsurface nutrients, and reducing light used by aquatic vegetation for growth. We expect that trees planted today will show great benefit in 10 to 20 years (although it takes 50 years for the trees to grow to full size). So, the shade that will be produced in 10 years will help to meet the water quality standards for dissolved oxygen and pH if nutrient loads are also reduced. The 10 year timeframe of the pH and dissolved oxygen TMDL will help wastewater treatment plants meet water quality standards. Area wastewater treatment plants by rule have 10 years to comply with water quality standards. Wastewater treatment plants discharging to surface waters that do not meet water quality standards are severely limited because their permits are based on all nutrient loads discharged by watershed residents. Identification and elimination of diffuse (nonpoint) sources of nutrients may improve dissolved oxygen and pH enough to allow wastewater treatment plants more flexibility to meet water quality standards. This flexibility can ultimately reduce expenses of city rate payers.
Walla Walla Temperature WQIR Page 125
Comment: From: Bob Hutchens 20 May 2007 Member Walla Walla Watershed Planning Unit Member Columbia/Blue Mountain Counties Farm Bureau 142 Fullerton Road Dayton, WA 99328 Ms. Karin Baldwin, Water Quality Program Washington State Department of Ecology, Eastern Regional Office 4601 N. Monroe Street Spokane, WA 99205-1295 Dear Karin, I am submitting the following comments as input to the ph-Dissolved Oxygen and Temperature TMDL proposals by the Washington State Department of Ecology. Also, I am submitting the following comments as an individual and for the Columbia/Blue Mountain Counties Farm Bureau, which by motion endorsed this letter. I know that DOE is doing what it is called to do by the Environmental Protection Agency by setting TMDL goals and describing ways of reaching those goals. The methods, which the proposal describes for reaching ph-Dissolved Oxygen and Temperature goals, are where I believe that there is a problem. The Detailed Implementation Plan described in the proposal includes, for upland agricultural management, Best Management Practices as a means of reaching goals. Herein lies the problem. Best Management Practices were developed under a completely different set of circumstances than the present demand by DOE/EPA to reach acceptable TMDL goals for our water resources. Best Management Practices had at least 3 criteria to be considered for adoption. They were: 1. Economically feasible; 2. Socially acceptable; and 3. They had to be effective. Currently farmers are using BMPs to the extent they are comfortable and to the extent that they satisfy the National Resource Conservation Service conservation demands. I feel that the NRCS demands for conservation are nowhere near as stringent as the demands of DOE/EPA. So I see farmers and EPA on a collision course. It will eventually need to be clearly defined for the agricultural industry, which set of regulations will prevail, EPA or USDA. EPA needs to consult with USDA NRCS and really study what the TMDL could do to conservation compliance demands. Then they need to consider the criteria for BMPs, and, if they are a reasonable route to use to reach TMDL goals. I suspect that your response to this concern will be that the BMP approach should be attempted first, see how effective they are, and then reassess the issue. But I say the BMP approach has, by definition, already been put in place and will not do much more to move dryland farming practices in the direction DOE/EPA wants them to go. So what do I suggest? Probably the most logical approach, because there is already an effort underway, is to see that the USDA Conservation Security Program be implemented nation-wide, not just on a watershed-by-watershed basis. The basin by basin approach creates some serious injustices and imbalances in the agricultural community. EPA should consider supporting this approach if they hope to reach their TMDL goals, short of direct regulation. Regulation will cause prescription farming, and conservation farming is far too complex to be well served by such an approach. Most importantly to me, is that DOE/EPA is aware, that in my opinion the current proposal does not include the necessary elements for TMDL proposal success, and that the agricultural community is not particularly aware of the potential expectations that may be placed on them by EPA in the near future, regardless of the NRCS demands. Thank you for accepting my input. Sincerely, Bob Hutchens
Page 126 Walla Walla Temperature WQIR
Member, WIRA 32 Planning Unit and Member, WIRA 32 Water Quality Committee Member Columbia/Blue Mountain Counties Farm Bureau Response: Thank you for submitting a comment. You are correct; according to the Natural Conservation Resources Service (NRCS) conservation compliance requirements from the Food Security Act were not established to meet TMDLs or any other water quality regulation. The conservation practices are designed to fit the producer’s needs while still meeting multiple resource concerns. The inability of NRCS’ requirements to achieve water quality standards was discussed at a recent national TMDL meeting. In the Walla Walla watershed, there are several farmers in the watershed who may be applying a specific best management practice (BMP), but could apply additional BMPs to protect water quality. So at this local level we have an opportunity to be a model for the nation. The Water Quality Subcommittee can work with the Department of Ecology (Ecology), local NRCS and conservation districts to promote upland BMPs, such as direct seeding, that will protect water quality. When the Water Quality Subcommittee begins writing the Water Quality Implementation Plan, strategies to inform and educate farmers and more specific upland BMPs that will improve water quality can be included. Ecology is interested in promoting BMPs that will help make the TMDL successful and we will work with the NRCS, other agencies and local growers to achieve the TMDL targets. Participation and involvement in NRCS’ Local Work Groups is one of the ways Ecology and watershed residents can work with NRCS.
Walla Walla Temperature WQIR Page 127
Comment:
Page 128 Walla Walla Temperature WQIR
Response Thank you for commenting on the TMDLs. The Department of Ecology (Ecology) agrees there is a need for additional monitoring for nutrient sources through and upstream of the City of Dayton on the North, South and Wolf Forks of the Touchet River. Ecology has requested that our Environmental Assessment Program conduct an intensive study to identify nutrient sources in the area. The study has been conditionally approved for funding during the next fiscal year (July 2007 through June 2008). As more information becomes available, Ecology staff will contact the city. If resources allow, Ecology may be able to take samples above the confluence of the North and South forks of the Touchet River. There may be other organizations that can monitor these areas as well. Removing the treatment plant’s nutrient load from May through October is necessary to improve water quality in the Touchet River. When Ecology modeled low flow conditions we found that in order for increasing stream flow to improve water quality, nutrients had to be reduced and shade had to be added. From May through October, the City’s wastewater treatment plant discharges an average maximum of about half of a cubic foot per second (0.5 cfs), or about 1% of the flow. Monitoring data shows that the effluent doubles the amount of phosphorus and triples the amount of nitrogen in the river during low flow. The nutrient load greatly contributes to pH and dissolved oxygen problems downstream. If the city chooses to go to Water Reuse, the city may have to complete a water rights impairment analysis and mitigate for the water removed from the stream. Ecology will continue to work with the City on finding economical approaches to alleviate the negative impact of the effluent on the Touchet River.
Walla Walla Temperature WQIR Page 129
Comment:
Reply To Attn Of: OOO May 21, 2007 Ms. Karin Baldwin Washington Dept of Ecology 4601 N Monroe Street, Spokane, WA 99205 Dear Ms. Baldwin: Following are the Environmental Protection Agency’s (EPA) comments on the draft Walla Walla River pH and Dissolved Oxygen and Temperature Total Maximum Daily Load (TMDL) Submittal Reports which were both released for public comment on April 17, 2007. These draft documents present TMDLs for the Walla Walla Subbasin and the analysis utilized in developing the TMDLs. In general, EPA finds the information presented in the TMDLs to be presented in a clear and complete format and inclusive of all the statutory and regulatory components required of TMDLs. The following comments provide some suggestions on minor changes which would clarify the TMDL. EPA wishes to acknowledge the excellent work presented in the TMDL. In developing these TMDLs, Ecology did an excellent job of presenting a complicated array of information and compiling it so that quantitative loading capacity could be established. Following are comments on specific elements of the TMDLs: Temperature TMDL p. 57 – Load Allocations; Figure 24, Predicted daily maximum water temperatures in the Touchet River for critical conditions during July-August 7Q2 and 7Q10: This figure does not depict the effects of holding the Dayton WWTP to a 18 degree Celsius effluent limit. It only shows scenarios where this and another change are made so that it is difficult to determine the impact this facility is having on stream temperature by itself. It appears as though the effluent effect is significant, though this may be a combined effect with excessive stream width in the same area of the river. It would be more informative to have a separate line
Page 130 Walla Walla Temperature WQIR
in the graph for the scenario in which the treatment plant effluent is reduced to 18 degrees Celsius. p. 61 - Load Allocations Load allocations of system potential shade are given for Walla Walla River tributaries below the National Forest Boundary and downstream of the Mill Creek Diversion. Reaches upstream of the diversion are in compliance with the current water quality standards and not given allocations for this reason. However the text mentions that temperatures in reaches of Mill Creek upstream of the diversion exceed the numeric criteria for bull trout that are part of the new water quality standards that have not yet been approved by EPA. These reaches are given no allocation and will be considered impaired waters not covered by a TMDL if Washington’s revised water quality standards are approved by EPA. This could be addressed by assigning system potential vegetation allocations to these reached in this TMDL. In addition, giving system potential vegetation allocations in the upper reaches of Mill Creek would help attain the dissolved oxygen and pH criteria in those reaches. No mention is made in the text of why stream reaches above the Forest Boundary are not given load allocations but it would be helpful to explain that here. If data collected in these reaches in the future indicated impairment, these reaches would require a TMDL. This could be avoided if this TMDL assigned these reaches system potential shade load allocations. Figure 28 states that the load allocations apply to all perennial streams. In the Walla Walla Subbasin there are streams that go dry because of water diversions. This used to be the case with the Walla Walla River mainstem due to withdrawals in Oregon. It would be good to clarify that the term “perennial” here refers only to streams that are intermittent under natural flow conditions. p.68 - 69 – Conclusions and Recommendations Several bullet points on page 69 seem to imply that channel width load allocations have been assigned to reaches of the Touchet River, but the Load Allocation section of the document does not specify these types of allocations. Please clarify. Bullet 4 on page 68 states that reductions of the widest reaches of the Touchet River will result in little reduction of stream temperature, because the channel is still difficult to shade. Reductions in stream width can provide benefits other than shade that reduce stream temperature, such as reconnection to the hyporheic zone. p. 82 – Mainstem; Results and Discussion; Figure 34, Existing and Simulated temperature profiles for an afternoon in August It is difficult to understand this figure. It was a color figure originally and in black and white it is not possible to tell which lines represent which model scenarios.
Walla Walla Temperature WQIR Page 131
Dissolved Oxygen and pH TMDL p.119 – 120 – Load Allocations; Walla Walla River and Minor Tributaries Dry Creek is listed on the 303(d) list as impaired for dissolved oxygen. There do not appear to be allocations to address the impairment in this waterbody. The TMDL states that it will be addressing impairment in Dry Creek. Please clarify what allocations have been set for this waterbody. p. 120 – Wasteload Allocations The last sentence of the first paragraph uses the wording “as soon as it can be achieved” in referring to diversion of the Walla Walla and College Place WWTP discharges from the stream during the May through October critical season. If these facilities are currently discharging to the impaired waters in the critical season they will need to receive allocations in the TMDL. If they are not, this should be stated clearly here. It would be helpful to state the season in which the Dayton WWTP wasteload allocations apply here. CONCLUSION We commend you for the efforts you have made to date and look forward to the submittal of the final TMDLs in the near future. If you have any questions regarding comments on the draft TMDLs, please contact me at (503)326-3280. Sincerely, Helen Rueda TMDL Project Manager Cc: Dave Croxton, EPA Laurie Mann, EPA Response: Thank you for your comments. Please see the responses to your comments below: Temperature TMDL: Pg. 57 - Figure 24: This figure was used to calculate the system potential condition, so discharge from the Dayton wastewater treatment plant is not included. The legend item saying Dayton 18 oC, means that water being delivered to the beginning of the model segment in Dayton is coming in at 18 oC. Therefore, the figure represents the South and North forks of the Touchet River
Page 132 Walla Walla Temperature WQIR
delivering water at 18 oC. The Dayton wastewater treatment plant is dealt with in the point source section. A clarifying statement has been added to the text after the figure’s reference. Pg. 61 – Load Allocations: The City of Walla Walla’s diversion dam in Mill Creek is located in Oregon. Upstream of the diversion dam, Mill Creek in Washington State is within the Umatilla National Forest. (All of the area above the diversion dam is protected as a municipal watershed.) The Department of Ecology (Ecology) is completing TMDLs on federal lands separate from private and state owned lands. We intend to complete a TMDL for the Umatilla National Forest in the future. Therefore, any water quality impairments located on the Umatilla National Forest will be addressed by another TMDL. However, because the Umatilla National Forest is interested in addressing water quality impairments watershed by watershed, Forest Service staff is participating on the Water Quality Subcommittee for this TMDL and are working to improve water quality. Figure 28 on page 61 does apply to perennial streams that go dry part of the year due to withdrawals. The definition of perennial will be relocated earlier in the paragraph that references Figure 28 to clarify which streams have load allocations. Pg. 68-69 – Conclusions and Recommendations: Channel width load allocations were not assigned. However, narrower channel widths were modeled for those stream segments that could potentially narrow as riparian vegetation and processes are restored. As sediment is trapped by riparian vegetation, streambanks are built, allowing vegetation to become established closer to the stream, thereby narrowing the stream channel. The surface area of the stream is also reduced, allowing for less solar radiation to hit the stream. So, channel width reductions result in higher “effective shade” load allocations, which is the reason for modeling narrower stream widths. Under the Load Allocation section on page 61, the last paragraph was revised to state that channel width reductions were considered in the effective shade allocations. You are correct, narrower stream channels do provide benefits other than shade. A discussion of these other benefits such as reconnection to the hyporheic zone and increased channel complexity is found under the ‘Overview of stream heating processes’ section. However, at this time, our models can not estimate the temperature effects of reconnection with the hyporheic zone with enough accuracy to report it as a number in TMDLs. Pg. 82 – Figure 34: Ecology will have the figure printed in color for the final report. Dissolved Oxygen and pH TMDL: Pg. 119-120 - Load Allocations: Walla Walla River and Minor Tributaries: The last paragraph on page 119 states that “Diffuse and groundwater nutrient sources to Dry Creek, Mud Creek…need to be reduced as much as possible to state line concentrations.” We will rearrange this section so that these load allocations are more easily found. Pg. 120 – Wasteload Allocations: We will clarify the wasteload allocations for the College Place and Walla Walla wastewater treatment plants and delete “as soon as it can be achieved.” We will also state the season in which the Dayton wastewater treatment plant wasteload allocations apply.
Walla Walla Temperature WQIR Page 133
Appendix C. Walla Walla Tributaries Temperature TMDL
Walla Walla River Tributaries Temperature Total Maximum Daily Load Study
By: Anita Stohr, Mike LeMoine, and Greg Pelletier
Watershed Ecology Section
Environmental Assessment Program Washington State Department of Ecology
April 2007
Publication No. 07-03-014
This report is available on the Washington Department of Ecology Web site at:
www.ecy.wa.gov/biblio/0703014.html
For more information contact:
Publications Coordinator Environmental Assessment Program
P.O. Box 47600 Olympia, WA 98504-7600
E-mail: [email protected]
Phone: (360) 407-6764

Page 134 Walla Walla Temperature WQIR
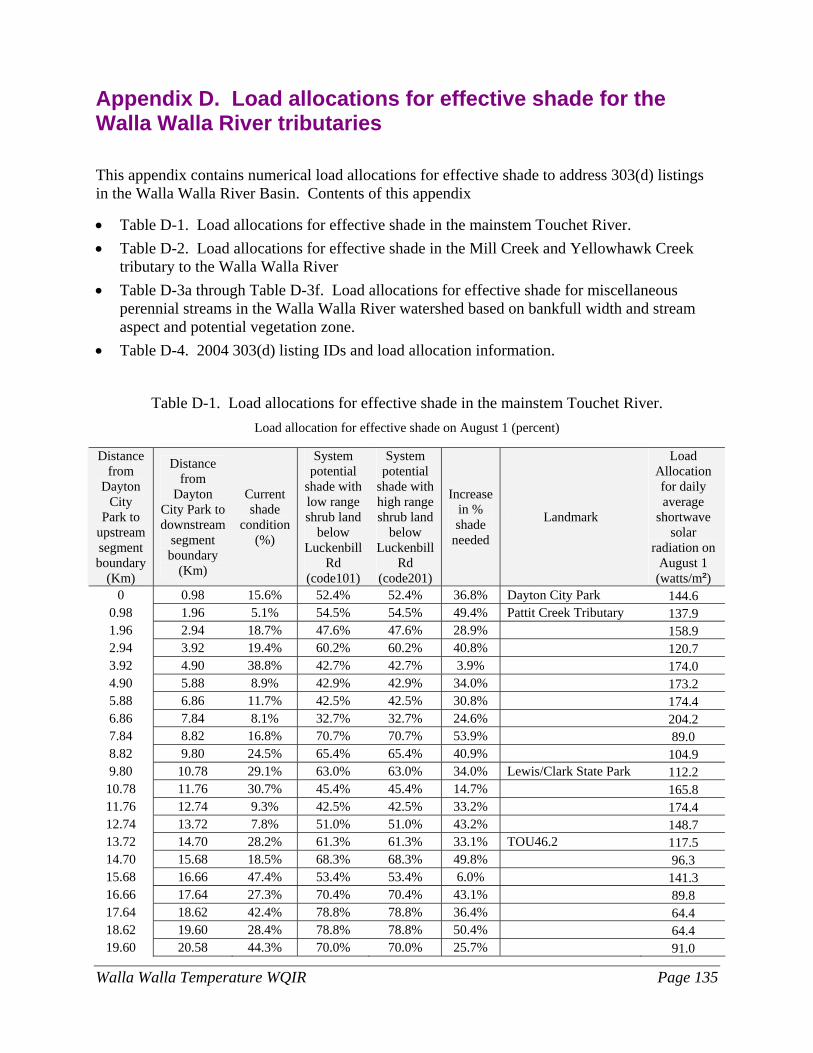
Walla Walla Temperature WQIR Page 135
Appendix D. Load allocations for effective shade for the Walla Walla River tributaries This appendix contains numerical load allocations for effective shade to address 303(d) listings in the Walla Walla River Basin. Contents of this appendix
• Table D-1. Load allocations for effective shade in the mainstem Touchet River. • Table D-2. Load allocations for effective shade in the Mill Creek and Yellowhawk Creek
tributary to the Walla Walla River • Table D-3a through Table D-3f. Load allocations for effective shade for miscellaneous
perennial streams in the Walla Walla River watershed based on bankfull width and stream aspect and potential vegetation zone.
• Table D-4. 2004 303(d) listing IDs and load allocation information.
Table D-1. Load allocations for effective shade in the mainstem Touchet River. Load allocation for effective shade on August 1 (percent)
Distance
from Dayton
City Park to
upstream segment boundary
(Km)
Distance from
Dayton City Park to downstream
segment boundary
(Km)
Current shade
condition (%)
System potential
shade with low range shrub land
below Luckenbill
Rd (code101)
System potential
shade with high range shrub land
below Luckenbill
Rd (code201)
Increase in % shade
needed
Landmark
Load Allocation for daily average
shortwave solar
radiation on August 1
(watts/m²) 0 0.98 15.6% 52.4% 52.4% 36.8% Dayton City Park 144.6
0.98 1.96 5.1% 54.5% 54.5% 49.4% Pattit Creek Tributary 137.9 1.96 2.94 18.7% 47.6% 47.6% 28.9% 158.9 2.94 3.92 19.4% 60.2% 60.2% 40.8% 120.7 3.92 4.90 38.8% 42.7% 42.7% 3.9% 174.0 4.90 5.88 8.9% 42.9% 42.9% 34.0% 173.2 5.88 6.86 11.7% 42.5% 42.5% 30.8% 174.4 6.86 7.84 8.1% 32.7% 32.7% 24.6% 204.2 7.84 8.82 16.8% 70.7% 70.7% 53.9% 89.0 8.82 9.80 24.5% 65.4% 65.4% 40.9% 104.9 9.80 10.78 29.1% 63.0% 63.0% 34.0% Lewis/Clark State Park 112.2 10.78 11.76 30.7% 45.4% 45.4% 14.7% 165.8 11.76 12.74 9.3% 42.5% 42.5% 33.2% 174.4 12.74 13.72 7.8% 51.0% 51.0% 43.2% 148.7 13.72 14.70 28.2% 61.3% 61.3% 33.1% TOU46.2 117.5 14.70 15.68 18.5% 68.3% 68.3% 49.8% 96.3 15.68 16.66 47.4% 53.4% 53.4% 6.0% 141.3 16.66 17.64 27.3% 70.4% 70.4% 43.1% 89.8 17.64 18.62 42.4% 78.8% 78.8% 36.4% 64.4 18.62 19.60 28.4% 78.8% 78.8% 50.4% 64.4 19.60 20.58 44.3% 70.0% 70.0% 25.7% 91.0
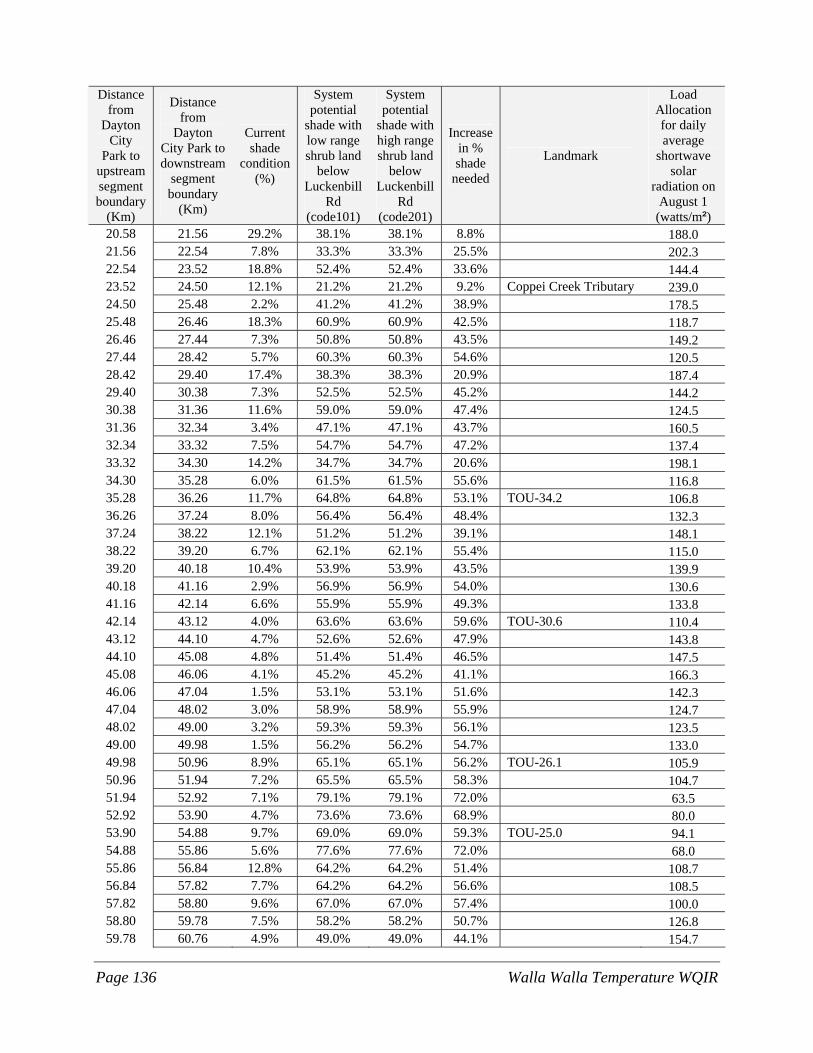
Page 136 Walla Walla Temperature WQIR
Distance from
Dayton City
Park to upstream segment boundary
(Km)
Distance from
Dayton City Park to downstream
segment boundary
(Km)
Current shade
condition (%)
System potential
shade with low range shrub land
below Luckenbill
Rd (code101)
System potential
shade with high range shrub land
below Luckenbill
Rd (code201)
Increase in % shade
needed
Landmark
Load Allocation for daily average
shortwave solar
radiation on August 1
(watts/m²) 20.58 21.56 29.2% 38.1% 38.1% 8.8% 188.0 21.56 22.54 7.8% 33.3% 33.3% 25.5% 202.3 22.54 23.52 18.8% 52.4% 52.4% 33.6% 144.4 23.52 24.50 12.1% 21.2% 21.2% 9.2% Coppei Creek Tributary 239.0 24.50 25.48 2.2% 41.2% 41.2% 38.9% 178.5 25.48 26.46 18.3% 60.9% 60.9% 42.5% 118.7 26.46 27.44 7.3% 50.8% 50.8% 43.5% 149.2 27.44 28.42 5.7% 60.3% 60.3% 54.6% 120.5 28.42 29.40 17.4% 38.3% 38.3% 20.9% 187.4 29.40 30.38 7.3% 52.5% 52.5% 45.2% 144.2 30.38 31.36 11.6% 59.0% 59.0% 47.4% 124.5 31.36 32.34 3.4% 47.1% 47.1% 43.7% 160.5 32.34 33.32 7.5% 54.7% 54.7% 47.2% 137.4 33.32 34.30 14.2% 34.7% 34.7% 20.6% 198.1 34.30 35.28 6.0% 61.5% 61.5% 55.6% 116.8 35.28 36.26 11.7% 64.8% 64.8% 53.1% TOU-34.2 106.8 36.26 37.24 8.0% 56.4% 56.4% 48.4% 132.3 37.24 38.22 12.1% 51.2% 51.2% 39.1% 148.1 38.22 39.20 6.7% 62.1% 62.1% 55.4% 115.0 39.20 40.18 10.4% 53.9% 53.9% 43.5% 139.9 40.18 41.16 2.9% 56.9% 56.9% 54.0% 130.6 41.16 42.14 6.6% 55.9% 55.9% 49.3% 133.8 42.14 43.12 4.0% 63.6% 63.6% 59.6% TOU-30.6 110.4 43.12 44.10 4.7% 52.6% 52.6% 47.9% 143.8 44.10 45.08 4.8% 51.4% 51.4% 46.5% 147.5 45.08 46.06 4.1% 45.2% 45.2% 41.1% 166.3 46.06 47.04 1.5% 53.1% 53.1% 51.6% 142.3 47.04 48.02 3.0% 58.9% 58.9% 55.9% 124.7 48.02 49.00 3.2% 59.3% 59.3% 56.1% 123.5 49.00 49.98 1.5% 56.2% 56.2% 54.7% 133.0 49.98 50.96 8.9% 65.1% 65.1% 56.2% TOU-26.1 105.9 50.96 51.94 7.2% 65.5% 65.5% 58.3% 104.7 51.94 52.92 7.1% 79.1% 79.1% 72.0% 63.5 52.92 53.90 4.7% 73.6% 73.6% 68.9% 80.0 53.90 54.88 9.7% 69.0% 69.0% 59.3% TOU-25.0 94.1 54.88 55.86 5.6% 77.6% 77.6% 72.0% 68.0 55.86 56.84 12.8% 64.2% 64.2% 51.4% 108.7 56.84 57.82 7.7% 64.2% 64.2% 56.6% 108.5 57.82 58.80 9.6% 67.0% 67.0% 57.4% 100.0 58.80 59.78 7.5% 58.2% 58.2% 50.7% 126.8 59.78 60.76 4.9% 49.0% 49.0% 44.1% 154.7
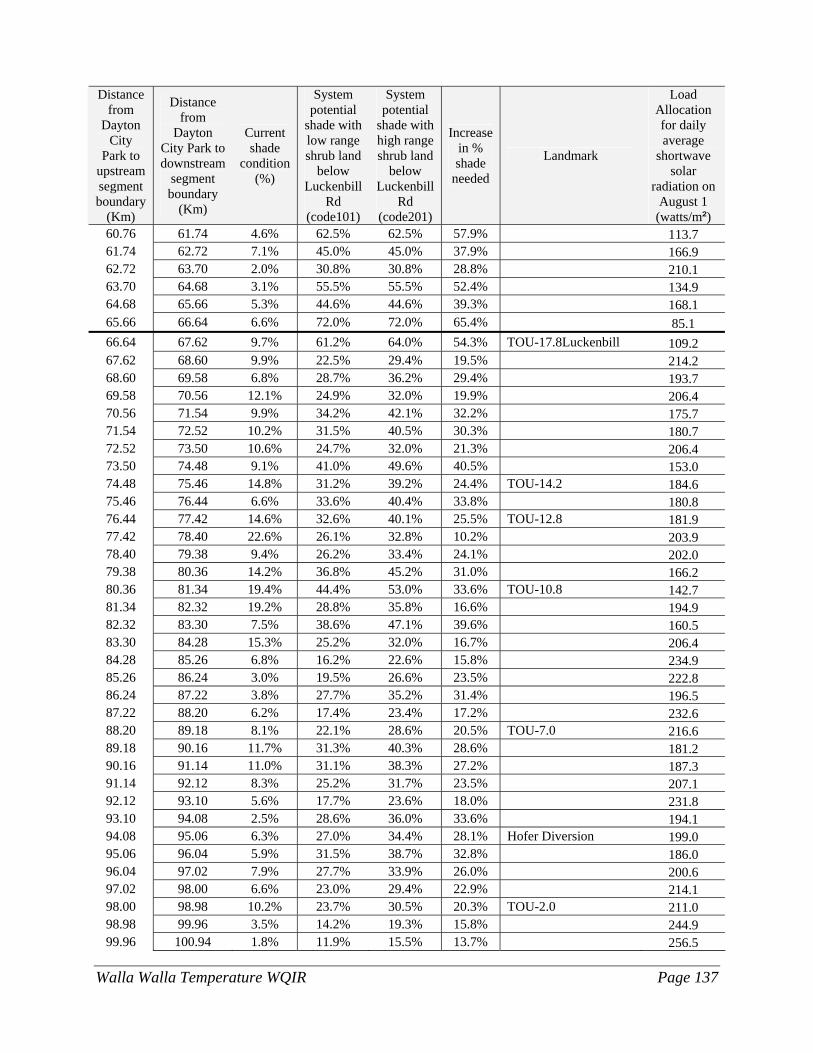
Walla Walla Temperature WQIR Page 137
Distance from
Dayton City
Park to upstream segment boundary
(Km)
Distance from
Dayton City Park to downstream
segment boundary
(Km)
Current shade
condition (%)
System potential
shade with low range shrub land
below Luckenbill
Rd (code101)
System potential
shade with high range shrub land
below Luckenbill
Rd (code201)
Increase in % shade
needed
Landmark
Load Allocation for daily average
shortwave solar
radiation on August 1
(watts/m²) 60.76 61.74 4.6% 62.5% 62.5% 57.9% 113.7 61.74 62.72 7.1% 45.0% 45.0% 37.9% 166.9 62.72 63.70 2.0% 30.8% 30.8% 28.8% 210.1 63.70 64.68 3.1% 55.5% 55.5% 52.4% 134.9 64.68 65.66 5.3% 44.6% 44.6% 39.3% 168.1 65.66 66.64 6.6% 72.0% 72.0% 65.4% 85.1 66.64 67.62 9.7% 61.2% 64.0% 54.3% TOU-17.8Luckenbill 109.2 67.62 68.60 9.9% 22.5% 29.4% 19.5% 214.2 68.60 69.58 6.8% 28.7% 36.2% 29.4% 193.7 69.58 70.56 12.1% 24.9% 32.0% 19.9% 206.4 70.56 71.54 9.9% 34.2% 42.1% 32.2% 175.7 71.54 72.52 10.2% 31.5% 40.5% 30.3% 180.7 72.52 73.50 10.6% 24.7% 32.0% 21.3% 206.4 73.50 74.48 9.1% 41.0% 49.6% 40.5% 153.0 74.48 75.46 14.8% 31.2% 39.2% 24.4% TOU-14.2 184.6 75.46 76.44 6.6% 33.6% 40.4% 33.8% 180.8 76.44 77.42 14.6% 32.6% 40.1% 25.5% TOU-12.8 181.9 77.42 78.40 22.6% 26.1% 32.8% 10.2% 203.9 78.40 79.38 9.4% 26.2% 33.4% 24.1% 202.0 79.38 80.36 14.2% 36.8% 45.2% 31.0% 166.2 80.36 81.34 19.4% 44.4% 53.0% 33.6% TOU-10.8 142.7 81.34 82.32 19.2% 28.8% 35.8% 16.6% 194.9 82.32 83.30 7.5% 38.6% 47.1% 39.6% 160.5 83.30 84.28 15.3% 25.2% 32.0% 16.7% 206.4 84.28 85.26 6.8% 16.2% 22.6% 15.8% 234.9 85.26 86.24 3.0% 19.5% 26.6% 23.5% 222.8 86.24 87.22 3.8% 27.7% 35.2% 31.4% 196.5 87.22 88.20 6.2% 17.4% 23.4% 17.2% 232.6 88.20 89.18 8.1% 22.1% 28.6% 20.5% TOU-7.0 216.6 89.18 90.16 11.7% 31.3% 40.3% 28.6% 181.2 90.16 91.14 11.0% 31.1% 38.3% 27.2% 187.3 91.14 92.12 8.3% 25.2% 31.7% 23.5% 207.1 92.12 93.10 5.6% 17.7% 23.6% 18.0% 231.8 93.10 94.08 2.5% 28.6% 36.0% 33.6% 194.1 94.08 95.06 6.3% 27.0% 34.4% 28.1% Hofer Diversion 199.0 95.06 96.04 5.9% 31.5% 38.7% 32.8% 186.0 96.04 97.02 7.9% 27.7% 33.9% 26.0% 200.6 97.02 98.00 6.6% 23.0% 29.4% 22.9% 214.1 98.00 98.98 10.2% 23.7% 30.5% 20.3% TOU-2.0 211.0 98.98 99.96 3.5% 14.2% 19.3% 15.8% 244.9 99.96 100.94 1.8% 11.9% 15.5% 13.7% 256.5
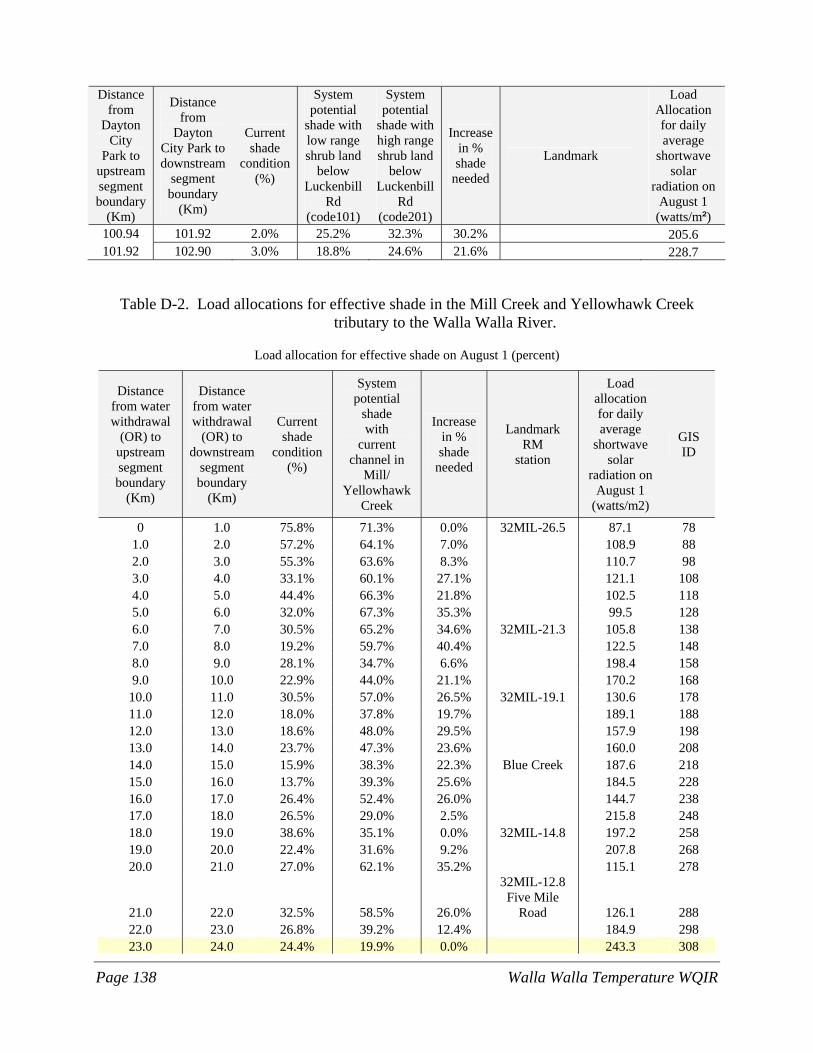
Page 138 Walla Walla Temperature WQIR
Distance from
Dayton City
Park to upstream segment boundary
(Km)
Distance from
Dayton City Park to downstream
segment boundary
(Km)
Current shade
condition (%)
System potential
shade with low range shrub land
below Luckenbill
Rd (code101)
System potential
shade with high range shrub land
below Luckenbill
Rd (code201)
Increase in % shade
needed
Landmark
Load Allocation for daily average
shortwave solar
radiation on August 1
(watts/m²) 100.94 101.92 2.0% 25.2% 32.3% 30.2% 205.6 101.92 102.90 3.0% 18.8% 24.6% 21.6% 228.7
Table D-2. Load allocations for effective shade in the Mill Creek and Yellowhawk Creek tributary to the Walla Walla River.
Load allocation for effective shade on August 1 (percent)
Distance from water withdrawal
(OR) to upstream segment boundary
(Km)
Distance from water withdrawal
(OR) to downstream
segment boundary
(Km)
Current shade
condition (%)
System potential
shade with
current channel in
Mill/ Yellowhawk
Creek
Increase in % shade
needed
Landmark RM
station
Load allocation for daily average
shortwave solar
radiation on August 1
(watts/m2)
GIS ID
0 1.0 75.8% 71.3% 0.0% 32MIL-26.5 87.1 78 1.0 2.0 57.2% 64.1% 7.0% 108.9 88 2.0 3.0 55.3% 63.6% 8.3% 110.7 98 3.0 4.0 33.1% 60.1% 27.1% 121.1 108 4.0 5.0 44.4% 66.3% 21.8% 102.5 118 5.0 6.0 32.0% 67.3% 35.3% 99.5 128 6.0 7.0 30.5% 65.2% 34.6% 32MIL-21.3 105.8 138 7.0 8.0 19.2% 59.7% 40.4% 122.5 148 8.0 9.0 28.1% 34.7% 6.6% 198.4 158 9.0 10.0 22.9% 44.0% 21.1% 170.2 168
10.0 11.0 30.5% 57.0% 26.5% 32MIL-19.1 130.6 178 11.0 12.0 18.0% 37.8% 19.7% 189.1 188 12.0 13.0 18.6% 48.0% 29.5% 157.9 198 13.0 14.0 23.7% 47.3% 23.6% 160.0 208 14.0 15.0 15.9% 38.3% 22.3% Blue Creek 187.6 218 15.0 16.0 13.7% 39.3% 25.6% 184.5 228 16.0 17.0 26.4% 52.4% 26.0% 144.7 238 17.0 18.0 26.5% 29.0% 2.5% 215.8 248 18.0 19.0 38.6% 35.1% 0.0% 32MIL-14.8 197.2 258 19.0 20.0 22.4% 31.6% 9.2% 207.8 268 20.0 21.0 27.0% 62.1% 35.2% 115.1 278
21.0 22.0 32.5% 58.5% 26.0%
32MIL-12.8 Five Mile
Road 126.1 288 22.0 23.0 26.8% 39.2% 12.4% 184.9 298 23.0 24.0 24.4% 19.9% 0.0% 243.3 308
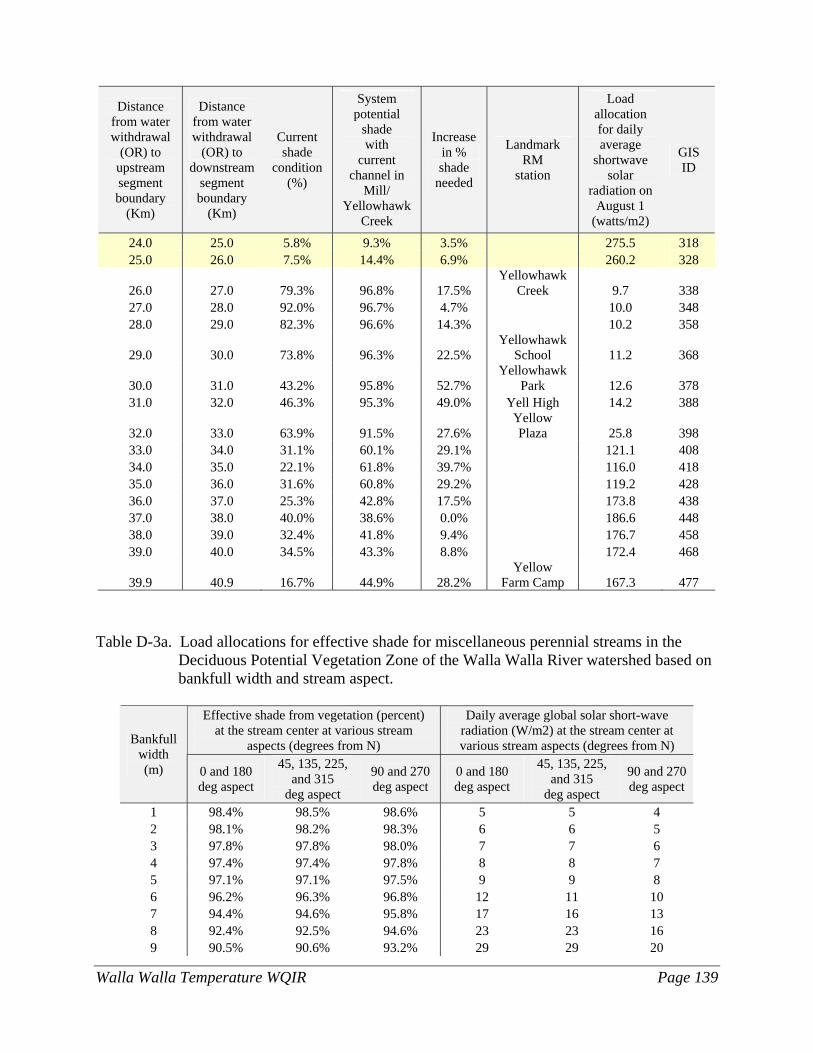
Walla Walla Temperature WQIR Page 139
Distance from water withdrawal
(OR) to upstream segment boundary
(Km)
Distance from water withdrawal
(OR) to downstream
segment boundary
(Km)
Current shade
condition (%)
System potential
shade with
current channel in
Mill/ Yellowhawk
Creek
Increase in % shade
needed
Landmark RM
station
Load allocation for daily average
shortwave solar
radiation on August 1
(watts/m2)
GIS ID
24.0 25.0 5.8% 9.3% 3.5% 275.5 318 25.0 26.0 7.5% 14.4% 6.9% 260.2 328
26.0 27.0 79.3% 96.8% 17.5% Yellowhawk
Creek 9.7 338 27.0 28.0 92.0% 96.7% 4.7% 10.0 348 28.0 29.0 82.3% 96.6% 14.3% 10.2 358
29.0 30.0 73.8% 96.3% 22.5% Yellowhawk
School 11.2 368
30.0 31.0 43.2% 95.8% 52.7% Yellowhawk
Park 12.6 378 31.0 32.0 46.3% 95.3% 49.0% Yell High 14.2 388
32.0 33.0 63.9% 91.5% 27.6% Yellow Plaza 25.8 398
33.0 34.0 31.1% 60.1% 29.1% 121.1 408 34.0 35.0 22.1% 61.8% 39.7% 116.0 418 35.0 36.0 31.6% 60.8% 29.2% 119.2 428 36.0 37.0 25.3% 42.8% 17.5% 173.8 438 37.0 38.0 40.0% 38.6% 0.0% 186.6 448 38.0 39.0 32.4% 41.8% 9.4% 176.7 458 39.0 40.0 34.5% 43.3% 8.8% 172.4 468
39.9 40.9 16.7% 44.9% 28.2% Yellow
Farm Camp 167.3 477
Table D-3a. Load allocations for effective shade for miscellaneous perennial streams in the Deciduous Potential Vegetation Zone of the Walla Walla River watershed based on bankfull width and stream aspect.
Effective shade from vegetation (percent)
at the stream center at various stream aspects (degrees from N)
Daily average global solar short-wave radiation (W/m2) at the stream center at various stream aspects (degrees from N) Bankfull
width (m) 0 and 180
deg aspect
45, 135, 225, and 315
deg aspect
90 and 270 deg aspect
0 and 180 deg aspect
45, 135, 225, and 315
deg aspect
90 and 270 deg aspect
1 98.4% 98.5% 98.6% 5 5 4 2 98.1% 98.2% 98.3% 6 6 5 3 97.8% 97.8% 98.0% 7 7 6 4 97.4% 97.4% 97.8% 8 8 7 5 97.1% 97.1% 97.5% 9 9 8 6 96.2% 96.3% 96.8% 12 11 10 7 94.4% 94.6% 95.8% 17 16 13 8 92.4% 92.5% 94.6% 23 23 16 9 90.5% 90.6% 93.2% 29 29 20
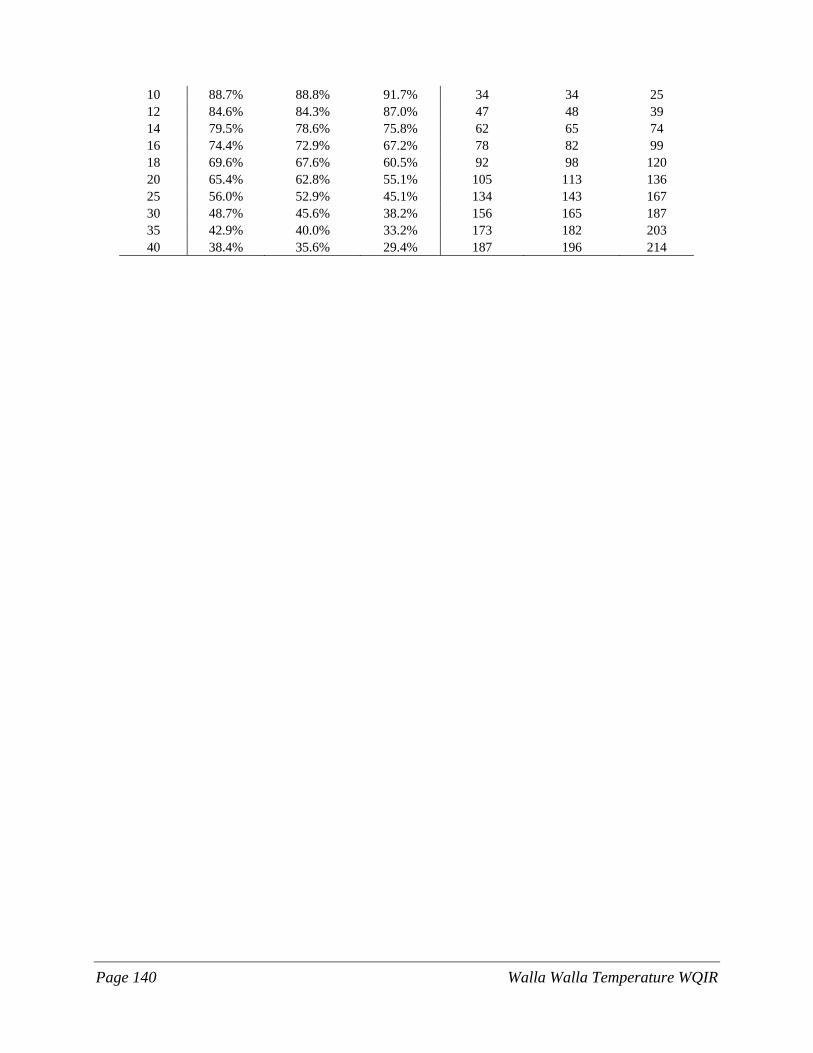
Page 140 Walla Walla Temperature WQIR
10 88.7% 88.8% 91.7% 34 34 25 12 84.6% 84.3% 87.0% 47 48 39 14 79.5% 78.6% 75.8% 62 65 74 16 74.4% 72.9% 67.2% 78 82 99 18 69.6% 67.6% 60.5% 92 98 120 20 65.4% 62.8% 55.1% 105 113 136 25 56.0% 52.9% 45.1% 134 143 167 30 48.7% 45.6% 38.2% 156 165 187 35 42.9% 40.0% 33.2% 173 182 203 40 38.4% 35.6% 29.4% 187 196 214
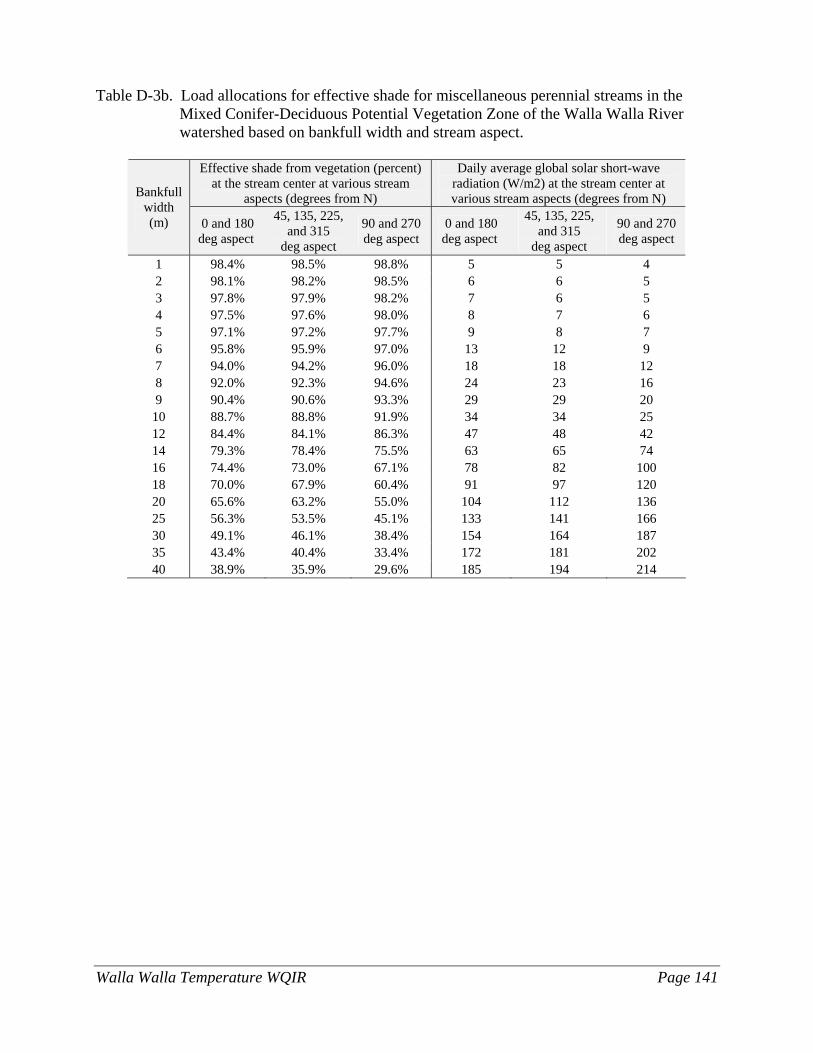
Walla Walla Temperature WQIR Page 141
Table D-3b. Load allocations for effective shade for miscellaneous perennial streams in the Mixed Conifer-Deciduous Potential Vegetation Zone of the Walla Walla River watershed based on bankfull width and stream aspect.
Effective shade from vegetation (percent)
at the stream center at various stream aspects (degrees from N)
Daily average global solar short-wave radiation (W/m2) at the stream center at various stream aspects (degrees from N) Bankfull
width (m) 0 and 180
deg aspect
45, 135, 225, and 315
deg aspect
90 and 270 deg aspect
0 and 180 deg aspect
45, 135, 225, and 315
deg aspect
90 and 270 deg aspect
1 98.4% 98.5% 98.8% 5 5 4 2 98.1% 98.2% 98.5% 6 6 5 3 97.8% 97.9% 98.2% 7 6 5 4 97.5% 97.6% 98.0% 8 7 6 5 97.1% 97.2% 97.7% 9 8 7 6 95.8% 95.9% 97.0% 13 12 9 7 94.0% 94.2% 96.0% 18 18 12 8 92.0% 92.3% 94.6% 24 23 16 9 90.4% 90.6% 93.3% 29 29 20
10 88.7% 88.8% 91.9% 34 34 25 12 84.4% 84.1% 86.3% 47 48 42 14 79.3% 78.4% 75.5% 63 65 74 16 74.4% 73.0% 67.1% 78 82 100 18 70.0% 67.9% 60.4% 91 97 120 20 65.6% 63.2% 55.0% 104 112 136 25 56.3% 53.5% 45.1% 133 141 166 30 49.1% 46.1% 38.4% 154 164 187 35 43.4% 40.4% 33.4% 172 181 202 40 38.9% 35.9% 29.6% 185 194 214
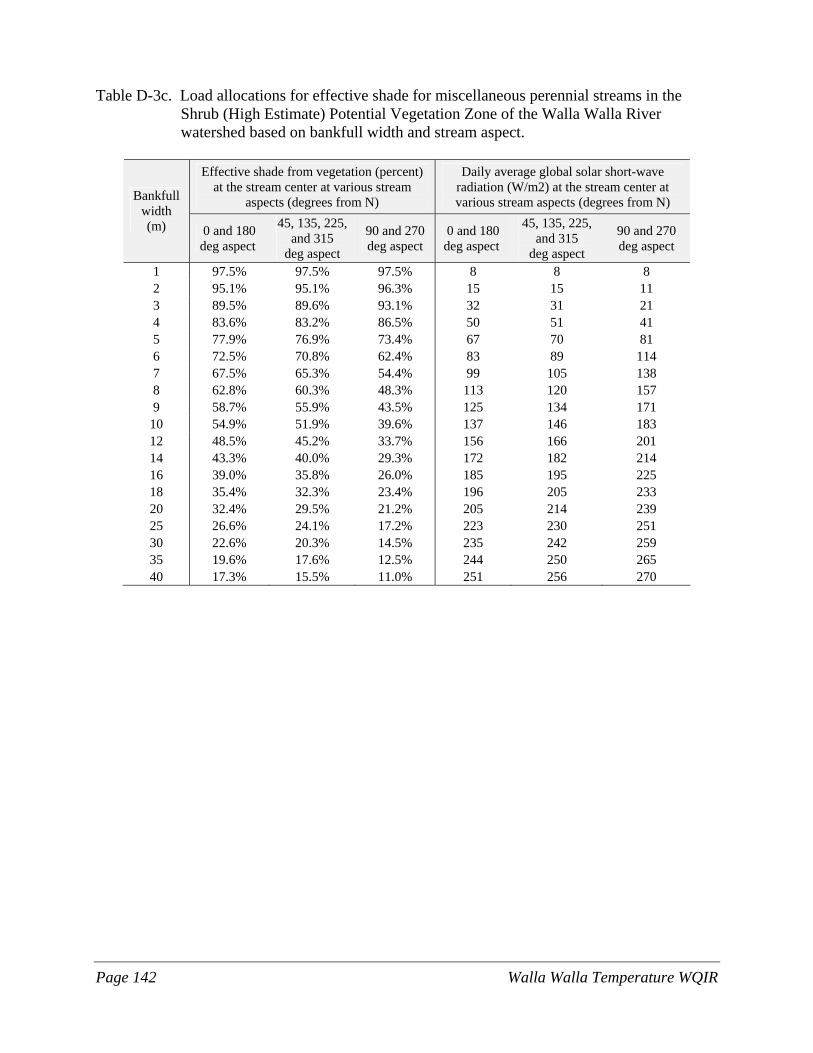
Page 142 Walla Walla Temperature WQIR
Table D-3c. Load allocations for effective shade for miscellaneous perennial streams in the Shrub (High Estimate) Potential Vegetation Zone of the Walla Walla River watershed based on bankfull width and stream aspect.
Effective shade from vegetation (percent)
at the stream center at various stream aspects (degrees from N)
Daily average global solar short-wave radiation (W/m2) at the stream center at various stream aspects (degrees from N) Bankfull
width (m) 0 and 180
deg aspect
45, 135, 225, and 315
deg aspect
90 and 270 deg aspect
0 and 180 deg aspect
45, 135, 225, and 315
deg aspect
90 and 270 deg aspect
1 97.5% 97.5% 97.5% 8 8 8 2 95.1% 95.1% 96.3% 15 15 11 3 89.5% 89.6% 93.1% 32 31 21 4 83.6% 83.2% 86.5% 50 51 41 5 77.9% 76.9% 73.4% 67 70 81 6 72.5% 70.8% 62.4% 83 89 114 7 67.5% 65.3% 54.4% 99 105 138 8 62.8% 60.3% 48.3% 113 120 157 9 58.7% 55.9% 43.5% 125 134 171
10 54.9% 51.9% 39.6% 137 146 183 12 48.5% 45.2% 33.7% 156 166 201 14 43.3% 40.0% 29.3% 172 182 214 16 39.0% 35.8% 26.0% 185 195 225 18 35.4% 32.3% 23.4% 196 205 233 20 32.4% 29.5% 21.2% 205 214 239 25 26.6% 24.1% 17.2% 223 230 251 30 22.6% 20.3% 14.5% 235 242 259 35 19.6% 17.6% 12.5% 244 250 265 40 17.3% 15.5% 11.0% 251 256 270
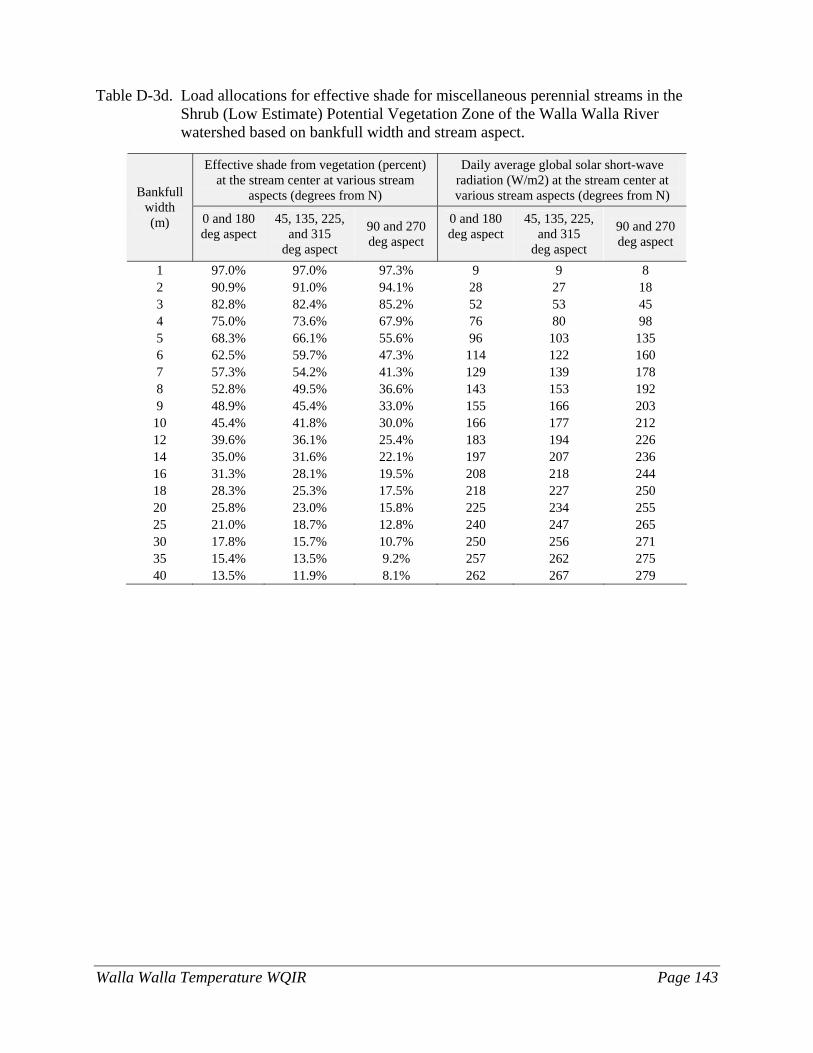
Walla Walla Temperature WQIR Page 143
Table D-3d. Load allocations for effective shade for miscellaneous perennial streams in the Shrub (Low Estimate) Potential Vegetation Zone of the Walla Walla River watershed based on bankfull width and stream aspect.
Effective shade from vegetation (percent) at the stream center at various stream
aspects (degrees from N)
Daily average global solar short-wave radiation (W/m2) at the stream center at various stream aspects (degrees from N) Bankfull
width (m) 0 and 180
deg aspect
45, 135, 225, and 315
deg aspect
90 and 270 deg aspect
0 and 180 deg aspect
45, 135, 225, and 315
deg aspect
90 and 270 deg aspect
1 97.0% 97.0% 97.3% 9 9 8 2 90.9% 91.0% 94.1% 28 27 18 3 82.8% 82.4% 85.2% 52 53 45 4 75.0% 73.6% 67.9% 76 80 98 5 68.3% 66.1% 55.6% 96 103 135 6 62.5% 59.7% 47.3% 114 122 160 7 57.3% 54.2% 41.3% 129 139 178 8 52.8% 49.5% 36.6% 143 153 192 9 48.9% 45.4% 33.0% 155 166 203
10 45.4% 41.8% 30.0% 166 177 212 12 39.6% 36.1% 25.4% 183 194 226 14 35.0% 31.6% 22.1% 197 207 236 16 31.3% 28.1% 19.5% 208 218 244 18 28.3% 25.3% 17.5% 218 227 250 20 25.8% 23.0% 15.8% 225 234 255 25 21.0% 18.7% 12.8% 240 247 265 30 17.8% 15.7% 10.7% 250 256 271 35 15.4% 13.5% 9.2% 257 262 275 40 13.5% 11.9% 8.1% 262 267 279
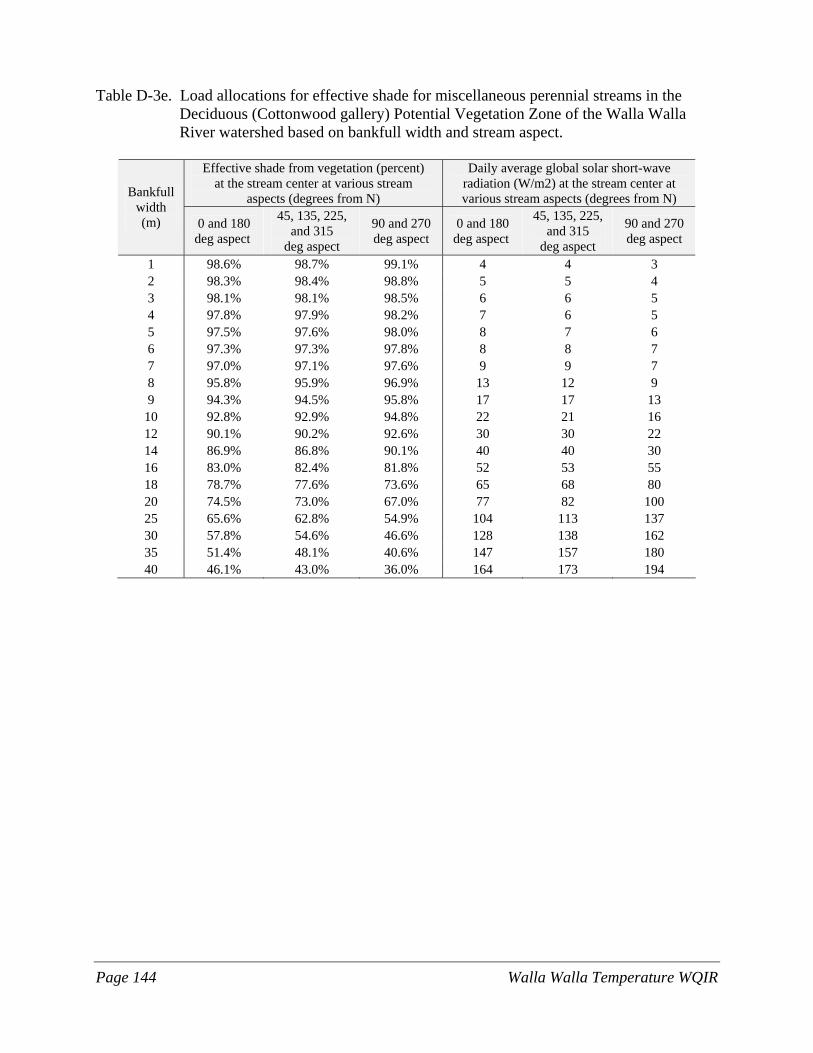
Page 144 Walla Walla Temperature WQIR
Table D-3e. Load allocations for effective shade for miscellaneous perennial streams in the Deciduous (Cottonwood gallery) Potential Vegetation Zone of the Walla Walla River watershed based on bankfull width and stream aspect.
Effective shade from vegetation (percent)
at the stream center at various stream aspects (degrees from N)
Daily average global solar short-wave radiation (W/m2) at the stream center at various stream aspects (degrees from N) Bankfull
width (m) 0 and 180
deg aspect
45, 135, 225, and 315
deg aspect
90 and 270 deg aspect
0 and 180 deg aspect
45, 135, 225, and 315
deg aspect
90 and 270 deg aspect
1 98.6% 98.7% 99.1% 4 4 3 2 98.3% 98.4% 98.8% 5 5 4 3 98.1% 98.1% 98.5% 6 6 5 4 97.8% 97.9% 98.2% 7 6 5 5 97.5% 97.6% 98.0% 8 7 6 6 97.3% 97.3% 97.8% 8 8 7 7 97.0% 97.1% 97.6% 9 9 7 8 95.8% 95.9% 96.9% 13 12 9 9 94.3% 94.5% 95.8% 17 17 13
10 92.8% 92.9% 94.8% 22 21 16 12 90.1% 90.2% 92.6% 30 30 22 14 86.9% 86.8% 90.1% 40 40 30 16 83.0% 82.4% 81.8% 52 53 55 18 78.7% 77.6% 73.6% 65 68 80 20 74.5% 73.0% 67.0% 77 82 100 25 65.6% 62.8% 54.9% 104 113 137 30 57.8% 54.6% 46.6% 128 138 162 35 51.4% 48.1% 40.6% 147 157 180 40 46.1% 43.0% 36.0% 164 173 194
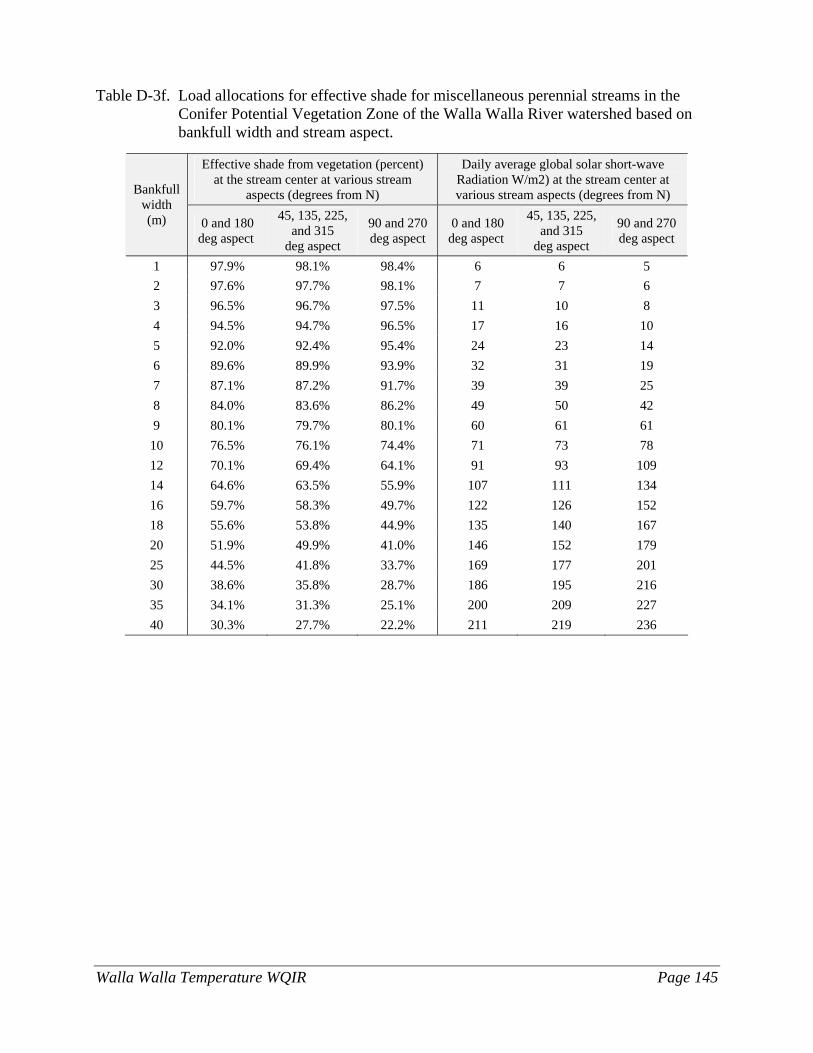
Walla Walla Temperature WQIR Page 145
Table D-3f. Load allocations for effective shade for miscellaneous perennial streams in the Conifer Potential Vegetation Zone of the Walla Walla River watershed based on bankfull width and stream aspect.
Effective shade from vegetation (percent) at the stream center at various stream
aspects (degrees from N)
Daily average global solar short-wave Radiation W/m2) at the stream center at various stream aspects (degrees from N) Bankfull
width (m) 0 and 180
deg aspect
45, 135, 225, and 315
deg aspect
90 and 270 deg aspect
0 and 180 deg aspect
45, 135, 225, and 315
deg aspect
90 and 270 deg aspect
1 97.9% 98.1% 98.4% 6 6 5 2 97.6% 97.7% 98.1% 7 7 6 3 96.5% 96.7% 97.5% 11 10 8 4 94.5% 94.7% 96.5% 17 16 10 5 92.0% 92.4% 95.4% 24 23 14 6 89.6% 89.9% 93.9% 32 31 19 7 87.1% 87.2% 91.7% 39 39 25 8 84.0% 83.6% 86.2% 49 50 42 9 80.1% 79.7% 80.1% 60 61 61
10 76.5% 76.1% 74.4% 71 73 78 12 70.1% 69.4% 64.1% 91 93 109 14 64.6% 63.5% 55.9% 107 111 134 16 59.7% 58.3% 49.7% 122 126 152 18 55.6% 53.8% 44.9% 135 140 167 20 51.9% 49.9% 41.0% 146 152 179 25 44.5% 41.8% 33.7% 169 177 201 30 38.6% 35.8% 28.7% 186 195 216 35 34.1% 31.3% 25.1% 200 209 227 40 30.3% 27.7% 22.2% 211 219 236
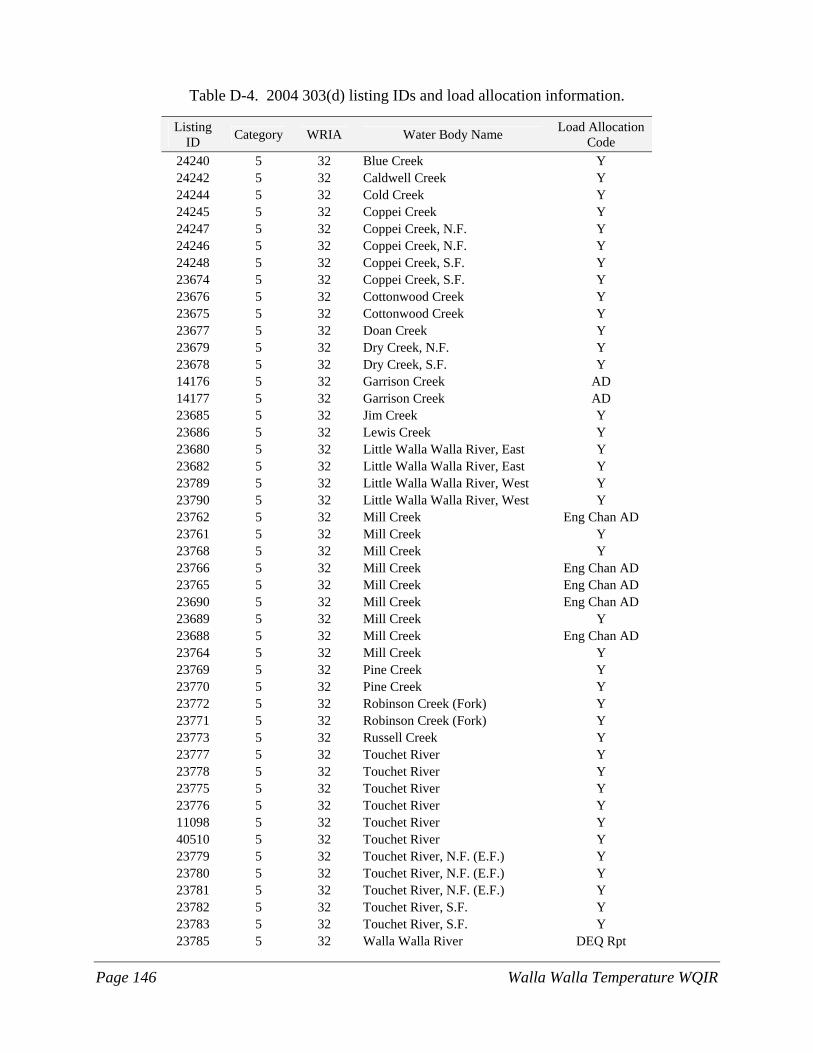
Page 146 Walla Walla Temperature WQIR
Table D-4. 2004 303(d) listing IDs and load allocation information.
Listing ID Category WRIA Water Body Name Load Allocation
Code 24240 5 32 Blue Creek Y 24242 5 32 Caldwell Creek Y 24244 5 32 Cold Creek Y 24245 5 32 Coppei Creek Y 24247 5 32 Coppei Creek, N.F. Y 24246 5 32 Coppei Creek, N.F. Y 24248 5 32 Coppei Creek, S.F. Y 23674 5 32 Coppei Creek, S.F. Y 23676 5 32 Cottonwood Creek Y 23675 5 32 Cottonwood Creek Y 23677 5 32 Doan Creek Y 23679 5 32 Dry Creek, N.F. Y 23678 5 32 Dry Creek, S.F. Y 14176 5 32 Garrison Creek AD 14177 5 32 Garrison Creek AD 23685 5 32 Jim Creek Y 23686 5 32 Lewis Creek Y 23680 5 32 Little Walla Walla River, East Y 23682 5 32 Little Walla Walla River, East Y 23789 5 32 Little Walla Walla River, West Y 23790 5 32 Little Walla Walla River, West Y 23762 5 32 Mill Creek Eng Chan AD 23761 5 32 Mill Creek Y 23768 5 32 Mill Creek Y 23766 5 32 Mill Creek Eng Chan AD 23765 5 32 Mill Creek Eng Chan AD 23690 5 32 Mill Creek Eng Chan AD 23689 5 32 Mill Creek Y 23688 5 32 Mill Creek Eng Chan AD 23764 5 32 Mill Creek Y 23769 5 32 Pine Creek Y 23770 5 32 Pine Creek Y 23772 5 32 Robinson Creek (Fork) Y 23771 5 32 Robinson Creek (Fork) Y 23773 5 32 Russell Creek Y 23777 5 32 Touchet River Y 23778 5 32 Touchet River Y 23775 5 32 Touchet River Y 23776 5 32 Touchet River Y 11098 5 32 Touchet River Y 40510 5 32 Touchet River Y 23779 5 32 Touchet River, N.F. (E.F.) Y 23780 5 32 Touchet River, N.F. (E.F.) Y 23781 5 32 Touchet River, N.F. (E.F.) Y 23782 5 32 Touchet River, S.F. Y 23783 5 32 Touchet River, S.F. Y 23785 5 32 Walla Walla River DEQ Rpt
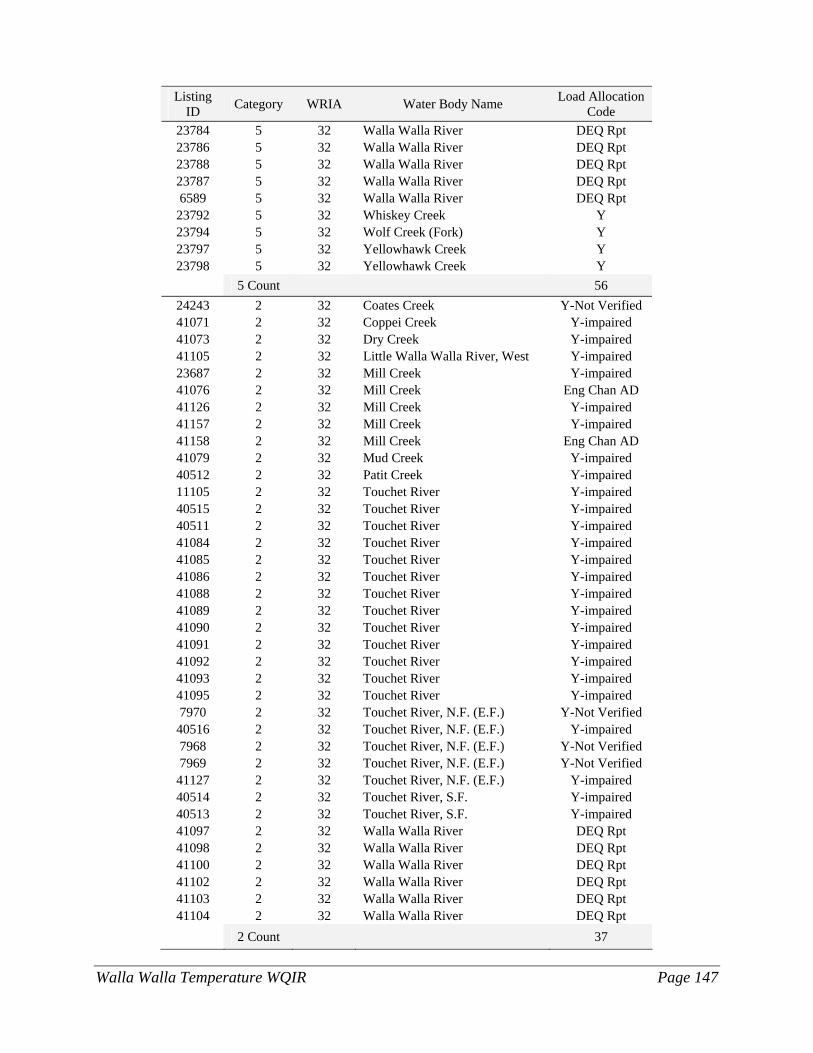
Walla Walla Temperature WQIR Page 147
Listing ID Category WRIA Water Body Name Load Allocation
Code 23784 5 32 Walla Walla River DEQ Rpt 23786 5 32 Walla Walla River DEQ Rpt 23788 5 32 Walla Walla River DEQ Rpt 23787 5 32 Walla Walla River DEQ Rpt 6589 5 32 Walla Walla River DEQ Rpt
23792 5 32 Whiskey Creek Y 23794 5 32 Wolf Creek (Fork) Y 23797 5 32 Yellowhawk Creek Y 23798 5 32 Yellowhawk Creek Y
5 Count 56 24243 2 32 Coates Creek Y-Not Verified 41071 2 32 Coppei Creek Y-impaired 41073 2 32 Dry Creek Y-impaired 41105 2 32 Little Walla Walla River, West Y-impaired 23687 2 32 Mill Creek Y-impaired 41076 2 32 Mill Creek Eng Chan AD 41126 2 32 Mill Creek Y-impaired 41157 2 32 Mill Creek Y-impaired 41158 2 32 Mill Creek Eng Chan AD 41079 2 32 Mud Creek Y-impaired 40512 2 32 Patit Creek Y-impaired 11105 2 32 Touchet River Y-impaired 40515 2 32 Touchet River Y-impaired 40511 2 32 Touchet River Y-impaired 41084 2 32 Touchet River Y-impaired 41085 2 32 Touchet River Y-impaired 41086 2 32 Touchet River Y-impaired 41088 2 32 Touchet River Y-impaired 41089 2 32 Touchet River Y-impaired 41090 2 32 Touchet River Y-impaired 41091 2 32 Touchet River Y-impaired 41092 2 32 Touchet River Y-impaired 41093 2 32 Touchet River Y-impaired 41095 2 32 Touchet River Y-impaired 7970 2 32 Touchet River, N.F. (E.F.) Y-Not Verified
40516 2 32 Touchet River, N.F. (E.F.) Y-impaired 7968 2 32 Touchet River, N.F. (E.F.) Y-Not Verified 7969 2 32 Touchet River, N.F. (E.F.) Y-Not Verified
41127 2 32 Touchet River, N.F. (E.F.) Y-impaired 40514 2 32 Touchet River, S.F. Y-impaired 40513 2 32 Touchet River, S.F. Y-impaired 41097 2 32 Walla Walla River DEQ Rpt 41098 2 32 Walla Walla River DEQ Rpt 41100 2 32 Walla Walla River DEQ Rpt 41102 2 32 Walla Walla River DEQ Rpt 41103 2 32 Walla Walla River DEQ Rpt 41104 2 32 Walla Walla River DEQ Rpt
2 Count 37
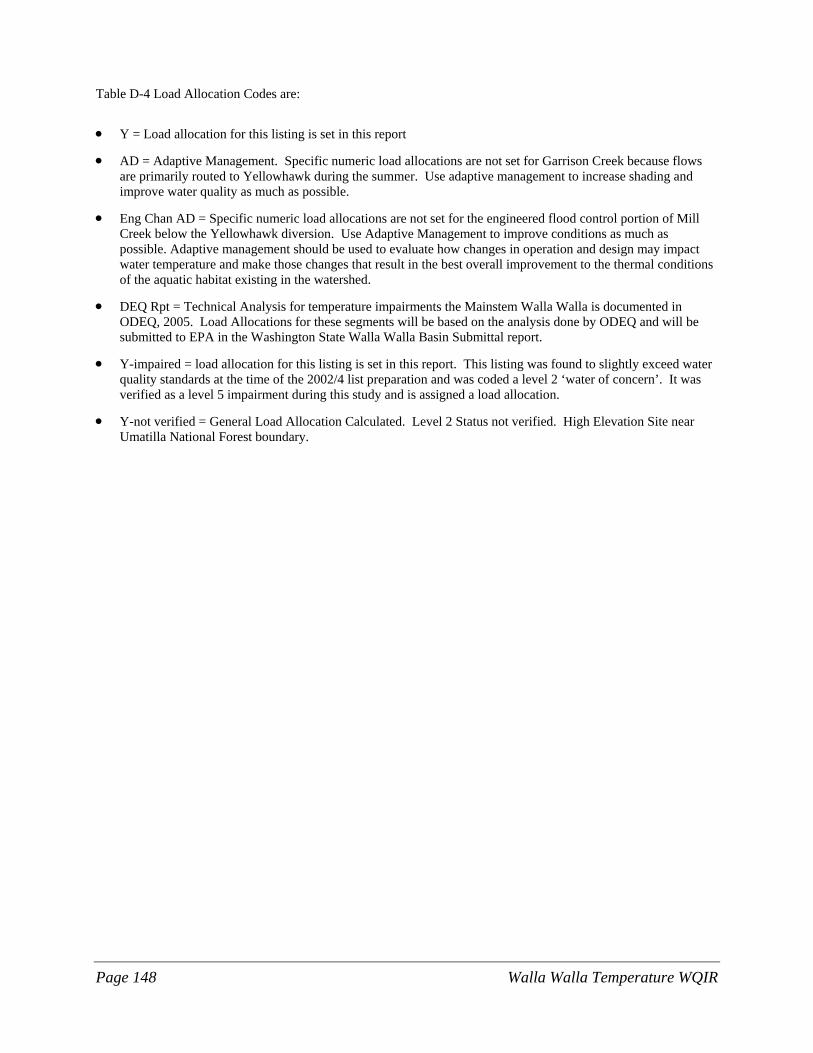
Page 148 Walla Walla Temperature WQIR
Table D-4 Load Allocation Codes are:
• Y = Load allocation for this listing is set in this report
• AD = Adaptive Management. Specific numeric load allocations are not set for Garrison Creek because flows are primarily routed to Yellowhawk during the summer. Use adaptive management to increase shading and improve water quality as much as possible.
• Eng Chan AD = Specific numeric load allocations are not set for the engineered flood control portion of Mill Creek below the Yellowhawk diversion. Use Adaptive Management to improve conditions as much as possible. Adaptive management should be used to evaluate how changes in operation and design may impact water temperature and make those changes that result in the best overall improvement to the thermal conditions of the aquatic habitat existing in the watershed.
• DEQ Rpt = Technical Analysis for temperature impairments the Mainstem Walla Walla is documented in ODEQ, 2005. Load Allocations for these segments will be based on the analysis done by ODEQ and will be submitted to EPA in the Washington State Walla Walla Basin Submittal report.
• Y-impaired = load allocation for this listing is set in this report. This listing was found to slightly exceed water quality standards at the time of the 2002/4 list preparation and was coded a level 2 ‘water of concern’. It was verified as a level 5 impairment during this study and is assigned a load allocation.
• Y-not verified = General Load Allocation Calculated. Level 2 Status not verified. High Elevation Site near Umatilla National Forest boundary.
Walla Walla Temperature WQIR Page 149
Appendix E. Stream Temperature Analysis for the Walla Walla River
Appendix A: Stream Temperature Analysis: Vegetation, Hydrology and Morphology Walla Walla Subbasin
By: Don Butcher1 and Bob Bower2
1State of Oregon Department of Environmental Quality Pendelton, OR 97801
2 Walla Walla Basin Watershed Council
Milton-Freewater, OR 97862
August 2005
This report is available on the Oregon Department of Environmental Quality’s Web site at:
www.deq.state.or.us/wq/TMDLs/docs/wallawallabasin/appxa.pdf
For more information contact:
Don Butcher Basin Coordinator/Analyst
Oregon Department of Environmental Quality 700 SE Emigrant, Suite 330
Pendleton, OR 97801
E-mail: [email protected]