Embed Size (px)
Citation preview
Walker Sigismund, FSA Risk Policy 1
Using Harm to anticipate and regulate Liquidity Risk
By Walker SigismundFSA Risk Policy
Imperial Risk Management Laboratory
Liquidity: Pricing and Risk Management Bank of England, 23-24 June 2008
Walker Sigismund, FSA Risk Policy 2
Troubles with Liquidity Concept
• During the last couple years I have been troubled by– The frequent absence of any clear let alone consistent definition of
“Liquidity Risk” in most academic and industry papers or discussions, in which it is used to mean many different and contradictory things
– Whether Liquidity is merely a symptom of the crystallisation of other types of risk—market, credit and operational—or a risk in its own right (& whether Basle captures it or not)
– Why firms think Liquidity is Firm rather than Market-centric– What are the Triggers & Early Warning Indicators– How to manage and regulate Liquidity– Whether the only regulatory concern is the Time transformation of
deposits, or if it includes Market Confidence and other factors…?
• The following derivative model of a firm/market and extensive empirical results help resolve these and many other Liquidity and Financial Stability problems
Walker Sigismund, FSA Risk Policy 3
Abstract
• The relationship of Liquidity to Asset Prices and the crystallisation of Market, Credit, Operational and Strategic Risks within firms can be clearly analysed by using Derivative pricing techniques to mark-to-market the balance sheets of each firm.
• The analysis defines Distress to be the risk that these risks crystallise, and defines Harm to be the losses incurred by non-shareholders as a result.
• These tools and definitions show why many of the principles and techniques used to manage Liquidity have only marginal affect.
• Marking-to-Market every Balance Sheet using these techniques, will dispel most of the current lack of transparency and help ensure that each firm get the right risk adjustment from the market.
• We have computed this risk for thousands of firms, across sectors and most major markets world-wide.
Walker Sigismund, FSA Risk Policy 4
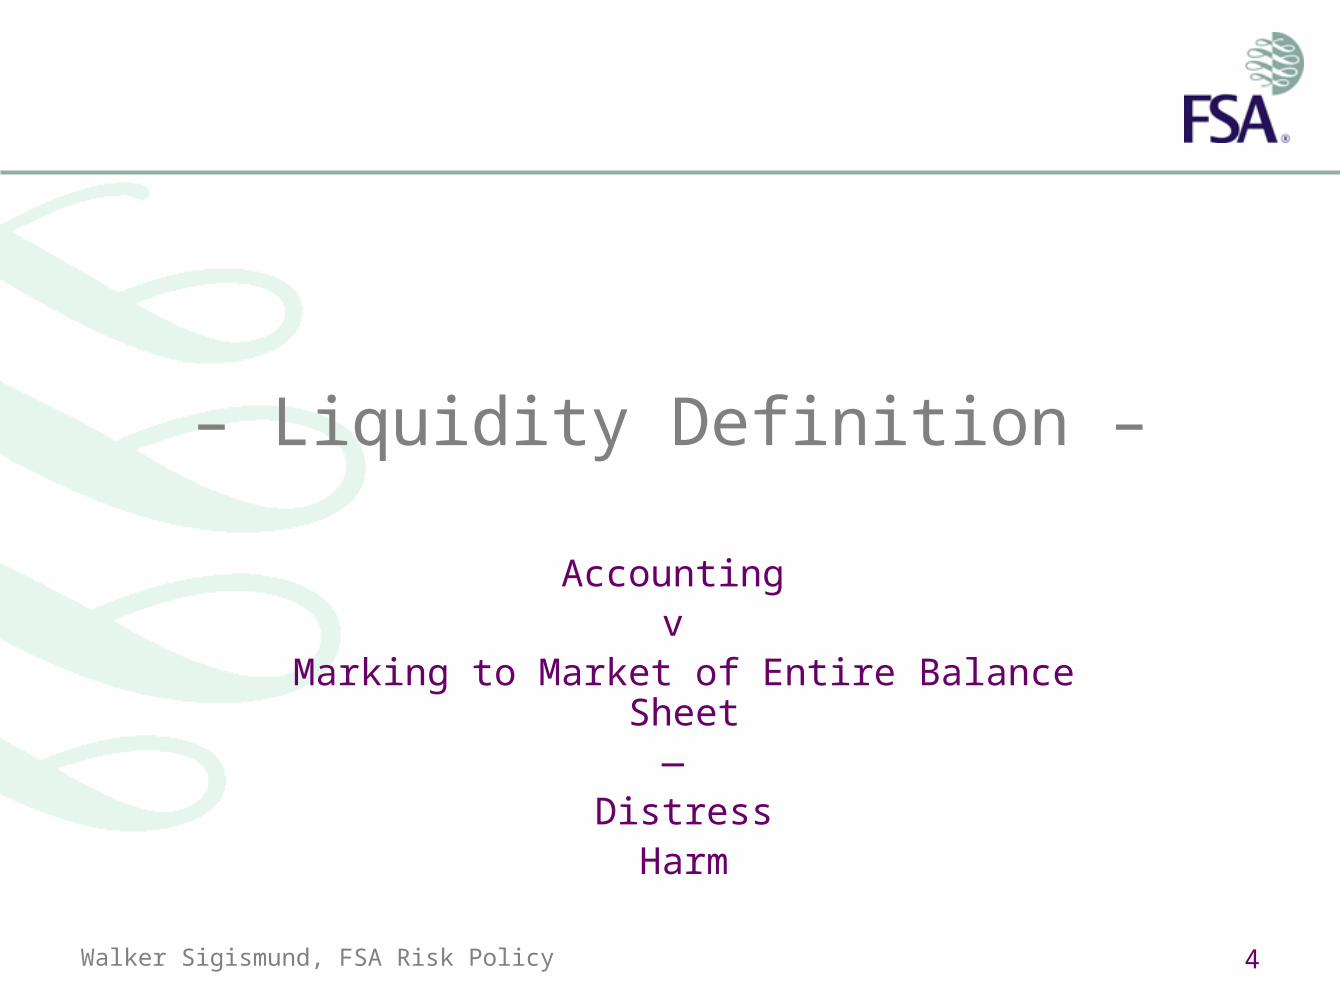
– Liquidity Definition –
Accounting v
Marking to Market of Entire Balance Sheet—
DistressHarm
Walker Sigismund, FSA Risk Policy 5
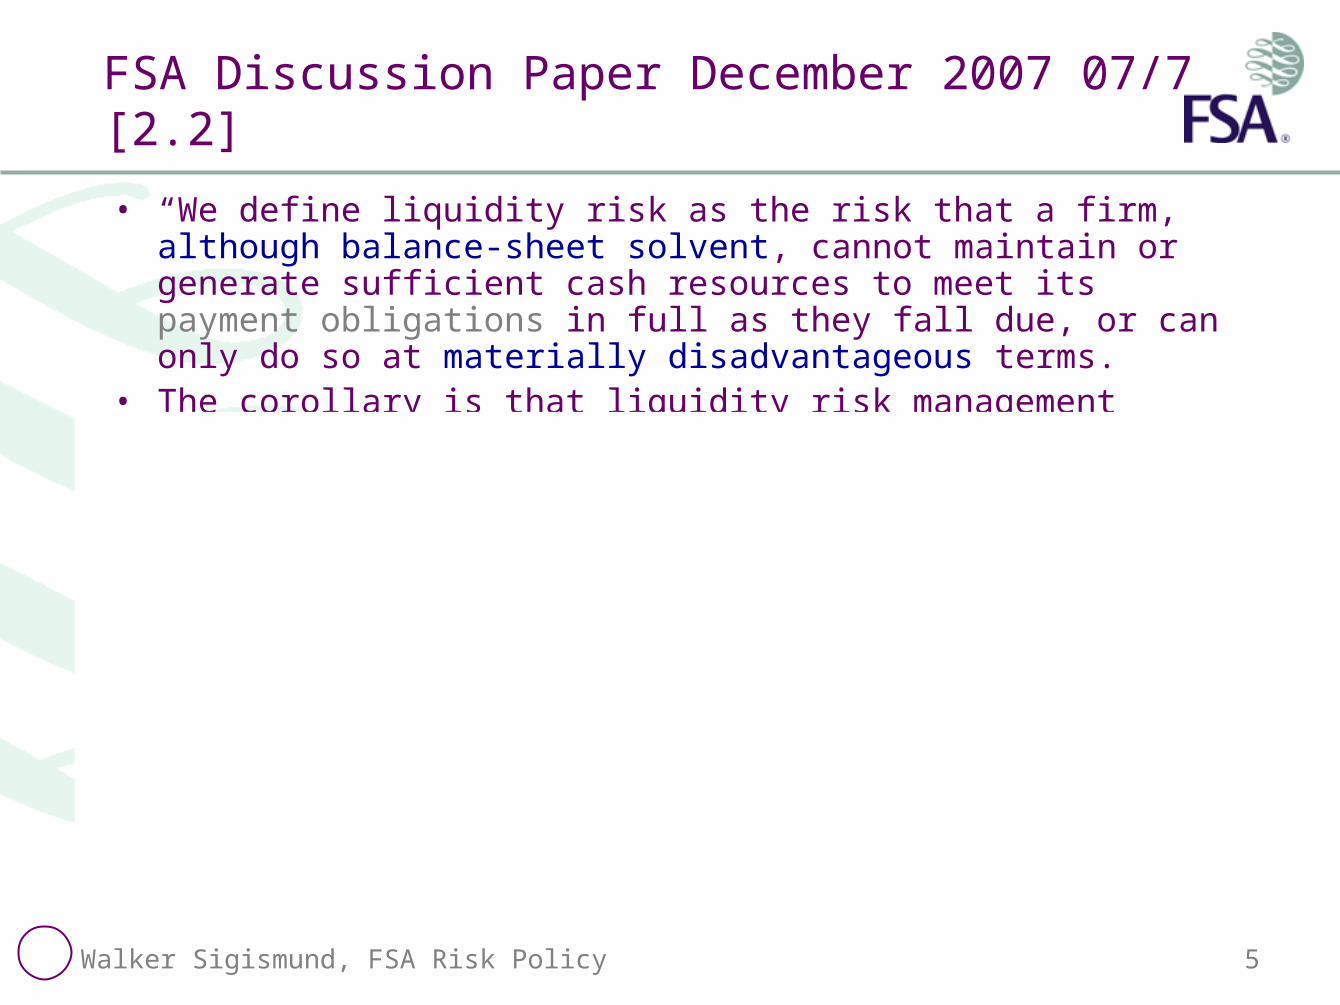
FSA Discussion Paper December 2007 07/7 [2.2]
• “We define liquidity risk as the risk that a firm, although balance-sheet solvent, cannot maintain or generate sufficient cash resources to meet its payment obligations in full as they fall due, or can only do so at materially disadvantageous terms.
• The corollary is that liquidity risk management means mitigating the risk that a bank is not able to do this. This in turn requires reliable access to enough cash resources, at unpredictable times and to unpredictable extents, to meet uncertain cash flow obligations.
• Such access – and indeed the cash flow obligations themselves – depends on market and other external events and on other agents’ behaviour. Even during normal conditions this can be far from straightforward; stressed conditions, which are themselves often unpredictable, make it even more challenging and add extra layers of uncertainty to a task already surrounded by uncertainty.”
Walker Sigismund, FSA Risk Policy 6
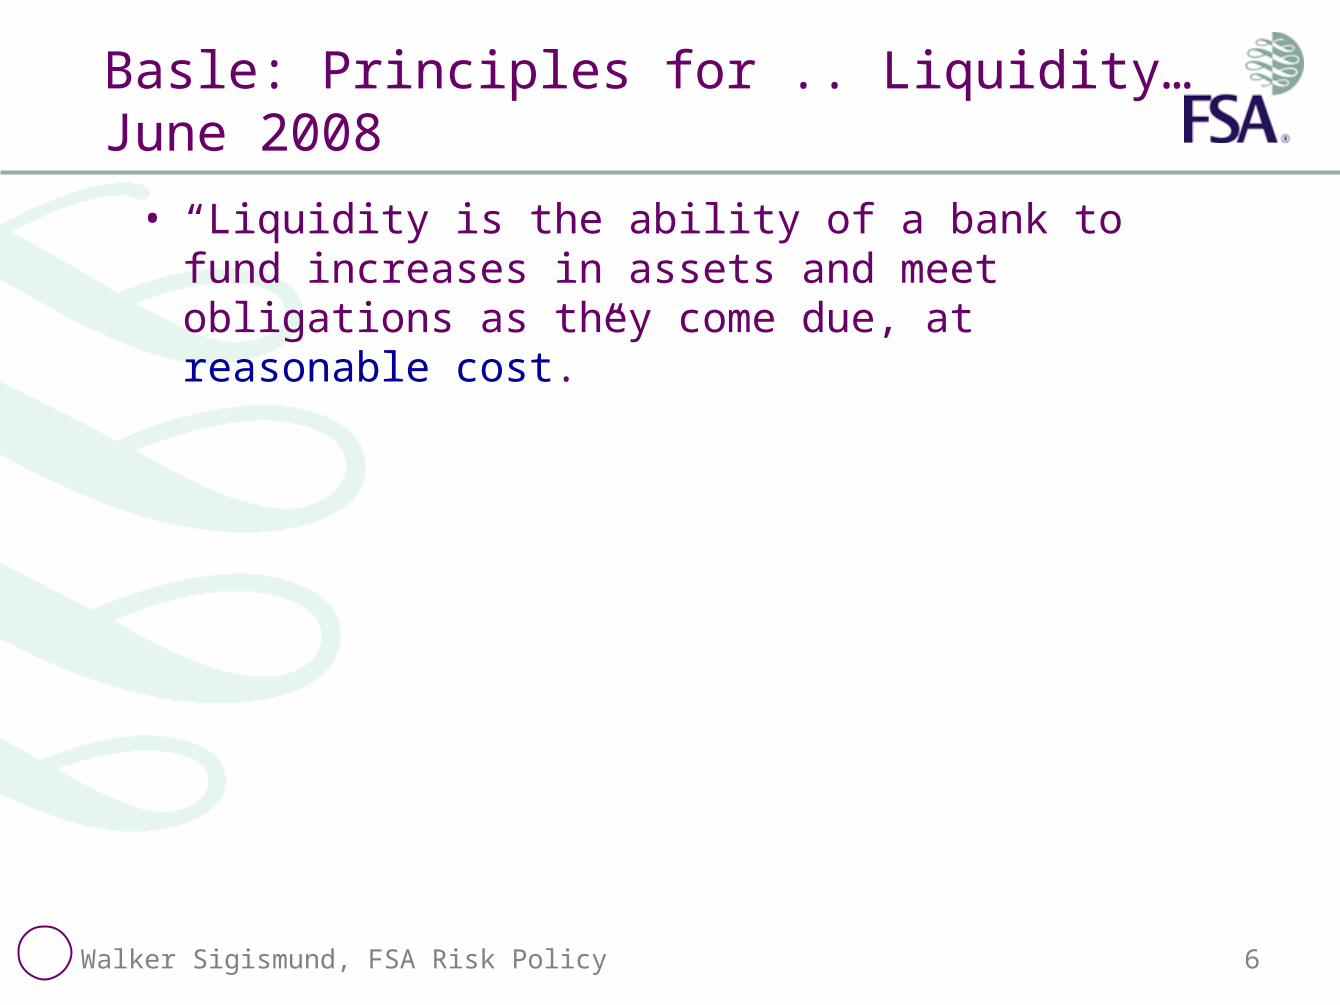
Basle: Principles for .. Liquidity… June 2008
• “Liquidity is the ability of a bank to fund increases in assets and meet obligations as they come due, at reasonable cost.”
Walker Sigismund, FSA Risk Policy 7
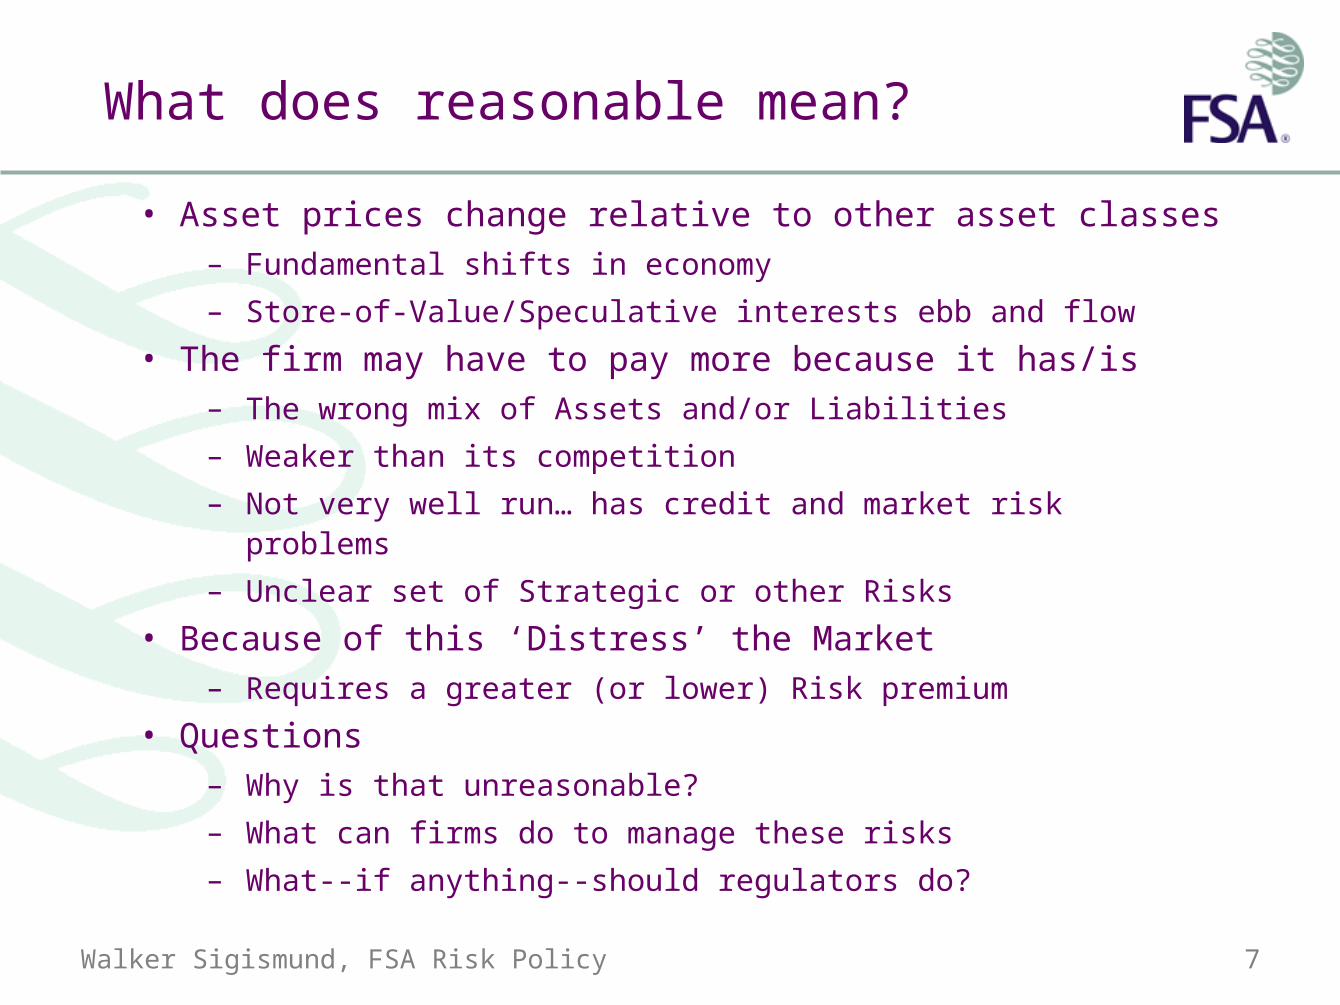
What does reasonable mean?
• Asset prices change relative to other asset classes– Fundamental shifts in economy
– Store-of-Value/Speculative interests ebb and flow
• The firm may have to pay more because it has/is – The wrong mix of Assets and/or Liabilities
– Weaker than its competition
– Not very well run… has credit and market risk problems
– Unclear set of Strategic or other Risks
• Because of this ‘Distress’ the Market– Requires a greater (or lower) Risk premium
• Questions– Why is that unreasonable?
– What can firms do to manage these risks
– What--if anything--should regulators do?
Walker Sigismund, FSA Risk Policy 8
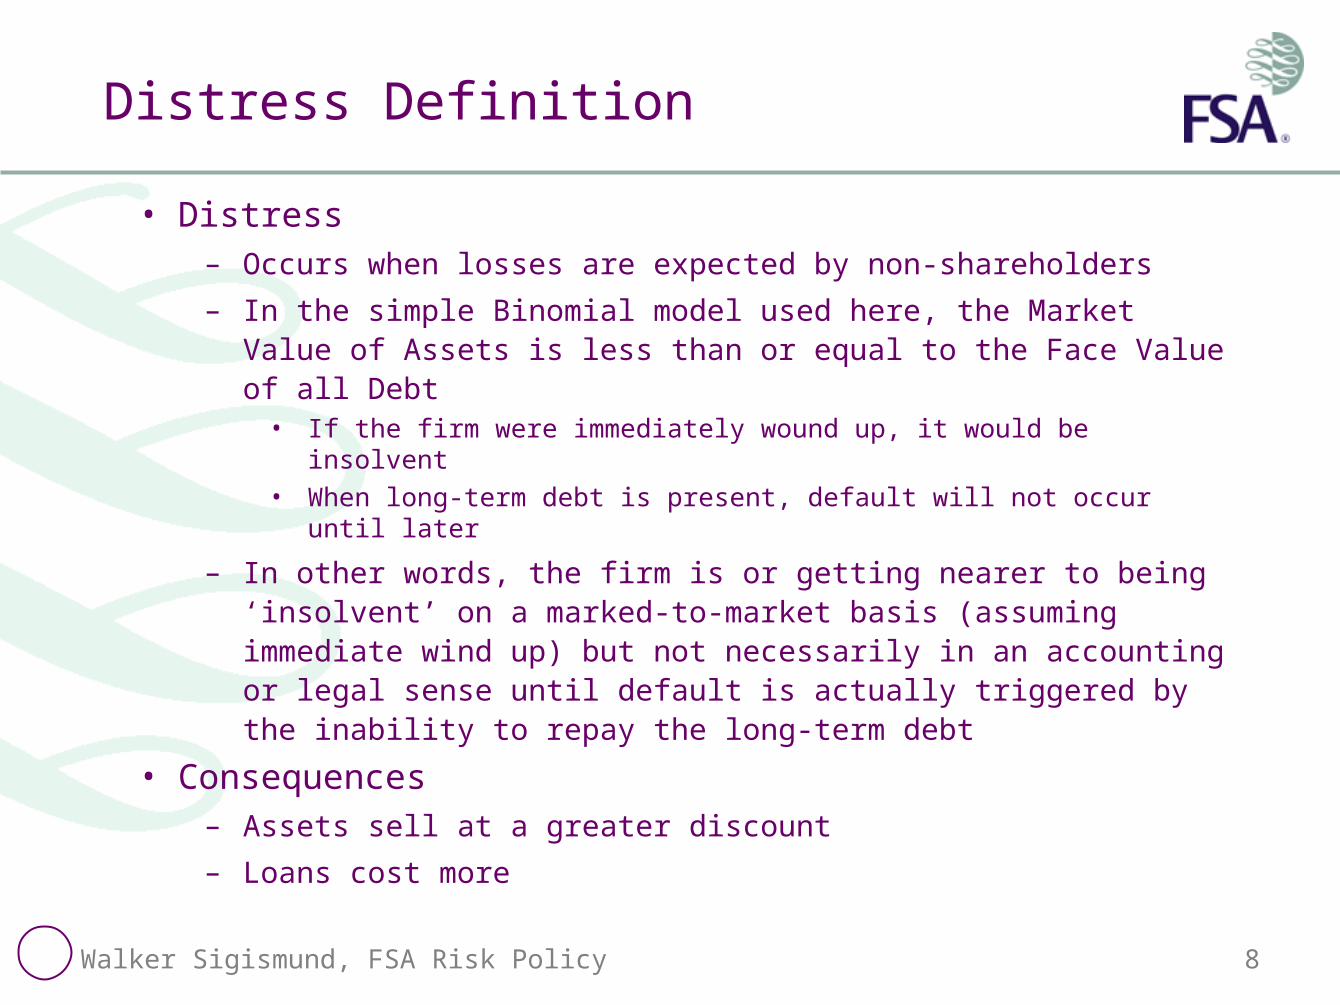
Distress Definition
• Distress– Occurs when losses are expected by non-shareholders
– In the simple Binomial model used here, the Market Value of Assets is less than or equal to the Face Value of all Debt
• If the firm were immediately wound up, it would be insolvent• When long-term debt is present, default will not occur until later
– In other words, the firm is or getting nearer to being ‘insolvent’ on a marked-to-market basis (assuming immediate wind up) but not necessarily in an accounting or legal sense until default is actually triggered by the inability to repay the long-term debt
• Consequences– Assets sell at a greater discount
– Loans cost more
Walker Sigismund, FSA Risk Policy 9
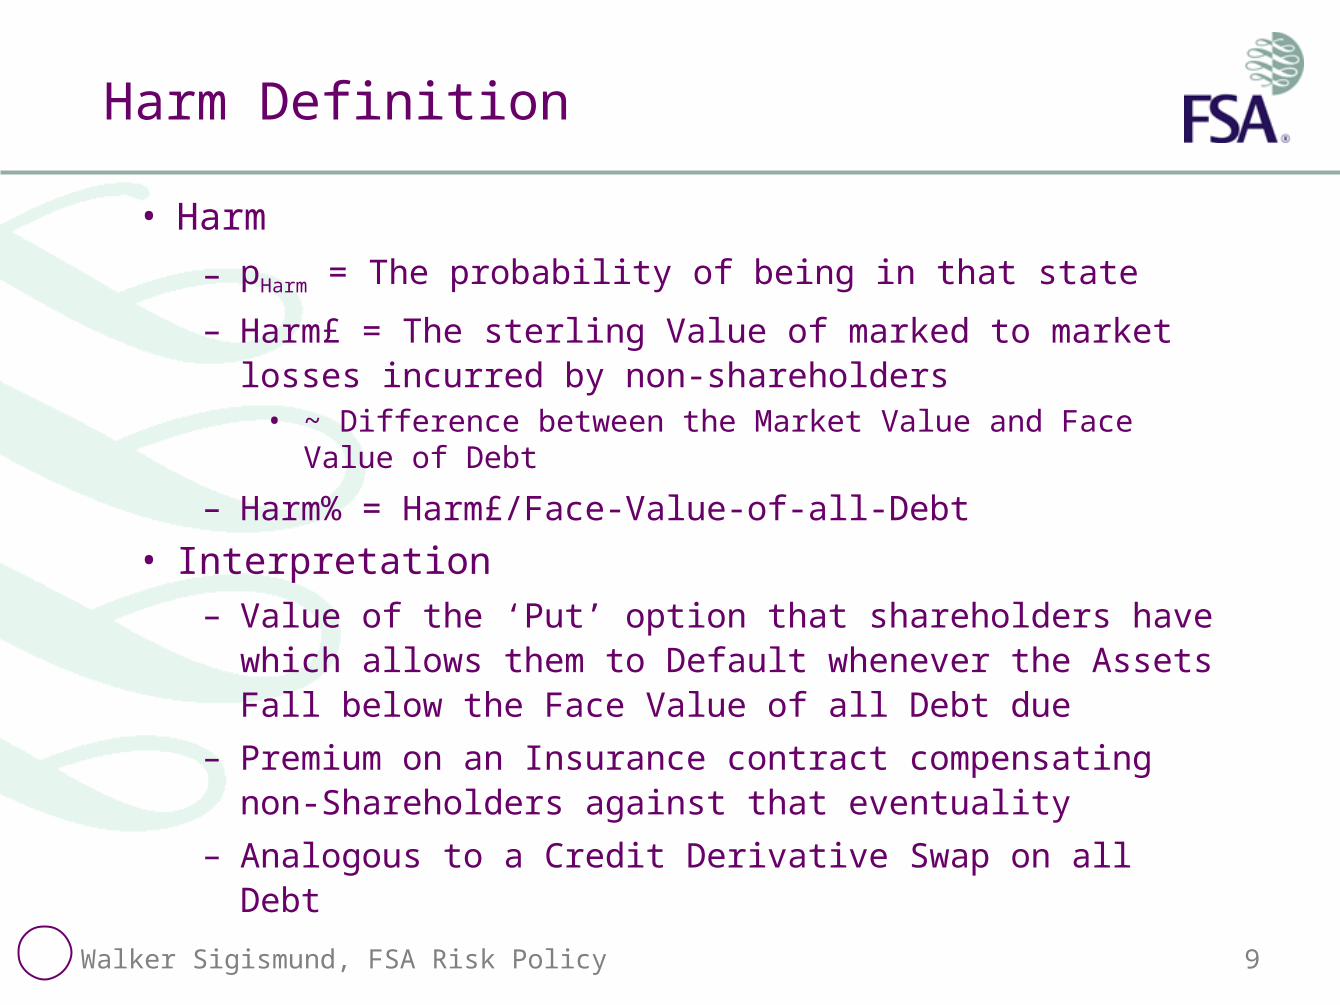
Harm Definition
• Harm
– pHarm = The probability of being in that state
– Harm£ = The sterling Value of marked to market losses incurred by non-shareholders
• ~ Difference between the Market Value and Face Value of Debt
– Harm% = Harm£/Face-Value-of-all-Debt
• Interpretation– Value of the ‘Put’ option that shareholders have which
allows them to Default whenever the Assets Fall below the Face Value of all Debt due
– Premium on an Insurance contract compensating non-Shareholders against that eventuality
– Analogous to a Credit Derivative Swap on all Debt
Walker Sigismund, FSA Risk Policy 10
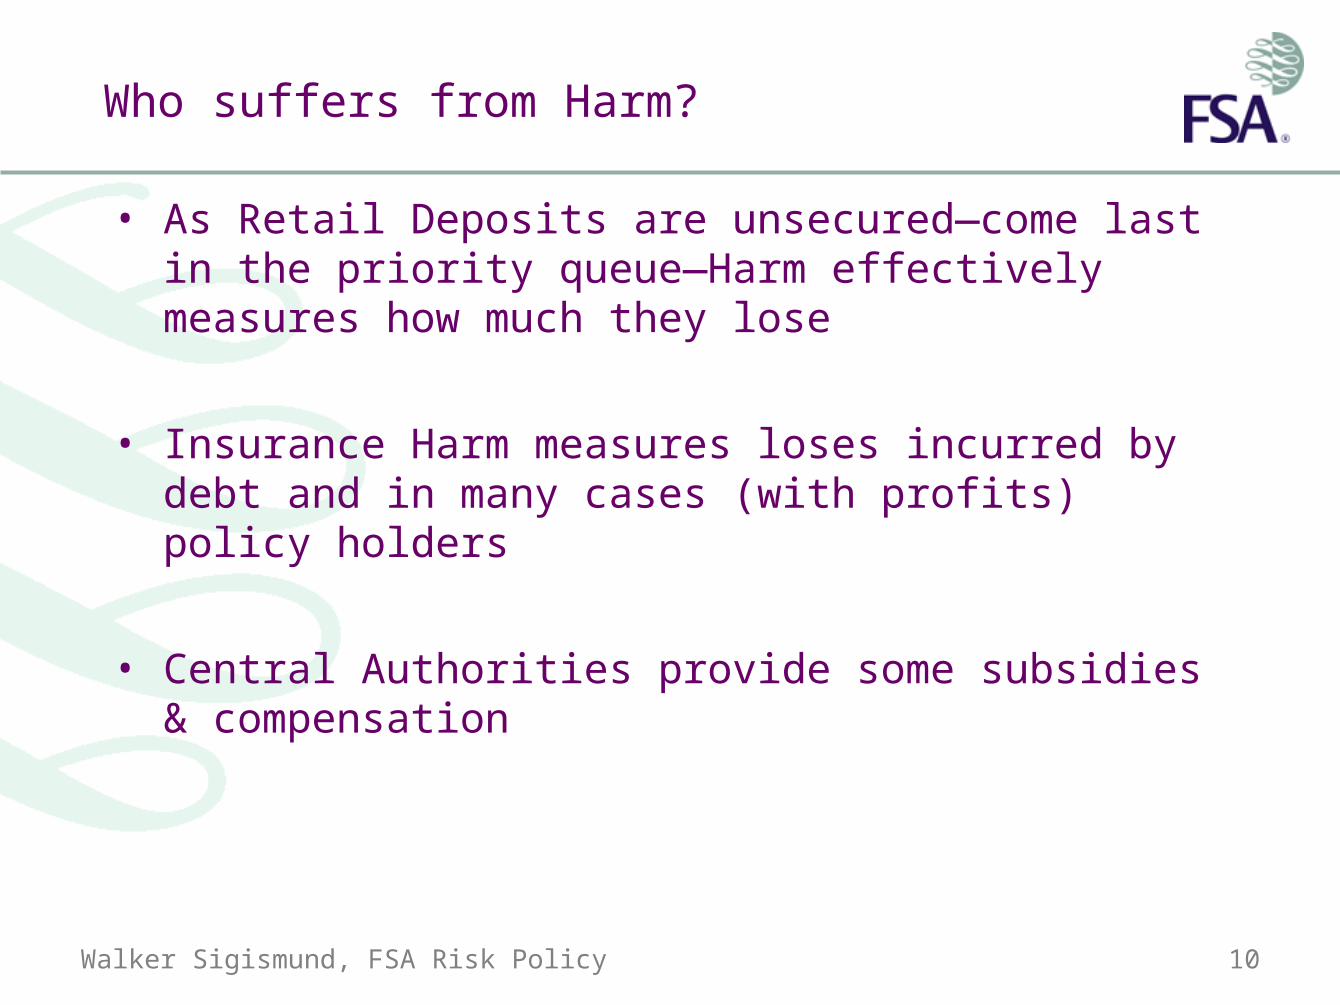
Who suffers from Harm?
• As Retail Deposits are unsecured—come last in the priority queue—Harm effectively measures how much they lose
• Insurance Harm measures loses incurred by debt and in many cases (with profits) policy holders
• Central Authorities provide some subsidies & compensation
Walker Sigismund, FSA Risk Policy 11
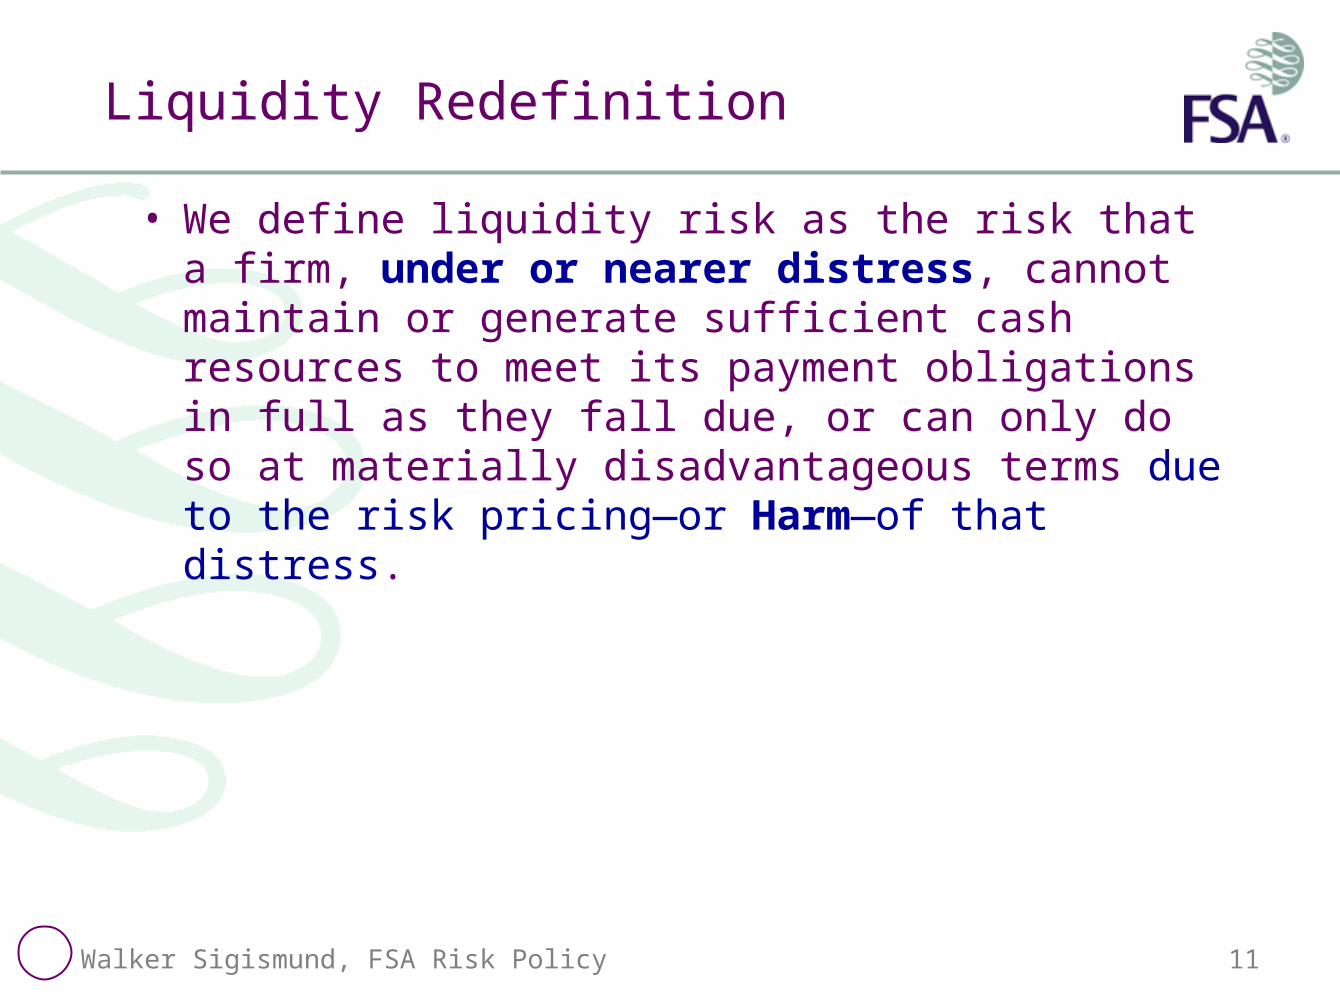
Liquidity Redefinition
• We define liquidity risk as the risk that a firm, under or nearer distress, cannot maintain or generate sufficient cash resources to meet its payment obligations in full as they fall due, or can only do so at materially disadvantageous terms due to the risk pricing—or Harm—of that distress.
Walker Sigismund, FSA Risk Policy 12
– Unravelling Liquidity –Marking-to-Market Balance Sheet
Repricing of Risk
Liquidity Risk is a symptom of Market/Credit Risk
Walker Sigismund, FSA Risk Policy 13
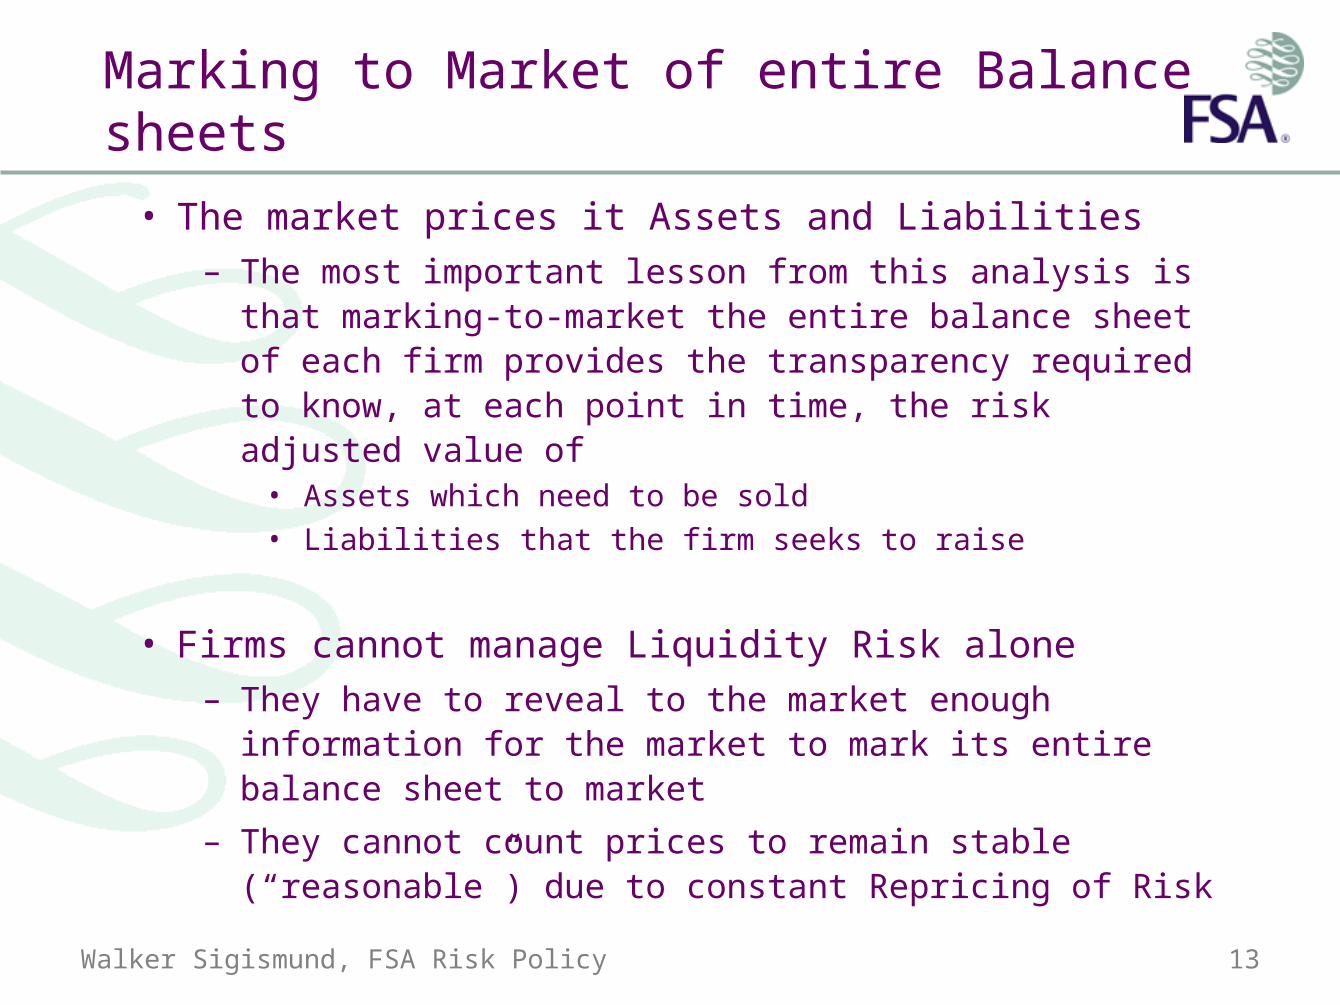
Marking to Market of entire Balance sheets
• The market prices it Assets and Liabilities– The most important lesson from this analysis is that
marking-to-market the entire balance sheet of each firm provides the transparency required to know, at each point in time, the risk adjusted value of
• Assets which need to be sold• Liabilities that the firm seeks to raise
• Firms cannot manage Liquidity Risk alone– They have to reveal to the market enough information for
the market to mark its entire balance sheet to market
– They cannot count prices to remain stable (“reasonable”) due to constant Repricing of Risk
Walker Sigismund, FSA Risk Policy 14
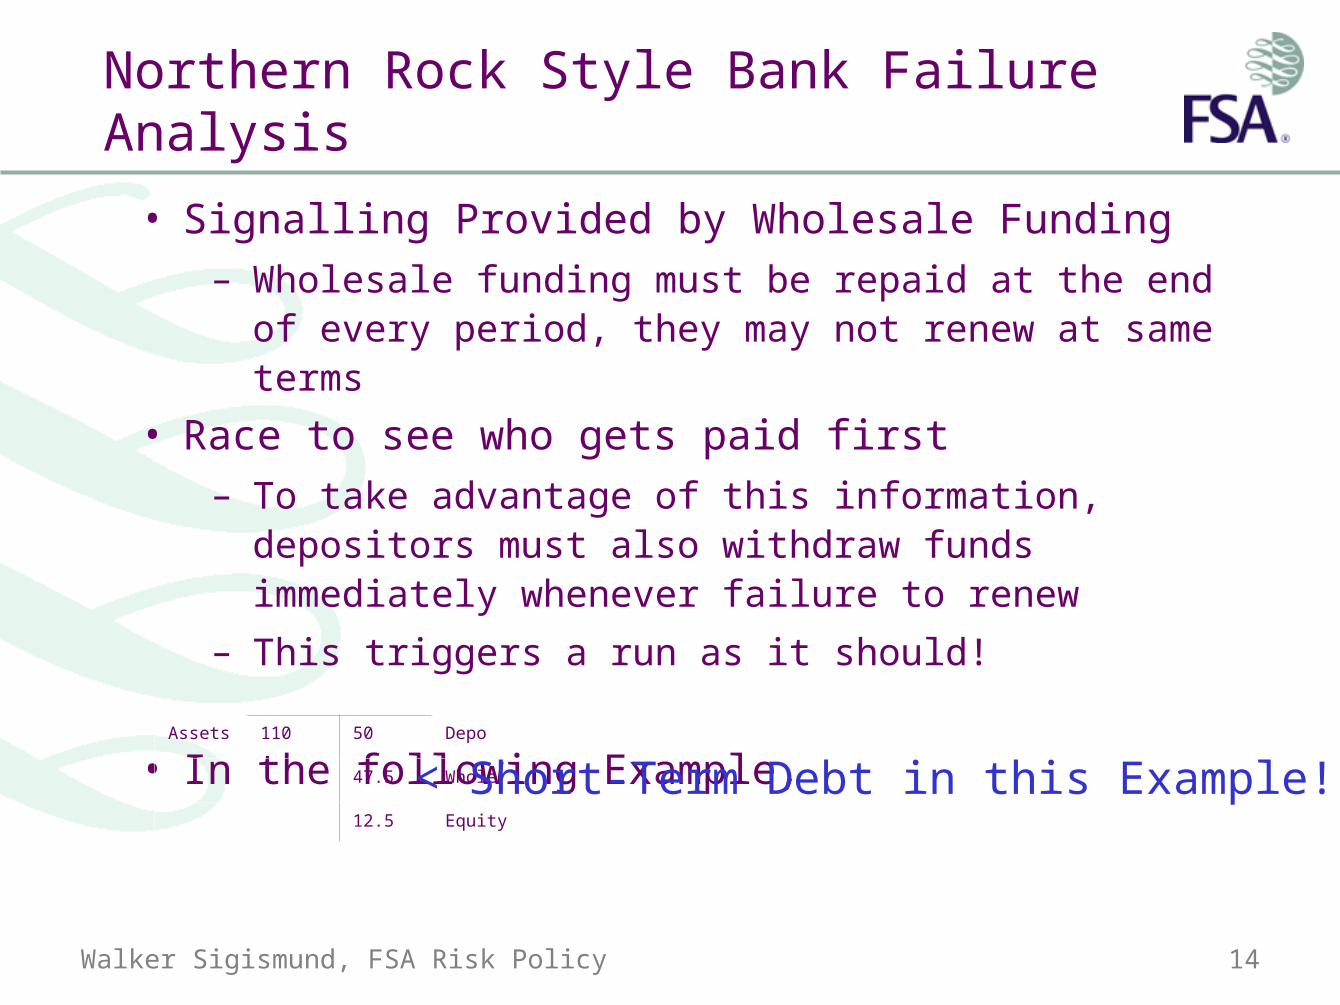
Northern Rock Style Bank Failure Analysis
• Signalling Provided by Wholesale Funding– Wholesale funding must be repaid at the end of every
period, they may not renew at same terms
• Race to see who gets paid first– To take advantage of this information, depositors must
also withdraw funds immediately whenever failure to renew
– This triggers a run as it should!
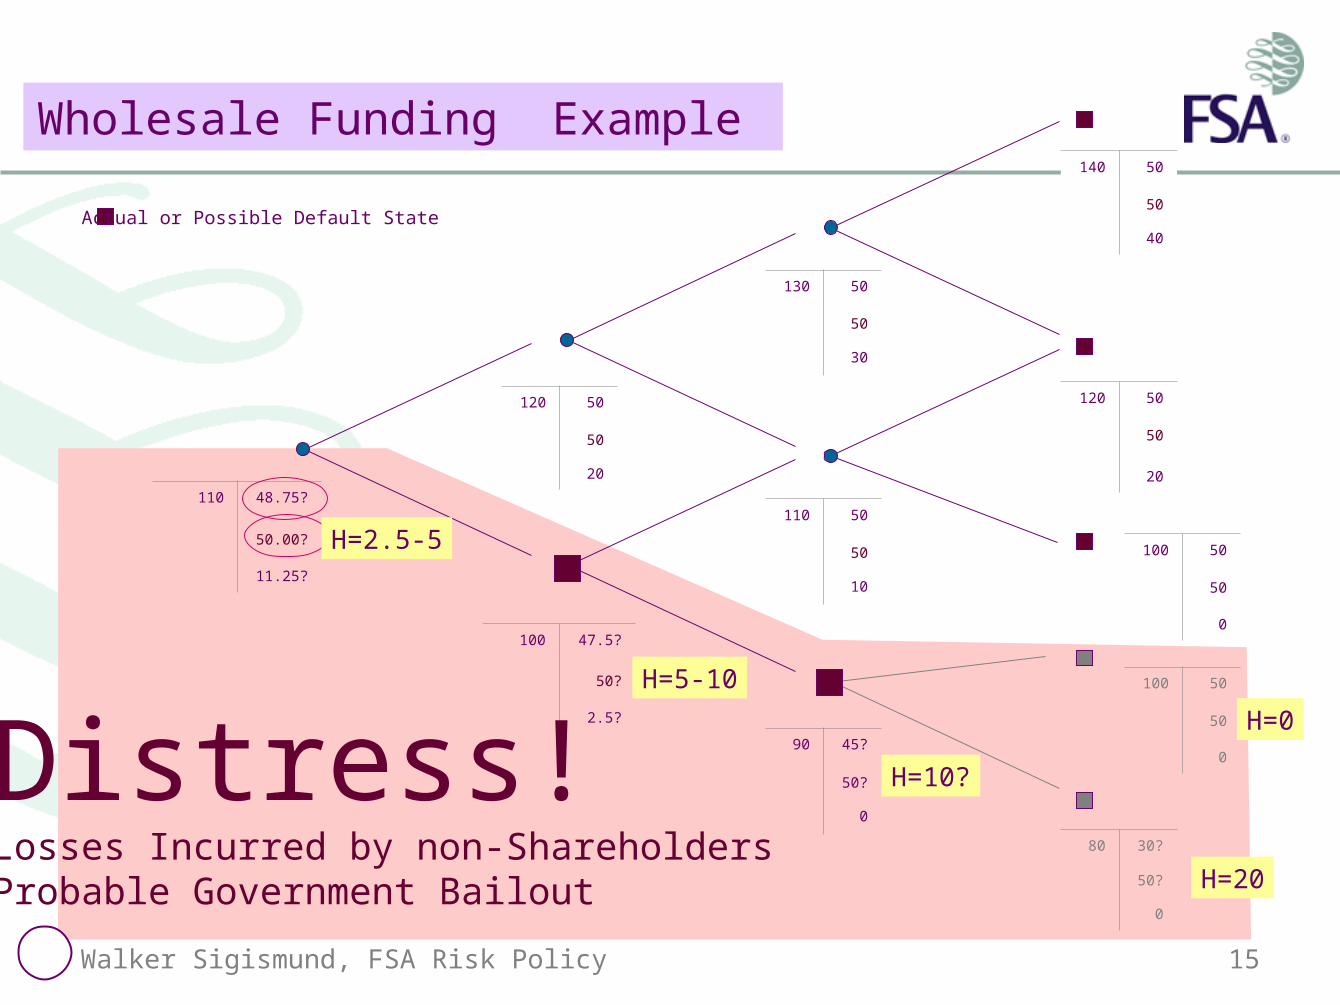
• In the following Example,Assets 110 50 Depo
47.5 Whole
12.5 Equity
< Short-Term Debt in this Example!
Walker Sigismund, FSA Risk Policy 15
130 50
50
30
140 50
50
40
110 50
50
10
90 45?
50?
0
120 50
50
20
100 50
50
0
80 30?
50?
0
120 50
50
20
100 47.5?
50?
2.5?
110 48.75?
50.00?
11.25?
Distress!Losses Incurred by non-ShareholdersProbable Government Bailout
Wholesale Funding Example
100 50
50
0
Actual or Possible Default State
H=0
H=20
H=10?
H=5-10
H=2.5-5
Walker Sigismund, FSA Risk Policy 16
130 50
50
30
140 50
50
40
110 50
50
10
90 45?
50?
0
120 50
50
20
100 50
50
0
80 30?
50?
0
120 50
50
20
100 47.5?
50?
2.5?
110 48.75?
50.00?
11.25?
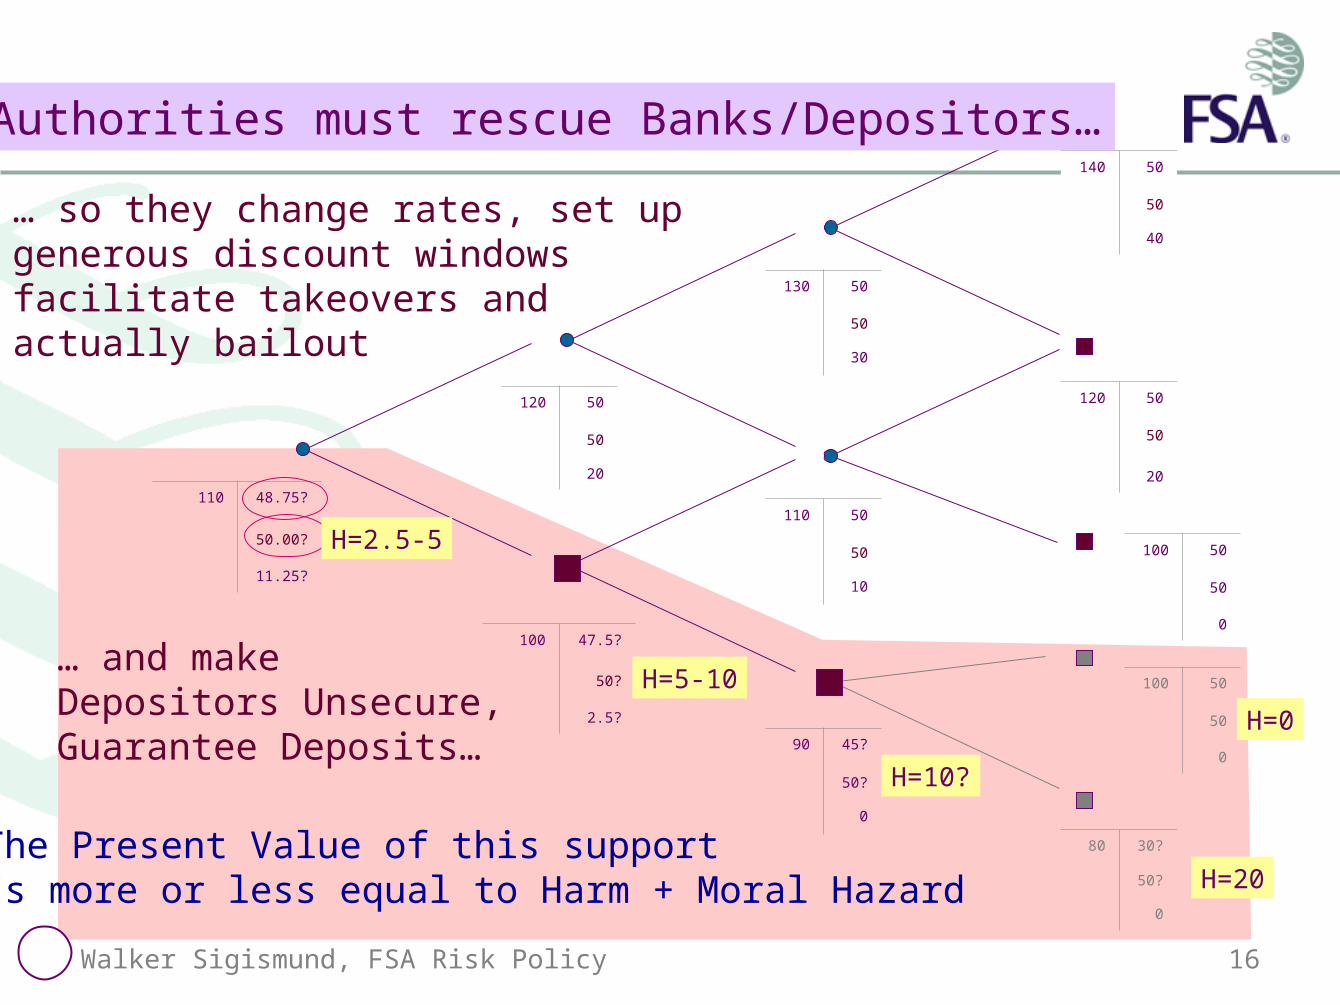
Authorities must rescue Banks/Depositors…
100 50
50
0
H=0
H=20
H=10?
H=5-10
H=2.5-5
… so they change rates, set up generous discount windowsfacilitate takeovers andactually bailout
The Present Value of this supportIs more or less equal to Harm + Moral Hazard
… and makeDepositors Unsecure,Guarantee Deposits…
Walker Sigismund, FSA Risk Policy 17
130 50
50
30
140 50
50
40
110 50
50
10
100 50?
50?
0
120 50
50
20
100 50
50
0
100 50
50
0
120 50
50
20
100 50?
50?
0 0
110 50
50
10
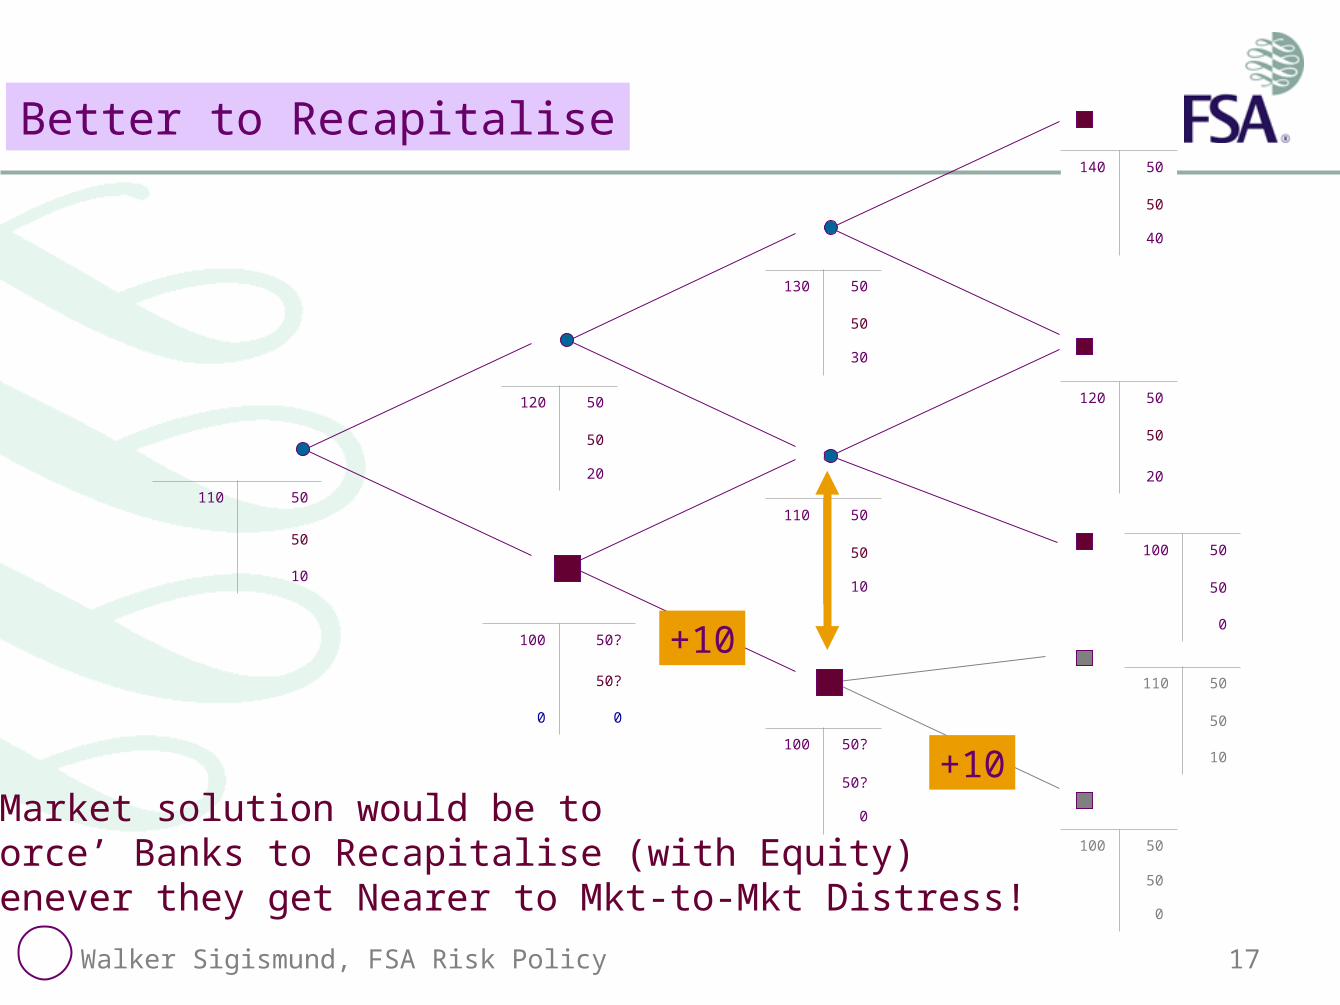
Better to Recapitalise
110 50
50
10
A Market solution would be to‘force’ Banks to Recapitalise (with Equity)Whenever they get Nearer to Mkt-to-Mkt Distress!
+10
+10
Walker Sigismund, FSA Risk Policy 18
Lessons from Northern Rock
• Wholesale funding – Acts like a trigger, keeping the whole system fair, almost as if all
funding were short term
– Possible delay, allowing further distress—or Harm—to develop
• Central Bank subsidies– Changes in Rates and lending windows subsidise banks
– These are frequently changed to suit the financial community (rather than the real economy)
– This also means that the tree is not Arbitrage Free!
• Forbearance– The fact that the tree is not Arbitrage-free means that there can be
no agreement About the exact nature and pricing within the tree
– No Reliable (unambiguous) threshold conditions
– The best is arguably Distress and Harm to Depositors
Walker Sigismund, FSA Risk Policy 19
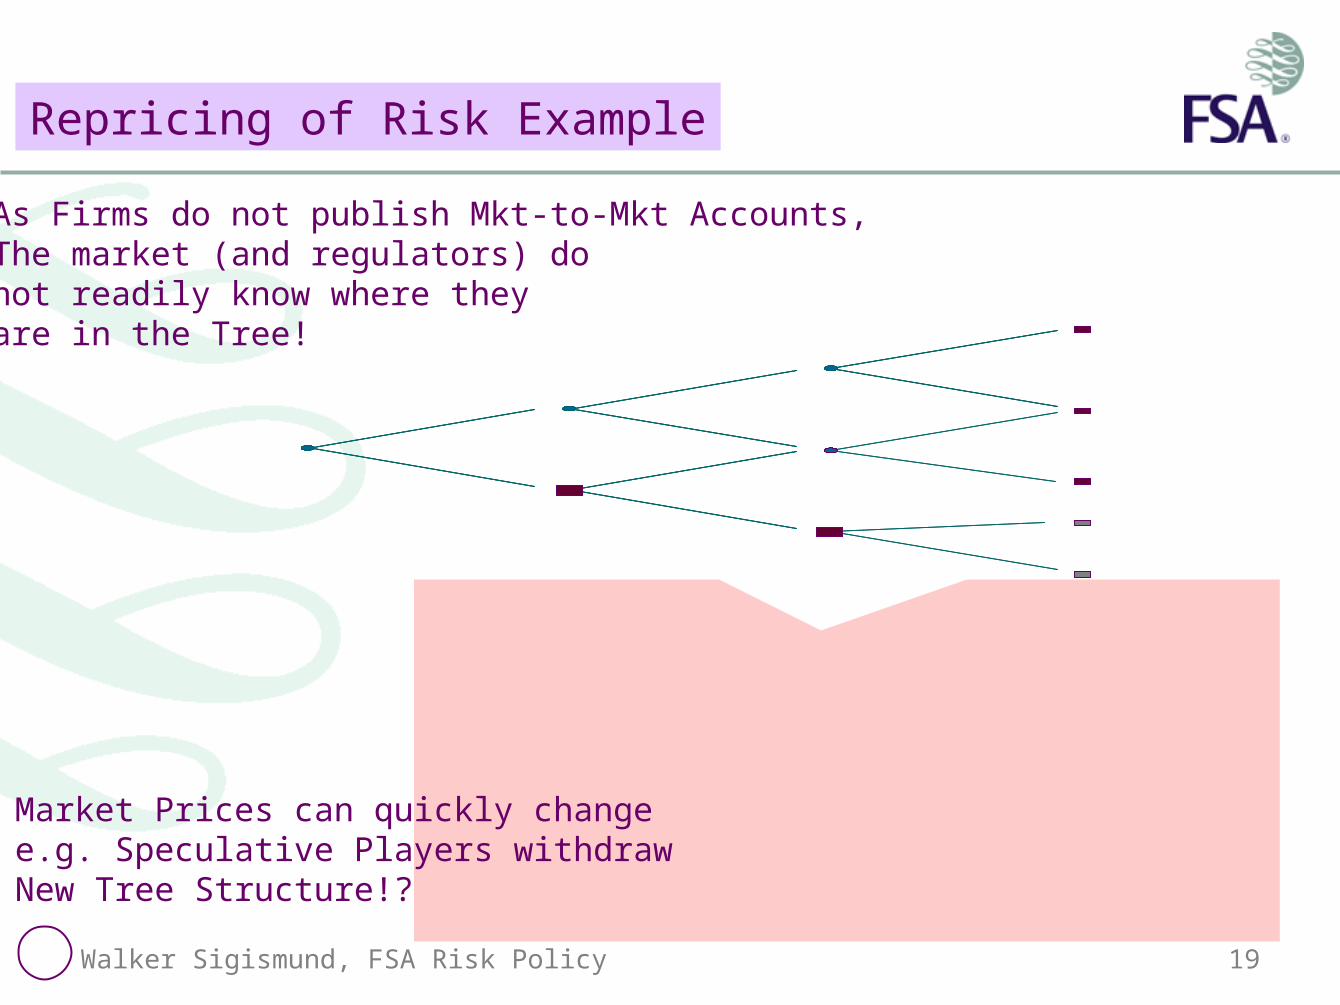
Repricing of Risk Example
As Firms do not publish Mkt-to-Mkt Accounts,The market (and regulators) donot readily know where theyare in the Tree!
Market Prices can quickly changee.g. Speculative Players withdrawNew Tree Structure!?
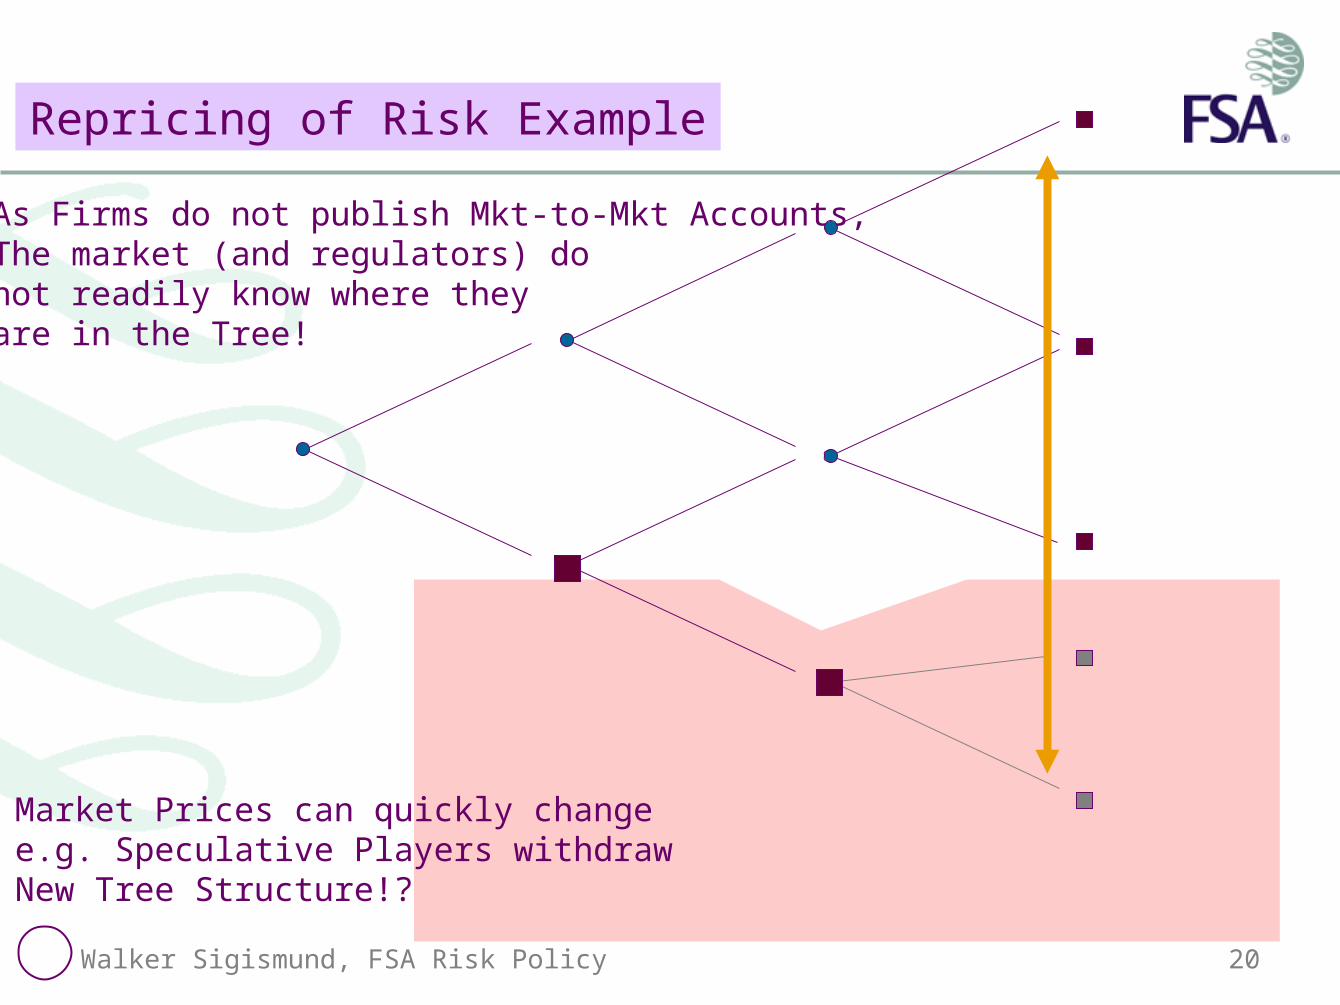
Walker Sigismund, FSA Risk Policy 20
Repricing of Risk Example
As Firms do not publish Mkt-to-Mkt Accounts,The market (and regulators) donot readily know where theyare in the Tree!
Market Prices can quickly changee.g. Speculative Players withdrawNew Tree Structure!?
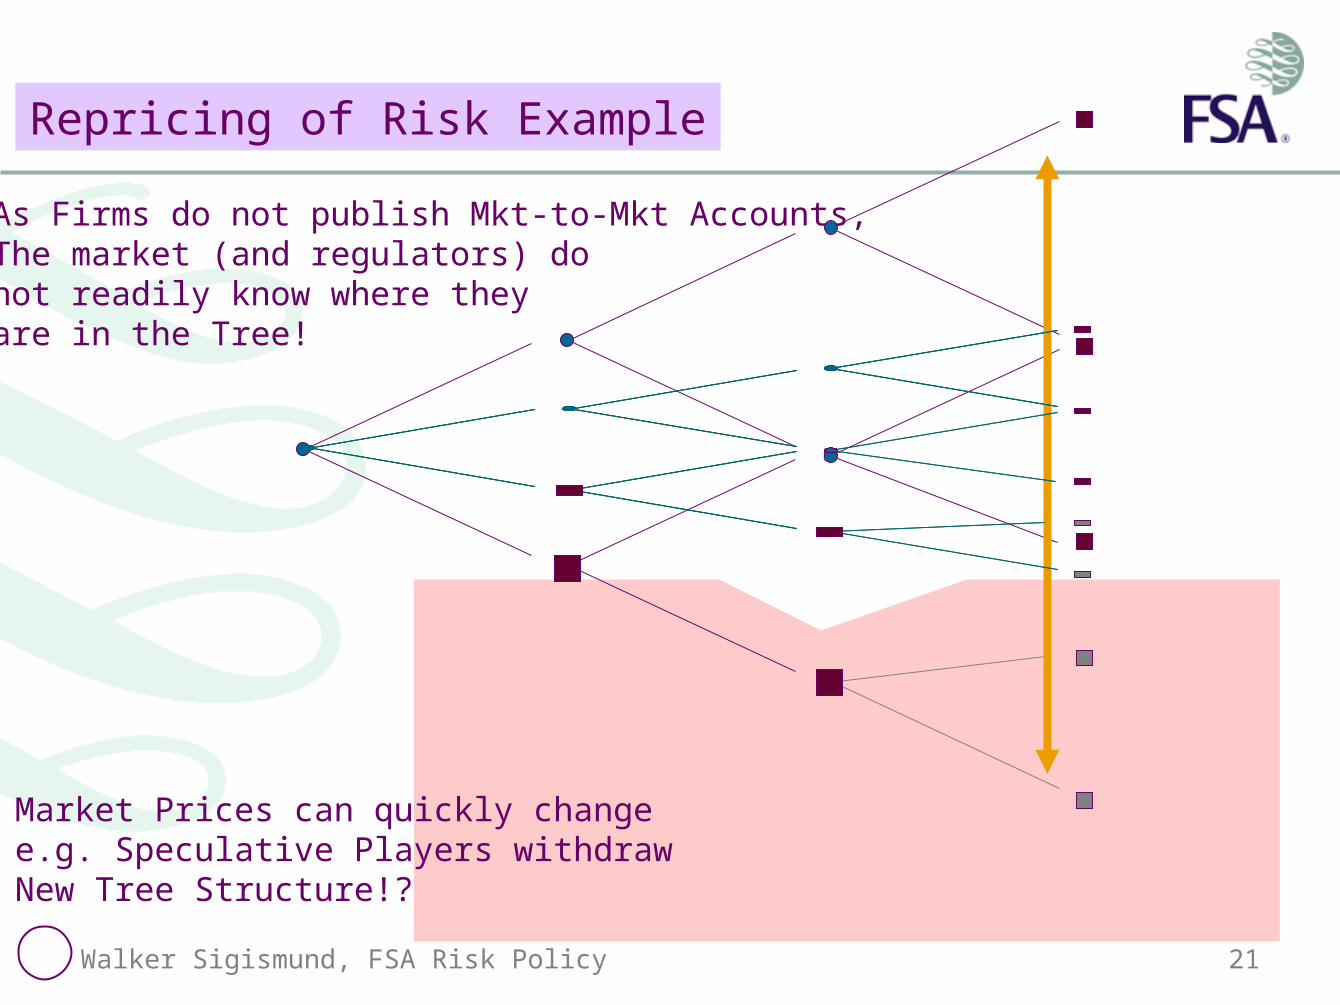
Walker Sigismund, FSA Risk Policy 21
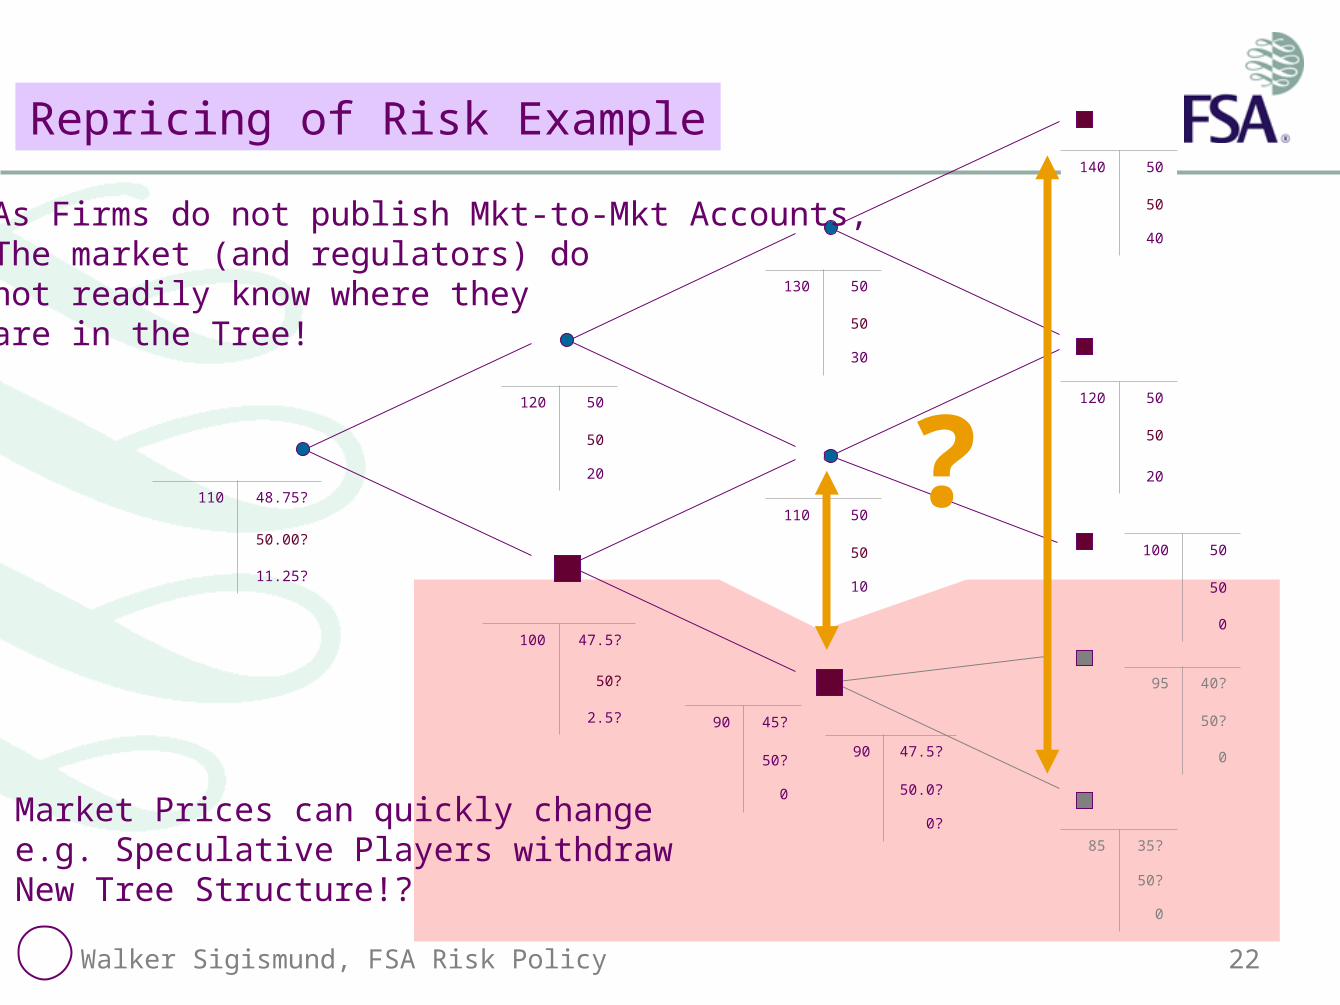
Repricing of Risk Example
As Firms do not publish Mkt-to-Mkt Accounts,The market (and regulators) donot readily know where theyare in the Tree!
Market Prices can quickly changee.g. Speculative Players withdrawNew Tree Structure!?
Walker Sigismund, FSA Risk Policy 22
130 50
50
30
140 50
50
40
110 50
50
10
90 45?
50?
0
120 50
50
20
100 50
50
0
85 35?
50?
0
120 50
50
20
100 47.5?
50?
2.5?
110 48.75?
50.00?
11.25?
Repricing of Risk Example
95 40?
50?
0
As Firms do not publish Mkt-to-Mkt Accounts,The market (and regulators) donot readily know where theyare in the Tree!
90 47.5?
50.0?
0?
?
Market Prices can quickly changee.g. Speculative Players withdrawNew Tree Structure!?
Walker Sigismund, FSA Risk Policy 23
Liquidity is composed of four elements
• Asset Prices reflecting– Market wide pricing and changes in risk pricing by Asset
• Economic• Speculative, Store-of-Value
– But each Firm decides the amount of each asset to hold!
• Liability Prices– Competes with the Market for additional Funding
• Including Market Making activities
– Each Firm also decides the composition of its Liabilities
• Intervention– Subsidies provided by Central Authorities
• Uncertainty
• Result– Each Firm has its own Tree, the composition of which it controls
Walker Sigismund, FSA Risk Policy 24
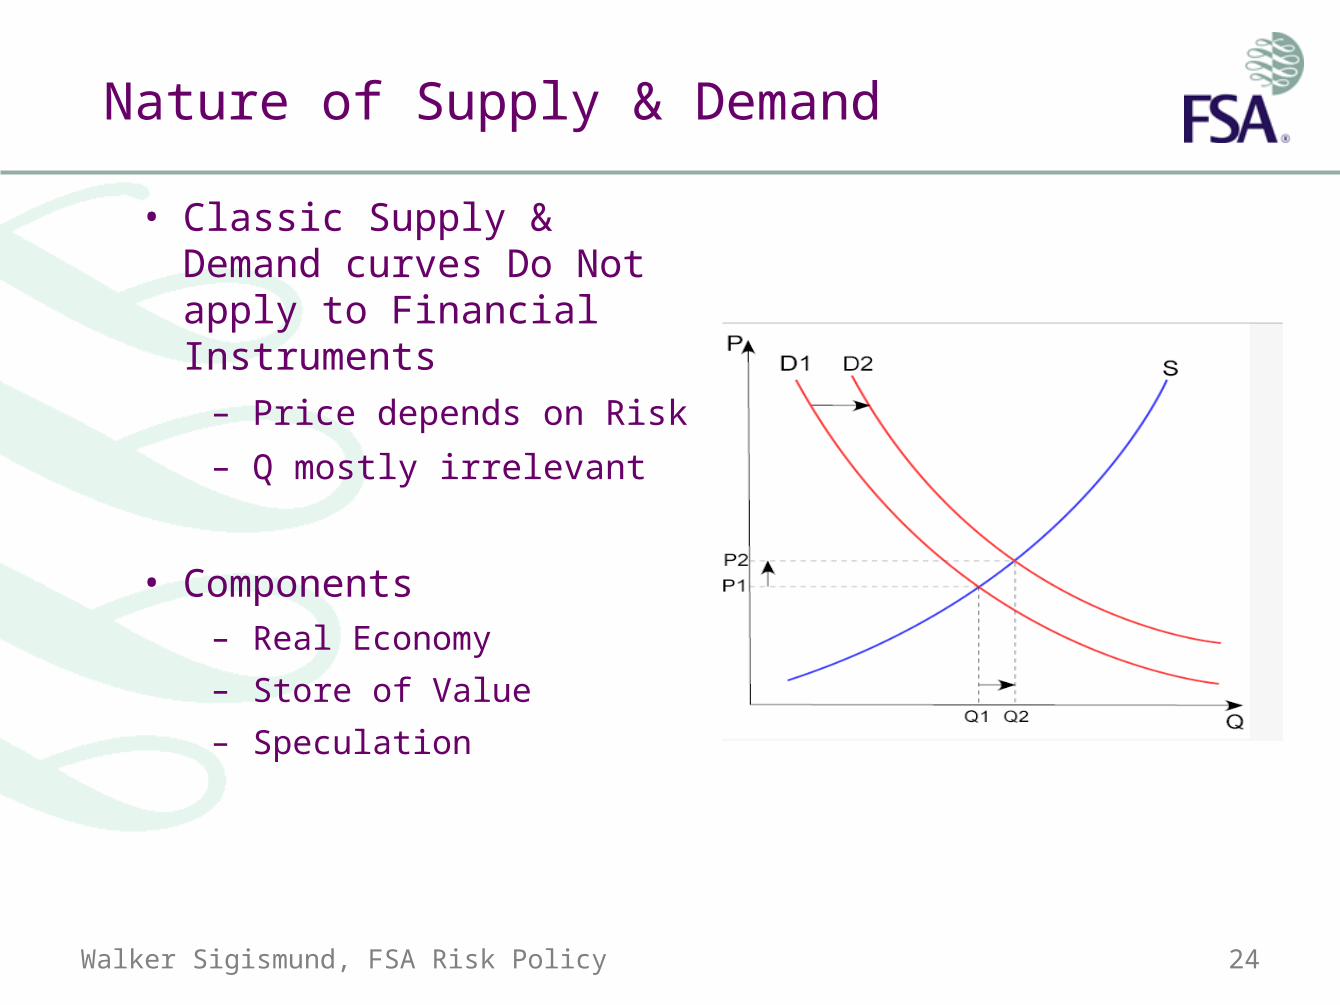
Nature of Supply & Demand
• Classic Supply & Demand curves Do Not apply to Financial Instruments
– Price depends on Risk
– Q mostly irrelevant
• Components– Real Economy
– Store of Value
– Speculation
Walker Sigismund, FSA Risk Policy 25
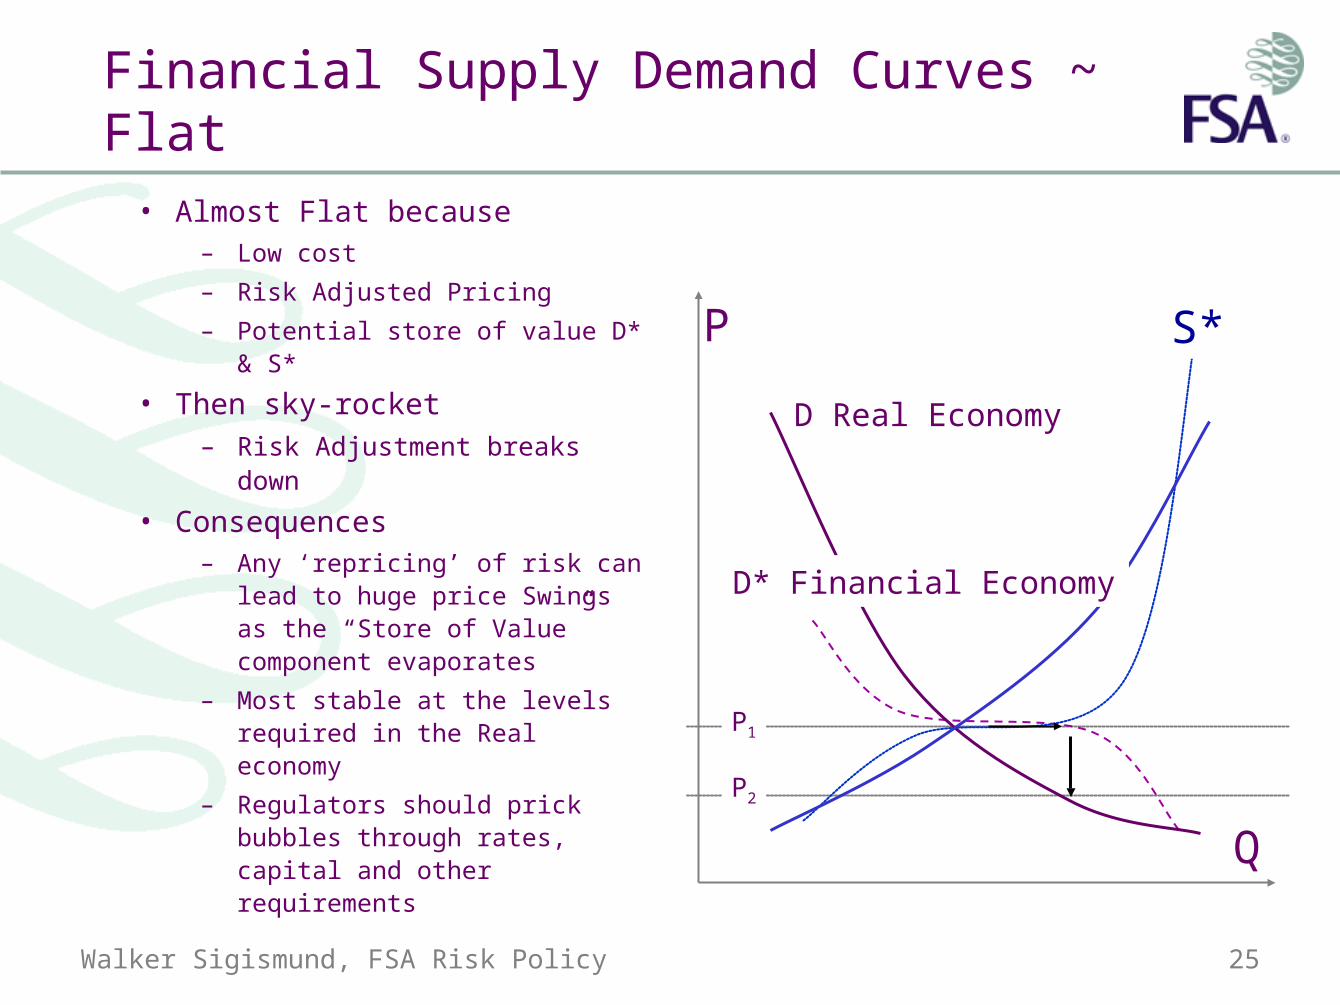
Financial Supply Demand Curves ~ Flat
• Almost Flat because– Low cost
– Risk Adjusted Pricing
– Potential store of value D* & S*
• Then sky-rocket– Risk Adjustment breaks down
• Consequences– Any ‘repricing’ of risk can lead
to huge price Swings as the “Store of Value” component evaporates
– Most stable at the levels required in the Real economy
– Regulators should prick bubbles through rates, capital and other requirements
P
Q
P1
P2
D Real Economy
D* Financial Economy
S*
Walker Sigismund, FSA Risk Policy 26
Lessons to be Learned
• Market Centric Liquidity– There is a market-wide tree for each asset class– The Real economy needs limited amounts of each asset class– Financial firms often over supply the market (which in many cases will absorb this
excess due to ‘storage of wealth’ made possible via ‘equilibrium’ risk pricing no matter the economic supply/demand need)
– The market goes through phases where certain types of assets are favoured over others, which can rapidly fall into disfavour as a store of wealth and thus in great economic oversupply
– Under market wide distress (disenchantment with certain asset classes and liability structures) a type of “musical chairs” take place where some sectors and firms are favoured over others
• Firm Centric Liquidity– The Trees of ‘similar’ firms differ both in the quality of the assets generating the
forward prices, but also the strength or weakness of the Liabilities generating backward prices
– A firm demonstrably in control of its market, credit and operational risk—relative to its peers—can have little if any Liquidity Risk
– A firm with a massive position in a given asset class—Metallgesellschaft, LTCM…—are always prone to Liquidity shocks
• Distress and Harm measures the degree of this risk
Walker Sigismund, FSA Risk Policy 27
– Liquidity Indicators –
Early Warning Indicators
Walker Sigismund, FSA Risk Policy 28
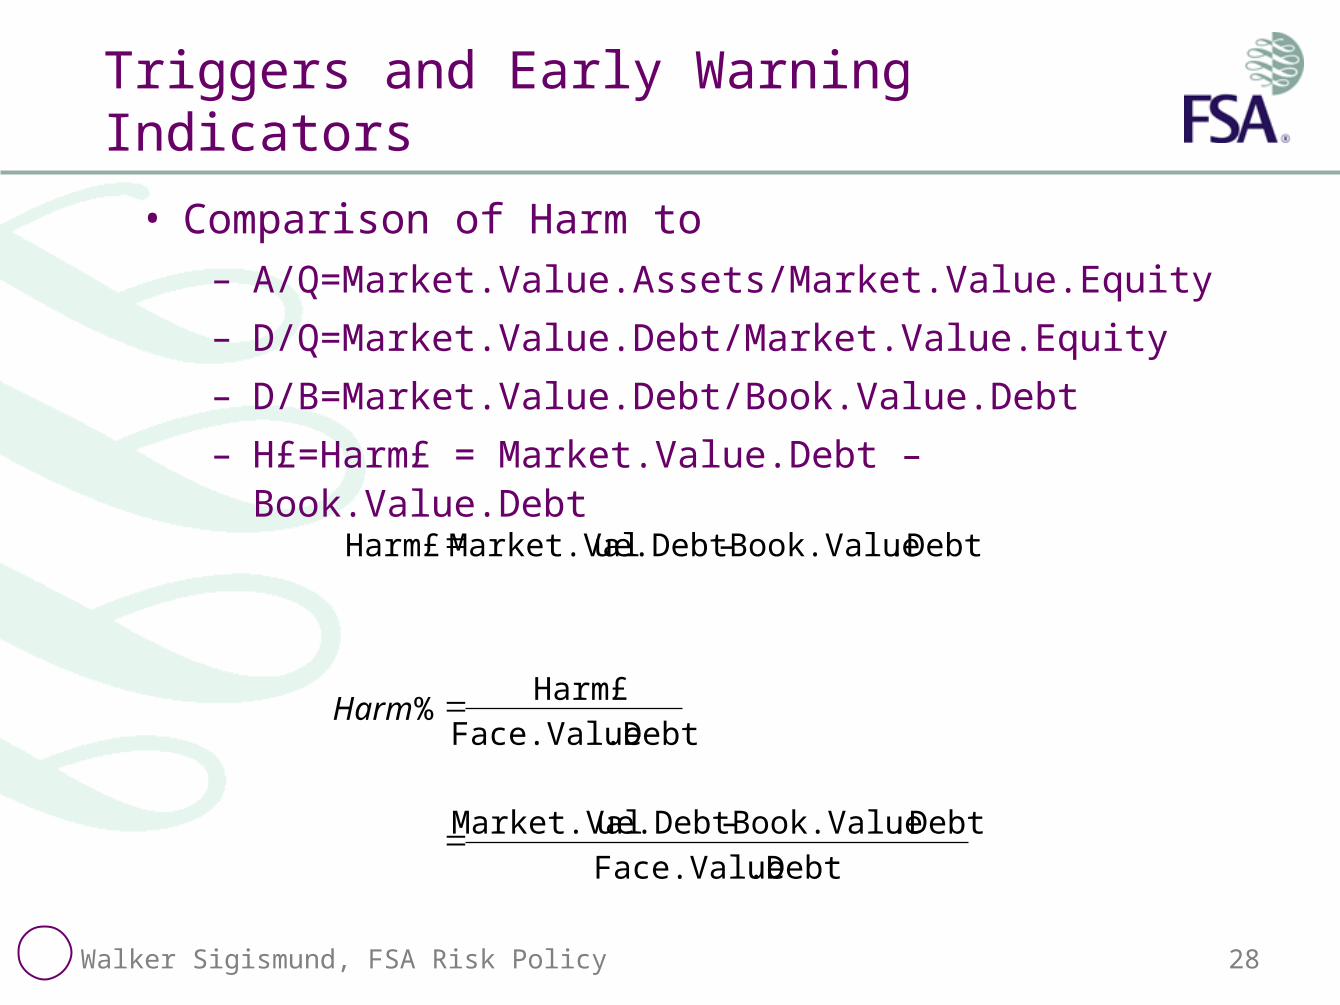
Triggers and Early Warning Indicators
• Comparison of Harm to– A/Q=Market.Value.Assets/Market.Value.Equity
– D/Q=Market.Value.Debt/Market.Value.Equity
– D/B=Market.Value.Debt/Book.Value.Debt
– H£=Harm£ = Market.Value.Debt – Book.Value.Debt
.DebtFace.Value
.DebtBook.Value– ue.Debt Market.Val
.DebtFace.Value
Harm£%
.DebtBook.Value– ue.Debt Market.ValHarm£
Harm
Walker Sigismund, FSA Risk Policy 29
130 50
50
30
140 50
50
40
110 50
50
10
90 50
40
0
120 50
50
20
100 50
50
0
80 50
30
0
120 50
50
20
100 50
45
5
110 50
47.5
12.5
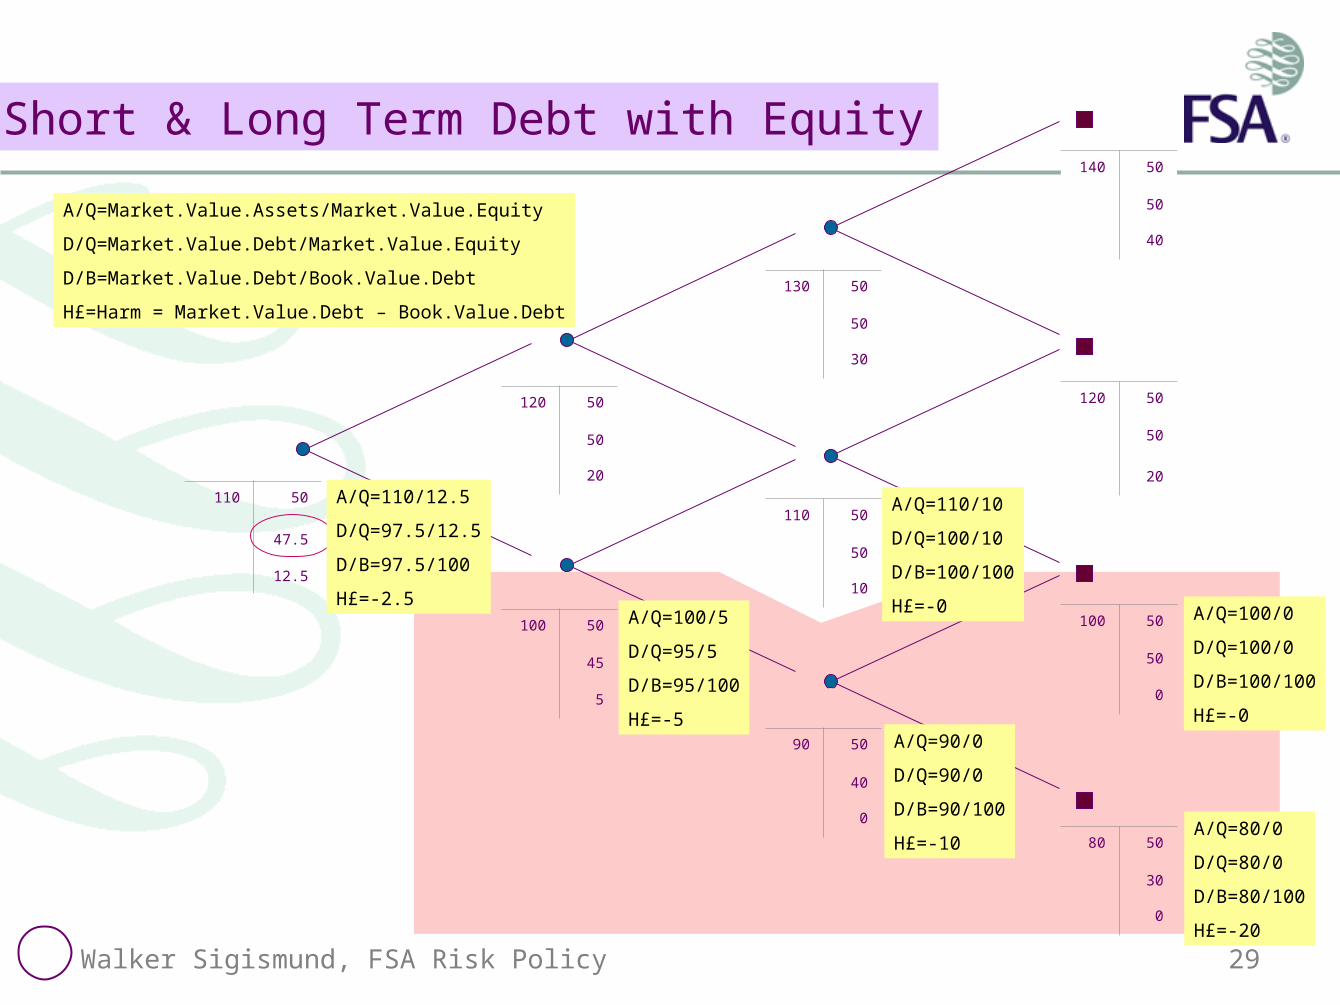
Short & Long Term Debt with Equity
A/Q=110/12.5
D/Q=97.5/12.5
D/B=97.5/100
H£=-2.5A/Q=100/5
D/Q=95/5
D/B=95/100
H£=-5
A/Q=110/10
D/Q=100/10
D/B=100/100
H£=-0
A/Q=90/0
D/Q=90/0
D/B=90/100
H£=-10A/Q=80/0
D/Q=80/0
D/B=80/100
H£=-20
A/Q=Market.Value.Assets/Market.Value.Equity
D/Q=Market.Value.Debt/Market.Value.Equity
D/B=Market.Value.Debt/Book.Value.Debt
H£=Harm = Market.Value.Debt – Book.Value.Debt
A/Q=100/0
D/Q=100/0
D/B=100/100
H£=-0
Walker Sigismund, FSA Risk Policy 30
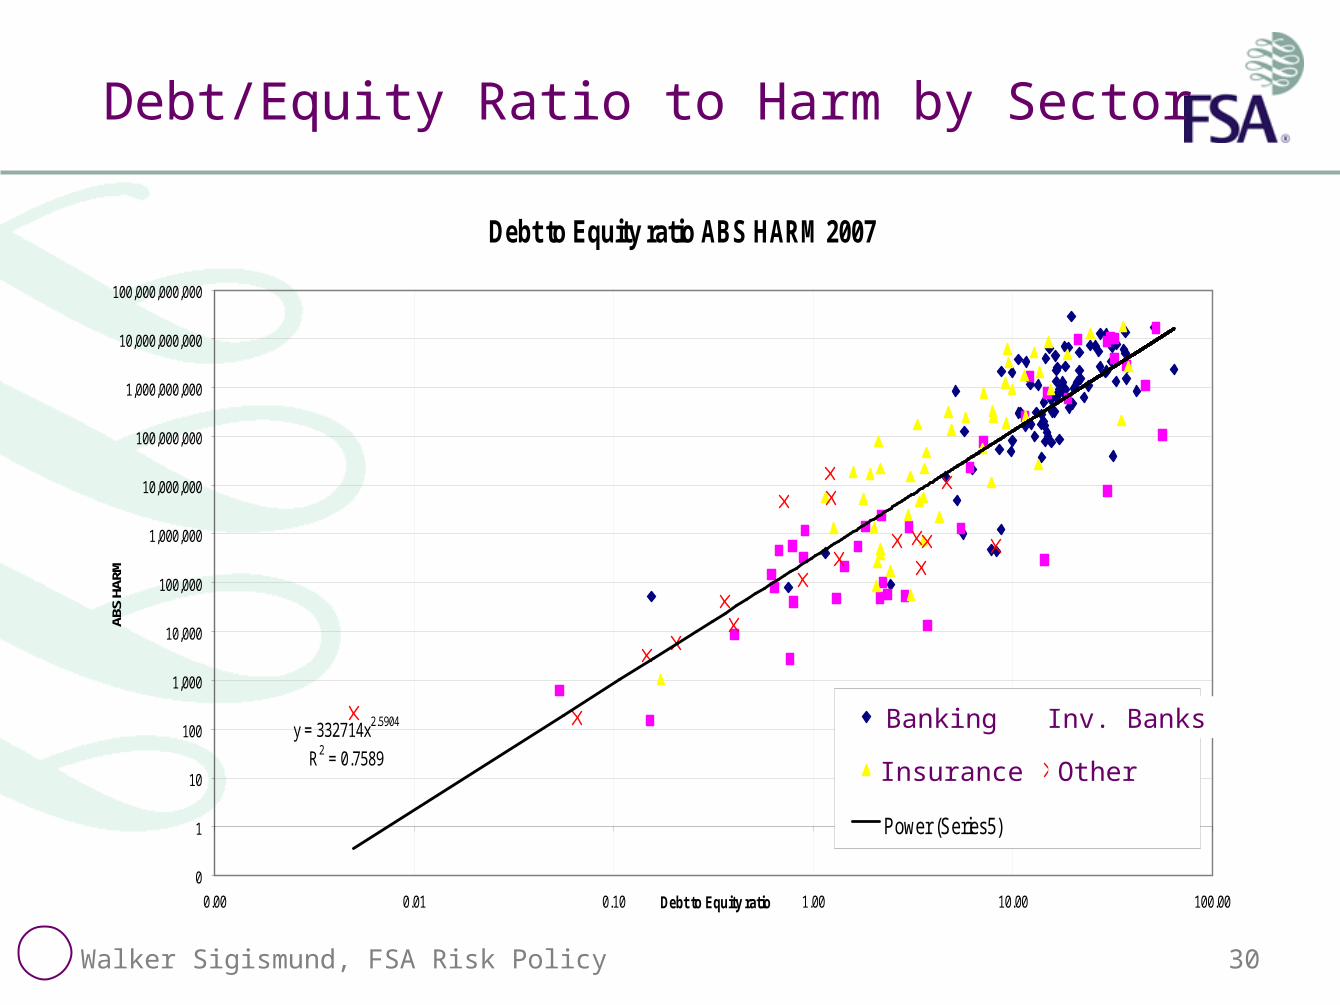
Debt/Equity Ratio to Harm by Sector
Debt to Equity ratio ABS HARM 2007
y = 332714x2.5904
R2 = 0.7589
0
1
10
100
1,000
10,000
100,000
1,000,000
10,000,000
100,000,000
1,000,000,000
10,000,000,000
100,000,000,000
0.00 0.01 0.10 1.00 10.00 100.00Debt to Equity ratio
ABS
HARM
6000 to 6200 6201 to 6300
6301 to 6500 6000
Power (Series5)
Banking Inv. Banks
Insurance Other
Walker Sigismund, FSA Risk Policy 31
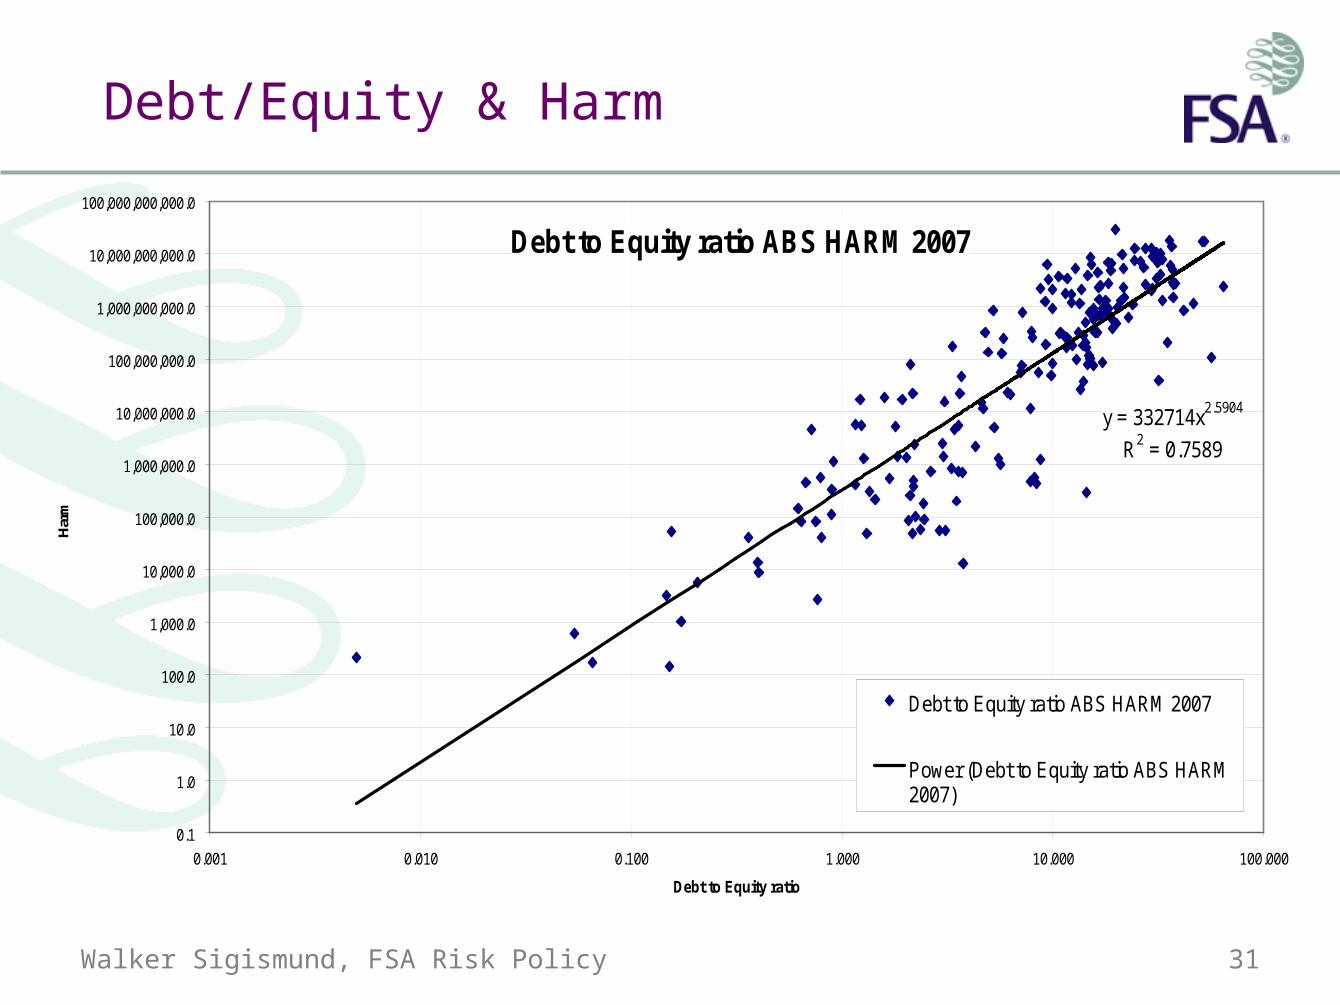
Debt/Equity & Harm
Debt to Equity ratio ABS HARM 2007
y = 332714x2.5904
R2 = 0.7589
0.1
1.0
10.0
100.0
1,000.0
10,000.0
100,000.0
1,000,000.0
10,000,000.0
100,000,000.0
1,000,000,000.0
10,000,000,000.0
100,000,000,000.0
0.001 0.010 0.100 1.000 10.000 100.000
Debt to Equity ratio
Har
m
Debt to Equity ratio ABS HARM 2007
Power (Debt to Equity ratio ABS HARM2007)
Walker Sigismund, FSA Risk Policy 32
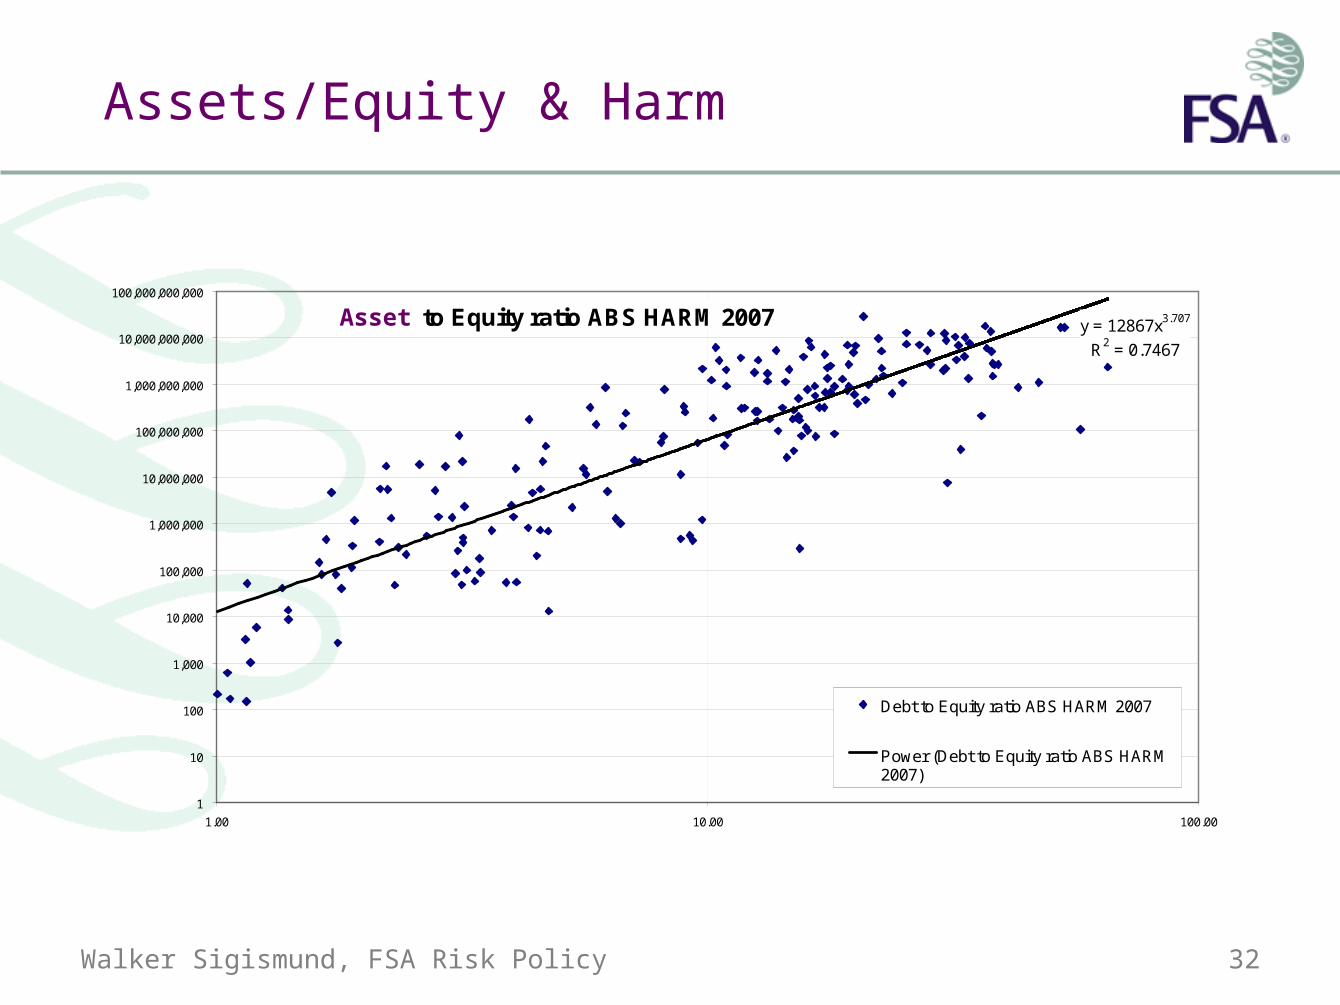
Assets/Equity & Harm
Debt to Equity ratio ABS HARM 2007 y = 12867x3.707
R2 = 0.7467
1
10
100
1,000
10,000
100,000
1,000,000
10,000,000
100,000,000
1,000,000,000
10,000,000,000
100,000,000,000
1.00 10.00 100.00
Debt to Equity ratio ABS HARM 2007
Power (Debt to Equity ratio ABS HARM2007)
Asset
Walker Sigismund, FSA Risk Policy 33
– Extensive Data Analysis –
Empirical Results from 5000+ firms
Across all major markets
Links to Accounting and Regulatory Returns
Supply/Demand Model
Walker Sigismund, FSA Risk Policy 34
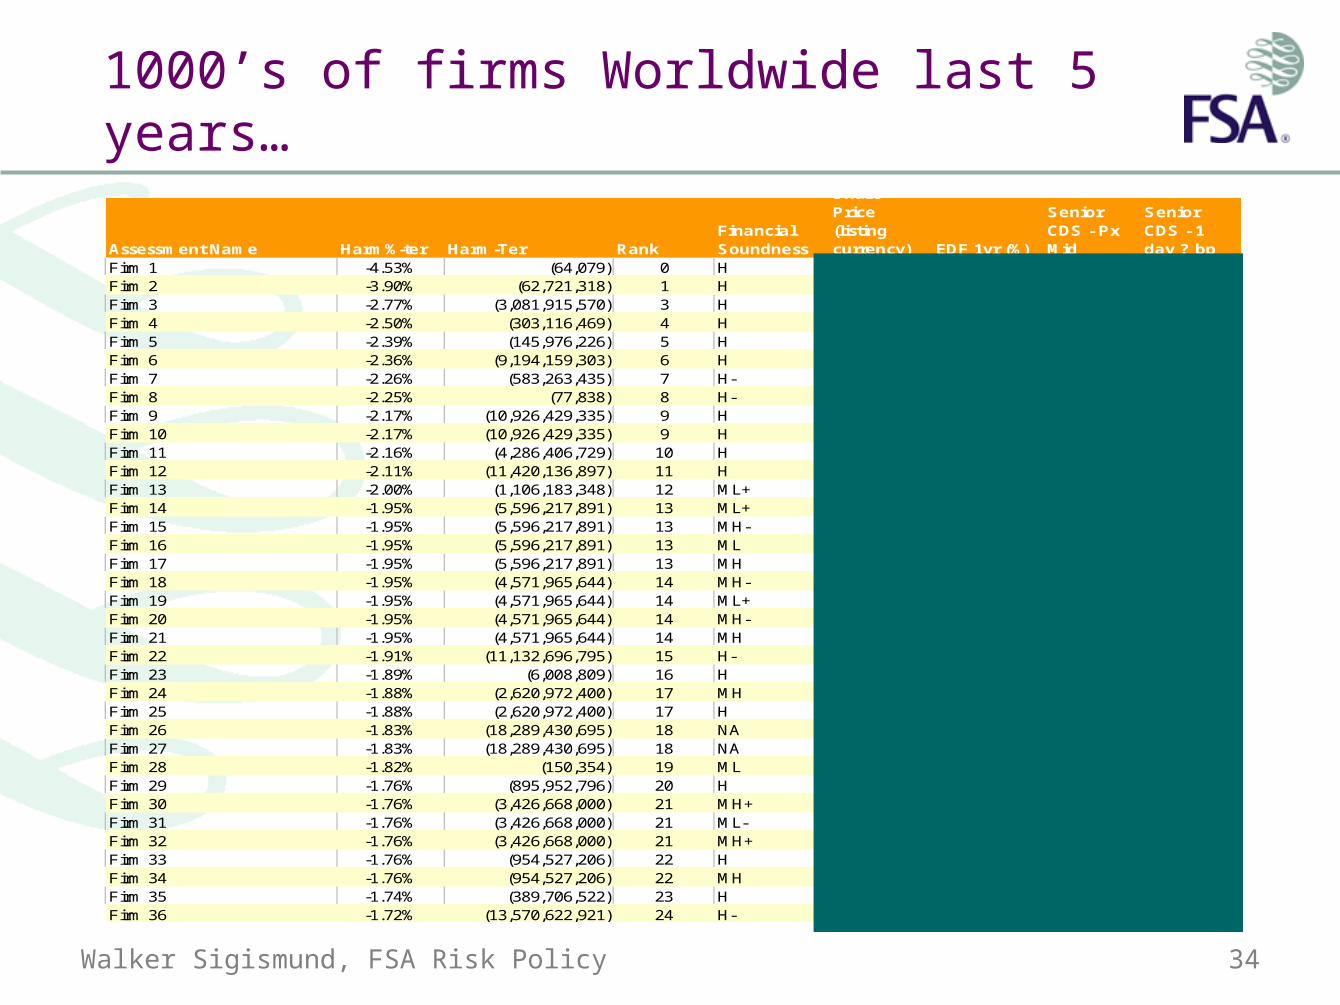
1000’s of firms Worldwide last 5 years…
Assessment Name Harm%-ter Harm-Ter RankFinancial Soundness
Share Price (listing currency) EDF 1yr (%)
Senior CDS - Px Mid
Senior CDS - 1 day ? bp
Firm 1 -4.53% (64,079) 0 H 1.75 24.5 #N/A #N/AFirm 2 -3.90% (62,721,318) 1 H 0.38 32.49 2742.37 97.10Firm 3 -2.77% (3,081,915,570) 3 H 0.11 143.63 -0.39Firm 4 -2.50% (303,116,469) 4 H 1.90 20.72 1778.65 -3.37Firm 5 -2.39% (145,976,226) 5 H 30.32 #N/A #N/AFirm 6 -2.36% (9,194,159,303) 6 H 23.75 0.19 282.76 27.97Firm 7 -2.26% (583,263,435) 7 H- 3.50 3.91 630.00 0.00Firm 8 -2.25% (77,838) 8 H- 14.00 11.54 #N/A #N/AFirm 9 -2.17% (10,926,429,335) 9 H 0.11 #N/A #N/AFirm 10 -2.17% (10,926,429,335) 9 H 35.46 0.11 205.11 8.52Firm 11 -2.16% (4,286,406,729) 10 H 9.33 0.46 87.77 1.16Firm 12 -2.11% (11,420,136,897) 11 H 37.13 0.12 187.98 8.29Firm 13 -2.00% (1,106,183,348) 12 ML+ 551.00 0.02 #N/A #N/AFirm 14 -1.95% (5,596,217,891) 13 ML+ 573.50 0.09 108.57 -3.99Firm 15 -1.95% (5,596,217,891) 13 MH- 0.09 #N/A #N/AFirm 16 -1.95% (5,596,217,891) 13 ML 0.09 #N/A #N/AFirm 17 -1.95% (5,596,217,891) 13 MH 0.09 #N/A #N/AFirm 18 -1.95% (4,571,965,644) 14 MH- 0.07 #N/A #N/AFirm 19 -1.95% (4,571,965,644) 14 ML+ 0.07 #N/A #N/AFirm 20 -1.95% (4,571,965,644) 14 MH- 9.08 0.07 121.62 -3.71Firm 21 -1.95% (4,571,965,644) 14 MH 0.07 #N/A #N/AFirm 22 -1.91% (11,132,696,795) 15 H- 162.40 0.08 117.74 6.80Firm 23 -1.89% (6,008,809) 16 H 8.35 19.07 #N/A #N/AFirm 24 -1.88% (2,620,972,400) 17 MH 0.09 #N/A #N/AFirm 25 -1.88% (2,620,972,400) 17 H 234.00 0.09 #N/A #N/AFirm 26 -1.83% (18,289,430,695) 18 NA 0.04 #N/A #N/AFirm 27 -1.83% (18,289,430,695) 18 NA 22.02 0.04 66.13 1.63Firm 28 -1.82% (150,354) 19 ML 15.50 10.4 #N/A #N/AFirm 29 -1.76% (895,952,796) 20 H 67.00 2.61 208.33 0.52Firm 30 -1.76% (3,426,668,000) 21 MH+ 611.00 0.02 64.93 1.05Firm 31 -1.76% (3,426,668,000) 21 ML- 0.02 #N/A #N/AFirm 32 -1.76% (3,426,668,000) 21 MH+ 0.02 #N/A #N/AFirm 33 -1.76% (954,527,206) 22 H 116.40 0.14 131.00 0.00Firm 34 -1.76% (954,527,206) 22 MH 0.14 #N/A #N/AFirm 35 -1.74% (389,706,522) 23 H 4.85 13.26 1718.93 -4.20Firm 36 -1.72% (13,570,622,921) 24 H- 0.08 #N/A #N/A
Walker Sigismund, FSA Risk Policy 35
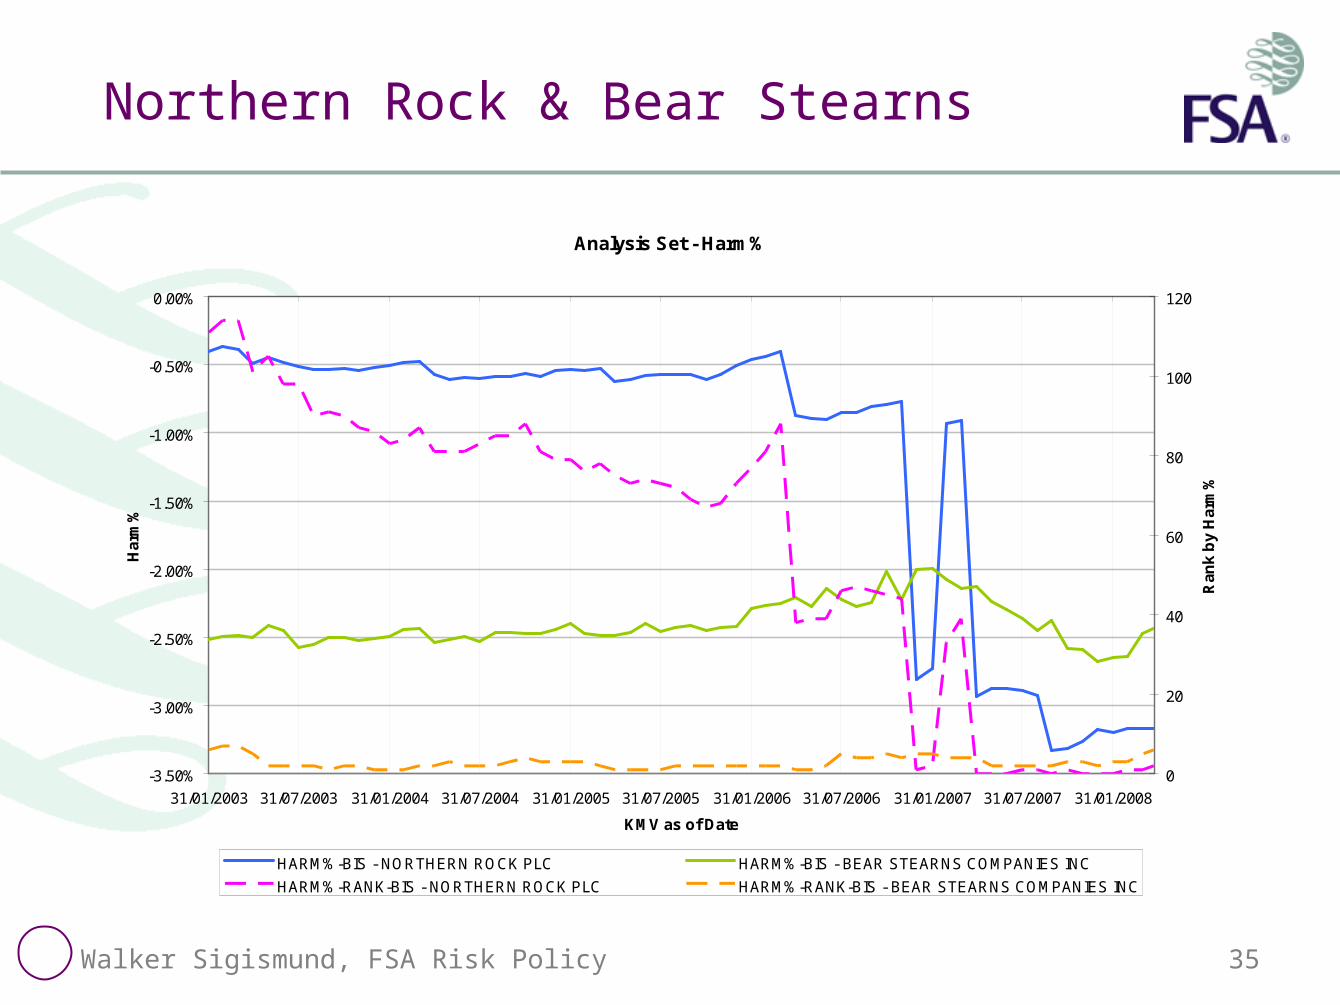
Northern Rock & Bear Stearns
Analysis Set - Harm%
-3.50%
-3.00%
-2.50%
-2.00%
-1.50%
-1.00%
-0.50%
0.00%
31/01/2003 31/07/2003 31/01/2004 31/07/2004 31/01/2005 31/07/2005 31/01/2006 31/07/2006 31/01/2007 31/07/2007 31/01/2008
KMV as of Date
Har
m%
0
20
40
60
80
100
120
Ran
k b
y H
arm
%
HARM%-BIS - NORTHERN ROCK PLC HARM%-BIS - BEAR STEARNS COMPANIES INC
HARM%-RANK-BIS - NORTHERN ROCK PLC HARM%-RANK-BIS - BEAR STEARNS COMPANIES INC
Walker Sigismund, FSA Risk Policy 36
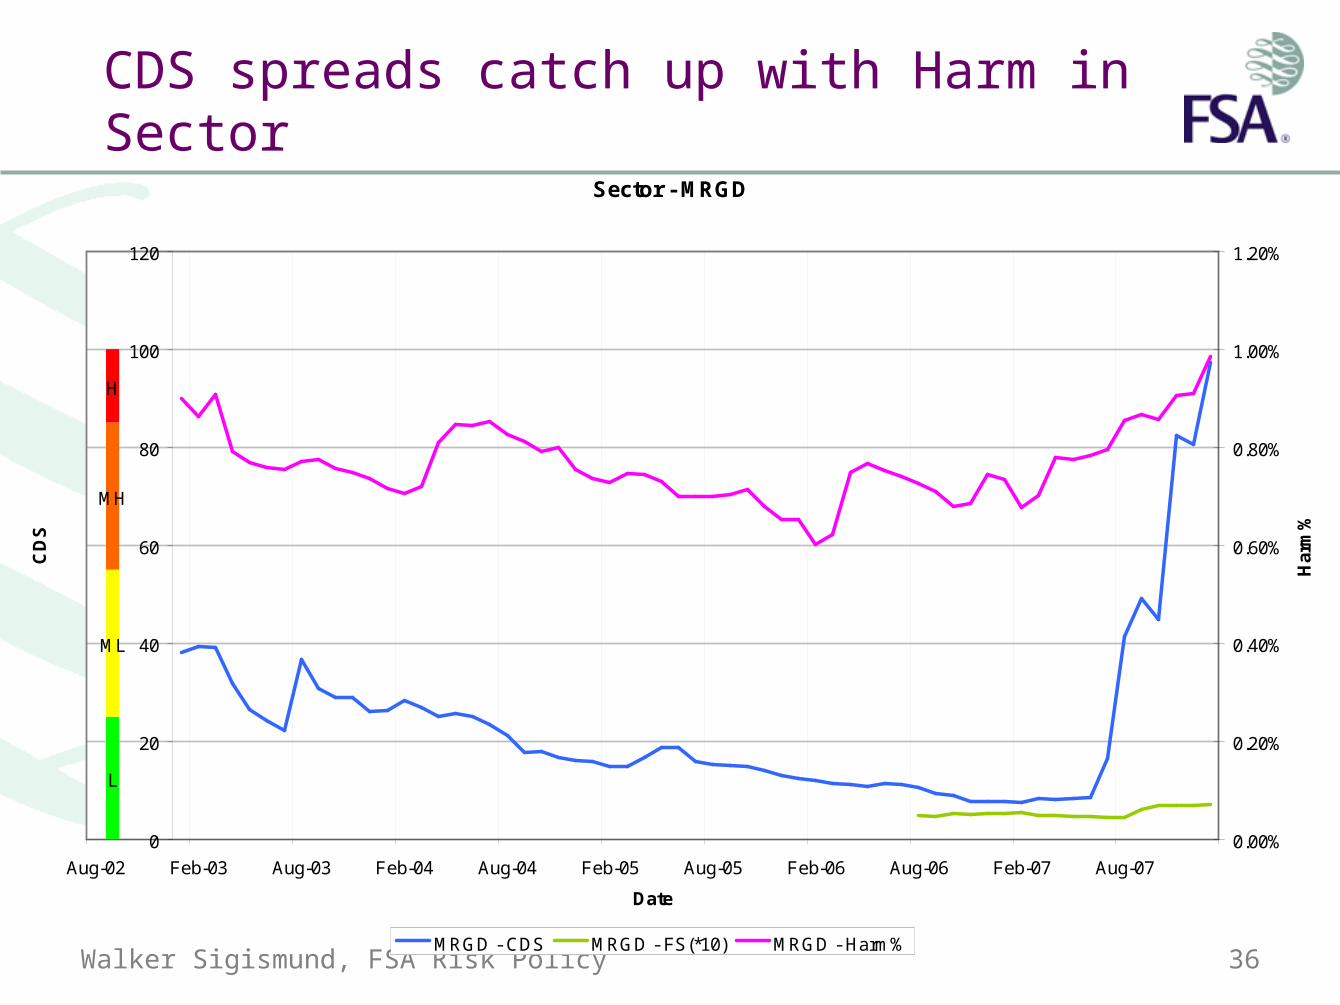
CDS spreads catch up with Harm in Sector
Sector - MRGD
L
ML
MH
H
0
20
40
60
80
100
120
Aug-02 Feb-03 Aug-03 Feb-04 Aug-04 Feb-05 Aug-05 Feb-06 Aug-06 Feb-07 Aug-07
Date
CD
S
0.00%
0.20%
0.40%
0.60%
0.80%
1.00%
1.20%
Har
m%
MRGD - CDS MRGD - FS(*10) MRGD - Harm%
Walker Sigismund, FSA Risk Policy 37
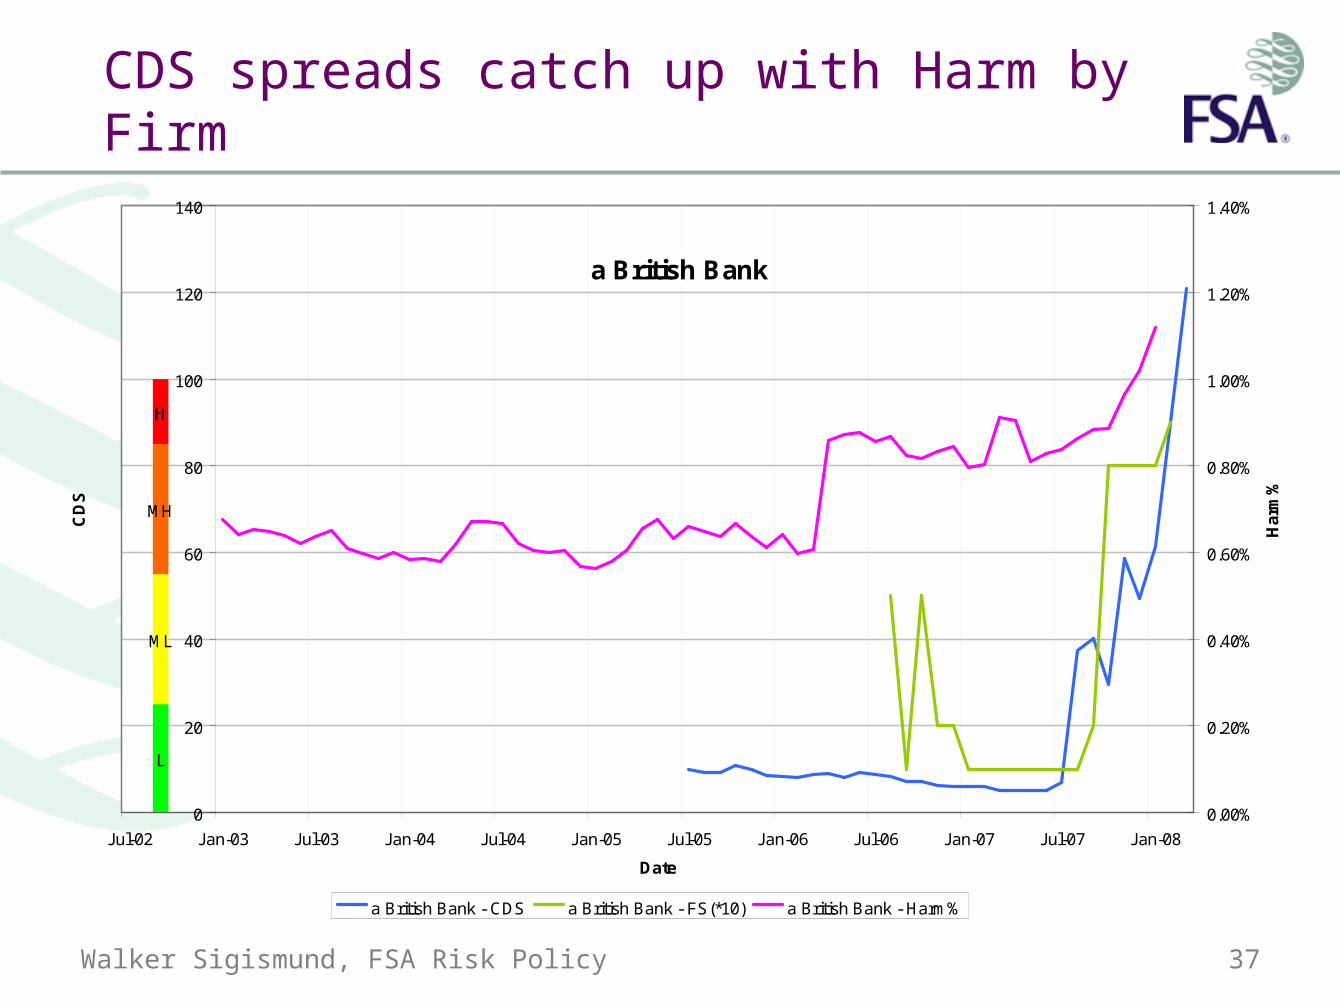
CDS spreads catch up with Harm by Firm
a British Bank
L
ML
MH
H
0
20
40
60
80
100
120
140
Jul-02 Jan-03 Jul-03 Jan-04 Jul-04 Jan-05 Jul-05 Jan-06 Jul-06 Jan-07 Jul-07 Jan-08
Date
CD
S
0.00%
0.20%
0.40%
0.60%
0.80%
1.00%
1.20%
1.40%
Har
m%
a British Bank - CDS a British Bank - FS(*10) a British Bank - Harm%
Walker Sigismund, FSA Risk Policy 38
Pattern of Riskiness by Sector
(35,000,000,000)
(30,000,000,000)
(25,000,000,000)
(20,000,000,000)
(15,000,000,000)
(10,000,000,000)
(5,000,000,000)
-
-5.0% -4.5% -4.0% -3.5% -3.0% -2.5% -2.0% -1.5% -1.0% -0.5% 0.0%
Life Insurers Retail Banks Wholesale Banks: EEA Wholesale Investment Banks: Group 1 Wholesale Investment Banks: Group 2
Walker Sigismund, FSA Risk Policy 39
Empirical Results
• Powerful Warning Indicator– NRK to be Riskiest firm up to 1 year before event
– Bear-Stearns… near top for a long time
– Seemingly all ‘problem’ firms at the top (various discussions with US and other regulators)
• Risk by Sector– Investment Banks, Insurance, Retail Banking… Real
Economy
• Risk by major market– Total Harm£ over £368Billion and rising
• Statistical and Logical Links to – Accounting and Regulatory Returns
Walker Sigismund, FSA Risk Policy 40
– End –


![[Clarinet_Institute] Neukomm, Sigismund - Clarinet Quintet, Op. 8.pdf](https://img.pdfslide.us/doc/110x75/552ef8214a795978658b4acf/clarinetinstitute-neukomm-sigismund-clarinet-quintet-op-8pdf.jpg)