Embed Size (px)
DESCRIPTION
Â
Citation preview
WOAKABILITYgenta ishimura jonathan yu kevin zhang

3
woakability | ends 440 | 2008
contents
intentions 4
introduction 5 what is walkability? why is walkability important? what makes a neighbourhood walkable?
scope and history 6 first impressions neighbourhood demographics housing types workplace distribution median household income population in low-income households
documentation & analysis 10modes of transport land use 5 min walking radius service coverage level of service typical sections connectivity transit coverage visibility permeability grey network long sections
conclusion 20 findings closing comments
tools & references 21
section one
section two
section three
section four
section five
CONTENTS
4
woakability | ends 440 | 2008
intentions
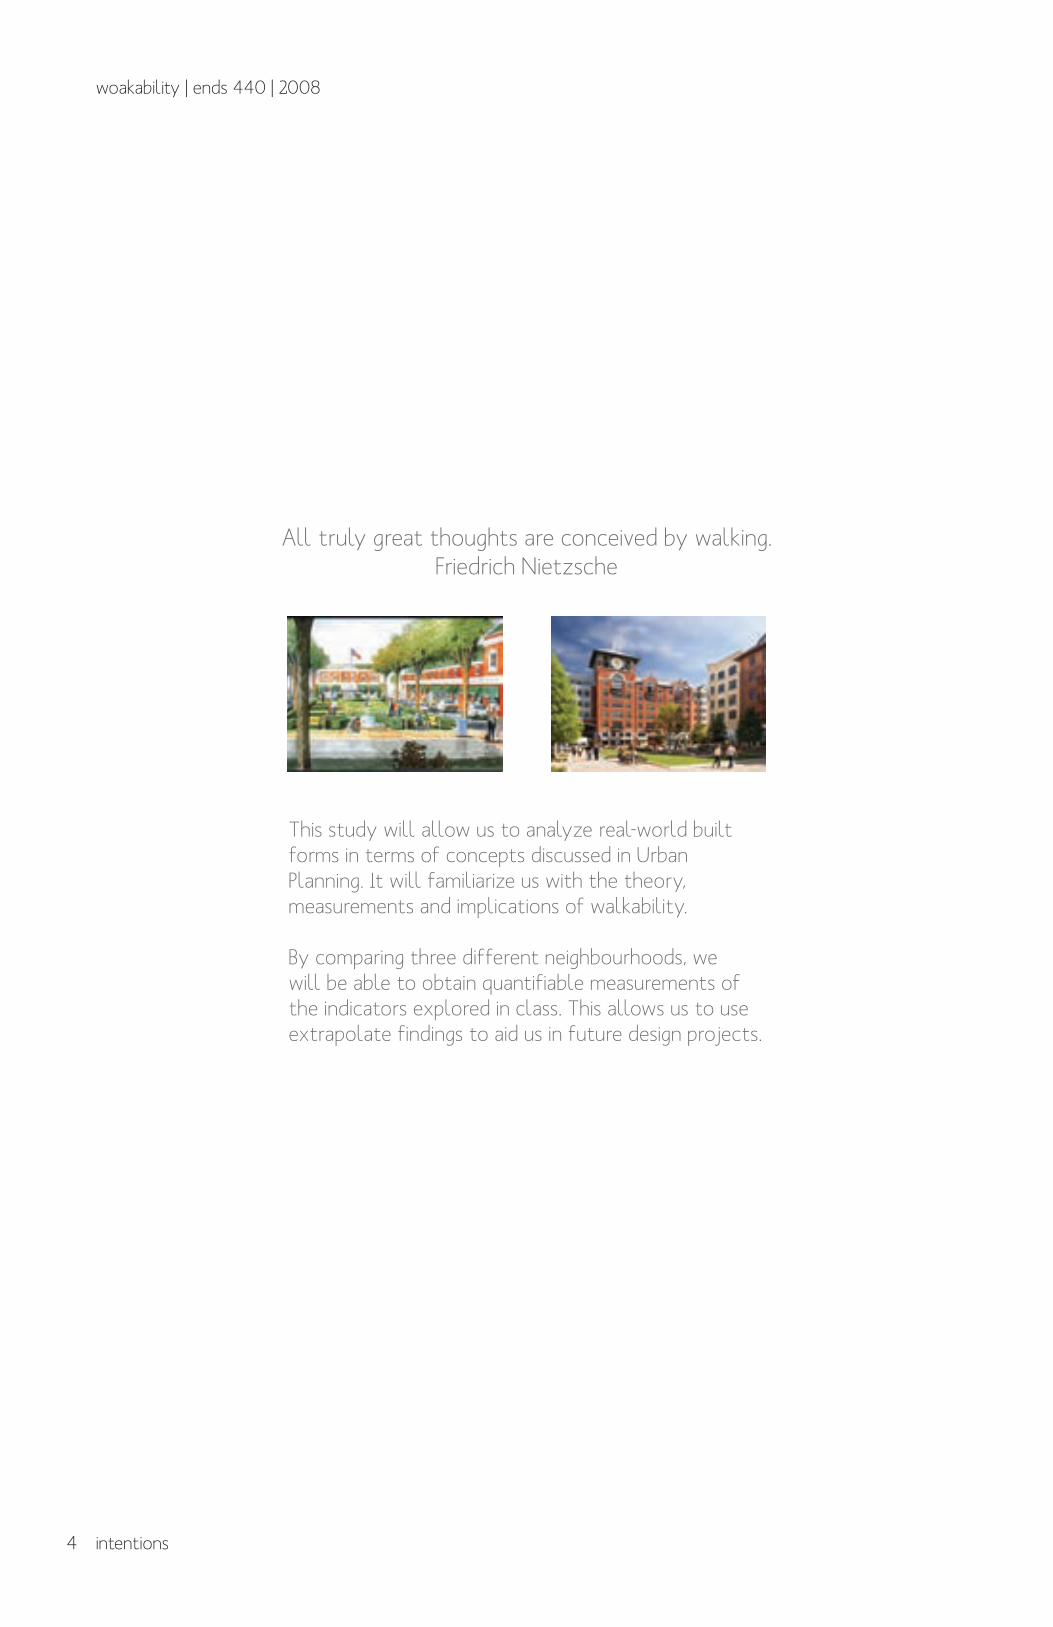
All truly great thoughts are conceived by walking.Friedrich Nietzsche
This study will allow us to analyze real-world built forms in terms of concepts discussed in Urban Planning. It will familiarize us with the theory, measurements and implications of walkability.
By comparing three different neighbourhoods, we will be able to obtain quantifiable measurements of the indicators explored in class. This allows us to use extrapolate findings to aid us in future design projects.
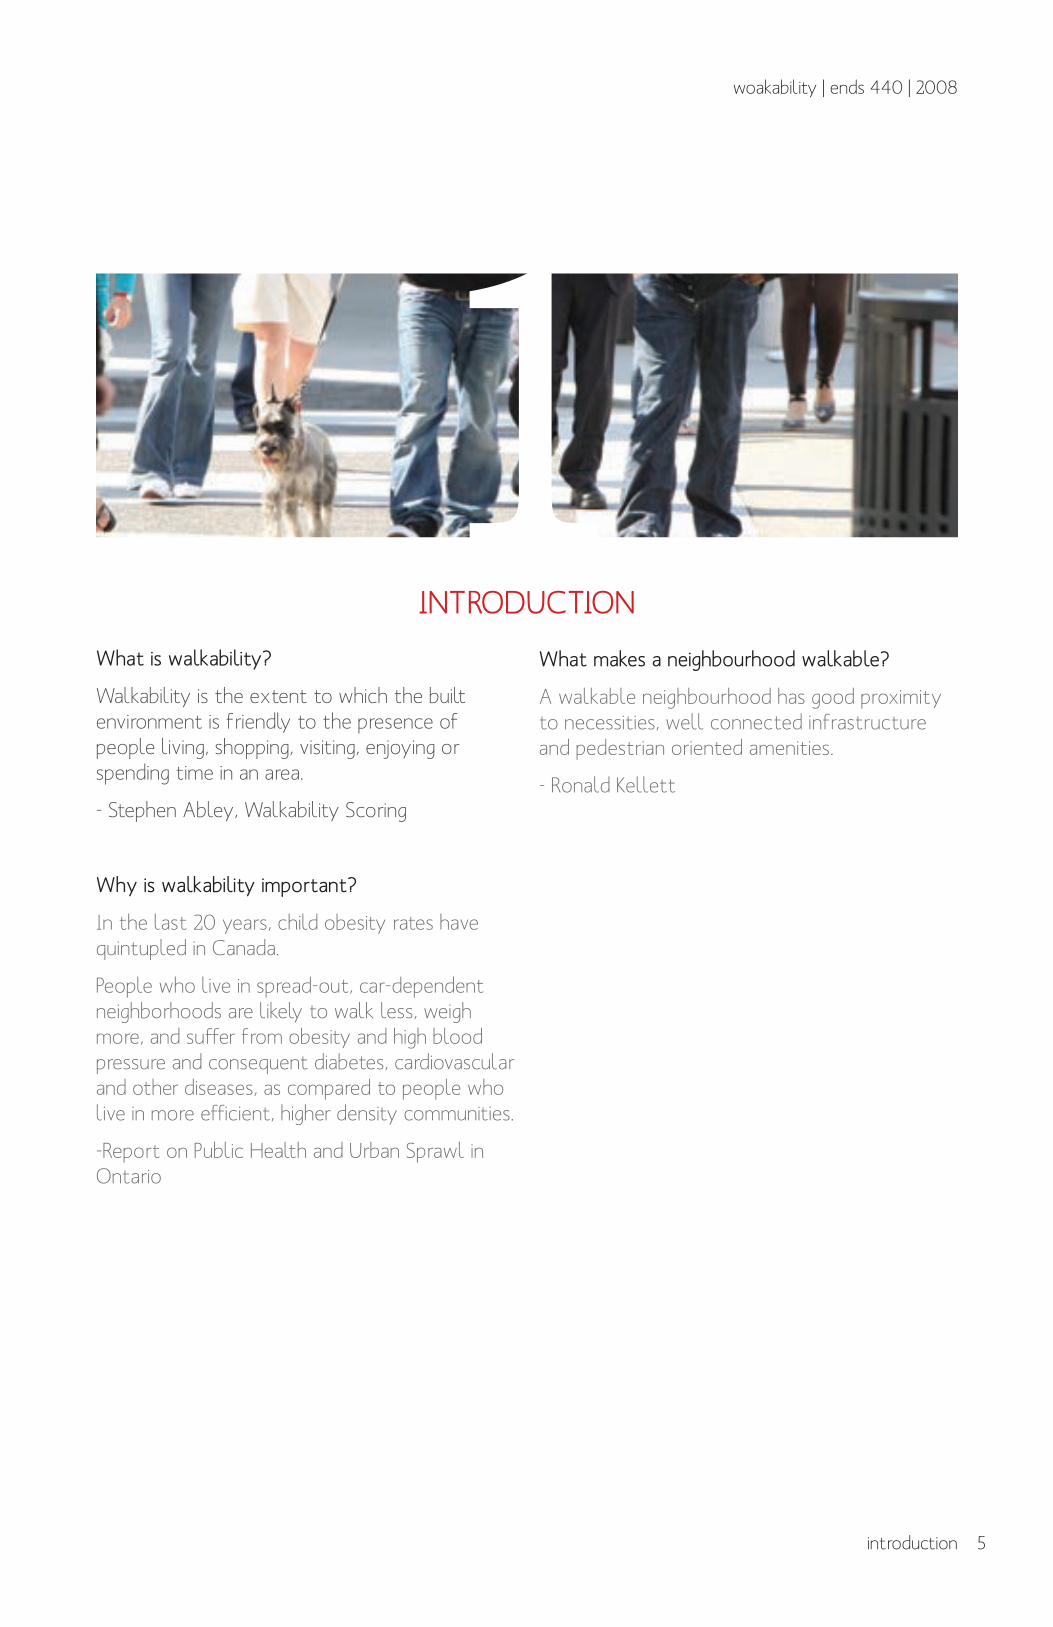
What makes a neighbourhood walkable?
A walkable neighbourhood has good proximity to necessities, well connected infrastructure and pedestrian oriented amenities.
- Ronald Kellett
INTRODUCTION
What is walkability?
Walkability is the extent to which the built environment is friendly to the presence of people living, shopping, visiting, enjoying or spending time in an area.
- Stephen Abley, Walkability Scoring
Why is walkability important?
In the last 20 years, child obesity rates have quintupled in Canada.
People who live in spread-out, car-dependent neighborhoods are likely to walk less, weigh more, and suffer from obesity and high blood pressure and consequent diabetes, cardiovascular and other diseases, as compared to people who live in more efficient, higher density communities.
-Report on Public Health and Urban Sprawl in Ontario
5
woakability | ends 440 | 2008
introduction
1

6
woakability | ends 440 | 2008
31Oak Street
Oak Street is a major arterial street in Vancouver. From north to south, it runs through a very busy commercial district, then by Vancouver General Hospital, then some very expensive Vancouver neighbourhoods, then to Marpole District, and into Richmond.
One can drive from Mexico to Vancouver and the first traffic lights they hit are at Oak and 70th avenue.
- Erick Villagomez
Fairview
1886 Fairview was named by CPR Land Commissioner L.A. Hamilton. Hamilton’s survey established the numbered system of east-west avenues and named the cross streets after trees.
1920s Fairview Slopes was zoned for 3 storey apartments and throughout the 1950s, the area south of Broadway developed as an apartment district.
1972 Plans initiated for the redevelopment of both Fairview and Granville Island for higher density residential and commercial uses.
Shaughnessy
1885 Shaughnessy developed on 6,000 acres of prime land in the heart of Vancouver to lure the city’s elite from the West End.
1907 CPR spends more than one million dollars developing the site before selling.
1914 Shaughnessy Settlement Act restricts development to single-family houses.
1922 Shaughnessy Heights Building Restriction Act prohibits the subdivision of lots and limits construction to one single-family dwelling per lot.
1930s Depression causes many homes to be repossessed and turned into rooming houses.
Marpole
3500 B.C. Two early village sites discovered along the north shore of the Fraser have been documented by archaeologists.
1929 Marpole is amalgamated into Vancouver. Saw mills along the river make it the industrial centre of the lower mainland.
1957 Oak Street opens and draws business and development away from old district
1960s Area south of 70th Avenue was rezoned and low-rise stucco walk-ups began to replace the original homes.
scope and history
SCOPE AND HISTORY
2
7
woakability | ends 440 | 2008
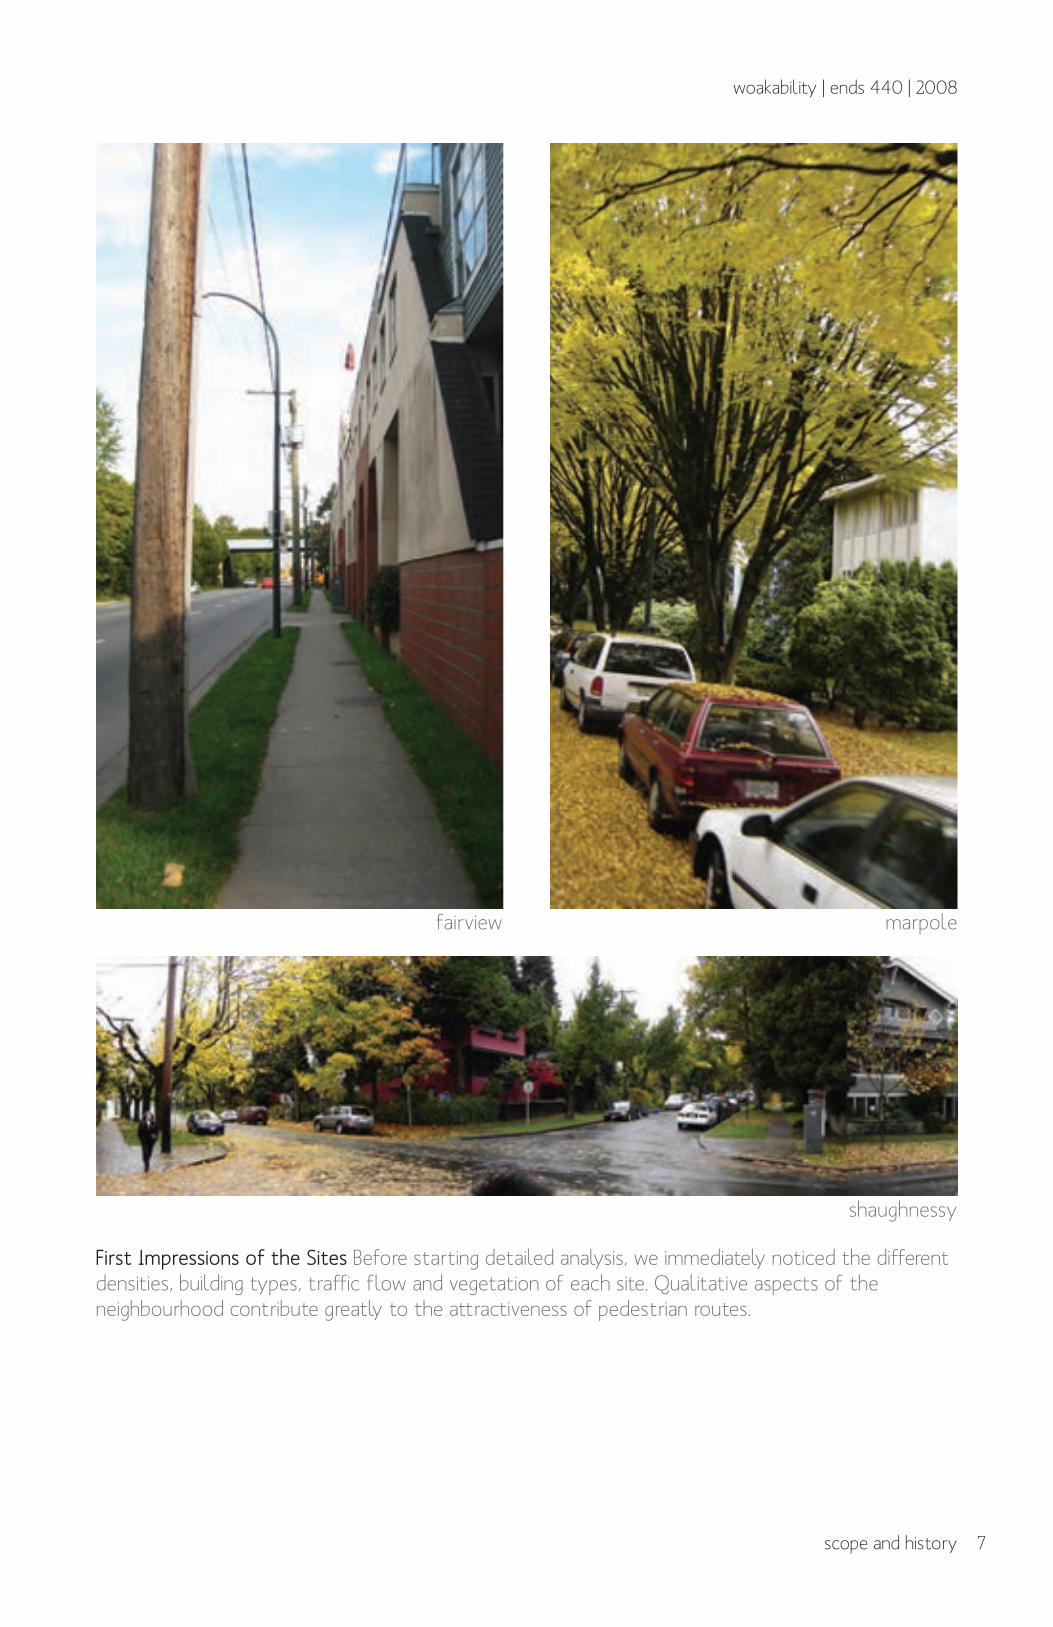
First Impressions of the Sites Before starting detailed analysis, we immediately noticed the different densities, building types, traffic flow and vegetation of each site. Qualitative aspects of the neighbourhood contribute greatly to the attractiveness of pedestrian routes.
scope and history
fairview marpole
shaughnessy
8
woakability | ends 440 | 2008
scope and history
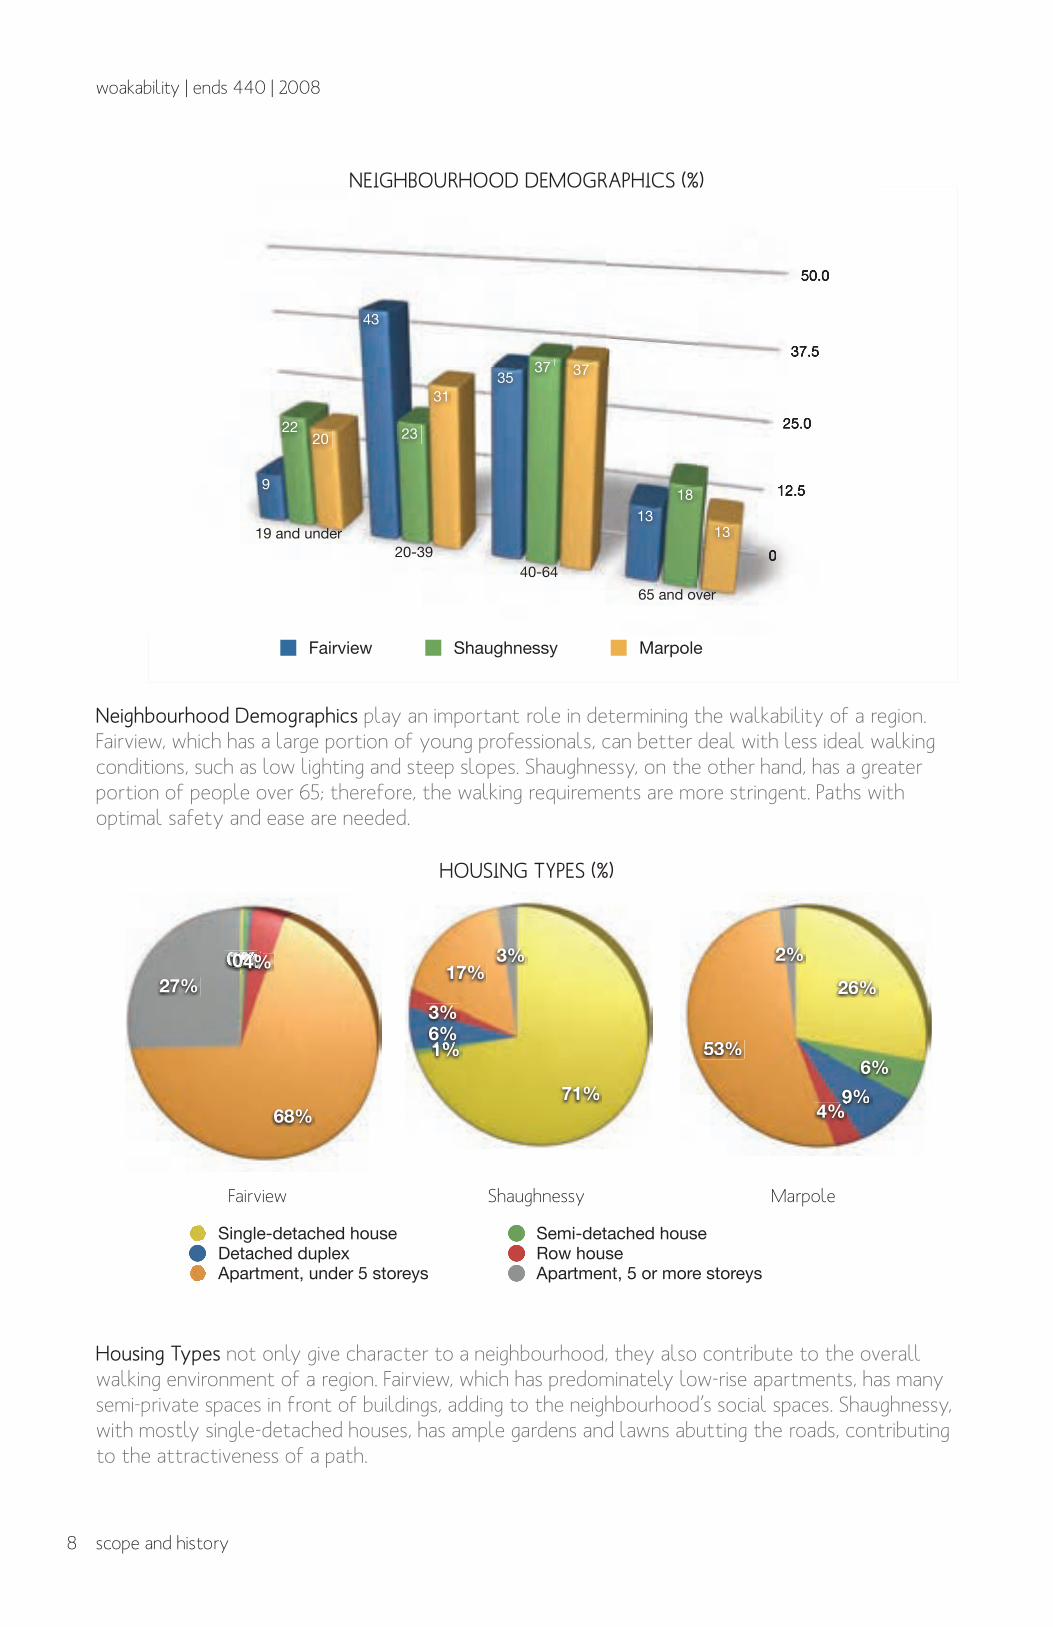
Neighbourhood Demographics play an important role in determining the walkability of a region. Fairview, which has a large portion of young professionals, can better deal with less ideal walking conditions, such as low lighting and steep slopes. Shaughnessy, on the other hand, has a greater portion of people over 65; therefore, the walking requirements are more stringent. Paths with optimal safety and ease are needed.
Fairview Shaughnessy Marpole
19 and under
20-39
40-64
65 and over
9.3 21.6 19.9
42.7 23.1 30.5
34.6 37.1 37.1
13.4 18.1 12.5
0
12.5
25.0
37.5
50.0
0
12.5
25.0
37.5
50.0
9
43
35
13
22 23
37
18
20
31
37
1319 and under
20-39
40-64
65 and over
Age Groups
Fairview Shaughnessy Marpole
Single-
detached
house
Semi-
detached
house
Detached
duplex
Row house Apartment,
under 5
storeys
Apartment, 5
or more
storeys
Fairview
Shaughnessy
Marpole
0.3 0.7 0.3 3.8 67.3 27
70.5 0.8 6.1 2.8 17.3 2.5
26.2 5.5 8.7 4 53.4 2.1
0%0%1%0%1%0%1%0%0%1%0%0%1%0%1%0%0%0%1%0%1%0%1%0%0%0%1%0%4%
68%
27%
Fairview
71%
1%1%6%3%
17%3%
Shaughnessy
Single-detached house Semi-detached houseDetached duplex Row houseApartment, under 5 storeys Apartment, 5 or more storeys
26%
6%
9%9%4%
53%
2%
Marpole
Housing Types not only give character to a neighbourhood, they also contribute to the overall walking environment of a region. Fairview, which has predominately low-rise apartments, has many semi-private spaces in front of buildings, adding to the neighbourhood’s social spaces. Shaughnessy, with mostly single-detached houses, has ample gardens and lawns abutting the roads, contributing to the attractiveness of a path.
Fairview Shaughnessy Marpole
NEIGHBOURHOOD DEMOGRAPHICS (%)
HOUSING TYPES (%)
9
woakability | ends 440 | 2008
scope and history
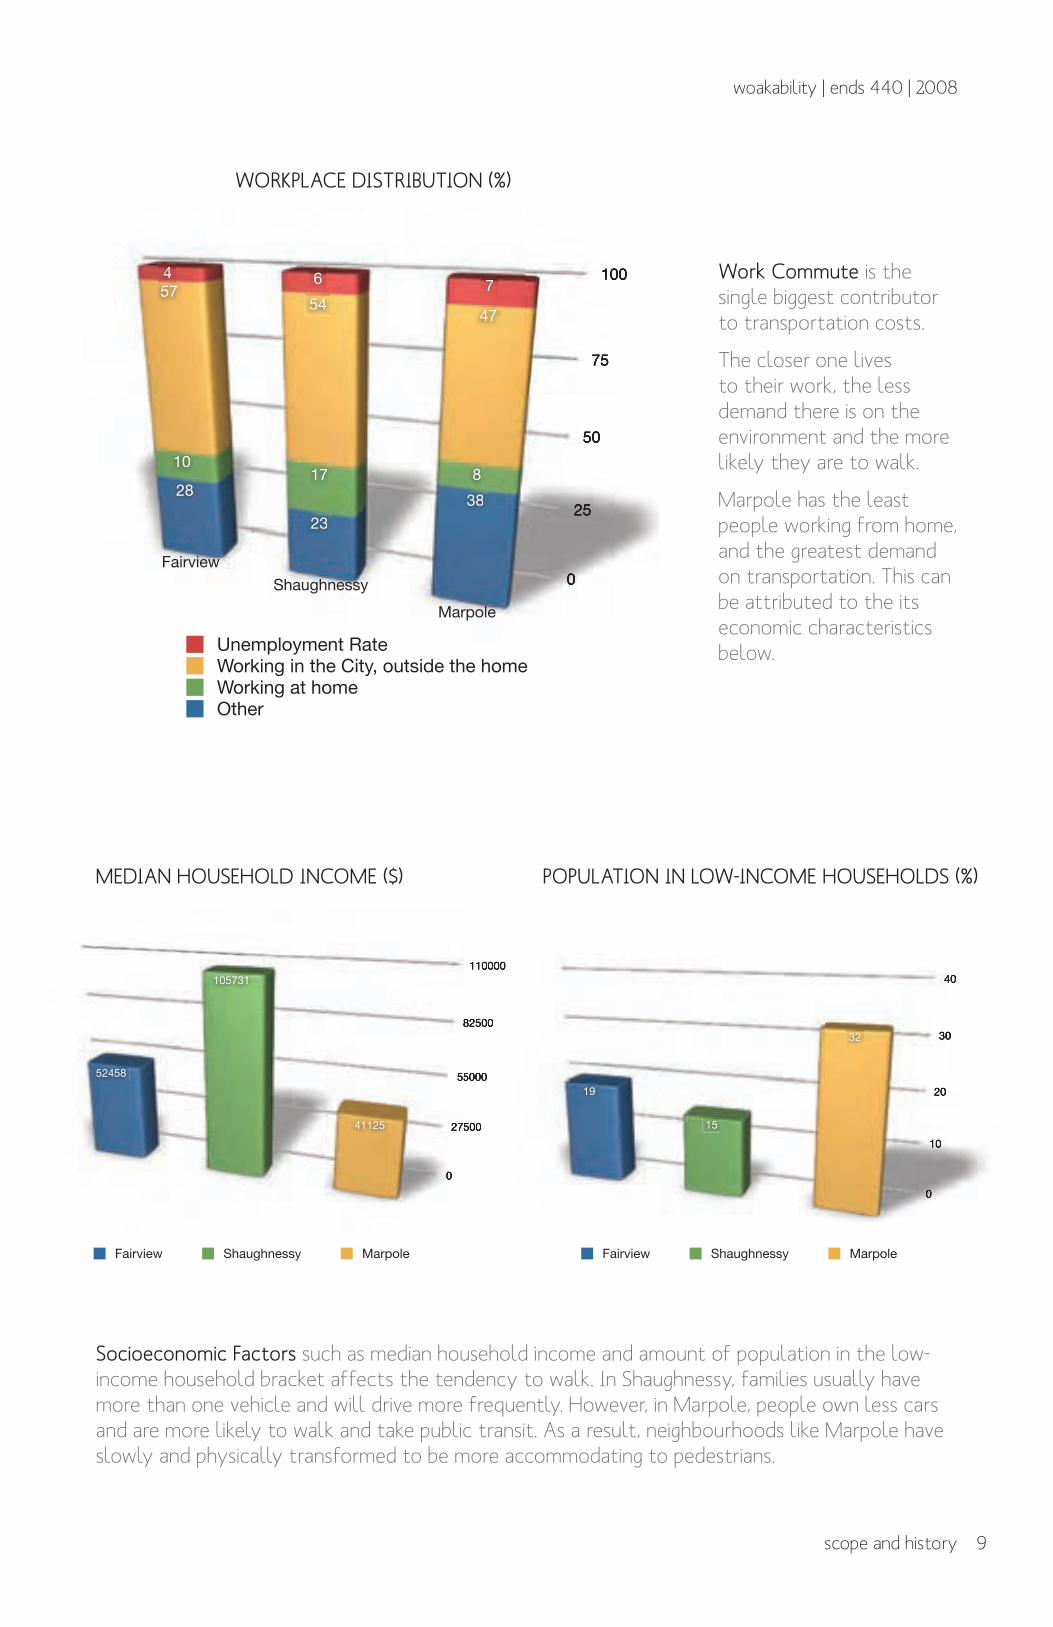
Socioeconomic Factors such as median household income and amount of population in the low-income household bracket affects the tendency to walk. In Shaughnessy, families usually have more than one vehicle and will drive more frequently. However, in Marpole, people own less cars and are more likely to walk and take public transit. As a result, neighbourhoods like Marpole have slowly and physically transformed to be more accommodating to pedestrians.
Work Commute is the single biggest contributor to transportation costs.
The closer one lives to their work, the less demand there is on the environment and the more likely they are to walk.
Marpole has the least people working from home, and the greatest demand on transportation. This can be attributed to the its economic characteristics below.
Fairview Shaughnessy Marpole
Median
household
Income
Population in
low income
household
52458 105731 41125
19.2 14.8 32.2
0
27500
55000
82500
110000
0
27500
55000
82500
52458
105731
41125
Median household income
Fairview Shaughnessy Marpole
0
10
20
30
40
27500
55000
82500
110000
0
10
20
30
40
19
15
32
Population in low income household
Fairview Shaughnessy Marpole
Fairview Shaughnessy Marpole
Other
Working at
home
Working in
the City,
outside the
home
Unemployme
nt Rate
28.2 23.2 38.4
10.1 17.2 8.2
57.3 53.6 46.6
4.4 6 6.8
0
25
50
75
100
0
25
50
75
100
28
23
38
1017 8
5754
47
4 6 7
Fairview
Shaughnessy
Marpole
Work place distribution
OtherWorking at homeWorking in the City, outside the homeUnemployment Rate
WORKPLACE DISTRIBUTION (%)
MEDIAN HOUSEHOLD INCOME ($) POPULATION IN LOW-INCOME HOUSEHOLDS (%)
10
woakability | ends 440 | 2008
3Modes of Transport
Transportation mode data has been collected for each of the three sites and are the most accurate measures of walkability. Vancouver as a whole, has a greater portion of people walking to work and services compared to areas surrounding it.
This study will look at the three indicator sets below to determine how formal design factors contribute to the different levels of walkability.
Proximity
Proximity measures the relationships between a resident and all their necessities. This will be measured by mapping neighbourhood services, 5 minute walking radii and service coverage.
Connectivity
Connectivity measures the ease at which one can walk to one’s destination. This will be measured through crosswalk availability, path choice, block size, and other formal characteristics displayed in section.
Attractiveness
Attractiveness measures the intangible attributes of a walking route. This will be measured through safety, vegetation, visibility and permeability.
documentation & analysis
DOCUMENTATION & ANALYSIS
3
11
woakability | ends 440 | 2008
documentation & analysis
Fairview Shaughnessy Marpole
Car, truck van
as driver
Car, truck ,
van as
passenger
Public transit
Walked to
work
Bicycle
Other method
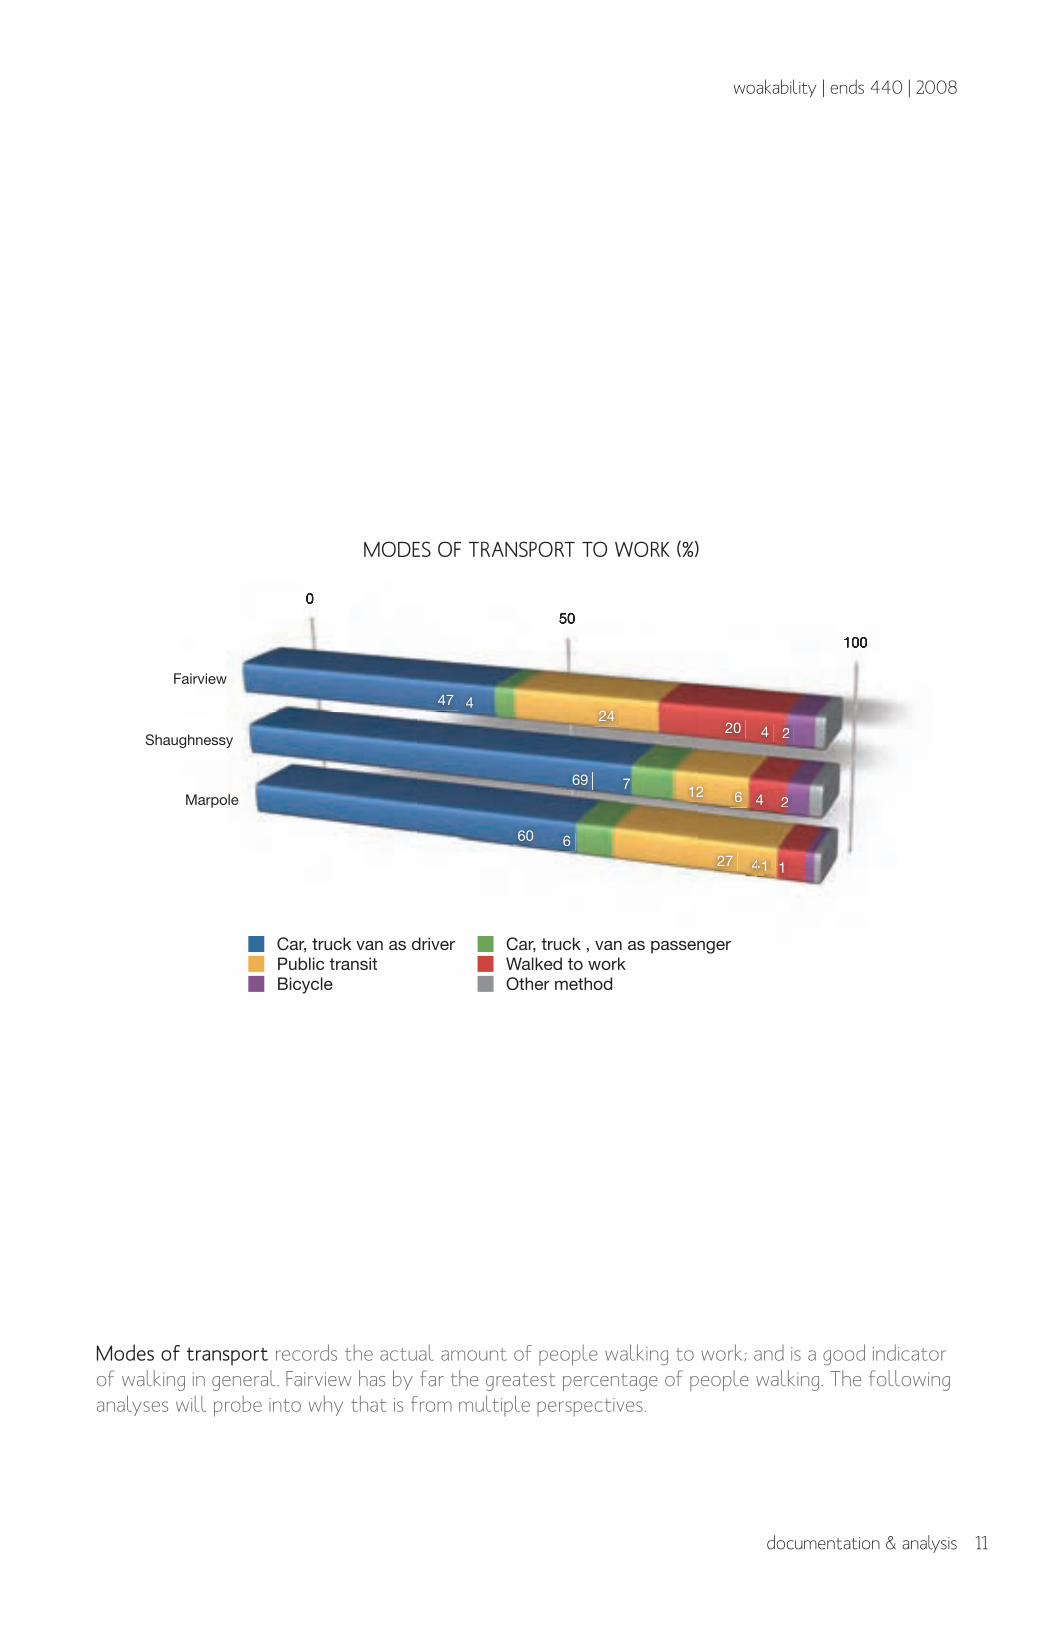
46.5 69.4 59.7
3.5 7 6.4
24 12.1 27.1
20.2 6 4.4
4.4 3.5 1.4
1.5 2 1
0
50
100
150
0
50
100
47
69
60
4
7
6
24
12
27
20
6
4
4
4
41
2
2
1
Fairview
Shaughnessy
Marpole
Mode of travel to work
Car, truck van as driver Car, truck , van as passengerPublic transit Walked to workBicycle Other method
MODES OF TRANSPORT TO WORK (%)
Modes of transport records the actual amount of people walking to work; and is a good indicator of walking in general. Fairview has by far the greatest percentage of people walking. The following analyses will probe into why that is from multiple perspectives.
12
woakability | ends 440 | 2008
documentation & analysis
5 minute walking radius}commercial mix}commercial general}public open space}civic general
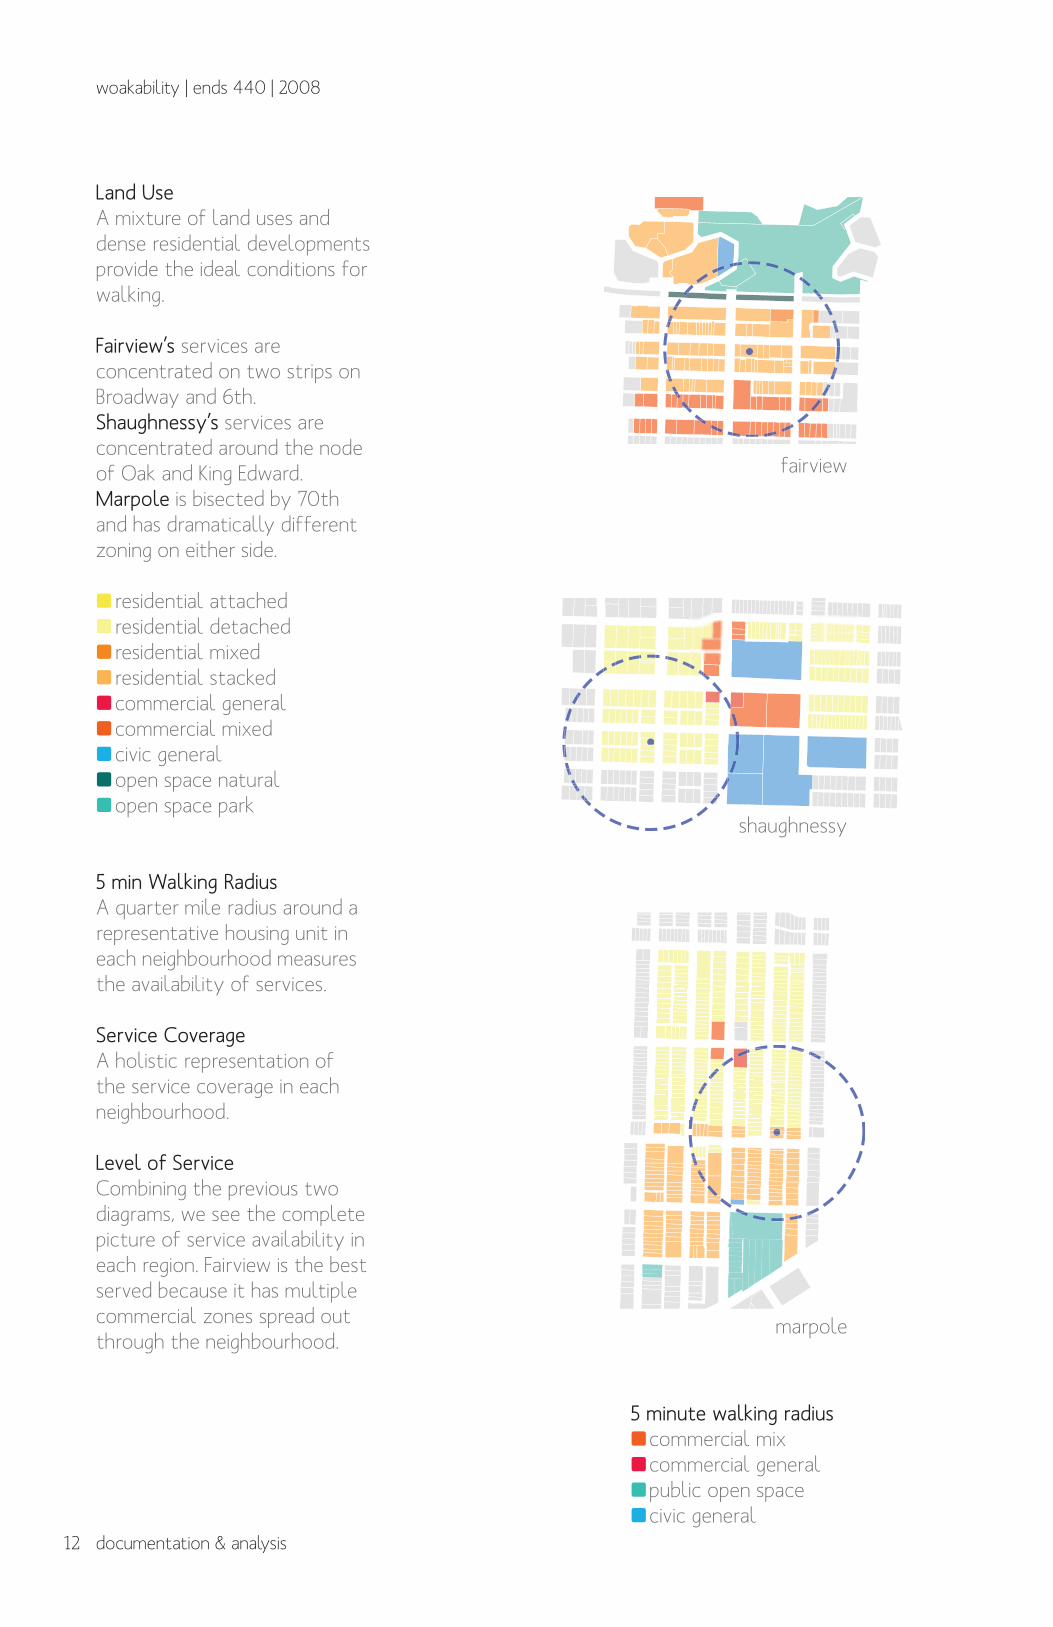
Land UseA mixture of land uses and dense residential developments provide the ideal conditions for walking.
Fairview’s services are concentrated on two strips on Broadway and 6th.Shaughnessy’s services are concentrated around the node of Oak and King Edward.Marpole is bisected by 70th and has dramatically different zoning on either side.
} residential attached} residential detached} residential mixed} residential stacked}commercial general}commercial mixed}civic general}open space natural}open space park
5 min Walking RadiusA quarter mile radius around a representative housing unit in each neighbourhood measures the availability of services.
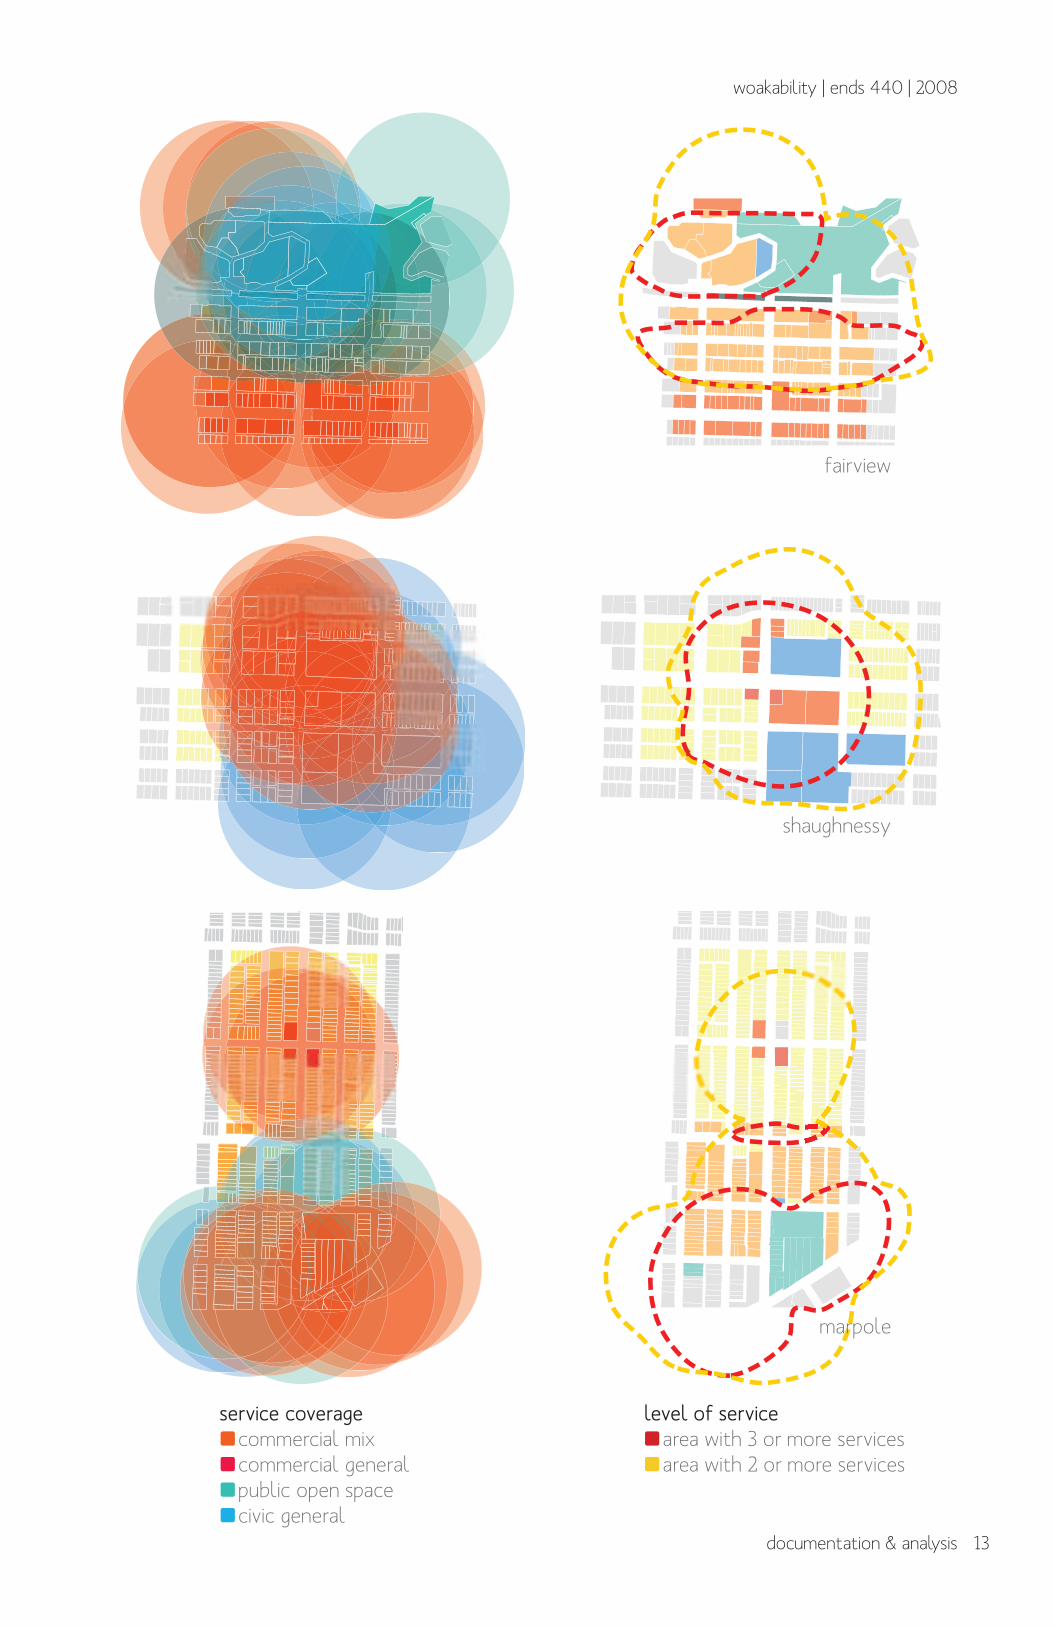
Service CoverageA holistic representation of the service coverage in each neighbourhood.
Level of ServiceCombining the previous two diagrams, we see the complete picture of service availability in each region. Fairview is the best served because it has multiple commercial zones spread out through the neighbourhood.
fairview
shaughnessy
marpole
13
woakability | ends 440 | 2008
documentation & analysis
residential attached
residential detached
residential mixed
residential stacked
commercial general
commercial mixed
civic general
open space natural
open space park
street alley
street local
street collector
street arterial
level of service}area with 3 or more services}area with 2 or more services
service coverage}commercial mix}commercial general}public open space}civic general
fairview
shaughnessy
marpole
14
woakability | ends 440 | 2008
documentation & analysis
Fairview Shaughnessy Marpole
Average road
width
Average block
length
Intersections
Intersections per
km2
Distant between
choices
Total road
Total road per km2
Total area
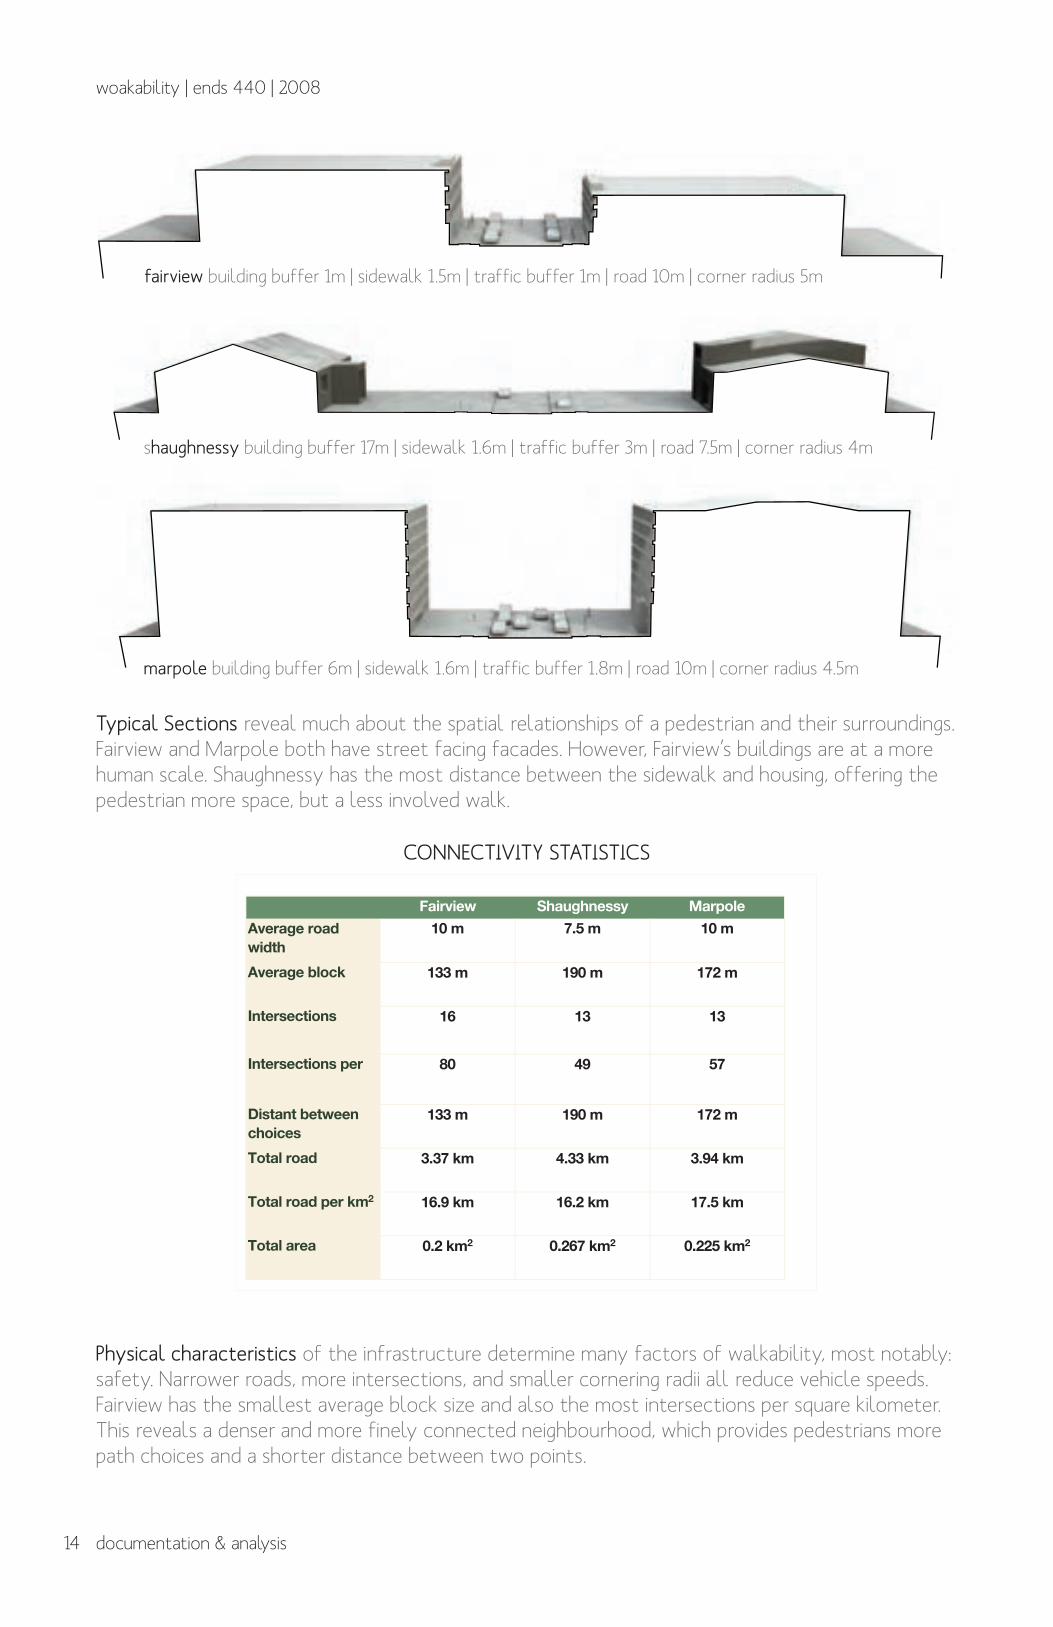
10 m 7.5 m 10 m
133 m 190 m 172 m
16 13 13
80 49 57
133 m 190 m 172 m
3.37 km 4.33 km 3.94 km
16.9 km 16.2 km 17.5 km
0.2 km2 0.267 km2 0.225 km2
CONNECTIVITY STATISTICS
Physical characteristics of the infrastructure determine many factors of walkability, most notably: safety. Narrower roads, more intersections, and smaller cornering radii all reduce vehicle speeds. Fairview has the smallest average block size and also the most intersections per square kilometer. This reveals a denser and more finely connected neighbourhood, which provides pedestrians more path choices and a shorter distance between two points.
Typical Sections reveal much about the spatial relationships of a pedestrian and their surroundings. Fairview and Marpole both have street facing facades. However, Fairview’s buildings are at a more human scale. Shaughnessy has the most distance between the sidewalk and housing, offering the pedestrian more space, but a less involved walk.
fairview building buffer 1m | sidewalk 1.5m | traffic buffer 1m | road 10m | corner radius 5m
shaughnessy building buffer 17m | sidewalk 1.6m | traffic buffer 3m | road 7.5m | corner radius 4m
marpole building buffer 6m | sidewalk 1.6m | traffic buffer 1.8m | road 10m | corner radius 4.5m
15
woakability | ends 440 | 2008
documentation & analysis
SCHOOL GREEN
IRONWORK PASSAGE
W 7TH AV
W 6TH AV
OA
K S
T
W BROADWAY
W 8TH AV
LA
UR
EL
ST
LAMEY'S MILL ROAD
FORGE WALK SCANTLINGS
SP
RU
CE
ST
W BROADWAY
W 8TH AV
LA
UR
EL
ST
W 8TH AV
LA
UR
EL
ST
SP
RU
CE
ST
OA
K S
T O
AK
ST
W BROADWAY W BROADWAY
W 6TH AV
W 7TH AVW 7TH AVW 7TH AVW 7TH AV
SP
RU
CE
ST
SCHOOL GREEN
IRONWORK PASSAGE
LAMEY'S MILL ROAD
FORGE WALK SCANTLINGS
W 6TH AV W 6TH AV
OA
K S
T
W KING EDWARD
OS
LER
ST
SE
LKIR
K S
T
LAU
RE
L S
T
WIL
LOW
ST
W 23TH AVE
W 26TH AVE
W 27TH AVE
W 24TH AVE
OA
K S
T
W 70TH AVE
W 67TH AVE
W 64TH AVE
W 71TH AVE
W 72TH AVE
OS
LER
ST
SE
LKIR
K S
T
SH
AU
GH
NE
SS
Y S
T
FR
EM
LIN
ST
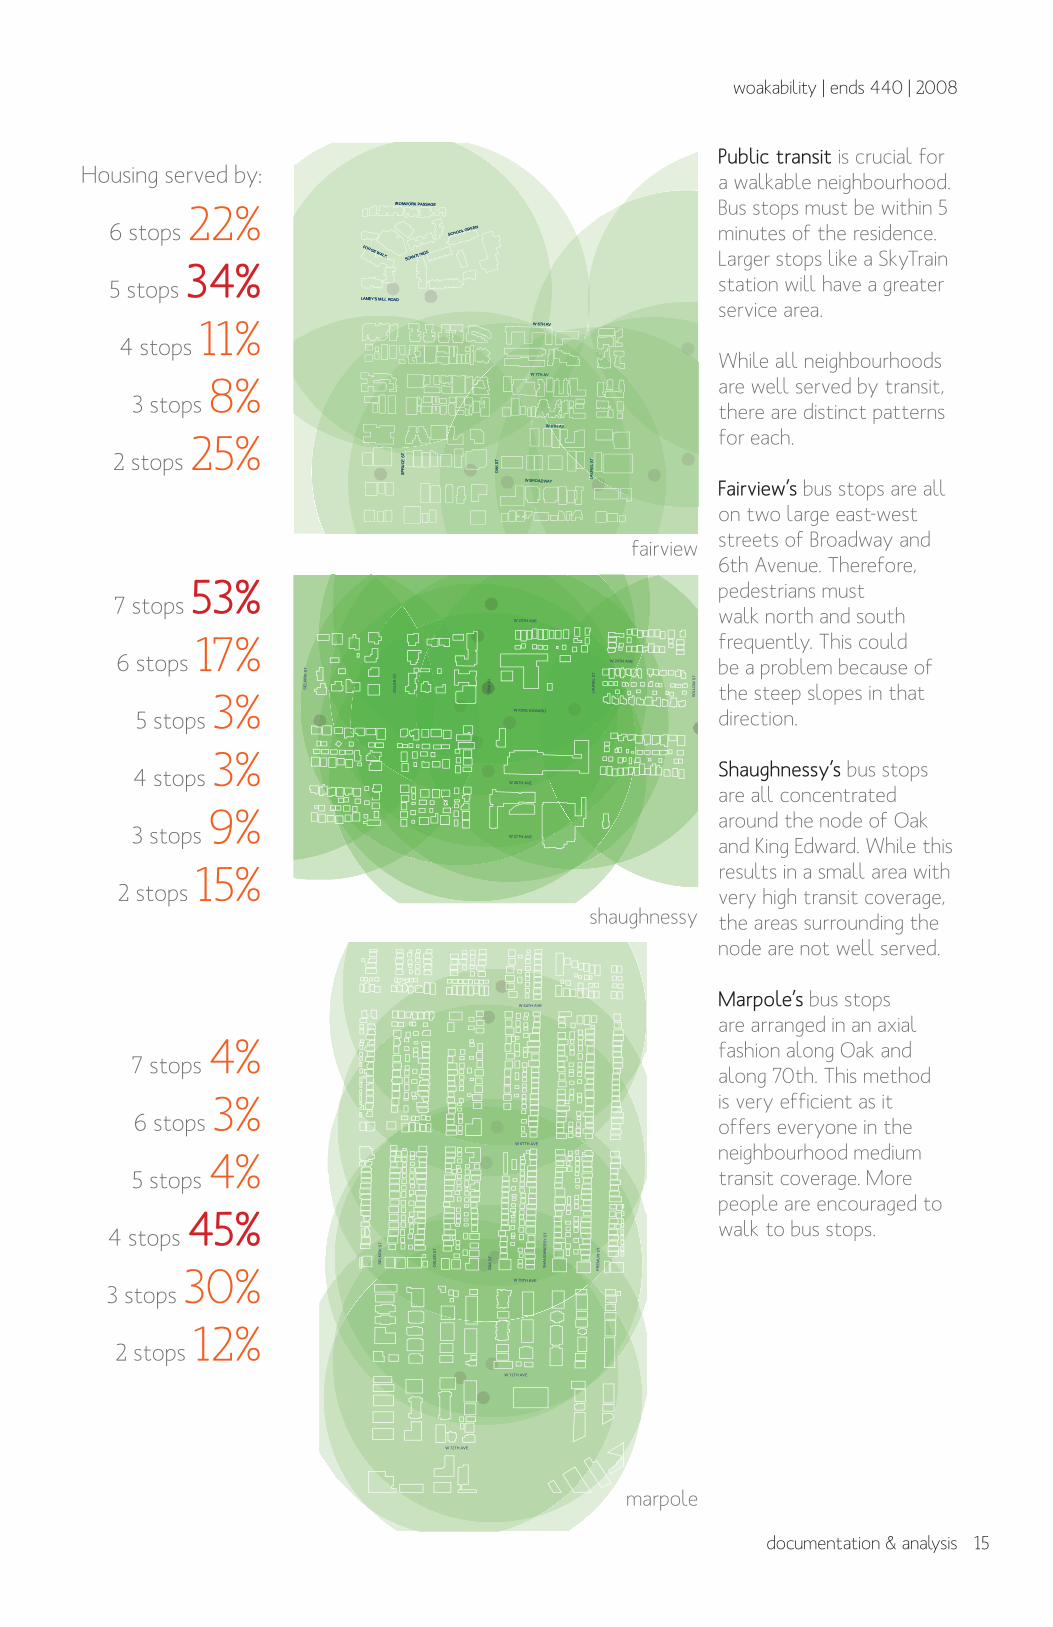
Public transit is crucial for a walkable neighbourhood. Bus stops must be within 5 minutes of the residence. Larger stops like a SkyTrain station will have a greater service area.
While all neighbourhoods are well served by transit, there are distinct patterns for each.
Fairview’s bus stops are all on two large east-west streets of Broadway and 6th Avenue. Therefore, pedestrians must walk north and south frequently. This could be a problem because of the steep slopes in that direction.
Shaughnessy’s bus stops are all concentrated around the node of Oak and King Edward. While this results in a small area with very high transit coverage, the areas surrounding the node are not well served.
Marpole’s bus stops are arranged in an axial fashion along Oak and along 70th. This method is very efficient as it offers everyone in the neighbourhood medium transit coverage. More people are encouraged to walk to bus stops.
fairview
shaughnessy
marpole
Housing served by:
6 stops 22%5 stops 34%4 stops 11%
3 stops 8%2 stops 25%
7 stops 53%6 stops 17%
5 stops 3%4 stops 3%3 stops 9%
2 stops 15%
7 stops 4%6 stops 3% 5 stops 4%
4 stops 45%3 stops 30%2 stops 12%
16
woakability | ends 440 | 2008
documentation & analysis
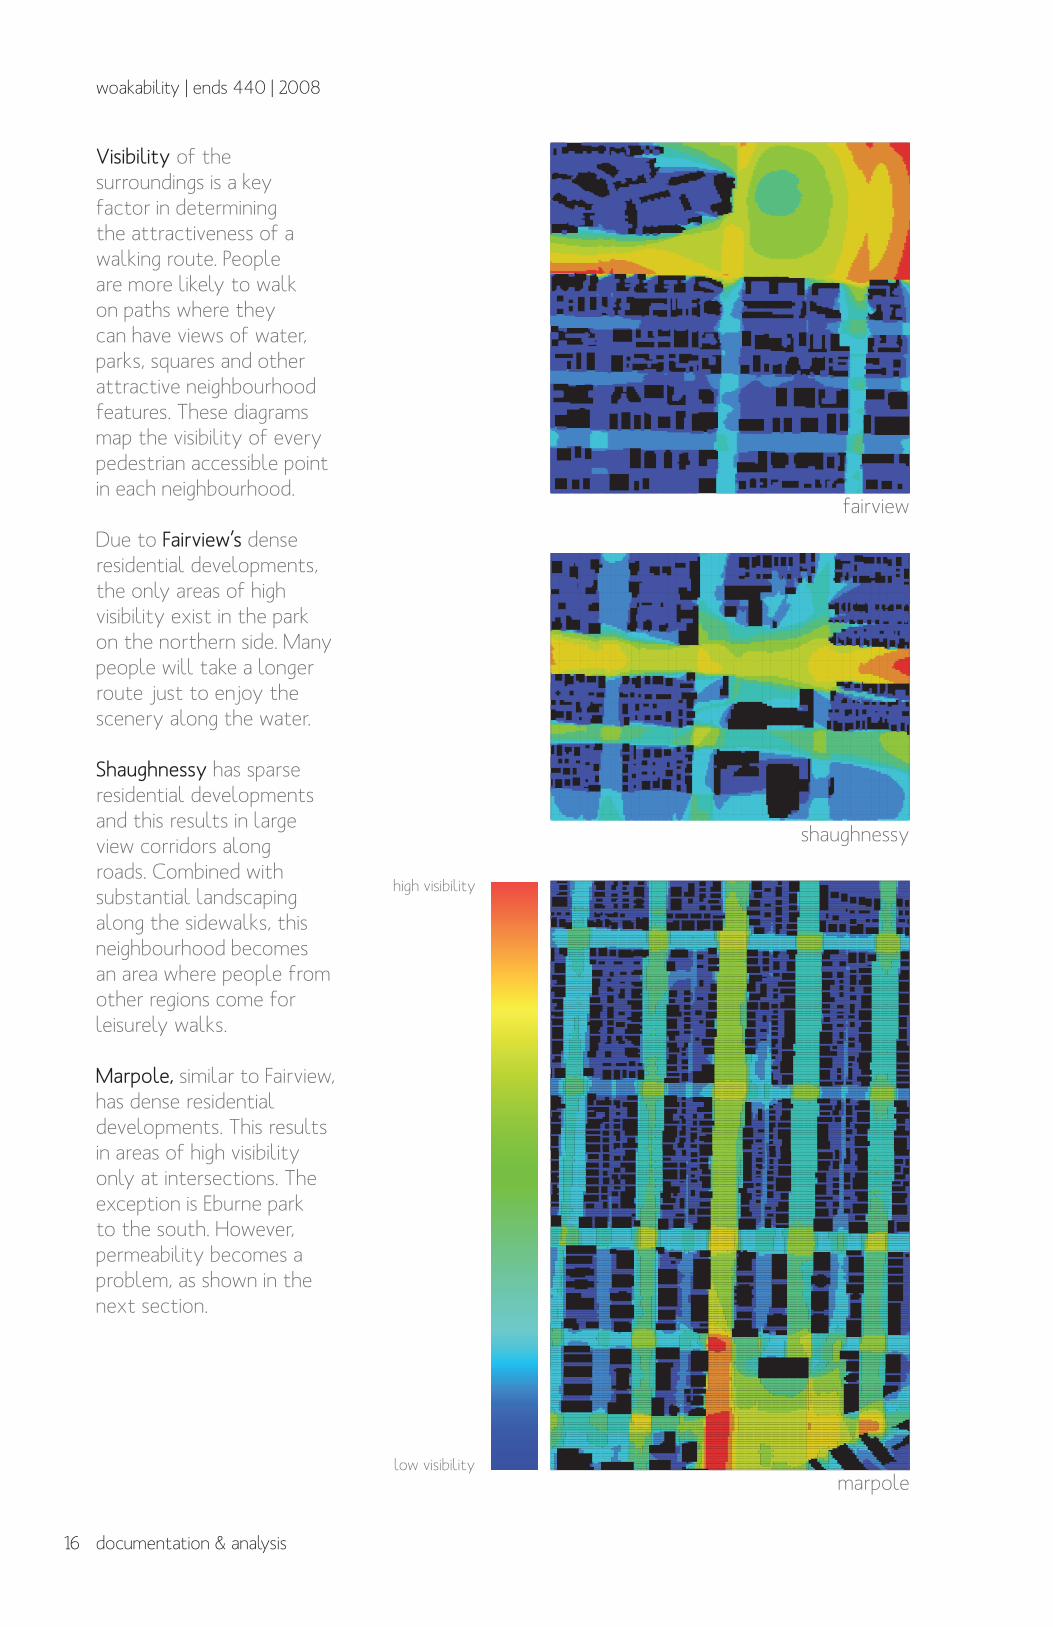
Visibility of the surroundings is a key factor in determining the attractiveness of a walking route. People are more likely to walk on paths where they can have views of water, parks, squares and other attractive neighbourhood features. These diagrams map the visibility of every pedestrian accessible point in each neighbourhood.
Due to Fairview’s dense residential developments, the only areas of high visibility exist in the park on the northern side. Many people will take a longer route just to enjoy the scenery along the water.
Shaughnessy has sparse residential developments and this results in large view corridors along roads. Combined with substantial landscaping along the sidewalks, this neighbourhood becomes an area where people from other regions come for leisurely walks.
Marpole, similar to Fairview, has dense residential developments. This results in areas of high visibility only at intersections. The exception is Eburne park to the south. However, permeability becomes a problem, as shown in the next section.
fairview
shaughnessy
marpolelow visibility
high visibility
17
woakability | ends 440 | 2008
documentation & analysis
Moderate
None
Heavy
Residential Mixed
Commercial General
Residential Detached
Civic General
Open Space Park
LAU
REL
ST
WIL
LOW
ST
W 26TH AVE
W 27TH AVE
OA
K ST
W 71TH AVE
OA
K ST
SW MARINE DR W 72TH AVE
SCHOOL GREEN
W 6TH AV
LAMEY'S MILL ROAD
Moderate
None
Heavy
Residential Mixed
Commercial General
Residential Detached
Civic General
Open Space Park
LAU
REL
ST
WIL
LOW
ST
W 26TH AVE
W 27TH AVE
OA
K ST
W 71TH AVE
OA
K ST
SW MARINE DR W 72TH AVE
SCHOOL GREEN
W 6TH AV
LAMEY'S MILL ROAD
Moderate
None
Heavy
Residential Mixed
Commercial General
Residential Detached
Civic General
Open Space Park
LAU
REL
ST
WIL
LOW
ST
W 26TH AVE
W 27TH AVE
OA
K ST
W 71TH AVE
OA
K ST
SW MARINE DR W 72TH AVE
SCHOOL GREEN
W 6TH AV
LAMEY'S MILL ROAD
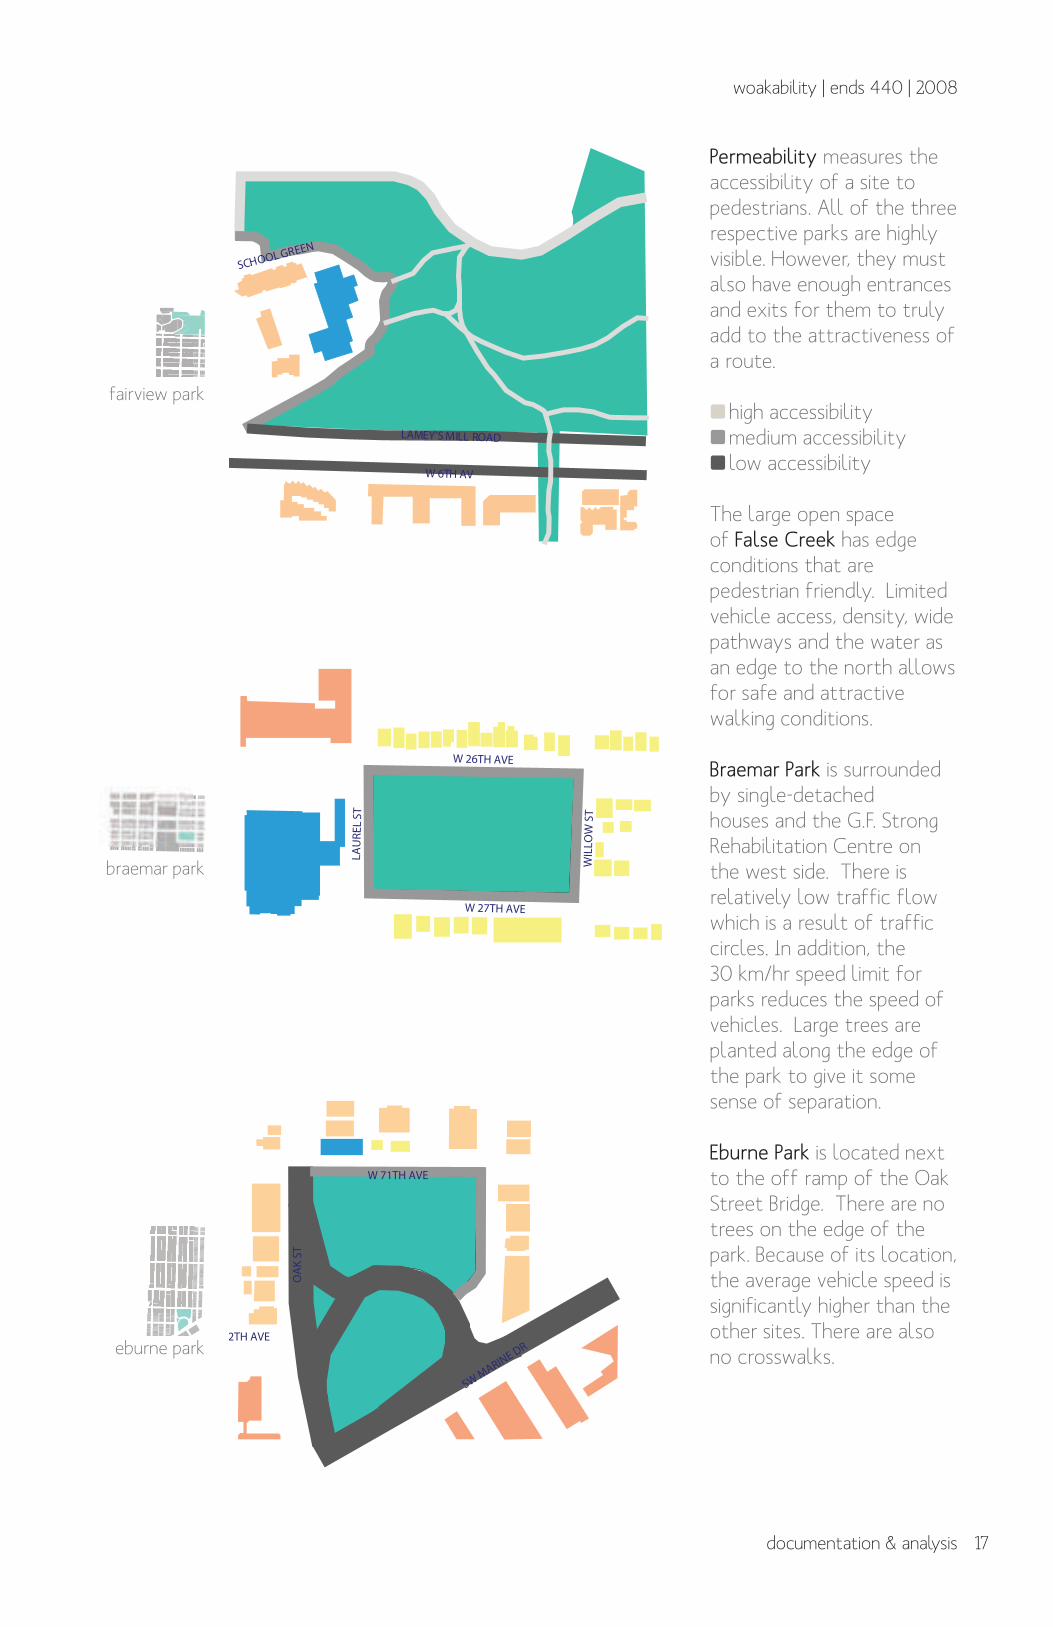
Permeability measures the accessibility of a site to pedestrians. All of the three respective parks are highly visible. However, they must also have enough entrances and exits for them to truly add to the attractiveness of a route.
}high accessibility}medium accessibility} low accessibility
The large open space of False Creek has edge conditions that are pedestrian friendly. Limited vehicle access, density, wide pathways and the water as an edge to the north allows for safe and attractive walking conditions.
Braemar Park is surrounded by single-detached houses and the G.F. Strong Rehabilitation Centre on the west side. There is relatively low traffic flow which is a result of traffic circles. In addition, the 30 km/hr speed limit for parks reduces the speed of vehicles. Large trees are planted along the edge of the park to give it some sense of separation.
Eburne Park is located next to the off ramp of the Oak Street Bridge. There are no trees on the edge of the park. Because of its location, the average vehicle speed is significantly higher than the other sites. There are also no crosswalks.
fairview park
braemar park
eburne park
18
woakability | ends 440 | 2008
documentation & analysis
SCHOOL GREEN
IRONWORK PASSAGE
W 7TH AV
W 6TH AV
OA
K ST
W BROADWAY
W 8TH AV
LA
UREL
ST
LAMEY'S MILL ROAD
FORGE WALK SCANTLINGS
SPR
UCE
ST
6
6
6
12
12
88
8
8
6
6
4 4
6
6
4
4
2
8
812
12
8
8
6
66
6
6
48
44
46
38
42
34
36
32
24
26
28
22
18
16
14
12
4
6
8
2
residential attached
residential detached
residential mixed
residential stacked
commercial general
commercial mixed
civic general
open space natural
open space park
street alley
street local
street collector
street arterial
18
14
48
44
46
3842
34
36
32
28
24
26
22
1416
18
12
4
6
8
OA
K ST
W 70TH AVE
W 67TH AVE
W 64TH AVE
W 71TH AVE
W 72TH AVE
OSL
ER S
T
SEL
KIRK
ST
SH
AU
GH
NES
SY S
T
FRE
MLI
N S
T
OA
K ST
W KING EDWARD
OSL
ER S
T
SEL
KIRK
ST
LAU
REL
ST
WIL
LOW
ST
W 23TH AVE
W 26TH AVE
W 27TH AVE
W 24TH AVE
74
74
74
74
72 72
68
68
68
6868
68
68
68
6666
68
68
72
72
84
82
78
72
74
76
68
64
66
58
62
56
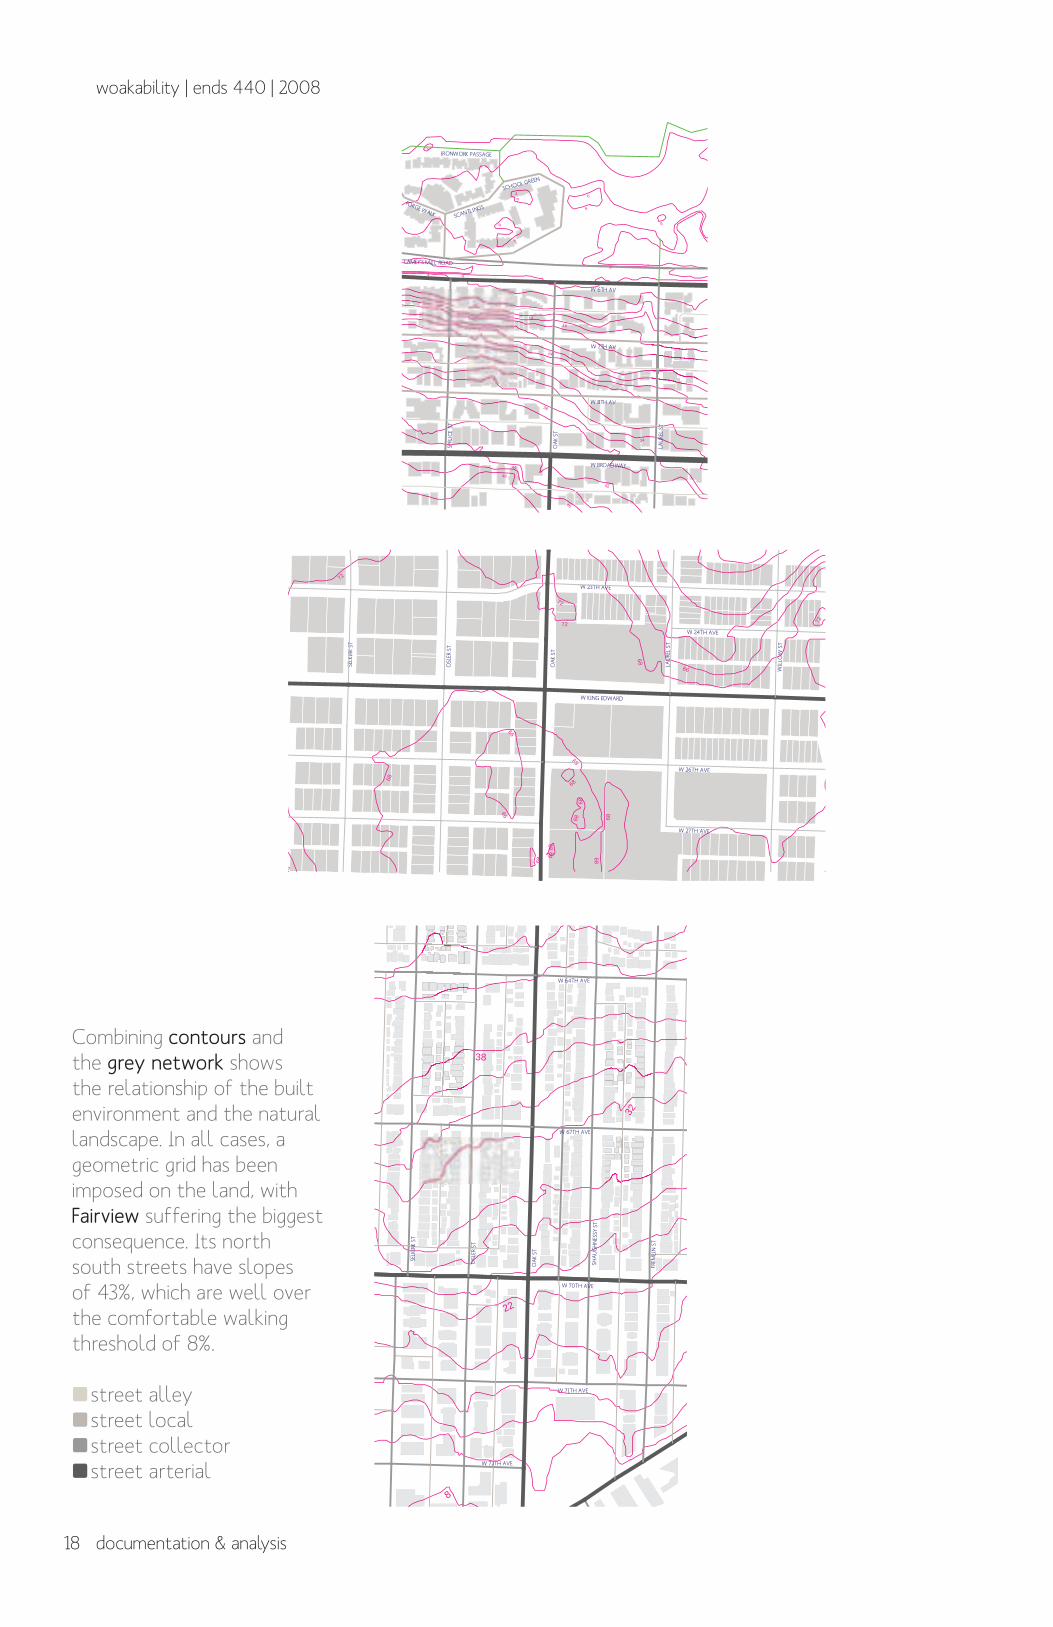
Combining contours and the grey network shows the relationship of the built environment and the natural landscape. In all cases, a geometric grid has been imposed on the land, with Fairview suffering the biggest consequence. Its north south streets have slopes of 43%, which are well over the comfortable walking threshold of 8%.
}street alley}street local}street collector}street arterial
19
woakability | ends 440 | 2008
documentation & analysis
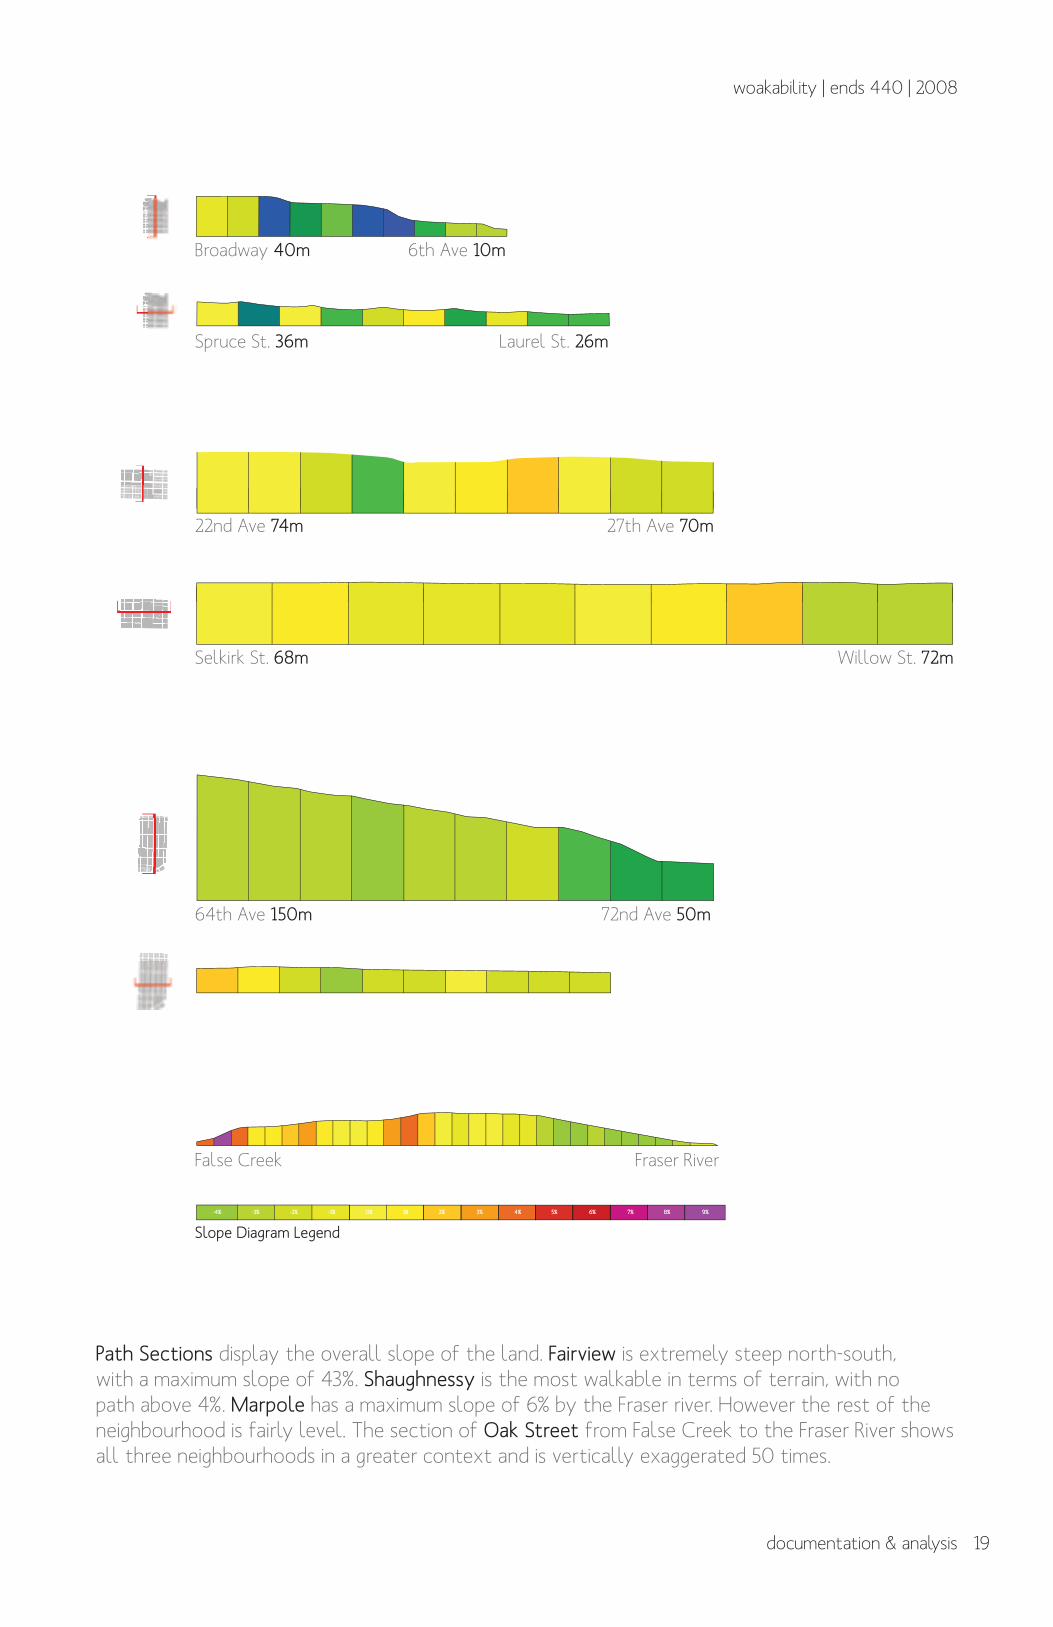
-4% -3% -2% -1% 0% 1% 2% 3% 4% 5% 6% 7% 8% 9%
]]
]]
]
]
64th Ave 150m 72nd Ave 50m
False Creek Fraser River
Slope Diagram Legend
Selkirk St. 68m Willow St. 72m
22nd Ave 74m 27th Ave 70m
Spruce St. 36m Laurel St. 26m
Broadway 40m 6th Ave 10m
Path Sections display the overall slope of the land. Fairview is extremely steep north-south, with a maximum slope of 43%. Shaughnessy is the most walkable in terms of terrain, with no path above 4%. Marpole has a maximum slope of 6% by the Fraser river. However the rest of the neighbourhood is fairly level. The section of Oak Street from False Creek to the Fraser River shows all three neighbourhoods in a greater context and is vertically exaggerated 50 times.
20
woakability | ends 440 | 2008
3
conclusion
CONCLUSION
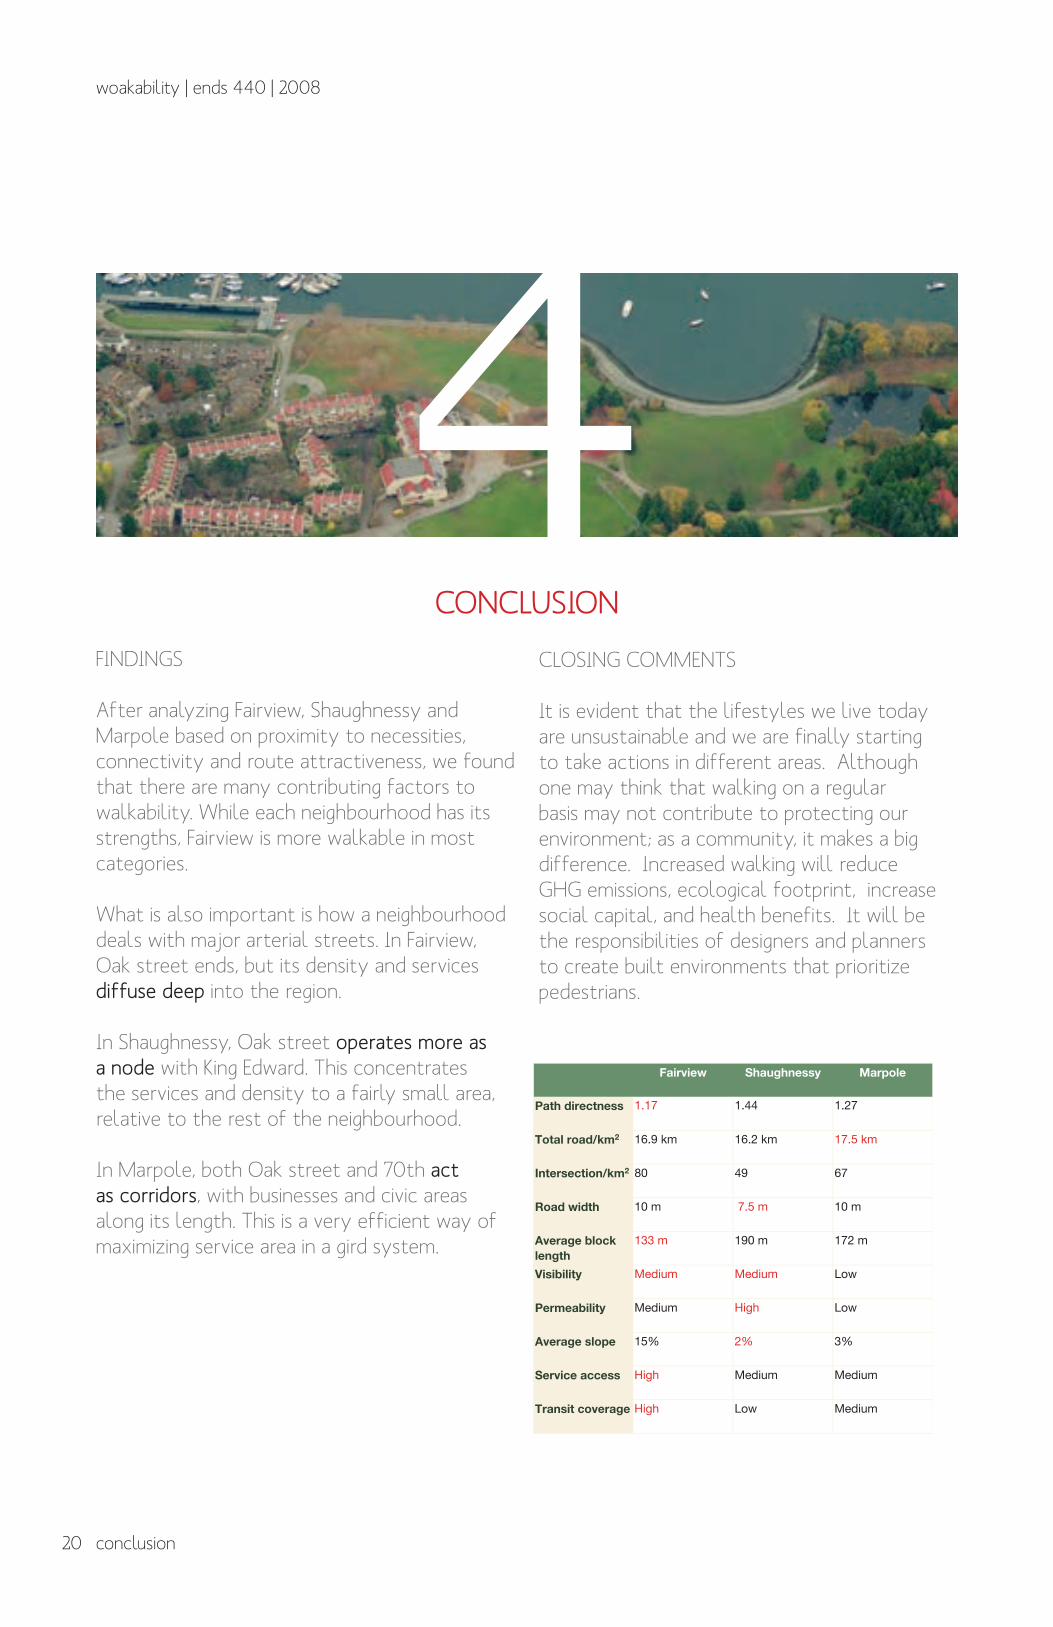
4Fairview Shaughnessy Marpole
Path directness
Total road/km2
Intersection/km2
Road width
Average block
length
Visibility
Permeability
Average slope
Service access
Transit coverage
1.17 1.44 1.27
16.9 km 16.2 km 17.5 km
80 49 67
10 m 7.5 m 10 m
133 m 190 m 172 m
Medium Medium Low
Medium High Low
15% 2% 3%
High Medium Medium
High Low Medium
FINDINGS
After analyzing Fairview, Shaughnessy and Marpole based on proximity to necessities, connectivity and route attractiveness, we found that there are many contributing factors to walkability. While each neighbourhood has its strengths, Fairview is more walkable in most categories.
What is also important is how a neighbourhood deals with major arterial streets. In Fairview, Oak street ends, but its density and services diffuse deep into the region.
In Shaughnessy, Oak street operates more as a node with King Edward. This concentrates the services and density to a fairly small area, relative to the rest of the neighbourhood.
In Marpole, both Oak street and 70th act as corridors, with businesses and civic areas along its length. This is a very efficient way of maximizing service area in a gird system.
CLOSING COMMENTS
It is evident that the lifestyles we live today are unsustainable and we are finally starting to take actions in different areas. Although one may think that walking on a regular basis may not contribute to protecting our environment; as a community, it makes a big difference. Increased walking will reduce GHG emissions, ecological footprint, increase social capital, and health benefits. It will be the responsibilities of designers and planners to create built environments that prioritize pedestrians.
3TOOLS
Depth Map http://www.vr.ucl.ac.uk/depthmap/
Google Earth http://earth.google.com/
Google Map http://maps.google.com/
Map My Walk http://www.mapmywalk.com
Microsoft Live Search Maps http://maps.live.com/
VanMap http://vancouver.ca/VanMap/
Walk Score http://www.walkscore.com
REFERENCES
City of Vancouver. 2001 - 2002 Pedestrian Study http://vancouver.ca/engsvcs/transport/pedstudy/index.htm
Community Services: Insights into Transportation http://vancouver.ca/commsvcs/cityplans/transportation/insightintotransportation.htm
Fairview Community Web Pages http://vancouver.ca/community_profiles/fairview/
Marpole Community Web Pages http://vancouver.ca/community_profiles/marpole/
Shaughnessy Community Web Pages http://vancouver.ca/community_profiles/shaughnessy/
Ewing, Reid H. Beyond Speed: The Next Generation of Transportation Performance Measure
Kansas City Walkability Plan. Measuring Walkability: Tools and Assessment
Krambeck, Holly. The Global walkability Index: Talk the Walk and Walk the Talk http://www.cleanairnet.org/caiasia/1412/articles-60499_paper.pdf
Metro Vancouver Sustainability Community Breakfast http://www.metrovancouver.org/region/breakfasts/Presentations/CreatingWalkableCommunities-CheeyingHo.pdf
Southworth, Michael. Designing the Walkable City
woakability | ends 440 | 2008
21tools & reference
TOOLS & REFERENCES
5
The sum of the whole is this: walk and be happy; walk and be healthy. The best way to lengthen out
our days is to walk steadily and with a purpose.
Charles Dickens


