Embed Size (px)
Citation preview
Walk in the Cloud: Learning Curves for Point Clouds Shape Analysis
Tiange XiangUniversity of Sydney
Chaoyi ZhangUniversity of Sydney
Yang SongUniversity of New South Wales
Jianhui YuUniversity of Sydney
Weidong CaiUniversity of Sydney
Abstract
Discrete point cloud objects lack sufficient shape de-scriptors of 3D geometries. In this paper, we present anovel method for aggregating hypothetical curves in pointclouds. Sequences of connected points (curves) are initiallygrouped by taking guided walks in the point clouds, andthen subsequently aggregated back to augment their point-wise features. We provide an effective implementation ofthe proposed aggregation strategy including a novel curvegrouping operator followed by a curve aggregation opera-tor. Our method was benchmarked on several point cloudanalysis tasks where we achieved the state-of-the-art clas-sification accuracy of 94.2% on the ModelNet40 classifica-tion task, instance IoU of 86.8% on the ShapeNetPart seg-mentation task and cosine error of 0.11 on the ModelNet40normal estimation task. Our project page with source codeis available at: https://curvenet.github.io/.
1. Introduction
The point cloud is a primary data structure in a string ofindoor/outdoor computer vision applications. A large vari-ety of 3D sensors (e.g. LiDAR sensors) are now able to cap-ture real-world objects, and their projections to digital formscan be made by sampling discrete points on the surface.To reach a better understanding of the 3D targets, effectivepoint cloud analysis techniques and methods are in great de-mand. With the thriving of deep learning, the pioneer works[27, 29] and their followers [21, 6, 44, 1, 43, 7, 18, 48] pro-cessed point clouds through well-designed neural networksto learn the latent mappings between input point coordinatesand the ground truth labels. Differing from conventional2D vision tasks, the points are usually in irregular and un-ordered forms, hence, effective design of feature aggrega-tion and message passing schemes among point clouds stillremains challenging.
Local feature aggregation is a basic operation that hasbeen widely studied recently. For each key point, its neigh-borhood point features are first grouped by pre-defined rules
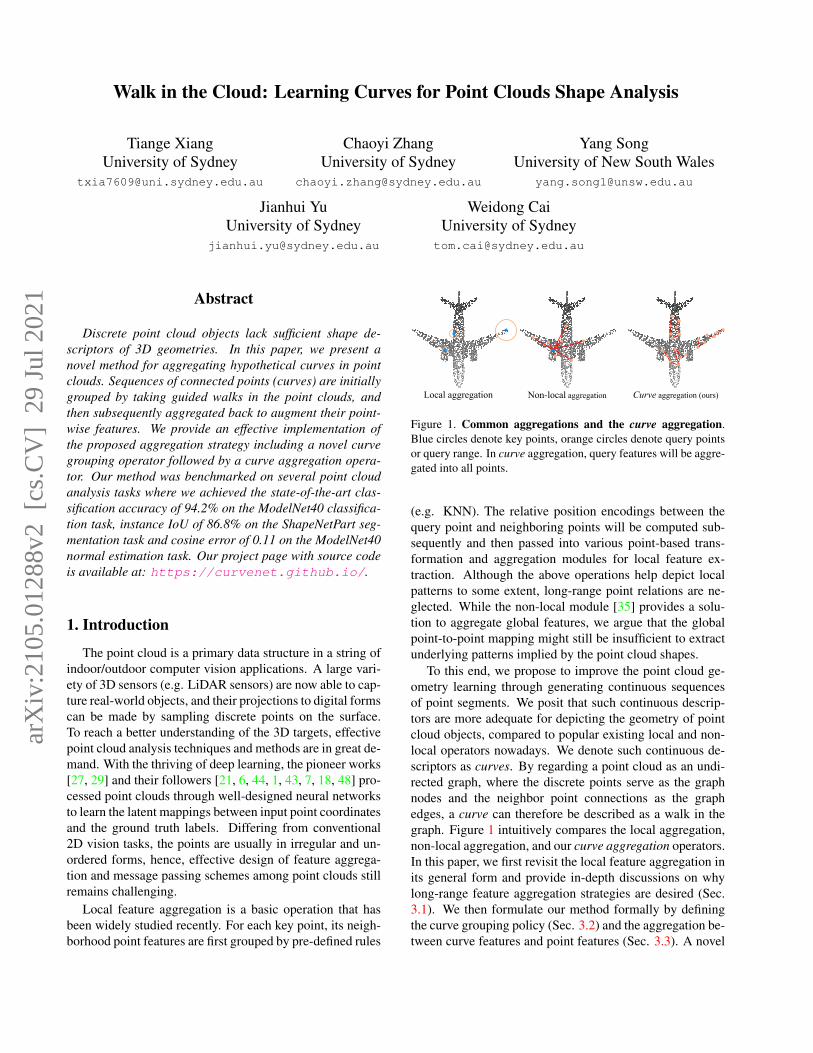
Local aggregation Non-local aggregation Curve aggregation (ours)
Figure 1. Common aggregations and the curve aggregation.Blue circles denote key points, orange circles denote query pointsor query range. In curve aggregation, query features will be aggre-gated into all points.
(e.g. KNN). The relative position encodings between thequery point and neighboring points will be computed sub-sequently and then passed into various point-based trans-formation and aggregation modules for local feature ex-traction. Although the above operations help depict localpatterns to some extent, long-range point relations are ne-glected. While the non-local module [35] provides a solu-tion to aggregate global features, we argue that the globalpoint-to-point mapping might still be insufficient to extractunderlying patterns implied by the point cloud shapes.
To this end, we propose to improve the point cloud ge-ometry learning through generating continuous sequencesof point segments. We posit that such continuous descrip-tors are more adequate for depicting the geometry of pointcloud objects, compared to popular existing local and non-local operators nowadays. We denote such continuous de-scriptors as curves. By regarding a point cloud as an undi-rected graph, where the discrete points serve as the graphnodes and the neighbor point connections as the graphedges, a curve can therefore be described as a walk in thegraph. Figure 1 intuitively compares the local aggregation,non-local aggregation, and our curve aggregation operators.In this paper, we first revisit the local feature aggregation inits general form and provide in-depth discussions on whylong-range feature aggregation strategies are desired (Sec.3.1). We then formulate our method formally by definingthe curve grouping policy (Sec. 3.2) and the aggregation be-tween curve features and point features (Sec. 3.3). A novel
arX
iv:2
105.
0128
8v2
[cs
.CV
] 2
9 Ju
l 202
1
point cloud processing network, CurveNet, is constructedby integrating the proposed modules along with several ba-sic building blocks into a ResNet [4] style network.
Our main contributions are three-fold: (1) We propose anovel feature aggregation paradigm for point cloud shapeanalysis. Sequences of points (curves) are grouped andaggregated for better depiction of point cloud object ge-ometries. A novel curve grouping operator along with acurve aggregation operator are proposed to achieve curvefeature propagation. (2) We study potential drawbacks ofgrouping loops and provide our solutions to alleviate them.Moreover, a dynamic encoding strategy is proposed so thatcurves can contain richer information while suppressing po-tential crossovers. (3) We embed the curve modules into anetwork named CurveNet, which achieves state-of-the-artresults on the object classification, normal estimation, andobject part segmentation tasks.
2. Related Works3D point cloud processing. One of the greatest challengesto point cloud analysis is processing unstructured represen-tations. Starting from indirect representation transformationmethods [17, 11, 30, 14] that first transform the point cloudinto another representation (e.g. octree, kdtree) to ease theanalysis difficulty, many recent works [27, 47, 6] extractfeatures from the raw point cloud directly.
As one of the pioneer direct approaches, Point-Net/PointNet++ [27, 29] utilize shared MLPs to learn point-wise features. Following them, recent works have extendedthe point-wise method to various directions, which includedesigning advanced convolution operations [12, 43, 38, 20],considering a wider neighborhood [15, 50, 36, 22], and theadaptive aggregation of it [6, 44, 49, 45]. The success of theabove methods is inseparable from the help of feature ag-gregation operators, which achieve the direct message pass-ing of discrete points in deep networks.
Current feature aggregation operators can be generallyclassified into two categories: local feature aggregation andnon-local feature aggregation. As a representative of lo-cal aggregation operator, EdgeConv [36] learns semanticdisplacement between key points and their feature-spaceneighbors. The thrive of non-local aggregation operatorstarts from the non-local network [35], with which globalfeatures are transformed and aggregated together to learnmany-to-one feature mappings. With the recent success ofapplying Transformer [34] in vision tasks, Guo et al. [3]designed a point cloud processing architecture comprisedof simple Transformers.
Beyond the local and non-local feature aggregation op-erators, we suggest that point cloud analysis can be bet-ter achieved with special consideration of shape segments,edges, and curves. By aggregating the additional curve fea-tures, latent feature information can be enriched.
Sampling techniques for 3D point cloud. Samplingtechnologies aggregate indicative point patterns and arehence essential to all point cloud processing methods.Voxelization-based approaches [28, 37, 39, 24] transformthe discrete point space into 3D grid (voxels), where theinput point clouds behave as the discrete sampling on acontinuous 3D space. However, the quality of such sam-pling is highly sensitive to the subdivision frequency. Simi-lar to voxelization-based sampling methods, view-based ap-proaches [33, 10, 40] start from capturing 2D snapshots ofpoint clouds from different angles, and make predictionsbased on the 2D images. The loss of spatial information isinevitable during such image samplings.
Advanced sampling methods from recent literaturesovercome the above drawbacks, and obtain promising re-sults on basic point cloud analysis tasks. GS-Net [42]exploits an Eigen-Graph to group points with similar Eu-clidean distance and geometric information. PointASNL[44] samples both adjacent and global points for a com-plete description of point cloud objects. Unlike the abovemethods, PAT [45] models point clouds with the help of aTransformer [34] and learns the point sampling through aGumbel-Softmax gate. RandLA-Net [6] reviews multiplesampling techniques and adopts the random sampling forefficiently processing large scale point clouds. In a con-current work, MeshWalker [13] also experiments on tak-ing random walks on mesh surfaces for better mesh anal-ysis. Differing from all existing sampling methods, wetake guided walks to group contiguous segments of pointsas curves, which contain rich information describing objectshapes and geometry.
3. MethodsIn this section, we present the proposed operators to
group and aggregate curves for any point cloud P = {p}and its point-wise features F = {f}. As aforementioned, acurve represents a connected sequence of points in the pointcloud, and can be formally defined as:
Definition 1. Curves in point cloud. Given P, F and anisomorphic graph G = (F,E) with the connectivity Ecomputed by the KNN algorithm on P. A curve c withlength l in feature space, is generated as a sequence of pointfeatures in F, such that c = {s1, · · · , sl|s ∈ F}. To groupcurves, we consider a walk policy π defined on the isomor-phic graph G that starts a walk (curve) from a starting points1 and transits for l steps.
3.1. Rethinking Local Feature Aggregation
The general purpose of local feature aggregation is tolearn the underlying patterns within a local space of kelements. For each point p, the neighborhood N ={p1, · · · ,pk} is first grouped by a deterministic rule, and
Laye
r 1La
yer 2
Laye
r 3
A
B
C
C
B
A
Max-Pooling Avg-Pooling
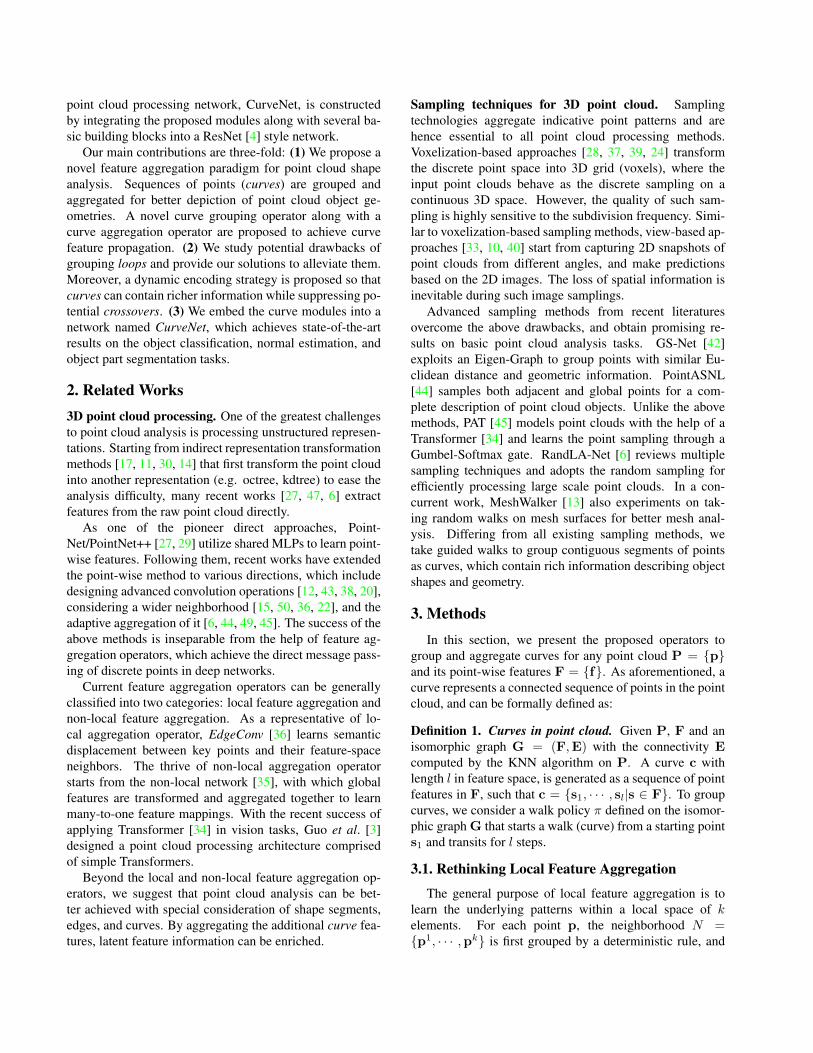
Figure 2. Left: A point cloud projected on the 2D plane. Lefttop: Three key points and their k=9 query neighbors. Left bot-tom: A possible curve through the three key points connected byred lines. Curve aggregation fuses the features along the curve.Right: Visualizations of the averaged channel g of a ModelNet40chair object under different layers of local feature aggregation anddifferent pooling strategies.
KNN is the most frequently used grouping algorithm [6, 44,21, 47] due to its computational efficiency. Then, pair-wisedifferences Φ between every two elements in N are com-puted and stacked together. Finally, shared MLPs are em-ployed to further aggregate the computed encodings leadingto the locally aggregated features g. Formally, the above lo-cal feature aggregation process can be formulated as:
g = pooling({MLP(Φ(f , f j)|f j ∈ N)}). (1)
Using Manhattan distance Φ(f , f j) = f − f j as the rel-ative encoding is the most natural practice and has beenwidely adopted. However, we argue that such encodingmethod does not provide abundant relative signals sincemost g in a point cloud contains nearly identical informa-tion in the same feature channel (regardless of pooling strat-egy), especially in shallow layers, as shown in Figure 2. Asthe raw point cloud sampled from an explicit representationR of 3D objects is unordered, the point cloud P can be re-garded as a set of random variables sampled in a particularprobability density function (PDF) U modeled on R, suchthat P ∼ U(R). After propagating through a certain num-ber of network layers, F becomes the transformation overthe random variable set P.
We first consider an extreme case where F representsthe initial point features, such that F = P. Using a sim-ple 2D plane (Figure 2 left) as an exemplary R, the sparsepoints are scattered on a compact subspace of R2. In Fig-ure 2 left top, three key points are highlighted with theirKNN computed neighbors. It can be practically observedthat, after sampling the points, {pA − pj
A} and {pB − pjB}
are most likely to have similar values, as the key points aresurrounded by their query neighbors in a similar pattern.However, point C at the boundary (an edge or an irregu-lar segment of surface in 3D space) stands as an exception.
Restricted by the geometry of R, the distribution of pointC query neighbors is considerably different than A and B,which leads to varying {pC − pj
C}.Based on the above observation, we claim that in any
structured PDF that ensures the same sampling behaviouron similar geometries, g in Eq. 1 is dependent on the distri-bution of F and P. Point cloud objects, which have similargeometry information at most parts, turn out encoding sim-ilar and indistinguishable information in g. As shown inFigure 2 right, the chair’s back and seat have close features,especially in shallow layers. One possible strategy to enrichg is using more relative encoding rules rather than element-wise difference solely [6, 1]. In this paper, we enrich thelocal features g by combining the features aggregated fromcurves, as illustrated in Figure 2 left bottom. Each curvecovers a long path in the point cloud encoding unique geo-metric information, which could be used to further increasepoint feature diversity.
3.2. Curve Grouping
In this subsection, we present the details on groupingcurves in the feature space of point clouds. The startingpoint of a curve is essential to the overall grouping qual-ity. To group n curves simultaneously, the starting point setin Rn×||f || needs to be determined beforehand. Borrowingthe top-k selection method from [2], we employ a sigmoidgated MLP to learn the selection score for each of the pointfeatures in F. The starting points are the points with top nscores. To enable gradient flow, we multiply the scores backto F via a self-attention manner.
After the construction of the starting point set, a walkW then starts from one of the starting points s1 and transitsfor exactly l steps. The points traveled by W are groupedto form a curve c. Given an intermediate state of curve si(si numerically equals fi when grouping curves in featurespace) arrived after walking for i steps, we are interested infinding a walk policy π(si) that determines the next stateof curve at the i + 1 step. With a predefined π(·), a curvec = {s1, · · · , sl} can be finally grouped by executing thefollowing equation iteratively for l times:
si+1 = π(si), 1 <= i ∈ Z+ <= l. (2)
A good π(·) is essential to guarantee an effective curvegrouping. Instead of a deterministic policy, we present alearnable π(·) that can be optimized along with the back-bone network. In more detail, for a state s, we apply MLPson a state descriptor hs ∈ R2||s|| to decide the next step. Astate descriptor is constructed as the concatenation of pointfeature si and a curve descriptor ri, which will be intro-duced later in this subsection. Selection logits α on allneighboring points in Ns can therefore be learned via theMLPs. We then feed α to a scoring function (e.g. softmax)to distribute each of the neighbors a score-based multiplier
sisi-1 si
si+1
si-1
s1 s2
s3
s4s5
sisi-1
N!ssi
si-1
s1 s2
s3
s4s5
! 𝑓(α)1! 𝑓(α)2
! 𝑓(α)3
! 𝑓(α)4! 𝑓(α)5𝑓=argmax
one-hot
𝑓=softmax
Eq. 3.
Eq. 5.
si-1
sic#
q#$
(s#$)
q#%
q#&
q#'q#(
s#%
s#&
s#'s#(
s!"
si
θ
d!" =cos(θ)+1
s!#
siθ
d!# =1 support vector
curve trajectory
forward backward
candidate trajectory (vector)
key point query point
curve descriptor
tolerance
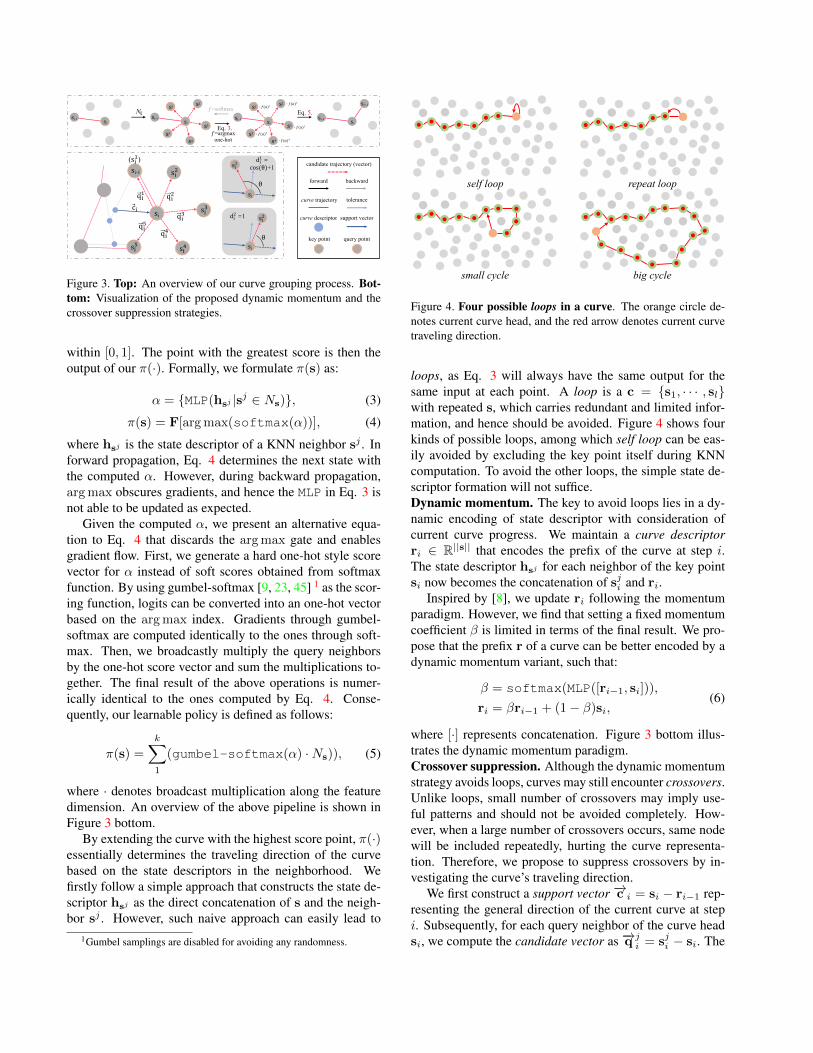
Figure 3. Top: An overview of our curve grouping process. Bot-tom: Visualization of the proposed dynamic momentum and thecrossover suppression strategies.
within [0, 1]. The point with the greatest score is then theoutput of our π(·). Formally, we formulate π(s) as:
α = {MLP(hsj |sj ∈ Ns)}, (3)
π(s) = F[arg max(softmax(α))], (4)
where hsj is the state descriptor of a KNN neighbor sj . Inforward propagation, Eq. 4 determines the next state withthe computed α. However, during backward propagation,arg max obscures gradients, and hence the MLP in Eq. 3 isnot able to be updated as expected.
Given the computed α, we present an alternative equa-tion to Eq. 4 that discards the arg max gate and enablesgradient flow. First, we generate a hard one-hot style scorevector for α instead of soft scores obtained from softmaxfunction. By using gumbel-softmax [9, 23, 45] 1 as the scor-ing function, logits can be converted into an one-hot vectorbased on the arg max index. Gradients through gumbel-softmax are computed identically to the ones through soft-max. Then, we broadcastly multiply the query neighborsby the one-hot score vector and sum the multiplications to-gether. The final result of the above operations is numer-ically identical to the ones computed by Eq. 4. Conse-quently, our learnable policy is defined as follows:
π(s) =
k∑1
(gumbel-softmax(α) ·Ns)), (5)
where · denotes broadcast multiplication along the featuredimension. An overview of the above pipeline is shown inFigure 3 bottom.
By extending the curve with the highest score point, π(·)essentially determines the traveling direction of the curvebased on the state descriptors in the neighborhood. Wefirstly follow a simple approach that constructs the state de-scriptor hsj as the direct concatenation of s and the neigh-bor sj . However, such naive approach can easily lead to
1Gumbel samplings are disabled for avoiding any randomness.
(a) (b)
(c) (d)
self loop repeat loop
small cycle big cycle
Figure 4. Four possible loops in a curve. The orange circle de-notes current curve head, and the red arrow denotes current curvetraveling direction.
loops, as Eq. 3 will always have the same output for thesame input at each point. A loop is a c = {s1, · · · , sl}with repeated s, which carries redundant and limited infor-mation, and hence should be avoided. Figure 4 shows fourkinds of possible loops, among which self loop can be eas-ily avoided by excluding the key point itself during KNNcomputation. To avoid the other loops, the simple state de-scriptor formation will not suffice.Dynamic momentum. The key to avoid loops lies in a dy-namic encoding of state descriptor with consideration ofcurrent curve progress. We maintain a curve descriptorri ∈ R||s|| that encodes the prefix of the curve at step i.The state descriptor hsj for each neighbor of the key pointsi now becomes the concatenation of sji and ri.
Inspired by [8], we update ri following the momentumparadigm. However, we find that setting a fixed momentumcoefficient β is limited in terms of the final result. We pro-pose that the prefix r of a curve can be better encoded by adynamic momentum variant, such that:
β = softmax(MLP([ri−1, si])),
ri = βri−1 + (1− β)si,(6)
where [·] represents concatenation. Figure 3 bottom illus-trates the dynamic momentum paradigm.Crossover suppression. Although the dynamic momentumstrategy avoids loops, curves may still encounter crossovers.Unlike loops, small number of crossovers may imply use-ful patterns and should not be avoided completely. How-ever, when a large number of crossovers occurs, same nodewill be included repeatedly, hurting the curve representa-tion. Therefore, we propose to suppress crossovers by in-vestigating the curve’s traveling direction.
We first construct a support vector −→c i = si − ri−1 rep-resenting the general direction of the current curve at stepi. Subsequently, for each query neighbor of the curve headsi, we compute the candidate vector as −→q j
i = sji − si. The
CIC
CIC
TSH
. . .
“Chair”
CIC
KNN
FPS
MLP
MLP
LPFA
Curve Intervention Convolution
CA TSHsegmentation
classification
Local Point-Feature Aggregation
LPFA
CurveNet
MLP MLP
AP
MLP
MLP MLP
Concat
3 x N
Cin x N
N = N/4 if stride
Cout x N
C x N
idx:N x k
F: C x N
F: C x N
C x N x k
Cout x N
C x N
MLP
CA
Curve GroupingSec 3.2
Top-K Selectionn x N
C x nx l
C x N
C x N
LPFA
MLP
Concat(P, Pk, Pk-P)Fk - FF: C x N idx:N x k P: 3 x N
9 x N x k
C x N x k
C x N x k
C x N x k
C x N x k
MLP
Average PoolingC x N x k
C x N
Curve Aggregation
Task-Specified Head
MLP
Linear
S
Max Pooling Linear + DP
C x nx l
C x nC x l F: C x N
Cmid x l Cmid x nCmid x N
Nx l Nx nCmid x l Cmid x n
Cmid x N Cmid x N
2Cmid x N
C x N
: matrixmultiplication
AP: AttentivePooling
C x N
Average Pooling Max Pooling
512 x N
1024 x N
1024 x N
1024 x 1 1024 x 1
2048 x 1
512 x 1
#classes x 1
Up + CIC
Up + CIC
Linear + DP
#classes x N
1024 x N1
128 x N’
64 x N
512 x N1
64 x N
Inside CIC
Outside CIC
. . .
Linear
192 x N
256 x N
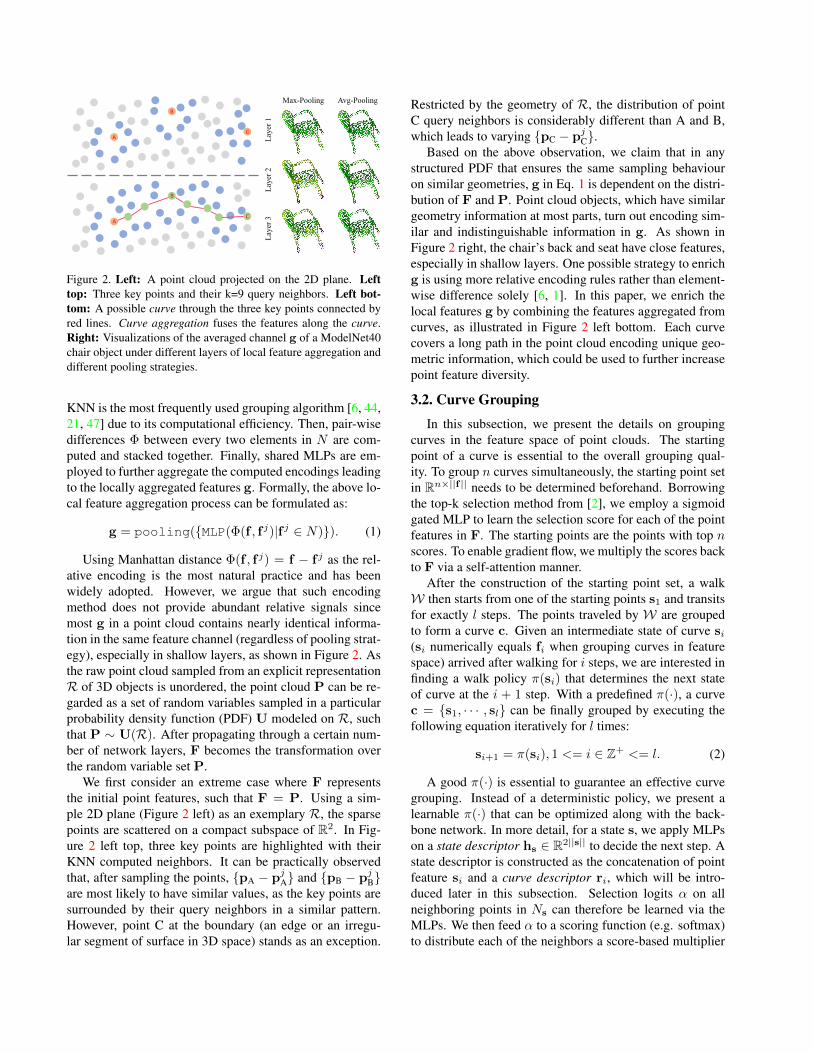
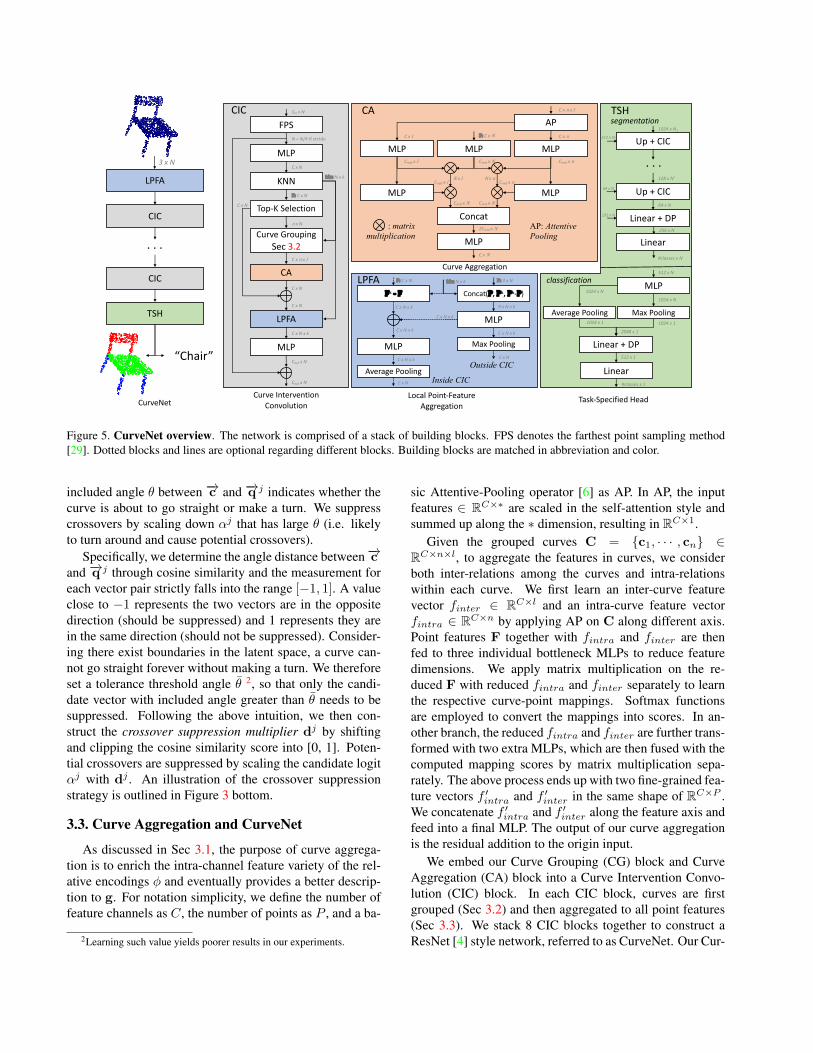
Figure 5. CurveNet overview. The network is comprised of a stack of building blocks. FPS denotes the farthest point sampling method[29]. Dotted blocks and lines are optional regarding different blocks. Building blocks are matched in abbreviation and color.
included angle θ between −→c and −→q j indicates whether thecurve is about to go straight or make a turn. We suppresscrossovers by scaling down αj that has large θ (i.e. likelyto turn around and cause potential crossovers).
Specifically, we determine the angle distance between−→cand −→q j through cosine similarity and the measurement foreach vector pair strictly falls into the range [−1, 1]. A valueclose to −1 represents the two vectors are in the oppositedirection (should be suppressed) and 1 represents they arein the same direction (should not be suppressed). Consider-ing there exist boundaries in the latent space, a curve can-not go straight forever without making a turn. We thereforeset a tolerance threshold angle θ 2, so that only the candi-date vector with included angle greater than θ needs to besuppressed. Following the above intuition, we then con-struct the crossover suppression multiplier dj by shiftingand clipping the cosine similarity score into [0, 1]. Poten-tial crossovers are suppressed by scaling the candidate logitαj with dj . An illustration of the crossover suppressionstrategy is outlined in Figure 3 bottom.
3.3. Curve Aggregation and CurveNet
As discussed in Sec 3.1, the purpose of curve aggrega-tion is to enrich the intra-channel feature variety of the rel-ative encodings φ and eventually provides a better descrip-tion to g. For notation simplicity, we define the number offeature channels as C, the number of points as P , and a ba-
2Learning such value yields poorer results in our experiments.
sic Attentive-Pooling operator [6] as AP. In AP, the inputfeatures ∈ RC×∗ are scaled in the self-attention style andsummed up along the ∗ dimension, resulting in RC×1.
Given the grouped curves C = {c1, · · · , cn} ∈RC×n×l, to aggregate the features in curves, we considerboth inter-relations among the curves and intra-relationswithin each curve. We first learn an inter-curve featurevector finter ∈ RC×l and an intra-curve feature vectorfintra ∈ RC×n by applying AP on C along different axis.Point features F together with fintra and finter are thenfed to three individual bottleneck MLPs to reduce featuredimensions. We apply matrix multiplication on the re-duced F with reduced fintra and finter separately to learnthe respective curve-point mappings. Softmax functionsare employed to convert the mappings into scores. In an-other branch, the reduced fintra and finter are further trans-formed with two extra MLPs, which are then fused with thecomputed mapping scores by matrix multiplication sepa-rately. The above process ends up with two fine-grained fea-ture vectors f ′intra and f ′inter in the same shape of RC×P .We concatenate f ′intra and f ′inter along the feature axis andfeed into a final MLP. The output of our curve aggregationis the residual addition to the origin input.
We embed our Curve Grouping (CG) block and CurveAggregation (CA) block into a Curve Intervention Convo-lution (CIC) block. In each CIC block, curves are firstgrouped (Sec 3.2) and then aggregated to all point features(Sec 3.3). We stack 8 CIC blocks together to construct aResNet [4] style network, referred to as CurveNet. Our Cur-
veNet initially learns a relative local encoding of the inputpoint coordinates through the Local Point-Feature Aggrega-tion (LPFA) block, which projects the relative point differ-ence into a higher dimension. CurveNet eventually makespredictions through the Task-Specified Head (TSH) regard-ing of different point cloud processing tasks. For classi-fication task, the extracted point features are first pooledand then passed into two fully-connected layers. For seg-mentation task, we use an attention U-Net [25] style de-coder that concatenates attentive shortcut connections fromthe encoder. Figure 5 gives an overview of our CurveNet.Network structure and building block details are presentedin the supplemental materials.
4. ExperimentsWe present experimental results for our point cloud ob-
ject analysis methods on object classification, shape partsegmentation, and normal estimation tasks.
4.1. Implementation Details
In all experiments, Dropout layers [32] were adoptedin final linear layers with probability 0.5 [36]. We usedLeakyReLU as the activation function in the backbone sub-network and ReLU in the task-specific heads. θ was setto 90◦. To eliminate the influence of randomness, randomseed was fixed in all experiments, which were implementedin the PyTorch framework [26].
For classification tasks, we used SGD with momentum0.9 as the optimizer and set the number of neighbors inKNN to 20. For segmentation tasks, the number of KNNneighbors was set dynamically according to different radiuswith no more than 32. The point features were interpolatedsimilar to [27] during upsampling. The distances betweenpredictions and ground truth labels were minimized throughcross entropy loss.
4.2. Benchmarks
Object classification. ModelNet 10/40 datasets [39] arethe most commonly used datasets for object shape classi-fication benchmarks, which collect meshed CAD modelsacross a variety of objects. ModelNet10 dataset is com-prised of 4899 individual models that are distributed into10 different categories. We split the training and testingsamples following the same schema as in [19]. In a largerhomogeneous dataset, ModelNet40 consists of 12311 mod-els that are classified into 40 categories. In both datasets,we only used the coordinates of 1024 uniformly sampledpoints as network inputs. The points were normalized intounit spheres before feeding into networks. A random scal-ing multiplier within the range [0.66, 1.5] was first multi-plied on the sampled points. Then, each point was trans-lated along the three directions by random displacementswithin [-0.2, 0.2]. The scaling and translation settings were
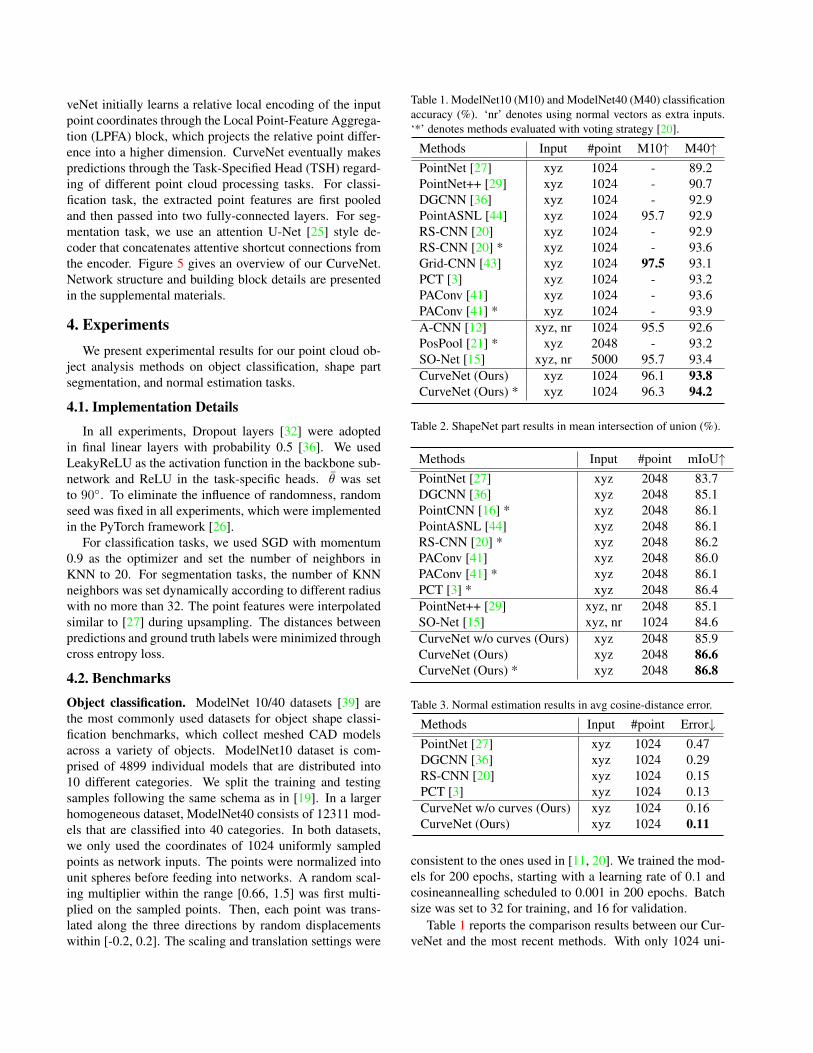
Table 1. ModelNet10 (M10) and ModelNet40 (M40) classificationaccuracy (%). ‘nr’ denotes using normal vectors as extra inputs.‘*’ denotes methods evaluated with voting strategy [20].
Methods Input #point M10↑ M40↑PointNet [27] xyz 1024 - 89.2PointNet++ [29] xyz 1024 - 90.7DGCNN [36] xyz 1024 - 92.9PointASNL [44] xyz 1024 95.7 92.9RS-CNN [20] xyz 1024 - 92.9RS-CNN [20] * xyz 1024 - 93.6Grid-CNN [43] xyz 1024 97.5 93.1PCT [3] xyz 1024 - 93.2PAConv [41] xyz 1024 - 93.6PAConv [41] * xyz 1024 - 93.9A-CNN [12] xyz, nr 1024 95.5 92.6PosPool [21] * xyz 2048 - 93.2SO-Net [15] xyz, nr 5000 95.7 93.4CurveNet (Ours) xyz 1024 96.1 93.8CurveNet (Ours) * xyz 1024 96.3 94.2
Table 2. ShapeNet part results in mean intersection of union (%).
Methods Input #point mIoU↑PointNet [27] xyz 2048 83.7DGCNN [36] xyz 2048 85.1PointCNN [16] * xyz 2048 86.1PointASNL [44] xyz 2048 86.1RS-CNN [20] * xyz 2048 86.2PAConv [41] xyz 2048 86.0PAConv [41] * xyz 2048 86.1PCT [3] * xyz 2048 86.4PointNet++ [29] xyz, nr 2048 85.1SO-Net [15] xyz, nr 1024 84.6CurveNet w/o curves (Ours) xyz 2048 85.9CurveNet (Ours) xyz 2048 86.6CurveNet (Ours) * xyz 2048 86.8
Table 3. Normal estimation results in avg cosine-distance error.
Methods Input #point Error↓PointNet [27] xyz 1024 0.47DGCNN [36] xyz 1024 0.29RS-CNN [20] xyz 1024 0.15PCT [3] xyz 1024 0.13CurveNet w/o curves (Ours) xyz 1024 0.16CurveNet (Ours) xyz 1024 0.11
consistent to the ones used in [11, 20]. We trained the mod-els for 200 epochs, starting with a learning rate of 0.1 andcosineannealling scheduled to 0.001 in 200 epochs. Batchsize was set to 32 for training, and 16 for validation.
Table 1 reports the comparison results between our Cur-veNet and the most recent methods. With only 1024 uni-
A curve Another curve Curve aggregated feature Point feature
Figure 6. Visualizations of curves and curve features. Left:Loops are avoided and crossovers are suppressed in the groupedcurves. Right: Point features can be enriched by combining thelong-range curve features.
formly sampled points, our method achieved the state-of-the-art result on the large scale ModelNet40 dataset at93.8% without voting [20] and reached 94.2% when av-erages 10 prediction votes. We also achieved 96.3% onthe ModelNet10 subset, which is the second best resultamong all methods with the same training data. Moreover,CurveNet is a highly memory-efficient architecture that re-quires only 4.1 G GPU memory for training while DGCNN[36] requires 5.9 G. We visualize the grouped curves, thelocal aggregated features, and the curve aggregated fea-tures on two randomly selected channels in Figure 6. Thecurves are able to cover long-range semantics and hencebring channel diversity to a great extent.Object part segmentation. We validated our method onthe ShapeNetPart dataset [46] for the 3D shape part seg-mentation task. The dataset collects 16881 shape modelsacross 16 categories. Most objects in the dataset have beenlabeled with less than 6 parts, results in a total number of50 different parts. Our training and testing split scheme fol-lows [27, 29], such that 12137 models were used as trainingsamples while the rest were used as validation. 2048 pointswere uniformly sampled from each model to be the input toour networks. We trained the models for 200 epochs withbatch size 32, starting with a learning rate of 0.05 which de-cayed by 0.1 at the 140th and 180th epoch. The momentumand weight decay are set to 0.9 and 0.0001, respectively. Weinserted a simple SE [5] module before the last linear layerof our CurveNet. Same to [20, 1], the one-hot class labelvector and global feature vectors are also adopted.
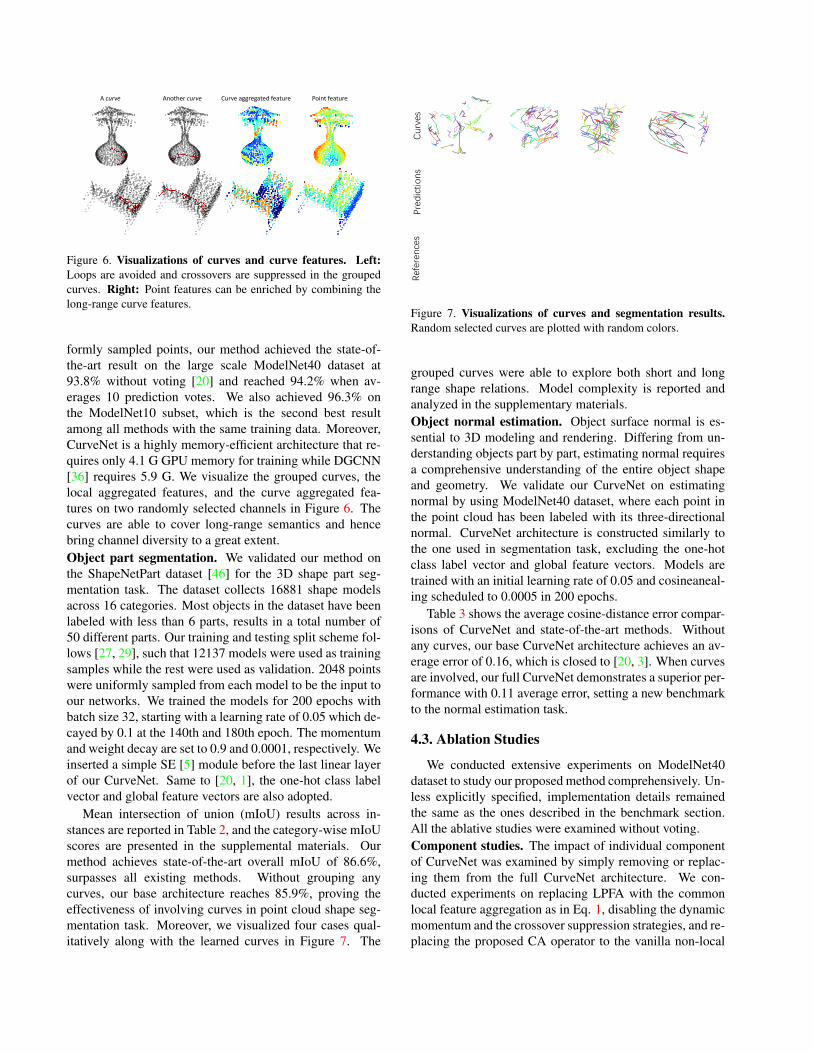
Mean intersection of union (mIoU) results across in-stances are reported in Table 2, and the category-wise mIoUscores are presented in the supplemental materials. Ourmethod achieves state-of-the-art overall mIoU of 86.6%,surpasses all existing methods. Without grouping anycurves, our base architecture reaches 85.9%, proving theeffectiveness of involving curves in point cloud shape seg-mentation task. Moreover, we visualized four cases qual-itatively along with the learned curves in Figure 7. The
Curves
Predictions
References
Figure 7. Visualizations of curves and segmentation results.Random selected curves are plotted with random colors.
grouped curves were able to explore both short and longrange shape relations. Model complexity is reported andanalyzed in the supplementary materials.Object normal estimation. Object surface normal is es-sential to 3D modeling and rendering. Differing from un-derstanding objects part by part, estimating normal requiresa comprehensive understanding of the entire object shapeand geometry. We validate our CurveNet on estimatingnormal by using ModelNet40 dataset, where each point inthe point cloud has been labeled with its three-directionalnormal. CurveNet architecture is constructed similarly tothe one used in segmentation task, excluding the one-hotclass label vector and global feature vectors. Models aretrained with an initial learning rate of 0.05 and cosineaneal-ing scheduled to 0.0005 in 200 epochs.
Table 3 shows the average cosine-distance error compar-isons of CurveNet and state-of-the-art methods. Withoutany curves, our base CurveNet architecture achieves an av-erage error of 0.16, which is closed to [20, 3]. When curvesare involved, our full CurveNet demonstrates a superior per-formance with 0.11 average error, setting a new benchmarkto the normal estimation task.
4.3. Ablation Studies
We conducted extensive experiments on ModelNet40dataset to study our proposed method comprehensively. Un-less explicitly specified, implementation details remainedthe same as the ones described in the benchmark section.All the ablative studies were examined without voting.Component studies. The impact of individual componentof CurveNet was examined by simply removing or replac-ing them from the full CurveNet architecture. We con-ducted experiments on replacing LPFA with the commonlocal feature aggregation as in Eq. 1, disabling the dynamicmomentum and the crossover suppression strategies, and re-placing the proposed CA operator to the vanilla non-local
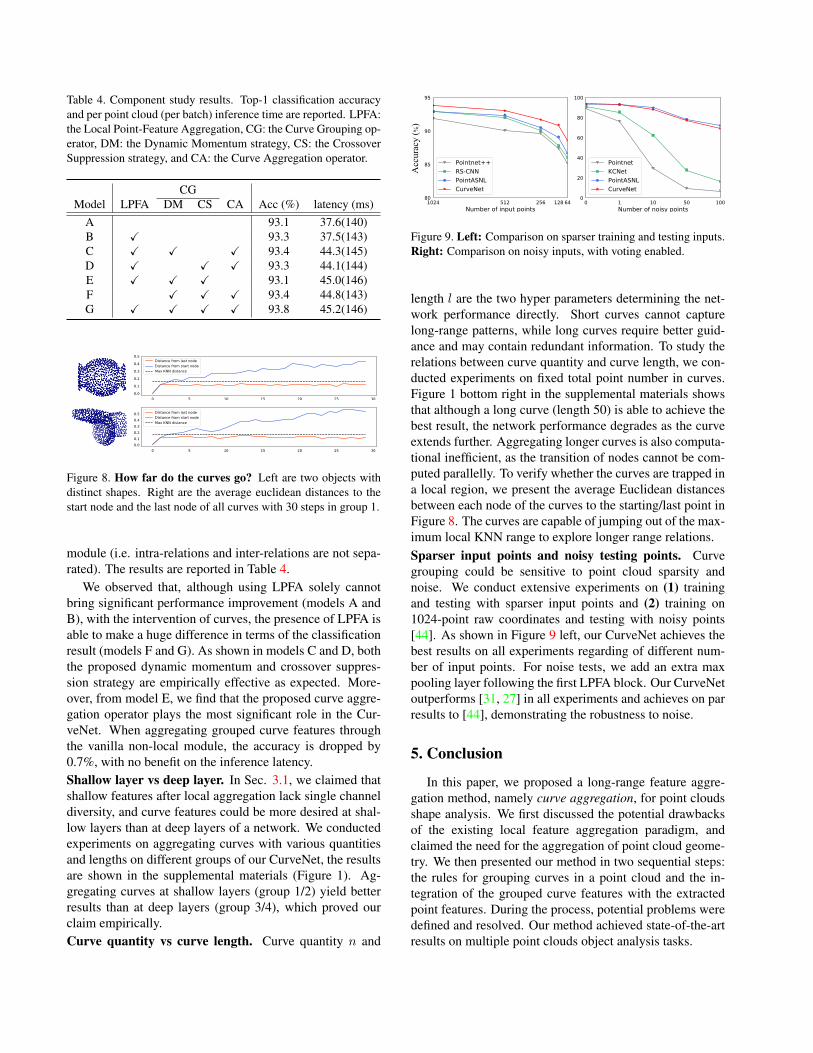
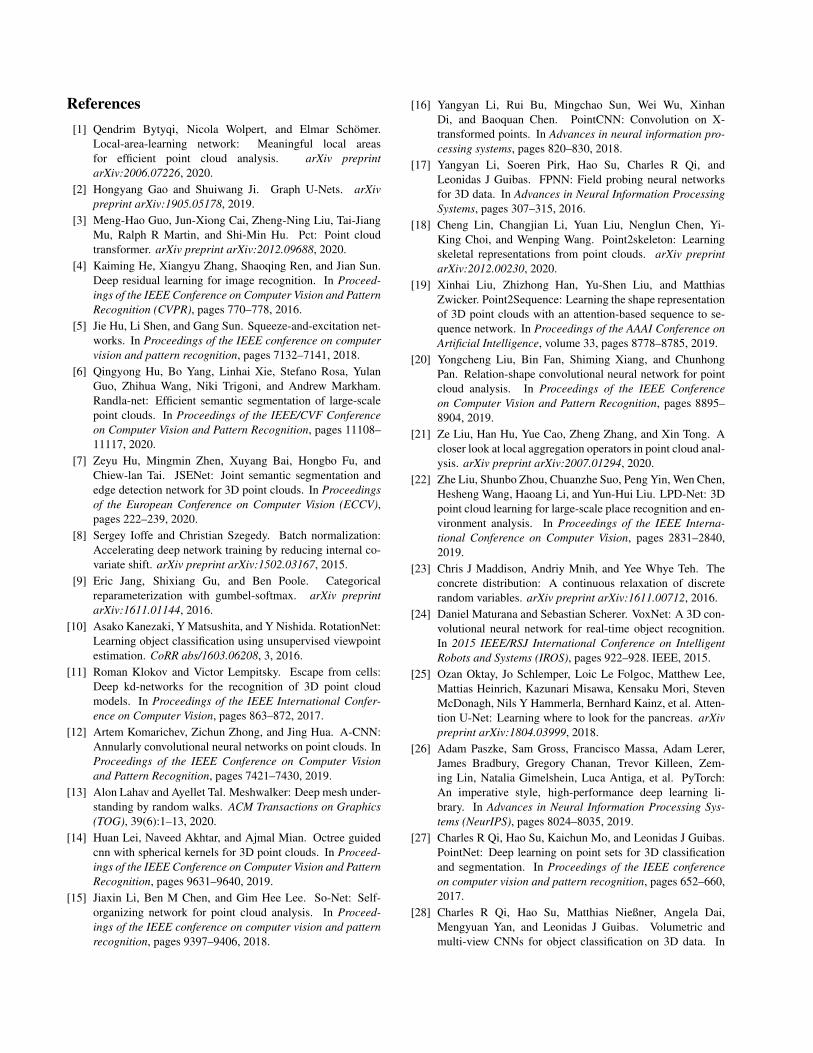
Table 4. Component study results. Top-1 classification accuracyand per point cloud (per batch) inference time are reported. LPFA:the Local Point-Feature Aggregation, CG: the Curve Grouping op-erator, DM: the Dynamic Momentum strategy, CS: the CrossoverSuppression strategy, and CA: the Curve Aggregation operator.
CGModel LPFA DM CS CA Acc (%) latency (ms)
A 93.1 37.6(140)B X 93.3 37.5(143)C X X X 93.4 44.3(145)D X X X 93.3 44.1(144)E X X X 93.1 45.0(146)F X X X 93.4 44.8(143)G X X X X 93.8 45.2(146)
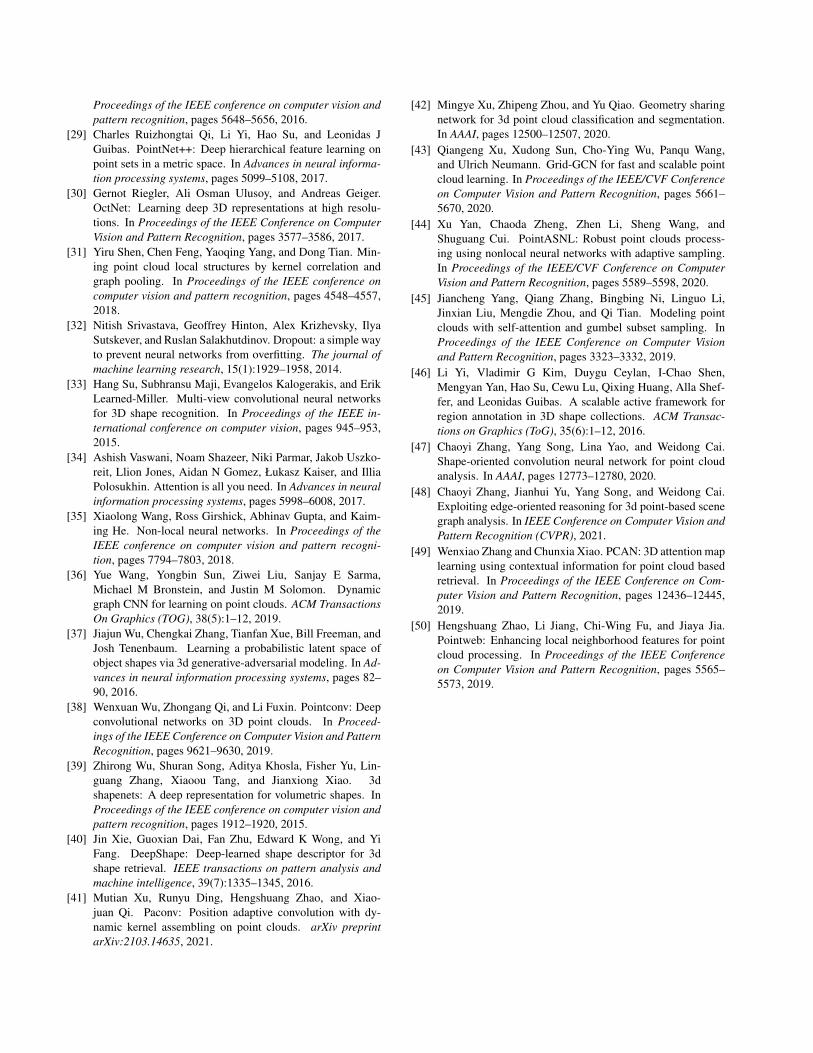
A curve Another curve Curve aggregated feature Point feature
Figure 8. How far do the curves go? Left are two objects withdistinct shapes. Right are the average euclidean distances to thestart node and the last node of all curves with 30 steps in group 1.
module (i.e. intra-relations and inter-relations are not sepa-rated). The results are reported in Table 4.
We observed that, although using LPFA solely cannotbring significant performance improvement (models A andB), with the intervention of curves, the presence of LPFA isable to make a huge difference in terms of the classificationresult (models F and G). As shown in models C and D, boththe proposed dynamic momentum and crossover suppres-sion strategy are empirically effective as expected. More-over, from model E, we find that the proposed curve aggre-gation operator plays the most significant role in the Cur-veNet. When aggregating grouped curve features throughthe vanilla non-local module, the accuracy is dropped by0.7%, with no benefit on the inference latency.Shallow layer vs deep layer. In Sec. 3.1, we claimed thatshallow features after local aggregation lack single channeldiversity, and curve features could be more desired at shal-low layers than at deep layers of a network. We conductedexperiments on aggregating curves with various quantitiesand lengths on different groups of our CurveNet, the resultsare shown in the supplemental materials (Figure 1). Ag-gregating curves at shallow layers (group 1/2) yield betterresults than at deep layers (group 3/4), which proved ourclaim empirically.Curve quantity vs curve length. Curve quantity n and
Acc
urac
y (%
)
Figure 9. Left: Comparison on sparser training and testing inputs.Right: Comparison on noisy inputs, with voting enabled.
length l are the two hyper parameters determining the net-work performance directly. Short curves cannot capturelong-range patterns, while long curves require better guid-ance and may contain redundant information. To study therelations between curve quantity and curve length, we con-ducted experiments on fixed total point number in curves.Figure 1 bottom right in the supplemental materials showsthat although a long curve (length 50) is able to achieve thebest result, the network performance degrades as the curveextends further. Aggregating longer curves is also computa-tional inefficient, as the transition of nodes cannot be com-puted parallelly. To verify whether the curves are trapped ina local region, we present the average Euclidean distancesbetween each node of the curves to the starting/last point inFigure 8. The curves are capable of jumping out of the max-imum local KNN range to explore longer range relations.Sparser input points and noisy testing points. Curvegrouping could be sensitive to point cloud sparsity andnoise. We conduct extensive experiments on (1) trainingand testing with sparser input points and (2) training on1024-point raw coordinates and testing with noisy points[44]. As shown in Figure 9 left, our CurveNet achieves thebest results on all experiments regarding of different num-ber of input points. For noise tests, we add an extra maxpooling layer following the first LPFA block. Our CurveNetoutperforms [31, 27] in all experiments and achieves on parresults to [44], demonstrating the robustness to noise.
5. Conclusion
In this paper, we proposed a long-range feature aggre-gation method, namely curve aggregation, for point cloudsshape analysis. We first discussed the potential drawbacksof the existing local feature aggregation paradigm, andclaimed the need for the aggregation of point cloud geome-try. We then presented our method in two sequential steps:the rules for grouping curves in a point cloud and the in-tegration of the grouped curve features with the extractedpoint features. During the process, potential problems weredefined and resolved. Our method achieved state-of-the-artresults on multiple point clouds object analysis tasks.
References[1] Qendrim Bytyqi, Nicola Wolpert, and Elmar Schomer.
Local-area-learning network: Meaningful local areasfor efficient point cloud analysis. arXiv preprintarXiv:2006.07226, 2020.
[2] Hongyang Gao and Shuiwang Ji. Graph U-Nets. arXivpreprint arXiv:1905.05178, 2019.
[3] Meng-Hao Guo, Jun-Xiong Cai, Zheng-Ning Liu, Tai-JiangMu, Ralph R Martin, and Shi-Min Hu. Pct: Point cloudtransformer. arXiv preprint arXiv:2012.09688, 2020.
[4] Kaiming He, Xiangyu Zhang, Shaoqing Ren, and Jian Sun.Deep residual learning for image recognition. In Proceed-ings of the IEEE Conference on Computer Vision and PatternRecognition (CVPR), pages 770–778, 2016.
[5] Jie Hu, Li Shen, and Gang Sun. Squeeze-and-excitation net-works. In Proceedings of the IEEE conference on computervision and pattern recognition, pages 7132–7141, 2018.
[6] Qingyong Hu, Bo Yang, Linhai Xie, Stefano Rosa, YulanGuo, Zhihua Wang, Niki Trigoni, and Andrew Markham.Randla-net: Efficient semantic segmentation of large-scalepoint clouds. In Proceedings of the IEEE/CVF Conferenceon Computer Vision and Pattern Recognition, pages 11108–11117, 2020.
[7] Zeyu Hu, Mingmin Zhen, Xuyang Bai, Hongbo Fu, andChiew-lan Tai. JSENet: Joint semantic segmentation andedge detection network for 3D point clouds. In Proceedingsof the European Conference on Computer Vision (ECCV),pages 222–239, 2020.
[8] Sergey Ioffe and Christian Szegedy. Batch normalization:Accelerating deep network training by reducing internal co-variate shift. arXiv preprint arXiv:1502.03167, 2015.
[9] Eric Jang, Shixiang Gu, and Ben Poole. Categoricalreparameterization with gumbel-softmax. arXiv preprintarXiv:1611.01144, 2016.
[10] Asako Kanezaki, Y Matsushita, and Y Nishida. RotationNet:Learning object classification using unsupervised viewpointestimation. CoRR abs/1603.06208, 3, 2016.
[11] Roman Klokov and Victor Lempitsky. Escape from cells:Deep kd-networks for the recognition of 3D point cloudmodels. In Proceedings of the IEEE International Confer-ence on Computer Vision, pages 863–872, 2017.
[12] Artem Komarichev, Zichun Zhong, and Jing Hua. A-CNN:Annularly convolutional neural networks on point clouds. InProceedings of the IEEE Conference on Computer Visionand Pattern Recognition, pages 7421–7430, 2019.
[13] Alon Lahav and Ayellet Tal. Meshwalker: Deep mesh under-standing by random walks. ACM Transactions on Graphics(TOG), 39(6):1–13, 2020.
[14] Huan Lei, Naveed Akhtar, and Ajmal Mian. Octree guidedcnn with spherical kernels for 3D point clouds. In Proceed-ings of the IEEE Conference on Computer Vision and PatternRecognition, pages 9631–9640, 2019.
[15] Jiaxin Li, Ben M Chen, and Gim Hee Lee. So-Net: Self-organizing network for point cloud analysis. In Proceed-ings of the IEEE conference on computer vision and patternrecognition, pages 9397–9406, 2018.
[16] Yangyan Li, Rui Bu, Mingchao Sun, Wei Wu, XinhanDi, and Baoquan Chen. PointCNN: Convolution on X-transformed points. In Advances in neural information pro-cessing systems, pages 820–830, 2018.
[17] Yangyan Li, Soeren Pirk, Hao Su, Charles R Qi, andLeonidas J Guibas. FPNN: Field probing neural networksfor 3D data. In Advances in Neural Information ProcessingSystems, pages 307–315, 2016.
[18] Cheng Lin, Changjian Li, Yuan Liu, Nenglun Chen, Yi-King Choi, and Wenping Wang. Point2skeleton: Learningskeletal representations from point clouds. arXiv preprintarXiv:2012.00230, 2020.
[19] Xinhai Liu, Zhizhong Han, Yu-Shen Liu, and MatthiasZwicker. Point2Sequence: Learning the shape representationof 3D point clouds with an attention-based sequence to se-quence network. In Proceedings of the AAAI Conference onArtificial Intelligence, volume 33, pages 8778–8785, 2019.
[20] Yongcheng Liu, Bin Fan, Shiming Xiang, and ChunhongPan. Relation-shape convolutional neural network for pointcloud analysis. In Proceedings of the IEEE Conferenceon Computer Vision and Pattern Recognition, pages 8895–8904, 2019.
[21] Ze Liu, Han Hu, Yue Cao, Zheng Zhang, and Xin Tong. Acloser look at local aggregation operators in point cloud anal-ysis. arXiv preprint arXiv:2007.01294, 2020.
[22] Zhe Liu, Shunbo Zhou, Chuanzhe Suo, Peng Yin, Wen Chen,Hesheng Wang, Haoang Li, and Yun-Hui Liu. LPD-Net: 3Dpoint cloud learning for large-scale place recognition and en-vironment analysis. In Proceedings of the IEEE Interna-tional Conference on Computer Vision, pages 2831–2840,2019.
[23] Chris J Maddison, Andriy Mnih, and Yee Whye Teh. Theconcrete distribution: A continuous relaxation of discreterandom variables. arXiv preprint arXiv:1611.00712, 2016.
[24] Daniel Maturana and Sebastian Scherer. VoxNet: A 3D con-volutional neural network for real-time object recognition.In 2015 IEEE/RSJ International Conference on IntelligentRobots and Systems (IROS), pages 922–928. IEEE, 2015.
[25] Ozan Oktay, Jo Schlemper, Loic Le Folgoc, Matthew Lee,Mattias Heinrich, Kazunari Misawa, Kensaku Mori, StevenMcDonagh, Nils Y Hammerla, Bernhard Kainz, et al. Atten-tion U-Net: Learning where to look for the pancreas. arXivpreprint arXiv:1804.03999, 2018.
[26] Adam Paszke, Sam Gross, Francisco Massa, Adam Lerer,James Bradbury, Gregory Chanan, Trevor Killeen, Zem-ing Lin, Natalia Gimelshein, Luca Antiga, et al. PyTorch:An imperative style, high-performance deep learning li-brary. In Advances in Neural Information Processing Sys-tems (NeurIPS), pages 8024–8035, 2019.
[27] Charles R Qi, Hao Su, Kaichun Mo, and Leonidas J Guibas.PointNet: Deep learning on point sets for 3D classificationand segmentation. In Proceedings of the IEEE conferenceon computer vision and pattern recognition, pages 652–660,2017.
[28] Charles R Qi, Hao Su, Matthias Nießner, Angela Dai,Mengyuan Yan, and Leonidas J Guibas. Volumetric andmulti-view CNNs for object classification on 3D data. In
Proceedings of the IEEE conference on computer vision andpattern recognition, pages 5648–5656, 2016.
[29] Charles Ruizhongtai Qi, Li Yi, Hao Su, and Leonidas JGuibas. PointNet++: Deep hierarchical feature learning onpoint sets in a metric space. In Advances in neural informa-tion processing systems, pages 5099–5108, 2017.
[30] Gernot Riegler, Ali Osman Ulusoy, and Andreas Geiger.OctNet: Learning deep 3D representations at high resolu-tions. In Proceedings of the IEEE Conference on ComputerVision and Pattern Recognition, pages 3577–3586, 2017.
[31] Yiru Shen, Chen Feng, Yaoqing Yang, and Dong Tian. Min-ing point cloud local structures by kernel correlation andgraph pooling. In Proceedings of the IEEE conference oncomputer vision and pattern recognition, pages 4548–4557,2018.
[32] Nitish Srivastava, Geoffrey Hinton, Alex Krizhevsky, IlyaSutskever, and Ruslan Salakhutdinov. Dropout: a simple wayto prevent neural networks from overfitting. The journal ofmachine learning research, 15(1):1929–1958, 2014.
[33] Hang Su, Subhransu Maji, Evangelos Kalogerakis, and ErikLearned-Miller. Multi-view convolutional neural networksfor 3D shape recognition. In Proceedings of the IEEE in-ternational conference on computer vision, pages 945–953,2015.
[34] Ashish Vaswani, Noam Shazeer, Niki Parmar, Jakob Uszko-reit, Llion Jones, Aidan N Gomez, Łukasz Kaiser, and IlliaPolosukhin. Attention is all you need. In Advances in neuralinformation processing systems, pages 5998–6008, 2017.
[35] Xiaolong Wang, Ross Girshick, Abhinav Gupta, and Kaim-ing He. Non-local neural networks. In Proceedings of theIEEE conference on computer vision and pattern recogni-tion, pages 7794–7803, 2018.
[36] Yue Wang, Yongbin Sun, Ziwei Liu, Sanjay E Sarma,Michael M Bronstein, and Justin M Solomon. Dynamicgraph CNN for learning on point clouds. ACM TransactionsOn Graphics (TOG), 38(5):1–12, 2019.
[37] Jiajun Wu, Chengkai Zhang, Tianfan Xue, Bill Freeman, andJosh Tenenbaum. Learning a probabilistic latent space ofobject shapes via 3d generative-adversarial modeling. In Ad-vances in neural information processing systems, pages 82–90, 2016.
[38] Wenxuan Wu, Zhongang Qi, and Li Fuxin. Pointconv: Deepconvolutional networks on 3D point clouds. In Proceed-ings of the IEEE Conference on Computer Vision and PatternRecognition, pages 9621–9630, 2019.
[39] Zhirong Wu, Shuran Song, Aditya Khosla, Fisher Yu, Lin-guang Zhang, Xiaoou Tang, and Jianxiong Xiao. 3dshapenets: A deep representation for volumetric shapes. InProceedings of the IEEE conference on computer vision andpattern recognition, pages 1912–1920, 2015.
[40] Jin Xie, Guoxian Dai, Fan Zhu, Edward K Wong, and YiFang. DeepShape: Deep-learned shape descriptor for 3dshape retrieval. IEEE transactions on pattern analysis andmachine intelligence, 39(7):1335–1345, 2016.
[41] Mutian Xu, Runyu Ding, Hengshuang Zhao, and Xiao-juan Qi. Paconv: Position adaptive convolution with dy-namic kernel assembling on point clouds. arXiv preprintarXiv:2103.14635, 2021.
[42] Mingye Xu, Zhipeng Zhou, and Yu Qiao. Geometry sharingnetwork for 3d point cloud classification and segmentation.In AAAI, pages 12500–12507, 2020.
[43] Qiangeng Xu, Xudong Sun, Cho-Ying Wu, Panqu Wang,and Ulrich Neumann. Grid-GCN for fast and scalable pointcloud learning. In Proceedings of the IEEE/CVF Conferenceon Computer Vision and Pattern Recognition, pages 5661–5670, 2020.
[44] Xu Yan, Chaoda Zheng, Zhen Li, Sheng Wang, andShuguang Cui. PointASNL: Robust point clouds process-ing using nonlocal neural networks with adaptive sampling.In Proceedings of the IEEE/CVF Conference on ComputerVision and Pattern Recognition, pages 5589–5598, 2020.
[45] Jiancheng Yang, Qiang Zhang, Bingbing Ni, Linguo Li,Jinxian Liu, Mengdie Zhou, and Qi Tian. Modeling pointclouds with self-attention and gumbel subset sampling. InProceedings of the IEEE Conference on Computer Visionand Pattern Recognition, pages 3323–3332, 2019.
[46] Li Yi, Vladimir G Kim, Duygu Ceylan, I-Chao Shen,Mengyan Yan, Hao Su, Cewu Lu, Qixing Huang, Alla Shef-fer, and Leonidas Guibas. A scalable active framework forregion annotation in 3D shape collections. ACM Transac-tions on Graphics (ToG), 35(6):1–12, 2016.
[47] Chaoyi Zhang, Yang Song, Lina Yao, and Weidong Cai.Shape-oriented convolution neural network for point cloudanalysis. In AAAI, pages 12773–12780, 2020.
[48] Chaoyi Zhang, Jianhui Yu, Yang Song, and Weidong Cai.Exploiting edge-oriented reasoning for 3d point-based scenegraph analysis. In IEEE Conference on Computer Vision andPattern Recognition (CVPR), 2021.
[49] Wenxiao Zhang and Chunxia Xiao. PCAN: 3D attention maplearning using contextual information for point cloud basedretrieval. In Proceedings of the IEEE Conference on Com-puter Vision and Pattern Recognition, pages 12436–12445,2019.
[50] Hengshuang Zhao, Li Jiang, Chi-Wing Fu, and Jiaya Jia.Pointweb: Enhancing local neighborhood features for pointcloud processing. In Proceedings of the IEEE Conferenceon Computer Vision and Pattern Recognition, pages 5565–5573, 2019.