Embed Size (px)
Citation preview
WALGREENS - GRESHAMGresham, OR
Offering Memorandum
N O N - E N D O R S E M E N T A N D D I S C L A I M E R N O T I C E
Confidentiality and DisclaimerThe information contained in the following Marketing Brochure is proprietary and strictly confidential. It is intended tobe reviewed only by the party receiving it from Marcus & Millichap and should not be made available to any otherperson or entity without the written consent of Marcus & Millichap. This Marketing Brochure has been prepared toprovide summary, unverified information to prospective purchasers, and to establish only a preliminary level of interestin the subject property. The information contained herein is not a substitute for a thorough due diligence investigation.Marcus & Millichap has not made any investigation, and makes no warranty or representation, with respect to theincome or expenses for the subject property, the future projected financial performance of the property, the size andsquare footage of the property and improvements, the presence or absence of contaminating substances, PCB's orasbestos, the compliance with State and Federal regulations, the physical condition of the improvements thereon, orthe financial condition or business prospects of any tenant, or any tenant's plans or intentions to continue itsoccupancy of the subject property. The information contained in this Marketing Brochure has been obtained fromsources we believe to be reliable; however, Marcus & Millichap has not verified, and will not verify, any of theinformation contained herein, nor has Marcus & Millichap conducted any investigation regarding these matters andmakes no warranty or representation whatsoever regarding the accuracy or completeness of the information provided.All potential buyers must take appropriate measures to verify all of the information set forth herein. Marcus & Millichapis a service mark of Marcus & Millichap Real Estate Investment Services, Inc. © 2016 Marcus & Millichap. All rightsreserved.
Non-Endorsement NoticeMarcus & Millichap is not affiliated with, sponsored by, or endorsed by any commercial tenant or lessee identified inthis marketing package. The presence of any corporation's logo or name is not intended to indicate or imply affiliationwith, or sponsorship or endorsement by, said corporation of Marcus & Millichap, its affiliates or subsidiaries, or anyagent, product, service, or commercial listing of Marcus & Millichap, and is solely included for the purpose of providingtenant lessee information about this listing to prospective customers.
ALL PROPERTY SHOWINGS ARE BY APPOINTMENT ONLY.PLEASE CONSULT YOUR MARCUS & MILLICHAP AGENT FOR MORE DETAILS.
WALGREENS - GRESHAMGresham, ORACT ID Y0210065
N E T L E A S E D D I S C L A I M E R
Marcus & Millichap hereby advises all prospective purchasers of Net Leased property as follows:
The information contained in this Marketing Brochure has been obtained from sources we believe to be reliable. However, Marcus & Millichap has not and will notverify any of this information, nor has Marcus & Millichap conducted any investigation regarding these matters. Marcus & Millichap makes no guarantee, warrantyor representation whatsoever about the accuracy or completeness of any information provided.
As the Buyer of a net leased property, it is the Buyer’s responsibility to independently confirm the accuracy and completeness of all material information beforecompleting any purchase. This Marketing Brochure is not a substitute for your thorough due diligence investigation of this investment opportunity. Marcus &Millichap expressly denies any obligation to conduct a due diligence examination of this Property for Buyer.
Any projections, opinions, assumptions or estimates used in this Marketing Brochure are for example only and do not represent the current or future performance ofthis property. The value of a net leased property to you depends on factors that should be evaluated by you and your tax, financial and legal advisors.
Buyer and Buyer’s tax, financial, legal, and construction advisors should conduct a careful, independent investigation of any net leased property to determine toyour satisfaction with the suitability of the property for your needs.
Like all real estate investments, this investment carries significant risks. Buyer and Buyer’s legal and financial advisors must request and carefully review all legaland financial documents related to the property and tenant. While the tenant’s past performance at this or other locations is an important consideration, it is not aguarantee of future success. Similarly, the lease rate for some properties, including newly-constructed facilities or newly-acquired locations, may be set based on atenant’s projected sales with little or no record of actual performance, or comparable rents for the area. Returns are not guaranteed; the tenant and any guarantorsmay fail to pay the lease rent or property taxes, or may fail to comply with other material terms of the lease; cash flow may be interrupted in part or in whole due tomarket, economic, environmental or other conditions. Regardless of tenant history and lease guarantees, Buyer is responsible for conducting his/her owninvestigation of all matters affecting the intrinsic value of the property and the value of any long-term lease, including the likelihood of locating a replacement tenantif the current tenant should default or abandon the property, and the lease terms that Buyer may be able to negotiate with a potential replacement tenantconsidering the location of the property, and Buyer’s legal ability to make alternate use of the property.
By accepting this Marketing Brochure you agree to release Marcus & Millichap Real Estate Investment Services and hold it harmless from any kind of claim, cost,expense, or liability arising out of your investigation and/or purchase of this net leased property.
TABLE OF CONTENTS
SECTION
INVESTMENT OVERVIEW 01Executive Summary
Investment Overview & HighlightsTenant Summary
Regional and Local Map
Aerial Photo
FINANCIAL ANALYSIS 02Property Summary
MARKET COMPARABLES 03Sales Comparables Map
Comparables
MARKET OVERVIEW 04Market Analysis
Demographic Analysis
WALGREENS - GRESHAM
WALGREENS - GRESHAM
5
INVESTMENT
OVERVIEW

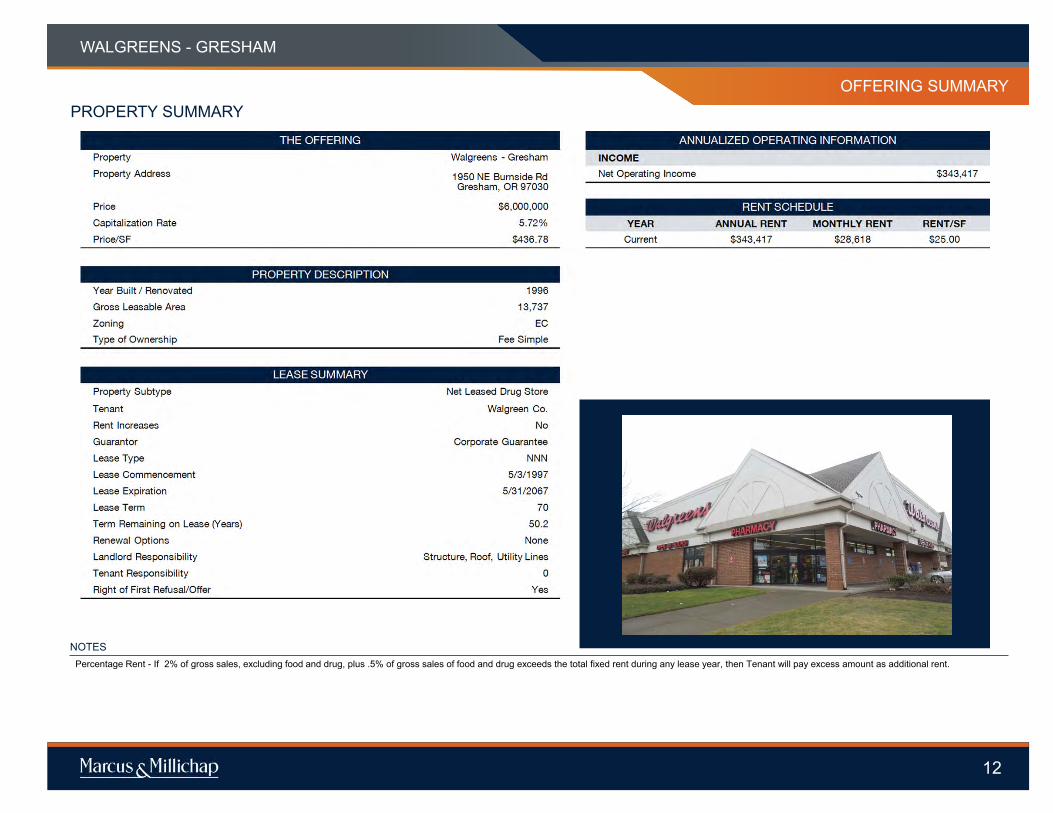
OFFERING SUMMARYPrice $6,000,000Net Operating Income $343,417Capitalization Rate – Current 5.72%Price / SF $436.78Rent / SF $25.00Lease Type NNNGross Leasable Area 13,737 SFYear Built / Renovated 1996Lot Size 2.37 acre(s)
#
EXECUTIVE SUMMARYOFFERING SUMMARY
#
FINANCINGLoan Amount $3,600,000
Loan Type Financed - New LoanLoan to Value 60.00%
Down Payment 40% / $2,400,000Interest Rate / Amortization 4.50% / 25 YearsAnnual Loan Payment $240,120Net Cash Flow After Debt Service 4.30% / $103,297Cash on Cash Return 4.30%
WALGREENS - GRESHAM
6
WALGREENS - GRESHAM
6
OFFERING SUMMARY
MAJOR EMPLOYERS
EMPLOYER # OF EMPLOYEES *
Portland Adventist Medical Ctr 1,694
Tri-Met 1,000
Mt Hood Community 900
Semiconductor 600
Walmart 574
Kaiser Permanente Dental 539
City of Gresham 504
Microchip Technology Inc 500
Nmhg Oregon LLC 400
Pella Vnyl-Portland Operations 400
Safeway 331
Legacy Mount Hood Medical Ctr 306
DEMOGRAPHICS
1-Miles 3-Miles 5-Miles
2016 Estimate Pop 21,572 108,926 190,248
2010 Census Pop 20,187 101,199 176,686
2016 Estimate HH 8,157 39,696 68,219
2010 Census HH 7,679 37,139 63,874
Median HH Income $42,953 $55,465 $53,171
Per Capita Income $21,957 $25,093 $24,135
Average HH Income $57,462 $68,404 $66,799
* # of Employees based on 5 mile radius
WALGREENS - GRESHAM
#
OFFERING SUMMARY
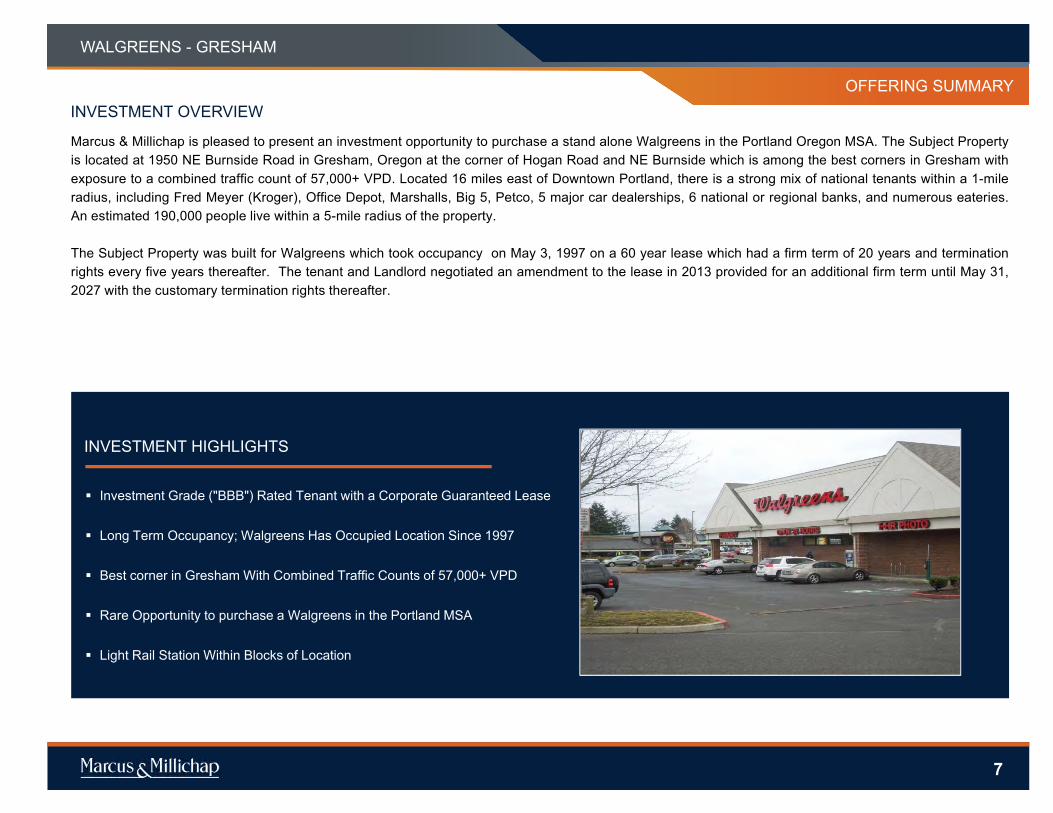
Investment Grade ("BBB") Rated Tenant with a Corporate Guaranteed Lease
Long Term Occupancy; Walgreens Has Occupied Location Since 1997
Best corner in Gresham With Combined Traffic Counts of 57,000+ VPD
Rare Opportunity to purchase a Walgreens in the Portland MSA
Light Rail Station Within Blocks of Location
INVESTMENT HIGHLIGHTS
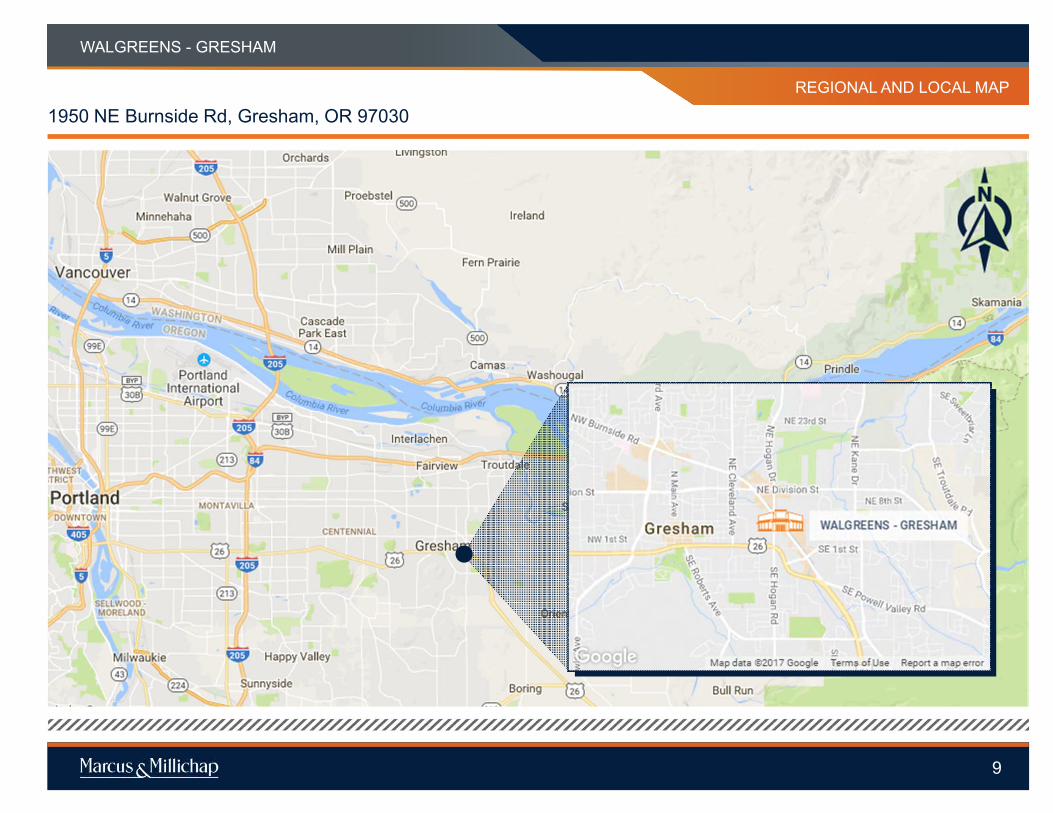
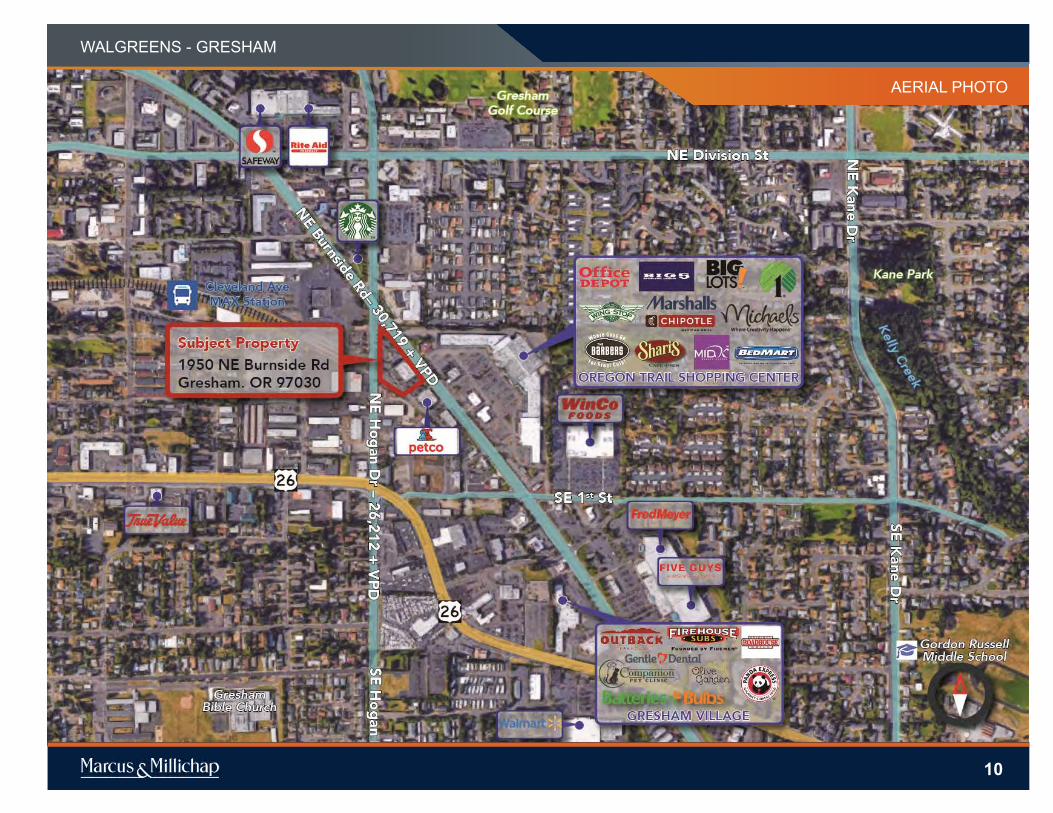
Marcus & Millichap is pleased to present an investment opportunity to purchase a stand alone Walgreens in the Portland Oregon MSA. The Subject Propertyis located at 1950 NE Burnside Road in Gresham, Oregon at the corner of Hogan Road and NE Burnside which is among the best corners in Gresham withexposure to a combined traffic count of 57,000+ VPD. Located 16 miles east of Downtown Portland, there is a strong mix of national tenants within a 1-mileradius, including Fred Meyer (Kroger), Office Depot, Marshalls, Big 5, Petco, 5 major car dealerships, 6 national or regional banks, and numerous eateries.An estimated 190,000 people live within a 5-mile radius of the property.
The Subject Property was built for Walgreens which took occupancy on May 3, 1997 on a 60 year lease which had a firm term of 20 years and terminationrights every five years thereafter. The tenant and Landlord negotiated an amendment to the lease in 2013 provided for an additional firm term until May 31,2027 with the customary termination rights thereafter.
INVESTMENT OVERVIEW
7
TENANT SUMMARY
#
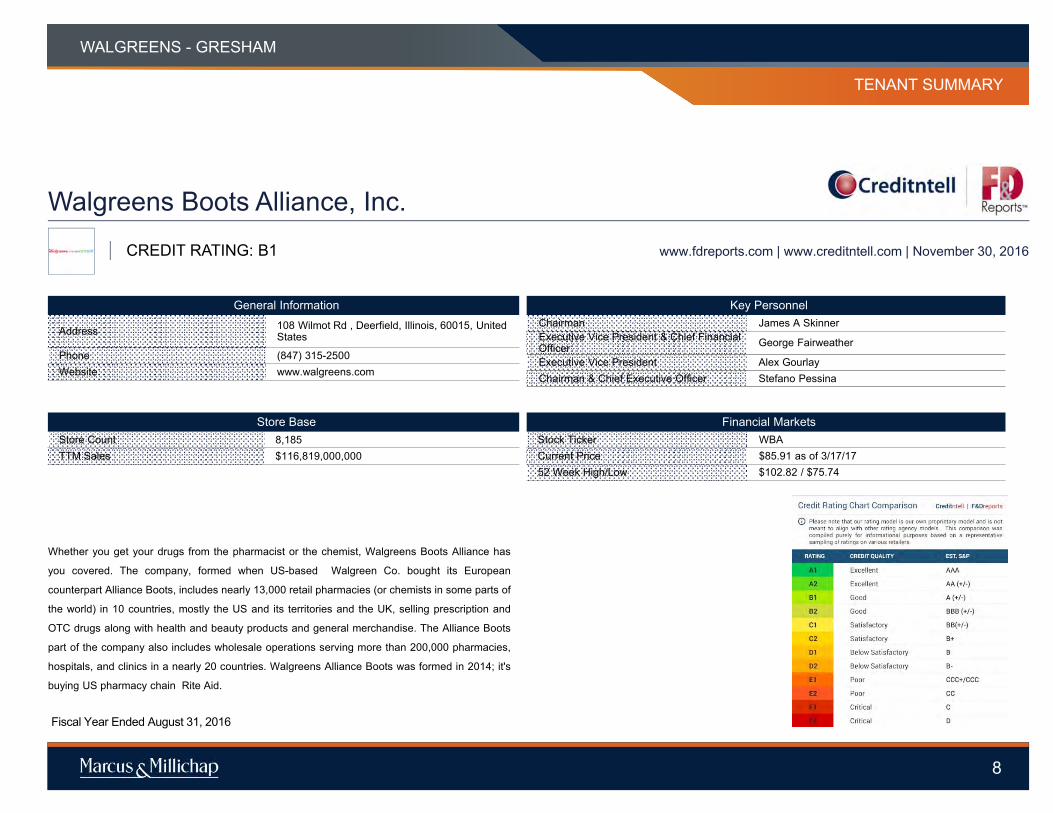
Fiscal Year Ended August 31, 2016
Walgreens Boots Alliance, Inc.CREDIT RATING: B1 www.fdreports.com | www.creditntell.com | November 30, 2016
Whether you get your drugs from the pharmacist or the chemist, Walgreens Boots Alliance has
you covered. The company, formed when US-based Walgreen Co. bought its European
counterpart Alliance Boots, includes nearly 13,000 retail pharmacies (or chemists in some parts of
the world) in 10 countries, mostly the US and its territories and the UK, selling prescription and
OTC drugs along with health and beauty products and general merchandise. The Alliance Boots
part of the company also includes wholesale operations serving more than 200,000 pharmacies,
hospitals, and clinics in a nearly 20 countries. Walgreens Alliance Boots was formed in 2014; it's
buying US pharmacy chain Rite Aid.
PRICING AND VALUATION MATRIX
PROPERTY NAMEWALGREENS - GRESHAM
PRICING AND VALUATION MATRIX
PROPERTY NAMEWALGREENS - GRESHAM
8
TENANT SUMMARY
General Information
Address 108 Wilmot Rd , Deerfield, Illinois, 60015, United States
Phone (847) 315-2500Website www.walgreens.com
Store BaseStore Count 8,185TTM Sales $116,819,000,000
Key PersonnelChairman James A SkinnerExecutive Vice President & Chief Financial Officer George Fairweather
Executive Vice President Alex GourlayChairman & Chief Executive Officer Stefano Pessina
Financial MarketsStock Ticker WBACurrent Price $85.91 as of 3/17/1752 Week High/Low $102.82 / $75.74
#
1950 NE Burnside Rd, Gresham, OR 97030LOCATION OVERVIEWTENANT SUMMARYPRICING AND VALUATION MATRIX
PROPERTY NAMEWALGREENS - GRESHAM
PRICING AND VALUATION MATRIX
PROPERTY NAMEWALGREENS - GRESHAM
9
REGIONAL AND LOCAL MAP
AERIAL PHOTO
WALGREENS - GRESHAM
10
WALGREENS - GRESHAM
11
FINANCIAL
ANALYSIS
#
PROPERTY SUMMARYOFFERING SUMMARY
#
NOTESPercentage Rent - If 2% of gross sales, excluding food and drug, plus .5% of gross sales of food and drug exceeds the total fixed rent during any lease year, then Tenant will pay excess amount as additional rent.
WALGREENS - GRESHAM
12
OFFERING SUMMARY
WALGREENS - GRESHAM
13
MARKET
COMPARABLES

8
WALGREENS - GRESHAM
COMPARABLES MAP
14
WALGREENS - GRESHAM(SUBJECT)
Walgreens
Walgreens
Walgreens
Walgreens
Walgreens
Walgreens
SALES COMPARABLES
1
2
3
4
5
6
PROPERTY NAME
MARKETING TEAM
WALGREENS - GRESHAM
COMPARABLES
rentpropertyname1
rentpropertyaddress1
rentpropertyname1
rentpropertyaddress1
rentpropertyname1
rentpropertyaddress1
15
SALES COMPARABLES
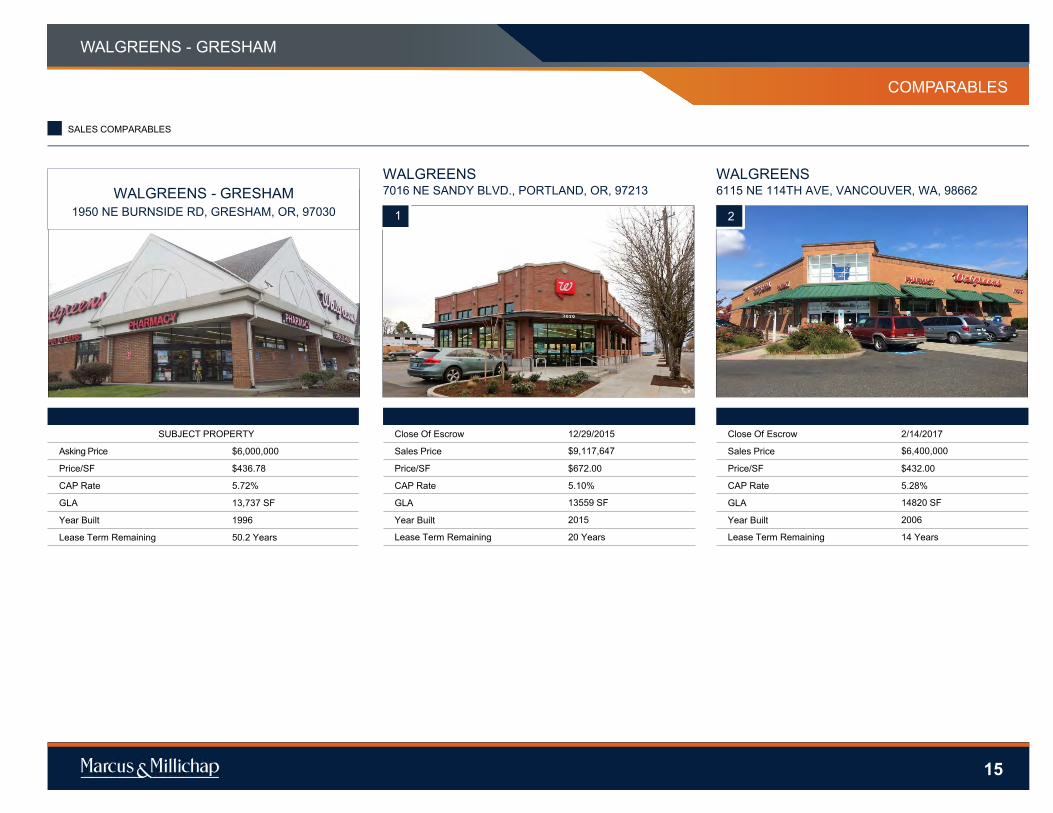
WALGREENS - GRESHAM1950 NE BURNSIDE RD, GRESHAM, OR, 97030
SUBJECT PROPERTY
Asking Price $6,000,000
Price/SF $436.78
CAP Rate 5.72%
GLA 13,737 SF
Year Built 1996
Lease Term Remaining 50.2 Years
WALGREENS7016 NE SANDY BLVD., PORTLAND, OR, 97213
1
Close Of Escrow 12/29/2015
Sales Price $9,117,647
Price/SF $672.00
CAP Rate 5.10%
GLA 13559 SF
Year Built 2015
Lease Term Remaining 20 Years
WALGREENS6115 NE 114TH AVE, VANCOUVER, WA, 98662
2
Close Of Escrow 2/14/2017
Sales Price $6,400,000
Price/SF $432.00
CAP Rate 5.28%
GLA 14820 SF
Year Built 2006
Lease Term Remaining 14 Years

PROPERTY NAME
MARKETING TEAM
WALGREENS - GRESHAM
COMPARABLES
rentpropertyname1
rentpropertyaddress1
rentpropertyname1
rentpropertyaddress1
rentpropertyname1
rentpropertyaddress1
16
SALES COMPARABLES
WALGREENS1210 MOHAWK BLVD, SPRINGFIELD, OR, 97477
3
Close Of Escrow 5/10/2016
Sales Price $6,428,864
Price/SF $444.00
CAP Rate 5.50%
GLA 14490 SF
Year Built 2005
WALGREENS6725 NORTH GLENWOOD STREET, BOISE, ID, 83714
4
Close Of Escrow 12/17/2015
Sales Price $5,900,000
Price/SF $405.00
CAP Rate 5.59%
GLA 14560 SF
Year Built 2005
Lease Term Remaining 25 Years
WALGREENS3230 E. CHANDLER HEIGHTS RD, GILBERT, AZ, 85298
5
Close Of Escrow 5/6/2016
Sales Price $7,850,000
Price/SF $533.00
CAP Rate 5.11%
GLA 14736 SF
Year Built 2007
Lease Term Remaining 16 Years

PROPERTY NAME
MARKETING TEAM
WALGREENS - GRESHAM
COMPARABLES
rentpropertyname1
rentpropertyaddress1
rentpropertyname1
rentpropertyaddress1
rentpropertyname1
rentpropertyaddress1
17
SALES COMPARABLES
WALGREENS590 SOUTH MAIN STREET, HEBER, UT, 84032
6
Close Of Escrow 11/10/2016
Sales Price $7,000,000
Price/SF $485.00
CAP Rate 5.66%
GLA 14435 SF
Year Built 2007
Lease Term Remaining 25 Years

WALGREENS - GRESHAM
18
MARKET
OVERVIEW

NATIONAL NET-LEASED RETAIL REPORT
THIRD QUARTER 2016
2016 Net-Leased Retail Market Overview
Y-O-Y Average Cap Rates down 10 Basis Points
Builders focus on net-leased floor plates as job growth continues unabated. The UnitedStates economy continues to be the engine for global growth, even as macroeconomicevents such as Brexit continue to make headlines. Employment growth has nowreached 24 straight quarters of positive traction, pushing unemployment below 5percent for the first time in the current cycle. In addition, retail vacancy is at the lowestlevel since 2005 as a slowdown in construction has prompted retailers to pick up darkspaces across the country. Builders have focused primarily on net-leased floor platesover the course of the current cycle, while drifting into mixed-use projects to fulfill multi-tenant requirements. Though supply has grown, net-leased vacancy has fallen to justabove 5 percent. Consumer spending has remained robust and thus tenant demandhas expanded. The largest gains are in discretionary categories such as bars andrestaurants, supporting a positive outlook for additional tightening in the net-leasedsector, particularly as lower unemployment translates into a pickup in labor pricing. Anyrise in wages will translate directly into higher consumption, boosting net-leaseddemand and rental rates.
Former apartment owners executing 1031 exchanges dominate net-leasedenvironment in search for yield. As interest rates have remained incredibly depressed,the search for positive yielding assets has soared, particularly in real estate. In addition,aging baby boomers are taking advantage of record-low cap rates in the apartmentsector to transition capital to the net-leased sector, where required management andmaintenance are much lower. The combination of these two factors has createdscarcity in the single-tenant sector, even as construction vaulted above 40 millionsquare feet in 2015. This environment has fueled dramatic increases in average sellingprices and cap rate compression as multiple bidders compete for the same assets. Asteady pace of expansion among multiple retailers in the net-leased space will continueto provide investors with opportunities to deploy funds, especially if internationalpressures ease over the coming months.
19
Y-O-Y Average Cap Ratesdown 10 Basis Points
Y-O-Y Average Cap Ratesdown 50 Basis Points
Y-O-Y Average Cap Ratesdown 20 Basis Points
Y-O-Y Average Cap Ratesdown 20 Basis Points
Steady Labor Market Underpins Net-Leased Growth in Discretionary Retailers
Dollar Stores: While store count concerns onthe back of merger considerations betweenFamily Dollar and Dollar Tree have trimmedtransactions, consistent growth in the DollarStore category will continue to promptallocations of capital. Cap rates for theseassets typically trade in the mid-6 percentrange.
Auto-Part Retailers: Considerable tailwindsfrom an aging fleet of vehicles on the road willboost demand for replacement auto parts.First-year returns in the space range from thehigh-5 percent to mid-7 percent band,depending on tenancy and location.
Drugstores: The long lease structure of CVSand Walgreens will power the majority ofinvestor dollars in the space, while Rite Aidlocations offer a slightly higher yield. Cap ratesbegin in the low-5 percent region, drifting intothe mid-6 percent range for shorter leases andless-traversed locations.
Quick-Service Restaurants: The range oftenancy and lease structures have generatedtremendous investor interest in the QSRspace. Brands such as McDonald’s andStarbucks trade in the mid-4 percent range,while regional operations can drift into thehigh-5 percent band.
Casual-Dining Establishments: Operatorperformance and branding will be the primarydriver of pricing in the casual-dining category.Top-tier national credits offer cap rates in themid-5 percent range, as regional and localoperators drift into the mid-7 percent region.

NATIONAL NET-LEASED RETAIL REPORT
THIRD QUARTER 2016
Quick-Service Restaurants
* ForecastSources: Marcus & Millichap Research Services; CoStar Group, Inc.
Drugstores
20
Rising discretionary income is supporting traffic at quick-service restaurants. The expansion of the sectorhas multiplied brands and locations, making the segment the largest in the net-leased market.
Transaction velocity rose considerably over the past year, with prices per square foot falling between $450and $1,500 per square foot, depending on brand name and location. McDonald’s and Starbucks stores willtrade at significant premiums to the average storefront.
The average cap rate was in the high-5 percent band during the last four quarters, with deals ranging fromthe mid-4s to mid-6 percent. Lease length and tenancy are the most important investor considerations inthe segment.
Outlook: The ease of operations and brand recognition will continue to motivate investors to quick-servicerestaurants.
Drugstores performed well over the past year, with retail spending at health and personal care retailers up7.5 percent. The $17 billion pending merger between Walgreens and Rite Aid could create the largestoperator in the space with over 13,000 stores. Regulatory approval from the Federal Trade Commission iscurrently pending, however a decision is due by year-end.
The widening of insurance costs and the aging of the American population has prompted vast amounts ofcapital investment in the sector. As a result, dollar volume exceeded $2 billion nationwide, with prices persquare foot exceeding $400.
Existing leases typically exchange ownership in the high-5 percent range, while new locations trade withcap rates in the high-4 percent band. Rite Aid trades at cap rates more than 100 basis points abovecomparable CVS and Walgreens locations, underscoring the significance of branding in the segment.
Outlook: The hands-off management structure and long leases associated with the drugstore segment willpropel investor dollars, even as concerns over the Walgreens/Rite Aid merger persist.
NATIONAL NET-LEASED RETAIL REPORT
THIRD QUARTER 2016
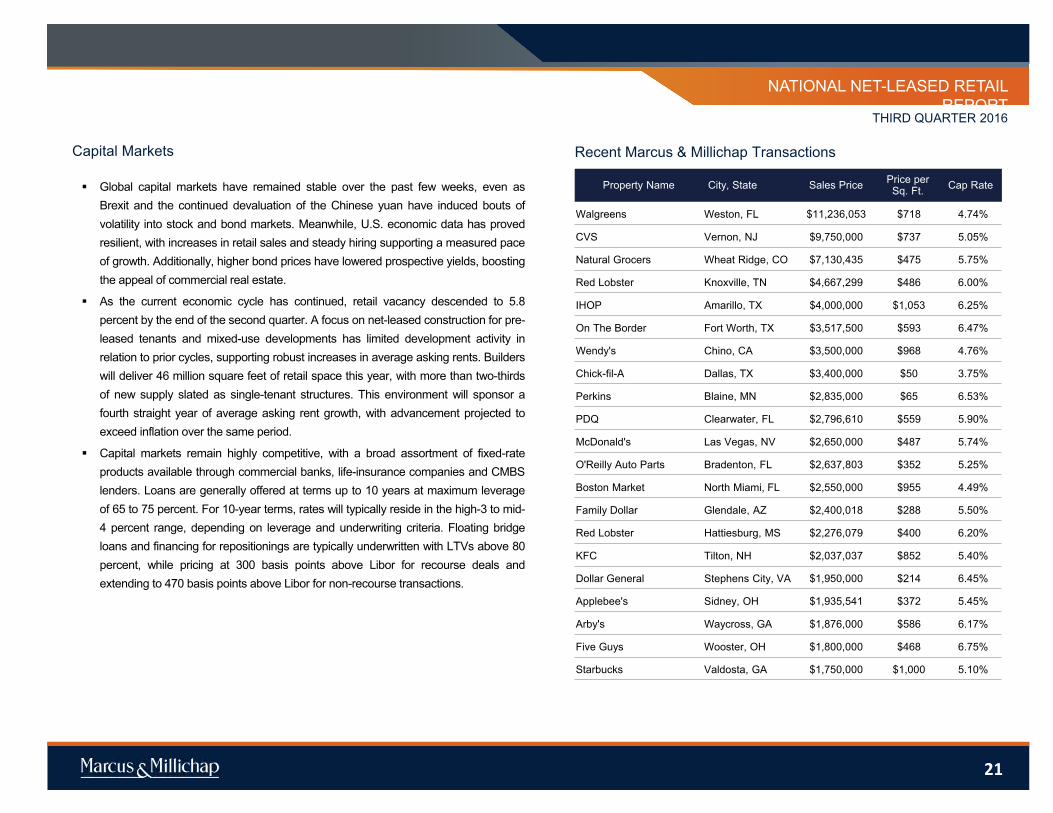
Capital Markets Recent Marcus & Millichap Transactions
Global capital markets have remained stable over the past few weeks, even asBrexit and the continued devaluation of the Chinese yuan have induced bouts ofvolatility into stock and bond markets. Meanwhile, U.S. economic data has provedresilient, with increases in retail sales and steady hiring supporting a measured paceof growth. Additionally, higher bond prices have lowered prospective yields, boostingthe appeal of commercial real estate.
As the current economic cycle has continued, retail vacancy descended to 5.8percent by the end of the second quarter. A focus on net-leased construction for pre-leased tenants and mixed-use developments has limited development activity inrelation to prior cycles, supporting robust increases in average asking rents. Builderswill deliver 46 million square feet of retail space this year, with more than two-thirdsof new supply slated as single-tenant structures. This environment will sponsor afourth straight year of average asking rent growth, with advancement projected toexceed inflation over the same period.
Capital markets remain highly competitive, with a broad assortment of fixed-rateproducts available through commercial banks, life-insurance companies and CMBSlenders. Loans are generally offered at terms up to 10 years at maximum leverageof 65 to 75 percent. For 10-year terms, rates will typically reside in the high-3 to mid-4 percent range, depending on leverage and underwriting criteria. Floating bridgeloans and financing for repositionings are typically underwritten with LTVs above 80percent, while pricing at 300 basis points above Libor for recourse deals andextending to 470 basis points above Libor for non-recourse transactions.
21
Property Name City, State Sales Price Price perSq. Ft. Cap Rate
Walgreens Weston, FL $11,236,053 $718 4.74%
CVS Vernon, NJ $9,750,000 $737 5.05%
Natural Grocers Wheat Ridge, CO $7,130,435 $475 5.75%
Red Lobster Knoxville, TN $4,667,299 $486 6.00%
IHOP Amarillo, TX $4,000,000 $1,053 6.25%
On The Border Fort Worth, TX $3,517,500 $593 6.47%
Wendy's Chino, CA $3,500,000 $968 4.76%
Chick-fil-A Dallas, TX $3,400,000 $50 3.75%
Perkins Blaine, MN $2,835,000 $65 6.53%
PDQ Clearwater, FL $2,796,610 $559 5.90%
McDonald's Las Vegas, NV $2,650,000 $487 5.74%
O'Reilly Auto Parts Bradenton, FL $2,637,803 $352 5.25%
Boston Market North Miami, FL $2,550,000 $955 4.49%
Family Dollar Glendale, AZ $2,400,018 $288 5.50%
Red Lobster Hattiesburg, MS $2,276,079 $400 6.20%
KFC Tilton, NH $2,037,037 $852 5.40%
Dollar General Stephens City, VA $1,950,000 $214 6.45%
Applebee's Sidney, OH $1,935,541 $372 5.45%
Arby's Waycross, GA $1,876,000 $586 6.17%
Five Guys Wooster, OH $1,800,000 $468 6.75%
Starbucks Valdosta, GA $1,750,000 $1,000 5.10%
MARKETING TEAM
Source: © 2015 Experian
PROPERTY NAME
#
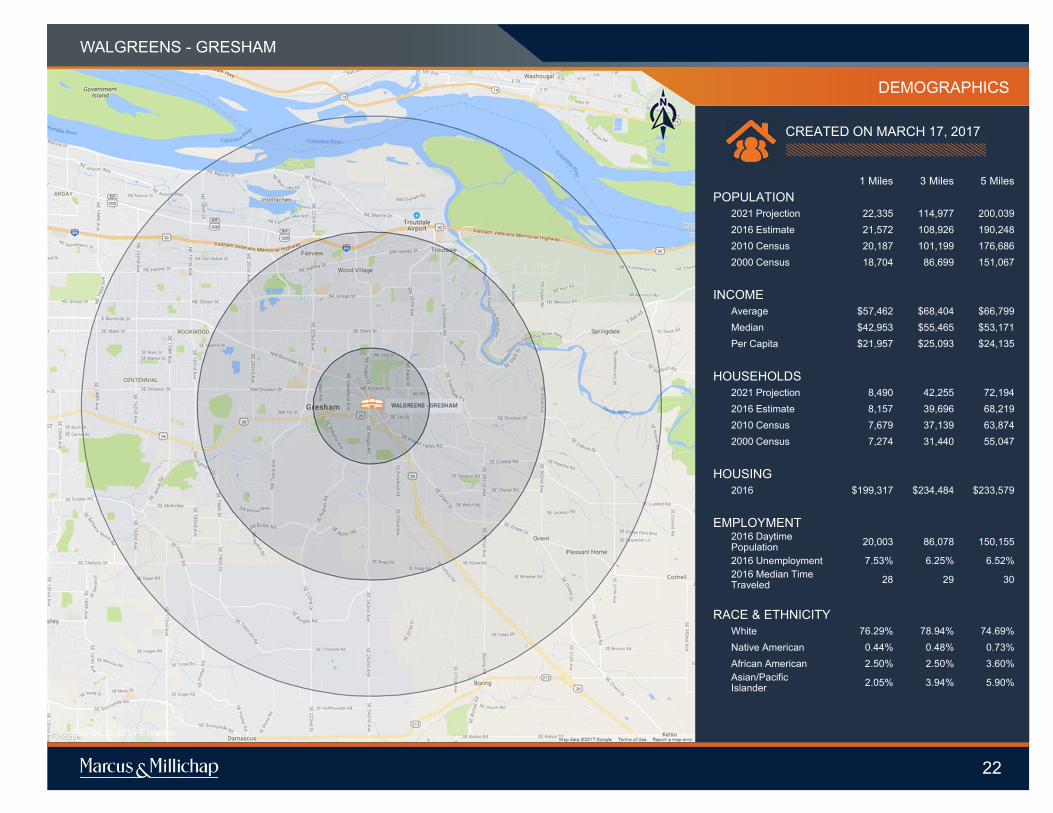
CREATED ON MARCH 17, 2017
LOCATION OVERVIEWTENANT SUMMARYPRICING AND VALUATION MATRIX
PROPERTY NAMEWALGREENS - GRESHAM
PRICING AND VALUATION MATRIX
PROPERTY NAMEWALGREENS - GRESHAM
22
DEMOGRAPHICS
1 Miles 3 Miles 5 MilesPOPULATION
2021 Projection 22,335 114,977 200,0392016 Estimate 21,572 108,926 190,2482010 Census 20,187 101,199 176,6862000 Census 18,704 86,699 151,067
INCOMEAverage $57,462 $68,404 $66,799Median $42,953 $55,465 $53,171Per Capita $21,957 $25,093 $24,135
HOUSEHOLDS2021 Projection 8,490 42,255 72,1942016 Estimate 8,157 39,696 68,2192010 Census 7,679 37,139 63,8742000 Census 7,274 31,440 55,047
HOUSING2016 $199,317 $234,484 $233,579
EMPLOYMENT2016 Daytime Population 20,003 86,078 150,155
2016 Unemployment 7.53% 6.25% 6.52%2016 Median Time Traveled 28 29 30
RACE & ETHNICITYWhite 76.29% 78.94% 74.69%Native American 0.44% 0.48% 0.73%African American 2.50% 2.50% 3.60%Asian/Pacific Islander 2.05% 3.94% 5.90%