Embed Size (px)
Citation preview
ARTICLE IN PRESS
0889-9746/$ - se
doi:10.1016/j.jfl
�Correspond91125, USA.
E-mail addr
Journal of Fluids and Structures 25 (2009) 991–1006
www.elsevier.com/locate/jfs
Wake structures and vortex-induced vibrations of a longflexible cylinder—Part 2: Drag coefficients and vortex modes
F.J. Huera-Huartea,�, P.W. Bearmanb
aDepartment of Mechanical Engineering, Universitat Rovira i Virgili, 43007 Tarragona, SpainbDepartment of Aeronautics, Imperial College London, SW7 2BY London, UK
Received 30 September 2008; accepted 24 March 2009
Available online 27 May 2009
Abstract
Drag coefficients and vortex structures in the wake of a vertical long flexible cylinder vibrating at low mode numbers
are presented in this paper. A model with an external diameter of 16mm and a total length of 1.5m giving an aspect
ratio of about 94 was used to perform more than 100 runs in which Reynolds numbers ranged between 1200 and 12 000.
Only the lower 40% of its length was exposed to the water current in the flume and applied top tensions varied from 15
to 110N giving fundamental natural frequencies in the range from 3 to 7.1Hz. Reduced velocities based on the
fundamental natural frequency up to 16 were reached. The mass ratio was 1.8 and the combined mass-damping
parameter about 0.05. The largest drag coefficients were found related to the largest x2y synchronised motions. Digital
particle image velocimetry was used to investigate the vortex structures in the wake of the cylinder model. Two modes
of vortex shedding were observed, depending on the response branch and the position along the length of the model at
which the interrogations were performed.
r 2009 Elsevier Ltd. All rights reserved.
Keywords: Vortex-induced vibration; High aspect ratio circular cylinders; Drag coefficients; Wake structures; Vortex modes
1. Introduction
A map of vortex modes in the wake of a 1 degree of freedom (dof) circular cylinder was first introduced by
Williamson and Roshko (1988). It was obtained from experiments in which their model was forced to oscillate with a
sinusoidal trajectory with different amplitudes and wavelenghts. They related the motion of the model with the vortical
patterns observed in its wake. In the lock-in region they observed several periodic vortex modes consisting of two single
vortices per cycle (2S mode), two pairs of vortices per cycle (2P mode) and combinations of those with one single vortex
on one side of the wake and two on the other (Pþ S mode). Khalak and Williamson (1999) showed how in free
vibration 1-dof experiments the 2S mode was only observed in the initial branch of response and the 2P mode was
observed in the upper and the lower branches inside the lock-in region.
Brika and Laneville (1993) carried out an experiment in a wind tunnel with a long flexible cylinder with low damping.
The aspect ratio (L=D) of their model was about 53. Previous experiments with high mass ratio cylinders had not shown
e front matter r 2009 Elsevier Ltd. All rights reserved.
uidstructs.2009.03.006
ing author. Present address: Graduate Aeronautical Laboratories, California Institute of Technology, Pasadena, CA
ess: [email protected] (F.J. Huera-Huarte).
ARTICLE IN PRESSF.J. Huera-Huarte, P.W. Bearman / Journal of Fluids and Structures 25 (2009) 991–1006992
the existence of the upper branch, a fact confirmed in Laneville’s experiments, where only the initial and the lower
branches of response appeared. They also investigated the vortex modes in the wake, finding the same patterns as in low
mass ratio cases: 2S in the initial branch and 2P in the lower branch.
Jeon and Gharib (2001) performed forced vibration experiments in a water tunnel. They arranged the motion of the
cylinder in their test section to perform a figure-eight and they studied the wake structures and the forces, from
the velocity fields obtained by using a PIV system. They found that even for very small in-line amplitudes the effect of
adding this streamwise motion was not negligible and observed that the 2P mode disappeared. They associated this
finding to a change in the phase of the lift force related to a phase change in the shedding of vortices.
Jauvtis and Williamson (2003) set up an experiment using a 2-dof rigid cylinder with mass ratios up to 25. The rig was
designed to have the same structural parameters in both directions, in-line and cross-flow. Their data showed how the
dynamic response of this 2-dof cylinder was practically identical to that of one with only transverse motion. The same
vortex modes, the 2S in the initial branch and the 2P in the upper and lower branches were observed. Their experiment
also confirmed data previously reported by Wooton et al. (1974) and King et al. (1973), in which two in-line response
branches were reported, in the first (Vro1=2S) vibrations were caused by the symmetric shedding of vortices, and in the
second (Vr ’ 1=2S) the flow visualisation showed asymmetric shedding. The study by Jauvtis and Williamson (2003)
showed an absence of cross-flow motion in this first region but in the second one cross-flow motion was observed. When
in-line motion was permitted, the in-line amplitudes were considerably smaller than those in the cross-flow direction.
The initial and the lower branches showed no in-line motion, whilst in the upper branch the in-line oscillation were only
0.04 diameters, which is about 5% of the cross-flow motion. In their subsequent study Jauvtis and Williamson (2004)
investigated the response of even lower mass ratio (m�o6) cylinders, free to move in-line and transverse to the flow.
They reported very important changes in amplitudes, frequency response and vortex dynamics in the wake of their
model. The super-upper branch was defined, characterised by what they called the 2T mode (two triplets of vortices at
each side per cycle) with transverse amplitudes higher than 1.5 diameters. In combination with these large amplitude
transverse motions, they show quite large streamwise motions reaching 0.3 diameters.
Laneville (2006) considered the importance of the in-line motion on the overall response of a long flexible cylinder to
reconcile his previous results with other researchers findings. He studied not only the importance of the in-line motion
and its effects on the cross-flow response but also the vortex patterns in the wake of his model in a wind tunnel. He
defined a parameter a to account for this fact, which basically indicates the plane of vibration with respect to the cross-
flow direction. He comments on the existence of the 2P mode only for values of a lower than 301. At higher values the
lower branch disappears as does the 2P mode, resulting in a response in which only the 2S pattern can be seen.
A recent experimental work showing amplitude and frequency response data for a two degree of freedom rigid
cylinder with equal mass ratio and natural frequency in both directions, has been published by Sanchis et al. (2008).
The authors present a set of data in which a low aspect ratio cylinder, with a mass ratio near 1 and a comparatively
large structural damping (4.7% of the critical), is allowed to vibrate in a water channel, whilst being supported by an
apparatus consisting of a set of three torsion springs at each end producing the restoring force. Their set-up combined a
low mass ratio with a relatively high damping, resulting in a combined mass-damping parameter comparable with
previous low-mass-damping experiments. For values of reduced velocity lower than 6.5, they showed evidence of the
initial branch of response with cross-flow amplitudes of almost one diameter combined with in-line amplitudes of 0.3
diameters, generating 2S vortex patterns and eight-shaped x2y trajectories.
2. Experimental details
The experiments were performed in a water channel at the Department of Aeronautics of Imperial College London.
It has a cross-section of 0:6� 0:75m with a total length exceeding 8m. A more detailed description of the model, the
facilities and the instrumentation used in the experiments appear in Huera-Huarte and Bearman (2009). The maximum
water height that could be established was up to about 0.65m, and the pumping system was able to generate currents up
to 0.75m/s at the maximum water height. The model had the same damping, mass and natural frequencies in both
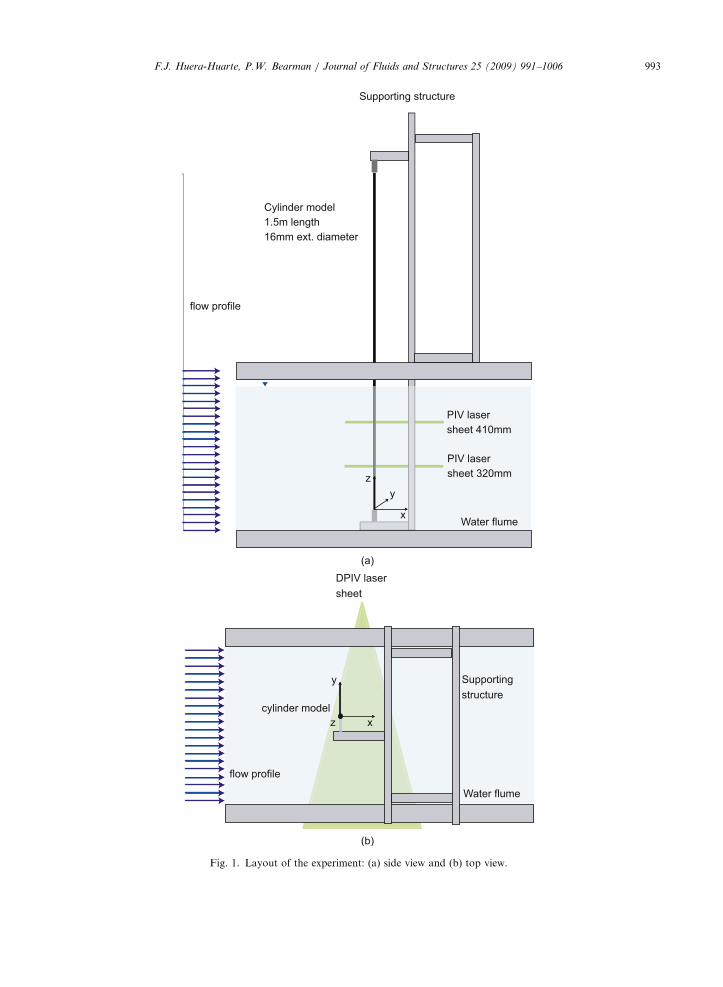
directions, in-line and cross-flow and the set-up appears in Figs. 1(a) and (b). It consisted of a supporting structure and
a long flexible circular cylinder instrumented with strain gauges along its length. The 1.5m long circular cylinder was
made of a skeleton structure consisting of a 6mm diameter aluminium core with 15mm diameter aluminium
diaphragms attached to it. In order to provide an external smooth surface, the skeleton was covered with a transparent
flexible PVC skin with an external diameter of 16mm. A very stiff aluminium structure was designed to place the
models inside the uniform current (Fig. 1(a)) and to allow changes in the applied top tension through a spring system.
Five different top tensions, 15, 35, 60, 85 and 110N were tested. Their corresponding fundamental natural frequencies
ARTICLE IN PRESS
Cylinder model1.5m length16mm ext. diameter
Supporting structure
flow profile
Water flume
zy
x
PIV lasersheet 320mm
PIV lasersheet 410mm
cylinder model
Supportingstructure
flow profile
Water flume
z
y
x
DPIV laser sheet
Fig. 1. Layout of the experiment: (a) side view and (b) top view.
F.J. Huera-Huarte, P.W. Bearman / Journal of Fluids and Structures 25 (2009) 991–1006 993
ARTICLE IN PRESS
Table 1
Main parameters.
Experiment parameters
External diameter D m 0.016
Length L m 1.5
Aspect ratio L=D – 93.75
Submerged length Ls m 0.585
Flexural stiffness EI Nm2 6.04
Axial stiffness EA MN 1.84
Top tension Tt N o 110
Flow speed V m/s o 0.75
Reynolds number Re – 1200–12 000
Mass m kg/m 0.362
Submerged weight ws N/m 2.7
Mass ratio m� – 1.8
Fund. natural freq. f 1 Hz 3.0-7.1
Damping ratio z % zc 1.77
F.J. Huera-Huarte, P.W. Bearman / Journal of Fluids and Structures 25 (2009) 991–1006994
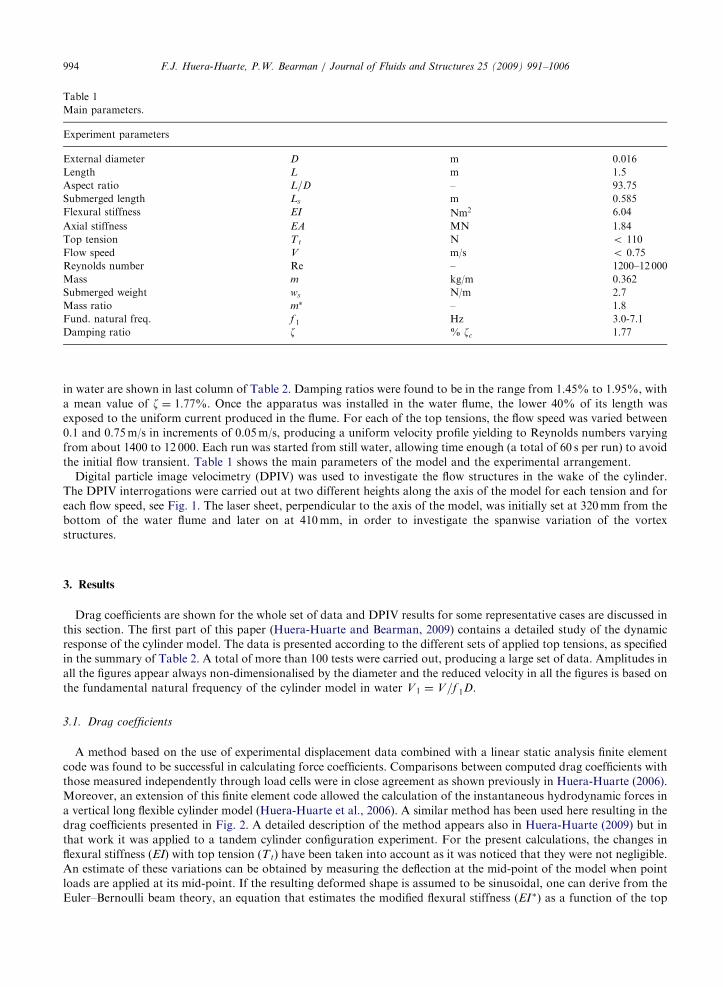
in water are shown in last column of Table 2. Damping ratios were found to be in the range from 1.45% to 1.95%, with
a mean value of z ¼ 1:77%. Once the apparatus was installed in the water flume, the lower 40% of its length was
exposed to the uniform current produced in the flume. For each of the top tensions, the flow speed was varied between
0.1 and 0.75m/s in increments of 0.05m/s, producing a uniform velocity profile yielding to Reynolds numbers varying
from about 1400 to 12 000. Each run was started from still water, allowing time enough (a total of 60 s per run) to avoid
the initial flow transient. Table 1 shows the main parameters of the model and the experimental arrangement.
Digital particle image velocimetry (DPIV) was used to investigate the flow structures in the wake of the cylinder.
The DPIV interrogations were carried out at two different heights along the axis of the model for each tension and for
each flow speed, see Fig. 1. The laser sheet, perpendicular to the axis of the model, was initially set at 320mm from the
bottom of the water flume and later on at 410mm, in order to investigate the spanwise variation of the vortex
structures.
3. Results
Drag coefficients are shown for the whole set of data and DPIV results for some representative cases are discussed in
this section. The first part of this paper (Huera-Huarte and Bearman, 2009) contains a detailed study of the dynamic
response of the cylinder model. The data is presented according to the different sets of applied top tensions, as specified
in the summary of Table 2. A total of more than 100 tests were carried out, producing a large set of data. Amplitudes in
all the figures appear always non-dimensionalised by the diameter and the reduced velocity in all the figures is based on
the fundamental natural frequency of the cylinder model in water V1 ¼ V=f 1D.
3.1. Drag coefficients
A method based on the use of experimental displacement data combined with a linear static analysis finite element
code was found to be successful in calculating force coefficients. Comparisons between computed drag coefficients with
those measured independently through load cells were in close agreement as shown previously in Huera-Huarte (2006).
Moreover, an extension of this finite element code allowed the calculation of the instantaneous hydrodynamic forces in
a vertical long flexible cylinder model (Huera-Huarte et al., 2006). A similar method has been used here resulting in the
drag coefficients presented in Fig. 2. A detailed description of the method appears also in Huera-Huarte (2009) but in
that work it was applied to a tandem cylinder configuration experiment. For the present calculations, the changes in
flexural stiffness (EI) with top tension (Tt) have been taken into account as it was noticed that they were not negligible.
An estimate of these variations can be obtained by measuring the deflection at the mid-point of the model when point
loads are applied at its mid-point. If the resulting deformed shape is assumed to be sinusoidal, one can derive from the
Euler–Bernoulli beam theory, an equation that estimates the modified flexural stiffness (EI�) as a function of the top
ARTICLE IN PRESS
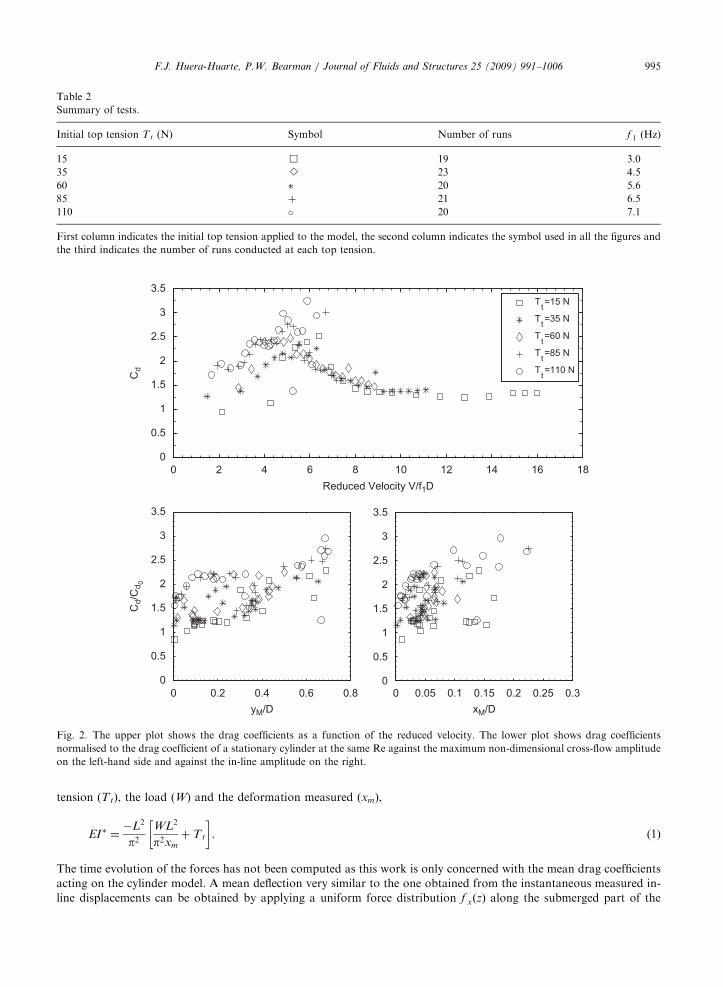
Table 2
Summary of tests.
Initial top tension Tt (N) Symbol Number of runs f 1 (Hz)
15 & 19 3.0
35 B 23 4.5
60 � 20 5.6
85 þ 21 6.5
110 � 20 7.1
First column indicates the initial top tension applied to the model, the second column indicates the symbol used in all the figures and
the third indicates the number of runs conducted at each top tension.
0 2 4 6 8 10 12 14 16 180
0.5
1
1.5
2
2.5
3
3.5
Cd
Reduced Velocity V/f1D
Tt=15 N
Tt=35 N
Tt=60 N
Tt=85 N
Tt=110 N
0 0.2 0.4 0.6 0.80
0.5
1
1.5
2
2.5
3
3.5
Cd/
Cd 0
yM/D0 0.05 0.1 0.15 0.2 0.25 0.3
0
0.5
1
1.5
2
2.5
3
3.5
xM/D
Fig. 2. The upper plot shows the drag coefficients as a function of the reduced velocity. The lower plot shows drag coefficients
normalised to the drag coefficient of a stationary cylinder at the same Re against the maximum non-dimensional cross-flow amplitude
on the left-hand side and against the in-line amplitude on the right.
F.J. Huera-Huarte, P.W. Bearman / Journal of Fluids and Structures 25 (2009) 991–1006 995
tension (Tt), the load (W) and the deformation measured (xm),
EI� ¼�L2
p2WL2
p2xm
þ Tt
� �. (1)
The time evolution of the forces has not been computed as this work is only concerned with the mean drag coefficients
acting on the cylinder model. A mean deflection very similar to the one obtained from the instantaneous measured in-
line displacements can be obtained by applying a uniform force distribution f xðzÞ along the submerged part of the
ARTICLE IN PRESSF.J. Huera-Huarte, P.W. Bearman / Journal of Fluids and Structures 25 (2009) 991–1006996
model (Ls). The integral of this force in z gives the total force acting on the cylinder,
Fx ¼
Z L
0
f xðzÞ dz. (2)
From this force, Cd can be easily obtained as
Cd ¼Fx
12rV2Ls
. (3)
By using an initial value of Cd equal to the expected drag coefficient for a stationary cylinder at the same Re, one can
construct an initially guessed uniform force distribution f xðzÞ. By inputting this distribution to the finite element code
mentioned previously, the corresponding deflection can be computed and compared to the experimental one obtained
from the experiments, in an iterative process. After each iteration, if the mean deflections are different, the drag
coefficient is updated. The comparison criterion stops the update process of the Cd when the area enclosed by the
deflections of both curves and the z axis differ less than a certain percentage value, which in this case was set to 0.1%.
In the upper plot of Fig. 2 the drag coefficients are shown as a function of the reduced velocity. Values between 1 and
3 are observed with increasing drag coefficient in the initial and upper branches. The highest values are found where the
largest cross-flow and in-line responses are seen. On the other hand, in the lower branch the drag coefficients rapidly
decrease to values typical of stationary cylinders at these Reynolds numbers. Similar values of drag coefficient and even
higher have been reported in past experiments such as Vandiver (1983), de Wilde and Huijsmans (2004) and Huera-
Huarte et al. (2006). The same coefficients but normalised to the drag coefficient of a stationary cylinder at the same
Reynolds number (Cd0) are shown in the lower left corner plot as a function of the maximum cross-flow amplitudes
(yM=D), and in the lower right corner plot versus the maximum in-line amplitudes (xM=D). The amplification of the
force coefficient with both the in-line and cross-flow amplitude appears evident, as previously reported in other
investigations.
3.2. Wake structures
The vortex patterns in the wake of freely vibrating 1-dof or 2-dof rigid cylinders have been extensively studied in the
past by several researchers, including Jauvtis and Williamson (2004) and Flemming and Williamson (2005). It is also
well know that for cylinders with variable geometry such as tapered cylinders, the wake patterns can change
considerably at different positions along their length (Techet et al., 1998). Flemming and Williamson (2005) found in
their study with a pivoted cylinder that wake patterns change along the length of the model finding similarities with the
vortex dynamics of tapered bodies as in Techet et al. (1998). They suggested that in vibrations of flexible bodies, the
same behaviour should be expected due to the variation in amplitude with distance between nodes. Hence, in
experiments such as the one presented here one should find different vortex dynamics at different positions along
the axis of the cylinder because the amplitudes vary according to the dominant structural mode shape of the motion.
This is the reason why it was decided to carry out DPIV interrogations at two positions below the free surface.
DPIV images were obtained at two planes perpendicular to the axis of the model at two different heights from the
bottom of the flume, z ¼ 320 and 410mm. These DPIV measurements were performed for three of the five sets of top
tension that appear in Table 2, i.e. 15, 60 and 110N. For each top tension the flow speed was increased from 0.1 to
0.7m/s with increments of 0.1. A total of more than 40 tests were carried out at each horizontal plane, producing more
than 80 experiments at different flow speeds and top tensions. The aim was to investigate the wake patterns for all the
reduced velocities along the submerged part of the riser model. In this section, six representative cases have been chosen
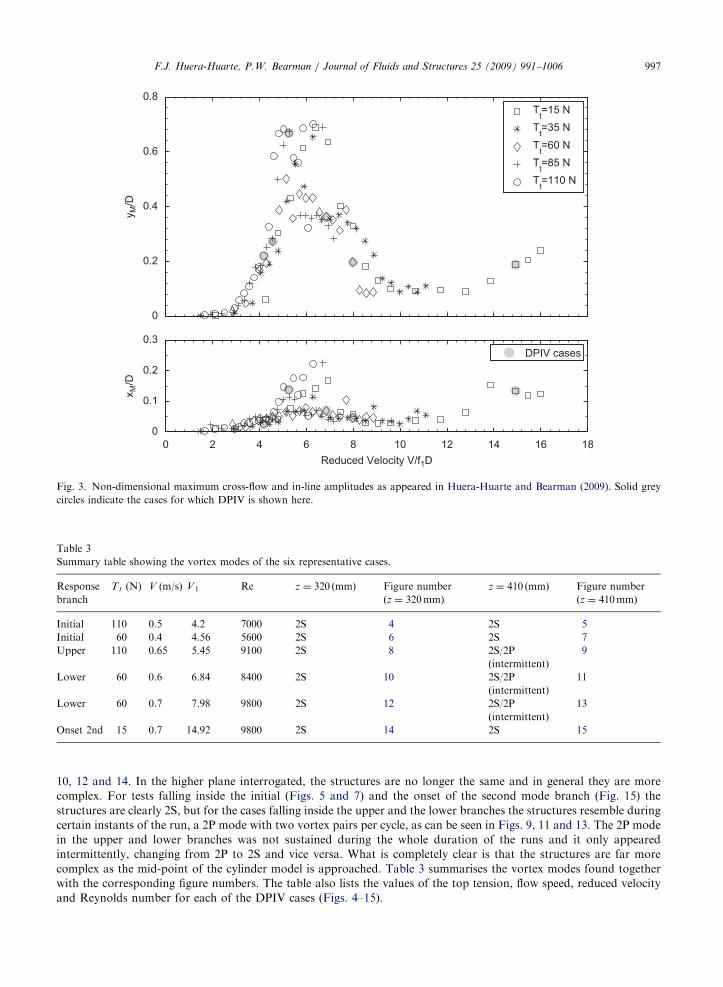
inside the different response branches to illustrate the vortex dynamics in the wake of the model. Fig. 3 shows the cross-
flow and in-line non-dimensional amplitudes as presented in Huera-Huarte and Bearman (2009). The solid circles in
that figure indicate each one of the six cases for which DPIV data is shown in the figures in this section.
Figs. 4, 6, 8, 10, 12 and 14 show the DPIV interrogations at z ¼ 320mm and Figs. 5, 7, 9, 11, 13 and 15 those at
z ¼ 410mm. In these figures the flow goes downwards and vorticity plots are presented every 115th of a second from left
to right in each row, starting in the upper left corner plot. The instantaneous position of the cylinder is shown by its
cross section in white. Each plot covers an area of the wake of the cylinder from y ¼ �4D on the left side of the plot to
y ¼ 4D on the right-hand side and from x ¼ 0 on the top margin (rest position) of the plot, to x ¼ 10D on the lower
one. The horizontal dashed line is at x ¼ 5D from the top margin and the three vertical lines are located at y ¼ �1D,
y ¼ 0 (rest position) and y ¼ 1D. The DPIV data obtained at z ¼ 320mm suggests that the main vortex structure is the
classical vortex street, with two single vortices per cycle or 2S, independently of the responding branch, 2S is found in
the initial, the upper, the lower and in the built up of the second mode branches as can be clearly seen from Figs. 4, 6, 8,
ARTICLE IN PRESS
0
0.2
0.4
0.6
0.8
y M/D
Tt=15 NTt=35 NTt=60 NTt=85 NTt=110 N
0 2 4 6 8 10 12 14 16 180
0.1
0.2
0.3
x M/D
Reduced Velocity V/f1D
DPIV cases
Fig. 3. Non-dimensional maximum cross-flow and in-line amplitudes as appeared in Huera-Huarte and Bearman (2009). Solid grey
circles indicate the cases for which DPIV is shown here.
Table 3
Summary table showing the vortex modes of the six representative cases.
Response
branch
Tt (N) V (m/s) V1 Re z ¼ 320 ðmmÞ Figure number
ðz ¼ 320mmÞ
z ¼ 410 ðmmÞ Figure number
ðz ¼ 410mmÞ
Initial 110 0.5 4.2 7000 2S 4 2S 5
Initial 60 0.4 4.56 5600 2S 6 2S 7
Upper 110 0.65 5.45 9100 2S 8 2S/2P
(intermittent)
9
Lower 60 0.6 6.84 8400 2S 10 2S/2P
(intermittent)
11
Lower 60 0.7 7.98 9800 2S 12 2S/2P
(intermittent)
13
Onset 2nd 15 0.7 14.92 9800 2S 14 2S 15
F.J. Huera-Huarte, P.W. Bearman / Journal of Fluids and Structures 25 (2009) 991–1006 997
10, 12 and 14. In the higher plane interrogated, the structures are no longer the same and in general they are more
complex. For tests falling inside the initial (Figs. 5 and 7) and the onset of the second mode branch (Fig. 15) the
structures are clearly 2S, but for the cases falling inside the upper and the lower branches the structures resemble during
certain instants of the run, a 2P mode with two vortex pairs per cycle, as can be seen in Figs. 9, 11 and 13. The 2P mode
in the upper and lower branches was not sustained during the whole duration of the runs and it only appeared
intermittently, changing from 2P to 2S and vice versa. What is completely clear is that the structures are far more
complex as the mid-point of the cylinder model is approached. Table 3 summarises the vortex modes found together
with the corresponding figure numbers. The table also lists the values of the top tension, flow speed, reduced velocity
and Reynolds number for each of the DPIV cases (Figs. 4–15).
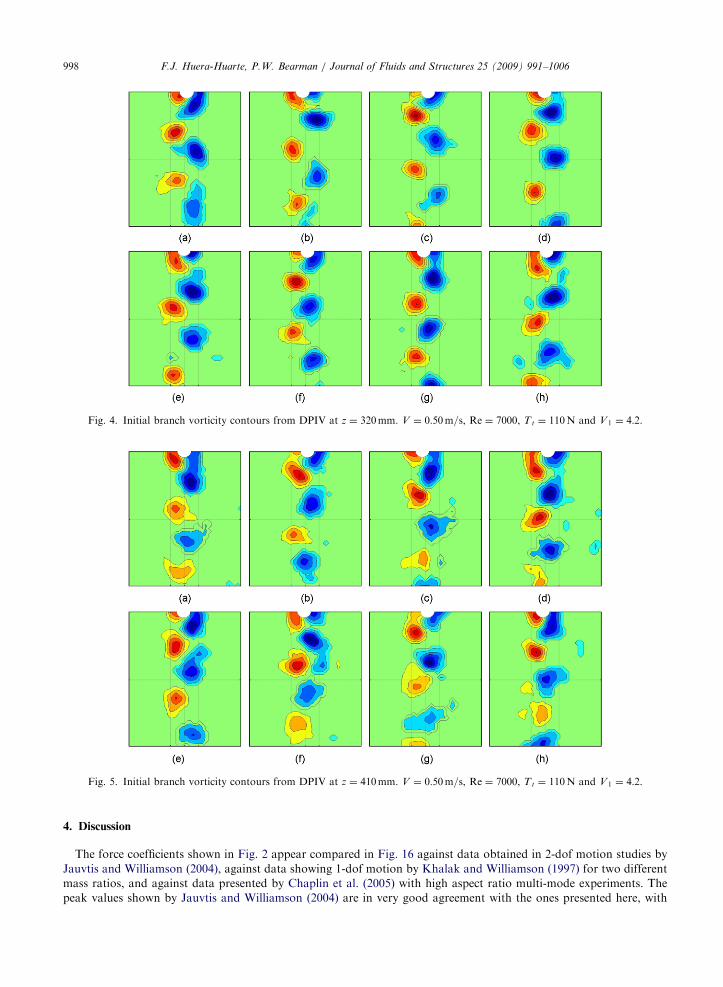
ARTICLE IN PRESS
Fig. 4. Initial branch vorticity contours from DPIV at z ¼ 320mm. V ¼ 0:50m=s, Re ¼ 7000, Tt ¼ 110N and V 1 ¼ 4:2.
Fig. 5. Initial branch vorticity contours from DPIV at z ¼ 410mm. V ¼ 0:50m=s, Re ¼ 7000, Tt ¼ 110N and V 1 ¼ 4:2.
F.J. Huera-Huarte, P.W. Bearman / Journal of Fluids and Structures 25 (2009) 991–1006998
4. Discussion
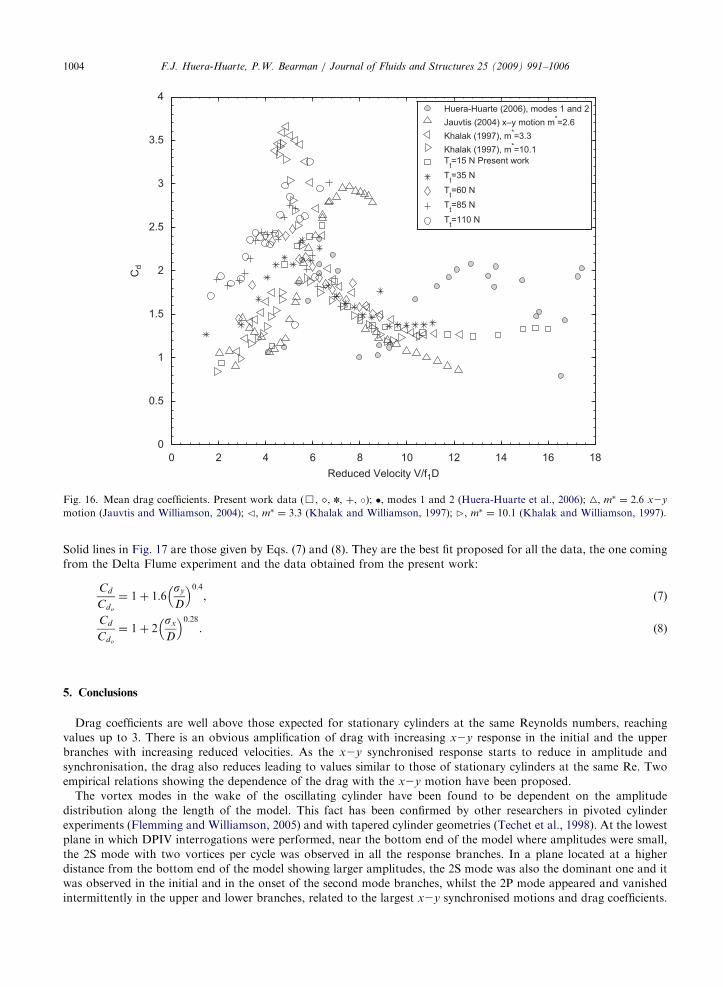
The force coefficients shown in Fig. 2 appear compared in Fig. 16 against data obtained in 2-dof motion studies by
Jauvtis and Williamson (2004), against data showing 1-dof motion by Khalak and Williamson (1997) for two different
mass ratios, and against data presented by Chaplin et al. (2005) with high aspect ratio multi-mode experiments. The
peak values shown by Jauvtis and Williamson (2004) are in very good agreement with the ones presented here, with
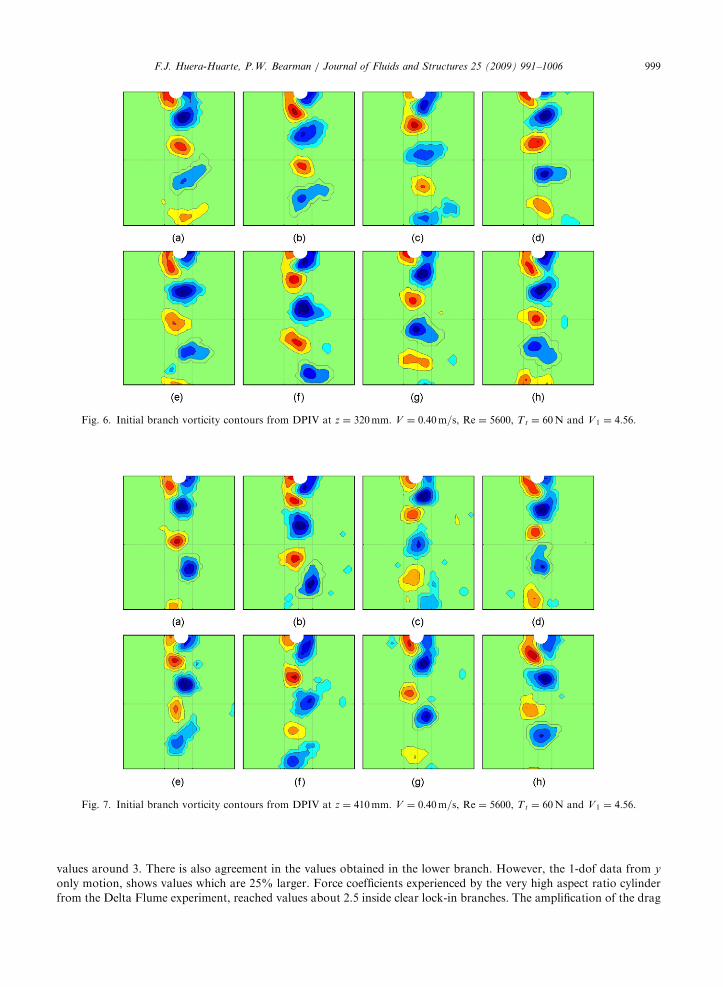
ARTICLE IN PRESS
Fig. 6. Initial branch vorticity contours from DPIV at z ¼ 320mm. V ¼ 0:40m=s, Re ¼ 5600, Tt ¼ 60N and V1 ¼ 4:56.
Fig. 7. Initial branch vorticity contours from DPIV at z ¼ 410mm. V ¼ 0:40m=s, Re ¼ 5600, Tt ¼ 60N and V1 ¼ 4:56.
F.J. Huera-Huarte, P.W. Bearman / Journal of Fluids and Structures 25 (2009) 991–1006 999
values around 3. There is also agreement in the values obtained in the lower branch. However, the 1-dof data from y
only motion, shows values which are 25% larger. Force coefficients experienced by the very high aspect ratio cylinder
from the Delta Flume experiment, reached values about 2.5 inside clear lock-in branches. The amplification of the drag
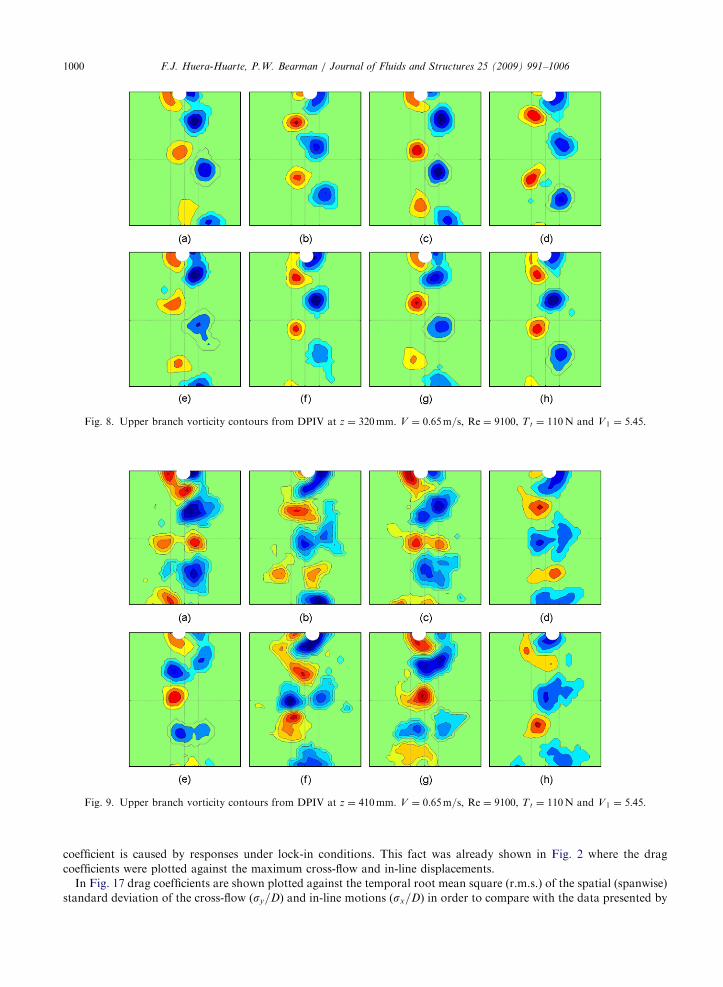
ARTICLE IN PRESS
Fig. 8. Upper branch vorticity contours from DPIV at z ¼ 320mm. V ¼ 0:65m=s, Re ¼ 9100, Tt ¼ 110N and V1 ¼ 5:45.
Fig. 9. Upper branch vorticity contours from DPIV at z ¼ 410mm. V ¼ 0:65m=s, Re ¼ 9100, Tt ¼ 110N and V1 ¼ 5:45.
F.J. Huera-Huarte, P.W. Bearman / Journal of Fluids and Structures 25 (2009) 991–10061000
coefficient is caused by responses under lock-in conditions. This fact was already shown in Fig. 2 where the drag
coefficients were plotted against the maximum cross-flow and in-line displacements.
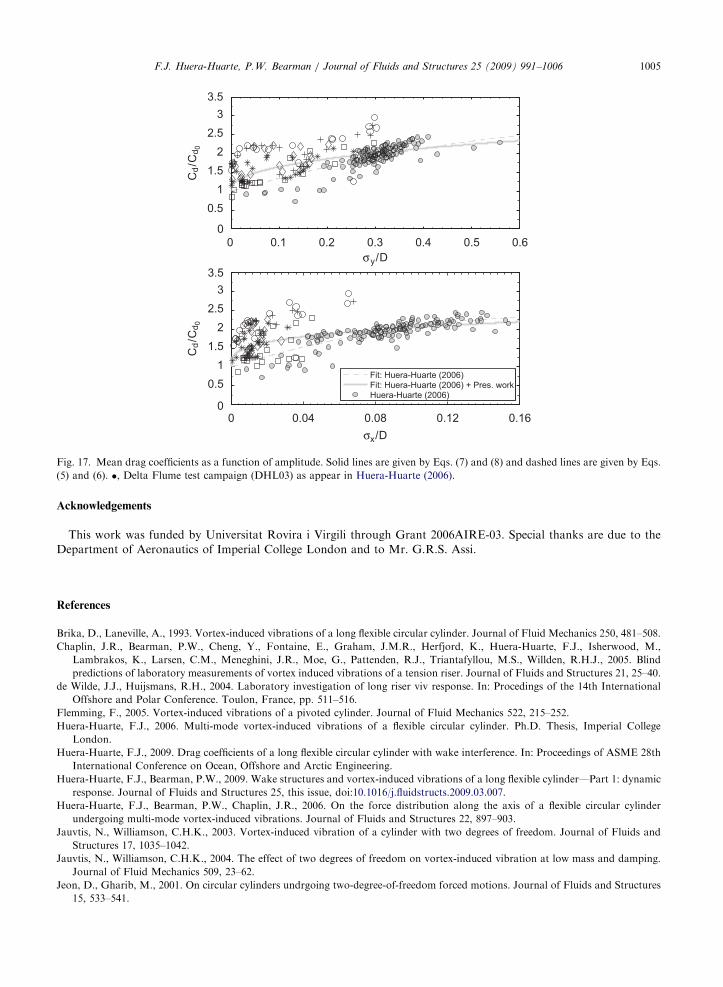
In Fig. 17 drag coefficients are shown plotted against the temporal root mean square (r.m.s.) of the spatial (spanwise)
standard deviation of the cross-flow (sy=D) and in-line motions (sx=D) in order to compare with the data presented by
ARTICLE IN PRESS
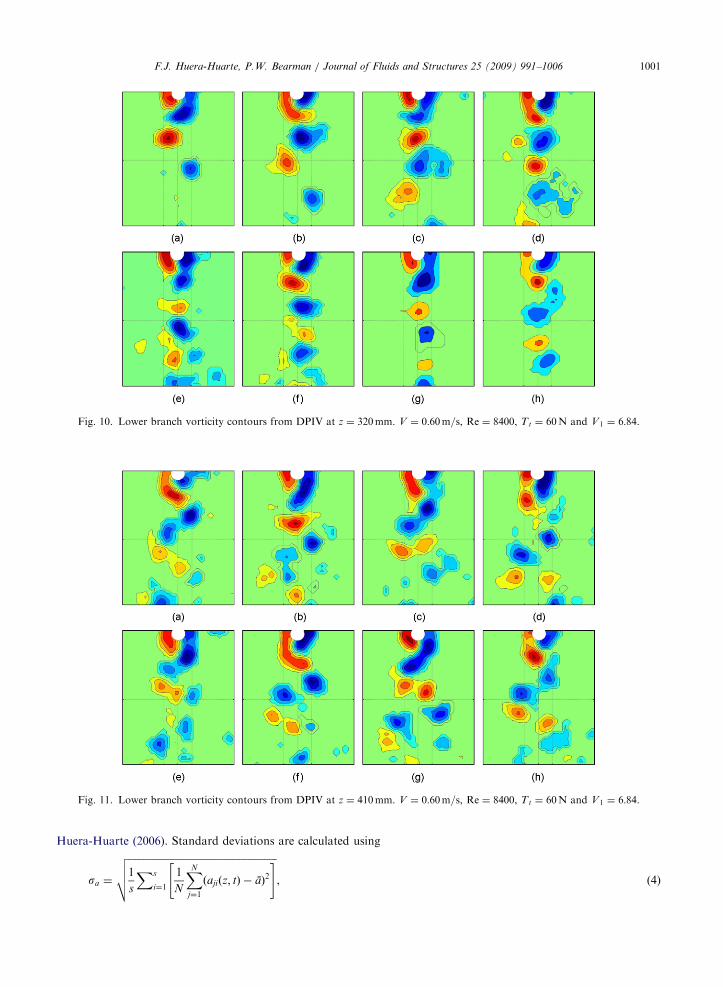
Fig. 10. Lower branch vorticity contours from DPIV at z ¼ 320mm. V ¼ 0:60m=s, Re ¼ 8400, Tt ¼ 60N and V1 ¼ 6:84.
Fig. 11. Lower branch vorticity contours from DPIV at z ¼ 410mm. V ¼ 0:60m=s, Re ¼ 8400, Tt ¼ 60N and V1 ¼ 6:84.
F.J. Huera-Huarte, P.W. Bearman / Journal of Fluids and Structures 25 (2009) 991–1006 1001
Huera-Huarte (2006). Standard deviations are calculated using
sa ¼
ffiffiffiffiffiffiffiffiffiffiffiffiffiffiffiffiffiffiffiffiffiffiffiffiffiffiffiffiffiffiffiffiffiffiffiffiffiffiffiffiffiffiffiffiffiffiffiffiffiffiffiffiffiffiffiffiffiffiffiffi1
s
Xs
i¼1
1
N
XN
j¼1
ðajiðz; tÞ � aÞ2
" #vuut , (4)
ARTICLE IN PRESS
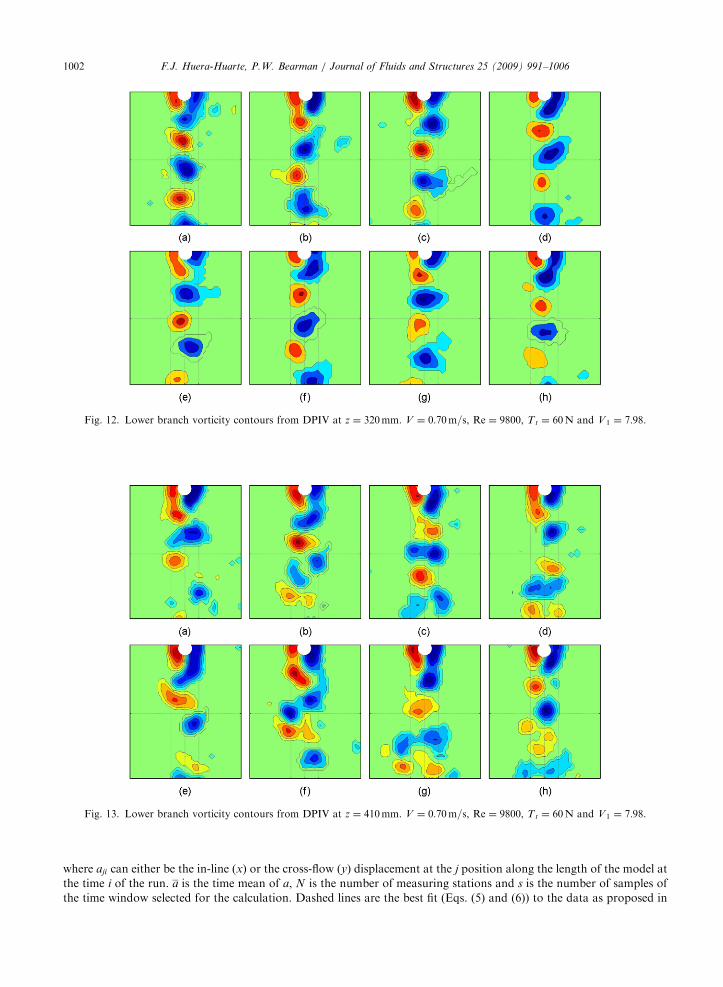
Fig. 12. Lower branch vorticity contours from DPIV at z ¼ 320mm. V ¼ 0:70m=s, Re ¼ 9800, Tt ¼ 60N and V1 ¼ 7:98.
Fig. 13. Lower branch vorticity contours from DPIV at z ¼ 410mm. V ¼ 0:70m=s, Re ¼ 9800, Tt ¼ 60N and V1 ¼ 7:98.
F.J. Huera-Huarte, P.W. Bearman / Journal of Fluids and Structures 25 (2009) 991–10061002
where aji can either be the in-line (x) or the cross-flow (y) displacement at the j position along the length of the model at
the time i of the run. a is the time mean of a, N is the number of measuring stations and s is the number of samples of
the time window selected for the calculation. Dashed lines are the best fit (Eqs. (5) and (6)) to the data as proposed in
ARTICLE IN PRESS
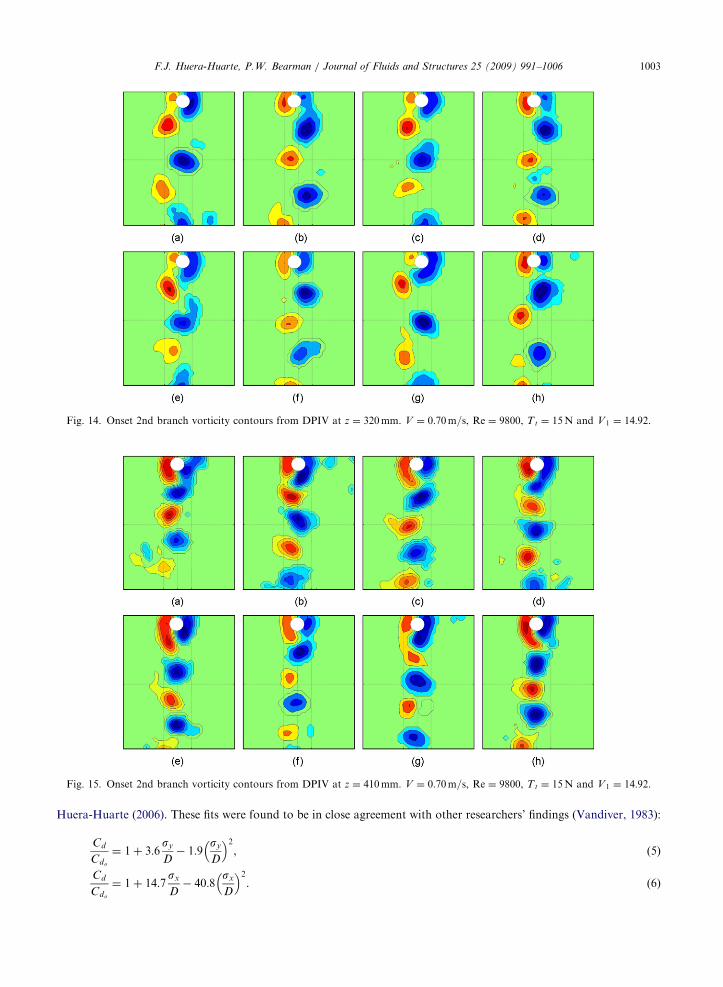
Fig. 14. Onset 2nd branch vorticity contours from DPIV at z ¼ 320mm. V ¼ 0:70m=s, Re ¼ 9800, Tt ¼ 15N and V 1 ¼ 14:92.
Fig. 15. Onset 2nd branch vorticity contours from DPIV at z ¼ 410mm. V ¼ 0:70m=s, Re ¼ 9800, Tt ¼ 15N and V 1 ¼ 14:92.
F.J. Huera-Huarte, P.W. Bearman / Journal of Fluids and Structures 25 (2009) 991–1006 1003
Huera-Huarte (2006). These fits were found to be in close agreement with other researchers’ findings (Vandiver, 1983):
Cd
Cdo
¼ 1þ 3:6sy
D� 1:9
sy
D
� �2, (5)
Cd
Cdo
¼ 1þ 14:7sx
D� 40:8
sx
D
� �2. (6)
ARTICLE IN PRESS
0 2 4 6 8 10 12 14 16 180
0.5
1
1.5
2
2.5
3
3.5
4
Cd
Reduced Velocity V/f1D
Huera-Huarte (2006), modes 1 and 2Jauvtis (2004) x–y motion m*=2.6Khalak (1997), m*=3.3Khalak (1997), m*=10.1Tt=15 N Present workTt=35 N
Tt=60 NTt=85 N
Tt=110 N
Fig. 16. Mean drag coefficients. Present work data (&, �, n, þ, �); �, modes 1 and 2 (Huera-Huarte et al., 2006); 4, m� ¼ 2:6 x2y
motion (Jauvtis and Williamson, 2004); /, m� ¼ 3:3 (Khalak and Williamson, 1997); ., m� ¼ 10:1 (Khalak and Williamson, 1997).
F.J. Huera-Huarte, P.W. Bearman / Journal of Fluids and Structures 25 (2009) 991–10061004
Solid lines in Fig. 17 are those given by Eqs. (7) and (8). They are the best fit proposed for all the data, the one coming
from the Delta Flume experiment and the data obtained from the present work:
Cd
Cdo
¼ 1þ 1:6sy
D
� �0:4, (7)
Cd
Cdo
¼ 1þ 2sx
D
� �0:28. (8)
5. Conclusions
Drag coefficients are well above those expected for stationary cylinders at the same Reynolds numbers, reaching
values up to 3. There is an obvious amplification of drag with increasing x2y response in the initial and the upper
branches with increasing reduced velocities. As the x2y synchronised response starts to reduce in amplitude and
synchronisation, the drag also reduces leading to values similar to those of stationary cylinders at the same Re. Two
empirical relations showing the dependence of the drag with the x2y motion have been proposed.
The vortex modes in the wake of the oscillating cylinder have been found to be dependent on the amplitude
distribution along the length of the model. This fact has been confirmed by other researchers in pivoted cylinder
experiments (Flemming and Williamson, 2005) and with tapered cylinder geometries (Techet et al., 1998). At the lowest
plane in which DPIV interrogations were performed, near the bottom end of the model where amplitudes were small,
the 2S mode with two vortices per cycle was observed in all the response branches. In a plane located at a higher
distance from the bottom end of the model showing larger amplitudes, the 2S mode was also the dominant one and it
was observed in the initial and in the onset of the second mode branches, whilst the 2P mode appeared and vanished
intermittently in the upper and lower branches, related to the largest x2y synchronised motions and drag coefficients.
ARTICLE IN PRESS
0 0.1 0.2 0.3 0.4 0.5 0.60
0.51
1.52
2.53
3.5
Cd/
Cd 0
Cd/
Cd 0
σy/D
0 0.04 0.08 0.12 0.160
0.51
1.52
2.53
3.5
σx/D
Fit: Huera-Huarte (2006)Fit: Huera-Huarte (2006) + Pres. workHuera-Huarte (2006)
Fig. 17. Mean drag coefficients as a function of amplitude. Solid lines are given by Eqs. (7) and (8) and dashed lines are given by Eqs.
(5) and (6). �, Delta Flume test campaign (DHL03) as appear in Huera-Huarte (2006).
F.J. Huera-Huarte, P.W. Bearman / Journal of Fluids and Structures 25 (2009) 991–1006 1005
Acknowledgements
This work was funded by Universitat Rovira i Virgili through Grant 2006AIRE-03. Special thanks are due to the
Department of Aeronautics of Imperial College London and to Mr. G.R.S. Assi.
References
Brika, D., Laneville, A., 1993. Vortex-induced vibrations of a long flexible circular cylinder. Journal of Fluid Mechanics 250, 481–508.
Chaplin, J.R., Bearman, P.W., Cheng, Y., Fontaine, E., Graham, J.M.R., Herfjord, K., Huera-Huarte, F.J., Isherwood, M.,
Lambrakos, K., Larsen, C.M., Meneghini, J.R., Moe, G., Pattenden, R.J., Triantafyllou, M.S., Willden, R.H.J., 2005. Blind
predictions of laboratory measurements of vortex induced vibrations of a tension riser. Journal of Fluids and Structures 21, 25–40.
de Wilde, J.J., Huijsmans, R.H., 2004. Laboratory investigation of long riser viv response. In: Procedings of the 14th International
Offshore and Polar Conference. Toulon, France, pp. 511–516.
Flemming, F., 2005. Vortex-induced vibrations of a pivoted cylinder. Journal of Fluid Mechanics 522, 215–252.
Huera-Huarte, F.J., 2006. Multi-mode vortex-induced vibrations of a flexible circular cylinder. Ph.D. Thesis, Imperial College
London.
Huera-Huarte, F.J., 2009. Drag coefficients of a long flexible circular cylinder with wake interference. In: Proceedings of ASME 28th
International Conference on Ocean, Offshore and Arctic Engineering.
Huera-Huarte, F.J., Bearman, P.W., 2009. Wake structures and vortex-induced vibrations of a long flexible cylinder—Part 1: dynamic
response. Journal of Fluids and Structures 25, this issue, doi:10.1016/j.fluidstructs.2009.03.007.
Huera-Huarte, F.J., Bearman, P.W., Chaplin, J.R., 2006. On the force distribution along the axis of a flexible circular cylinder
undergoing multi-mode vortex-induced vibrations. Journal of Fluids and Structures 22, 897–903.
Jauvtis, N., Williamson, C.H.K., 2003. Vortex-induced vibration of a cylinder with two degrees of freedom. Journal of Fluids and
Structures 17, 1035–1042.
Jauvtis, N., Williamson, C.H.K., 2004. The effect of two degrees of freedom on vortex-induced vibration at low mass and damping.
Journal of Fluid Mechanics 509, 23–62.
Jeon, D., Gharib, M., 2001. On circular cylinders undrgoing two-degree-of-freedom forced motions. Journal of Fluids and Structures
15, 533–541.
ARTICLE IN PRESSF.J. Huera-Huarte, P.W. Bearman / Journal of Fluids and Structures 25 (2009) 991–10061006
Khalak, A., Williamson, C.H.K., 1997. Fluid forces and dynamics of a hydroelastic structure with very low mass and damping. Journal
of Fluids and Structures 11, 973–981.
Khalak, A., Williamson, C.H.K., 1999. Motions, forces and mode transitions in vortex-induced vibrations at low mass-damping.
Journal of Fluids and Structures 13, 813–851.
King, R., Prosser, M.J., Johns, D.J., 1973. On vortex excitation of model piles in water. Journal of Sound and Vibration 29, 169–188.
Laneville, A., 2006. On vortex-induced vibrations of cylinders describing xy trajectories. Journal of Fluids and Structures 22, 773–782.
Sanchis, A., Sælevik, G., Grue, J., 2008. Two-degree-of-freedom vortex-induced vibrations of a spring-mounted rigid cylinder with low
mass ratio. Journal of Fluids and Structures 24, 907–919.
Techet, A., Hover, F., Triantafyllou, M., 1998. Vortical patterns behind a tapered cylinder oscillating transversely to a uniform flow.
Journal of Fluid Mechanics 363, 79–96.
Vandiver, J.K., May 1983. Drag coefficients of long flexible cylinders. In: Offshore Technology Conference, Texas, USA.
Williamson, C.H.K., Roshko, A., 1988. Vortex formation in the wake of an oscillating cylinder. Journal of Fluids and Structures 2,
355–381.
Wooton, L.R., Warner, M.H., Cooper, D.H., 1974. Some aspects of the oscillations of full-scale piles. In: Flow-Induced Structural
Vibrations. Naudascher, E. (Ed.), Springer, Berlin, pp. 587–601.