Embed Size (px)
Citation preview
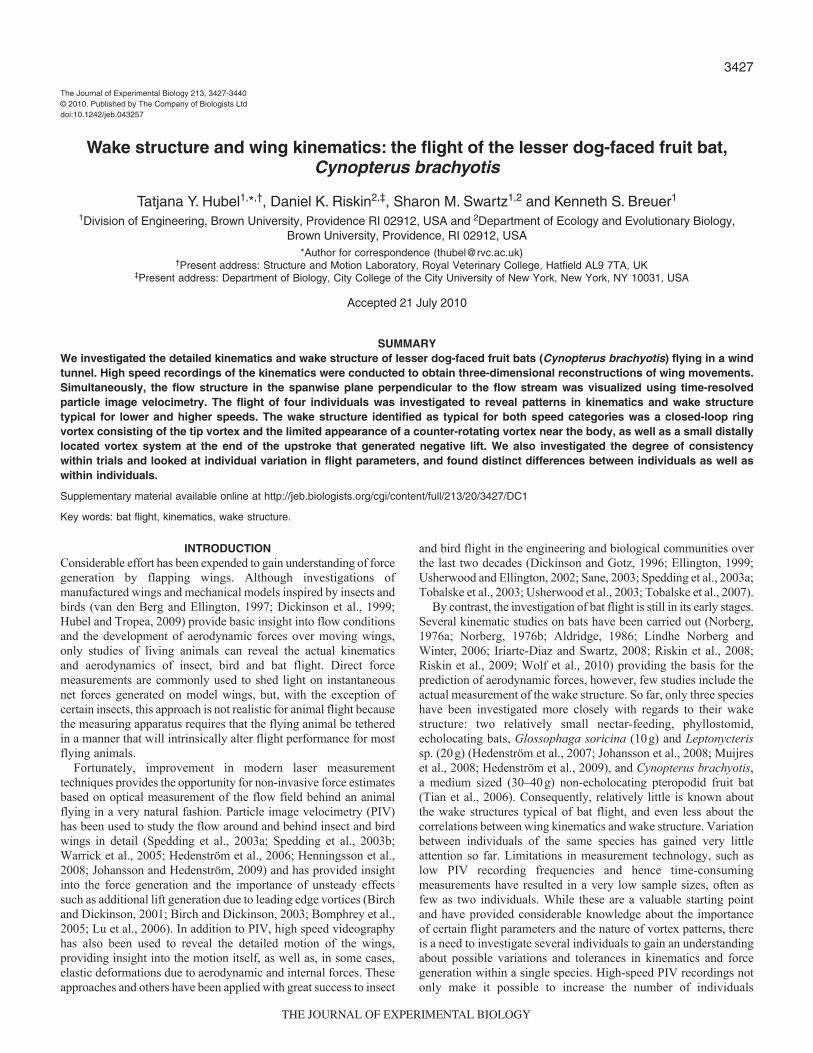
3427
INTRODUCTIONConsiderable effort has been expended to gain understanding of forcegeneration by flapping wings. Although investigations ofmanufactured wings and mechanical models inspired by insects andbirds (van den Berg and Ellington, 1997; Dickinson et al., 1999;Hubel and Tropea, 2009) provide basic insight into flow conditionsand the development of aerodynamic forces over moving wings,only studies of living animals can reveal the actual kinematicsand aerodynamics of insect, bird and bat flight. Direct forcemeasurements are commonly used to shed light on instantaneousnet forces generated on model wings, but, with the exception ofcertain insects, this approach is not realistic for animal flight becausethe measuring apparatus requires that the flying animal be tetheredin a manner that will intrinsically alter flight performance for mostflying animals.
Fortunately, improvement in modern laser measurementtechniques provides the opportunity for non-invasive force estimatesbased on optical measurement of the flow field behind an animalflying in a very natural fashion. Particle image velocimetry (PIV)has been used to study the flow around and behind insect and birdwings in detail (Spedding et al., 2003a; Spedding et al., 2003b;Warrick et al., 2005; Hedenström et al., 2006; Henningsson et al.,2008; Johansson and Hedenström, 2009) and has provided insightinto the force generation and the importance of unsteady effectssuch as additional lift generation due to leading edge vortices (Birchand Dickinson, 2001; Birch and Dickinson, 2003; Bomphrey et al.,2005; Lu et al., 2006). In addition to PIV, high speed videographyhas also been used to reveal the detailed motion of the wings,providing insight into the motion itself, as well as, in some cases,elastic deformations due to aerodynamic and internal forces. Theseapproaches and others have been applied with great success to insect
and bird flight in the engineering and biological communities overthe last two decades (Dickinson and Gotz, 1996; Ellington, 1999;Usherwood and Ellington, 2002; Sane, 2003; Spedding et al., 2003a;Tobalske et al., 2003; Usherwood et al., 2003; Tobalske et al., 2007).
By contrast, the investigation of bat flight is still in its early stages.Several kinematic studies on bats have been carried out (Norberg,1976a; Norberg, 1976b; Aldridge, 1986; Lindhe Norberg andWinter, 2006; Iriarte-Diaz and Swartz, 2008; Riskin et al., 2008;Riskin et al., 2009; Wolf et al., 2010) providing the basis for theprediction of aerodynamic forces, however, few studies include theactual measurement of the wake structure. So far, only three specieshave been investigated more closely with regards to their wakestructure: two relatively small nectar-feeding, phyllostomid,echolocating bats, Glossophaga soricina (10g) and Leptonycterissp. (20g) (Hedenström et al., 2007; Johansson et al., 2008; Muijreset al., 2008; Hedenström et al., 2009), and Cynopterus brachyotis,a medium sized (30–40g) non-echolocating pteropodid fruit bat(Tian et al., 2006). Consequently, relatively little is known aboutthe wake structures typical of bat flight, and even less about thecorrelations between wing kinematics and wake structure. Variationbetween individuals of the same species has gained very littleattention so far. Limitations in measurement technology, such aslow PIV recording frequencies and hence time-consumingmeasurements have resulted in a very low sample sizes, often asfew as two individuals. While these are a valuable starting pointand have provided considerable knowledge about the importanceof certain flight parameters and the nature of vortex patterns, thereis a need to investigate several individuals to gain an understandingabout possible variations and tolerances in kinematics and forcegeneration within a single species. High-speed PIV recordings notonly make it possible to increase the number of individuals
The Journal of Experimental Biology 213, 3427-3440© 2010. Published by The Company of Biologists Ltddoi:10.1242/jeb.043257
Wake structure and wing kinematics: the flight of the lesser dog-faced fruit bat,Cynopterus brachyotis
Tatjana Y. Hubel1,*,†, Daniel K. Riskin2,‡, Sharon M. Swartz1,2 and Kenneth S. Breuer1
1Division of Engineering, Brown University, Providence RI 02912, USA and 2Department of Ecology and Evolutionary Biology,Brown University, Providence, RI 02912, USA
*Author for correspondence ([email protected])†Present address: Structure and Motion Laboratory, Royal Veterinary College, Hatfield AL9 7TA, UK
‡Present address: Department of Biology, City College of the City University of New York, New York, NY 10031, USA
Accepted 21 July 2010
SUMMARYWe investigated the detailed kinematics and wake structure of lesser dog-faced fruit bats (Cynopterus brachyotis) flying in a windtunnel. High speed recordings of the kinematics were conducted to obtain three-dimensional reconstructions of wing movements.Simultaneously, the flow structure in the spanwise plane perpendicular to the flow stream was visualized using time-resolvedparticle image velocimetry. The flight of four individuals was investigated to reveal patterns in kinematics and wake structuretypical for lower and higher speeds. The wake structure identified as typical for both speed categories was a closed-loop ringvortex consisting of the tip vortex and the limited appearance of a counter-rotating vortex near the body, as well as a small distallylocated vortex system at the end of the upstroke that generated negative lift. We also investigated the degree of consistencywithin trials and looked at individual variation in flight parameters, and found distinct differences between individuals as well aswithin individuals.
Supplementary material available online at http://jeb.biologists.org/cgi/content/full/213/20/3427/DC1
Key words: bat flight, kinematics, wake structure.
THE JOURNAL OF EXPERIMENTAL BIOLOGY
3428
investigated because of faster data collection, they also make itpossible to follow the time-resolved development of single wingbeatcycles, avoiding errors and uncertainties due to the reconstructionof a wingbeat cycle from several distinct realizations (Hedenströmet al., 2009; Hubel et al., 2009). In addition, they alleviate theproblem of investigating animals that cannot easily be trained to flyat a fixed position, such as non-hovering bat species.
Here, we report on a study in which we have measured the wakestructure in the spanwise (or transverse) plane behind fourCynopterus brachyotis in two different flight speed ranges. Usingtime-resolved PIV with a sampling rate of 200Hz, we were able tocapture approximately 30 PIV images over each wingbeat cycle.Synchronized with the PIV data, three-dimensional (3-D) wingmotion was then reconstructed to provide information aboutkinematic parameters such as flapping frequency, angle of attack,amplitude etc., in addition to the precise spatial location of vortexstructures and anatomical landmarks of the wing. The current studygreatly extends the initial demonstration of time-resolved PIV byour group (Hubel et al., 2009), providing significantly more detailon the wake vortex structure and kinematics, as well as considerabledetail regarding variation between individuals in both kinematicsand wake patterns.
MATERIALS AND METHODSBats
Four captive-bred female lesser dog-faced fruit bats, Cynopterusbrachyotis (Müller 1838), were trained to fly in the low-speed windtunnel in the Division of Engineering at Brown University, RI, USA.Each bat was flown at least twice a week over the period of thestudy. All experiments were conducted with the authorization ofthe Institutional Animal Care and Use Committees of BrownUniversity, the Lubee Bat Conservancy, and the Division ofBiomedical Research and Regulatory Compliance of the Office ofthe Surgeon General of the United States Air Force.
The body mass of each bat was measured before the recordingsession. Both the morphological characteristics of each bat and thewingbeat cycle descriptors were determined directly from in-flightkinematic measurements (described below). Wing span was definedas twice the maximum distance between body midpoint (see belowfor definition of anatomical landmarks) and the wingtip, and thewing chord was defined by the maximum distance between wristand tip of the fifth digit. We calculate the chord in this way becausewing extension changes greatly over the course of the wingbeatcycle, in contrast to a much smaller change in this anatomicallydefined wing chord. A calculation of wing chord based on extensionand area would therefore be misleading, especially considering theuncertainty in the area calculation resulting from wing curling. Theanatomical chord is, in this case, a considerably more reliable value.However, for comparison, we also provide the chord value basedon wing area and wingspan averaged over the wing beat cycle. Amean and standard deviation were calculated for chord, span andmass of all bats (Table1). Span and chord were calculated usingthe first wingbeat cycle when the bat was in the field of view ofboth kinematic and PIV cameras.
Wind tunnelThe measurements were conducted in a closed-circuit wind tunnelwith the test section having a cross section of 0.60m�0.82m (height� width) and a length of 3.8m. The original low free-streamturbulence level of 0.08% was increased to 0.5% by the installationof a fine-mesh (600wires per meter) net at the upstream entranceto the test section to prevent the bats from entering the settling
chamber (Hubel et al., 2009). The mesh generates an array of jets(Re ~ 400 at 5ms–1) which quickly merge to form a very fine-grainedturbulent background noise and, although this turbulence level wassomewhat greater than that of the net-free flow, the mesh did notgenerate structured, coherent wakes, as has been seen in someinstances (i.e. Spedding et al., 2009), and did not affect the bat flightin any discernable manner. The bats were introduced into the sectionby hand at the downstream end of the test section. They flewupstream and landed on a screen mesh that was offered to themafter they passed through the measurement volume. Experimentswere conducted at two wind speeds: 3.8 and 5.8ms–1. Afteraccounting for the additional speed of the bats, the resulting averageflight speeds were 5.0±0.1ms–1 and 6.7±0.4ms–1 (mean ± s.d.).
The limited observation area required the bat to fly close to thegeometric center of the cross section of the test section to be ableto successfully record PIV images of one or more wingbeat cycles.No corrective maneuvers were necessary or observed for theseconsecutive wingbeat cycles. Ground effects have been reported tobe significant for a dimensionless height, G<0.5 [Gheight(h)/wing semispan (b)] while having very little effect for G>1(Rayner, 1991). Flying in the middle of the test section, G wascalculated to be above 1.5 for our bats, therefore any ground andwall effects have been assumed to be negligible.
A right-handed coordinate system was defined in which positivex was defined in the direction of the wind (negative in the flightdirection of the bat). The y-coordinate is positive from center of thebat towards the tip of the right wing, and the z-coordinate is positivein the vertical upward direction.
Depending on the particular analysis, results are presented in (1)a bat-centered coordinate system with the origin located at the bodymarker centered between the scapulae, roughly 1.5cm caudal to theskull, (2) a wind tunnel-fixed coordinate system, or (3) a combinationcoordinate system, in which the y- and z-coordinates are in the bat-centered system but the origin of the x-axis is fixed at the planewhere PIV measurements were acquired.
KinematicsThe movements of the bats’ bodies and wings were recorded usingthree Photron 1024 PCI high speed cameras (1024�1024pixels,200f.p.s., shutter speed 1/1000s; Photron USA, Inc., San Diego,CA, USA), synchronized with the PIV recordings. Two halogenlamps were used for illumination, pointing away from the PIVcameras so as to minimize light pollution. Red filters were placedover the lights so that light for high-speed video did not interferewith the shorter wavelength light used for PIV, and so that the lightswere less disruptive to the bats. The kinematic camera calibrationwas achieved by calculating the direct linear transformation (DLT)coefficients (Abdel-Aziz and Karara, 1971) by manually tracking144 calibration markers in four different planes within themeasurement volume.
Kinematics measurements were obtained by tracking high-contrast markers which were non-toxic white paint on five locations
T. Y. Hubel and others
Table1. Mean and standard deviation of span, chord and mass ofthe four study subjects
Span b (m) Chord c (m) Chord cAw/b (m) Massm (g)
Bat I 0.171±0.003 0.075±0.001 0.057±0.003 30.0±1.0Bat II 0.171±0.004 0.078±0.001 0.063±0.003 31.3±2.1Bat III 0.180±0.006 0.084±0.001 0.058±0.01 38.3±1.3Bat IV 0.172±0.004 0.084±0.001 0.053±0.005 36.3±0.1
THE JOURNAL OF EXPERIMENTAL BIOLOGY
3429Flight of Cynopterus brachyotis
on the bat: the midline of bat’s body, overlying the vertebral columnand midway between the scapulae; the right foot at the ankle joint;the right carpus; the tip of the distal phalanx of right digit III; andthe tip of the distal phalanx of right digit V (Fig.1).
Each marker was tracked in each camera view to obtain 2-Dcoordinates; gaps in the data resulting from obstruction of themarkers were then filled using a third-order polynomial. 3-Dcoordinates were calculated based on the DLT coefficients andvalidated by projecting them on all three camera views. Completewingbeat cycles within one trial were identified and subdividedaccording to the upper reversal point of the wingtip. Each wingbeatcycle contained approximately 28–32 kinematic frames, but becauseof the Doppler effect 34–37PIV frames were recorded (see below:Correlation of kinematics and PIV). For ease of analysis, allwingbeat cycles were interpolated in order to achieve a uniformnumber of 35 frames per cycle.
Based on the motions of the body markers, the velocity andacceleration of the bat were calculated in the global coordinatesystem. The horizontal speed of the bat, UB, was calculated as thedistance traveled in the x-direction during a complete wingbeat cycle,divided by travel time. This value was negative because it refers totravel in the negative, upstream direction in the global coordinatesystem. The ground speed, Ut, was calculated from the combinationof the wind speed (U�) and the bat’s true air speed (UB): UtU�–UB.The horizontal and vertical accelerations, ax and az respectively,were calculated from the change in horizontal and vertical velocitiesobserved over a full wingbeat cycle.
Additional parameters calculated in the global coordinate systemwere the wingbeat period, T, and its reciprocal, the flappingfrequency, f, as well as the geometric angle of attack, ag. Thewingbeat period, T, was defined as the time between two consecutiveupper reversal points of the wingtip. The geometric angle of attack,ag, was defined as the angle between the resultant flow due toflapping, forward flight and wind tunnel speed and the chord line.The chord line was determined by the wrist position and thecorresponding location on the trailing edge parallel to the body,between the foot and the fifth digit.
The global coordinate system was transformed to a body-referencedcoordinate system by subtracting the body marker position from theglobal coordinates, and additional flight parameters were calculated.The downstroke ratio, t, was defined as downstroke period dividedby the total wingbeat period based on the wingtip motion in the z-direction. The wing stroke amplitude, qtip, defines the maximum anglebetween wingtip positions relative to the midline body marker on thebat’s back over the course of a wingbeat cycle. Although many studiesof bat flight kinematics define wingbeat amplitude measurements bymovements of the wingtip or wrist with respect to the shoulder,markers on the skin at the shoulder are subject to greater skin motion
relative to the position of the joint than markers on the body or wing(Riskin et al., 2008). Moreover, the shoulder moves relative to thespine because the clavicle participates significantly in the skeletalmotion of the wingbeat, hence the shoulder motion is a meaningfulelement of the wing motion in bats. We therefore chose the midlinebody marker as our reference, finding that it gives us a repeatableand intuitive measurement of wing stroke amplitude. Assuming aconstant distance between the body marker and the shoulder jointover the wing beat cycle, we estimate amplitude based on the shoulderto be roughly 5.6deg larger than that based on the body marker.
Stroke plane angle, , is the angle between the horizontal and alinear regression line fitted to the wingtip trajectory of the wingtipin the x–z plane. It was also useful to monitor the wing-retraction(how close the bat pulled its wing to its body during the upstroke)and for this, the minimum body-to-tip distance, dmin, was definedas the minimum 3-D distance between body marker and wing tip.Finally, the Reynolds number, RU�c/n and reduced frequency,kpfc/U�, were calculated as well.
Span ratio, SR, is the ratio of wing span in up- to downstroke,and was calculated for the wing passing through the horizontal plane.However, the span ratio gives no information about curling, a motionoccurring distal to the elbow, as a result of flexion of themetacarpophalangeal and interphalangeal joints, and, perhaps,deformation of the elongated, slender phalanges. In our opinion,curling is better expressed by the minimum distance between wingtip and body, not necessarily occurring at mid-upstroke.
Particle image velocimetryThe PIV measurements were performed using a 200Hz double-pulseNd:YAG laser (Litron LPY 703-200/100, 532nm; Rugby, UK),synchronized with the kinematics cameras. Di-ethyl-hexyl-sebacate(DEHS) was used for particle generation using a custom-built foggenerator with a Laskin-type nozzle (particle size ~1mm). Thedisplacement of the seeding particles was recorded with two high-resolution CMOS cameras (Photron 1024 PCI, resolution1024�1024pixels) equipped with band-pass filters. These two PIVcameras were located perpendicular to the flow stream at the endof the test section, and thus observed the wake structure in the y–z-plane. The two cameras were stacked in the vertical direction,capturing two slightly overlapping images that were merged togetherafterwards to accommodate the large size of the observation areanecessary to capture a whole wingbeat cycle (0.23m�0.41mwidth�height). Stitching of the two images was accomplished byusing the stitching tool in the DaVis software.
To reduce any effect of parallax error that may arise from carryingout 2-D PIV in cross-stream flow, we carried out a subtraction ofbackground flow prior to merging the velocity fields from the twocameras. This change in processing resulted in only a 4% changein total circulation. Owing to the large size of the observation area,any parallax displacement was less than one-tenth of a pixeldisplacement which is near the limits of resolution for this PIV setupand therefore had negligible effect on our measurements.Furthermore, parallax effects have little influence on wake structureinterpretations based on the vorticity fields, making this approachan especially suitable solution to the challenge of describing therelatively large wakes generated by bats of this body and wing size.
Limited pulse energy and camera resolution requires acompromise between image quality and size of the observation area,restricting wake capture to the area between body and right wing.The wake structure was mirrored under the assumption that left andright wings generate similar circulation in steady forward flight.This approach will necessarily impose a symmetrical wake structure
Span of one wing (b)
y
xBody
Foot
Wrist
5th digit
Wing tip
Fig.1. Marked positions on the dorsal surface of the bat.
THE JOURNAL OF EXPERIMENTAL BIOLOGY
3430
even where slight difference between right and left wing would havebeen present but not recorded, but given that the PIV observationarea is limited and that all trials analyzed were straight or nearlystraight flight, we believe mirroring the wake is physicallyappropriate. Mirroring of the smoothed swirl field occurred alongthe line of the body trajectory at the body marker position, in thex–z-plane.
Because of the risks to the bats from the energy-intense PIV laser,a laser-light safety curtain was installed 0.05m upstream of the PIVlaser-illuminated cross section, gating the operation of the PIVsystem. The safety light curtain consists of an array of 21 low-powerred diode lasers spanning the entire test section, each aimed at acomplementary photodiode. Breaking one of the beams resulted inblocking the Q-switch signals, shutting the PIV system down toprevent any potential harm to skin and eyes of the bats.
The PIV space was calibrated using the same calibration plateas was described above for the kinematics system. Using a singlecalibration plate with the origin of the coordinate system visible inboth kinematics and PIV cameras allowed for simultaneous butindependent calibrations, greatly simplifying image synchronization.The calibration parameters are achieved by using a pinholecalibration (Hartley and Zissermann, 2000).
The PIV measurement sequence was initiated using a manuallyoperated trigger which was activated once the bat was observed tosafely fly upstream of the location of the laser light sheet. The triggerenabling the safety curtain was switched on, which subsequentlyenabled the PIV laser, which continued to fire as long as the batflew away from the laser light. Several seconds of PIV and datacould be acquired, which was sufficient to allow the bat to flythrough the kinematic measurement volume, and to land on theretrieval net approximately 1m further upstream.
The PIV images were recorded and analyzed using DaVis 7.2software (LaVision). Vector fields were calculated using sequentialcross-correlation with multi-pass iterations with decreasing size(128�128, two iterations to 64�64, two iterations, 50% overlap).Post processing consisted of the replacements of vectors with peakratio Q<1.2 and average neighborhood variation >1.5�rms usinginterpolation and the application of a simple 3�3 smoothing filter.Subsequently, the vector fields were exported and processed inMatlab (The Mathworks, Inc., Natick, MA, USA).
The vorticity and swirl (the rotational part of the local two-dimensional rate-of-strain tensor), were calculated in order tovisualize the development of wake structure over time. The vorticitywas calculated in the following manner:
where v and w are the velocity components in the y- and z-directions.Vorticity contains both rotation and shear information, hence the
swirl was used to minimize noise in the isosurface reconstructionsby showing only the rotational part of the vortex (Adrian et al.,2000). The swirl was calculated in the following manner:
Only the positive part of the swirl was used, while the negativepart, representing the shear, was set to zero. In displaying results,isosurfaces of swirl are used to show a 3-D reconstruction of thewake structure based on the 2-D PIV measurements in the y–z-plane.Since swirl is always positive and therefore cannot distinguishbetween clockwise and counterclockwise rotating vortices, sign was
x =dv
dz−
dw
dy , (1)�
swirl =
∂v∂z
⋅∂w∂y
⎛⎝⎜
⎞⎠⎟
−1
2
∂v∂y
⋅∂w∂z
⎛⎝⎜
⎞⎠⎟
+1
4
∂v∂y
⎛⎝⎜
⎞⎠⎟
2
+∂w∂z
⎛⎝⎜
⎞⎠⎟
2⎛
⎝⎜⎜
⎞
⎠⎟⎟
. (2)
chosen based on the vorticity template. The surfaces were plottedusing a 3�3 smoothing filter and swirl threshold (±25) that allowedthe vortex structures to be visualized but reduced the remainingnoise. The body marker between the scapulae of the bat was chosenas point of origin in y–z-plane and each PIV image was adjustedaccordingly; time was converted into streamwise distance byassuming that the wake structures advected with the freestreamvelocity. The increasing distance due to the additional speed of thebat was determined for each frame and the Doppler effect was takeninto account (see below, Correlation of kinematics and PIV).
Circulation, G, over different areas of the flow field was calculatedby integrating the vorticity, wx, over a defined area, A, as:
G ∫∫AwxdA . (3)
The total circulation was calculated by taking the whole area tothe right of the body marker into account. In addition, we haveidentified four distinct, recurring vortices (see below, Correlation ofkinematics and PIV). To separate vortices from background noiseand from each other, a threshold of ±5s–1 was applied to the vorticityfield and values below the threshold were set to zero. The thresholdvalue of ±5s–1 was chosen to maximize separation among the distinctvortex structures and of vortices from background noise, whileaccounting for as much vorticity as possible. For each of the fourreoccurring vortices, location was determined manually in each ofthe approximately 30 vorticity fields collected for each wingbeat, andin each case, the circulation was calculated based on all contiguouspositive or negative vorticity at the chosen location. In the few caseswhere V1 and V3 could not be separated from each other by usingthe threshold of 5s–1, the circulation of V3 was assumed to equal thatof V4 and the value was subsequently subtracted from the circulationcalculated for the tip vortex. The lift associated with the streamwisevortex was calculated from the instantaneous circulation, Gi, basedon the instantaneous wing span, 2bi, as:
Fzi GiU�2bi , (4)
where is the density of the air and b is the span of one wing.Subsequently the force was averaged over the course of the wingbeat cycle. One needs to consider that the circulation extracted fromthe transverse plane contains only the vertical force component ofthe lift, and that the magnitude of the horizontal force componentis not determined. This is a rather simple model for the lift force,ignoring several issues, such as the influence of the near-body vortexand the distal vortex pair, as well as the fact that unsteady fluideffects, such as virtual mass, may play a role in the generation oflift. However, the chief goal of this work is to elucidate wakestructure, not to determine the absolute magnitude of the lift force,hence this model is sufficient to provide some correspondencebetween vortex strength and the nominal lift generated.
Correlation of kinematics and PIVA key feature of these experiments is the synchronized acquisitionof both the flight kinematics and the wake velocity structure.However, the correlation of specific features in the wake with bodyand wing motions is not trivial and fraught with complexities. Todetermine the features on the body and the phase of the wingbeatcycle associated with a particular vortex structure in the wake, oneneeds to know the distance between the bat and the PIV laser sheetand a characteristic velocity at which the vortex structures areadvected downstream. The distance is easily determined from thesynchronized flight kinematics, and it is usually adequate to use thewind tunnel freestream speed, U�, as the typical advection speed.The distance and speed yield a time offset between the recorded
T. Y. Hubel and others
THE JOURNAL OF EXPERIMENTAL BIOLOGY
3431Flight of Cynopterus brachyotis
kinematics and the associated PIV velocity measurement. However,the situation is made more complex by the fact that the bat is notat a fixed distance from the PIV laser sheet, but usually fliesupstream. This produces a ‘Doppler shift’ in the time-resolved PIVfields, which is corrected by determining an effective PIV sampletime: dtnewdt�U�/Ut (Hubel et al., 2009). Lastly, when there areintense levels of vorticity, the assumption that vortex structures areadvected straight downstream is probably not valid, as the structureswill be shifted by the flow induced by adjacent vortices. This inducedmotion is relatively small for short distances between the bat andthe PIV laser measurement position and during the bulk of thedownstroke when the wing is outstretched and the primary vortexis far from other vortex structures. However, the possible changein position should be considered, particularly when trying tocorrelate kinematics with flow structures when the wings areretracted and the vortex structures are in close proximity to eachother.
StatisticsFlight trials varied in speed, with a clearly bimodal distribution;each bat flew at both a lower and a higher speed, with somevariation around that speed, and some variation among bats.Because the flight speed distribution was clearly bimodal, it wasnot appropriate to treat speed as a continuous variable. Instead,we tested for differences in kinematic parameters between the twoobserved speed categories. A single trial could contain up to sixwingbeat cycles. To assess differences in means between the twospeed categories at a significance level of 5%, we used 60wingbeat cycles, and employed a mixed effect model withwingbeat cycle as a repeated measure and individual as a randomeffect to account for pseudoreplication. Means are presented ±s.d.All tests were carried out using SPSS 17.0 (SPSS Inc., Chicago,IL, USA).
Data presented over the course of a wingbeat cycle werecalculated based on five wingbeat cycles for each bat in both speedcategories (only three for Bat IV at higher speed). We chose onlyone wingbeat cycle – the first with both PIV and kinematic dataavailable – in order to avoid pseudoreplication within trials. Theaverage over the five wingbeat cycles was calculated within theindividual bats, and subsequently mean and standard deviation forall four bats are presented.
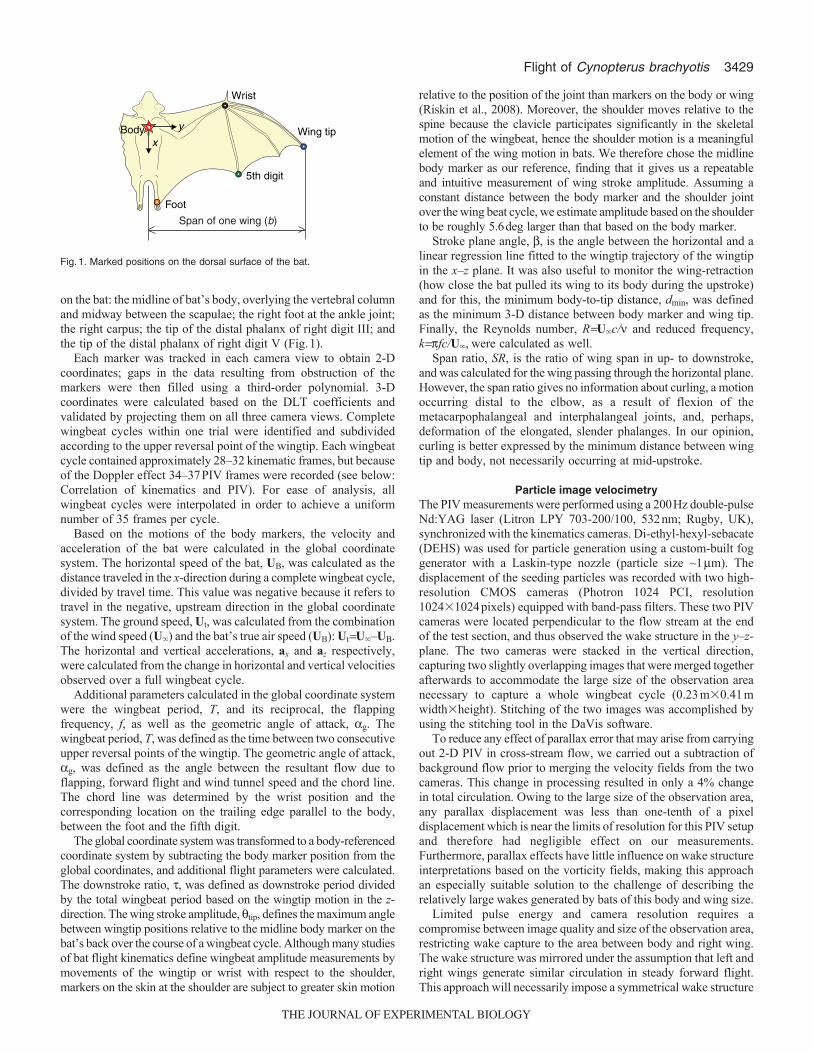
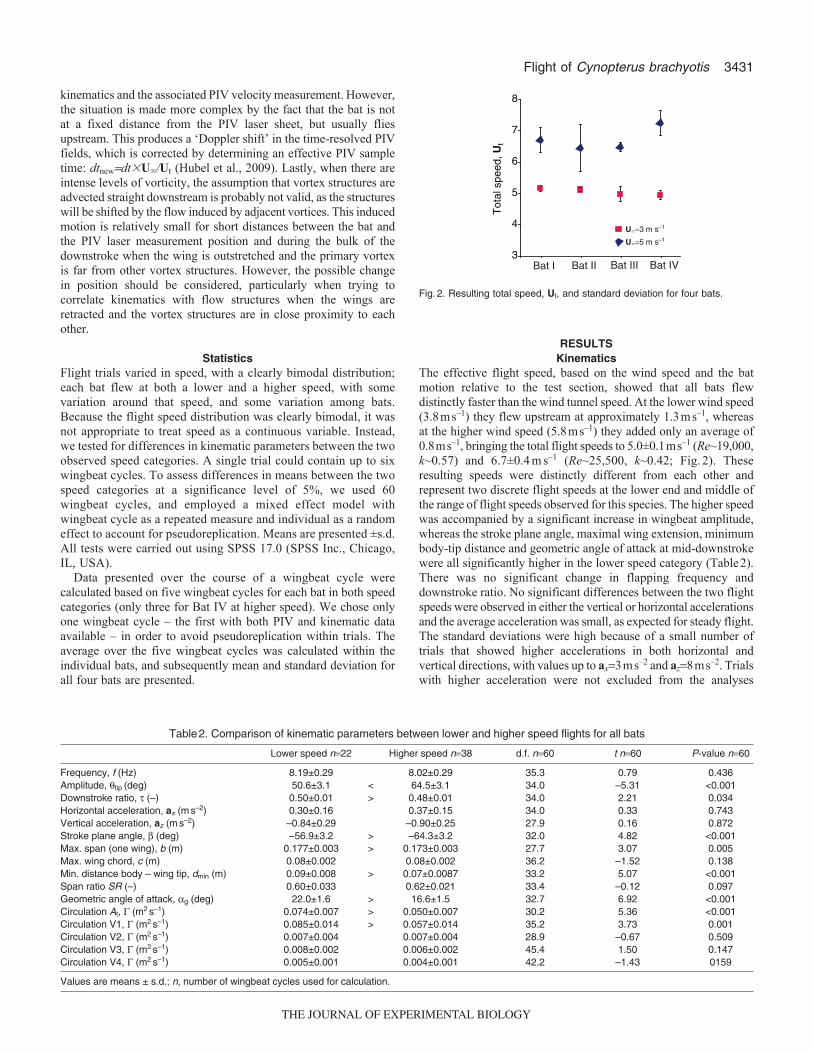
RESULTSKinematics
The effective flight speed, based on the wind speed and the batmotion relative to the test section, showed that all bats flewdistinctly faster than the wind tunnel speed. At the lower wind speed(3.8ms–1) they flew upstream at approximately 1.3ms–1, whereasat the higher wind speed (5.8ms–1) they added only an average of0.8ms–1, bringing the total flight speeds to 5.0±0.1ms–1 (Re~19,000,k~0.57) and 6.7±0.4ms–1 (Re~25,500, k~0.42; Fig.2). Theseresulting speeds were distinctly different from each other andrepresent two discrete flight speeds at the lower end and middle ofthe range of flight speeds observed for this species. The higher speedwas accompanied by a significant increase in wingbeat amplitude,whereas the stroke plane angle, maximal wing extension, minimumbody-tip distance and geometric angle of attack at mid-downstrokewere all significantly higher in the lower speed category (Table2).There was no significant change in flapping frequency anddownstroke ratio. No significant differences between the two flightspeeds were observed in either the vertical or horizontal accelerationsand the average acceleration was small, as expected for steady flight.The standard deviations were high because of a small number oftrials that showed higher accelerations in both horizontal andvertical directions, with values up to ax3ms–2 and az8ms–2. Trialswith higher acceleration were not excluded from the analyses
3
4
5
6
7
8
Tot
al s
peed
, Ut
U�=3 m s–1
U�=5 m s–1
Bat IVBat IIIBat IIBat I
Fig.2. Resulting total speed, Ut, and standard deviation for four bats.
Table2. Comparison of kinematic parameters between lower and higher speed flights for all bats
Lower speed n22 Higher speed n38 d.f. n60 t n60 P-value n60
Frequency, f (Hz) 8.19±0.29 8.02±0.29 35.3 0.79 0.436Amplitude, qtip (deg) 50.6±3.1 < 64.5±3.1 34.0 –5.31 <0.001Downstroke ratio, t (–) 0.50±0.01 > 0.48±0.01 34.0 2.21 0.034Horizontal acceleration, ax (ms–2) 0.30±0.16 0.37±0.15 34.0 0.33 0.743Vertical acceleration, az (ms–2) –0.84±0.29 –0.90±0.25 27.9 0.16 0.872Stroke plane angle, (deg) –56.9±3.2 > –64.3±3.2 32.0 4.82 <0.001Max. span (one wing), b (m) 0.177±0.003 > 0.173±0.003 27.7 3.07 0.005Max. wing chord, c (m) 0.08±0.002 0.08±0.002 36.2 –1.52 0.138Min. distance body – wing tip, dmin (m) 0.09±0.008 > 0.07±0.0087 33.2 5.07 <0.001Span ratio SR (–) 0.60±0.033 0.62±0.021 33.4 –0.12 0.097Geometric angle of attack, ag (deg) 22.0±1.6 > 16.6±1.5 32.7 6.92 <0.001Circulation At, G (m2s–1) 0.074±0.007 > 0.050±0.007 30.2 5.36 <0.001Circulation V1, G (m2s–1) 0.085±0.014 > 0.057±0.014 35.2 3.73 0.001Circulation V2, G (m2s–1) 0.007±0.004 0.007±0.004 28.9 –0.67 0.509Circulation V3, G (m2s–1) 0.008±0.002 0.006±0.002 45.4 1.50 0.147Circulation V4, G (m2s–1) 0.005±0.001 0.004±0.001 42.2 –1.43 0159
Values are means ± s.d.; n, number of wingbeat cycles used for calculation.
THE JOURNAL OF EXPERIMENTAL BIOLOGY
3432
because the kinematic parameters or average circulation did notdiffer significantly from trials with lower acceleration.
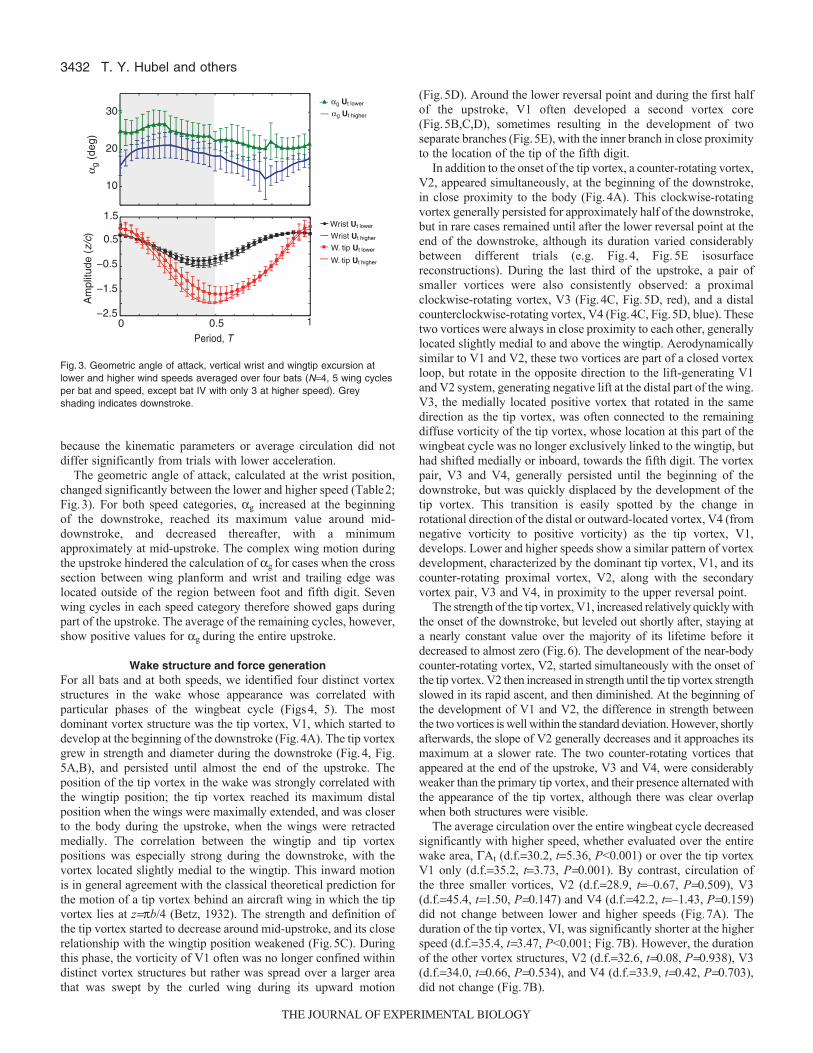
The geometric angle of attack, calculated at the wrist position,changed significantly between the lower and higher speed (Table2;Fig.3). For both speed categories, ag increased at the beginningof the downstroke, reached its maximum value around mid-downstroke, and decreased thereafter, with a minimumapproximately at mid-upstroke. The complex wing motion duringthe upstroke hindered the calculation of ag for cases when the crosssection between wing planform and wrist and trailing edge waslocated outside of the region between foot and fifth digit. Sevenwing cycles in each speed category therefore showed gaps duringpart of the upstroke. The average of the remaining cycles, however,show positive values for ag during the entire upstroke.
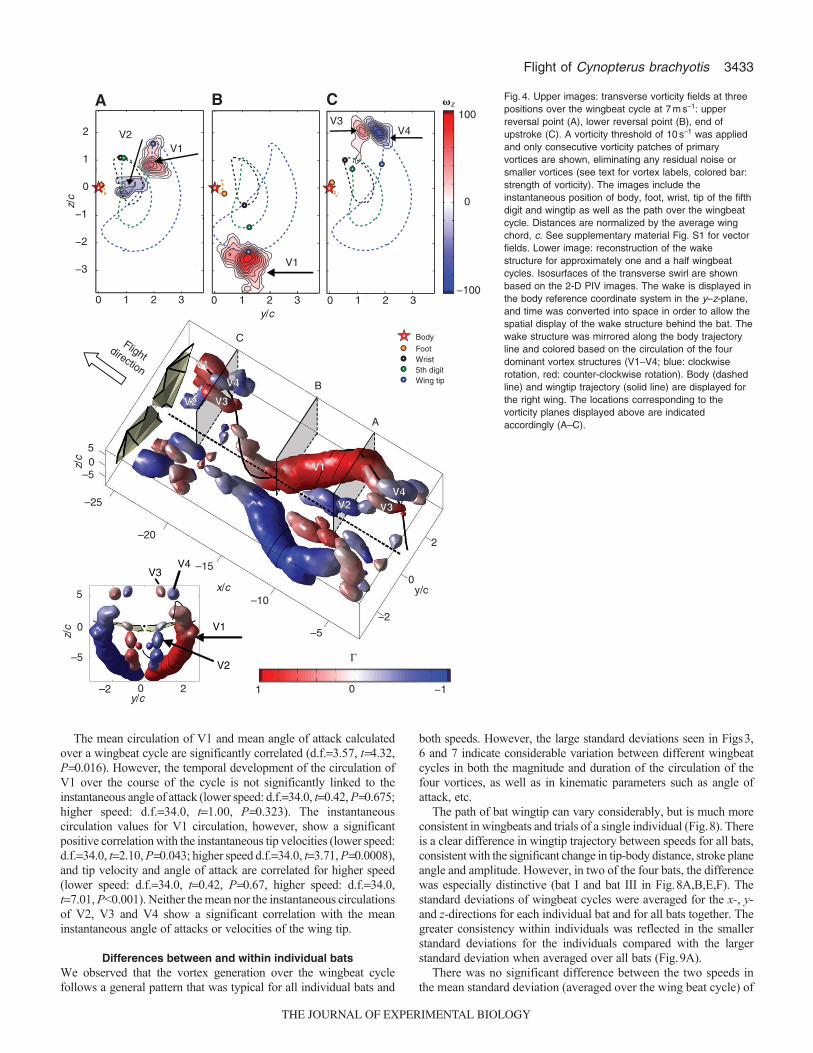
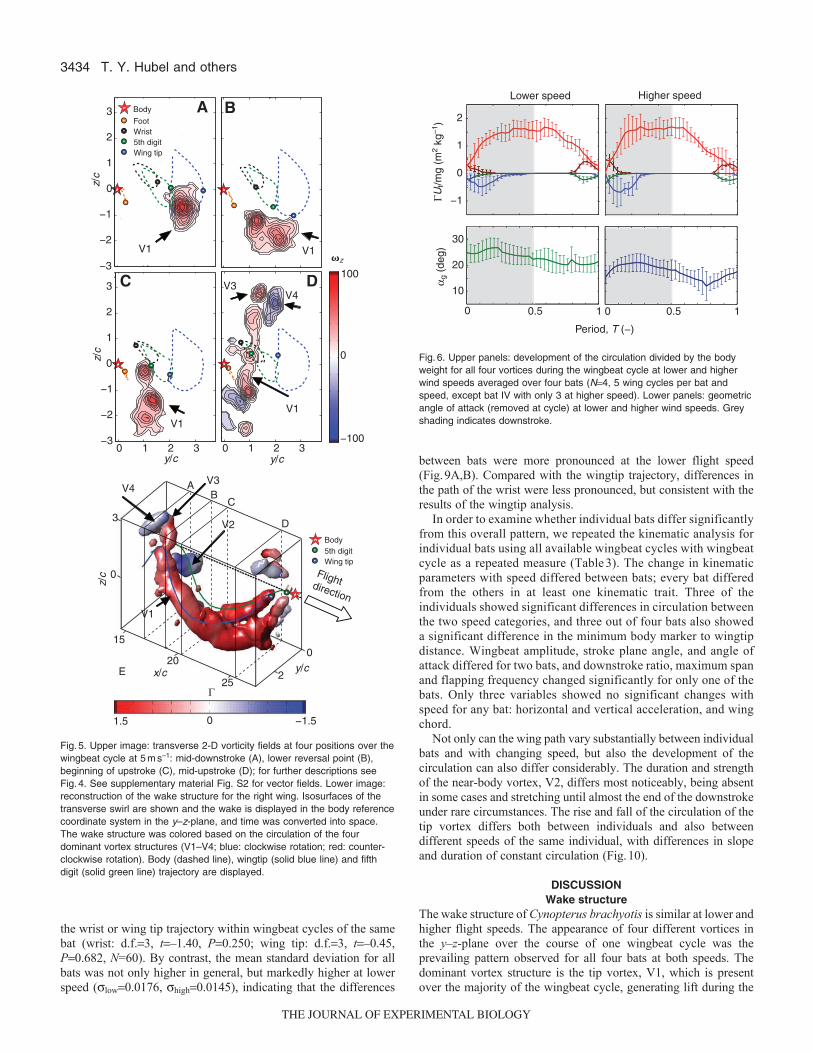
Wake structure and force generationFor all bats and at both speeds, we identified four distinct vortexstructures in the wake whose appearance was correlated withparticular phases of the wingbeat cycle (Figs4, 5). The mostdominant vortex structure was the tip vortex, V1, which started todevelop at the beginning of the downstroke (Fig.4A). The tip vortexgrew in strength and diameter during the downstroke (Fig.4, Fig.5A,B), and persisted until almost the end of the upstroke. Theposition of the tip vortex in the wake was strongly correlated withthe wingtip position; the tip vortex reached its maximum distalposition when the wings were maximally extended, and was closerto the body during the upstroke, when the wings were retractedmedially. The correlation between the wingtip and tip vortexpositions was especially strong during the downstroke, with thevortex located slightly medial to the wingtip. This inward motionis in general agreement with the classical theoretical prediction forthe motion of a tip vortex behind an aircraft wing in which the tipvortex lies at zpb/4 (Betz, 1932). The strength and definition ofthe tip vortex started to decrease around mid-upstroke, and its closerelationship with the wingtip position weakened (Fig.5C). Duringthis phase, the vorticity of V1 often was no longer confined withindistinct vortex structures but rather was spread over a larger areathat was swept by the curled wing during its upward motion
(Fig.5D). Around the lower reversal point and during the first halfof the upstroke, V1 often developed a second vortex core(Fig.5B,C,D), sometimes resulting in the development of twoseparate branches (Fig.5E), with the inner branch in close proximityto the location of the tip of the fifth digit.
In addition to the onset of the tip vortex, a counter-rotating vortex,V2, appeared simultaneously, at the beginning of the downstroke,in close proximity to the body (Fig.4A). This clockwise-rotatingvortex generally persisted for approximately half of the downstroke,but in rare cases remained until after the lower reversal point at theend of the downstroke, although its duration varied considerablybetween different trials (e.g. Fig.4, Fig.5E isosurfacereconstructions). During the last third of the upstroke, a pair ofsmaller vortices were also consistently observed: a proximalclockwise-rotating vortex, V3 (Fig.4C, Fig.5D, red), and a distalcounterclockwise-rotating vortex, V4 (Fig.4C, Fig.5D, blue). Thesetwo vortices were always in close proximity to each other, generallylocated slightly medial to and above the wingtip. Aerodynamicallysimilar to V1 and V2, these two vortices are part of a closed vortexloop, but rotate in the opposite direction to the lift-generating V1and V2 system, generating negative lift at the distal part of the wing.V3, the medially located positive vortex that rotated in the samedirection as the tip vortex, was often connected to the remainingdiffuse vorticity of the tip vortex, whose location at this part of thewingbeat cycle was no longer exclusively linked to the wingtip, buthad shifted medially or inboard, towards the fifth digit. The vortexpair, V3 and V4, generally persisted until the beginning of thedownstroke, but was quickly displaced by the development of thetip vortex. This transition is easily spotted by the change inrotational direction of the distal or outward-located vortex, V4 (fromnegative vorticity to positive vorticity) as the tip vortex, V1,develops. Lower and higher speeds show a similar pattern of vortexdevelopment, characterized by the dominant tip vortex, V1, and itscounter-rotating proximal vortex, V2, along with the secondaryvortex pair, V3 and V4, in proximity to the upper reversal point.
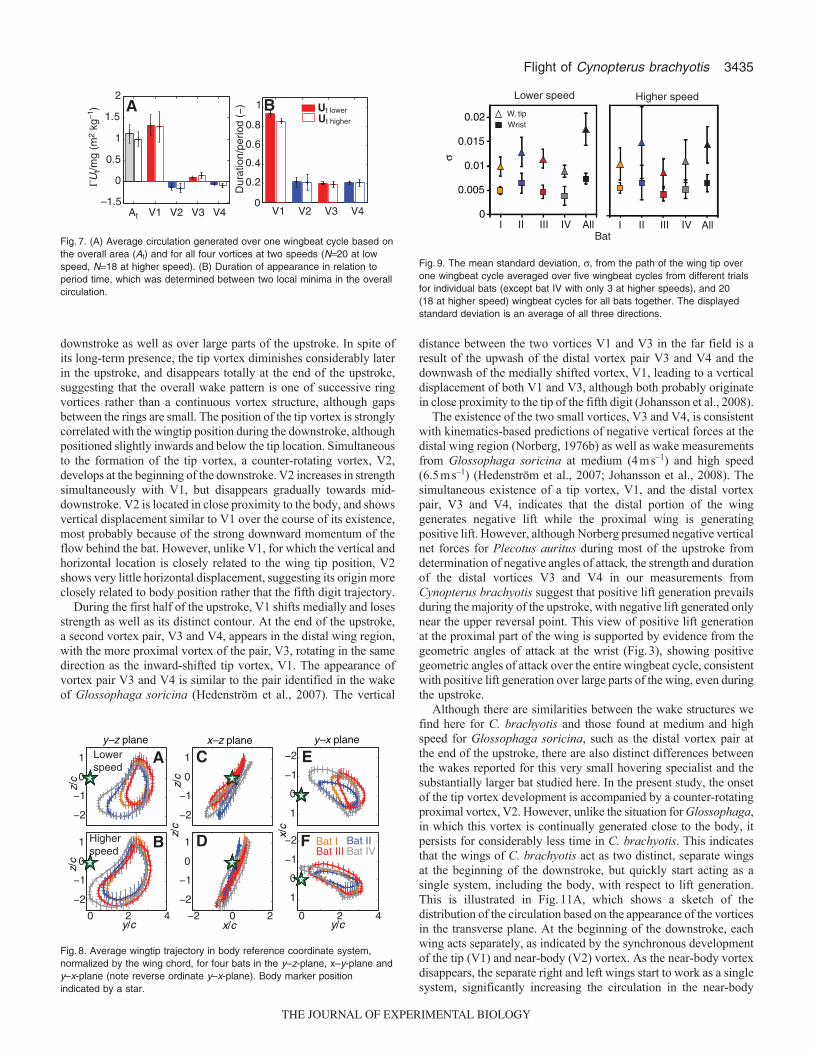
The strength of the tip vortex, V1, increased relatively quickly withthe onset of the downstroke, but leveled out shortly after, staying ata nearly constant value over the majority of its lifetime before itdecreased to almost zero (Fig.6). The development of the near-bodycounter-rotating vortex, V2, started simultaneously with the onset ofthe tip vortex. V2 then increased in strength until the tip vortex strengthslowed in its rapid ascent, and then diminished. At the beginning ofthe development of V1 and V2, the difference in strength betweenthe two vortices is well within the standard deviation. However, shortlyafterwards, the slope of V2 generally decreases and it approaches itsmaximum at a slower rate. The two counter-rotating vortices thatappeared at the end of the upstroke, V3 and V4, were considerablyweaker than the primary tip vortex, and their presence alternated withthe appearance of the tip vortex, although there was clear overlapwhen both structures were visible.
The average circulation over the entire wingbeat cycle decreasedsignificantly with higher speed, whether evaluated over the entirewake area, GAt (d.f.30.2, t5.36, P<0.001) or over the tip vortexV1 only (d.f.35.2, t3.73, P0.001). By contrast, circulation ofthe three smaller vortices, V2 (d.f.28.9, t–0.67, P0.509), V3(d.f.45.4, t1.50, P0.147) and V4 (d.f.42.2, t–1.43, P0.159)did not change between lower and higher speeds (Fig.7A). Theduration of the tip vortex, VI, was significantly shorter at the higherspeed (d.f.35.4, t3.47, P<0.001; Fig.7B). However, the durationof the other vortex structures, V2 (d.f.32.6, t0.08, P0.938), V3(d.f.34.0, t0.66, P0.534), and V4 (d.f.33.9, t0.42, P0.703),did not change (Fig.7B).
T. Y. Hubel and others
10
20
30
0.5−2.5
−1.5
−0.5
0.5
1.5
α g (
deg)
Period, T
Am
plitu
de (
z/c)
0 1
αg Ut lower
αg Ut higher
1 Wrist Ut lower
W. tip Ut lower
W. tip Ut higher
Wrist Ut higher
1111111
Fig.3. Geometric angle of attack, vertical wrist and wingtip excursion atlower and higher wind speeds averaged over four bats (N4, 5 wing cyclesper bat and speed, except bat IV with only 3 at higher speed). Greyshading indicates downstroke.
THE JOURNAL OF EXPERIMENTAL BIOLOGY
3433Flight of Cynopterus brachyotis
The mean circulation of V1 and mean angle of attack calculatedover a wingbeat cycle are significantly correlated (d.f.3.57, t4.32,P0.016). However, the temporal development of the circulation ofV1 over the course of the cycle is not significantly linked to theinstantaneous angle of attack (lower speed: d.f.34.0, t0.42, P0.675;higher speed: d.f.34.0, t1.00, P0.323). The instantaneouscirculation values for V1 circulation, however, show a significantpositive correlation with the instantaneous tip velocities (lower speed:d.f.34.0, t2.10, P0.043; higher speed d.f.34.0, t3.71, P0.0008),and tip velocity and angle of attack are correlated for higher speed(lower speed: d.f.34.0, t0.42, P0.67, higher speed: d.f.34.0,t7.01, P<0.001). Neither the mean nor the instantaneous circulationsof V2, V3 and V4 show a significant correlation with the meaninstantaneous angle of attacks or velocities of the wing tip.
Differences between and within individual batsWe observed that the vortex generation over the wingbeat cyclefollows a general pattern that was typical for all individual bats and
both speeds. However, the large standard deviations seen in Figs3,6 and 7 indicate considerable variation between different wingbeatcycles in both the magnitude and duration of the circulation of thefour vortices, as well as in kinematic parameters such as angle ofattack, etc.
The path of bat wingtip can vary considerably, but is much moreconsistent in wingbeats and trials of a single individual (Fig.8). Thereis a clear difference in wingtip trajectory between speeds for all bats,consistent with the significant change in tip-body distance, stroke planeangle and amplitude. However, in two of the four bats, the differencewas especially distinctive (bat I and bat III in Fig.8A,B,E,F). Thestandard deviations of wingbeat cycles were averaged for the x-, y-and z-directions for each individual bat and for all bats together. Thegreater consistency within individuals was reflected in the smallerstandard deviations for the individuals compared with the largerstandard deviation when averaged over all bats (Fig.9A).
There was no significant difference between the two speeds inthe mean standard deviation (averaged over the wing beat cycle) of
–10
2
–2
0
–5
–15
–20
–25
05
–5
z/c
x/c y/c
−101
Γ
A
B
C Body
FootWrist5th digitWing tip
Flightdirection
0 1 2 3−100
0
100
0 1 2 3
−3
−2
−1
0
1
2
0 1 2 3y/c
z/c
�z
B C
V4V3
0
5
–5
z/c
2–2 0y/c
V1
V3V4
V2
V1V2
A
V1
V1V1
V2V2 V3V3V4V4
V4V4
V2V2 V3V3
V1V1
Fig.4. Upper images: transverse vorticity fields at threepositions over the wingbeat cycle at 7ms–1: upperreversal point (A), lower reversal point (B), end ofupstroke (C). A vorticity threshold of 10s–1 was appliedand only consecutive vorticity patches of primaryvortices are shown, eliminating any residual noise orsmaller vortices (see text for vortex labels, colored bar:strength of vorticity). The images include theinstantaneous position of body, foot, wrist, tip of the fifthdigit and wingtip as well as the path over the wingbeatcycle. Distances are normalized by the average wingchord, c. See supplementary material Fig. S1 for vectorfields. Lower image: reconstruction of the wakestructure for approximately one and a half wingbeatcycles. Isosurfaces of the transverse swirl are shownbased on the 2-D PIV images. The wake is displayed inthe body reference coordinate system in the y–z-plane,and time was converted into space in order to allow thespatial display of the wake structure behind the bat. Thewake structure was mirrored along the body trajectoryline and colored based on the circulation of the fourdominant vortex structures (V1–V4; blue: clockwiserotation, red: counter-clockwise rotation). Body (dashedline) and wingtip trajectory (solid line) are displayed forthe right wing. The locations corresponding to thevorticity planes displayed above are indicatedaccordingly (A–C).
THE JOURNAL OF EXPERIMENTAL BIOLOGY
3434
the wrist or wing tip trajectory within wingbeat cycles of the samebat (wrist: d.f.3, t–1.40, P0.250; wing tip: d.f.3, t–0.45,P0.682, N=60). By contrast, the mean standard deviation for allbats was not only higher in general, but markedly higher at lowerspeed (slow0.0176, shigh0.0145), indicating that the differences
between bats were more pronounced at the lower flight speed(Fig.9A,B). Compared with the wingtip trajectory, differences inthe path of the wrist were less pronounced, but consistent with theresults of the wingtip analysis.
In order to examine whether individual bats differ significantlyfrom this overall pattern, we repeated the kinematic analysis forindividual bats using all available wingbeat cycles with wingbeatcycle as a repeated measure (Table3). The change in kinematicparameters with speed differed between bats; every bat differedfrom the others in at least one kinematic trait. Three of theindividuals showed significant differences in circulation betweenthe two speed categories, and three out of four bats also showeda significant difference in the minimum body marker to wingtipdistance. Wingbeat amplitude, stroke plane angle, and angle ofattack differed for two bats, and downstroke ratio, maximum spanand flapping frequency changed significantly for only one of thebats. Only three variables showed no significant changes withspeed for any bat: horizontal and vertical acceleration, and wingchord.
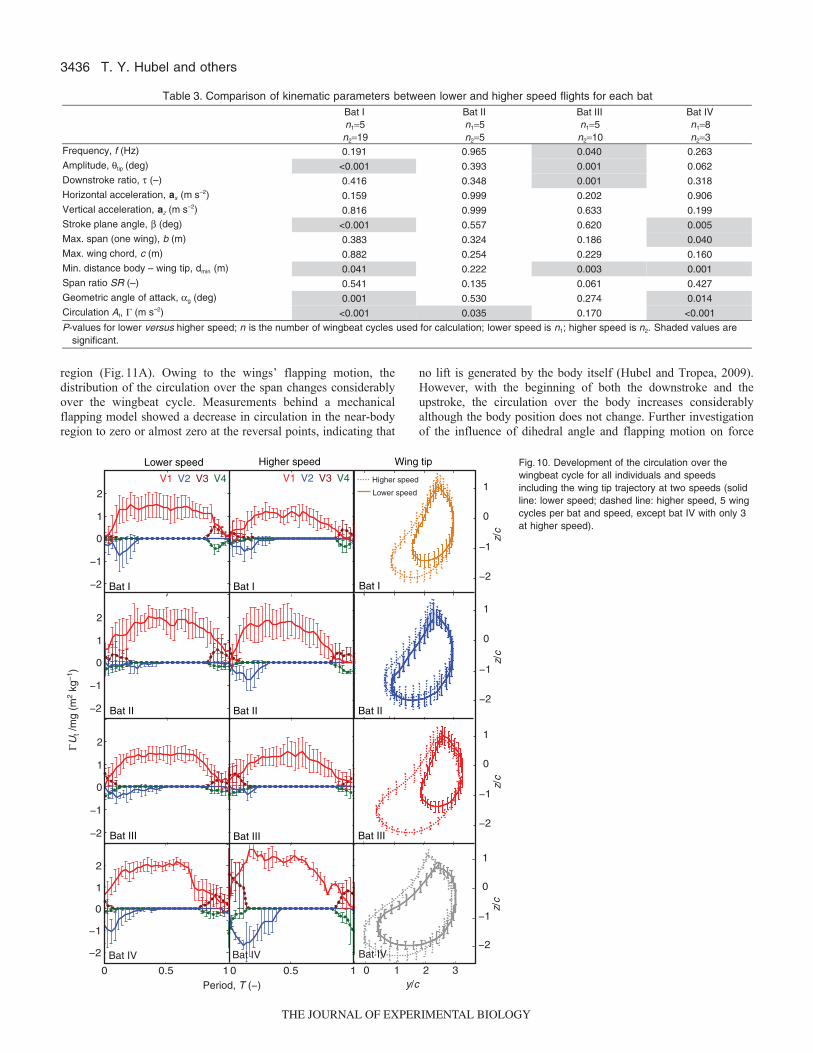
Not only can the wing path vary substantially between individualbats and with changing speed, but also the development of thecirculation can also differ considerably. The duration and strengthof the near-body vortex, V2, differs most noticeably, being absentin some cases and stretching until almost the end of the downstrokeunder rare circumstances. The rise and fall of the circulation of thetip vortex differs both between individuals and also betweendifferent speeds of the same individual, with differences in slopeand duration of constant circulation (Fig.10).
DISCUSSIONWake structure
The wake structure of Cynopterus brachyotis is similar at lower andhigher flight speeds. The appearance of four different vortices inthe y–z-plane over the course of one wingbeat cycle was theprevailing pattern observed for all four bats at both speeds. Thedominant vortex structure is the tip vortex, V1, which is presentover the majority of the wingbeat cycle, generating lift during the
T. Y. Hubel and others
0 1 2 3
0 1 2 3−100
0
100
−3
−2
−1
0
1
2
3
Body
FootWrist5th digitWing tip
y/c
z/c
�z
0
2
0
3
15
20
25
−1.501.5
Γ
y/c
z/c
x/c
V1
V3V4
V2
V1 V1
V1
V3V4
V1
y/c
−3
−2
−1
0
1
2
3
z/c
A B
C
E
AB
C
D
Body5th digitWing tip
D
Flightdirection
Fig.5. Upper image: transverse 2-D vorticity fields at four positions over thewingbeat cycle at 5ms–1: mid-downstroke (A), lower reversal point (B),beginning of upstroke (C), mid-upstroke (D); for further descriptions seeFig.4. See supplementary material Fig. S2 for vector fields. Lower image:reconstruction of the wake structure for the right wing. Isosurfaces of thetransverse swirl are shown and the wake is displayed in the body referencecoordinate system in the y–z-plane, and time was converted into space.The wake structure was colored based on the circulation of the fourdominant vortex structures (V1–V4; blue: clockwise rotation; red: counter-clockwise rotation). Body (dashed line), wingtip (solid blue line) and fifthdigit (solid green line) trajectory are displayed.
Higher speed
v1v2 v3 v4
0 10 1
−1
0
1
2
ΓUt/m
g (m
2 kg
–1)
Period, T (−)
Lower speed
α g (
deg)
10
20
30
0.50.5
Fig.6. Upper panels: development of the circulation divided by the bodyweight for all four vortices during the wingbeat cycle at lower and higherwind speeds averaged over four bats (N4, 5 wing cycles per bat andspeed, except bat IV with only 3 at higher speed). Lower panels: geometricangle of attack (removed at cycle) at lower and higher wind speeds. Greyshading indicates downstroke.
THE JOURNAL OF EXPERIMENTAL BIOLOGY
3435Flight of Cynopterus brachyotis
downstroke as well as over large parts of the upstroke. In spite ofits long-term presence, the tip vortex diminishes considerably laterin the upstroke, and disappears totally at the end of the upstroke,suggesting that the overall wake pattern is one of successive ringvortices rather than a continuous vortex structure, although gapsbetween the rings are small. The position of the tip vortex is stronglycorrelated with the wingtip position during the downstroke, althoughpositioned slightly inwards and below the tip location. Simultaneousto the formation of the tip vortex, a counter-rotating vortex, V2,develops at the beginning of the downstroke. V2 increases in strengthsimultaneously with V1, but disappears gradually towards mid-downstroke. V2 is located in close proximity to the body, and showsvertical displacement similar to V1 over the course of its existence,most probably because of the strong downward momentum of theflow behind the bat. However, unlike V1, for which the vertical andhorizontal location is closely related to the wing tip position, V2shows very little horizontal displacement, suggesting its origin moreclosely related to body position rather that the fifth digit trajectory.
During the first half of the upstroke, V1 shifts medially and losesstrength as well as its distinct contour. At the end of the upstroke,a second vortex pair, V3 and V4, appears in the distal wing region,with the more proximal vortex of the pair, V3, rotating in the samedirection as the inward-shifted tip vortex, V1. The appearance ofvortex pair V3 and V4 is similar to the pair identified in the wakeof Glossophaga soricina (Hedenström et al., 2007). The vertical
distance between the two vortices V1 and V3 in the far field is aresult of the upwash of the distal vortex pair V3 and V4 and thedownwash of the medially shifted vortex, V1, leading to a verticaldisplacement of both V1 and V3, although both probably originatein close proximity to the tip of the fifth digit (Johansson et al., 2008).
The existence of the two small vortices, V3 and V4, is consistentwith kinematics-based predictions of negative vertical forces at thedistal wing region (Norberg, 1976b) as well as wake measurementsfrom Glossophaga soricina at medium (4ms–1) and high speed(6.5ms–1) (Hedenström et al., 2007; Johansson et al., 2008). Thesimultaneous existence of a tip vortex, V1, and the distal vortexpair, V3 and V4, indicates that the distal portion of the winggenerates negative lift while the proximal wing is generatingpositive lift. However, although Norberg presumed negative verticalnet forces for Plecotus auritus during most of the upstroke fromdetermination of negative angles of attack, the strength and durationof the distal vortices V3 and V4 in our measurements fromCynopterus brachyotis suggest that positive lift generation prevailsduring the majority of the upstroke, with negative lift generated onlynear the upper reversal point. This view of positive lift generationat the proximal part of the wing is supported by evidence from thegeometric angles of attack at the wrist (Fig.3), showing positivegeometric angles of attack over the entire wingbeat cycle, consistentwith positive lift generation over large parts of the wing, even duringthe upstroke.
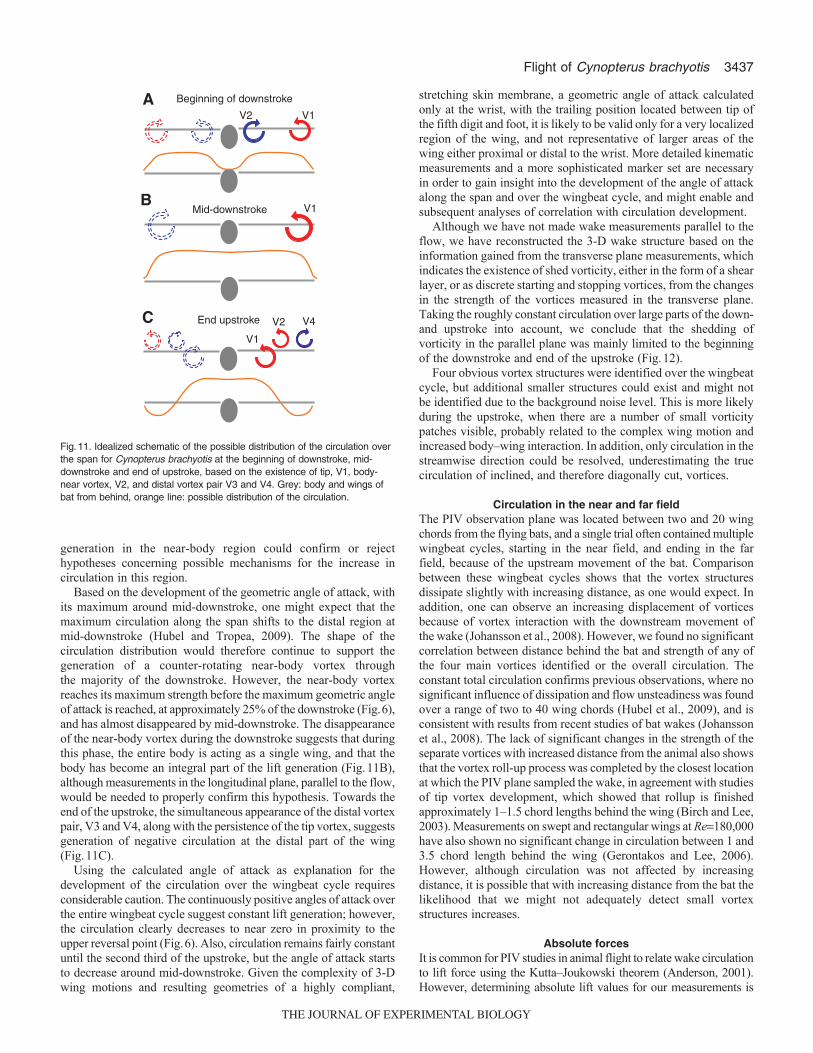
Although there are similarities between the wake structures wefind here for C. brachyotis and those found at medium and highspeed for Glossophaga soricina, such as the distal vortex pair atthe end of the upstroke, there are also distinct differences betweenthe wakes reported for this very small hovering specialist and thesubstantially larger bat studied here. In the present study, the onsetof the tip vortex development is accompanied by a counter-rotatingproximal vortex, V2. However, unlike the situation for Glossophaga,in which this vortex is continually generated close to the body, itpersists for considerably less time in C. brachyotis. This indicatesthat the wings of C. brachyotis act as two distinct, separate wingsat the beginning of the downstroke, but quickly start acting as asingle system, including the body, with respect to lift generation.This is illustrated in Fig.11A, which shows a sketch of thedistribution of the circulation based on the appearance of the vorticesin the transverse plane. At the beginning of the downstroke, eachwing acts separately, as indicated by the synchronous developmentof the tip (V1) and near-body (V2) vortex. As the near-body vortexdisappears, the separate right and left wings start to work as a singlesystem, significantly increasing the circulation in the near-body
At V1 V2 V3 V4 V2 V3 V40
0.
1
Dur
atio
n/pe
riod
(−)A B Ut lower
Ut higher
–1.5
0
0.5
1
1.5
2ΓU
t/mg
(m2
kg–1
)
0.2
4
0.6
0.8
V1
Fig.7. (A) Average circulation generated over one wingbeat cycle based onthe overall area (At) and for all four vortices at two speeds (N20 at lowspeed, N=18 at higher speed). (B) Duration of appearance in relation toperiod time, which was determined between two local minima in the overallcirculation.
−2
−1
0
1
−2
−1
0
1 −2
−1
0
1
0 2 4
−2
−1
0
1
−2 0 2
−2
−1
0
1
0 2 4
−2
−1
0
1
y/c x/c y/c
z/c
z/c
z/c
z/c
x/c
Lower speed
Higherspeed
y–z plane x–z plane y–x plane
B D F
A C E
Bat IBat III
Bat IIBat IV
Fig.8. Average wingtip trajectory in body reference coordinate system,normalized by the wing chord, for four bats in the y–z-plane, x–y-plane andy–x-plane (note reverse ordinate y–x-plane). Body marker positionindicated by a star.
0
0.005
0.01
0.015
0.02
I II III IV AllBat
σ
I II III IV All
Lower speed Higher speed
WristW. tip
Fig.9. The mean standard deviation, s, from the path of the wing tip overone wingbeat cycle averaged over five wingbeat cycles from different trialsfor individual bats (except bat IV with only 3 at higher speeds), and 20(18 at higher speed) wingbeat cycles for all bats together. The displayedstandard deviation is an average of all three directions.
THE JOURNAL OF EXPERIMENTAL BIOLOGY
3436
region (Fig.11A). Owing to the wings’ flapping motion, thedistribution of the circulation over the span changes considerablyover the wingbeat cycle. Measurements behind a mechanicalflapping model showed a decrease in circulation in the near-bodyregion to zero or almost zero at the reversal points, indicating that
no lift is generated by the body itself (Hubel and Tropea, 2009).However, with the beginning of both the downstroke and theupstroke, the circulation over the body increases considerablyalthough the body position does not change. Further investigationof the influence of dihedral angle and flapping motion on force
T. Y. Hubel and others
Table 3. Comparison of kinematic parameters between lower and higher speed flights for each batBat In1=5n2=19
Bat IIn1=5n2=5
Bat IIIn1=5n2=10
Bat IVn1=8n2=3
Frequency, f (Hz) 0.191 0.965 0.040 0.263Amplitude, tip (deg) <0.001 0.393 0.001 0.062Downstroke ratio, (–) 0.416 0.348 0.001 0.318Horizontal acceleration, ax (m s–2) 0.159 0.999 0.202 0.906Vertical acceleration, az (m s–2) 0.816 0.999 0.633 0.199Stroke plane angle, (deg) <0.001 0.557 0.620 0.005Max. span (one wing), b (m) 0.383 0.324 0.186 0.040Max. wing chord, c (m) 0.882 0.254 0.229 0.160Min. distance body – wing tip, dmin (m) 0.041 0.222 0.003 0.001Span ratio SR (–) 0.541 0.135 0.061 0.427Geometric angle of attack, g (deg) 0.001 0.530 0.274 0.014Circulation At, (m s–2) <0.001 0.035 0.170 <0.001
P-values for lower versus higher speed; n is the number of wingbeat cycles used for calculation; lower speed is n1; higher speed is n2. Shaded values aresignificant.
−2
−1
0
1
2
−2
−1
0
1
2
−2
−1
0
1
2
Period, T (−)0 0.5 1
−2
−1
0
1
2
ΓU
t /m
g (m
2 kg
–1)
0 0.5 1
Lower speed Higher speed
Bat I Bat I
Bat II Bat II
Bat III Bat III
Bat IV Bat IV
V1 V2 V3 V4 V1 V2 V3 V4
−2
−1
0
1z/
c
−2
−1
0
1
z/c
−2
−1
0
1
z/c
0 1 2 3
−2
−1
0
1
y/c
z/c
Bat I
Bat II
Bat III
Bat IV
Wing tip
Lower speed
Higher speed
Fig.10. Development of the circulation over thewingbeat cycle for all individuals and speedsincluding the wing tip trajectory at two speeds (solidline: lower speed; dashed line: higher speed, 5 wingcycles per bat and speed, except bat IV with only 3at higher speed).
THE JOURNAL OF EXPERIMENTAL BIOLOGY
3437Flight of Cynopterus brachyotis
generation in the near-body region could confirm or rejecthypotheses concerning possible mechanisms for the increase incirculation in this region.
Based on the development of the geometric angle of attack, withits maximum around mid-downstroke, one might expect that themaximum circulation along the span shifts to the distal region atmid-downstroke (Hubel and Tropea, 2009). The shape of thecirculation distribution would therefore continue to support thegeneration of a counter-rotating near-body vortex through the majority of the downstroke. However, the near-body vortexreaches its maximum strength before the maximum geometric angleof attack is reached, at approximately 25% of the downstroke (Fig.6),and has almost disappeared by mid-downstroke. The disappearanceof the near-body vortex during the downstroke suggests that duringthis phase, the entire body is acting as a single wing, and that thebody has become an integral part of the lift generation (Fig.11B),although measurements in the longitudinal plane, parallel to the flow,would be needed to properly confirm this hypothesis. Towards theend of the upstroke, the simultaneous appearance of the distal vortexpair, V3 and V4, along with the persistence of the tip vortex, suggestsgeneration of negative circulation at the distal part of the wing(Fig.11C).
Using the calculated angle of attack as explanation for thedevelopment of the circulation over the wingbeat cycle requiresconsiderable caution. The continuously positive angles of attack overthe entire wingbeat cycle suggest constant lift generation; however,the circulation clearly decreases to near zero in proximity to theupper reversal point (Fig.6). Also, circulation remains fairly constantuntil the second third of the upstroke, but the angle of attack startsto decrease around mid-downstroke. Given the complexity of 3-Dwing motions and resulting geometries of a highly compliant,
stretching skin membrane, a geometric angle of attack calculatedonly at the wrist, with the trailing position located between tip ofthe fifth digit and foot, it is likely to be valid only for a very localizedregion of the wing, and not representative of larger areas of thewing either proximal or distal to the wrist. More detailed kinematicmeasurements and a more sophisticated marker set are necessaryin order to gain insight into the development of the angle of attackalong the span and over the wingbeat cycle, and might enable andsubsequent analyses of correlation with circulation development.
Although we have not made wake measurements parallel to theflow, we have reconstructed the 3-D wake structure based on theinformation gained from the transverse plane measurements, whichindicates the existence of shed vorticity, either in the form of a shearlayer, or as discrete starting and stopping vortices, from the changesin the strength of the vortices measured in the transverse plane.Taking the roughly constant circulation over large parts of the down-and upstroke into account, we conclude that the shedding ofvorticity in the parallel plane was mainly limited to the beginningof the downstroke and end of the upstroke (Fig.12).
Four obvious vortex structures were identified over the wingbeatcycle, but additional smaller structures could exist and might notbe identified due to the background noise level. This is more likelyduring the upstroke, when there are a number of small vorticitypatches visible, probably related to the complex wing motion andincreased body–wing interaction. In addition, only circulation in thestreamwise direction could be resolved, underestimating the truecirculation of inclined, and therefore diagonally cut, vortices.
Circulation in the near and far fieldThe PIV observation plane was located between two and 20 wingchords from the flying bats, and a single trial often contained multiplewingbeat cycles, starting in the near field, and ending in the farfield, because of the upstream movement of the bat. Comparisonbetween these wingbeat cycles shows that the vortex structuresdissipate slightly with increasing distance, as one would expect. Inaddition, one can observe an increasing displacement of vorticesbecause of vortex interaction with the downstream movement ofthe wake (Johansson et al., 2008). However, we found no significantcorrelation between distance behind the bat and strength of any ofthe four main vortices identified or the overall circulation. Theconstant total circulation confirms previous observations, where nosignificant influence of dissipation and flow unsteadiness was foundover a range of two to 40 wing chords (Hubel et al., 2009), and isconsistent with results from recent studies of bat wakes (Johanssonet al., 2008). The lack of significant changes in the strength of theseparate vortices with increased distance from the animal also showsthat the vortex roll-up process was completed by the closest locationat which the PIV plane sampled the wake, in agreement with studiesof tip vortex development, which showed that rollup is finishedapproximately 1–1.5 chord lengths behind the wing (Birch and Lee,2003). Measurements on swept and rectangular wings at Re180,000have also shown no significant change in circulation between 1 and3.5 chord length behind the wing (Gerontakos and Lee, 2006).However, although circulation was not affected by increasingdistance, it is possible that with increasing distance from the bat thelikelihood that we might not adequately detect small vortexstructures increases.
Absolute forcesIt is common for PIV studies in animal flight to relate wake circulationto lift force using the Kutta–Joukowski theorem (Anderson, 2001).However, determining absolute lift values for our measurements is
Mid-downstroke
Beginning of downstroke
V1
V1
V2
V4
V1
V2End upstroke
A
B
C
Fig.11. Idealized schematic of the possible distribution of the circulation overthe span for Cynopterus brachyotis at the beginning of downstroke, mid-downstroke and end of upstroke, based on the existence of tip, V1, body-near vortex, V2, and distal vortex pair V3 and V4. Grey: body and wings ofbat from behind, orange line: possible distribution of the circulation.
THE JOURNAL OF EXPERIMENTAL BIOLOGY
3438
challenging for several reasons, including continuously changingwingspan and experimental challenges associated with time-resolvedmeasurements in the transverse plane. The limits to generatingadequate laser energy at high frequency, generating high densities ofseeding particles, and maintaining adequate spatial resolution in alarge PIV window all contribute to lower than expected values in theabsolute magnitude of the circulation measured. This issue has beenquantified in detail for a model system consisting of a fixed winggenerating a comparable vortex structure as is reported here (Waldmanet al., 2009). It was found that with our current available laser powerof 50mJpulse–1 at 200Hz, decreasing spatial resolution leads to aincompletely resolved streamwise vortex structure, and that althoughthe vortex shape is correctly captured, the measured circulation islower than the true circulation. In the series of experiments reportedhere, capturing the whole wingbeat cycle of the medium-sized batrequired a large observation area with resolution of 0.24mmpixel–1,and we determined that the absolute magnitude of the circulation,and consequently the aerodynamic forces, to be underestimated byapproximately 30%.
The circulation extracted from the transverse plane contains thevertical force component of lift whereas the magnitude of thehorizontal forward force is not directly determined. Ultimately, the vertical force must balance body weight over the course of thewingbeat cycle if there is not significant vertical acceleration. Wecalculated the average vertical force generated over the course of awingbeat cycle based on the tip vortex circulation, integrated overthe instantaneous wing extension. The near-body vortex and distalvortex pair were neglected for this estimation, leading to anoverestimate of force production. With these considerations in mind,we find that the vertical force calculated based on the circulationof the tip vortex gives a lift force value of 42.7% of the body weight,well below the 70% expected based on the low spatial resolution.The value was found to vary slightly depending on the PIVevaluation parameters.
To further explore the possible sources of the underestimation oflift in our measurements, we carried out a supplementary experiment.We readjusted the thickness and intensity distribution of the lasersheet and added a second seeding particle generator to test thehypothesis that these were the most important factors in our low liftmagnitude estimates, and carried out four trials at lower and higherspeed employing one bat (bat IV). In these trials, lift averaged 94.6%of body weight when based on tip vorticity. The overall structure ofthe wake and relative strengths of the distinct vortex structures wereidentical to those in all previous experiments reported here.
Kinematics and PIV correlationThe simultaneous recording of PIV and kinematics and thesubsequent correlation between the two measurements allows us,in principle, to link vortex wake structures to specific geometricfeatures of the wingbeat cycle, such as angle of attack. In addition,one can make associations between the instantaneous positions ofmarked locations on the wing and vorticity features in the wake.However, as mentioned earlier, this association is difficult, as onehas to consider the effects of vortex interactions and resultingdisplacements generated by the induced velocities with increasingdistance between the trailing edge and observation plane. Duringthe downstroke, although the tip vortex is shifted slightly inwardand located below the wing tip, the correlation with the position ofthe wing tip is apparent (Fig.5A). At the beginning of the upstroke,there is an additional inward shift, and the tip vortex loses its closeassociation with the wing tip position. At this stage of the cycle,the direct correlation between positions on the wing and thegenerated vortex structure becomes challenging. The wings arepulled towards the body and the two tip vortices are quite close toeach other, and thus influence each other strongly. During this phaseof the wingbeat cycle, the tip vortex often develops a secondaryvortex core (Fig.5B,C,D,E). Some of the trials show what seemsto be a distinct split of the tip vortex into two branches, with theinner branch in close proximity to the location of the tip of the fifthdigit. However, more often the pattern is much less distinct. Wingmotion, the more vertical orientation of the distal wing, and theinfluence of the body and other secondary vortex structures allcontribute to a more complex pattern of vortex advection from thebody to the PIV measurement plane, making the association betweenvortex structures and specific features on the body difficult if notimpossible during this phase of the wingbeat cycle. From theseexperiments alone, it is not possible to determine conclusivelywhether the secondary vortex core structure is a result of a changein the distribution of the circulation over the wing or is founded invortex–vortex or vortex–body interactions.
Individual differencesThere are considerable differences in the wing path trajectorybetween individuals and the two speeds, as well as in the adjustmentof flight parameters between speeds. Amplitude, stroke plane angle,and body-to-wingtip distance (‘curling’) are the most consistentparameters to vary between the two speed categories, suggestingthat their influence on aerodynamic forces can be important. Thedifferences in body-to-wingtip distance between the speeds isespecially obvious for bat I and bat III, which maintain aconsiderably larger body-to-wingtip distance at the lower speed thanthe other two bats. At higher speed, the difference is less pronounced,and all the bats pull their wings closer to the body on the upstroke.Downstroke ratio, maximum span and frequency changed less oftenbetween the two speed categories; one might speculate that theirpurpose might be that of fine tuning rather than the change in speed
T. Y. Hubel and others
C B A
V1
V4
V3
V1
V2Flightdirection
Flightdirection
Fig.12. Reconstruction of the 3-D wake structure based on the 2-D PIVmeasurements. Sections (A,B and C) correspond to the 2-D vorticity fieldsand 3-D isosurface reconstruction in Fig.4. Red arrows: counter-clockwiserotating vortex; blue arrows: clockwise rotating vortex; grey arrows:predicted vorticity shed in the parallel plane (x–z-plane) either in the formof shear layers or starting and stopping vortices.
THE JOURNAL OF EXPERIMENTAL BIOLOGY
3439Flight of Cynopterus brachyotis
itself. The results regarding the significance of frequency anddownstroke ratio in Cynopterus stand in contrast to other speciesthat show a significant change in frequency (Norberg and Winter,2006; Wolf et al., 2010) and downstroke ratio (Wolf et al., 2010)with speed, but are in agreement with measurements used forcomparing kinematics of differently sized pteropodid bats (Riskinet al., 2010). Out of six species investigated three did not show asignificant change in frequency with speed and only two showedsignificant change in downstroke ratio. Surprisingly, for bat II, therewere no significant differences between speeds in any of theparameters we described. However, the relative lack of kinematicdifferences between lower and higher speed overall and in this batin particular suggests that parameters yet to be considered are likelyto be relevant to regulating flight speed. These results also provideadditional evidence that individual bats vary in the ways in whichdiverse flight parameters may be modulated to change the flightspeed (Iriarte-Diaz, 2008). The high degree of individual variationshows that the sample size can greatly influence the significance ofcertain flight parameters. General statements regarding theimportance of certain parameters for a species based on theinvestigation of only four or five individuals must be regarded withsome caution (Iriarte-Diaz and Swartz, 2008; Riskin et al., 2010)and are more tentative for even smaller sample sizes (Norberg andWinter, 2006; Wolf et al., 2010).
Linking individual differences in kinematic strategies to specificindividual variations in morphology, such as body mass, wingloading or bone architecture, is a challenging but potentiallyrewarding avenue for future research.
The development of circulation of the tip vortex also differsbetween individuals and between speeds. Higher speed seems to beassociated with a shorter duration of constant circulation and anearlier onset of the decrease in circulation. The two bats that exhibitless curling in their wings during the upstroke at lower speed, batsI and III, also show steep changes in circulation at the beginningand end of the wingbeat cycle and a long phase of nearly constantcirculation in between. These two observations may or may not berelated, and the causality between the development of circulationand wing path trajectory, angle of attack, and other kinematicparameters would benefit from further investigation. The standarddeviation of the circulation is considerably higher than of the two-dimensional wing path trajectory, considering the differences in allthree dimensions and other flight parameters, suggesting that wehave yet to identify the complete kinematic basis of the productionof the measured circulation.
ConclusionsWe consistently identified four vortex structures as typical for bothlower and higher speed flight in Cynopterus brachyotis. The wakestructure was dominated by a strong tip vortex that developed duringthe downstroke and remained until almost the end of the upstroke.However, although the portion of the wingbeat cycle with no tipvortex was very short, the wake structure can still be considered avortex ring rather than a continuous vortex structure. The proportionof the cycle without the presence of the tip vortex increased withspeed; this contrasts with the continuous vortex or ladder structureat higher speeds that has been proposed for bird flight based onboth observations and theory (Rayner and Gordon, 1998; Hedricket al., 2002; Tobalske et al., 2007; Henningsson et al., 2008).Simultaneously with the onset of the tip vortex at the beginning ofthe downstroke, a counter-rotating near-body vortex developed,indicating that the left and right wings operate independently, withno or little lift generation over the body. However, shortly afterwards
the near-body vortex diminished, leaving the two wings, includingthe body, operating as a single airfoil. A pair of two small vorticesappears at the end of the upstroke at the distal part of the wing, asign of negative lift, accompanied by thrust generation at the distalpart of the wing. However, drag and positive lift at the proximalwing prevail during most of the duration of the distal vortex pairdue to the concurrent persistence of the tip vortex. Wing kinematics,as well as the development and strength of both the tip and near-body vortices, vary between individuals and speeds. However,finding direct causality between the development of the circulationand kinematics is challenging because of the number of changingparameters, and is an exciting challenge for future research.
ACKNOWLEDGEMENTSWe thank Nickolay Hristov, Arnold Song and Rye Waldman for helpful discussions,and Anthony Assad, Zachary Levko, Leigh MacAyeal, Alex Robb and AllyceSullivan for handling and training of animals and their help with data collection.Andrew Bearnot helped design and create Fig.12. We thank the Lubee BatConservancy, especially Allyson Walsh, for long term access to the bats. This workwas supported by the Air Force Office of Scientific Research, monitored by RhettJeffries, Willard Larkin and John Schmisseur, and the National Science Foundation.
LIST OF ABBREVIATIONSA areaax horizontal accelerationaz vertical accelerationb span of one wingc wing chorddmin minimum distance between body and wing tipdt time between imagesdtnew time used to correct for Doppler shiftf wingbeat frequencyh heightk reduced frequencyRe Reynolds numberSR span ratioT wingbeat periodU� free-stream (wind tunnel) velocityUB speed of bat, relative to test sectionUt total air speed of bat, U�–UB
V1 tip vortexV2 near body vortexV3 positive distal vortexV4 negative distal vortexag geometric angle of attack stroke plane angleG dimensionless height (Gh/b)G circulationGAt circulation based on total area right of body positionqtip amplitude of wing tipn kinematic viscosity air densitys standard deviationt downstroke ratiow vorticity
REFERENCESAbdel-Aziz, Y. I. and Karara, H. M. (1971). Direct linear transformation from
comparator coordinates into object space coordinates in close-rangephotogrammetry. In Proceedings of the Symposium on Close-RangePhotogrammetry, pp. 1-18. Falls Church, VA: American Society of Photogrammetry.
Adrian, R. J., Christensen, K. T. and Liu, Z. C. (2000). Analysis and interpretation ofinstantaneous turbulent velocity fields. Exp. Fluids 29, 275-290.
Aldridge, H. D. (1986). Kinematics and aerodynamics of the greater horseshoe bat,Rhinolophus ferrumequinum, in horizontal flight at various flight speeds. J. Exp. Biol.126, 479-497.
Anderson, J. D. (2001). Fundamentals of Aerodynamics. McGraw Hill.Betz, A. (1932). Verhalten von Wirbelsystemen. Zeitschrift fur angewandte
Mathematikund Mechanik 12, 164-174.Birch, D. and Lee, T. (2003). The roll-up and near field behavior of a tip vortex. J.
Aircr. 40, 603-607.Birch, J. M. and Dickinson, M. H. (2001). Spanwise flow and the attachment of the
leading-edge vortex on insect wings. Nature 412, 729-733.
THE JOURNAL OF EXPERIMENTAL BIOLOGY
3440
Birch, J. M. and Dickinson, M. H. (2003). The influence of wing-wake interactions onthe production of aerodynamic forces in flapping flight. J. Exp. Biol. 206, 2257-2272.
Bomphrey, R. J., Lawson, N. J., Harding, N. J., Taylor, G. K. and Thomas, A. L. R.(2005). The aerodynamics of Manduca sexta: digital particle image velocimetryanalysis of the leading-edge vortex. J. Exp. Biol. 208, 1079-1094.
Dickinson, M. H. and Gotz, K. G. (1996). The wake dynamics and flight forces of thefruit fly Drosophila melanogaster. J. Exp. Biol. 199, 2085-2104.
Dickinson, M. H., Lehmann, F. and Sane, S. P. (1999). Wing rotation and theaerodynamic basis of insect flight. Science 284, 1954-1960.
Ellington, C. P. (1999). The novel aerodynamics of insect flight: applications to micro-air vehicles. J. Exp. Biol. 202, 3439-3448.
Gerontakos, P. and Lee, T. (2006). Near-field tip vortex behind a swept wing model.Exp. Fluids 40, 141-155.
Hartley, R. and Zissermann, A. (2000). Multiple View Geometry in Computer Vision.Cambridge: Cambridge University Press.
Hedenström, A., Rosén, M. and Spedding, G. R. (2006). Vortex wakes generated byrobins Erithacus rubecula during free flight in a wind tunnel. J. R. Soc. Interface 3,263-276.
Hedenström, A., Johansson, L. C., Wolf, M., von Busse, R., Winter, Y. andSpedding, G. R. (2007). Bat flight generates complex aerodynamic tracks. Science316, 894-897.
Hedenström, A., Muijres, F., von Busse, R., Johansson, L., Winter, Y. andSpedding, G. (2009). High-speed stereo DPIV measurement of wakes of two batspecies flying freely in a wind tunnel. Exp. Fluids 46, 923-932.
Hedrick, T. L., Tobalske, B. W. and Biewener, A. A. (2002). Estimates of circulationand gait change based on a three-dimensional kinematic analysis of flight incockatiels (Nymphicus hollandicus) and ringed turtle-doves (Streptopelia risoria). J.Exp. Biol. 205, 1389-1409.
Henningsson, P., Spedding, G. R. and Hedenström, A. (2008). Vortex wake and flightkinematics of a swift in cruising flight in a wind tunnel. J. Exp. Biol. 211, 717-730.
Hubel, T. and Tropea, C. (2009). Experimental investigation of a flapping wing model.Exp. Fluids 46, 945-961.
Hubel, T., Hristov, N., Swartz, S. M. and Breuer, K. S. (2009). Time-resolved wakestructure and kinematics of bat flight. Exp. Fluids 46, 933-943.
Iriarte-Diaz, J. (2008). Flight performance in bats and its ecomorphologicalimplications. PhD thesis, Department of Ecology and Evolutionary Biology, BrownUniversity, Providence.
Iriarte-Diaz, J. and Swartz, S. M. (2008). Kinematics of slow turn maneuvering in thefruit bat Cynopterus brachyotis. J. Exp. Biol. 211, 3478-3489.
Johansson, L. C. and Hedenström, A. (2009). The vortex wake of blackcaps (Sylviaatricapilla L.) measured using high-speed digital particle image velocimetry (DPIV). J.Exp. Biol. 212, 3365-3376.
Johansson, L. C., Wolf, M., von Busse, R., Winter, Y., Spedding, G. R. andHedenström, A. (2008). The near and far wake of Pallas’ long tongued bat(Glossophaga soricina). J. Exp. Biol. 211, 2909-2918.
Lindhe Norberg, U. M. and Winter, Y. (2006). Wing beat kinematics of a nectar-feeding bat, Glossophaga soricina, flying at different flight speeds and Strouhalnumbers. J. Exp. Biol. 209, 3887-3897.
Lu, Y., Shen, G. X. and Lai, G. J. (2006). Dual leading-edge vortices on flappingwings. J. Exp. Biol. 209, 5005-5016.
Muijres, F. T., Johansson, L. C., Barfield, R., Wolf, M., Spedding, G. R. andHedenström, A. (2008). Leading-edge vortex improves lift in slow-flying bats.Science 319, 1250-1253.
Norberg, U. M. (1976a). Aerodynamics of hovering flight in the long-eared batPlecotus auritus. J. Exp. Biol. 65, 459-470.
Norberg, U. M. (1976b). Aerodynamics, kinematics, and energetics of horizontalflapping flight in the long-eared bat Plecotus auritus. J. Exp. Biol. 65, 179-212.
Norberg, U. M. L. and Winter, Y. (2006). Wing beat kinematics of a nectar-feedingbat, Glossophaga soricina, flying at different flight speeds and Strouhal numbers. J.Exp. Biol. 209, 3887-3897.
Rayner, J. M. V. (1991). On the aerodynamics of animal flight in ground effect. Philos.Trans. R Soc. Lond., B, Biol. Sci. 334, 119-128.
Rayner, J. M. V. and Gordon, R. (1998). Visualization and modelling of the wakes offlying birds. In Biona Report 13, Motion Systems (ed. R. Blickhan, A. Wisser and W.Nachtigall), Jena: Gustav Fischer Verlag.
Riskin, D. K., Willis, D. J., Iriarte-Díaz, J., Hedrick, T. L., Kostandov, M., Chen, J.,Laidlaw, D. H., Breuer, K. S. and Swartz, S. M. (2008). Quantifying the complexityof bat wing kinematics. J. Theor. Biol. 254, 604-615.
Riskin, D. K., Bahlman, J. W., Hubel, T. Y., Ratcliffe, J. M., Kunz, T. H. andSwartz, S. M. (2009). Bats go head-under-heels: the biomechanics of landing on aceiling. J. Exp. Biol. 212, 945-953.
Riskin, D. K., Iríarte-Diaz, J., Middleton, K. M., Swartz, S. M. and Breuer, K. S.(2010). The effect of body size on the wing movements of pteropodid bats, withinsights into thrust and lift production. J. Exp. Biol. (in press).
Sane, S. P. (2003). The aerodynamics of insect flight. J. Exp. Biol. 206, 4191-4208.Spedding, G. R., Hedenström, A. and Rosén, M. (2003a). Quantitative studies of
the wakes of freely flying birds in a low-turbulence wind tunnel. Exp. Fluids 34, 291-303.
Spedding, G. R., Rosén, M. and Hedenström, A. (2003b). A family of vortex wakesgenerated by a thrush nightingale in free flight in a wind tunnel over its entire naturalrange of flight speeds. J. Exp. Biol. 206, 2313-2344.
Spedding, G., Hedenström, A. and Johansson, L. (2009). A note on wind-tunnelturbulence measurements with DPIV. Exp. Fluids 46, 527-537.
Tian, X., Iriarte-Diaz, J., Middleton, K., Galvao, R., Israeli, E., Roemer, A., Sullivan,A., Song, A., Swartz, S. and Breuer, K. (2006). Direct measurements of thekinematics and dynamics of bat flight. Bioinspir. Biomim. 1, 10-18.
Tobalske, B. W., Hedrick, T. L., Dial, K. P. and Biewener, A. A. (2003). Comparativepower curves in bird flight. Nature 421, 363-366.
Tobalske, B. W., Warrick, D. R., Clark, C. J., Powers, D. R., Hedrick, T. L., Hyder,G. A. and Biewener, A. A. (2007). Three-dimensional kinematics of hummingbirdflight. J. Exp. Biol. 210, 2368-2382.
Usherwood, J. R. and Ellington, C. P. (2002). The aerodynamics of revolving wingsI. Model hawkmoth wings. J. Exp. Biol. 205, 1547-1564.
Usherwood, J. R., Hedrick, T. L. and Biewener, A. A. (2003). The aerodynamics ofavian take-off from direct pressure measurements in Canada geese (Brantacanadensis). J. Exp. Biol. 206, 4051-4056.
van den Berg, C. and Ellington, C. P. (1997). The vortex wake of a “hovering” modelhawkmoth. Philos. Trans. R. Soc. B. Biol. Sci. 352, 317-328.
Waldman, R., Kudo, J. and Breuer, K. S. (2009). Trailing vortices from low speed flyers.APS/DFD meeting abstract. Minneapolis MN. http://meetings.aps.org/link/BAPS.2009.DFD.PT.2
Warrick, D. R., Tobalske, B. W. and Powers, D. R. (2005). Aerodynamics of thehovering hummingbird. Nature 435, 1094-1097.
Wolf, M., Johansson, L. C., von Busse, R., Winter, Y. and Hedenstrom, A. (2010).Kinematics of flight and the relationship to the vortex wake of a Pallas’ long tonguedbat (Glossophaga soricina). J. Exp. Biol. 213, 2142-2153.
T. Y. Hubel and others
THE JOURNAL OF EXPERIMENTAL BIOLOGY


![KINEMATICS - new.excellencia.co.innew.excellencia.co.in/college/web/pdf/Kinematics-merged.pdf · KINEMATICS KINEMATICS WORKSHEET 1 1) Displacement is a _____ [ ] 1) Vector quantity](https://img.pdfslide.us/doc/110x75/5f356d4687229051801abace/kinematics-new-kinematics-kinematics-worksheet-1-1-displacement-is-a-.jpg)