Embed Size (px)
Citation preview

Waits Events and the
Geeks who love them
Kyle Hailey
http://perfvision.com
Copyright 2006 Kyle Hailey
#.2
Wait EventsWait EventsWait Events

Copyright 2006 Kyle Hailey
#.3
And the Geeks Who Love Them
Copyright 2006 Kyle Hailey
#.4
In this Presentation:
Tuning MethodologyPlan of ActionStatspacks for Collection DataBased on Waits
Waits Cheat Sheet top 36 Waits
Details 4 hardest Waits

Copyright 2006 Kyle Hailey
#.5
Word of Wisdom
Half of the game is knowing when to act and how much effort to put in
Copyright 2006 Kyle Hailey
#.6
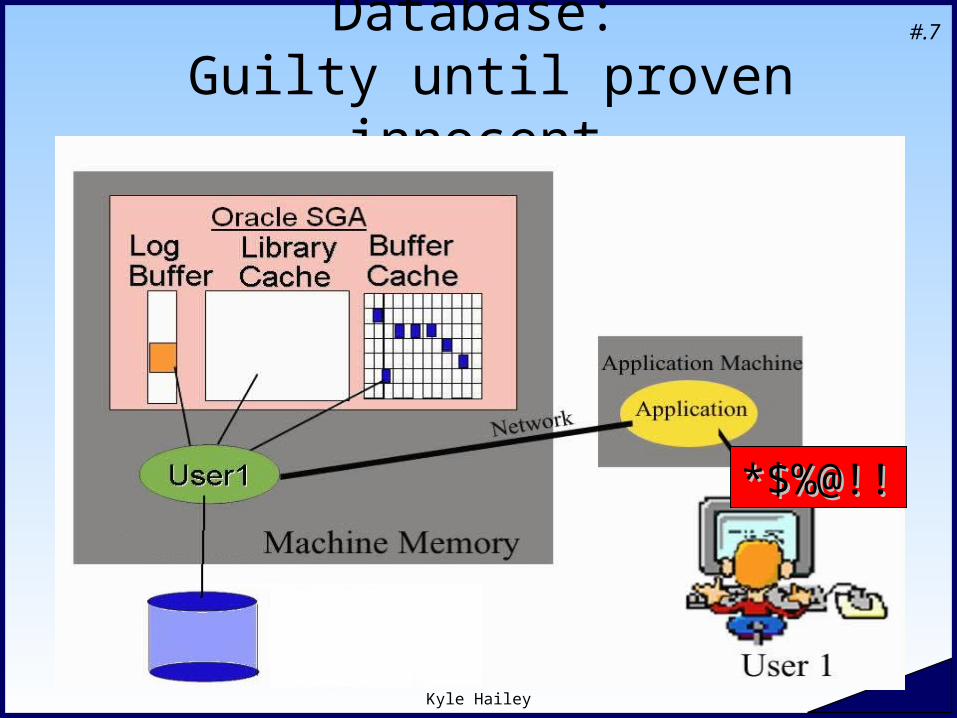
Database is Hung!
Everybody blames the databasePoor DatabaseYet 9 out of 10 dba’s agree it’s not the
databaseHow do you prove it to management?On the off chance it’s the database, now
we are in some serious trouble!
Copyright 2006 Kyle Hailey
#.7Database: Guilty until proven innocent
*$%@!!*$%@!!
Copyright 2006 Kyle Hailey
#.8
Oracle’s Defense
After years of false accusations Oracle took action and created a defense
system:
WAIT EVENTS
To the rescue
Copyright 2006 Kyle Hailey
#.9
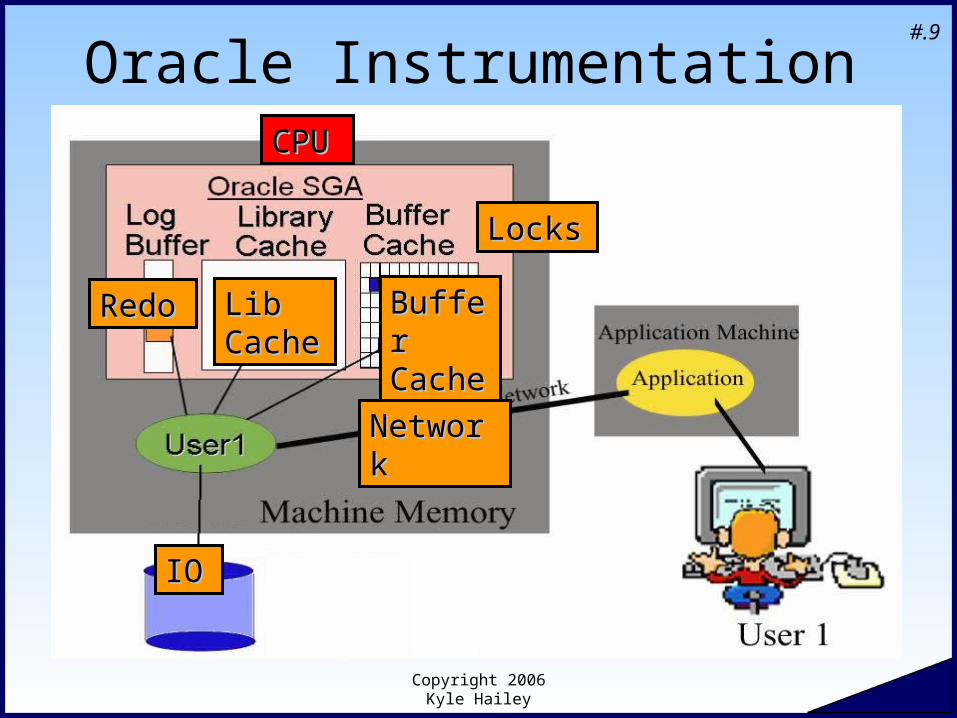
Oracle Instrumentation
RedoRedo Lib Lib CacheCache
Buffer Buffer CacheCache
IOIO
LocksLocks
NetworkNetwork
CPU CPU
Copyright 2006 Kyle Hailey
#.10
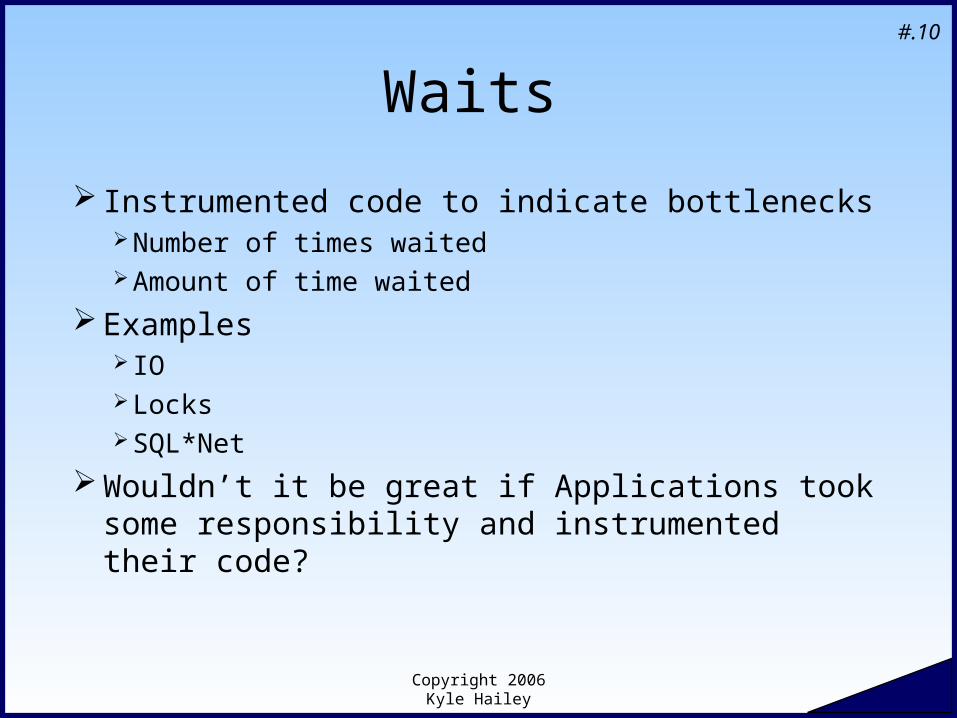
Waits
Instrumented code to indicate bottlenecksNumber of times waitedAmount of time waited
Examples IO LocksSQL*Net
Wouldn’t it be great if Applications took some responsibility and instrumented their code?
Copyright 2006 Kyle Hailey
#.11
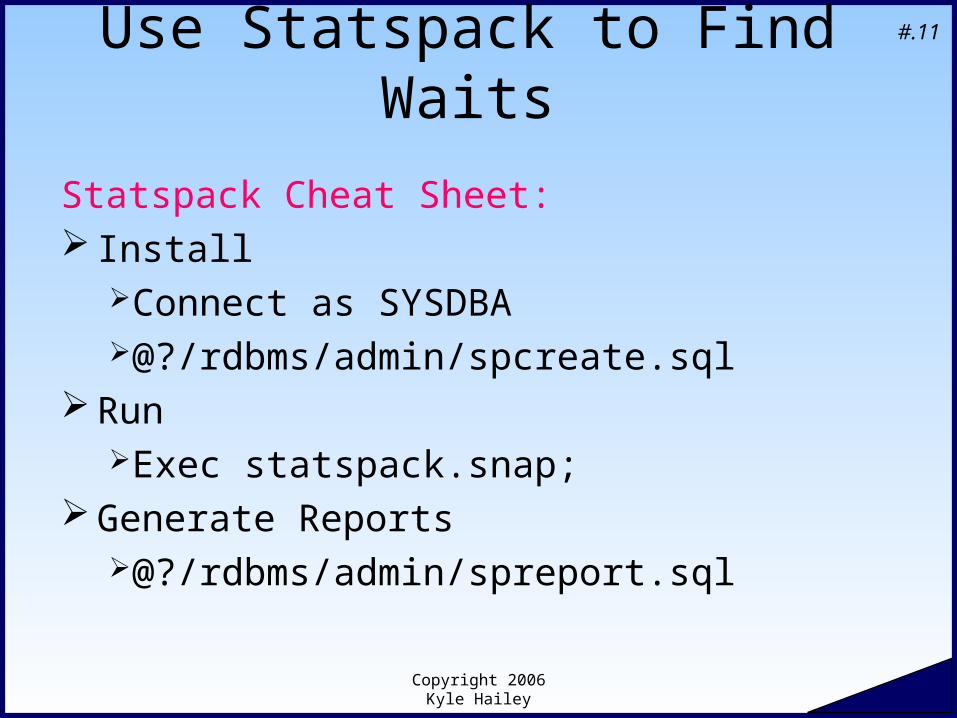
Use Statspack to Find Waits
Statspack Cheat Sheet: Install
Connect as SYSDBA@?/rdbms/admin/spcreate.sql
RunExec statspack.snap;
Generate Reports@?/rdbms/admin/spreport.sql
Copyright 2006 Kyle Hailey
#.12
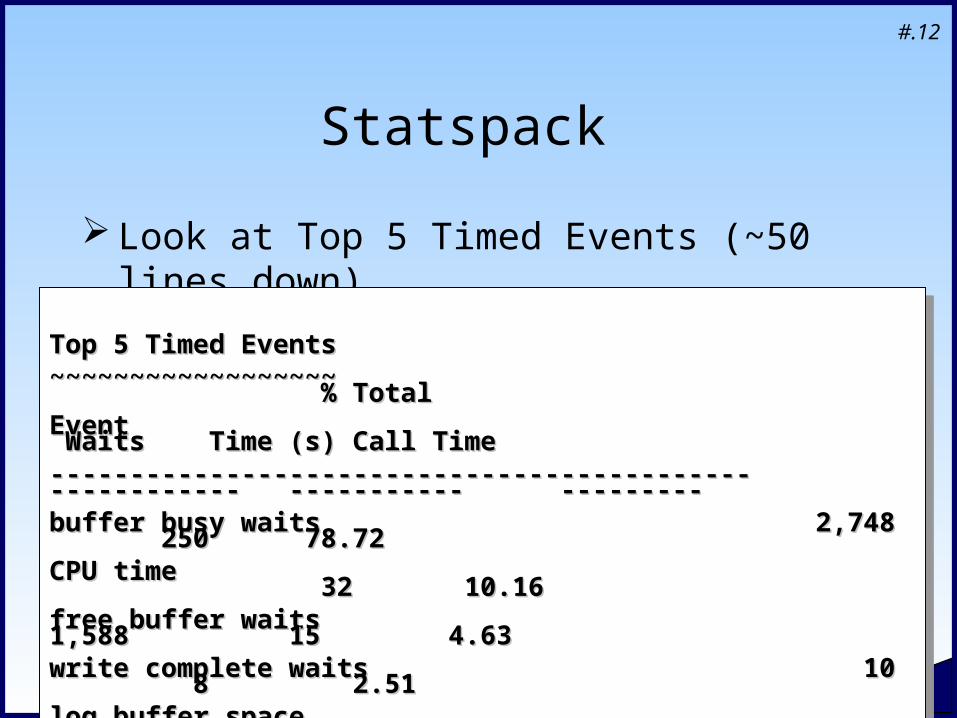
Statspack
Look at Top 5 Timed Events (~50 lines down)
Top 5 Timed EventsTop 5 Timed Events~~~~~~~~~~~~~~~~~~ % Total~~~~~~~~~~~~~~~~~~ % TotalEvent Waits Time (s) Call TimeEvent Waits Time (s) Call Time-------------------------------------------- ------------ ----------- ----------------------------------------------------- ------------ ----------- ---------buffer busy waits 2,748 250 78.72buffer busy waits 2,748 250 78.72CPU time 32 10.16CPU time 32 10.16free buffer waits 1,588 15 4.63free buffer waits 1,588 15 4.63write complete waits 10 8 2.51write complete waits 10 8 2.51log buffer space 306 5 1.51log buffer space 306 5 1.51
Top 5 Timed EventsTop 5 Timed Events~~~~~~~~~~~~~~~~~~ % Total~~~~~~~~~~~~~~~~~~ % TotalEvent Waits Time (s) Call TimeEvent Waits Time (s) Call Time-------------------------------------------- ------------ ----------- ----------------------------------------------------- ------------ ----------- ---------buffer busy waits 2,748 250 78.72buffer busy waits 2,748 250 78.72CPU time 32 10.16CPU time 32 10.16free buffer waits 1,588 15 4.63free buffer waits 1,588 15 4.63write complete waits 10 8 2.51write complete waits 10 8 2.51log buffer space 306 5 1.51log buffer space 306 5 1.51
Copyright 2006 Kyle Hailey
#.13
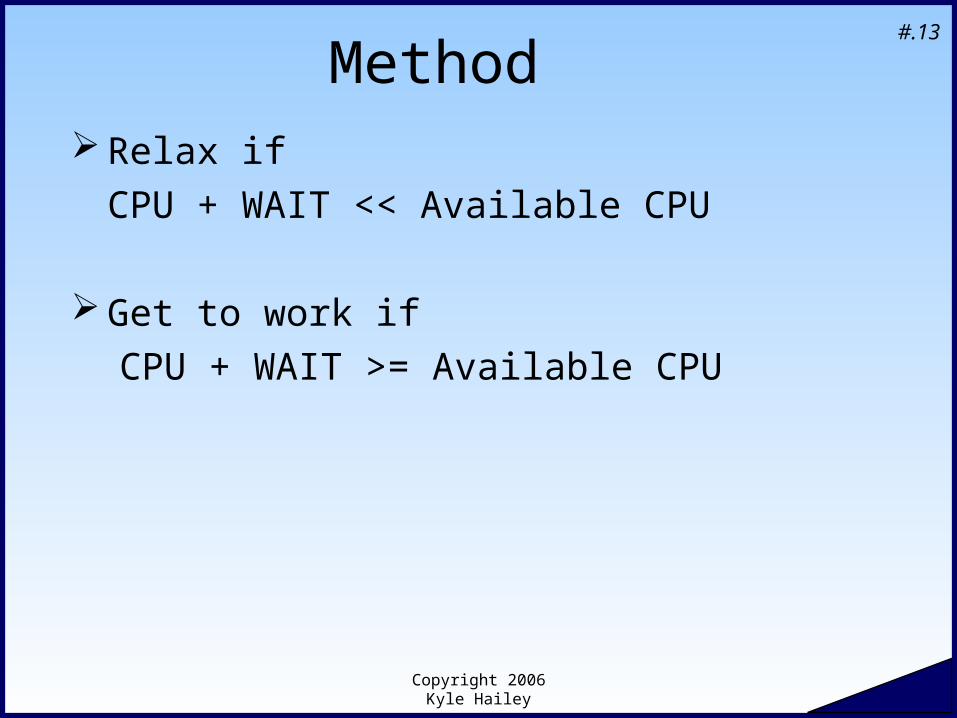
Method Relax if
CPU + WAIT << Available CPU
Get to work if
CPU + WAIT >= Available CPU
Copyright 2006 Kyle Hailey
#.14
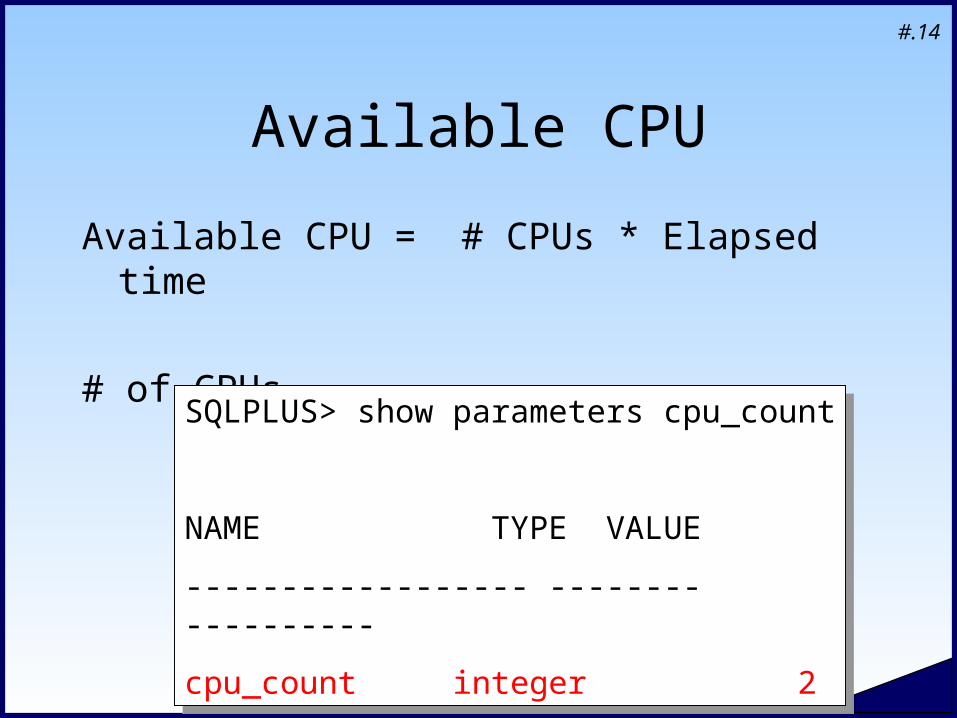
Available CPU
Available CPU = # CPUs * Elapsed time
# of CPUs
SQLPLUS> show parameters cpu_count
NAME TYPE VALUE
------------------ -------- ----------
cpu_count integer 2
SQLPLUS> show parameters cpu_count
NAME TYPE VALUE
------------------ -------- ----------
cpu_count integer 2
Copyright 2006 Kyle Hailey
#.15
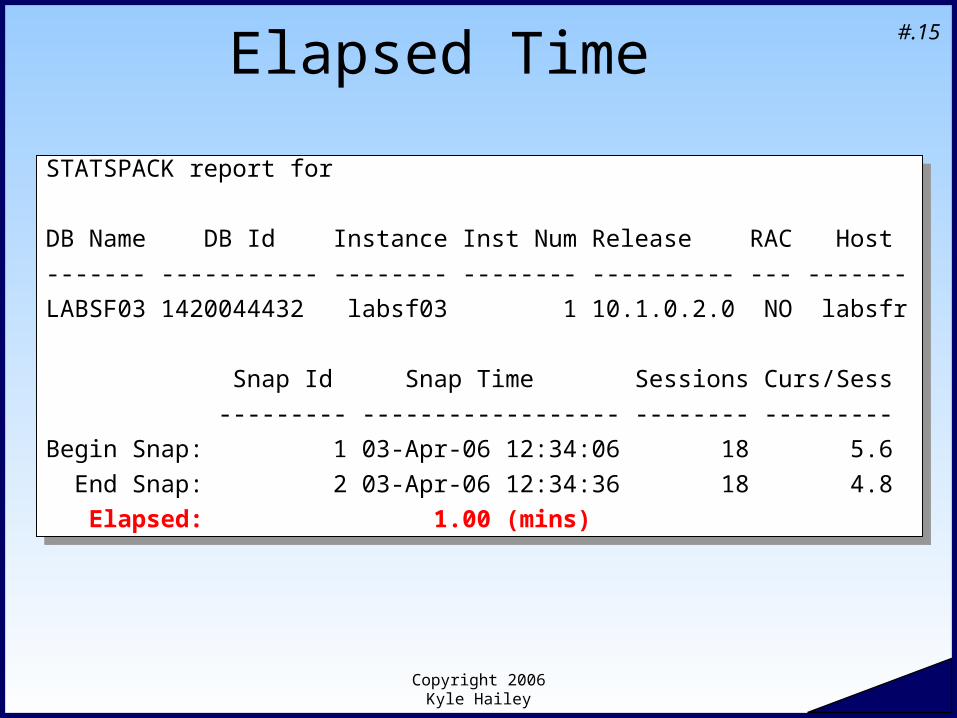
Elapsed Time
STATSPACK report for
DB Name DB Id Instance Inst Num Release RAC Host
------- ----------- -------- -------- ---------- --- -------
LABSF03 1420044432 labsf03 1 10.1.0.2.0 NO labsfr
Snap Id Snap Time Sessions Curs/Sess
--------- ------------------ -------- ---------
Begin Snap: 1 03-Apr-06 12:34:06 18 5.6
End Snap: 2 03-Apr-06 12:34:36 18 4.8
Elapsed: 1.00 (mins)
Copyright 2006 Kyle Hailey
#.16
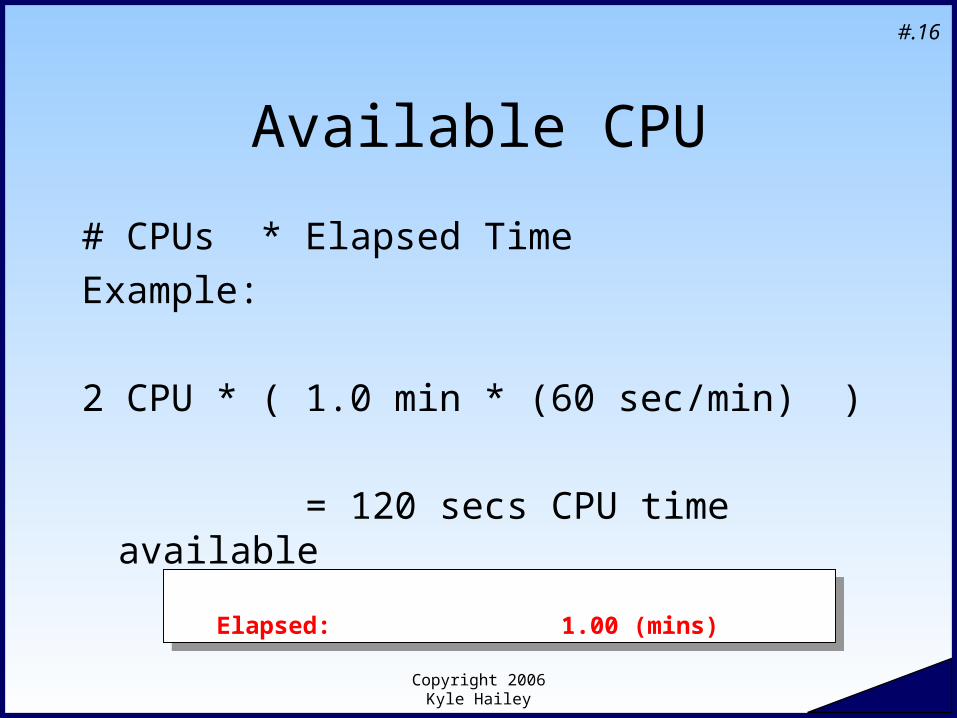
Available CPU
# CPUs * Elapsed Time
Example:
2 CPU * ( 1.0 min * (60 sec/min) )
= 120 secs CPU time available
Elapsed: 1.00 (mins) Elapsed: 1.00 (mins)
Copyright 2006 Kyle Hailey
#.17
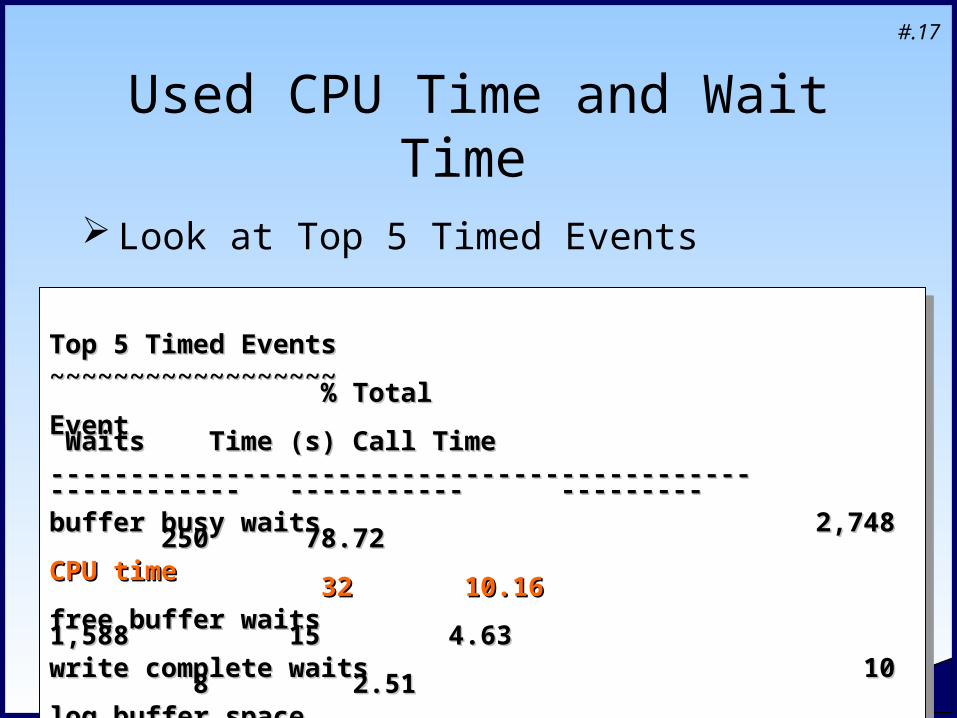
Used CPU Time and Wait Time
Look at Top 5 Timed Events
Top 5 Timed EventsTop 5 Timed Events~~~~~~~~~~~~~~~~~~ % Total~~~~~~~~~~~~~~~~~~ % TotalEvent Waits Time (s) Call TimeEvent Waits Time (s) Call Time-------------------------------------------- ------------ ----------- ----------------------------------------------------- ------------ ----------- ---------buffer busy waits 2,748 250 78.72buffer busy waits 2,748 250 78.72CPU time 32 10.16CPU time 32 10.16free buffer waits 1,588 15 4.63free buffer waits 1,588 15 4.63write complete waits 10 8 2.51write complete waits 10 8 2.51log buffer space 306 5 1.51log buffer space 306 5 1.51
Top 5 Timed EventsTop 5 Timed Events~~~~~~~~~~~~~~~~~~ % Total~~~~~~~~~~~~~~~~~~ % TotalEvent Waits Time (s) Call TimeEvent Waits Time (s) Call Time-------------------------------------------- ------------ ----------- ----------------------------------------------------- ------------ ----------- ---------buffer busy waits 2,748 250 78.72buffer busy waits 2,748 250 78.72CPU time 32 10.16CPU time 32 10.16free buffer waits 1,588 15 4.63free buffer waits 1,588 15 4.63write complete waits 10 8 2.51write complete waits 10 8 2.51log buffer space 306 5 1.51log buffer space 306 5 1.51
Copyright 2006 Kyle Hailey
#.18
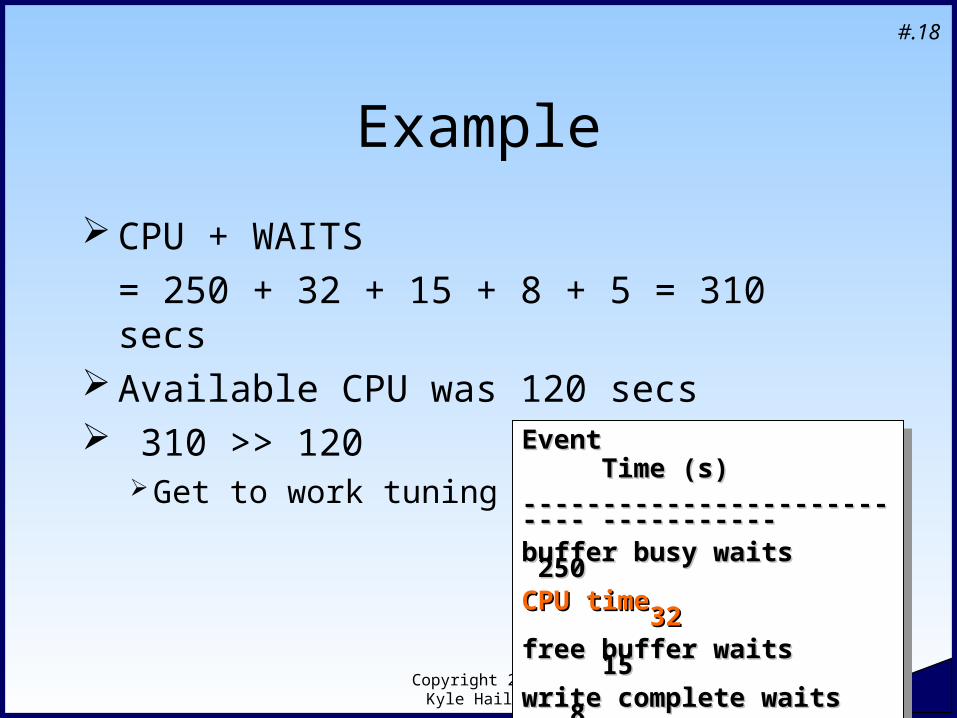
Example
CPU + WAITS
= 250 + 32 + 15 + 8 + 5 = 310 secs Available CPU was 120 secs 310 >> 120
Get to work tuning ! Event Time (s)Event Time (s)--------------------------- ----------- --------------------------- ----------- buffer busy waits 250 buffer busy waits 250 CPU time 32 CPU time 32 free buffer waits 15 free buffer waits 15 write complete waits 8write complete waits 8log buffer space 5log buffer space 5
Event Time (s)Event Time (s)--------------------------- ----------- --------------------------- ----------- buffer busy waits 250 buffer busy waits 250 CPU time 32 CPU time 32 free buffer waits 15 free buffer waits 15 write complete waits 8write complete waits 8log buffer space 5log buffer space 5
Copyright 2006 Kyle Hailey
#.19
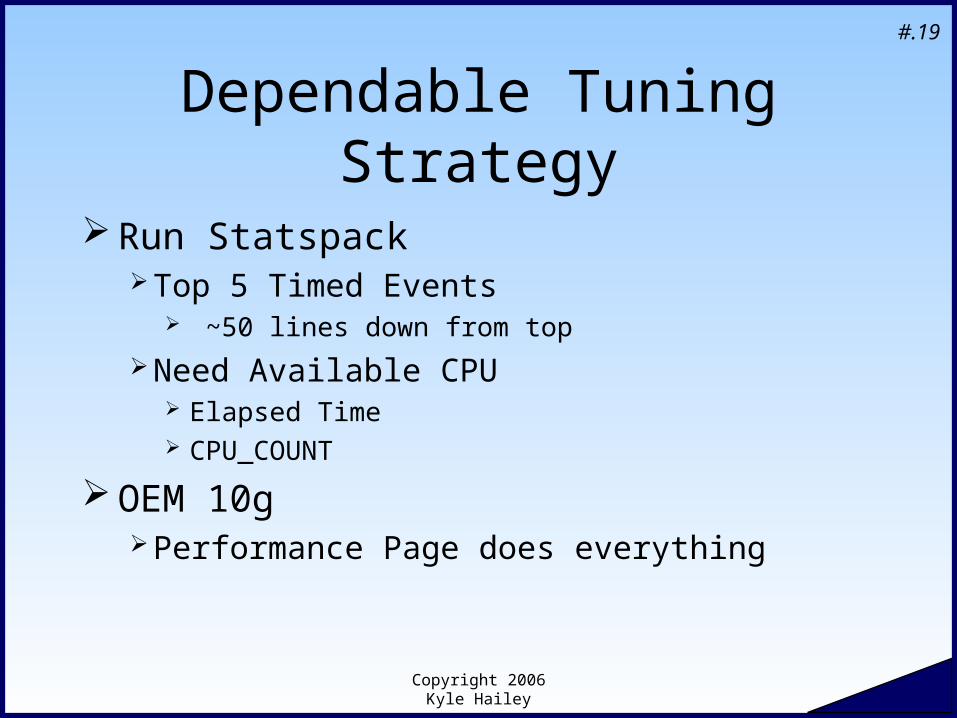
Dependable Tuning Strategy
Run StatspackTop 5 Timed Events
~50 lines down from top
Need Available CPU Elapsed Time CPU_COUNT
OEM 10gPerformance Page does everything
Copyright 2006 Kyle Hailey
#.20
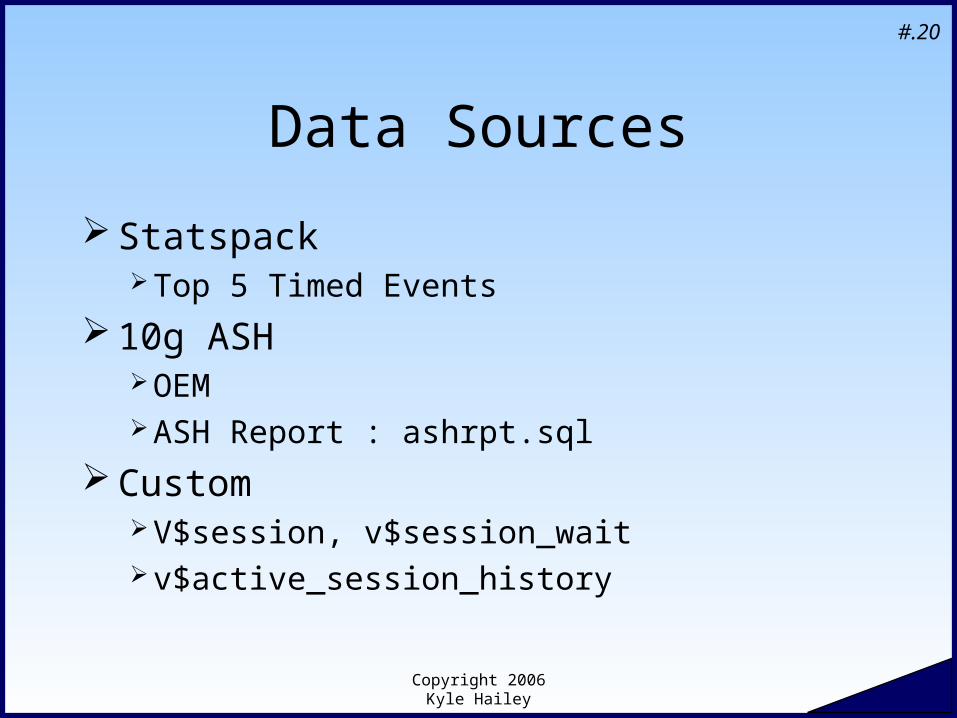
Data Sources
StatspackTop 5 Timed Events
10g ASHOEMASH Report : ashrpt.sql
CustomV$session, v$session_wait v$active_session_history
Copyright 2006 Kyle Hailey
#.21Statspack
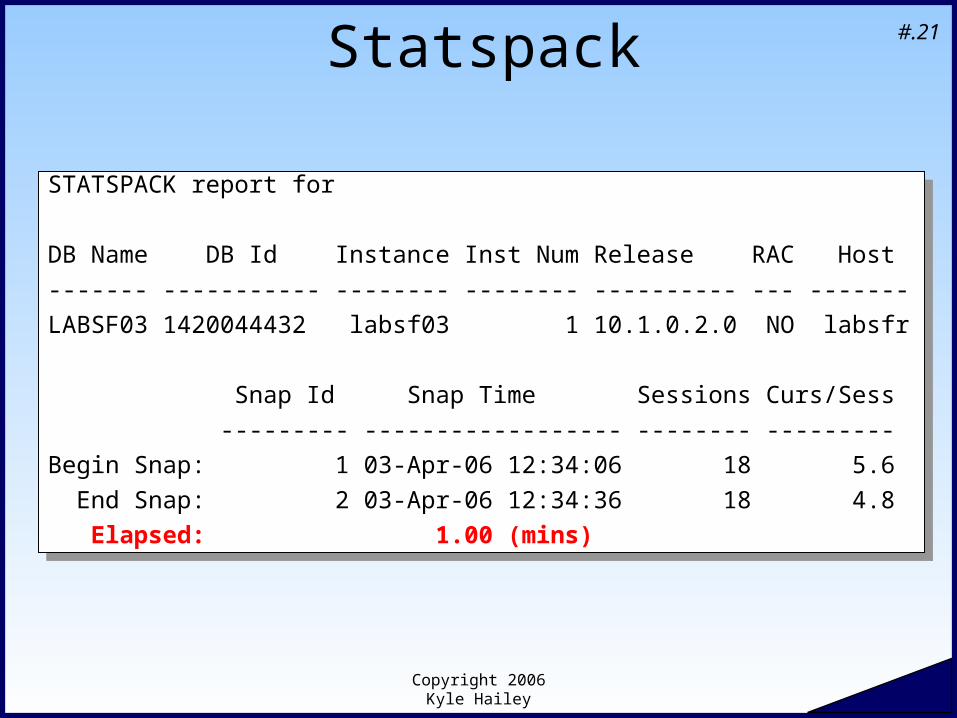
STATSPACK report for
DB Name DB Id Instance Inst Num Release RAC Host
------- ----------- -------- -------- ---------- --- -------
LABSF03 1420044432 labsf03 1 10.1.0.2.0 NO labsfr
Snap Id Snap Time Sessions Curs/Sess
--------- ------------------ -------- ---------
Begin Snap: 1 03-Apr-06 12:34:06 18 5.6
End Snap: 2 03-Apr-06 12:34:36 18 4.8
Elapsed: 1.00 (mins)
Copyright 2006 Kyle Hailey
#.22
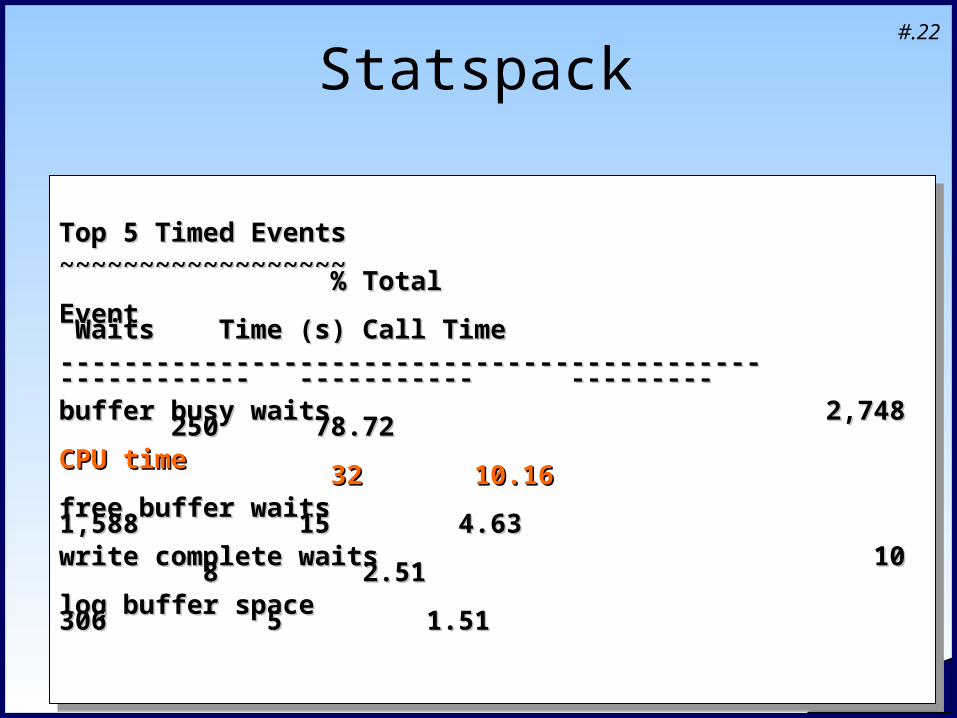
Statspack
Top 5 Timed EventsTop 5 Timed Events~~~~~~~~~~~~~~~~~~ % Total~~~~~~~~~~~~~~~~~~ % TotalEvent Waits Time (s) Call TimeEvent Waits Time (s) Call Time-------------------------------------------- ------------ ----------- ----------------------------------------------------- ------------ ----------- ---------buffer busy waits 2,748 250 78.72buffer busy waits 2,748 250 78.72CPU time 32 10.16CPU time 32 10.16free buffer waits 1,588 15 4.63free buffer waits 1,588 15 4.63write complete waits 10 8 2.51write complete waits 10 8 2.51log buffer space 306 5 1.51log buffer space 306 5 1.51
Top 5 Timed EventsTop 5 Timed Events~~~~~~~~~~~~~~~~~~ % Total~~~~~~~~~~~~~~~~~~ % TotalEvent Waits Time (s) Call TimeEvent Waits Time (s) Call Time-------------------------------------------- ------------ ----------- ----------------------------------------------------- ------------ ----------- ---------buffer busy waits 2,748 250 78.72buffer busy waits 2,748 250 78.72CPU time 32 10.16CPU time 32 10.16free buffer waits 1,588 15 4.63free buffer waits 1,588 15 4.63write complete waits 10 8 2.51write complete waits 10 8 2.51log buffer space 306 5 1.51log buffer space 306 5 1.51
Copyright 2006 Kyle Hailey
#.23
OEM 10g
9i &10g Licensed but worth it Does all the work
Aggregates Wait timeSums with CPU timeDisplays available CPUGroups WaitsFilters out unusable waits
Copyright 2006 Kyle Hailey
#.24
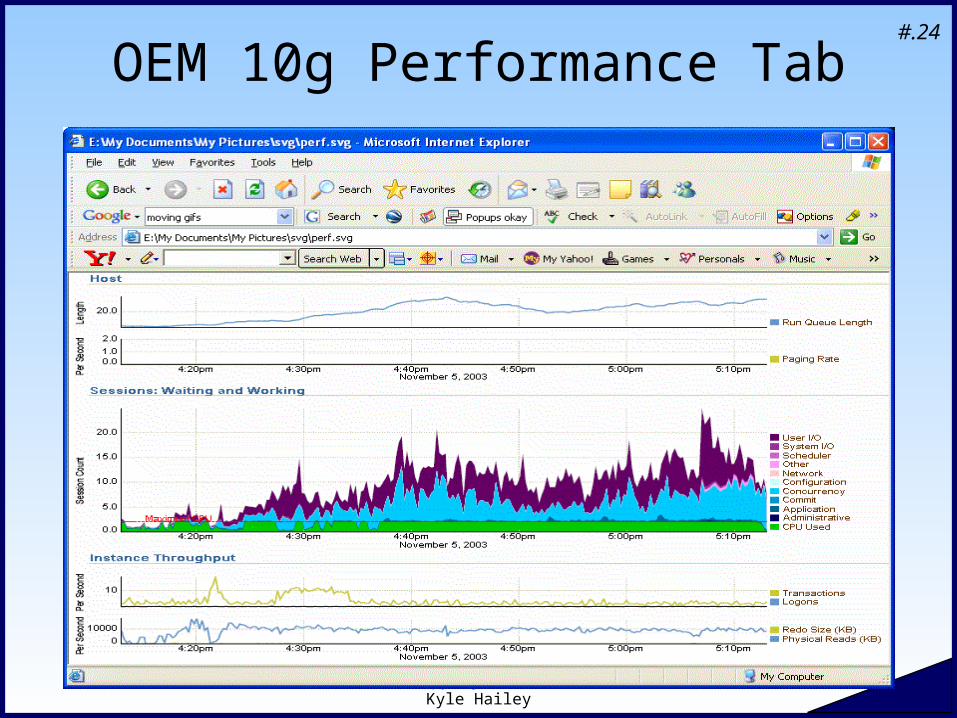
OEM 10g Performance Tab
Copyright 2006 Kyle Hailey
#.25
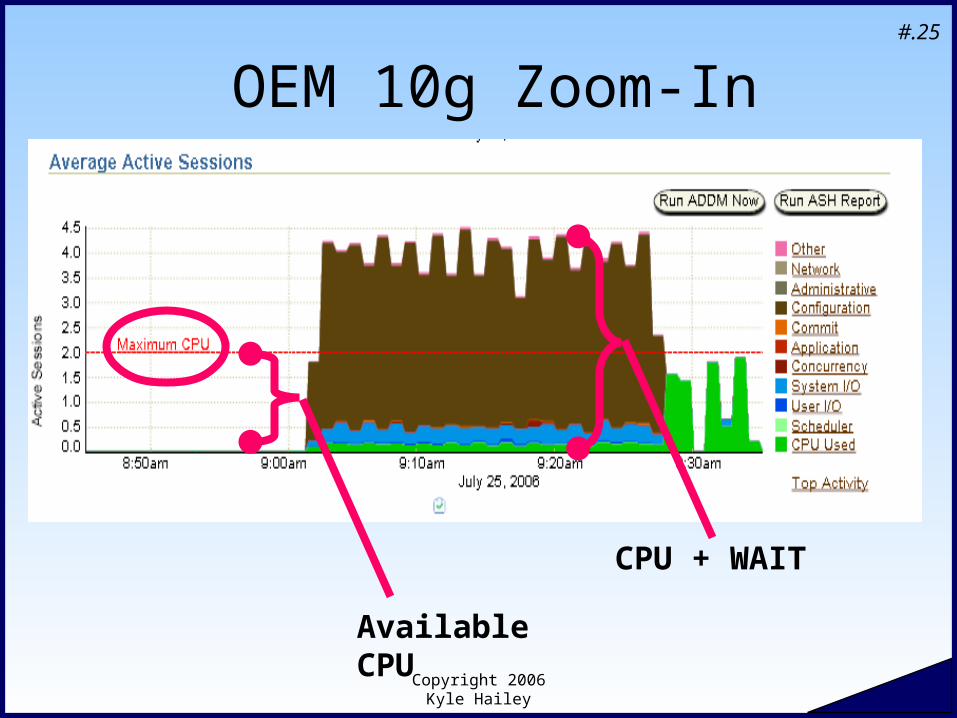
OEM 10g Zoom-In
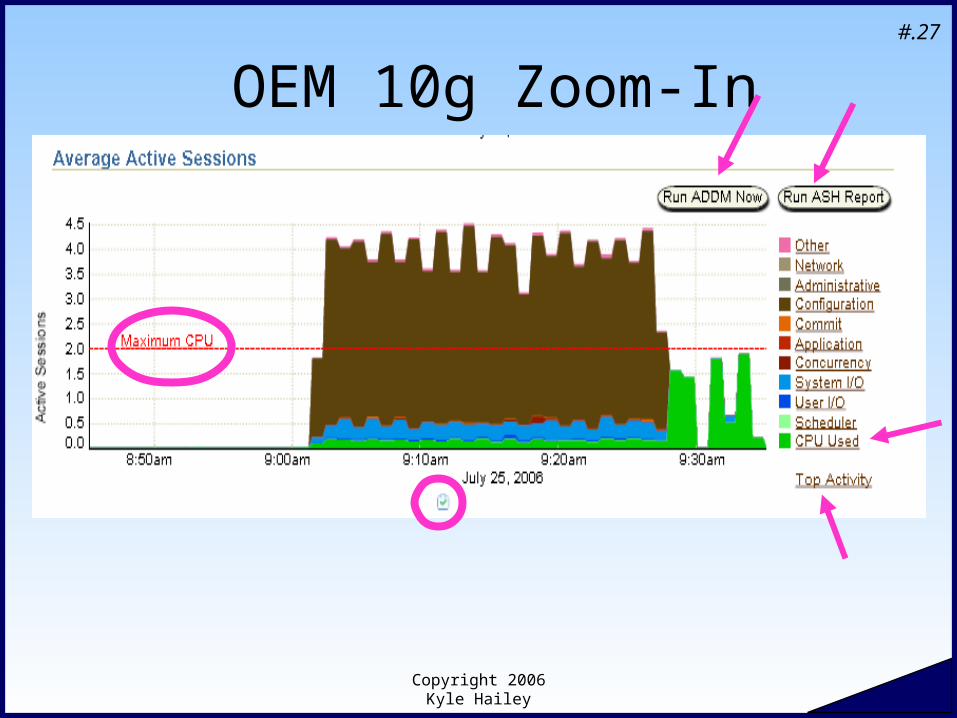
Available CPU
CPU + WAIT
Copyright 2006 Kyle Hailey
#.26
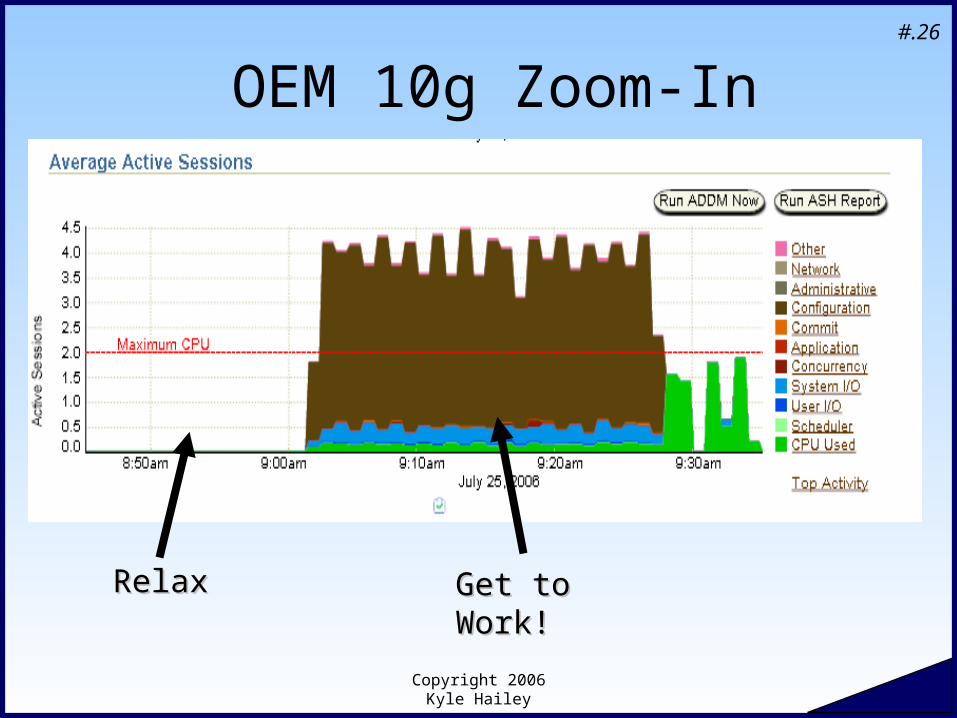
OEM 10g Zoom-In
Relax Relax Get to Work!Get to Work!
Copyright 2006 Kyle Hailey
#.27
OEM 10g Zoom-In
Copyright 2006 Kyle Hailey
#.28
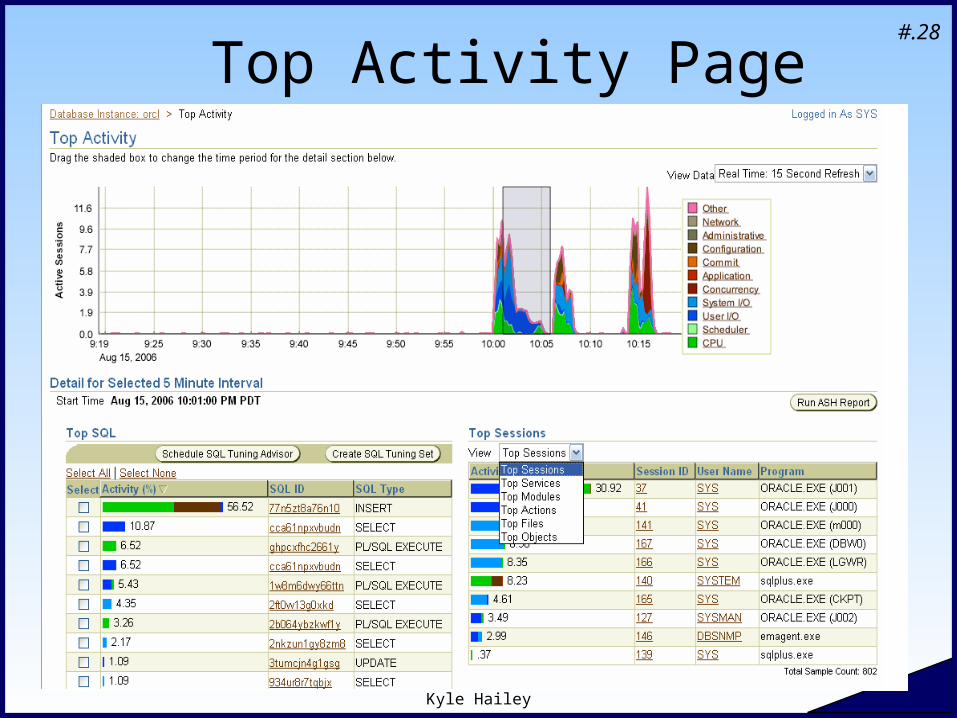
Top Activity Page
Copyright 2006 Kyle Hailey
#.29
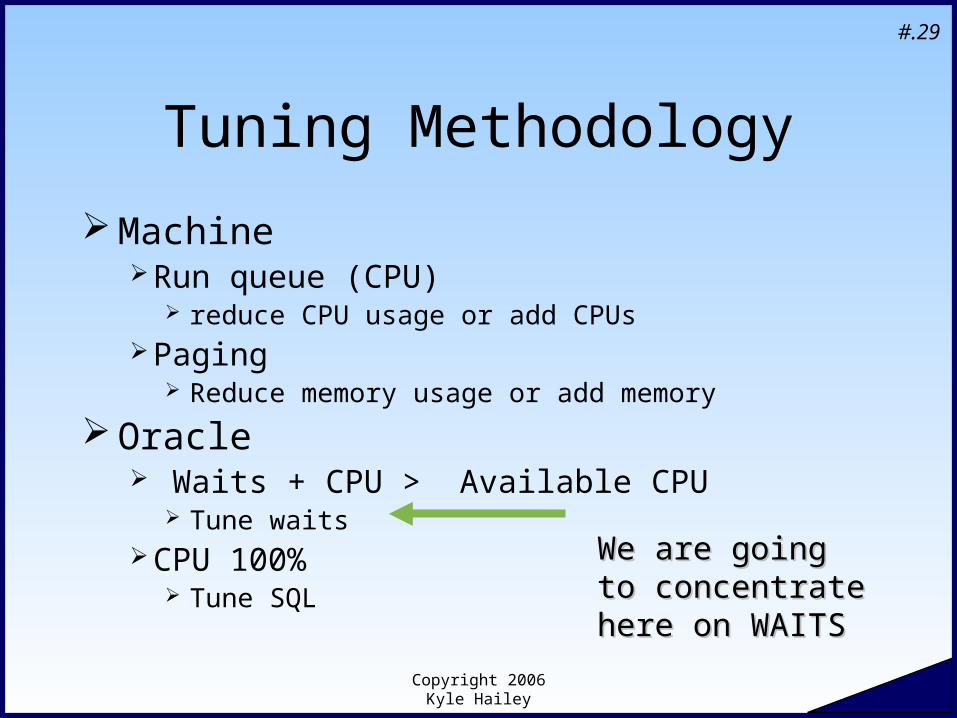
Tuning Methodology
MachineRun queue (CPU)
reduce CPU usage or add CPUs Paging
Reduce memory usage or add memory
Oracle Waits + CPU > Available CPU
Tune waitsCPU 100%
Tune SQL
We are going to We are going to concentrate here concentrate here on WAITSon WAITS
Copyright 2006 Kyle Hailey
#.30
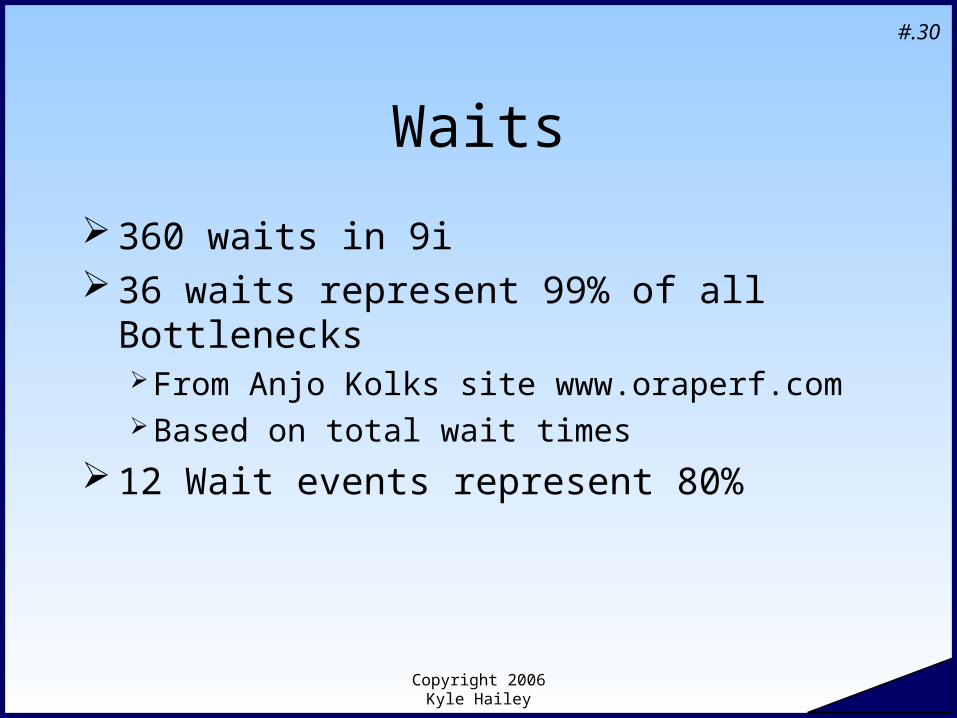
Waits
360 waits in 9i 36 waits represent 99% of all Bottlenecks
From Anjo Kolks site www.oraperf.comBased on total wait times
12 Wait events represent 80%
Copyright 2006 Kyle Hailey
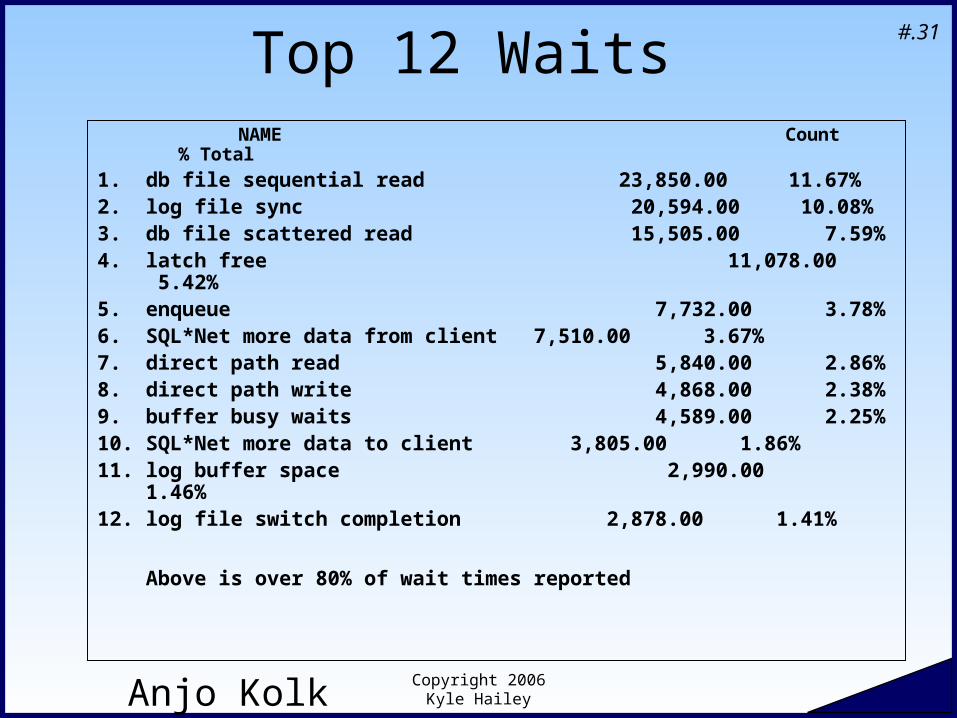
#.31Top 12 Waits NAME Count % Total
1. db file sequential read 23,850.00 11.67%2. log file sync 20,594.00 10.08%3. db file scattered read 15,505.00 7.59%4. latch free 11,078.00 5.42%5. enqueue 7,732.00 3.78%6. SQL*Net more data from client 7,510.00 3.67%7. direct path read 5,840.00 2.86%8. direct path write 4,868.00 2.38%9. buffer busy waits 4,589.00 2.25%10. SQL*Net more data to client 3,805.00 1.86% 11. log buffer space 2,990.00 1.46% 12. log file switch completion 2,878.00 1.41%
Above is over 80% of wait times reported
Anjo Kolk www.oraperf.com
Copyright 2006 Kyle Hailey
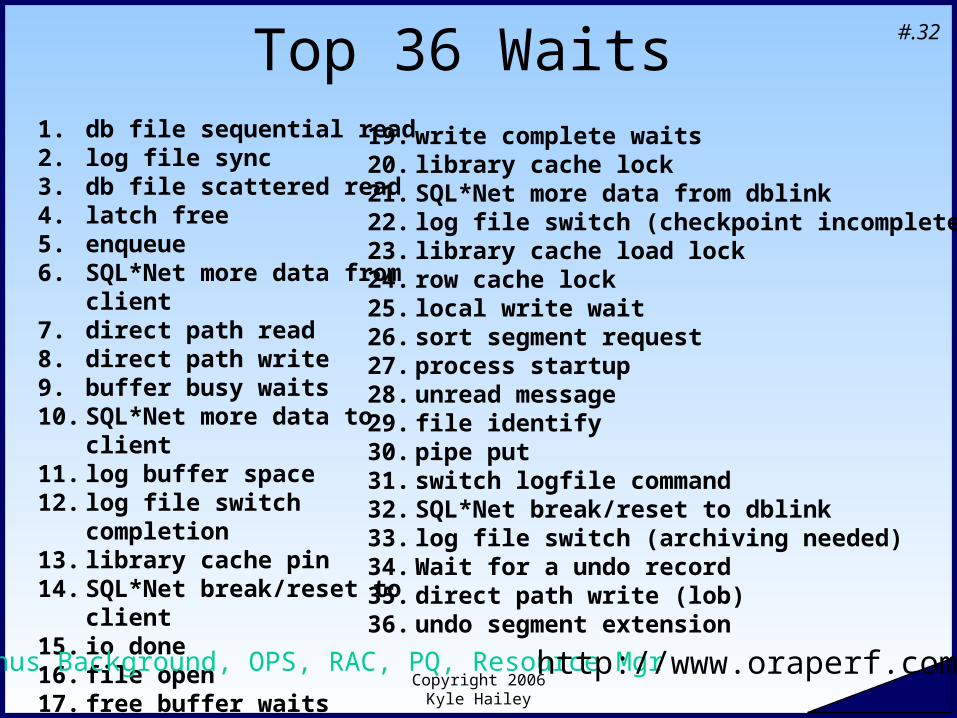
#.32Top 36 Waits19. write complete waits 20. library cache lock21. SQL*Net more data from dblink22. log file switch (checkpoint incomplete)23. library cache load lock24. row cache lock25. local write wait26. sort segment request27. process startup28. unread message29. file identify30. pipe put31. switch logfile command32. SQL*Net break/reset to dblink33. log file switch (archiving needed)34. Wait for a undo record35. direct path write (lob)36. undo segment extension
1. db file sequential read2. log file sync3. db file scattered read4. latch free5. enqueue6. SQL*Net more data from client7. direct path read8. direct path write9. buffer busy waits10. SQL*Net more data to client11. log buffer space12. log file switch completion13. library cache pin14. SQL*Net break/reset to client15. io done16. file open17. free buffer waits18. db file parallel read
minus Background, OPS, RAC, PQ, Resource Mgrhttp://www.oraperf.com
Copyright 2006 Kyle Hailey
#.33
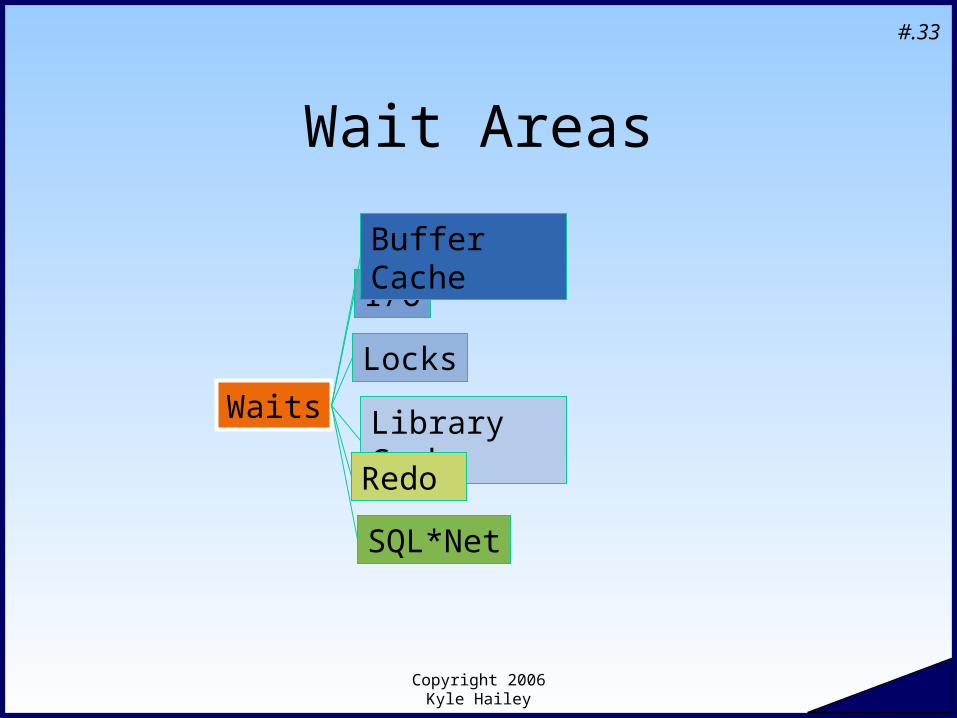
Waits
I/O
Library Cache
Locks
Redo
Buffer Cache
SQL*Net
Wait Areas
Copyright 2006 Kyle Hailey
#.34
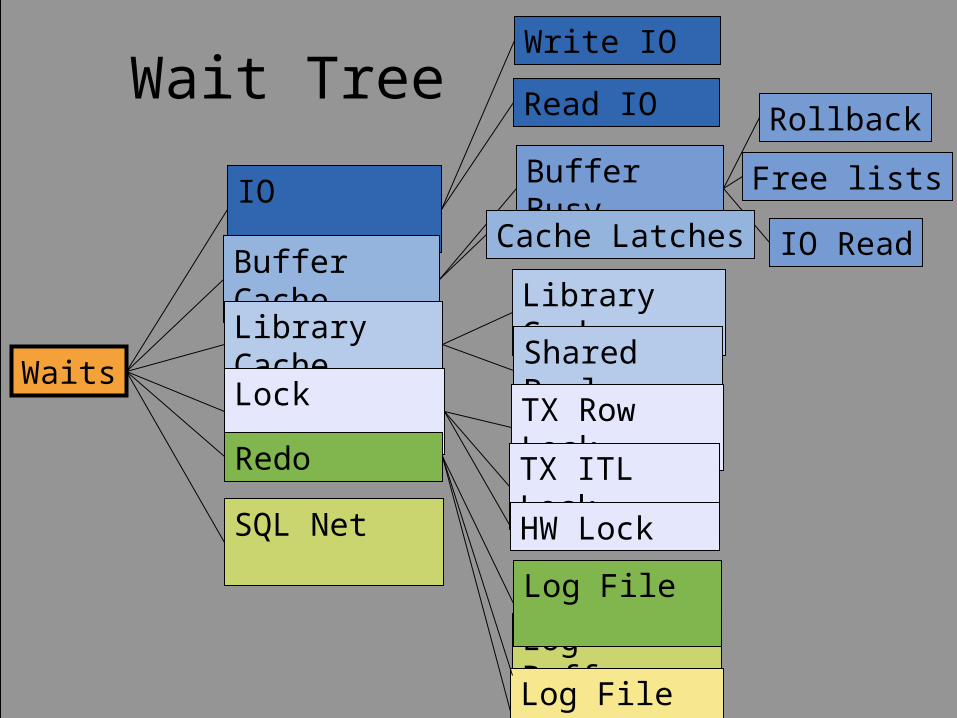
Wait Tree
Waits
IO
Buffer Cache
Library Cache
Lock
Redo
SQL Net
Buffer Busy
Rollback
Free lists
IO ReadCache Latches
Library Cache
Shared Pool
TX Row Lock
TX ITL Lock
HW Lock
Write IO
Read IO
Log Buffer
Log File Sync
Log File
Copyright 2006 Kyle Hailey
#.35
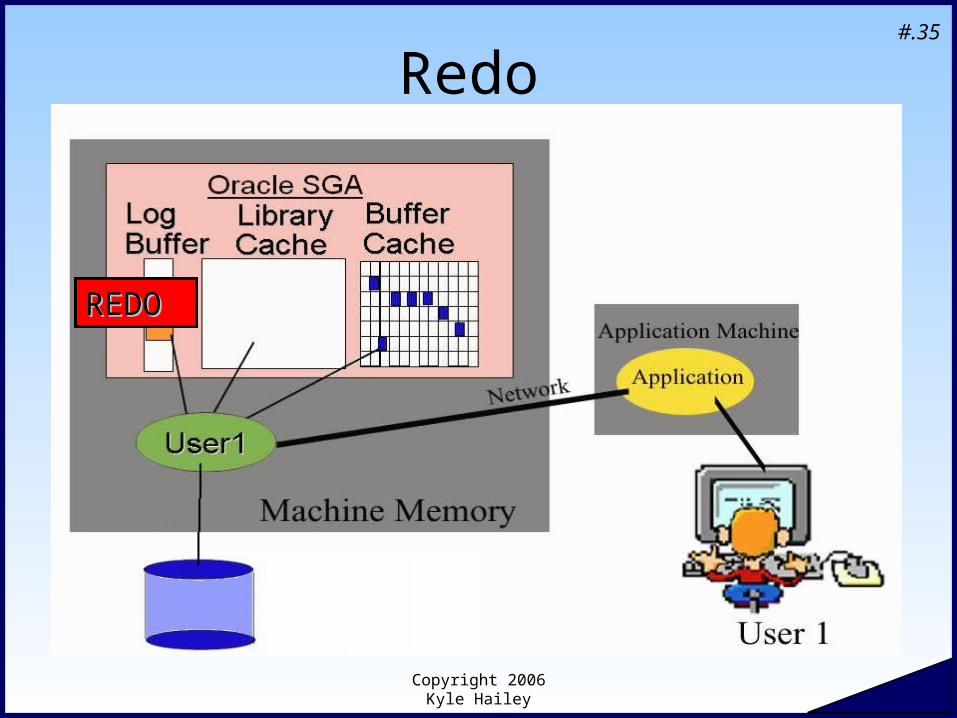
Redo
REDOREDO
Copyright 2006 Kyle Hailey
#.36
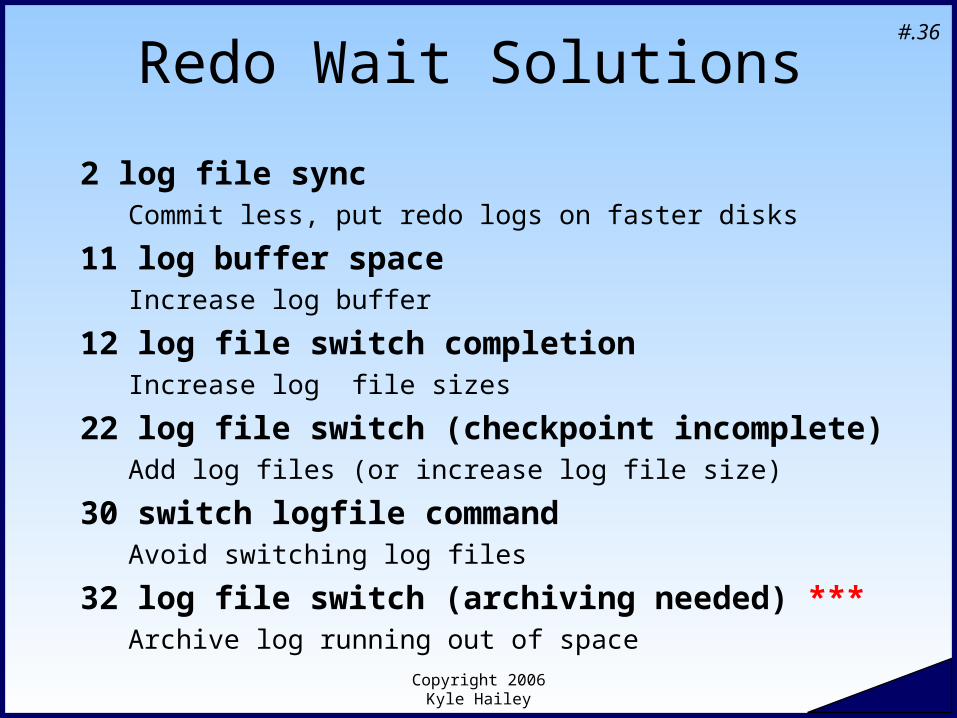
Redo Wait Solutions
2 log file syncCommit less, put redo logs on faster disks
11 log buffer spaceIncrease log buffer
12 log file switch completionIncrease log file sizes
22 log file switch (checkpoint incomplete)Add log files (or increase log file size)
30 switch logfile commandAvoid switching log files
32 log file switch (archiving needed) ***Archive log running out of space
Copyright 2006 Kyle Hailey
#.37
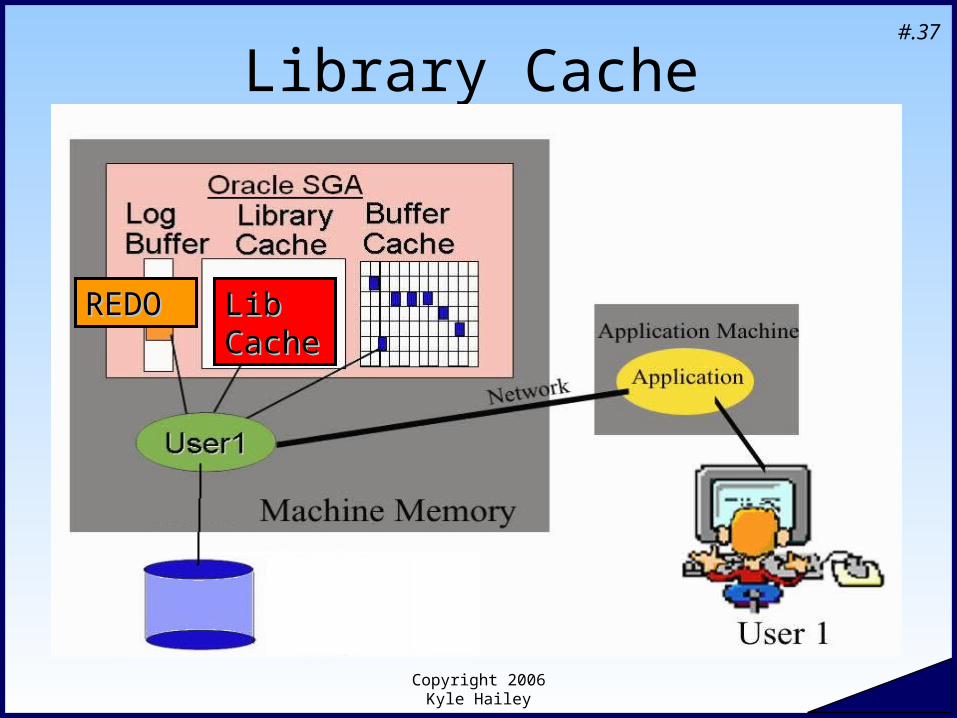
Library Cache
REDOREDO Lib Lib CacheCache
Copyright 2006 Kyle Hailey
#.38
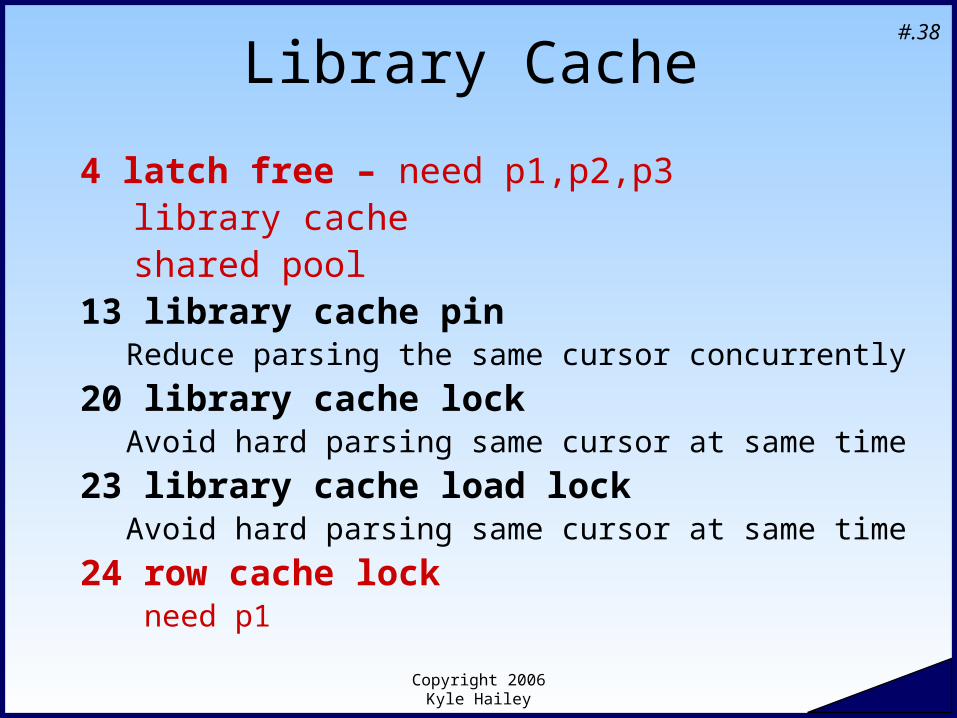
Library Cache
4 latch free – need p1,p2,p3library cacheshared pool
13 library cache pinReduce parsing the same cursor concurrently
20 library cache lockAvoid hard parsing same cursor at same time
23 library cache load lockAvoid hard parsing same cursor at same time
24 row cache lock need p1
Copyright 2006 Kyle Hailey
#.39
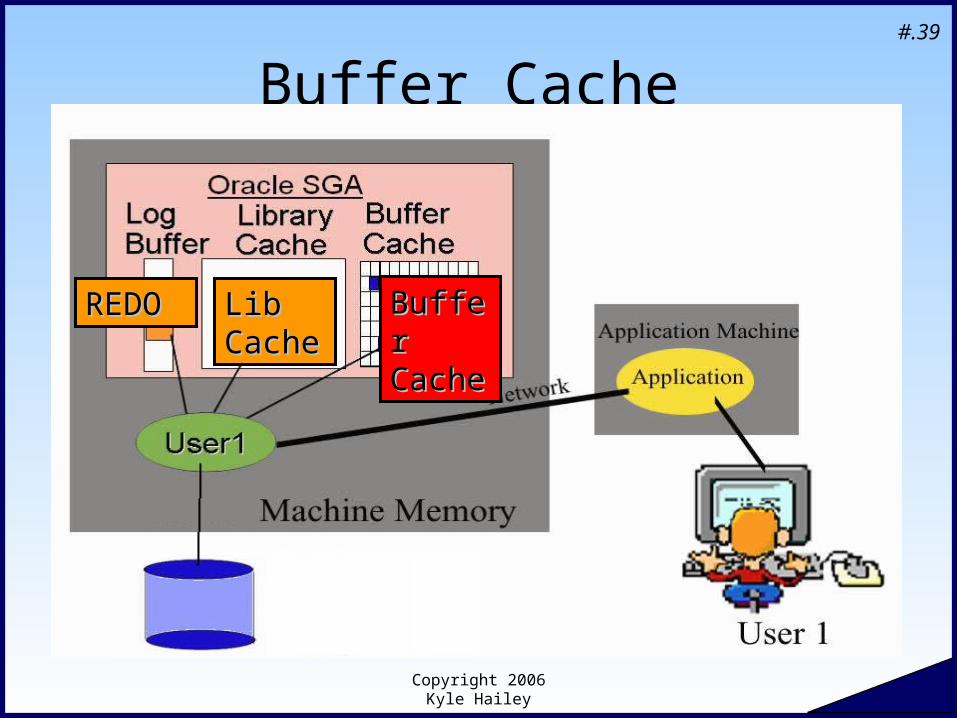
Buffer Cache
REDOREDO Lib Lib CacheCache
Buffer Buffer CacheCache
Copyright 2006 Kyle Hailey
#.40
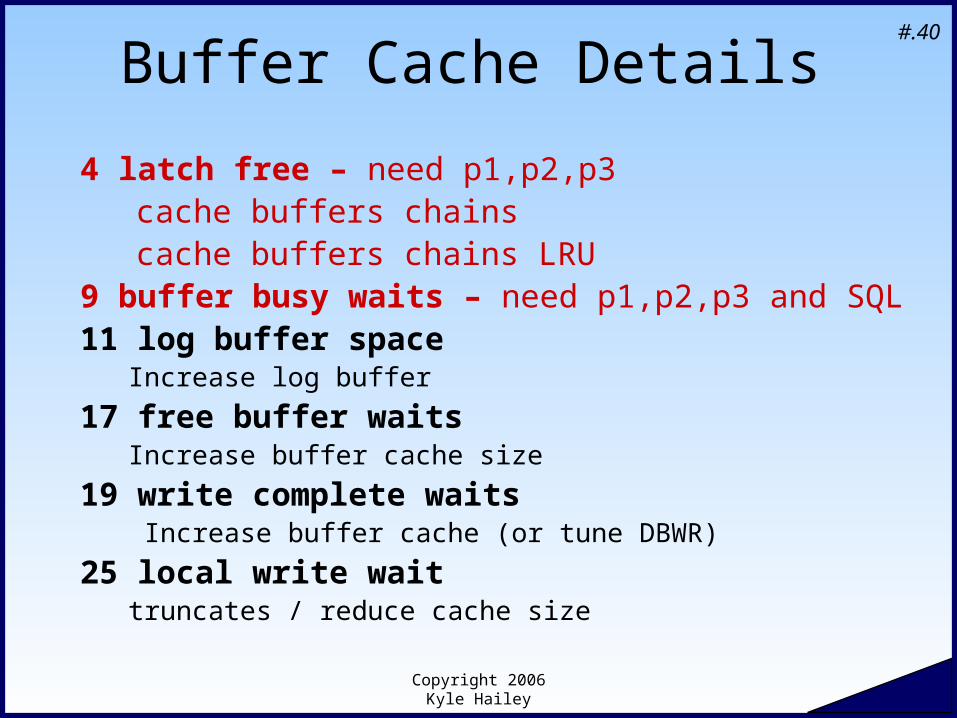
Buffer Cache Details
4 latch free – need p1,p2,p3cache buffers chainscache buffers chains LRU
9 buffer busy waits – need p1,p2,p3 and SQL11 log buffer space
Increase log buffer
17 free buffer waitsIncrease buffer cache size
19 write complete waits Increase buffer cache (or tune DBWR)
25 local write waittruncates / reduce cache size
Copyright 2006 Kyle Hailey
#.41
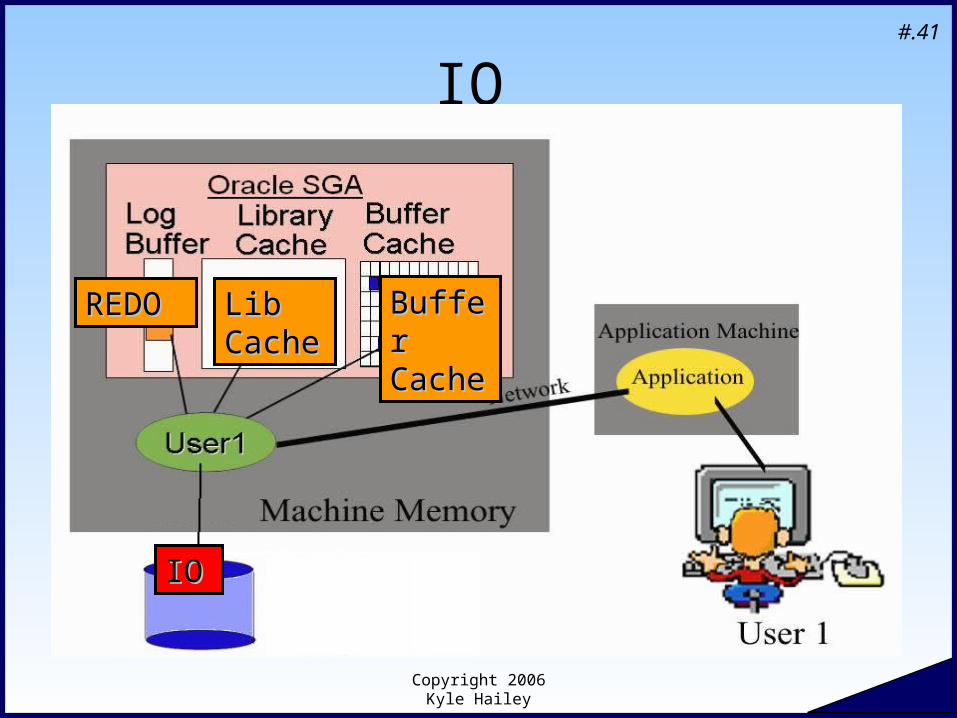
IO
REDOREDO Lib Lib CacheCache
Buffer Buffer CacheCache
IOIO
Copyright 2006 Kyle Hailey
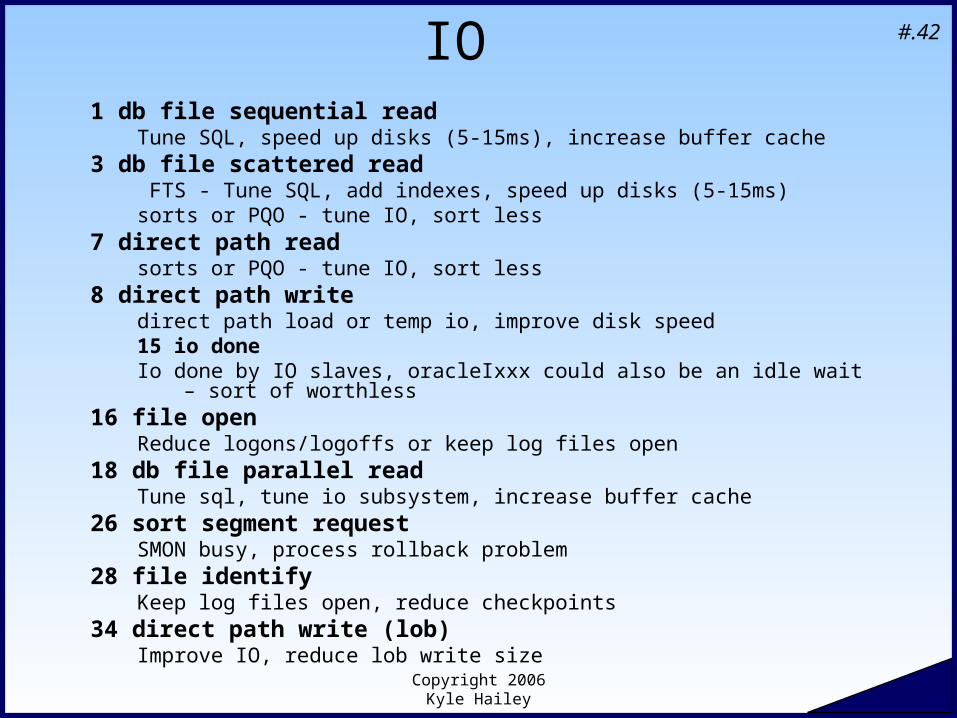
#.42IO 1 db file sequential read
Tune SQL, speed up disks (5-15ms), increase buffer cache3 db file scattered read
FTS - Tune SQL, add indexes, speed up disks (5-15ms)sorts or PQO - tune IO, sort less
7 direct path readsorts or PQO - tune IO, sort less
8 direct path writedirect path load or temp io, improve disk speed 15 io doneIo done by IO slaves, oracleIxxx could also be an idle wait – sort of worthless
16 file openReduce logons/logoffs or keep log files open
18 db file parallel readTune sql, tune io subsystem, increase buffer cache
26 sort segment requestSMON busy, process rollback problem
28 file identifyKeep log files open, reduce checkpoints
34 direct path write (lob)Improve IO, reduce lob write size
Copyright 2006 Kyle Hailey
#.43
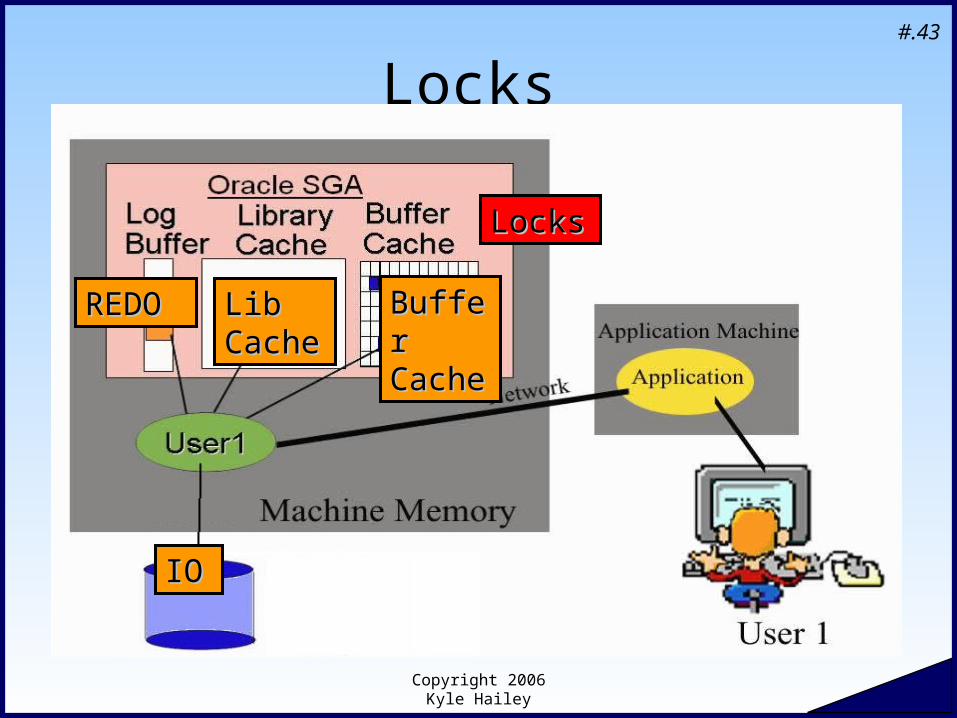
Locks
REDOREDO Lib Lib CacheCache
Buffer Buffer CacheCache
IOIO
LocksLocks
Copyright 2006 Kyle Hailey
#.44
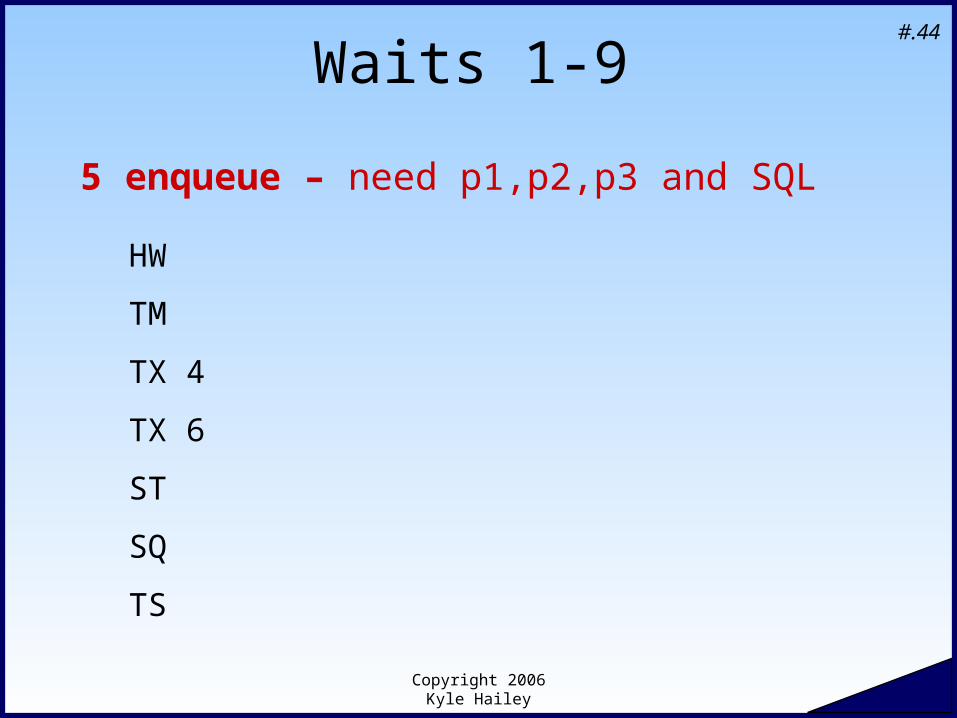
Waits 1-9
5 enqueue – need p1,p2,p3 and SQL
HW
TM
TX 4
TX 6
ST
SQ
TS
Copyright 2006 Kyle Hailey
#.45
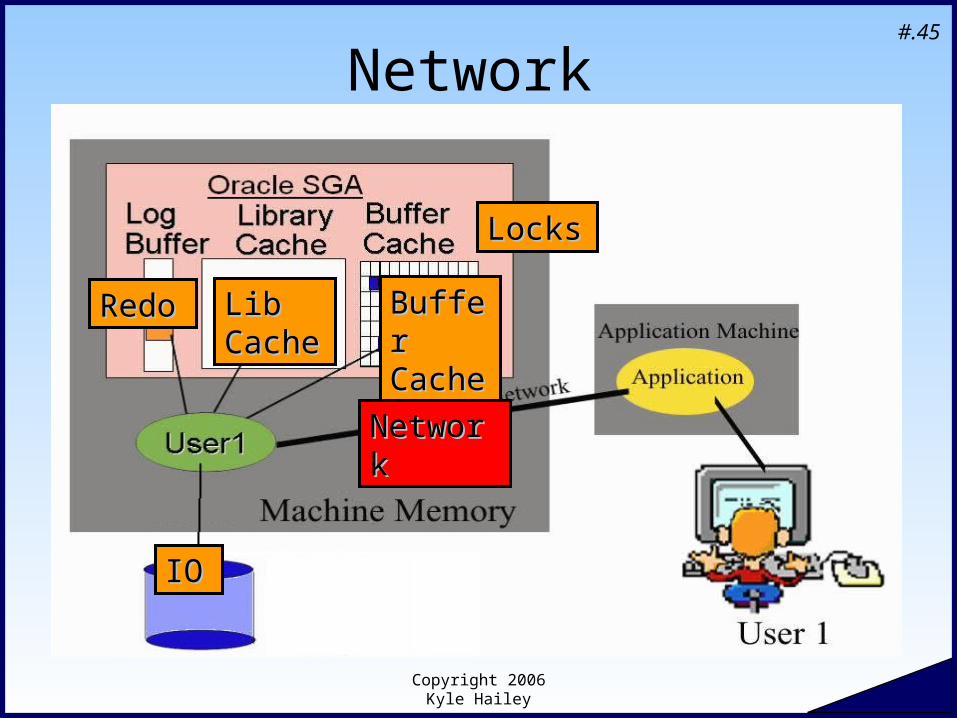
Network
RedoRedo Lib Lib CacheCache
Buffer Buffer CacheCache
IOIO
LocksLocks
NetworkNetwork
Copyright 2006 Kyle Hailey
#.46
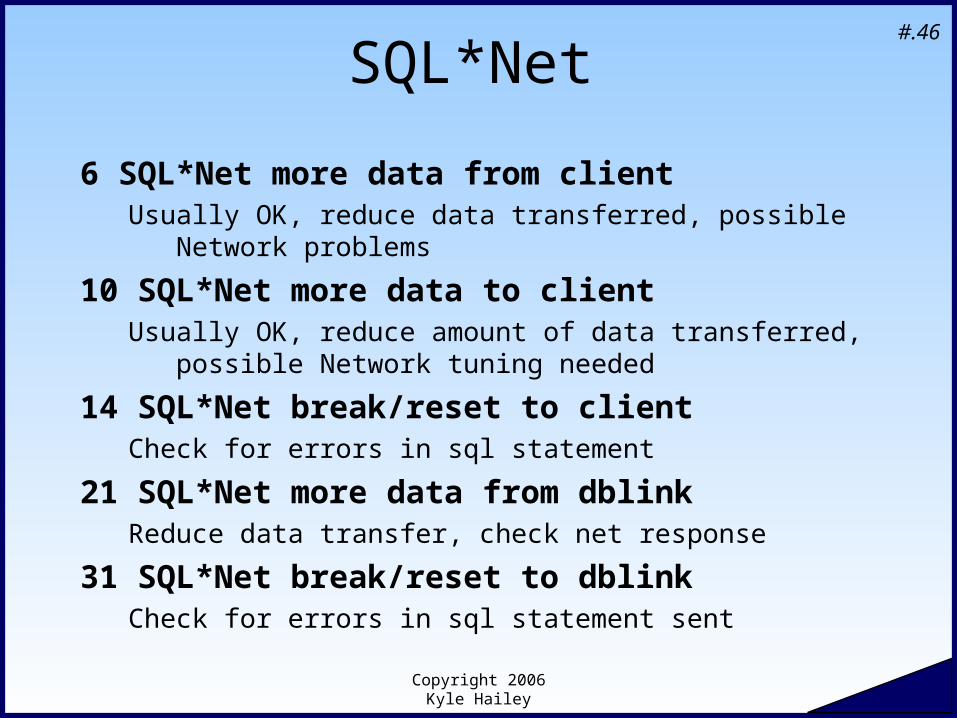
SQL*Net
6 SQL*Net more data from clientUsually OK, reduce data transferred, possible Network problems
10 SQL*Net more data to clientUsually OK, reduce amount of data transferred, possible Network
tuning needed
14 SQL*Net break/reset to clientCheck for errors in sql statement
21 SQL*Net more data from dblinkReduce data transfer, check net response
31 SQL*Net break/reset to dblinkCheck for errors in sql statement sent
Copyright 2006 Kyle Hailey
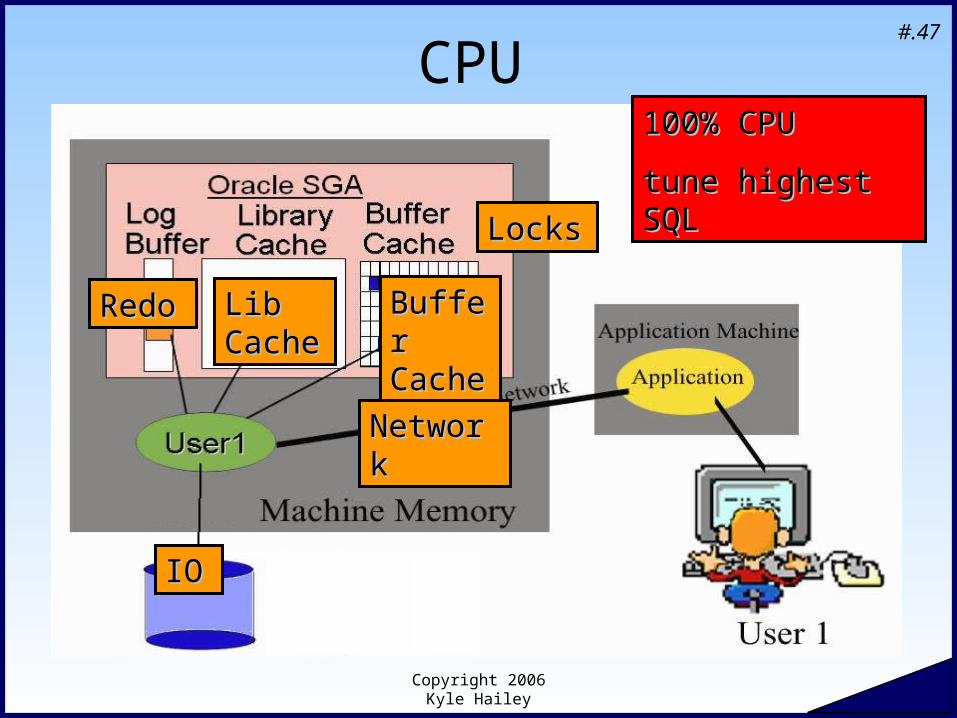
#.47
CPU
RedoRedo Lib Lib CacheCache
Buffer Buffer CacheCache
IOIO
LocksLocks
NetworkNetwork
100% CPU100% CPU
tune highest SQL tune highest SQL
Copyright 2006 Kyle Hailey
#.48
CPU
Different from Waits Still a Timed Event High CPU & Low Waits
Tune SQL
Copyright 2006 Kyle Hailey
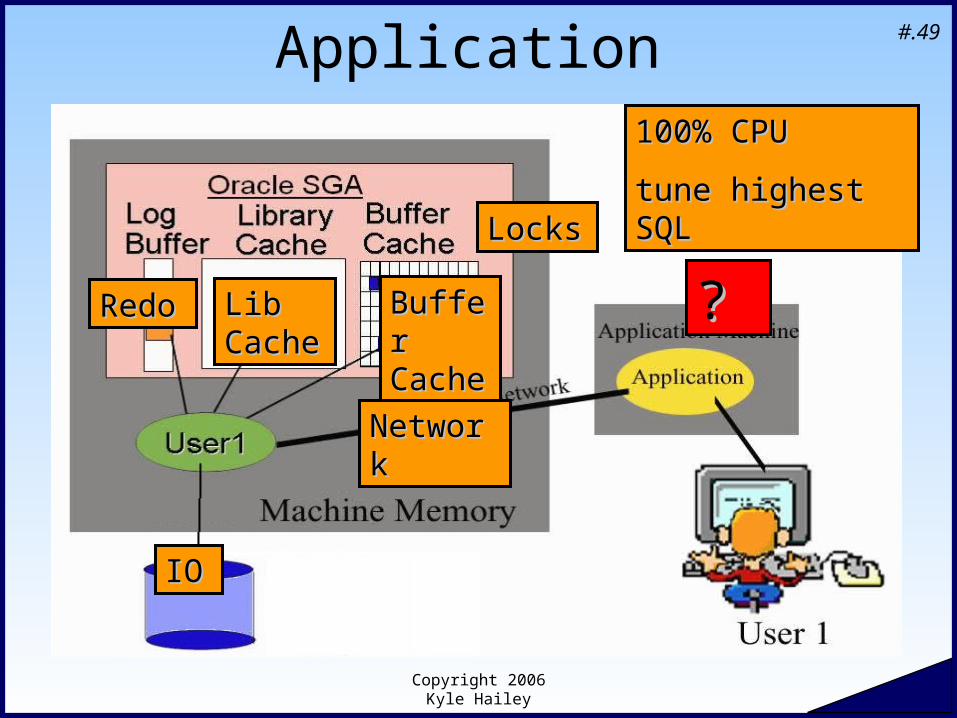
#.49Application
RedoRedo Lib Lib CacheCache
Buffer Buffer CacheCache
IOIO
LocksLocks
NetworkNetwork
??
100% CPU100% CPU
tune highest SQL tune highest SQL

Copyright 2006 Kyle Hailey
#.50
It’s the Application
If all these areas show no contention , it’s the application
Copyright 2006 Kyle Hailey
#.51
Waits we will Ignore
Background Idle RAC Resource Manager
Copyright 2006 Kyle Hailey
#.52
Background & Foreground
Background Processes DBWR LGWR PMON SMON Etc
Foreground Processes SQL*Plus Pro*C SQL*Forms Oracle applications
Only interested in Foreground waits
Copyright 2006 Kyle Hailey
#.53
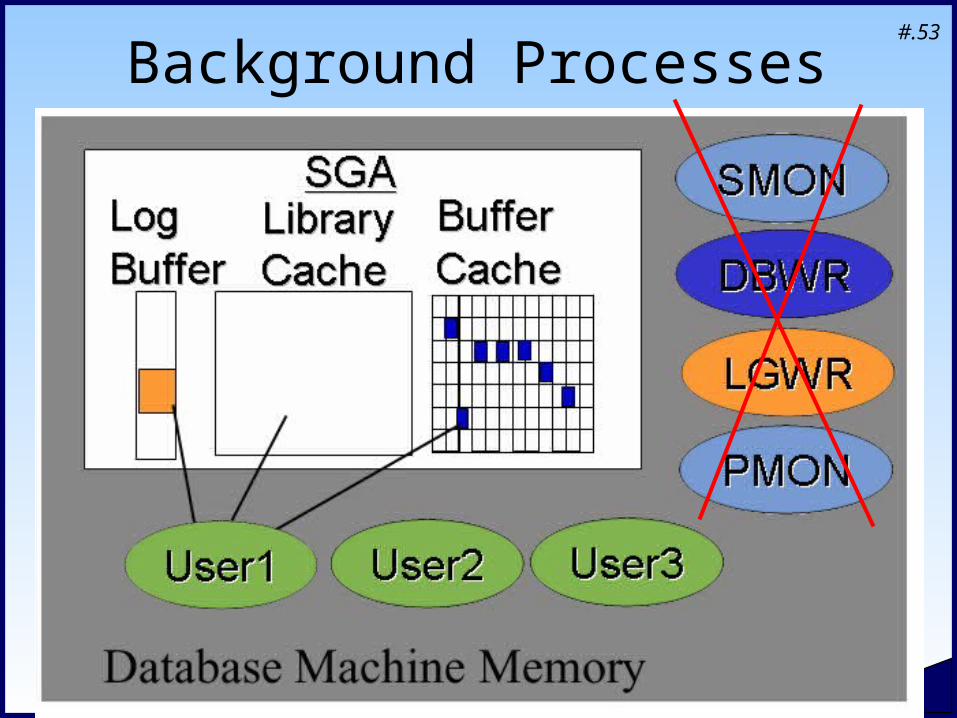
REDO Log FilesREDO Log Files Data FilesData Files
DBWRDBWRLGWRLGWR
User2User2
User1User1
User3User3
Log BufferLog Buffer
Buffer CacheBuffer CacheLog Log BufferBuffer
Buffer Buffer CacheCache
SGASGALibrary Library CacheCache
Background Processes
PMONPMON
SMONSMON
Copyright 2006 Kyle Hailey
#.54
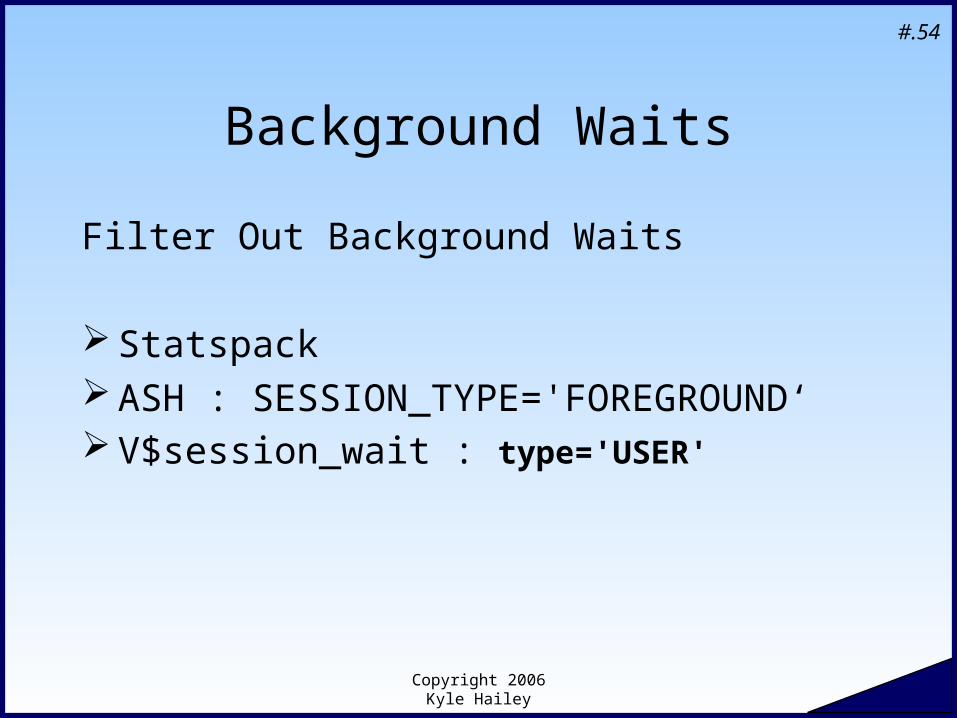
Background Waits
Filter Out Background Waits
Statspack ASH : SESSION_TYPE='FOREGROUND‘ V$session_wait : type='USER'
Copyright 2006 Kyle Hailey
#.55
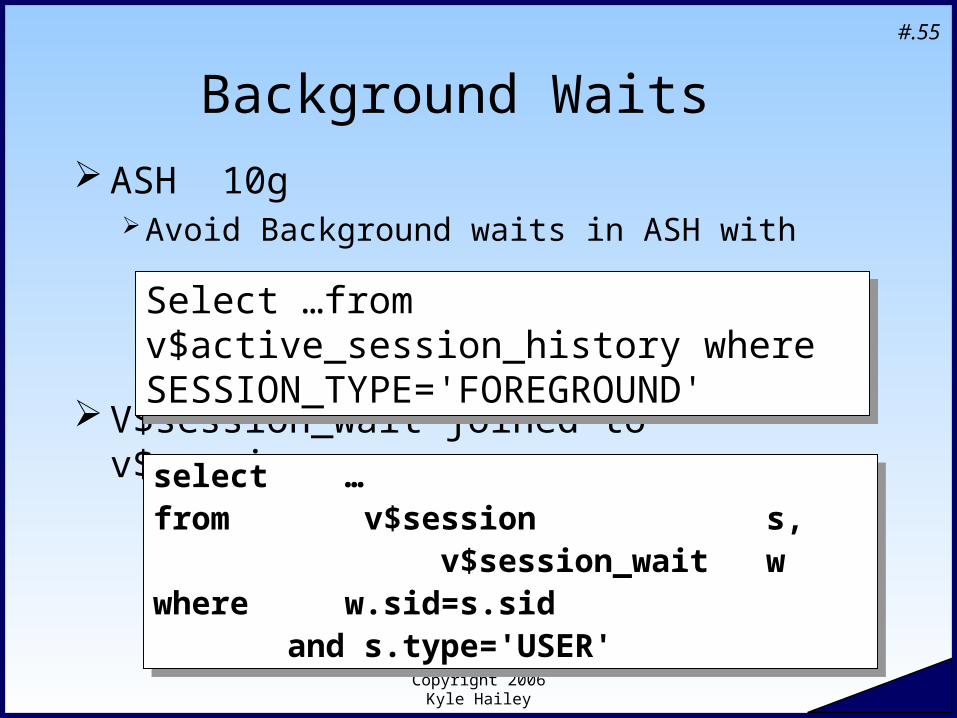
Background Waits
ASH 10gAvoid Background waits in ASH with
V$session_wait joined to v$session
Select …from v$active_session_history where SESSION_TYPE='FOREGROUND'
Select …from v$active_session_history where SESSION_TYPE='FOREGROUND'
select …from v$session s, v$session_wait w where w.sid=s.sid and s.type='USER'
select …from v$session s, v$session_wait w where w.sid=s.sid and s.type='USER'
Copyright 2006 Kyle Hailey
#.56
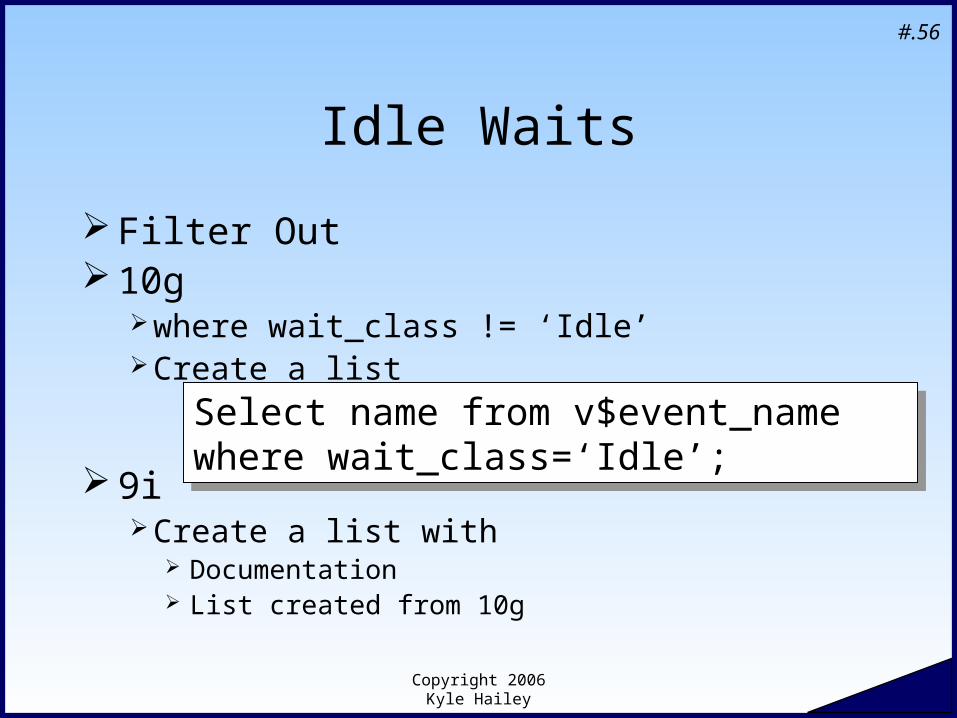
Idle Waits
Filter Out 10g
where wait_class != ‘Idle’Create a list
9iCreate a list with
Documentation List created from 10g
Select name from v$event_name where wait_class=‘Idle’;
Select name from v$event_name where wait_class=‘Idle’;
Copyright 2006 Kyle Hailey
#.57
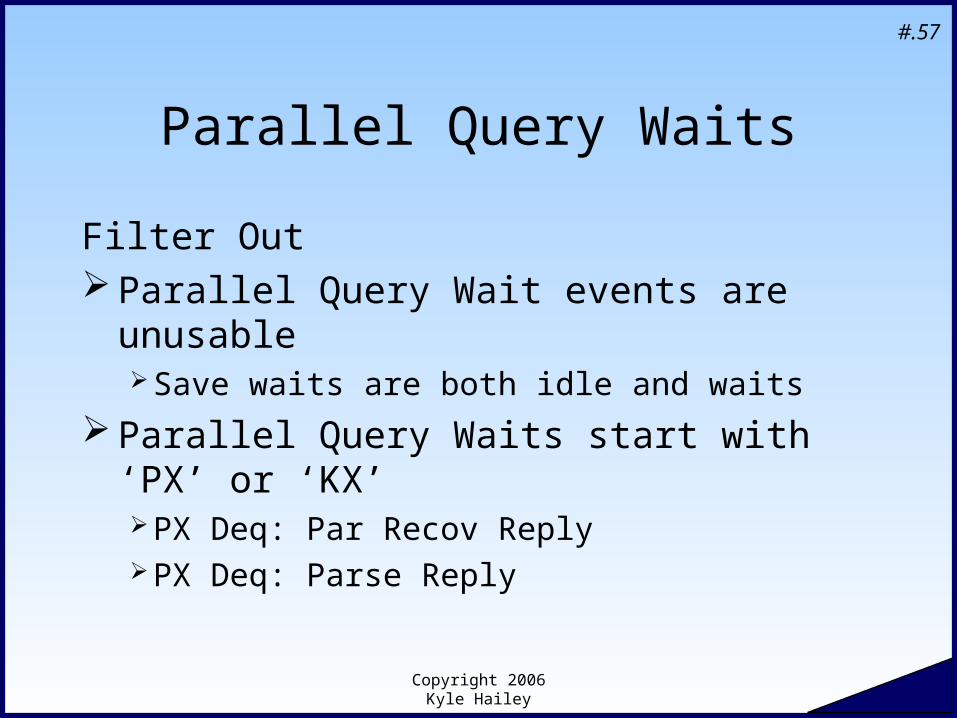
Parallel Query Waits
Filter Out Parallel Query Wait events are unusable
Save waits are both idle and waits
Parallel Query Waits start with ‘PX’ or ‘KX’PX Deq: Par Recov ReplyPX Deq: Parse Reply
Copyright 2006 Kyle Hailey
#.58
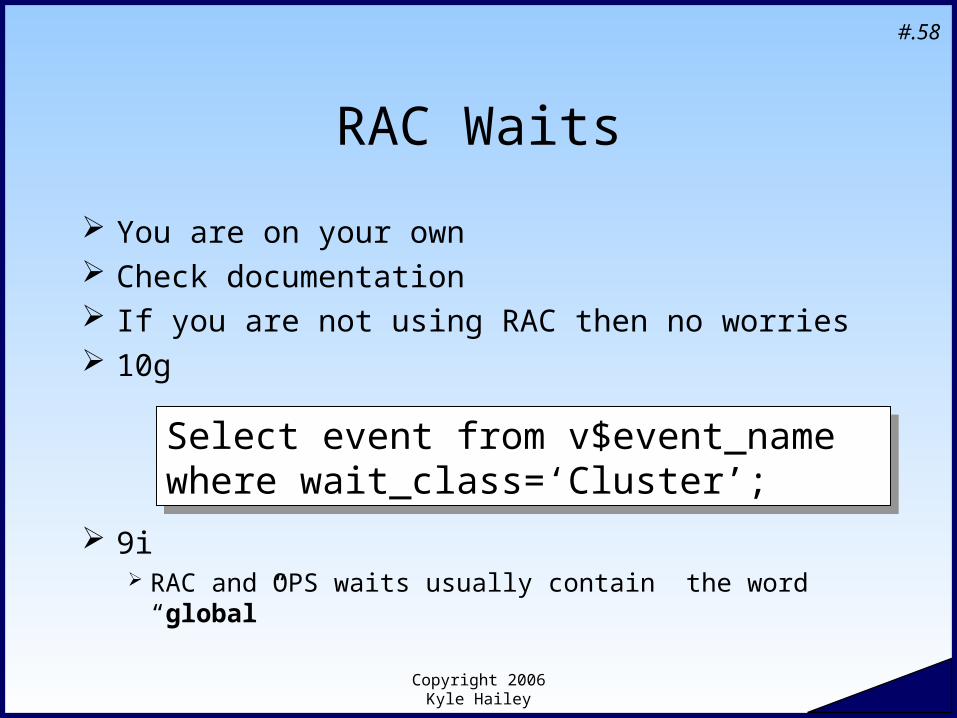
RAC Waits
You are on your own Check documentation If you are not using RAC then no worries 10g
9i RAC and OPS waits usually contain the word “global”
Select event from v$event_name where wait_class=‘Cluster’;
Select event from v$event_name where wait_class=‘Cluster’;
Copyright 2006 Kyle Hailey
#.59
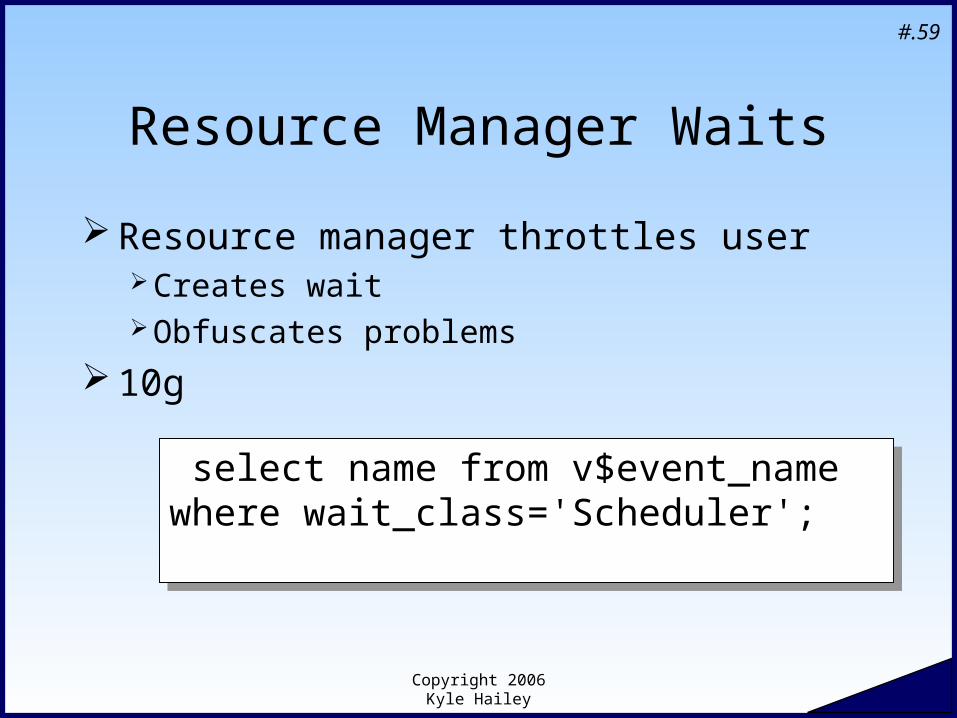
Resource Manager Waits
Resource manager throttles userCreates waitObfuscates problems
10g
select name from v$event_name where wait_class='Scheduler';
select name from v$event_name where wait_class='Scheduler';
Copyright 2006 Kyle Hailey
#.60
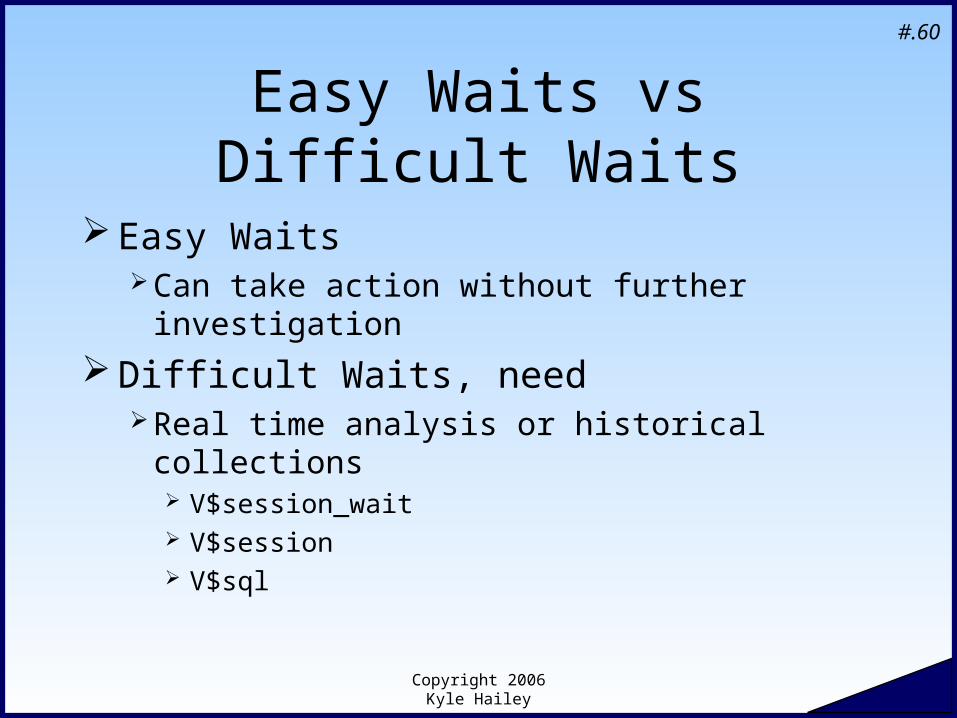
Easy Waits vs Difficult Waits
Easy Waits Can take action without further investigation
Difficult Waits, needReal time analysis or historical collections
V$session_wait V$session V$sql
Copyright 2006 Kyle Hailey
#.61
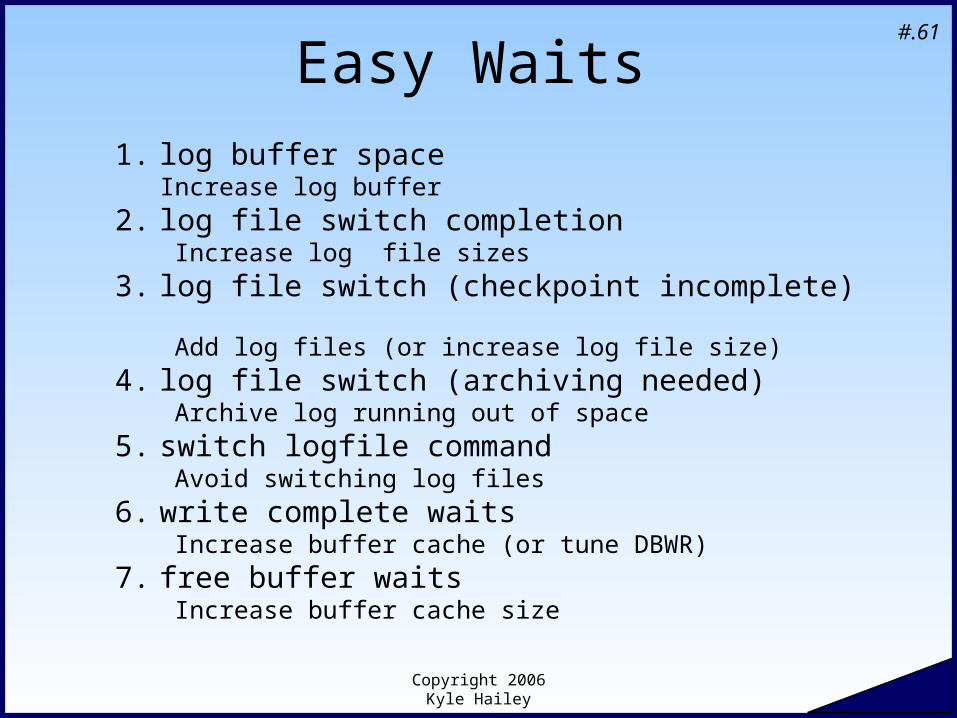
Easy Waits
1. log buffer space Increase log buffer
2. log file switch completion Increase log file sizes
3. log file switch (checkpoint incomplete) Add log files (or increase log file size)
4. log file switch (archiving needed) Archive log running out of space
5. switch logfile command Avoid switching log files
6. write complete waits Increase buffer cache (or tune DBWR)
7. free buffer waits Increase buffer cache size
Copyright 2006 Kyle Hailey
#.62
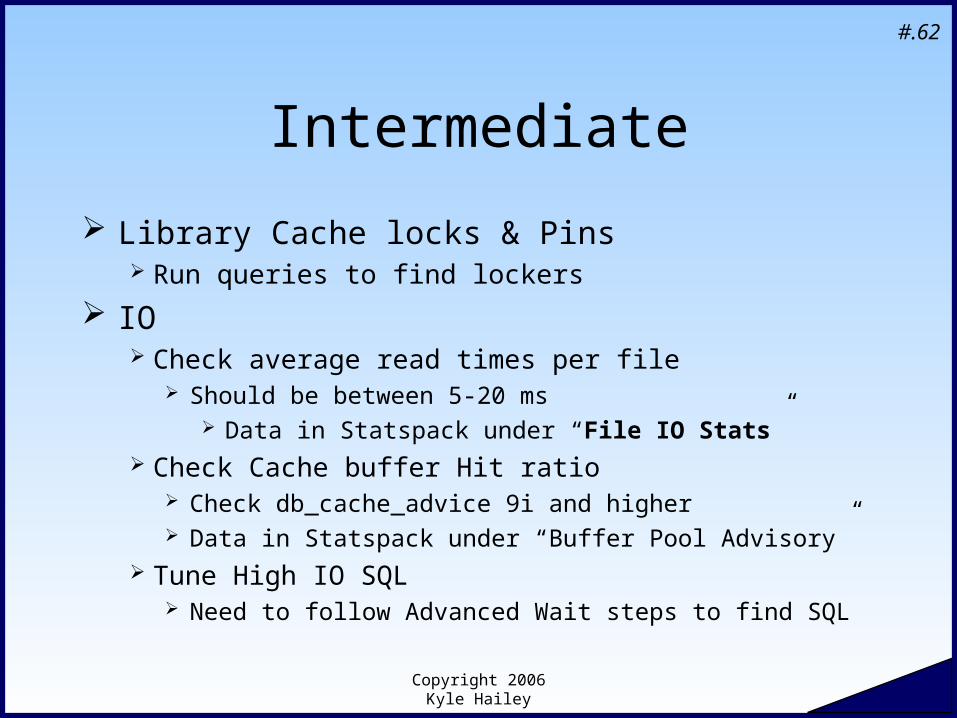
Intermediate
Library Cache locks & Pins Run queries to find lockers
IO Check average read times per file
Should be between 5-20 ms Data in Statspack under “File IO Stats”
Check Cache buffer Hit ratio Check db_cache_advice 9i and higher Data in Statspack under “Buffer Pool Advisory”
Tune High IO SQL Need to follow Advanced Wait steps to find SQL
Copyright 2006 Kyle Hailey
#.63
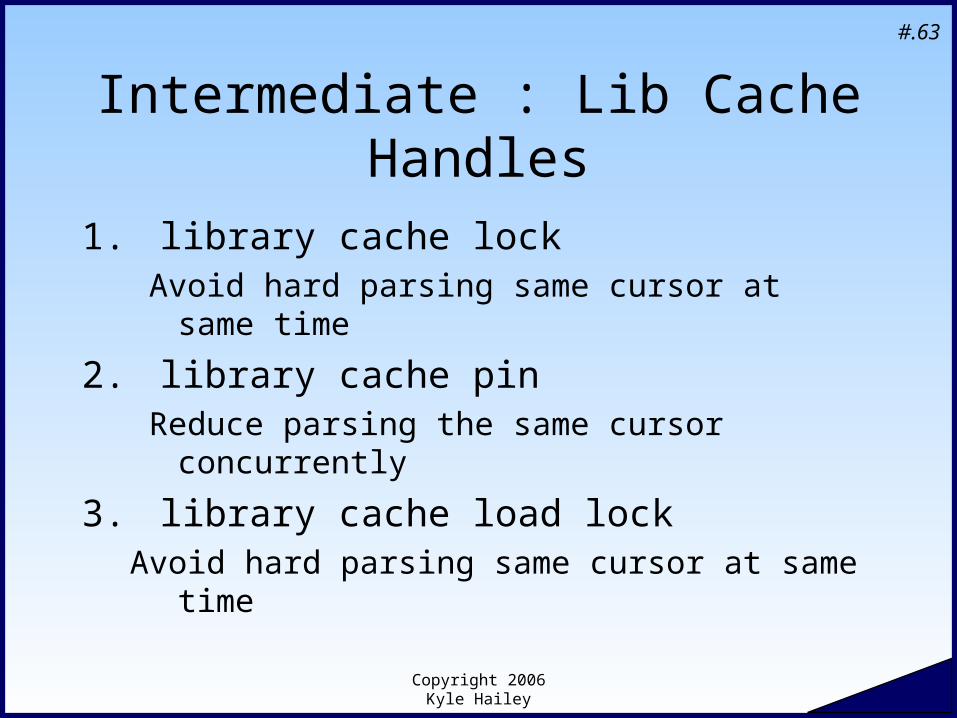
Intermediate : Lib Cache Handles
1. library cache lock Avoid hard parsing same cursor at same time
2. library cache pin Reduce parsing the same cursor concurrently
3. library cache load lock Avoid hard parsing same cursor at same time
Copyright 2006 Kyle Hailey
#.64
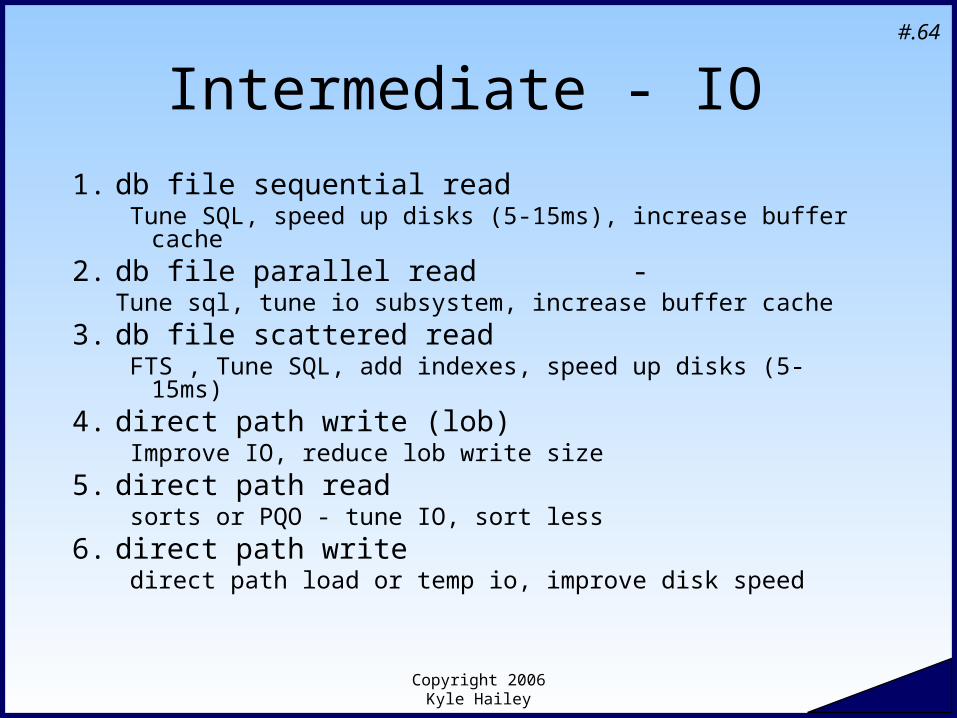
Intermediate - IO
1. db file sequential read Tune SQL, speed up disks (5-15ms), increase buffer cache
2. db file parallel read -Tune sql, tune io subsystem, increase buffer cache
3. db file scattered read FTS , Tune SQL, add indexes, speed up disks (5-15ms)
4. direct path write (lob) Improve IO, reduce lob write size
5. direct path read sorts or PQO - tune IO, sort less
6. direct path write direct path load or temp io, improve disk speed
Copyright 2006 Kyle Hailey
#.65
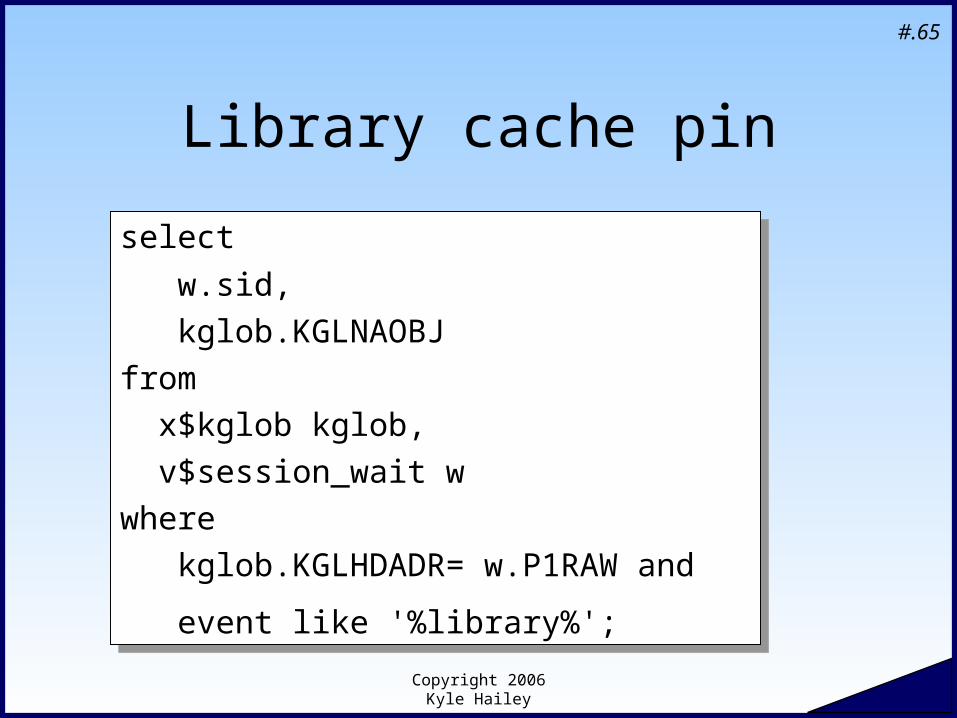
Library cache pin
select
w.sid,
kglob.KGLNAOBJ
from
x$kglob kglob,
v$session_wait w
where
kglob.KGLHDADR= w.P1RAW and
event like '%library%';
select
w.sid,
kglob.KGLNAOBJ
from
x$kglob kglob,
v$session_wait w
where
kglob.KGLHDADR= w.P1RAW and
event like '%library%';
Copyright 2006 Kyle Hailey
#.66
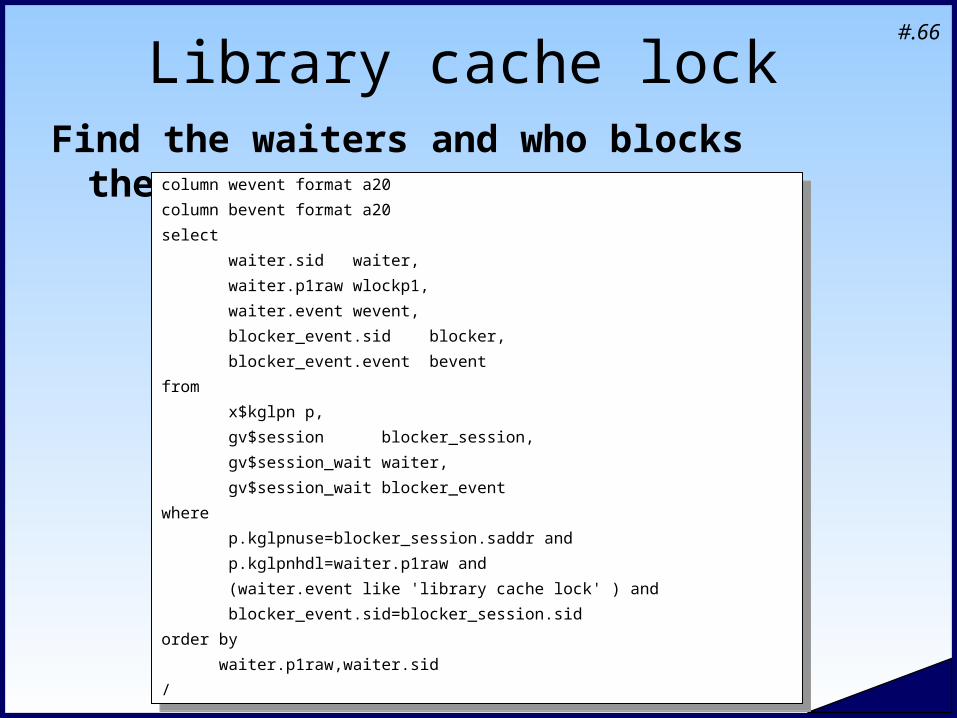
Library cache lockFind the waiters and who blocks them
column wevent format a20
column bevent format a20
select
waiter.sid waiter,
waiter.p1raw wlockp1,
waiter.event wevent,
blocker_event.sid blocker,
blocker_event.event bevent
from
x$kglpn p,
gv$session blocker_session,
gv$session_wait waiter,
gv$session_wait blocker_event
where
p.kglpnuse=blocker_session.saddr and
p.kglpnhdl=waiter.p1raw and
(waiter.event like 'library cache lock' ) and
blocker_event.sid=blocker_session.sid
order by
waiter.p1raw,waiter.sid
/
Copyright 2006 Kyle Hailey
#.67
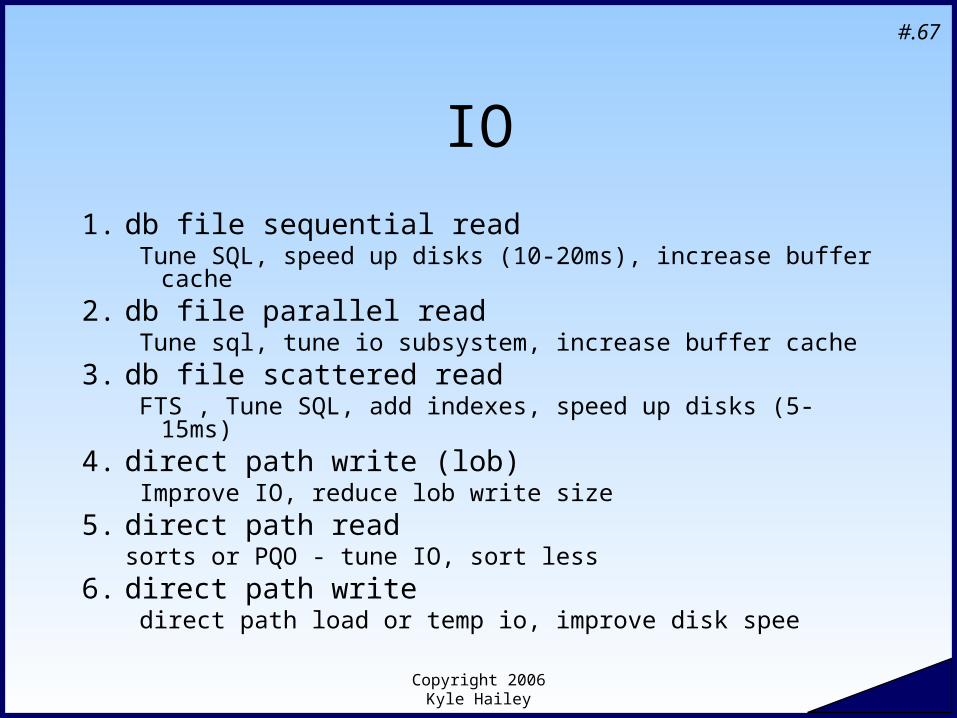
IO
1. db file sequential read Tune SQL, speed up disks (10-20ms), increase buffer cache
2. db file parallel read Tune sql, tune io subsystem, increase buffer cache
3. db file scattered read FTS , Tune SQL, add indexes, speed up disks (5-15ms)
4. direct path write (lob) Improve IO, reduce lob write size
5. direct path read sorts or PQO - tune IO, sort less
6. direct path write direct path load or temp io, improve disk spee
Copyright 2006 Kyle Hailey
#.68
IO Solutions If
Db scattered ReadDb file sequential ReadDb file parallel Read
ThenCheck average read times per file
Should be between 5-15 ms Data in Statspack under “File IO Stats”
Check Cache buffer Hit ratio Check db_cache_advice 9i and higher Data in Statspack under “Buffer Pool Advisory”
Tune High IO SQL
Copyright 2006 Kyle Hailey
#.69
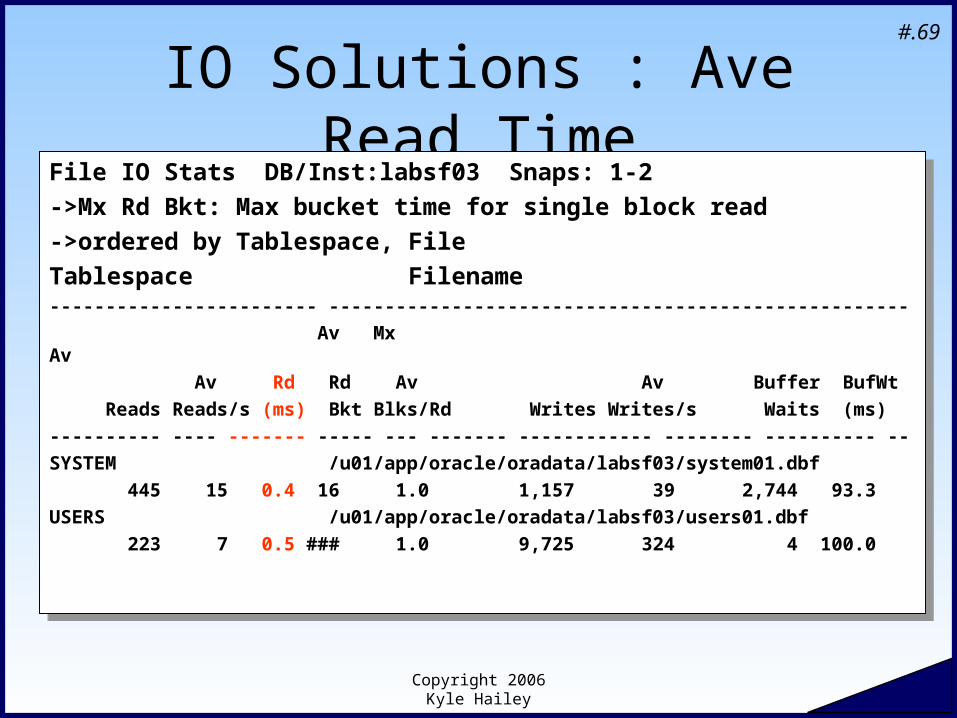
IO Solutions : Ave Read TimeFile IO Stats DB/Inst:labsf03 Snaps: 1-2
->Mx Rd Bkt: Max bucket time for single block read
->ordered by Tablespace, File
Tablespace Filename------------------------ ----------------------------------------------------
Av Mx Av
Av Rd Rd Av Av Buffer BufWt
Reads Reads/s (ms) Bkt Blks/Rd Writes Writes/s Waits (ms)
---------- ---- ------- ----- --- ------- ------------ -------- ---------- --
SYSTEM /u01/app/oracle/oradata/labsf03/system01.dbf
445 15 0.4 16 1.0 1,157 39 2,744 93.3
USERS /u01/app/oracle/oradata/labsf03/users01.dbf
223 7 0.5 ### 1.0 9,725 324 4 100.0
File IO Stats DB/Inst:labsf03 Snaps: 1-2
->Mx Rd Bkt: Max bucket time for single block read
->ordered by Tablespace, File
Tablespace Filename------------------------ ----------------------------------------------------
Av Mx Av
Av Rd Rd Av Av Buffer BufWt
Reads Reads/s (ms) Bkt Blks/Rd Writes Writes/s Waits (ms)
---------- ---- ------- ----- --- ------- ------------ -------- ---------- --
SYSTEM /u01/app/oracle/oradata/labsf03/system01.dbf
445 15 0.4 16 1.0 1,157 39 2,744 93.3
USERS /u01/app/oracle/oradata/labsf03/users01.dbf
223 7 0.5 ### 1.0 9,725 324 4 100.0
Copyright 2006 Kyle Hailey
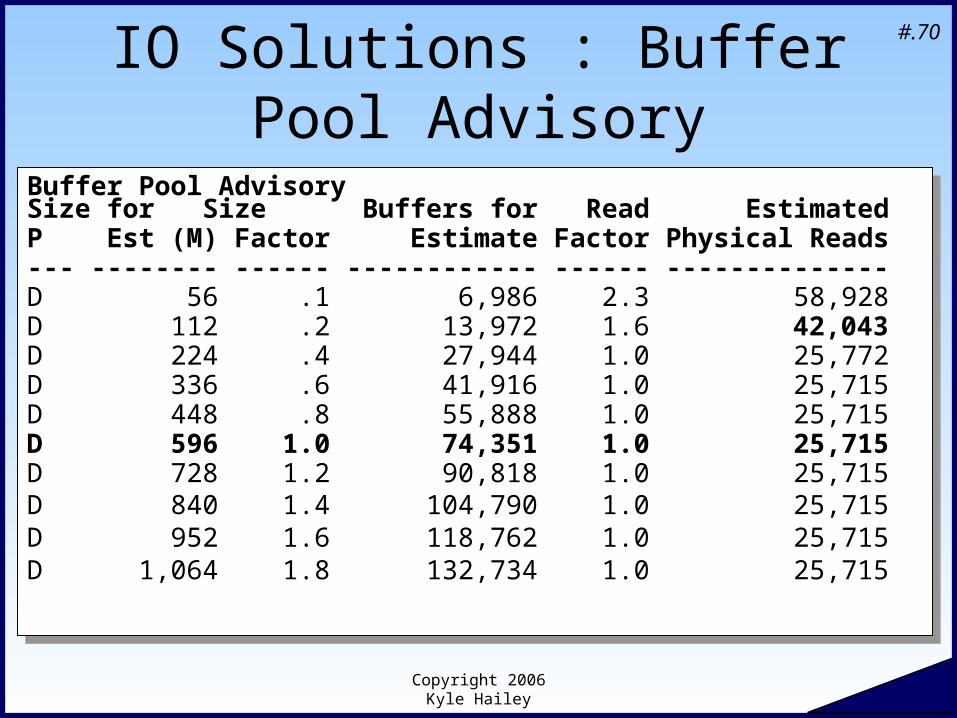
#.70IO Solutions : Buffer Pool Advisory
Buffer Pool Advisory Size for Size Buffers for Read EstimatedP Est (M) Factor Estimate Factor Physical Reads--- -------- ------ ------------ ------ --------------D 56 .1 6,986 2.3 58,928D 112 .2 13,972 1.6 42,043D 224 .4 27,944 1.0 25,772D 336 .6 41,916 1.0 25,715D 448 .8 55,888 1.0 25,715D 596 1.0 74,351 1.0 25,715D 728 1.2 90,818 1.0 25,715D 840 1.4 104,790 1.0 25,715D 952 1.6 118,762 1.0 25,715D 1,064 1.8 132,734 1.0 25,715
Buffer Pool Advisory Size for Size Buffers for Read EstimatedP Est (M) Factor Estimate Factor Physical Reads--- -------- ------ ------------ ------ --------------D 56 .1 6,986 2.3 58,928D 112 .2 13,972 1.6 42,043D 224 .4 27,944 1.0 25,772D 336 .6 41,916 1.0 25,715D 448 .8 55,888 1.0 25,715D 596 1.0 74,351 1.0 25,715D 728 1.2 90,818 1.0 25,715D 840 1.4 104,790 1.0 25,715D 952 1.6 118,762 1.0 25,715D 1,064 1.8 132,734 1.0 25,715
Copyright 2006 Kyle Hailey
#.71
IO Solutions
After CheckingFile IO response timesBuffer Cache Hit Ratio
Then the only choice is to Tune the SQLSee Advanced Wait on how to find SQL
Copyright 2006 Kyle Hailey
#.72
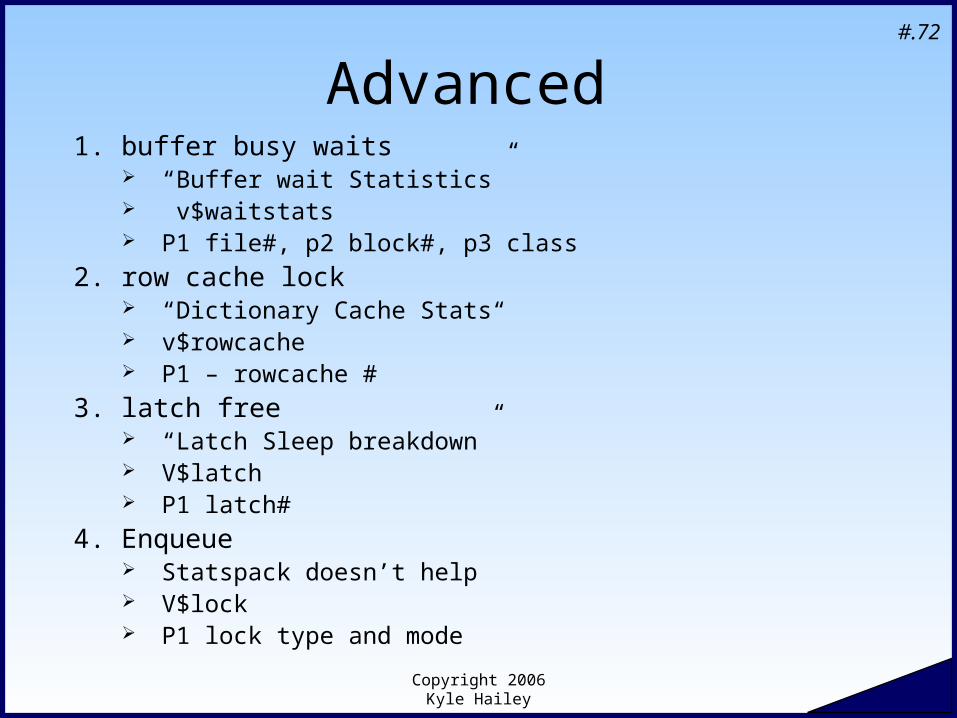
Advanced1. buffer busy waits
“Buffer wait Statistics” v$waitstats P1 file#, p2 block#, p3 class
2. row cache lock “Dictionary Cache Stats“ v$rowcache P1 – rowcache #
3. latch free “Latch Sleep breakdown” V$latch P1 latch#
4. Enqueue Statspack doesn’t help V$lock P1 lock type and mode
Copyright 2006 Kyle Hailey
#.73
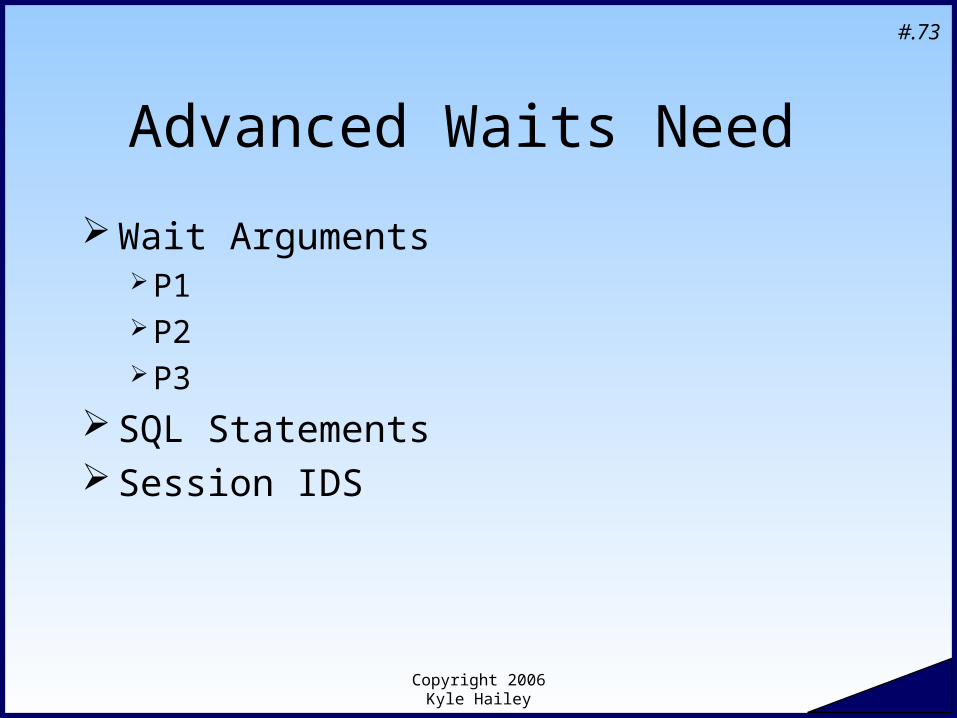
Advanced Waits Need
Wait ArgumentsP1P2P3
SQL Statements Session IDS
Copyright 2006 Kyle Hailey
#.74
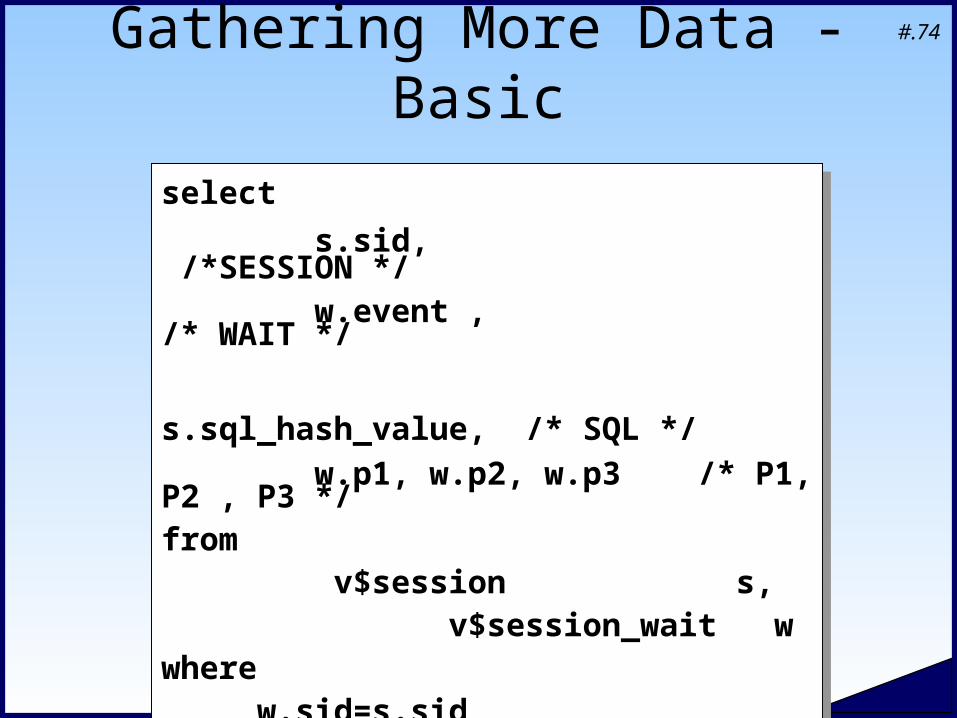
Gathering More Data - Basic
select
s.sid, /*SESSION */ w.event , /* WAIT */
s.sql_hash_value, /* SQL */
w.p1, w.p2, w.p3 /* P1, P2 , P3 */from
v$session s, v$session_wait w where
w.sid=s.sid /
select
s.sid, /*SESSION */ w.event , /* WAIT */
s.sql_hash_value, /* SQL */
w.p1, w.p2, w.p3 /* P1, P2 , P3 */from
v$session s, v$session_wait w where
w.sid=s.sid /
Copyright 2006 Kyle Hailey
#.75
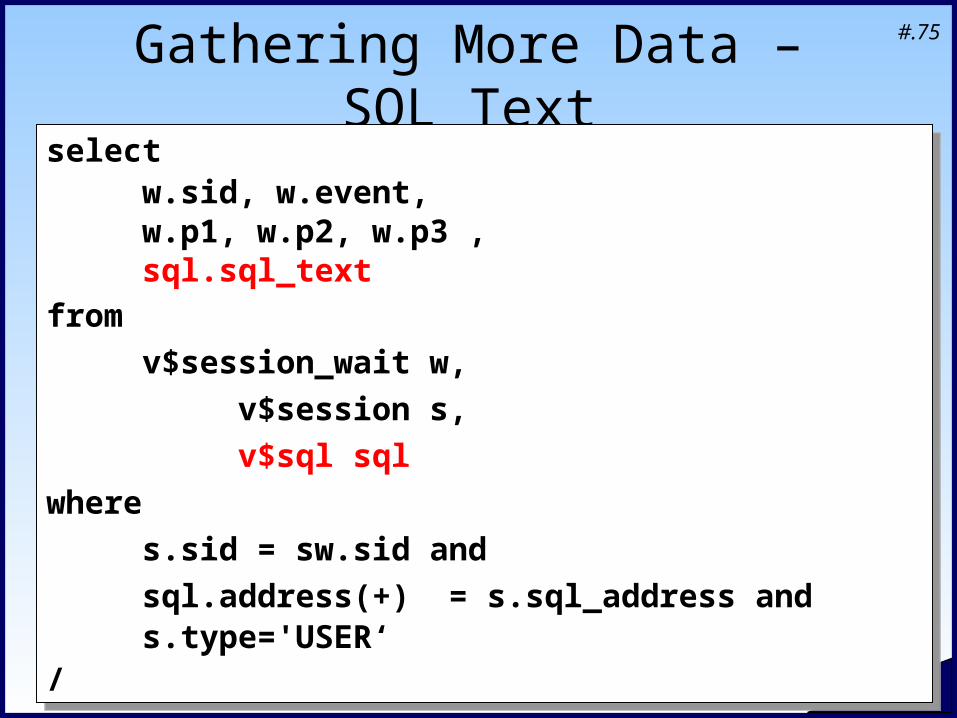
Gathering More Data – SQL Text
select w.sid, w.event, w.p1, w.p2, w.p3 ,sql.sql_text
from
v$session_wait w,
v$session s,
v$sql sql
where
s.sid = sw.sid and
sql.address(+) = s.sql_address and s.type='USER‘/
select w.sid, w.event, w.p1, w.p2, w.p3 ,sql.sql_text
from
v$session_wait w,
v$session s,
v$sql sql
where
s.sid = sw.sid and
sql.address(+) = s.sql_address and s.type='USER‘/
Copyright 2006 Kyle Hailey
#.76
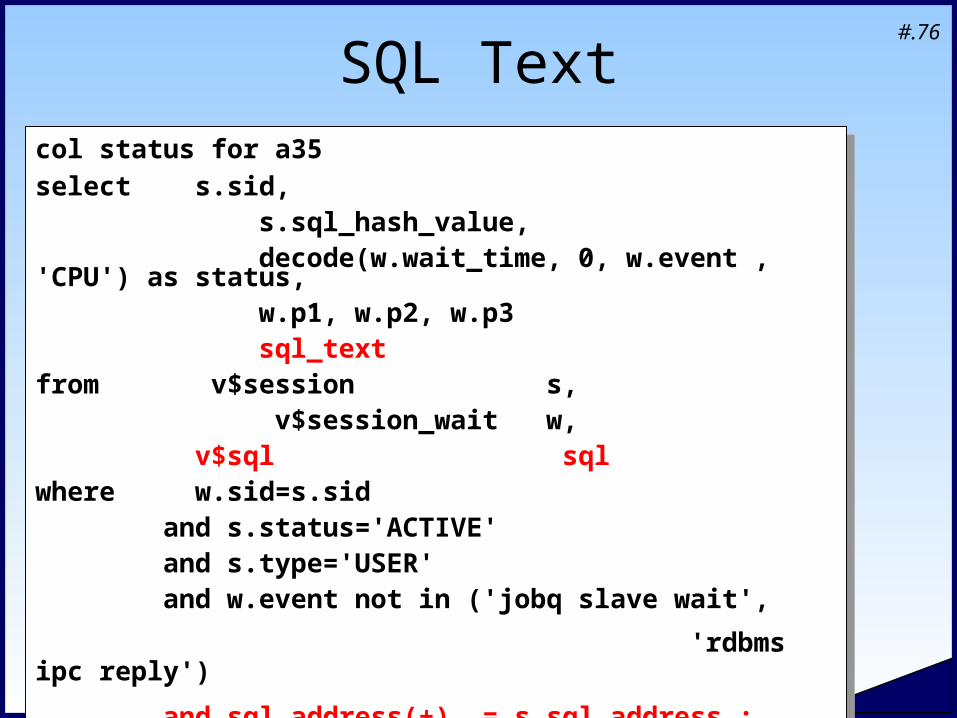
SQL Text
col status for a35
select s.sid, s.sql_hash_value, decode(w.wait_time, 0, w.event , 'CPU') as status, w.p1, w.p2, w.p3 sql_textfrom v$session s, v$session_wait w,
v$sql sqlwhere w.sid=s.sid and s.status='ACTIVE' and s.type='USER' and w.event not in ('jobq slave wait',
'rdbms ipc reply')
and sql.address(+) = s.sql_address ;
Copyright 2006 Kyle Hailey
#.77
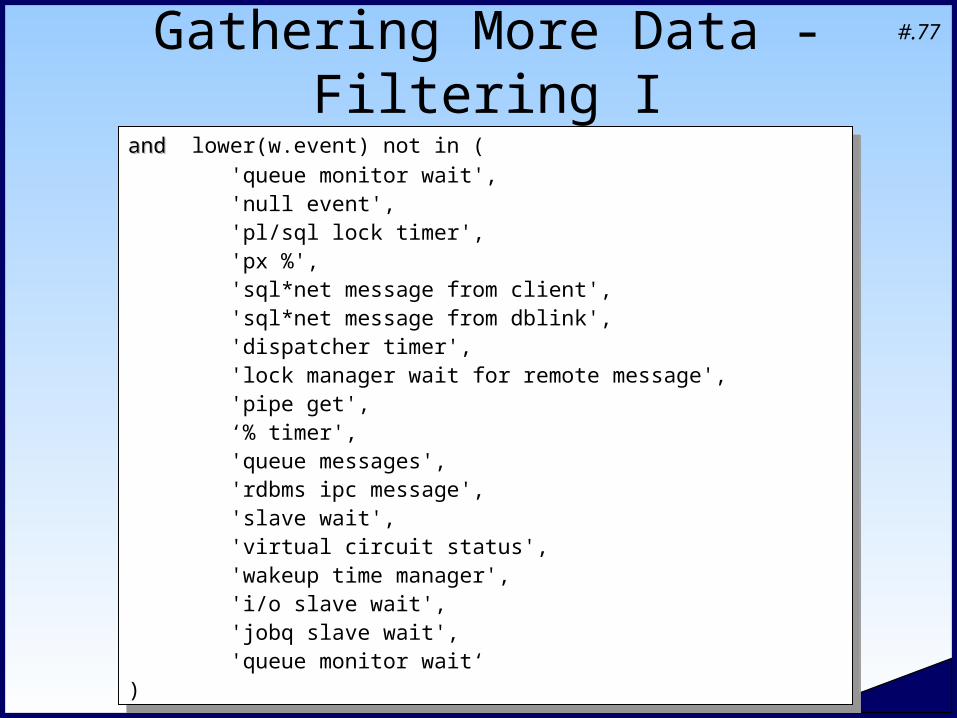
Gathering More Data - Filtering I
and and lower(w.event) not in (
'queue monitor wait', 'null event', 'pl/sql lock timer', 'px %', 'sql*net message from client', 'sql*net message from dblink', 'dispatcher timer', 'lock manager wait for remote message', 'pipe get', ‘% timer', 'queue messages', 'rdbms ipc message', 'slave wait', 'virtual circuit status', 'wakeup time manager', 'i/o slave wait', 'jobq slave wait', 'queue monitor wait‘)
Copyright 2006 Kyle Hailey
#.78
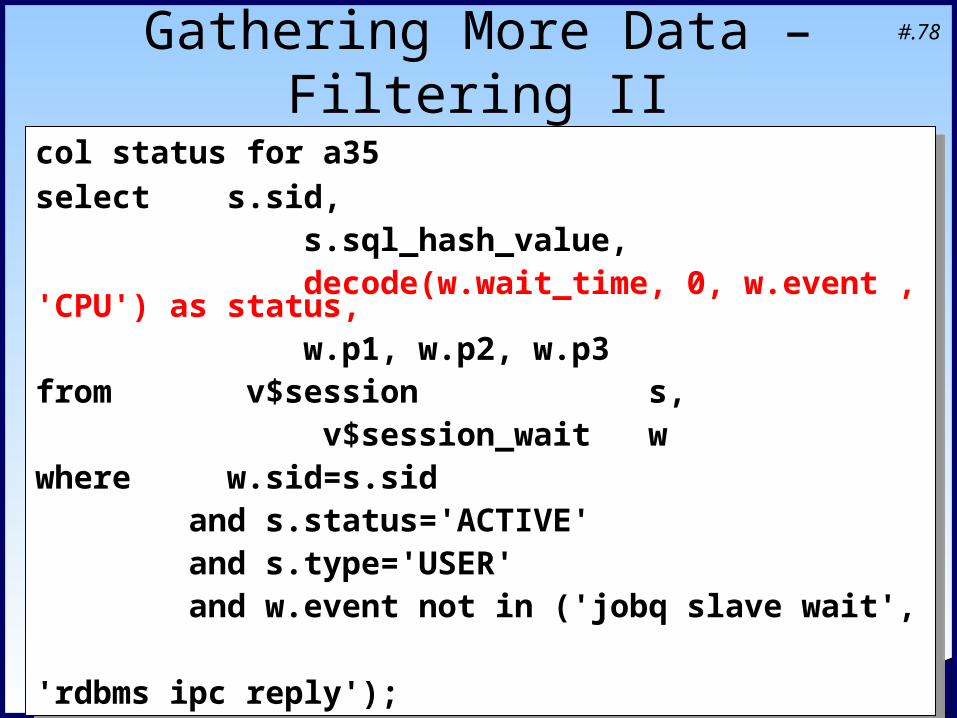
Gathering More Data – Filtering II
col status for a35
select s.sid, s.sql_hash_value, decode(w.wait_time, 0, w.event , 'CPU') as status, w.p1, w.p2, w.p3from v$session s, v$session_wait w where w.sid=s.sid and s.status='ACTIVE' and s.type='USER' and w.event not in ('jobq slave wait',
'rdbms ipc reply');
col status for a35
select s.sid, s.sql_hash_value, decode(w.wait_time, 0, w.event , 'CPU') as status, w.p1, w.p2, w.p3from v$session s, v$session_wait w where w.sid=s.sid and s.status='ACTIVE' and s.type='USER' and w.event not in ('jobq slave wait',
'rdbms ipc reply');
Copyright 2006 Kyle Hailey
#.79
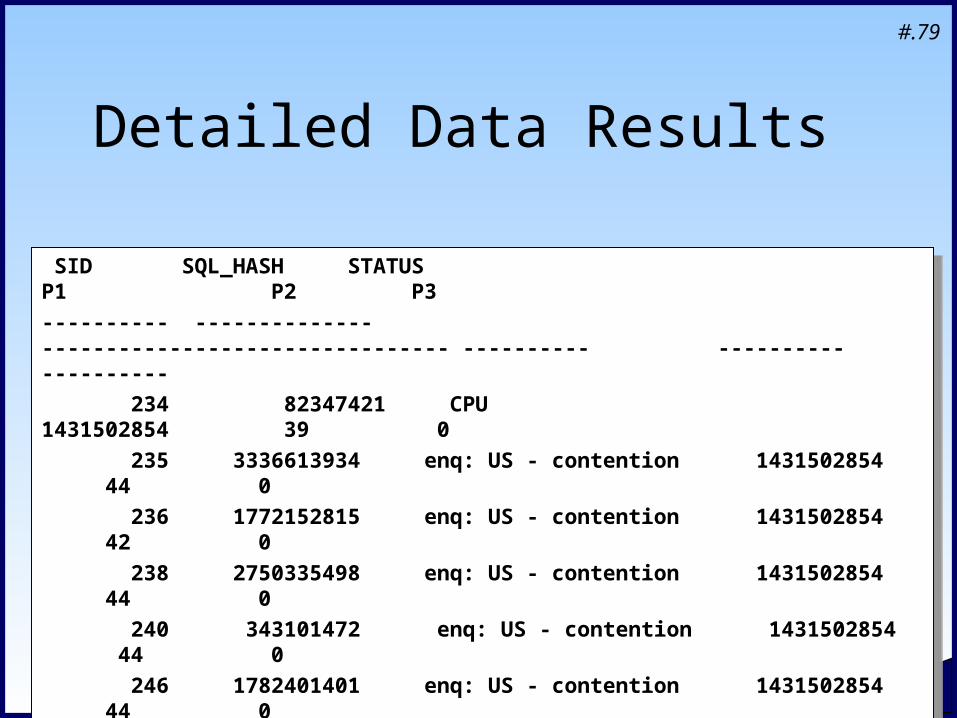
Detailed Data Results
SID SQL_HASH STATUS P1 P2 P3
---------- -------------- -------------------------------- ---------- ---------- ----------
234 82347421 CPU 1431502854 39 0
235 3336613934 enq: US - contention 1431502854 44 0
236 1772152815 enq: US - contention 1431502854 42 0
238 2750335498 enq: US - contention 1431502854 44 0
240 343101472 enq: US - contention 1431502854 44 0
246 1782401401 enq: US - contention 1431502854 44 0
248 3333220954 CPU 1650815232 1 0
252 323960517 enq: US - contention 1431502854 44 0
260 1272059733 CPU 1431502854 44 0
Copyright 2006 Kyle Hailey
#.80
Wait Arguments: P1,P2,P3
Each Wait has a 3 parameters P1,P2,P3 Give detailed information Meaning different for each wait Meaning defined in V$event_name
Copyright 2006 Kyle Hailey
#.81
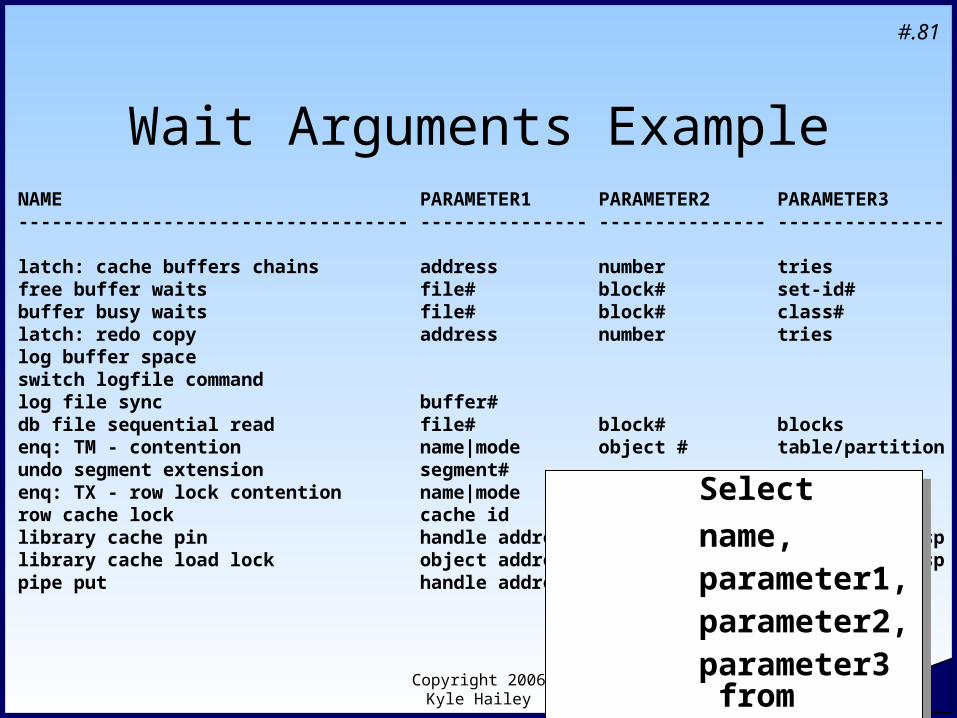
Wait Arguments ExampleNAME PARAMETER1 PARAMETER2 PARAMETER3----------------------------------- --------------- --------------- ---------------
latch: cache buffers chains address number triesfree buffer waits file# block# set-id#buffer busy waits file# block# class#latch: redo copy address number trieslog buffer spaceswitch logfile commandlog file sync buffer#db file sequential read file# block# blocksenq: TM - contention name|mode object # table/partitionundo segment extension segment#enq: TX - row lock contention name|mode usn<<16 | slot sequencerow cache lock cache id mode requestlibrary cache pin handle address pin address 100*mode+namesplibrary cache load lock object address lock address 100*mask+namesppipe put handle address record length timeout
Select
name, parameter1, parameter2, parameter3 from v$event_name;
Select
name, parameter1, parameter2, parameter3 from v$event_name;
Copyright 2006 Kyle Hailey
#.82
Difficult Waits
Multiple causes and solutions
Latches Locks Buffer Busy Row Cache Lock
Copyright 2006 Kyle Hailey
#.83
Latches
Protect memory for concurrent use “protect lines of code”
Light weight locksBit in memoryAtomic processor callFast and cheapGone if memory is lost
Exclusive Generally Sharing reading has been introduced for some latches
Copyright 2006 Kyle Hailey
#.84
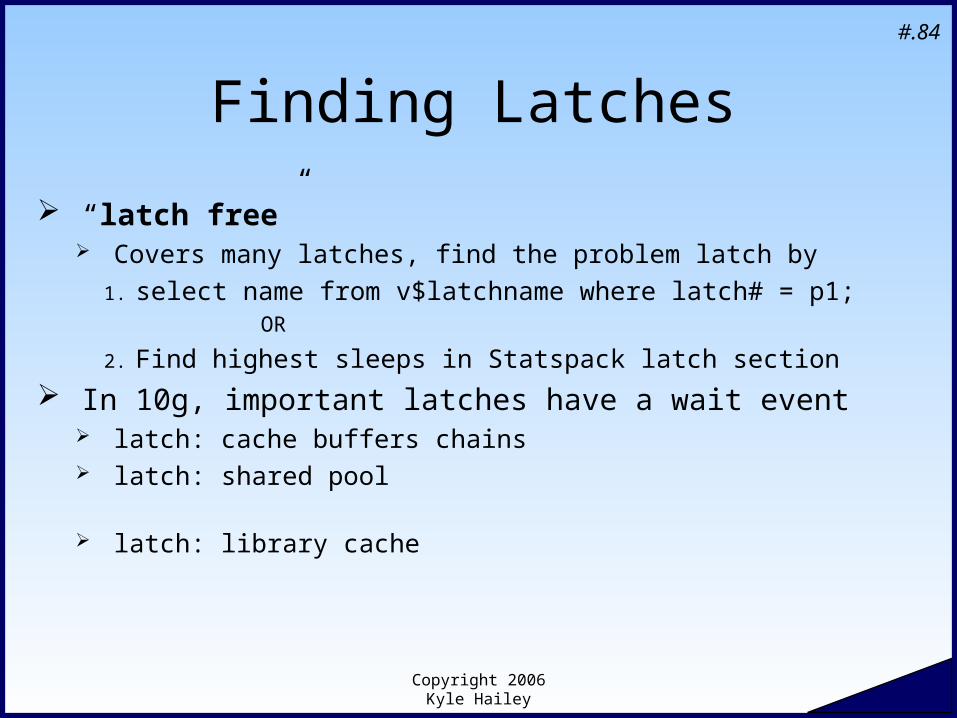
Finding Latches
“latch free” Covers many latches, find the problem latch by
1. select name from v$latchname where latch# = p1; OR
2. Find highest sleeps in Statspack latch section
In 10g, important latches have a wait event latch: cache buffers chains latch: shared pool
latch: library cache
Copyright 2006 Kyle Hailey
#.85
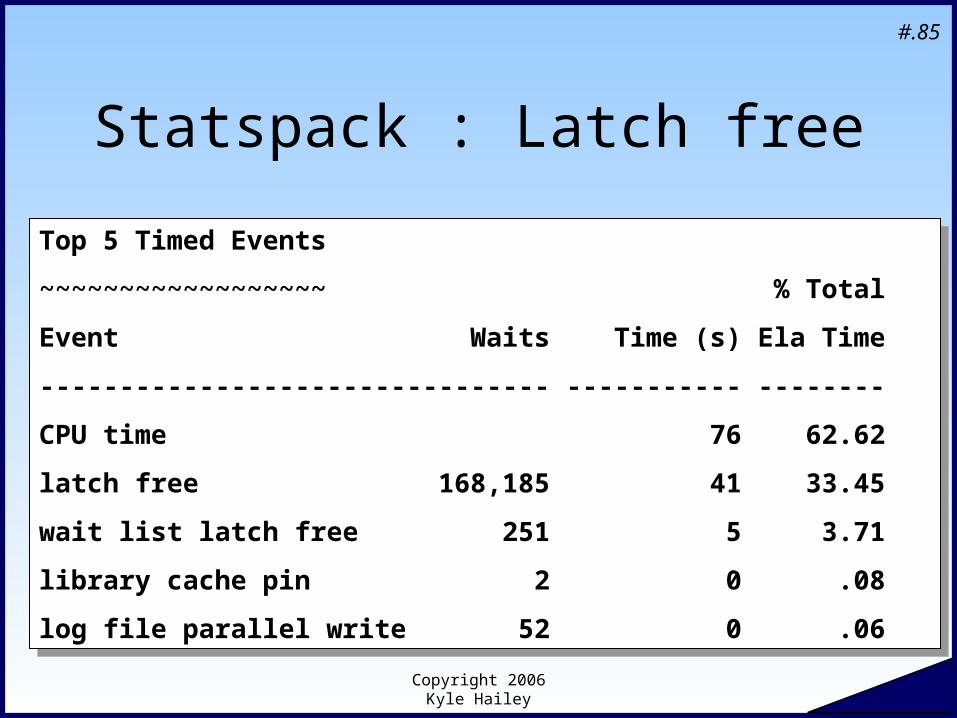
Statspack : Latch free
Top 5 Timed Events
~~~~~~~~~~~~~~~~~~ % Total
Event Waits Time (s) Ela Time
-------------------------------- ----------- --------
CPU time 76 62.62
latch free 168,185 41 33.45
wait list latch free 251 5 3.71
library cache pin 2 0 .08
log file parallel write 52 0 .06
Top 5 Timed Events
~~~~~~~~~~~~~~~~~~ % Total
Event Waits Time (s) Ela Time
-------------------------------- ----------- --------
CPU time 76 62.62
latch free 168,185 41 33.45
wait list latch free 251 5 3.71
library cache pin 2 0 .08
log file parallel write 52 0 .06
Copyright 2006 Kyle Hailey
#.86
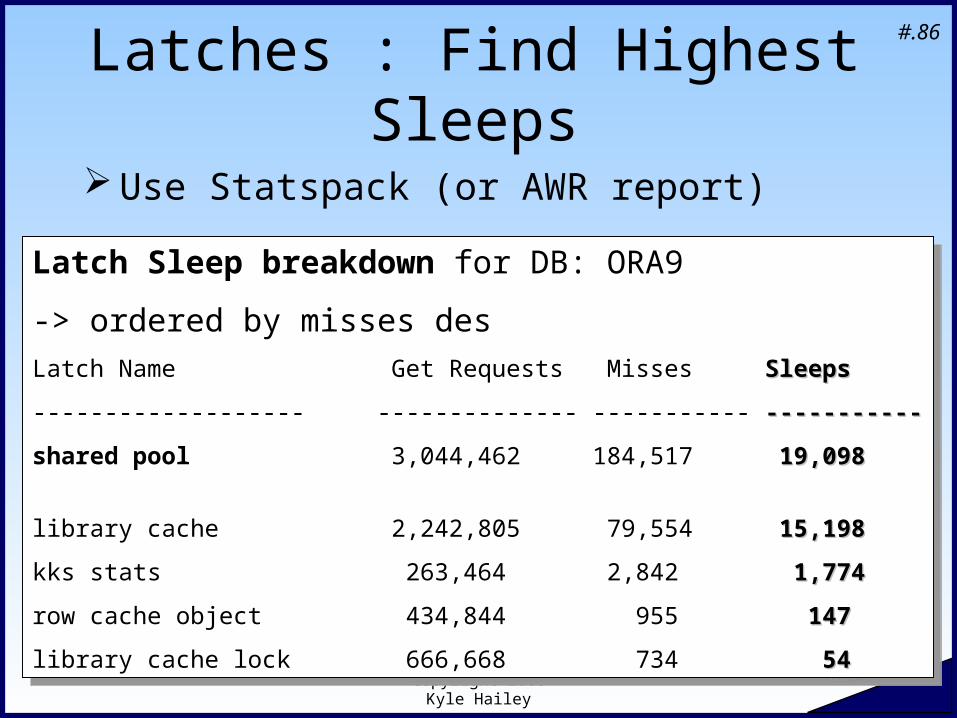
Latches : Find Highest Sleeps
Use Statspack (or AWR report)
Latch Sleep breakdown for DB: ORA9
-> ordered by misses des
Latch Name Get Requests Misses SleepsSleeps
------------------- -------------- ----------- ----------------------
shared pool 3,044,462 184,517 19,09819,098
library cache 2,242,805 79,554 15,19815,198
kks stats 263,464 2,842 1,7741,774
row cache object 434,844 955 147147
library cache lock 666,668 734 5454
Copyright 2006 Kyle Hailey
#.87
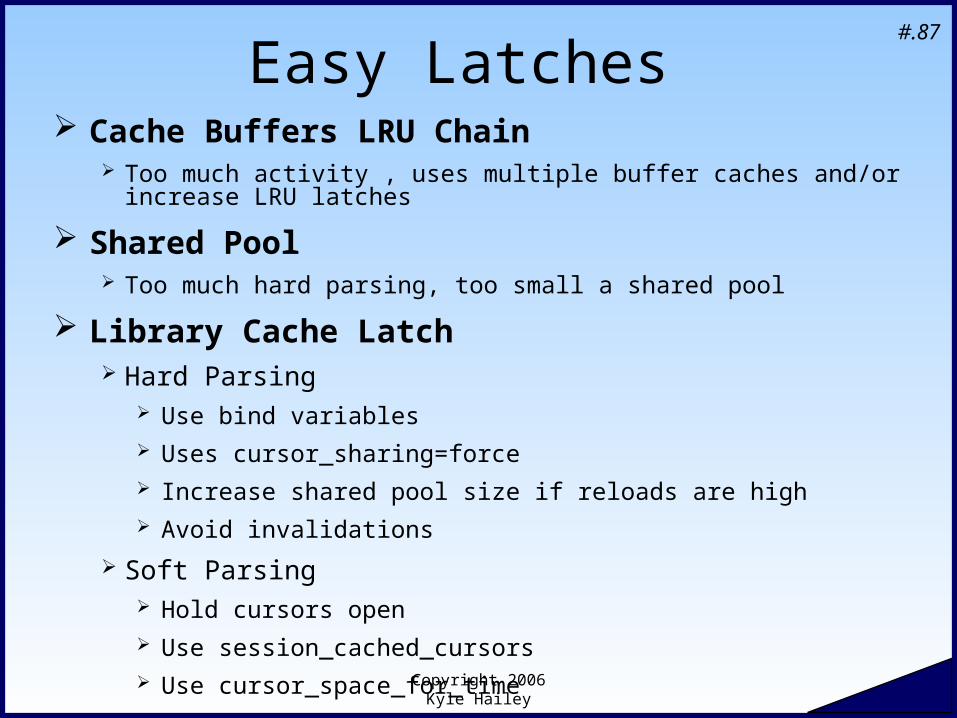
Easy Latches Cache Buffers LRU Chain
Too much activity , uses multiple buffer caches and/or increase LRU latches
Shared Pool Too much hard parsing, too small a shared pool
Library Cache Latch Hard Parsing
Use bind variables Uses cursor_sharing=force Increase shared pool size if reloads are high Avoid invalidations
Soft Parsing Hold cursors open Use session_cached_cursors Use cursor_space_for_time
Copyright 2006 Kyle Hailey
#.88
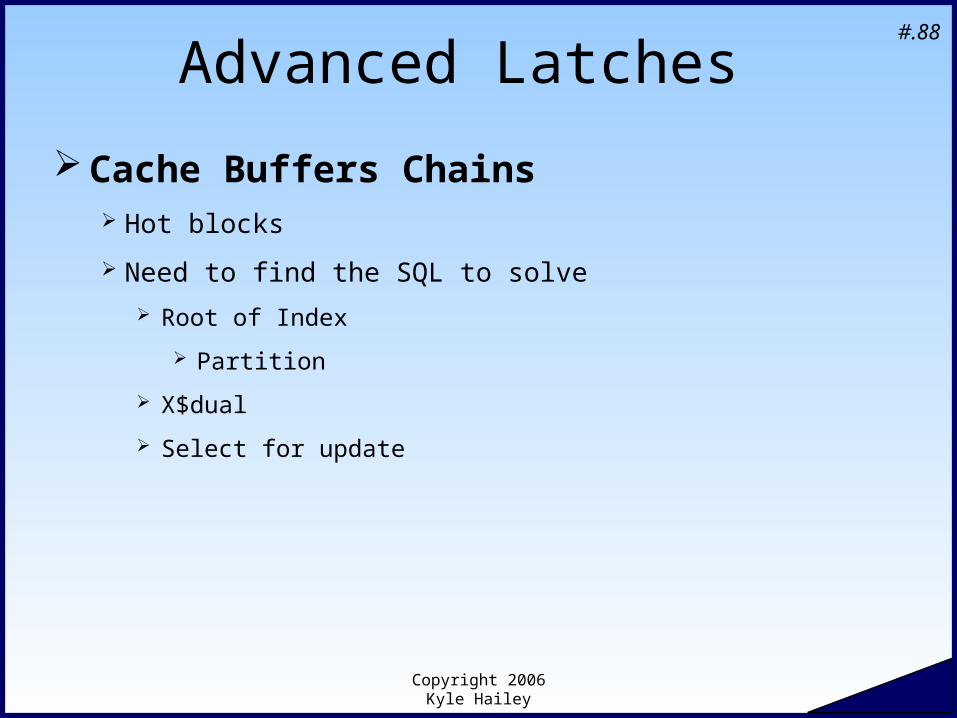
Advanced Latches
Cache Buffers Chains Hot blocks
Need to find the SQL to solve
Root of Index
Partition
X$dual
Select for update
Copyright 2006 Kyle Hailey
#.89
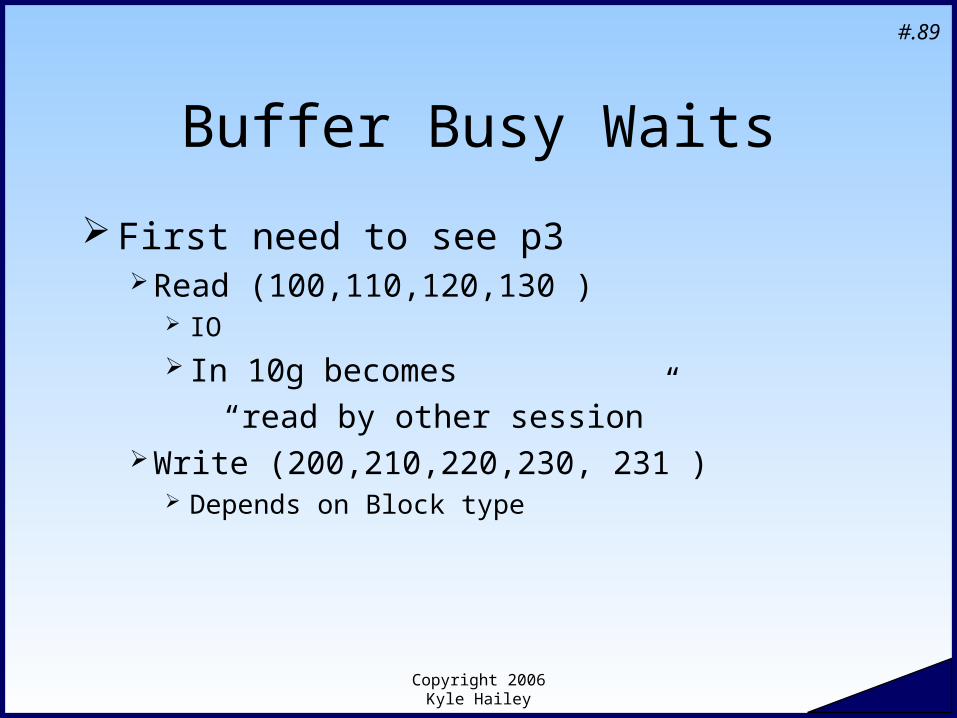
Buffer Busy Waits
First need to see p3Read (100,110,120,130 )
IO
In 10g becomes
“read by other session”Write (200,210,220,230, 231 )
Depends on Block type
Copyright 2006 Kyle Hailey
#.90
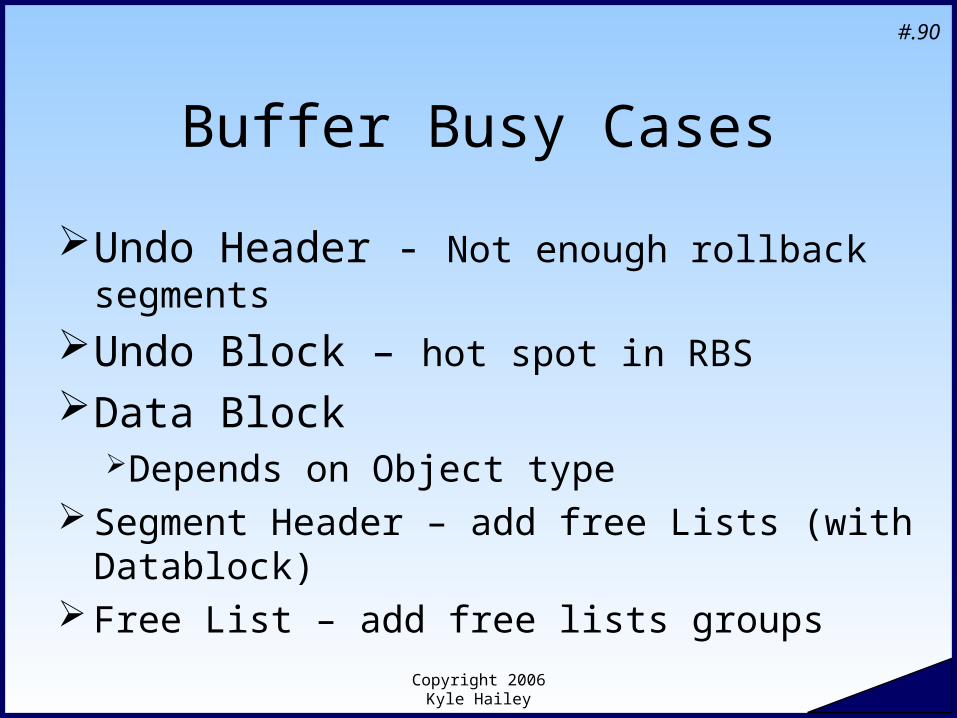
Buffer Busy Cases
Undo Header - Not enough rollback segments
Undo Block – hot spot in RBS
Data Block Depends on Object type
Segment Header – add free Lists (with Datablock) Free List – add free lists groups
Copyright 2006 Kyle Hailey
#.91
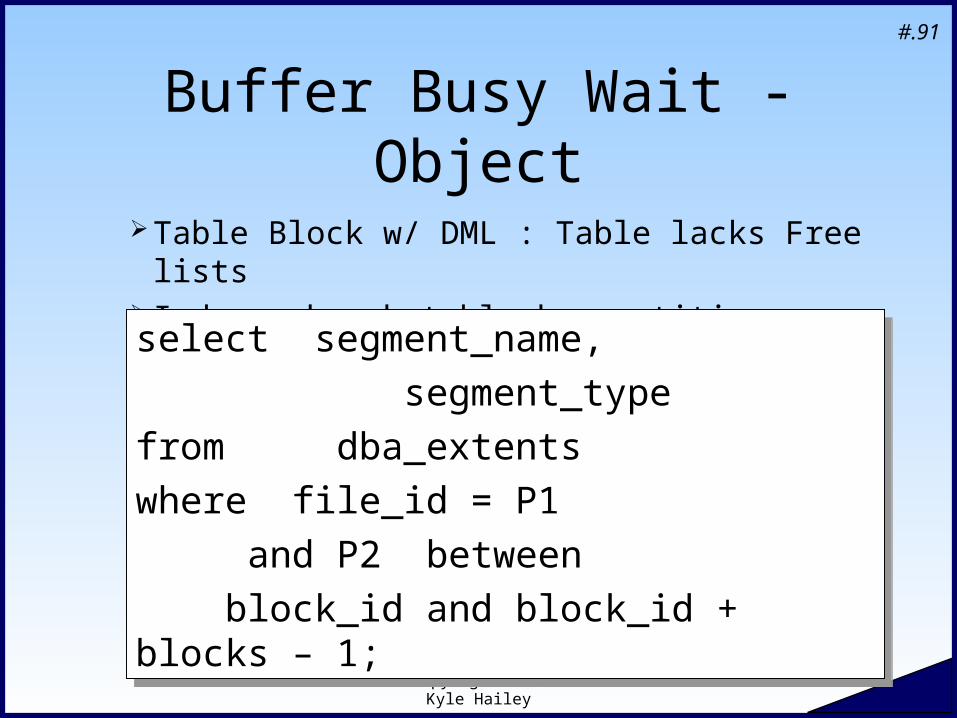
Buffer Busy Wait - Object
Table Block w/ DML : Table lacks Free lists Index : has hot block, partition or change SQL
select segment_name,
segment_type
from dba_extents
where file_id = P1
and P2 between
block_id and block_id + blocks – 1;
select segment_name,
segment_type
from dba_extents
where file_id = P1
and P2 between
block_id and block_id + blocks – 1;
Copyright 2006 Kyle Hailey
#.92
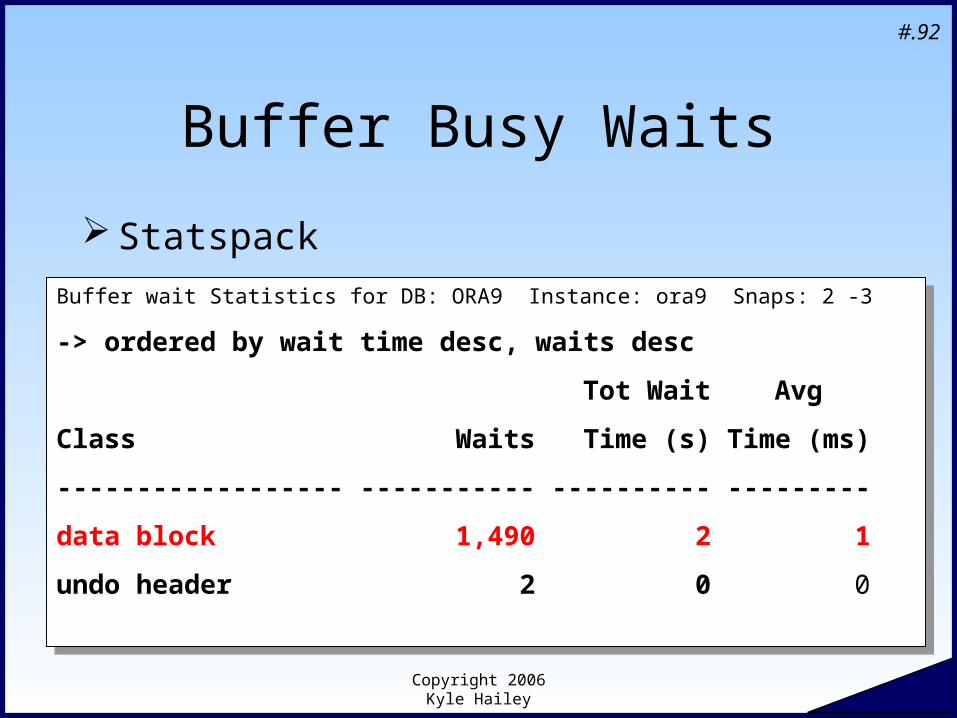
Buffer Busy Waits
Statspack
Buffer wait Statistics for DB: ORA9 Instance: ora9 Snaps: 2 -3
-> ordered by wait time desc, waits desc
Tot Wait Avg
Class Waits Time (s) Time (ms)
------------------ ----------- ---------- ---------
data block 1,490 2 1
undo header 2 0 0
Buffer wait Statistics for DB: ORA9 Instance: ora9 Snaps: 2 -3
-> ordered by wait time desc, waits desc
Tot Wait Avg
Class Waits Time (s) Time (ms)
------------------ ----------- ---------- ---------
data block 1,490 2 1
undo header 2 0 0
Copyright 2006 Kyle Hailey
#.93
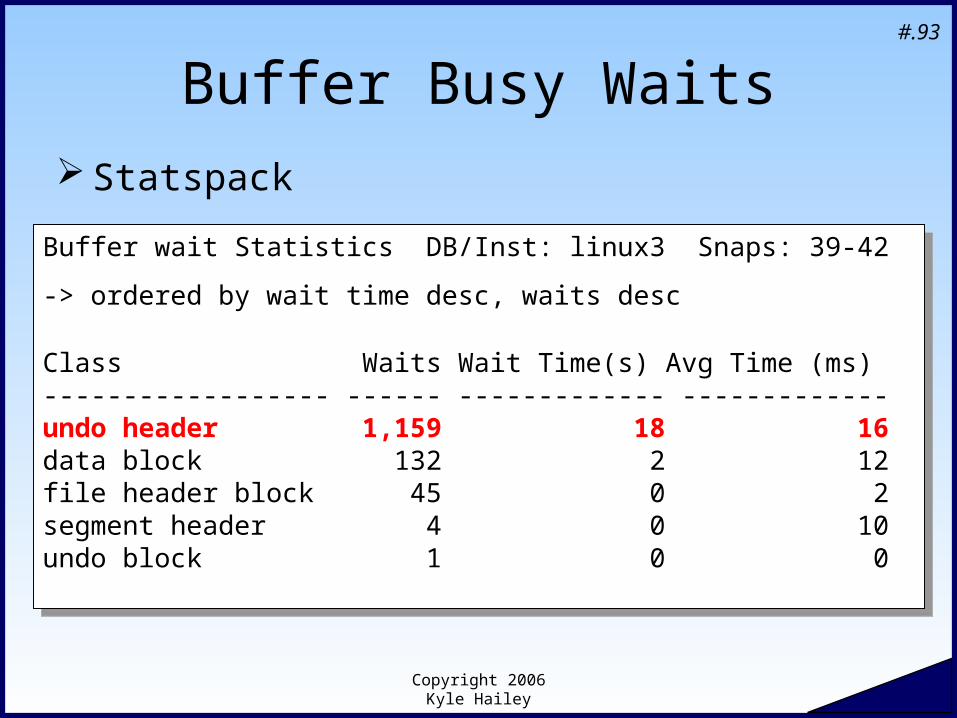
Buffer Busy Waits Statspack
Buffer wait Statistics DB/Inst: linux3 Snaps: 39-42
-> ordered by wait time desc, waits desc
Class Waits Wait Time(s) Avg Time (ms)------------------ ------ ------------- -------------undo header 1,159 18 16data block 132 2 12file header block 45 0 2segment header 4 0 10undo block 1 0 0
Buffer wait Statistics DB/Inst: linux3 Snaps: 39-42
-> ordered by wait time desc, waits desc
Class Waits Wait Time(s) Avg Time (ms)------------------ ------ ------------- -------------undo header 1,159 18 16data block 132 2 12file header block 45 0 2segment header 4 0 10undo block 1 0 0
Copyright 2006 Kyle Hailey
#.94
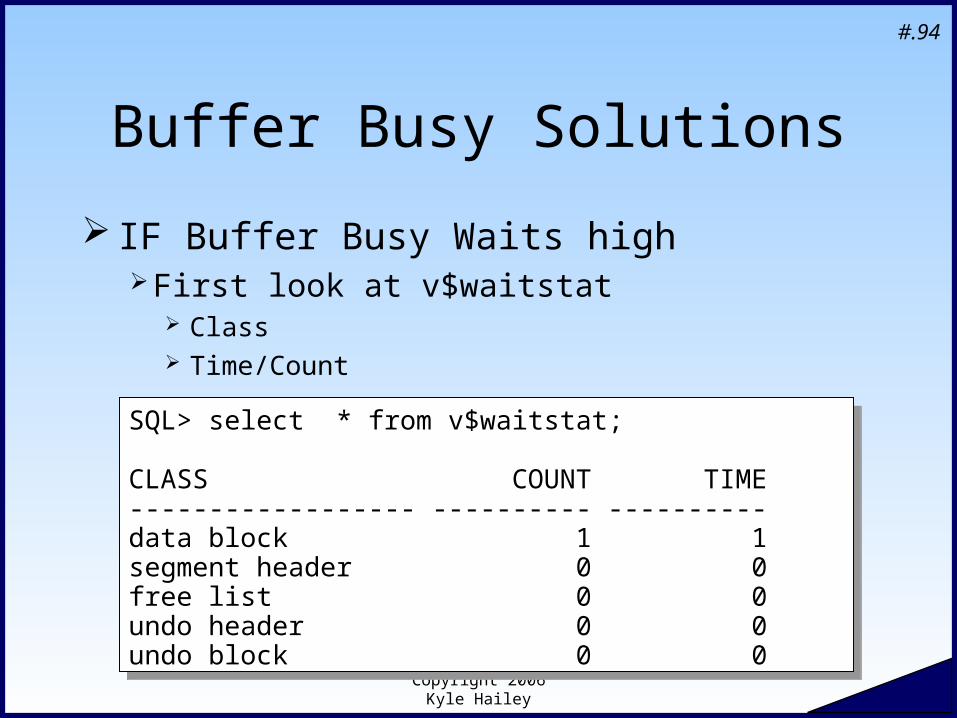
Buffer Busy Solutions
IF Buffer Busy Waits highFirst look at v$waitstat
Class Time/Count
SQL> select * from v$waitstat;
CLASS COUNT TIME------------------ ---------- ----------data block 1 1segment header 0 0free list 0 0undo header 0 0undo block 0 0
SQL> select * from v$waitstat;
CLASS COUNT TIME------------------ ---------- ----------data block 1 1segment header 0 0free list 0 0undo header 0 0undo block 0 0
Copyright 2006 Kyle Hailey
#.95
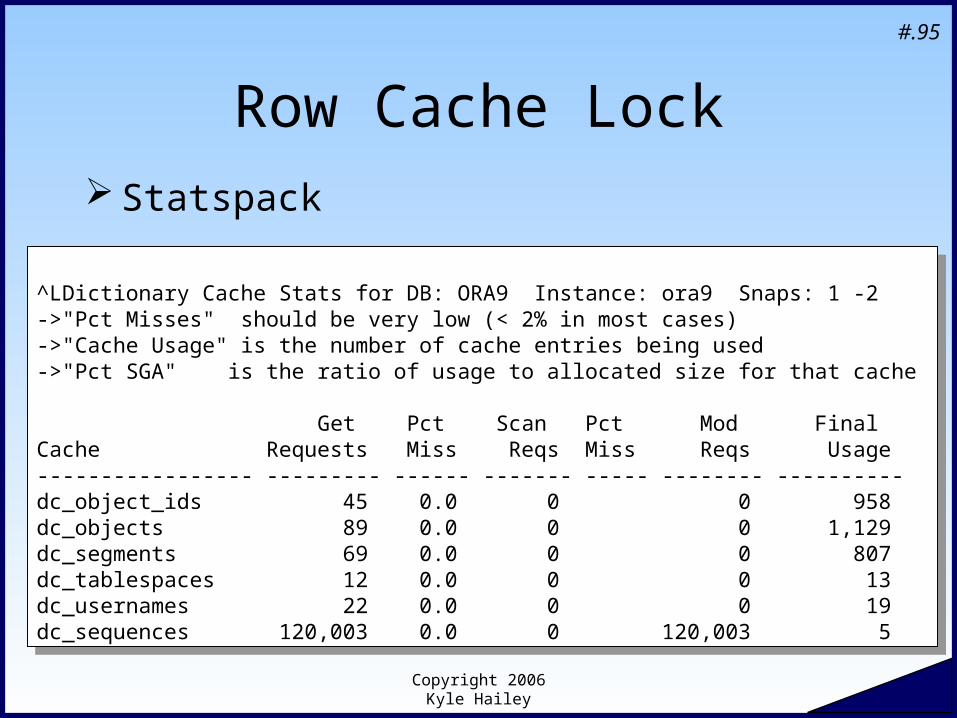
Row Cache Lock Statspack
^LDictionary Cache Stats for DB: ORA9 Instance: ora9 Snaps: 1 -2->"Pct Misses" should be very low (< 2% in most cases)->"Cache Usage" is the number of cache entries being used->"Pct SGA" is the ratio of usage to allocated size for that cache
Get Pct Scan Pct Mod FinalCache Requests Miss Reqs Miss Reqs Usage----------------- --------- ------ ------- ----- -------- ----------dc_object_ids 45 0.0 0 0 958dc_objects 89 0.0 0 0 1,129dc_segments 69 0.0 0 0 807dc_tablespaces 12 0.0 0 0 13dc_usernames 22 0.0 0 0 19dc_sequences 120,003 0.0 0 120,003 5
Copyright 2006 Kyle Hailey
#.96
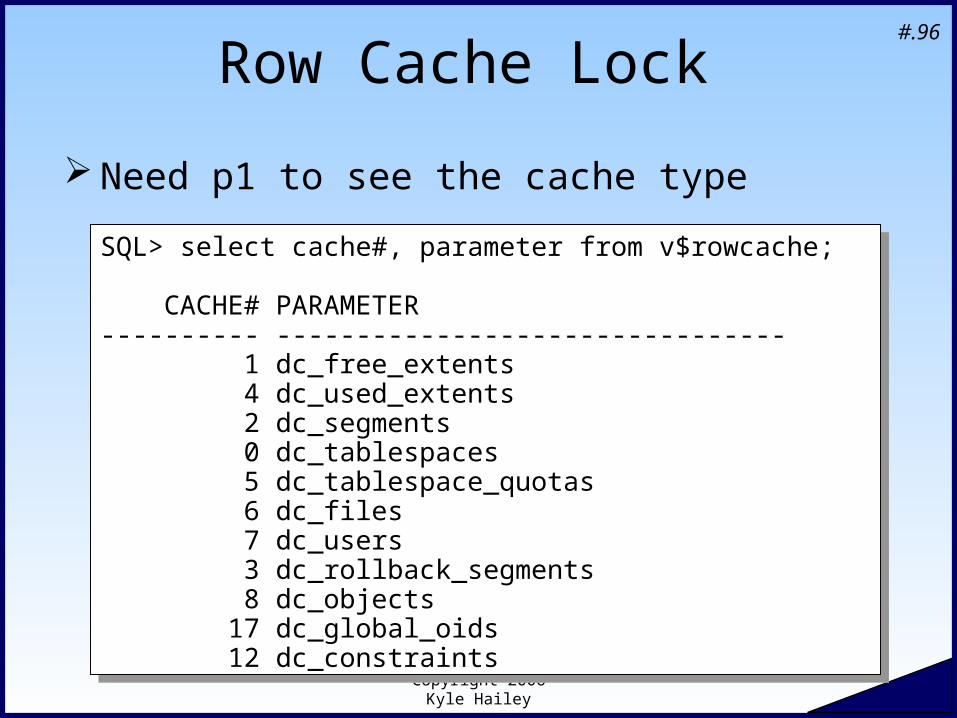
Row Cache Lock
Need p1 to see the cache type
SQL> select cache#, parameter from v$rowcache;
CACHE# PARAMETER---------- -------------------------------- 1 dc_free_extents 4 dc_used_extents 2 dc_segments 0 dc_tablespaces 5 dc_tablespace_quotas 6 dc_files 7 dc_users 3 dc_rollback_segments 8 dc_objects 17 dc_global_oids 12 dc_constraints
SQL> select cache#, parameter from v$rowcache;
CACHE# PARAMETER---------- -------------------------------- 1 dc_free_extents 4 dc_used_extents 2 dc_segments 0 dc_tablespaces 5 dc_tablespace_quotas 6 dc_files 7 dc_users 3 dc_rollback_segments 8 dc_objects 17 dc_global_oids 12 dc_constraints
Copyright 2006 Kyle Hailey
#.97
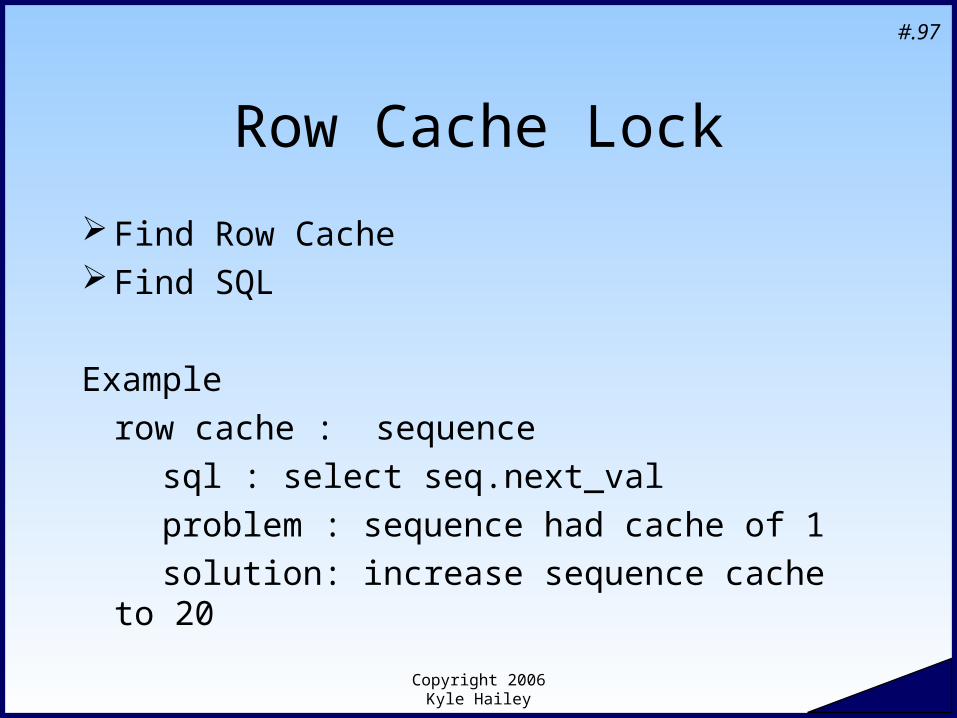
Row Cache Lock
Find Row Cache Find SQL
Example
row cache : sequence
sql : select seq.next_val
problem : sequence had cache of 1
solution: increase sequence cache to 20
Copyright 2006 Kyle Hailey
#.98
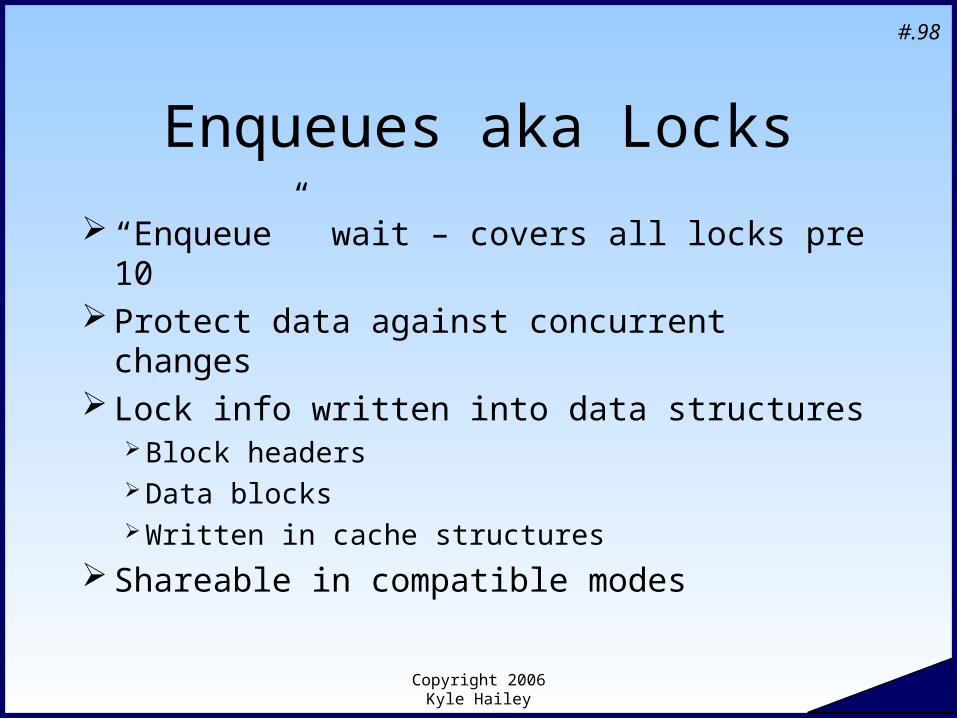
Enqueues aka Locks
“Enqueue” wait – covers all locks pre 10 Protect data against concurrent changes Lock info written into data structures
Block headersData blocksWritten in cache structures
Shareable in compatible modes
Copyright 2006 Kyle Hailey
#.99
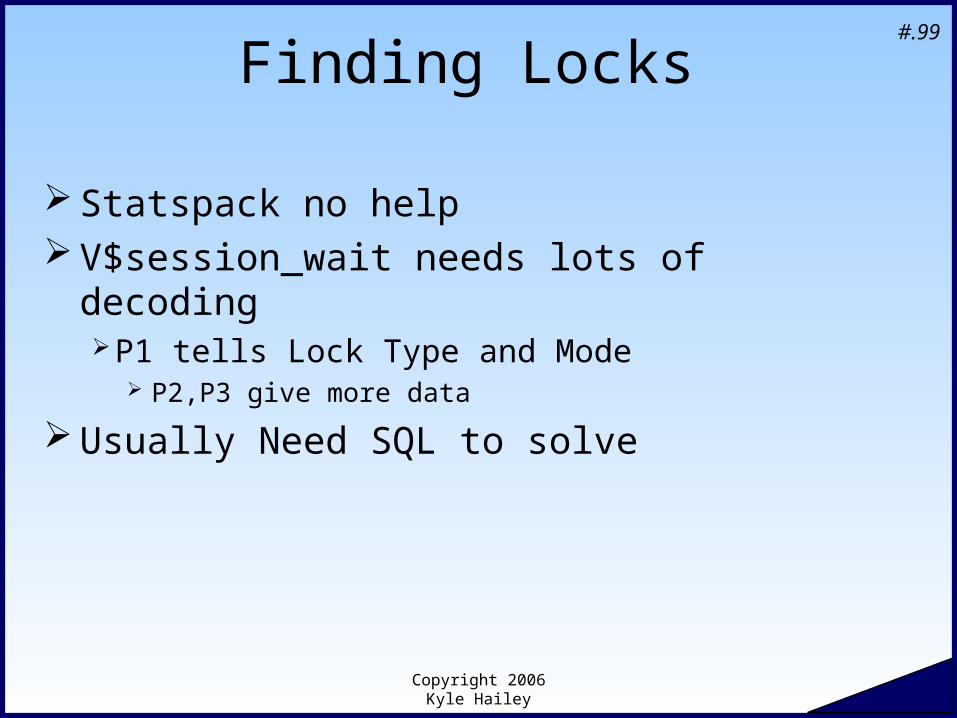
Finding Locks
Statspack no help V$session_wait needs lots of decoding
P1 tells Lock Type and Mode P2,P3 give more data
Usually Need SQL to solve
Copyright 2006 Kyle Hailey
#.100
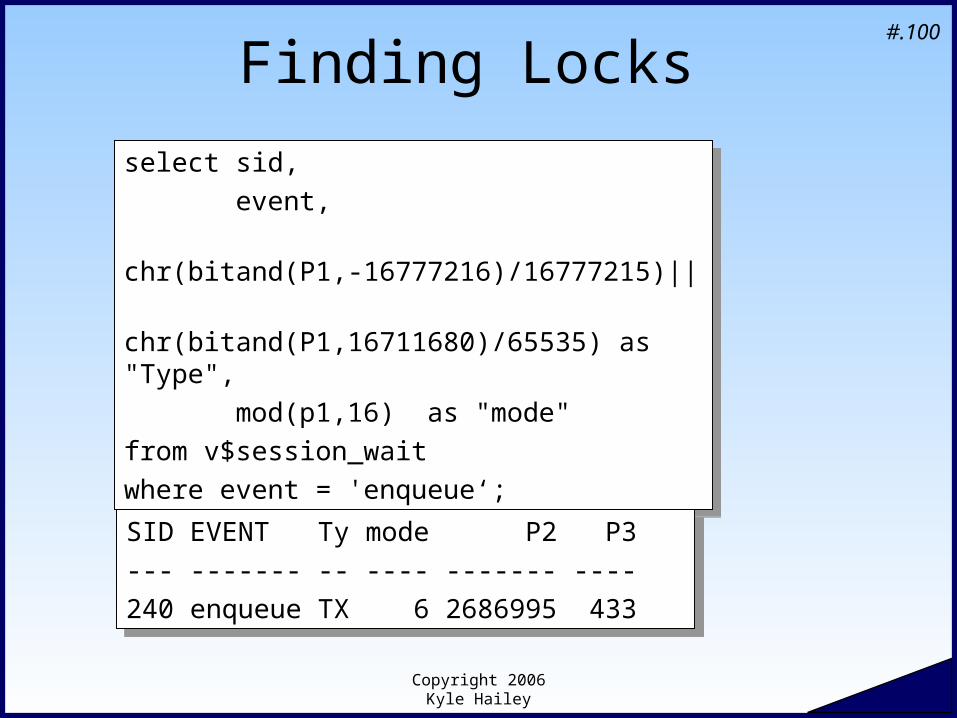
Finding Locks
select sid,
event,
chr(bitand(P1,-16777216)/16777215)||
chr(bitand(P1,16711680)/65535) as "Type",
mod(p1,16) as "mode"
from v$session_wait
where event = 'enqueue‘;
select sid,
event,
chr(bitand(P1,-16777216)/16777215)||
chr(bitand(P1,16711680)/65535) as "Type",
mod(p1,16) as "mode"
from v$session_wait
where event = 'enqueue‘;
SID EVENT Ty mode P2 P3
--- ------- -- ---- ------- ----
240 enqueue TX 6 2686995 433
SID EVENT Ty mode P2 P3
--- ------- -- ---- ------- ----
240 enqueue TX 6 2686995 433
Copyright 2006 Kyle Hailey
#.101
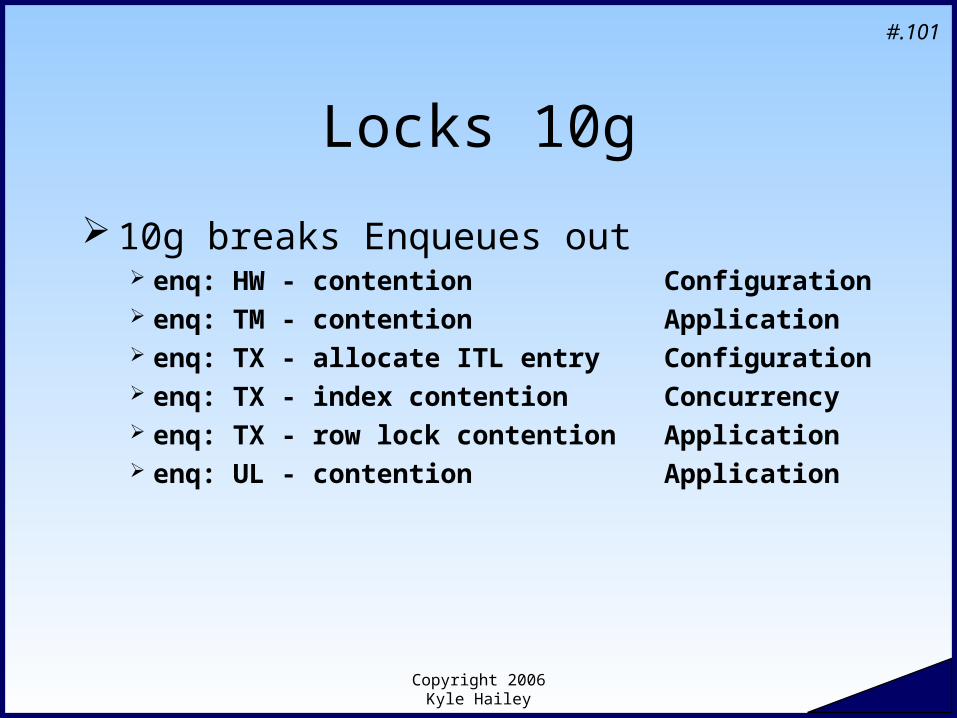
Locks 10g
10g breaks Enqueues out enq: HW - contention Configuration enq: TM - contention Application enq: TX - allocate ITL entry Configuration enq: TX - index contention Concurrency enq: TX - row lock contention Application enq: UL - contention Application
Copyright 2006 Kyle Hailey
#.102
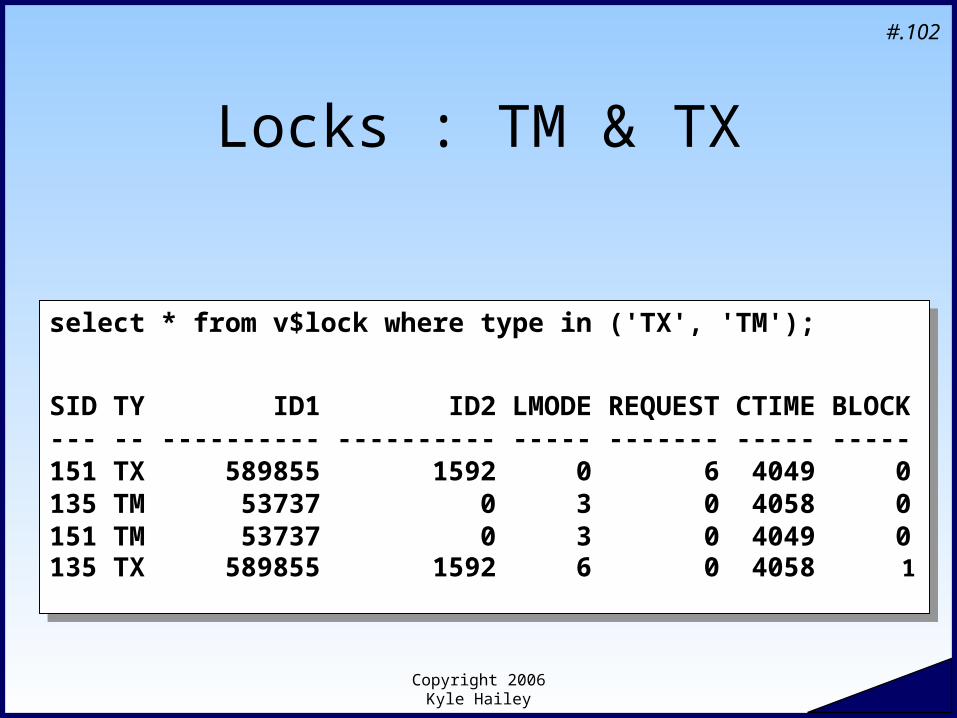
Locks : TM & TX
select * from v$lock where type in ('TX', 'TM');
SID TY ID1 ID2 LMODE REQUEST CTIME BLOCK--- -- ---------- ---------- ----- ------- ----- -----151 TX 589855 1592 0 6 4049 0135 TM 53737 0 3 0 4058 0151 TM 53737 0 3 0 4049 0135 TX 589855 1592 6 0 4058 1
select * from v$lock where type in ('TX', 'TM');
SID TY ID1 ID2 LMODE REQUEST CTIME BLOCK--- -- ---------- ---------- ----- ------- ----- -----151 TX 589855 1592 0 6 4049 0135 TM 53737 0 3 0 4058 0151 TM 53737 0 3 0 4049 0135 TX 589855 1592 6 0 4058 1
Copyright 2006 Kyle Hailey
#.103
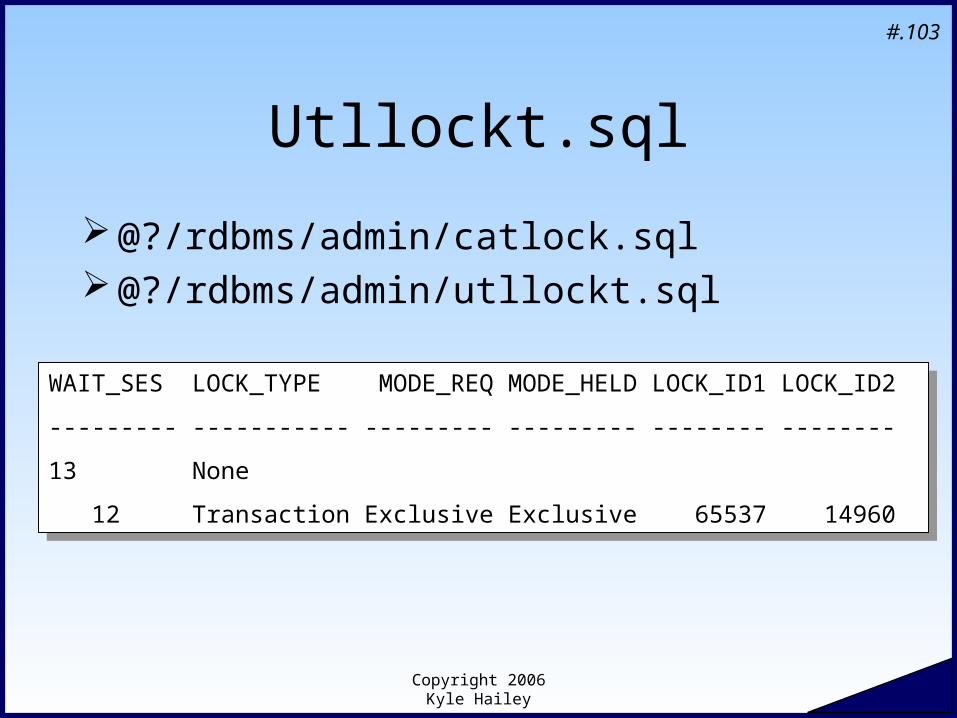
Utllockt.sql
@?/rdbms/admin/catlock.sql @?/rdbms/admin/utllockt.sql
WAIT_SES LOCK_TYPE MODE_REQ MODE_HELD LOCK_ID1 LOCK_ID2
--------- ----------- --------- --------- -------- --------
13 None
12 Transaction Exclusive Exclusive 65537 14960
WAIT_SES LOCK_TYPE MODE_REQ MODE_HELD LOCK_ID1 LOCK_ID2
--------- ----------- --------- --------- -------- --------
13 None
12 Transaction Exclusive Exclusive 65537 14960
Copyright 2006 Kyle Hailey
#.104
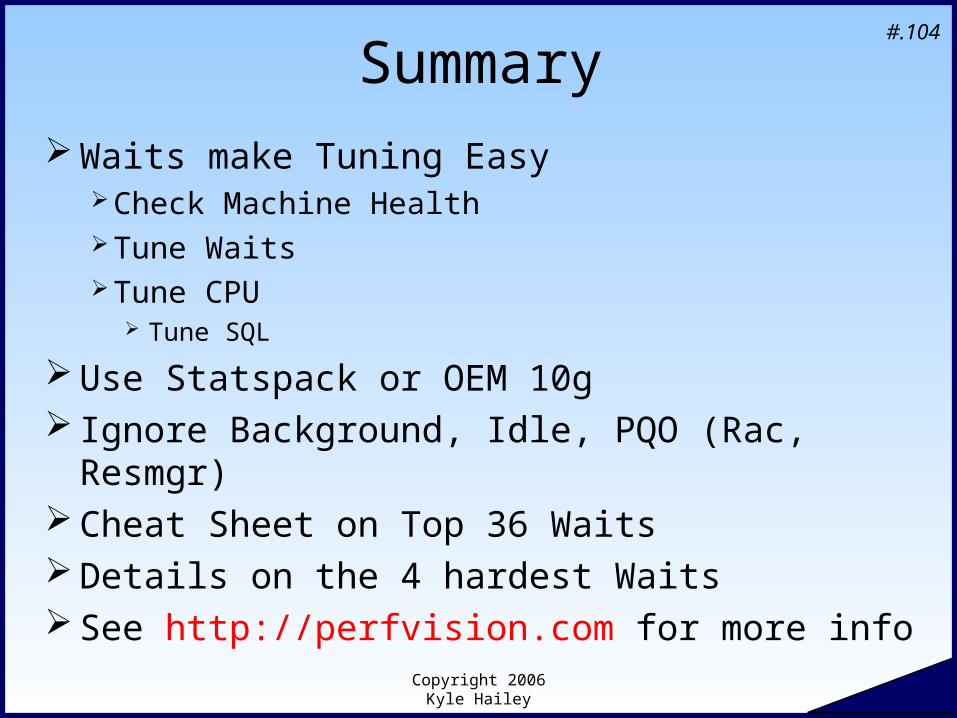
Summary Waits make Tuning Easy
Check Machine HealthTune WaitsTune CPU
Tune SQL
Use Statspack or OEM 10g Ignore Background, Idle, PQO (Rac, Resmgr) Cheat Sheet on Top 36 Waits Details on the 4 hardest Waits See http://perfvision.com for more info
Copyright 2006 Kyle Hailey
#.105
10g v$active_session_history
Best source 10g only Data exists since v7
Can simulate v$active_session_history
Copyright 2006 Kyle Hailey
#.106
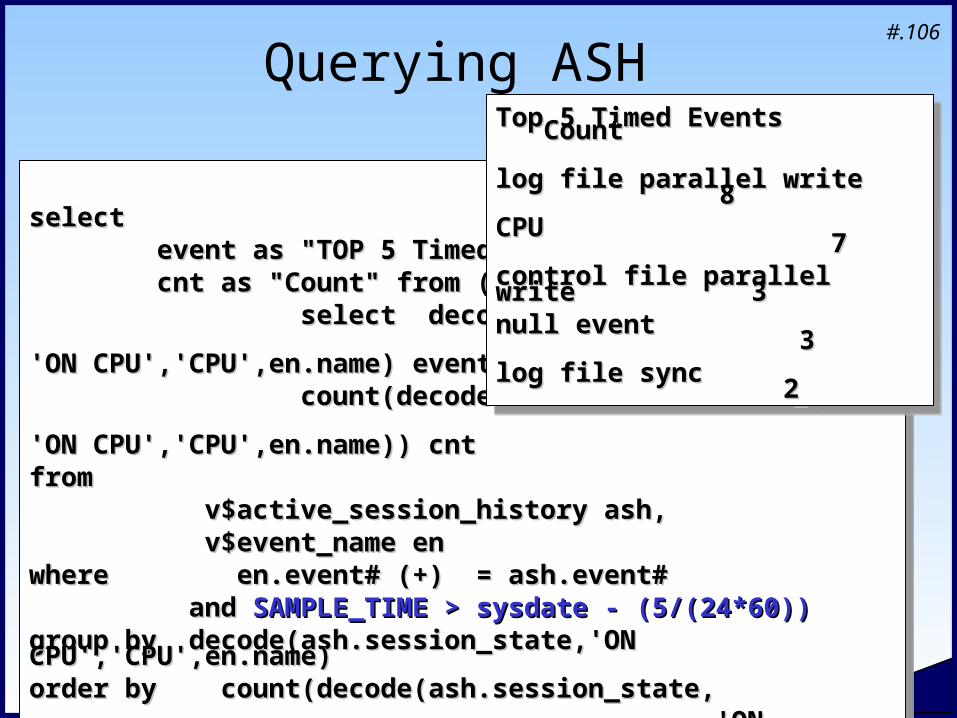
Querying ASH
select select event as "TOP 5 Timed Events", event as "TOP 5 Timed Events", cnt as "Count" from (cnt as "Count" from ( select decode(ash.session_state,select decode(ash.session_state, 'ON CPU','CPU',en.name) event ,'ON CPU','CPU',en.name) event , count(decode(ash.session_state,count(decode(ash.session_state, 'ON CPU','CPU',en.name)) cnt'ON CPU','CPU',en.name)) cntfrom from v$active_session_history ash,v$active_session_history ash, v$event_name env$event_name enwhere en.event# (+) = ash.event# where en.event# (+) = ash.event# and and SAMPLE_TIME > sysdate - (5/(24*60)) SAMPLE_TIME > sysdate - (5/(24*60)) group by decode(ash.session_state,'ON CPU','CPU',en.name)group by decode(ash.session_state,'ON CPU','CPU',en.name)order by count(decode(ash.session_state,order by count(decode(ash.session_state, 'ON CPU','CPU',en.name)) desc'ON CPU','CPU',en.name)) desc) where rownum < 6;) where rownum < 6;
select select event as "TOP 5 Timed Events", event as "TOP 5 Timed Events", cnt as "Count" from (cnt as "Count" from ( select decode(ash.session_state,select decode(ash.session_state, 'ON CPU','CPU',en.name) event ,'ON CPU','CPU',en.name) event , count(decode(ash.session_state,count(decode(ash.session_state, 'ON CPU','CPU',en.name)) cnt'ON CPU','CPU',en.name)) cntfrom from v$active_session_history ash,v$active_session_history ash, v$event_name env$event_name enwhere en.event# (+) = ash.event# where en.event# (+) = ash.event# and and SAMPLE_TIME > sysdate - (5/(24*60)) SAMPLE_TIME > sysdate - (5/(24*60)) group by decode(ash.session_state,'ON CPU','CPU',en.name)group by decode(ash.session_state,'ON CPU','CPU',en.name)order by count(decode(ash.session_state,order by count(decode(ash.session_state, 'ON CPU','CPU',en.name)) desc'ON CPU','CPU',en.name)) desc) where rownum < 6;) where rownum < 6;
Top 5 Timed Events CountTop 5 Timed Events Count
------------------------------------ --------------------------------------------- ---------
log file parallel write 8log file parallel write 8CPU 7CPU 7control file parallel write 3control file parallel write 3null event 3null event 3log file sync 2log file sync 2
Copyright 2006 Kyle Hailey
#.107
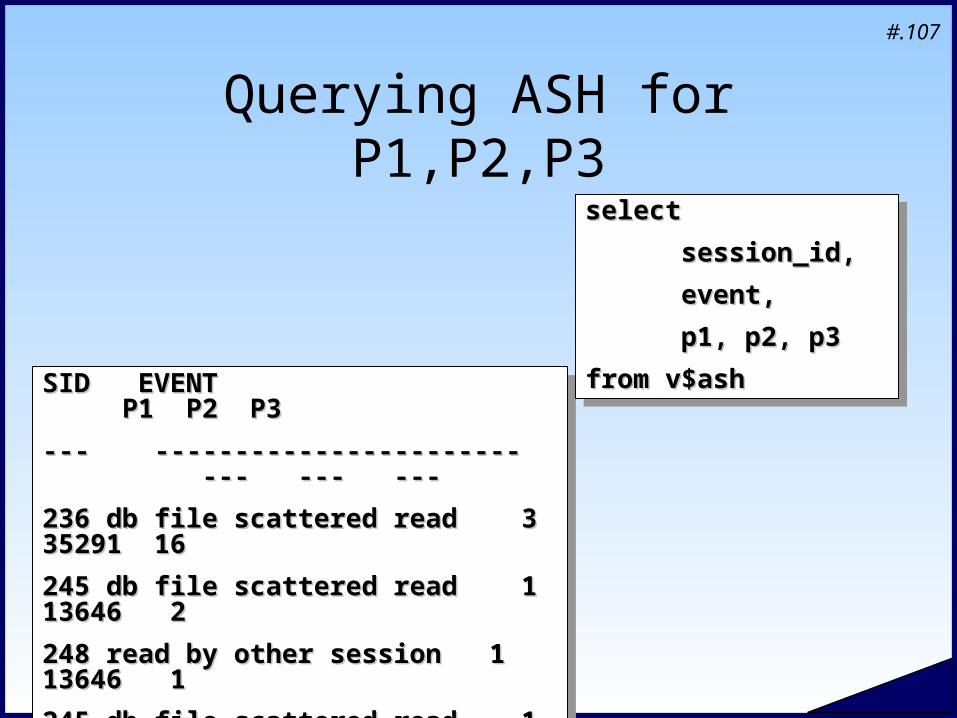
Querying ASH for P1,P2,P3
SID EVENT P1 P2 P3SID EVENT P1 P2 P3
--- ----------------------- --- --- ------ ----------------------- --- --- ---
236 db file scattered read 3 35291 16236 db file scattered read 3 35291 16
245 db file scattered read 1 13646 2245 db file scattered read 1 13646 2
248 read by other session 1 13646 1248 read by other session 1 13646 1
245 db file scattered read 1 8457 7245 db file scattered read 1 8457 7
248 db file scattered read 1 42226 8248 db file scattered read 1 42226 8
245 db file sequential read 1 13591 1245 db file sequential read 1 13591 1
select select
session_id, session_id,
event,event,
p1, p2, p3p1, p2, p3
from v$ashfrom v$ash
select select
session_id, session_id,
event,event,
p1, p2, p3p1, p2, p3
from v$ashfrom v$ash
Copyright 2006 Kyle Hailey
#.108
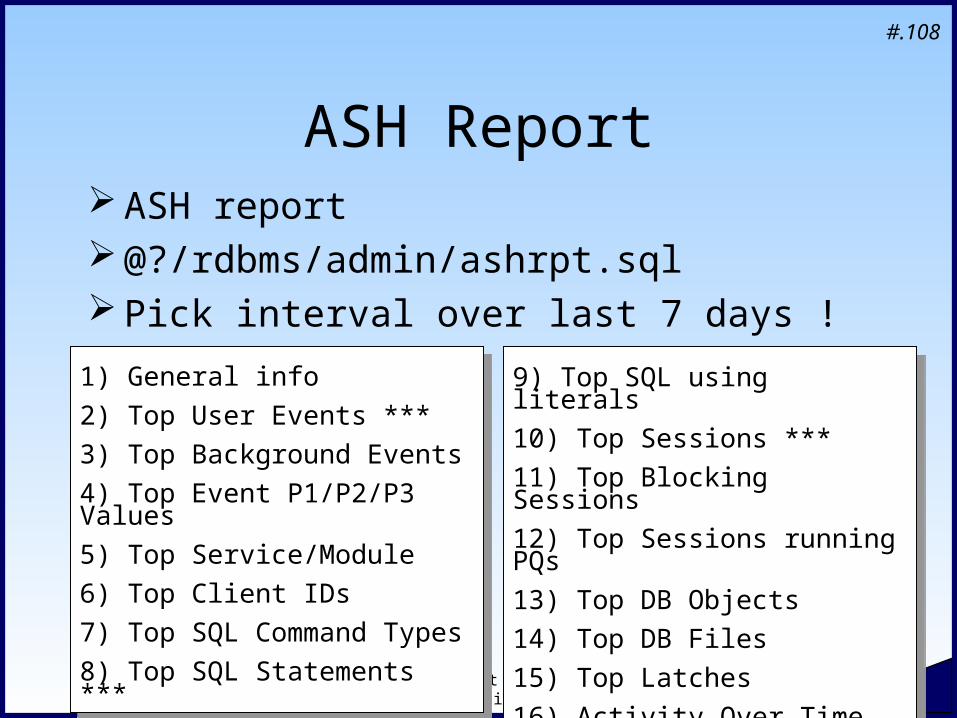
ASH Report ASH report @?/rdbms/admin/ashrpt.sql Pick interval over last 7 days !
1) General info
2) Top User Events ***
3) Top Background Events
4) Top Event P1/P2/P3 Values
5) Top Service/Module
6) Top Client IDs
7) Top SQL Command Types
8) Top SQL Statements ***
1) General info
2) Top User Events ***
3) Top Background Events
4) Top Event P1/P2/P3 Values
5) Top Service/Module
6) Top Client IDs
7) Top SQL Command Types
8) Top SQL Statements ***
9) Top SQL using literals
10) Top Sessions ***
11) Top Blocking Sessions
12) Top Sessions running PQs
13) Top DB Objects
14) Top DB Files
15) Top Latches
16) Activity Over Time ***
9) Top SQL using literals
10) Top Sessions ***
11) Top Blocking Sessions
12) Top Sessions running PQs
13) Top DB Objects
14) Top DB Files
15) Top Latches
16) Activity Over Time ***
Copyright 2006 Kyle Hailey
#.109
V$session_wait
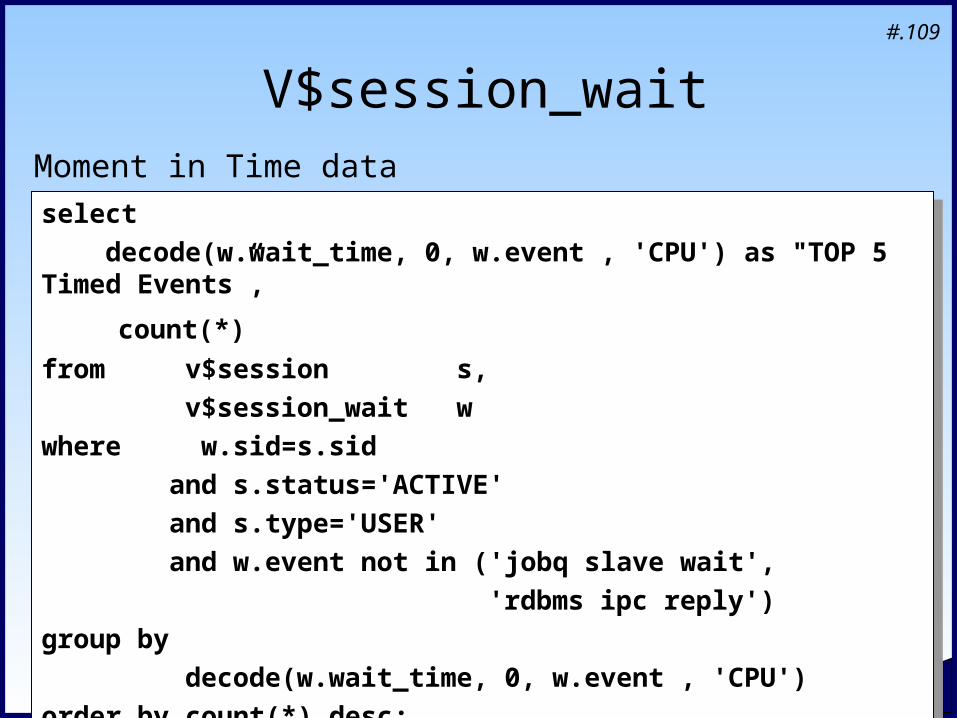
select
decode(w.wait_time, 0, w.event , 'CPU') as "TOP 5 Timed Events”,
count(*) from v$session s,
v$session_wait w
where w.sid=s.sid
and s.status='ACTIVE'
and s.type='USER'
and w.event not in ('jobq slave wait',
'rdbms ipc reply')
group by
decode(w.wait_time, 0, w.event , 'CPU')
order by count(*) desc;
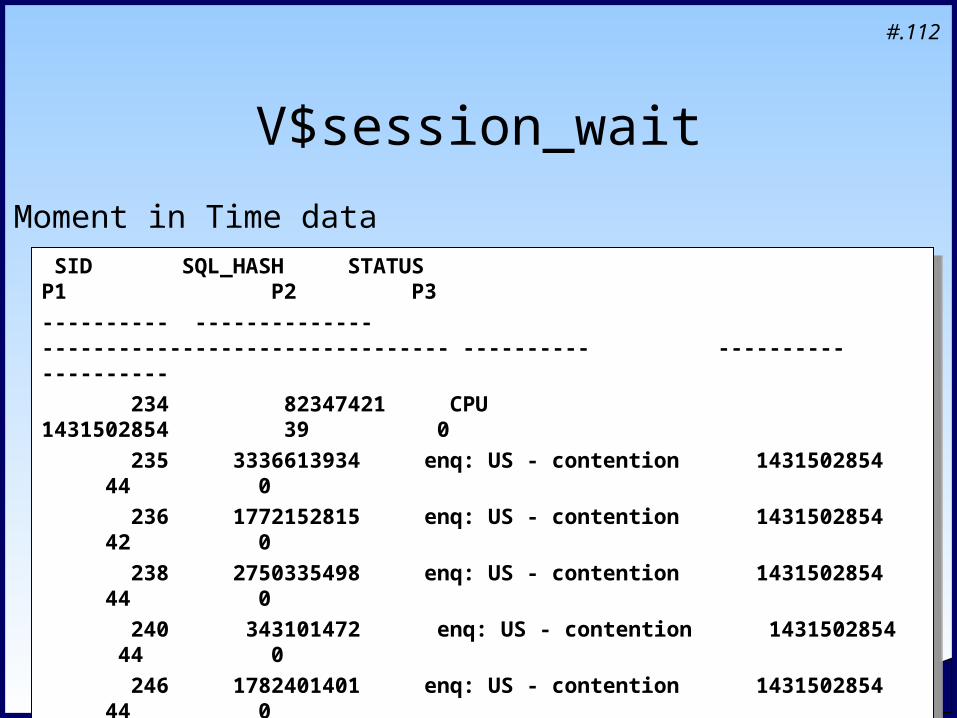
Moment in Time data
Copyright 2006 Kyle Hailey
#.110
V$session_wait
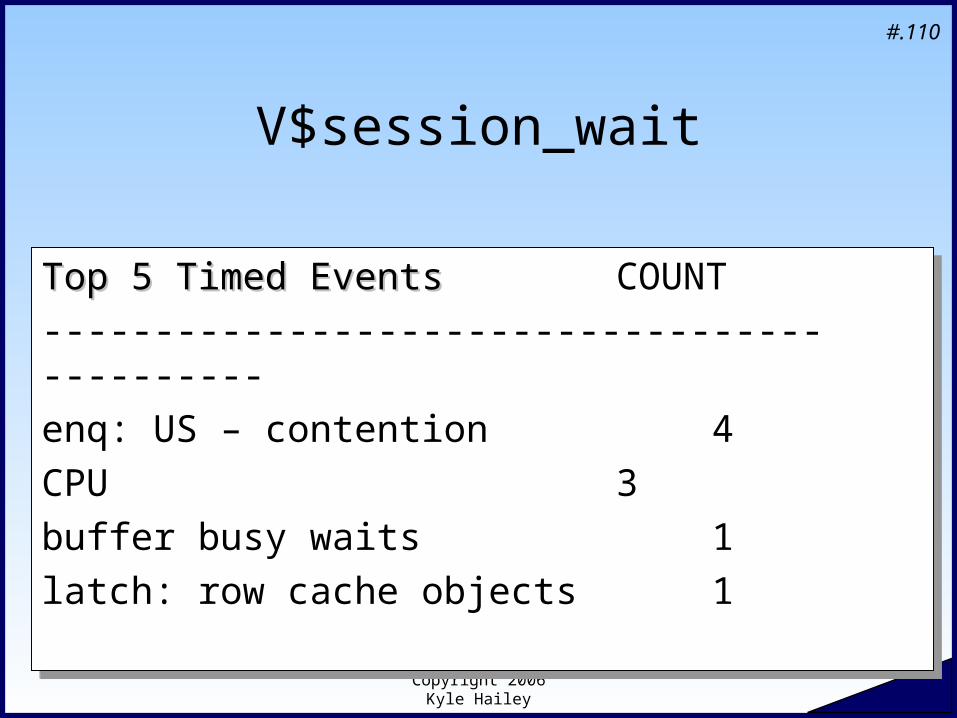
Top 5 Timed Events Top 5 Timed Events COUNT
----------------------------------- ----------
enq: US – contention 4
CPU 3
buffer busy waits 1
latch: row cache objects 1
Top 5 Timed Events Top 5 Timed Events COUNT
----------------------------------- ----------
enq: US – contention 4
CPU 3
buffer busy waits 1
latch: row cache objects 1
Copyright 2006 Kyle Hailey
#.111
V$session_wait
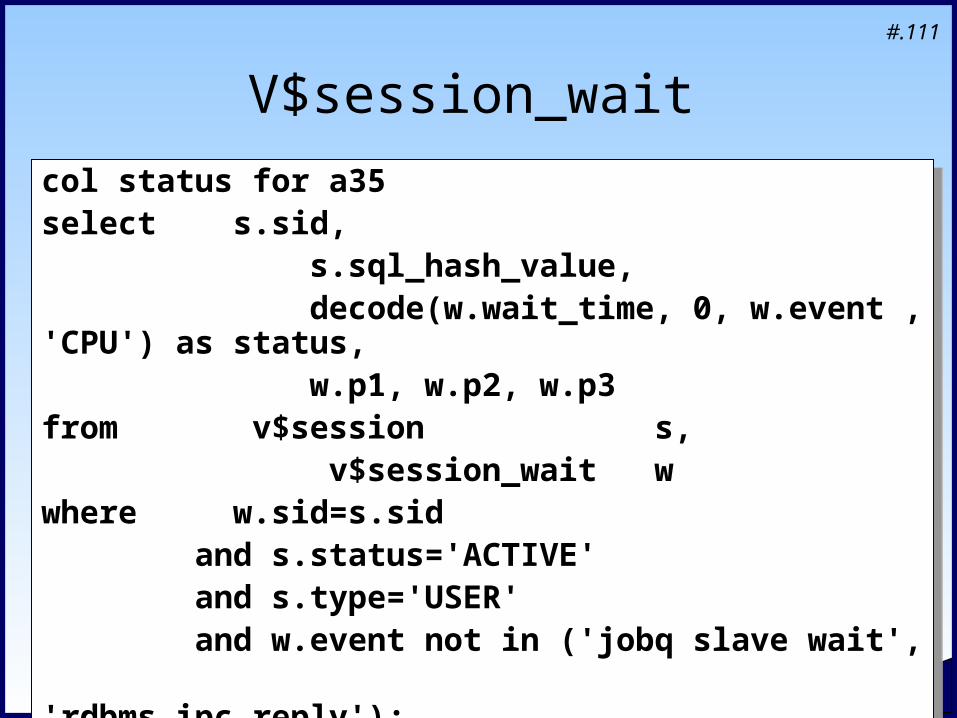
col status for a35 select s.sid, s.sql_hash_value, decode(w.wait_time, 0, w.event , 'CPU') as status, w.p1, w.p2, w.p3from v$session s, v$session_wait w where w.sid=s.sid and s.status='ACTIVE' and s.type='USER' and w.event not in ('jobq slave wait', 'rdbms ipc reply');
col status for a35 select s.sid, s.sql_hash_value, decode(w.wait_time, 0, w.event , 'CPU') as status, w.p1, w.p2, w.p3from v$session s, v$session_wait w where w.sid=s.sid and s.status='ACTIVE' and s.type='USER' and w.event not in ('jobq slave wait', 'rdbms ipc reply');
Copyright 2006 Kyle Hailey
#.112
V$session_wait
SID SQL_HASH STATUS P1 P2 P3
---------- -------------- -------------------------------- ---------- ---------- ----------
234 82347421 CPU 1431502854 39 0
235 3336613934 enq: US - contention 1431502854 44 0
236 1772152815 enq: US - contention 1431502854 42 0
238 2750335498 enq: US - contention 1431502854 44 0
240 343101472 enq: US - contention 1431502854 44 0
246 1782401401 enq: US - contention 1431502854 44 0
248 3333220954 CPU 1650815232 1 0
252 323960517 enq: US - contention 1431502854 44 0
260 1272059733 CPU 1431502854 44 0
Moment in Time data
Copyright 2006 Kyle Hailey
#.113
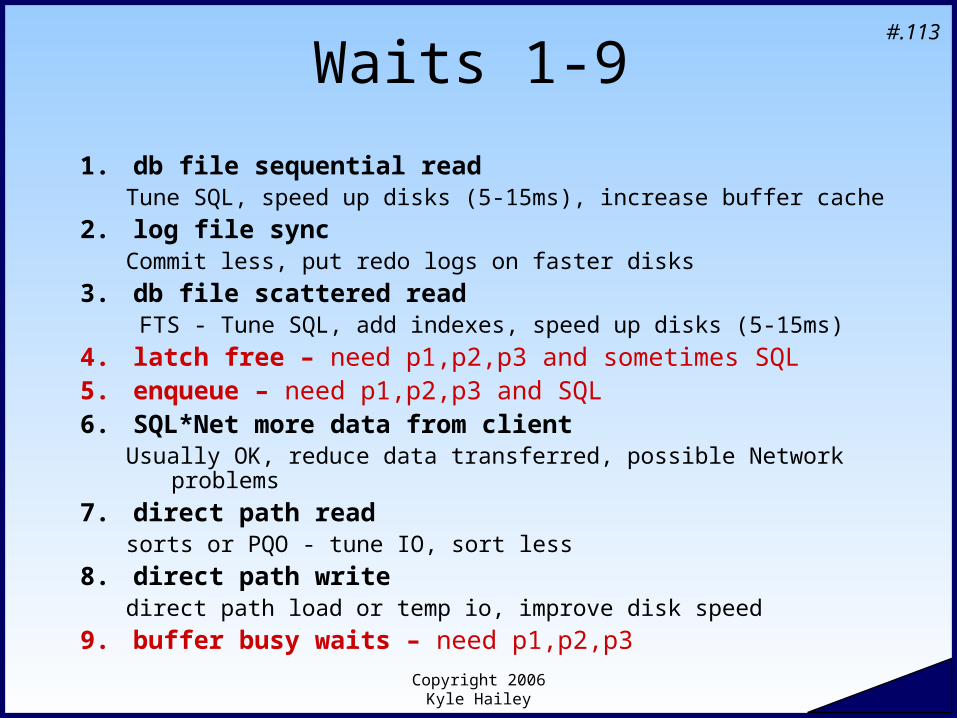
Waits 1-9
1. db file sequential readTune SQL, speed up disks (5-15ms), increase buffer cache
2. log file syncCommit less, put redo logs on faster disks
3. db file scattered read FTS - Tune SQL, add indexes, speed up disks (5-15ms)
4. latch free – need p1,p2,p3 and sometimes SQL5. enqueue – need p1,p2,p3 and SQL6. SQL*Net more data from client
Usually OK, reduce data transferred, possible Network problems
7. direct path readsorts or PQO - tune IO, sort less
8. direct path writedirect path load or temp io, improve disk speed
9. buffer busy waits – need p1,p2,p3
Copyright 2006 Kyle Hailey
#.114
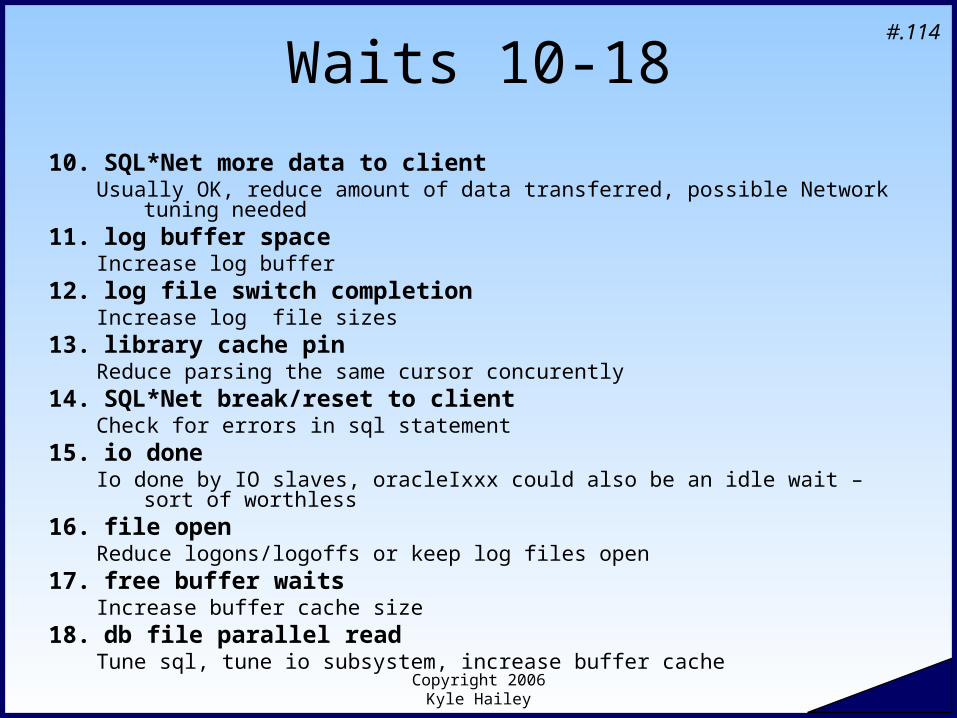
Waits 10-18
10. SQL*Net more data to clientUsually OK, reduce amount of data transferred, possible Network tuning needed
11. log buffer spaceIncrease log buffer
12. log file switch completionIncrease log file sizes
13. library cache pinReduce parsing the same cursor concurently
14. SQL*Net break/reset to clientCheck for errors in sql statement
15. io doneIo done by IO slaves, oracleIxxx could also be an idle wait – sort of worthless
16. file openReduce logons/logoffs or keep log files open
17. free buffer waitsIncrease buffer cache size
18. db file parallel readTune sql, tune io subsystem, increase buffer cache
Copyright 2006 Kyle Hailey
#.115
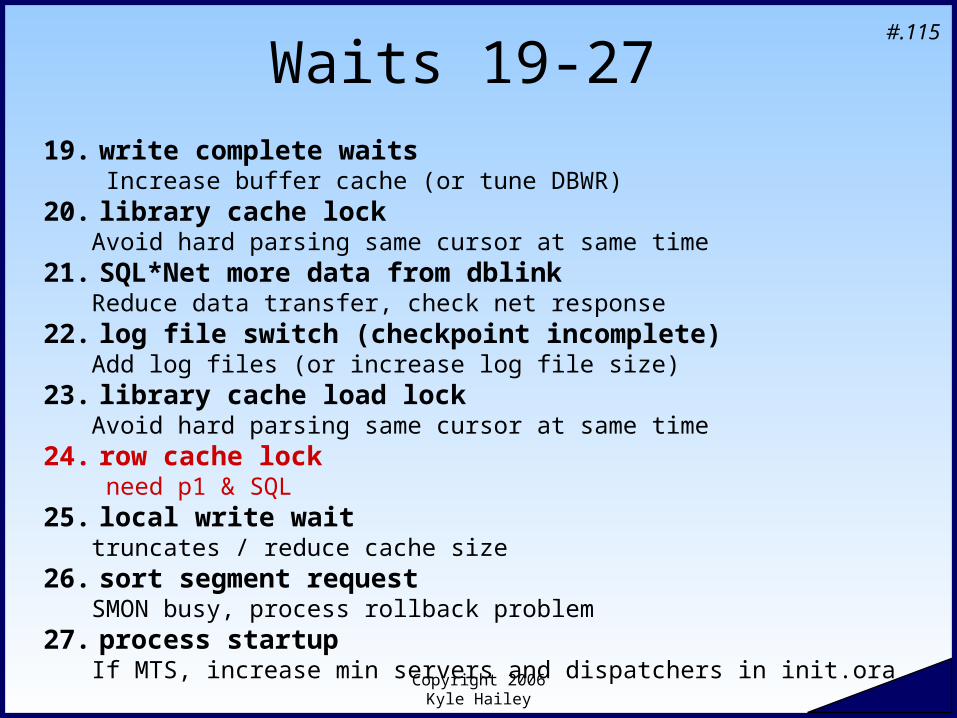
Waits 19-2719. write complete waits
Increase buffer cache (or tune DBWR)20. library cache lock
Avoid hard parsing same cursor at same time21. SQL*Net more data from dblink
Reduce data transfer, check net response22. log file switch (checkpoint incomplete)
Add log files (or increase log file size)23. library cache load lock
Avoid hard parsing same cursor at same time24. row cache lock
need p1 & SQL25. local write wait
truncates / reduce cache size26. sort segment request
SMON busy, process rollback problem27. process startup
If MTS, increase min servers and dispatchers in init.ora
Copyright 2006 Kyle Hailey
#.116
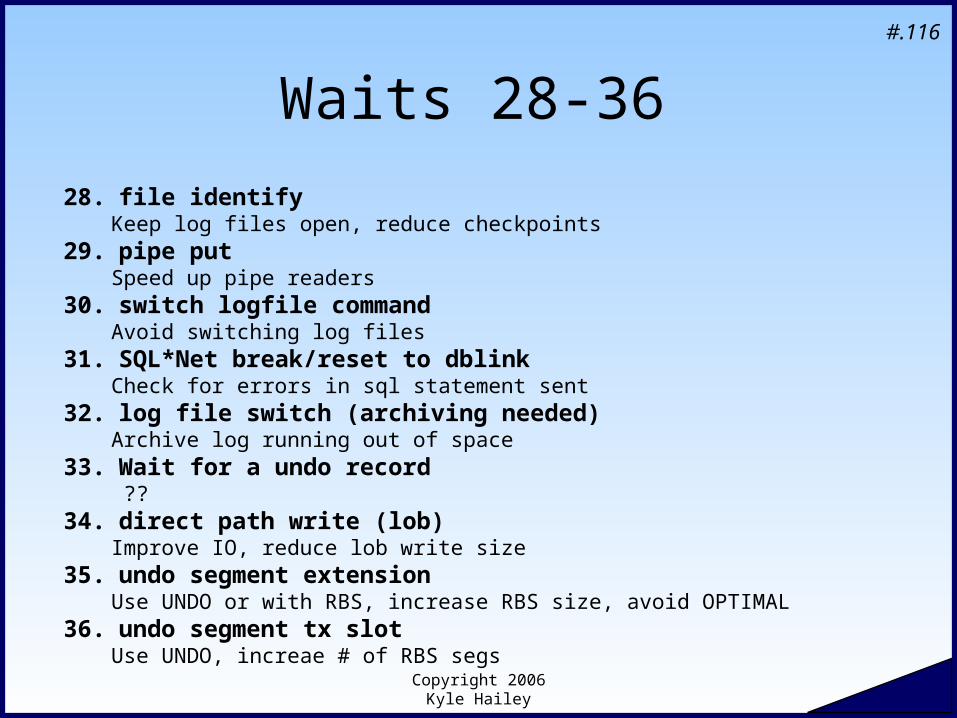
Waits 28-36
28. file identifyKeep log files open, reduce checkpoints
29. pipe putSpeed up pipe readers
30. switch logfile commandAvoid switching log files
31. SQL*Net break/reset to dblinkCheck for errors in sql statement sent
32. log file switch (archiving needed)Archive log running out of space
33. Wait for a undo record ??
34. direct path write (lob)Improve IO, reduce lob write size
35. undo segment extensionUse UNDO or with RBS, increase RBS size, avoid OPTIMAL
36. undo segment tx slotUse UNDO, increae # of RBS segs
Copyright 2006 Kyle Hailey
#.117
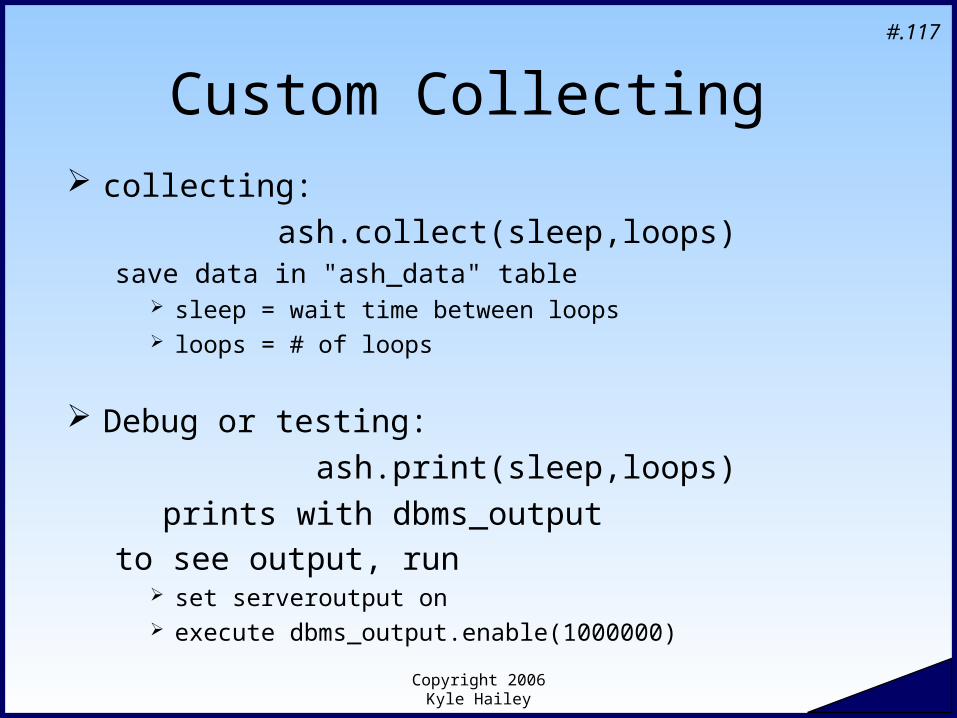
Custom Collecting collecting:
ash.collect(sleep,loops)save data in "ash_data" table
sleep = wait time between loops loops = # of loops
Debug or testing:
ash.print(sleep,loops)
prints with dbms_output
to see output, run set serveroutput on execute dbms_output.enable(1000000)
Copyright 2006 Kyle Hailey
#.118
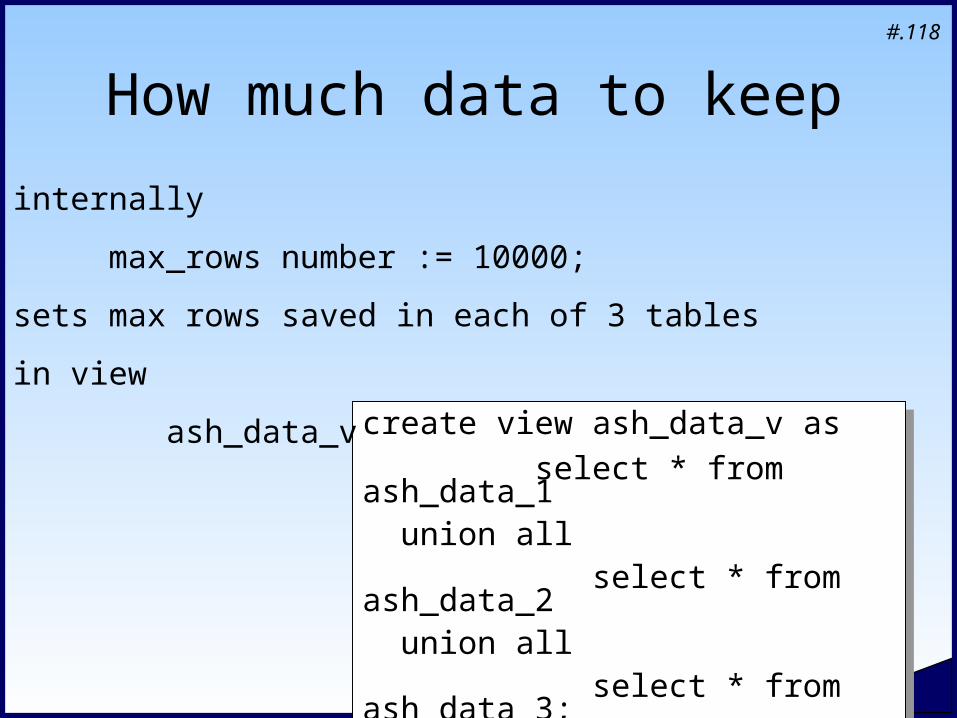
How much data to keep
create view ash_data_v as
select * from ash_data_1 union all select * from ash_data_2 union all select * from ash_data_3;
create view ash_data_v as
select * from ash_data_1 union all select * from ash_data_2 union all select * from ash_data_3;
internally
max_rows number := 10000;
sets max rows saved in each of 3 tables
in view
ash_data_v
Copyright 2006 Kyle Hailey
#.119
Sampling ASH Data
Foreground and Background Waiting and CPU Mimics main Fields of ASH
Copyright 2006 Kyle Hailey
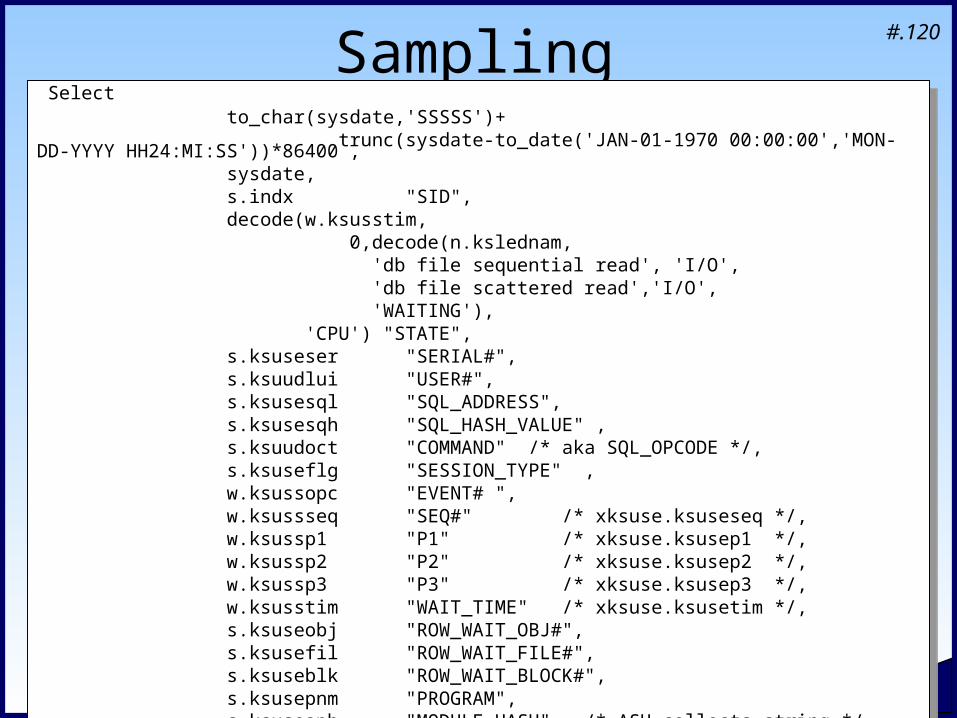
#.120Sampling Select to_char(sysdate,'SSSSS')+ trunc(sysdate-to_date('JAN-01-1970 00:00:00','MON-DD-YYYY HH24:MI:SS'))*86400 , sysdate, s.indx "SID", decode(w.ksusstim, 0,decode(n.kslednam, 'db file sequential read', 'I/O', 'db file scattered read','I/O', 'WAITING'), 'CPU') "STATE", s.ksuseser "SERIAL#", s.ksuudlui "USER#", s.ksusesql "SQL_ADDRESS", s.ksusesqh "SQL_HASH_VALUE" , s.ksuudoct "COMMAND" /* aka SQL_OPCODE */, s.ksuseflg "SESSION_TYPE" , w.ksussopc "EVENT# ", w.ksussseq "SEQ#" /* xksuse.ksuseseq */, w.ksussp1 "P1" /* xksuse.ksusep1 */, w.ksussp2 "P2" /* xksuse.ksusep2 */, w.ksussp3 "P3" /* xksuse.ksusep3 */, w.ksusstim "WAIT_TIME" /* xksuse.ksusetim */, s.ksuseobj "ROW_WAIT_OBJ#", s.ksusefil "ROW_WAIT_FILE#", s.ksuseblk "ROW_WAIT_BLOCK#", s.ksusepnm "PROGRAM", s.ksuseaph "MODULE_HASH", /* ASH collects string */ s.ksuseach "ACTION_HASH" /* ASH collects string */
Select to_char(sysdate,'SSSSS')+ trunc(sysdate-to_date('JAN-01-1970 00:00:00','MON-DD-YYYY HH24:MI:SS'))*86400 , sysdate, s.indx "SID", decode(w.ksusstim, 0,decode(n.kslednam, 'db file sequential read', 'I/O', 'db file scattered read','I/O', 'WAITING'), 'CPU') "STATE", s.ksuseser "SERIAL#", s.ksuudlui "USER#", s.ksusesql "SQL_ADDRESS", s.ksusesqh "SQL_HASH_VALUE" , s.ksuudoct "COMMAND" /* aka SQL_OPCODE */, s.ksuseflg "SESSION_TYPE" , w.ksussopc "EVENT# ", w.ksussseq "SEQ#" /* xksuse.ksuseseq */, w.ksussp1 "P1" /* xksuse.ksusep1 */, w.ksussp2 "P2" /* xksuse.ksusep2 */, w.ksussp3 "P3" /* xksuse.ksusep3 */, w.ksusstim "WAIT_TIME" /* xksuse.ksusetim */, s.ksuseobj "ROW_WAIT_OBJ#", s.ksusefil "ROW_WAIT_FILE#", s.ksuseblk "ROW_WAIT_BLOCK#", s.ksusepnm "PROGRAM", s.ksuseaph "MODULE_HASH", /* ASH collects string */ s.ksuseach "ACTION_HASH" /* ASH collects string */
Copyright 2006 Kyle Hailey
#.121
Samplingfrom
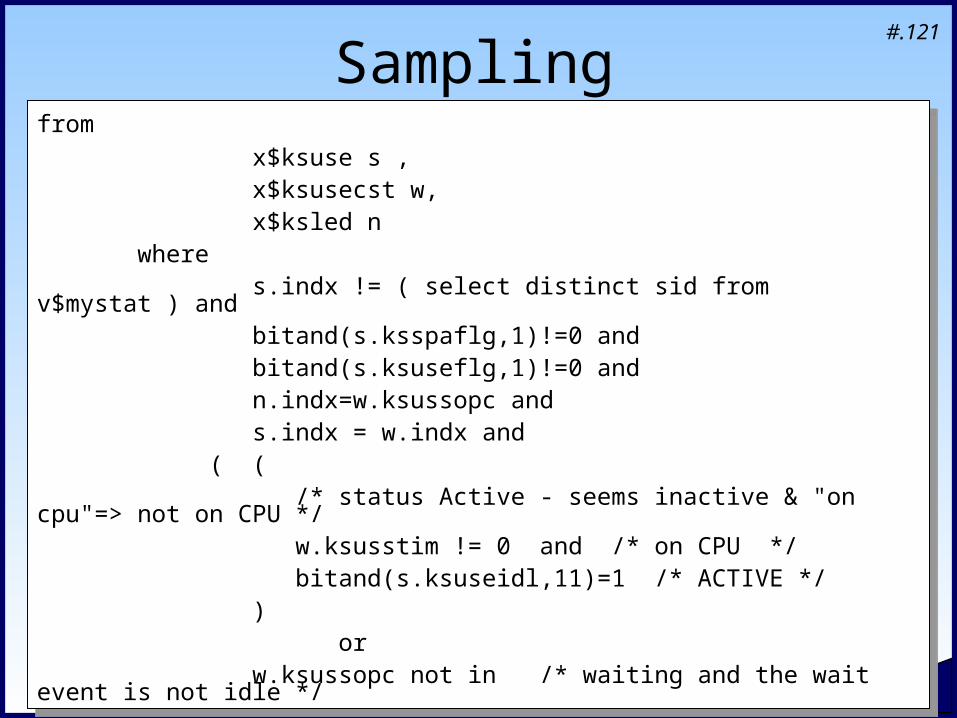
x$ksuse s , x$ksusecst w, x$ksled n where s.indx != ( select distinct sid from v$mystat ) and bitand(s.ksspaflg,1)!=0 and bitand(s.ksuseflg,1)!=0 and n.indx=w.ksussopc and s.indx = w.indx and ( ( /* status Active - seems inactive & "on cpu"=> not on CPU */ w.ksusstim != 0 and /* on CPU */ bitand(s.ksuseidl,11)=1 /* ACTIVE */ ) or w.ksussopc not in /* waiting and the wait event is not idle */
from
x$ksuse s , x$ksusecst w, x$ksled n where s.indx != ( select distinct sid from v$mystat ) and bitand(s.ksspaflg,1)!=0 and bitand(s.ksuseflg,1)!=0 and n.indx=w.ksussopc and s.indx = w.indx and ( ( /* status Active - seems inactive & "on cpu"=> not on CPU */ w.ksusstim != 0 and /* on CPU */ bitand(s.ksuseidl,11)=1 /* ACTIVE */ ) or w.ksussopc not in /* waiting and the wait event is not idle */
Copyright 2006 Kyle Hailey
#.122
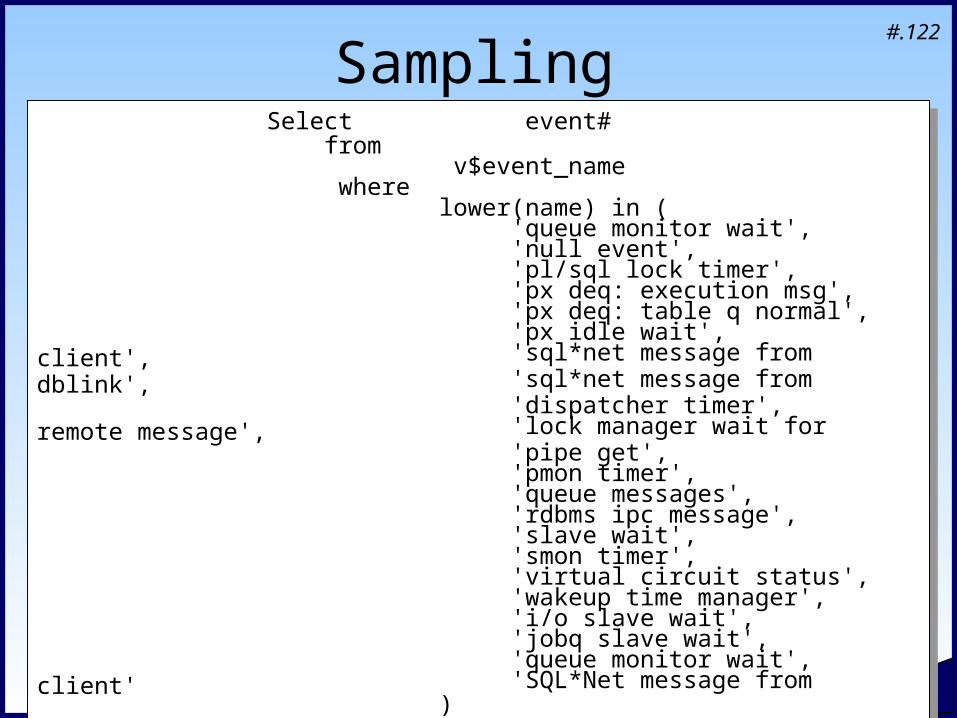
Sampling Select event# from v$event_name where lower(name) in ( 'queue monitor wait', 'null event', 'pl/sql lock timer', 'px deq: execution msg', 'px deq: table q normal', 'px idle wait', 'sql*net message from client', 'sql*net message from dblink', 'dispatcher timer', 'lock manager wait for remote message', 'pipe get', 'pmon timer', 'queue messages', 'rdbms ipc message', 'slave wait', 'smon timer', 'virtual circuit status', 'wakeup time manager', 'i/o slave wait', 'jobq slave wait', 'queue monitor wait', 'SQL*Net message from client' ) )
Select event# from v$event_name where lower(name) in ( 'queue monitor wait', 'null event', 'pl/sql lock timer', 'px deq: execution msg', 'px deq: table q normal', 'px idle wait', 'sql*net message from client', 'sql*net message from dblink', 'dispatcher timer', 'lock manager wait for remote message', 'pipe get', 'pmon timer', 'queue messages', 'rdbms ipc message', 'slave wait', 'smon timer', 'virtual circuit status', 'wakeup time manager', 'i/o slave wait', 'jobq slave wait', 'queue monitor wait', 'SQL*Net message from client' ) )

Copyright 2006 Kyle Hailey
#.123