Embed Size (px)
Citation preview

WAITING FOR THE GREEN LIGHT: TRANSPORT SOLUTIONS TO CLIMATE CHANGE
CLIMATECOUNCIL.ORG.AU

The Climate Council is an independent, crowd-funded organisation
providing quality information on climate change to the Australian public.
Thank you for supporting the Climate Council.
twitter.com/climatecouncil
facebook.com/climatecouncil [email protected]
climatecouncil.org.au
Published by the Climate Council of Australia Limited
ISBN: 978-1-925573-69-5 (print) 978-1-925573-68-8 (digital)
© Climate Council of Australia Ltd 2018
This work is copyright the Climate Council of Australia Ltd. All material contained in this work is copyright the Climate Council of Australia Ltd except where a third party source is indicated.
Climate Council of Australia Ltd copyright material is licensed under the Creative Commons Attribution 3.0 Australia License. To view a copy of this license visit http://creativecommons.org.au.
You are free to copy, communicate and adapt the Climate Council of Australia Ltd copyright material so long as you attribute the Climate Council of Australia Ltd and the authors in the following manner:
Waiting for the Green Light: Transport Solutions to Climate Change. Authors: Petra Stock, Professor Will Steffen, Greg Bourne and Louis Brailsford.
— Cover image: Photo by chuttersnap on Unsplash.
This report is printed on 100% recycled paper.

PrefaceThis report marks the beginning of a new flagship project for the Climate Council aimed at cutting greenhouse gas pollution levels from the transport sector - Australia’s second largest source of greenhouse gas pollution.
Australia’s greenhouse gas emissions are rising and are projected to continue increasing in
the absence of credible and comprehensive climate and energy policy tackling all key sectors:
electricity, transport, stationary energy, agriculture, fugitive emissions, industrial processes,
waste and land use.
There has been considerable public discussion in Australia surrounding the need to transition
the electricity sector away from polluting, ageing and inefficient coal and gas generation to
clean, affordable and reliable renewable power and storage. There are now many policies and
programs at the federal, state and local levels designed to drive greater uptake of renewable
energy. While more still needs to be done to continue cutting greenhouse gas pollution levels
in the electricity sector, there is an urgent need to start addressing pollution from other sectors,
particularly transport, the nation’s next largest polluter.
Australia’s transport emissions or transport greenhouse gas pollution levels have been steadily
rising and are projected to continue going up. Factors such as population growth have led to
a higher number of cars on the road, while increased demand for freight is also driving up
truck emissions. Domestic air travel continues to increase, leading to an increase in aviation
emissions (Australian Government 2017).
Solutions are readily available to cut rising greenhouse gas pollution levels from the transport
sector. These include introducing vehicle emissions standards, planning for and investing in
infrastructure to enable more people to walk, cycle and use public transport, powering cars,
buses and rail with renewable energy, along with increasing the uptake of electric vehicles.
However, Australia needs federal, state and local policies and investment to set us on the right
path to do so.
We would like to thank Dr John Stone, Prof Peter Newman, Dr Graham Sinden (EY), Marion
Terrill (Grattan Institute) and Tony Morton (President of the Public Transport Users Association)
for kindly reviewing the report.
Authors
Greg BourneClimate Councillor
Louis BrailsfordResearcher
Professor Will SteffenClimate Councillor
Petra StockSenior Energy and Climate Solutions Analyst

II
Key Findings
1Transport is Australia’s second largest source of greenhouse gas pollution (after electricity).
› Australia’s transport related
greenhouse gas pollution levels
increased 3.4% in the year to
December 2017.
› Road based transport accounts
for an even greater share of
transport pollution in Australia
than the global average, at
around 85%.
› Cars and light commercial
vehicles alone make up over
60% of Australia’s transport
pollution levels.
› Greenhouse gas pollution levels
from transport are projected
to continue rising to 2030 and
beyond, reaching 112 MtCO2e
in 2030, a further 12% above
current levels.
2Global transport pollution levels are rising by around 2.5% each year. Without action they are expected to double by 2050.
› The transport sector contributes
14% of total global greenhouse
gas pollution annually.
› Road related transport -
motorcycles, cars, trucks and
buses - make up about three
quarters of global transport
greenhouse gas pollution levels.
› An international scorecard for
transport energy efficiency
ranked Australia third highest
for car distance travelled per
capita on an annual basis
(8,853 kilometres per person),
after the United States (highest,
14,724 kilometres per person)
and Canada (second highest,
8,864 kilometres per person).
Australia lags behind Russia,
Mexico and Indonesia on
transport efficiency.
3Congestion is a $16 billion dollar handbrake on the productivity of Australian cities.
› Congestion in Australia costs
the economy more than $16
billion per year - measured in
lost private and business time,
vehicle costs and air pollution.
This figure is expected to rise.
› Demand and congestion on
Australian roads will continue
to soar as city populations
rise. Investing in better public
transport infrastructure is a
proven means of alleviating
congestion.
› Population growth in Australian
cities is driving increased
demand for public transport.
Infrastructure Australia
forecasts an 89% increase in
demand for public transport
between 2011 and 2031.
› Federal and state governments
can play a major role in
encouraging more people to use
public transport through both
investing in infrastructure as
well as running more frequent
public transport services on
existing routes.
II WAITING FOR THE GREEN LIGHT:
TRANSPORT SOLUTIONS TO CLIMATE CHANGE

KEY FINDINGS III
4Nearly 9 out of 10 Australians travel to work, school or university by car.
› On average, one in three
cars on the road during the
morning peak are people
making their way to work.
› Nearly 87% of Australian
commuters travel to work
by car with a much smaller
proportion taking public
transport (5%), walking (5%)
and riding a bicycle (1%).
› The average Australian
household spends seven times
more on transport (over $11,000
per year) than electricity
(around $1,500 per year).
› A study of Sydney transport
costs to the taxpayer found
cars to be the most expensive
mode of travel costing society
86c for every passenger
kilometre, compared with rail
(the cheapest) at 47c and buses
at 57c.
5Australia is one of just a handful of Organisation for Economic Co-operation and Development (OECD) countries without greenhouse gas emissions standards for vehicles, and lacks credible national policy to tackle transport emissions.
› Mandatory vehicle emissions
standards need to be
introduced soon to enable
Australia to prevent emissions
of up to 65 MtCO2 by 2030
(significantly more greenhouse
gas pollution than what New
South Wales’ entire coal fleet
produces in a year).
› To tackle climate change,
Australia needs to rapidly roll out
a fleet of sustainable transport
solutions like high quality
public transport, cycling and
walking infrastructure as well
as renewable powered vehicles
in the form of electric bicycles,
cars, trains, trams and buses.
› By 2025, an electric car is
anticipated to be similar in
terms of upfront cost compared
to a conventional (petrol or
diesel) vehicle.
› In Australia, the adoption of
electric vehicles is being held
back by the lack of policy
support or incentives, higher
upfront cost, lack of choice
of available electric vehicles
for sale in Australia, and the
availability of public vehicle
charging infrastructure.
III
climatecouncil.org.au

Iv
Recommendations for policy makers
1Federal, State and Territory governments to
set targets for zero emissions, fossil fuel free
transport well before 2050. Develop a climate
and transport policy and implementation plan
to achieve these targets.
2Ensure cost benefit analyses for all transport
project business cases account for the additional
greenhouse gas pollution that projects will lock
in over their lifetime, or pollution avoided (e.g.
from public transport improvements).
3Establish mode shift targets for public transport,
cycling and walking.
4Ensure that at least 50% of all Federal, State and
Territory Government transport infrastructure
spending is directed to public and active (e.g.
walking and cycling) transport.
5Federal, State and Territory governments to introduce
targets to drive uptake of electric buses, trucks, cars
and bicycles powered by renewables. Electric vehicle
targets can be established for specific sectors and
government operations, including:
› State and territory public transport systems.
› Federal, state and territory government vehicle
fleet purchases.
Iv WAITING FOR THE GREEN LIGHT:
TRANSPORT SOLUTIONS TO CLIMATE CHANGE

vRECOMMENDATIONS FOR POLICY MAKERS
6State and Territory Governments to contract
additional 100% renewable energy to power public
transport systems (trains, light rail and buses).
7Federal Government to introduce strong vehicle
greenhouse gas emissions standards. State and
Territory Governments to advocate for vehicle
emissions standards through the Council
of Australian Government’s Transport and
Infrastructure Council.
8Federal, State and Territory governments to
encourage the rollout of 100% renewable powered
electric vehicle charging, particularly in regional
areas and interstate routes.
9Put a price on pollution. Consider policies or
pricing which better reflects the cost of greenhouse
gas pollution, so that road or public transport users
bear the cost, or reap economic benefits based
on emissions associated with their chosen travel
mode. End government subsidies, incentives and
support for fossil fuel use in the transport sector.
v
climatecouncil.org.au
ContentsPreface ................................................................................................................................................................................................ i
Key Findings .................................................................................................................................................................................... ii
Recommendations for policy makers ..................................................................................................................................... iv
1. Introduction ..............................................................................................................................................................................1
2. Transport and climate change ........................................................................................................................................... 3
3. Transport emissions: How does Australia compare? .................................................................................................. 8
3.1 Australian cars pollute more 10
3.2 Australians depend heavily on cars to get around 12
3.3 Low use and limited access to public transport in Australian cities 13
4. Pressures on and impacts from transport in Australian cities ...............................................................................14
4.1 Population growth placing pressure on transport systems 15
4.2 Congested roads 16
4.3 Increasing demand for public transport systems 18
4.4 Health and wellbeing impacts from transport choices 23
4.5 Urban air pollution and noise 25
4.6 The cost of transport 26
5. Transport climate solutions .............................................................................................................................................. 27
5.1 Increasing public transport use to move more people with less pollution 30
5.2 Walkable, cyclable cities 36
5.3 Renewable powered electric vehicles 37
5.4 Policies, standards and targets 42
6. Case studies............................................................................................................................................................................ 43
6.1 Australia 43
6.2 International 48
7. Conclusion ............................................................................................................................................................................. 57
References ...................................................................................................................................................................................... 58
Image Credits ................................................................................................................................................................................ 63
vI WAITING FOR THE GREEN LIGHT:
TRANSPORT SOLUTIONS TO CLIMATE CHANGE

CHAPTER 01
INTRODUCTION
1. IntroductionRoad and public transport systems in Australia are under increasing strain due to growing populations, the layout of our cities and suburbs, our heavy reliance on cars to get around, and in many cases the lack of suitable public transport alternatives. As the transport systems in our major cities come under pressure, some commuters and communities are experiencing negative effects such as high transport costs and travel times, congestion, overcrowding, noise, air pollution, and reduced physical activity.
Crucially, our transport systems are failing
when it comes to tackling climate change.
Transport is now Australia’s second largest
source of greenhouse gas pollution (after
electricity) and the sector has seen the
largest percentage growth (62.9%) since
1990 (Department of Environment and
Energy 2018a). Without action, transport
emissions will continue rising (Department
of Environment and Energy 2017).
Australia can do much more to reduce
greenhouse gas pollution from the
transport sector. Compared with other
countries, Australia consistently ranks at the
back of the pack when it comes to tackling
its transport emissions (ACEEE 2018). In
fact, Australia’s cars are more polluting;
our relative investment in and use of
public and active transport options is lower
than comparable countries; and we lack
credible targets, policies, or plans to reduce
greenhouse gas pollution from transport.
Action on climate change is urgent. The
world experienced its hottest five-year
period on record between 2013 and 2017,
continuing a strong, long-term upswing
in global temperatures (Climate Council
2018; NOAA 2018). Increasing global heat,
driven primarily by the burning of fossil
fuels like coal, oil and gas, is exacerbating
extreme weather events around the globe
and in Australia.
Australia is failing to tackle greenhouse gas pollution from transport; our second highest emitter.
1

Transport systems are vulnerable to
disruptions and damage from more frequent
and intense extreme weather events such
as heatwaves, storms and bushfires. For
example, on 7 January 2018, the Sydney
suburb of Penrith was recorded as the
hottest place on earth over a 24-hour period
(with temperatures reaching 47.3°C). This
extreme heat led to cancellations and delays
across the city’s public transport system
(News.com.au 2018; SMH 2018a).
Transport plans, policies and investments
made today have long-term implications
decades into the future. These impacts
include concerns over how efficiently we will
be able to move around our major cities, how
rapidly we can cut greenhouse gas pollution,
and how well our transport systems are able
to withstand the impacts of extreme weather.
To tackle climate change, Australia must
rapidly roll out a fleet of sustainable transport
solutions. These include improving the
quality, efficiency and accessibility of public
transport, cycling and walking alternatives
as well as shifting to renewable powered
vehicles in the form of electric bicycles,
cars, trains, trams and buses. Australian
governments need to develop coherent
transport and climate change policies
with the aim of lowering greenhouse gas
pollution across the sector.
Transport policies need to consider the many
factors that influence people’s transport
choices - family, work and household
circumstances, housing choices, comparative
costs, how long it takes to get from A to B and
whether the route is direct or meandering.
Fortunately, there are many transport
solutions available that can both drive down
greenhouse gas pollution levels, while also
bringing significant environmental, health
and economic benefits.
This report focuses on climate solutions to
road-based transport, as cars, commercial
vehicles, trucks and buses make up the vast
majority (85%) of Australia’s transport-related
greenhouse gas emissions. It is important
to note emissions from domestic and
international air travel are also significant and
rising, with domestic air travel alone making
up 9% of Australia’s transport emissions.
Section two of this report provides
an overview of the transport sector’s
contribution to greenhouse gas pollution
globally and in Australia. Section three
considers how Australia’s transport sector
emissions measure up compared with other
nations. Section four provides background to
some of the pressures facing Australian cities
and their transport systems. Section five
describes key climate solutions to drive down
transport emissions in Australia. Section six
highlights a range of local and international
case studies of transport climate solutions.
Greenhouse gas pollution from air travel is also significant and rising.
2 WAITING FOR THE GREEN LIGHT:
TRANSPORT SOLUTIONS TO CLIMATE CHANGE

2. Transport and climate changeGreenhouse gas pollution from transport represents a significant share of emissions both globally and in Australia, with pollution increasing year on year.
Globally, the transport sector contributes
nearly a quarter of energy-related carbon
dioxide pollution. The transport sector
contributes 14% of total global greenhouse
gas pollution annually (7.0 GtCO2 in 2010)
(IPCC 2014). Road related transport -
motorcycles, cars, trucks and buses - make
up about three quarters of global transport
emissions (The ICCT 2017).
Transport emissions are rising (Figure 1).
Worldwide transport-related emissions are
increasing by around 2.5% every year (IEA
2017b; The ICCT 2017). Without action,
transport emissions are expected to double
by 2050 (IPCC 2014; Figure 1).
In Australia, transport (18%, 100 MtCO2e) is
the second largest source of greenhouse
gas pollution after electricity (33%, 184.5
MtCO2e). Australia’s transport related
emissions increased 3.4% in the year
to December 2017 (Department of the
Environment and Energy 2018a).
Road based transport accounts for an even
greater share of transport emissions in
Australia than the global average, at around
85% (Department of the Environment and
Energy 2017). Cars and light commercial
vehicles alone make up over 60% of
Australia’s transport emissions. New
South Wales has the highest total transport
emissions of any state or territory, whereas
Western Australia has the highest transport
emissions on a per capita basis.
Australia’s transport sector adds 100 million tonnes of greenhouse gas pollution to the atmosphere every year.
3CHAPTER 02
TRANSPORT AND CLIMATE CHANGE

201020052000199519901985198019751970
Total Direct and Indirect 2.9
(Total Direct 2.8)
Total Direct and Indirect 4.9
(Total Direct 4.7)
Total Direct and Indirect 7.1
(Total Direct 7.0)
100%
Indirect Emissions from Electricity Generation
Road
Rail
Pipeline etc.
HFC & Indirect N20
GH
G E
mis
sio
ns
[GtC
O2
eq/y
r]
0
1
2
3
4
5
6
7
8
5.55%
3.26%11.66%5.71%
1.38%2.81%9.78%
5.39%
2.09%7.66%5.94%
1.12%3.45%3.34%
71.00%
72.06%
2.38%
+2.11%
1.60%
2.16%
6.52%
4.10%
9.26%
1.91%
59.85%
+2,71%
+2.83%
International Aviation
Domestic Aviation
International & Coastal Shipping
Domestic Waterborne
GLOBAL TRANSPORT EMISSIONS
Figure 1: Global transport emissions are rapidly rising.
Source: IPCC 2014.
4 WAITING FOR THE GREEN LIGHT:
TRANSPORT SOLUTIONS TO CLIMATE CHANGE

AUSTRALIA’STRANSPORT EMISSIONS
The transport sector is Australia's second largest source of greenhouse gas pollution.
WESTERN AUSTRALIA
Annual transport emissions14.5 million tonnes
Equivalent to the emissions from 6 Bluewaters Power Stations (coal)
Per capita emissions = 5.6 t CO
2/person
NORTHERN TERRITORY
Annual transport emissions1.3 million tonnes
Equivalent to the emissions from2 Channel Island Power Stations (gas)
Per capita emissions = 5.3 t CO
2/person
TASMANIA
Annual transport emissions1.7 million tonnes
Equivalent to the emissions from5 Tamar Valley Power Stations (gas)
Per capita emissions = 3.3 t CO
2/person
QUEENSLAND
Annual transport emissions22.5 million tonnes
Equivalent to the emissions from3.5 Gladstone Power Stations (coal)
Per capita emissions = 4.6 t CO
2/person
NEW SOUTH WALES
Annual transport emissions27.4 million tonnes
Equivalent to the emissions from3 Liddell Power Stations (coal)
Per capita emissions = 3.5 t CO
2/person
ACT
Annual transport emissions1.2 million tonnes
Equivalent to the emissions from0.1 Liddell Power Stations (coal)
Per capita emissions = 3.0 t CO
2/person
VICTORIA
Annual transport emissions22.3 million tonnes
Equivalent to the emissions from1.5 Yallourn Power Stations (coal)
Per capita emissions = 3.6 t CO
2/person
SOUTH AUSTRALIA
Annual transport emissions6.6 million tonnes
Equivalent to the emissions from4 Torrens Islands Power Stations (gas)
Per capita emissions = 3.8 t CO
2/person
Sources: ABS 2017a; Clean Energy Regulator 2018; Department of the Environment and Energy 2018b.
Figure 2: State and territory transport emissions.

In Australia, greenhouse gas emissions
from transport have increased dramatically
since 1990 (62.9%), experiencing higher
growth than any other sector. Pollution
levels from transport are projected to
continue rising to 2030 and beyond,
reaching 112 MtCO2e in 2030, a further 12%
above current levels (Department of the
Environment and Energy 2017; Figure 3).
Greenhouse gas pollution from cars, trucks and buses is on the rise both globally and in Australia.
-60%
-40%
-20%
0%
20%
40%
60%
80%
1991
1990
1992
1993
1994
1995
1996
1997
1998
1999
200
020
01
200
220
03
200
420
05
200
620
07
200
820
09
2010
2011
2012
2013
2014
2015
2016
2017
Per
cen
t ch
ang
e in
em
issi
on
s o
n 1
98
9-9
0 (
%)
Electricity
Transport
Industrial processes and product use
Waste
Stationary energy excluding electricity
Fugitive emissions
Agriculture
Figure 3: Transport emissions increased the most as a percentage of any sector since 1990.
Source: Department of the Environment and Energy 2018a.
6 WAITING FOR THE GREEN LIGHT:
TRANSPORT SOLUTIONS TO CLIMATE CHANGE
Emissions from the transport sector must
be rapidly reduced in order to tackle climate
change (IEA 2017b).
Transport solutions - improving city
planning; investing in public transport;
encouraging people to shift out of cars and
Source: Steffen et al 2015.
on to public and active transport modes; and
adopting technological developments such
as renewable powered electric cars, buses,
light rail and trains - are together capable
of reducing greenhouse gas pollution levels
globally by 15 - 40% from business as usual by
2050 (IPCC 2014).
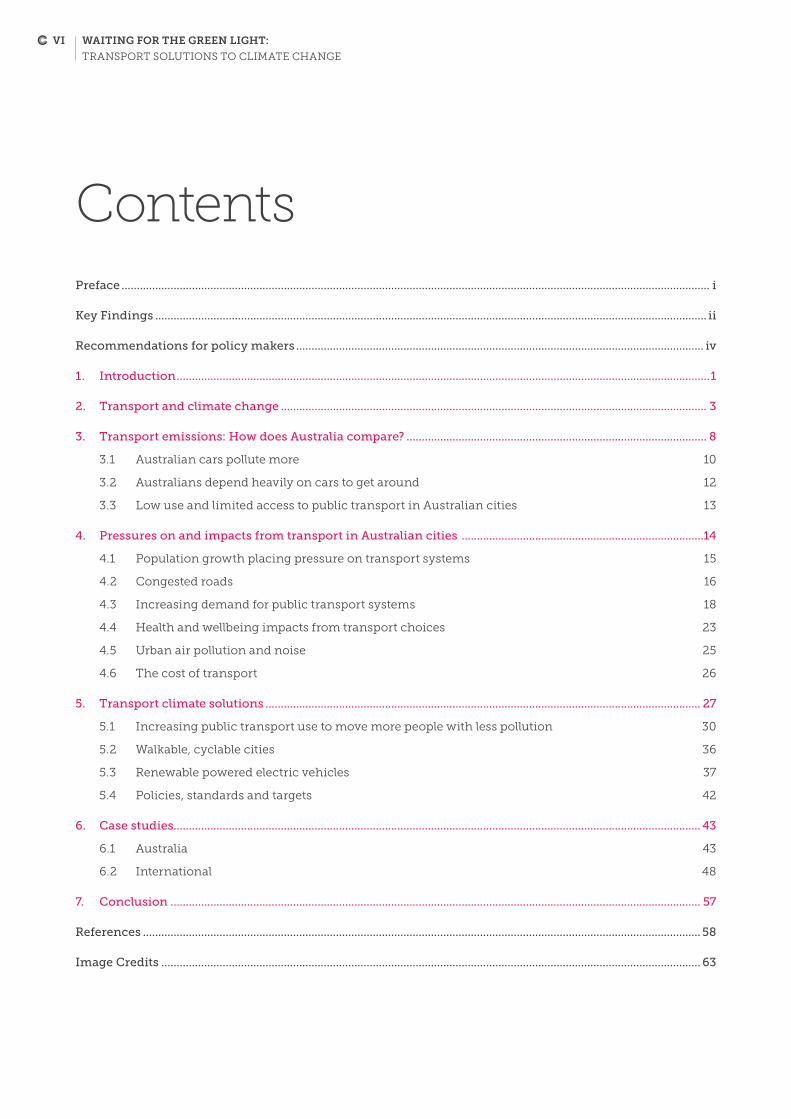
BOX 1: THE CLIMATE BENEFITS OF CANBERRA’S LIGHT RAIL PROJECT
By 2020 the ACT has contracted enough wind
and solar power to ensure the Territory is
powered by 100% renewable electricity. So the
electricity powering the trains will be entirely
free of greenhouse gas emissions.
The other way that the CMLR system will reduce
greenhouse gas pollution is by the land use
change it will enhance. As people will want to live
and work near the fast, high quality rail service,
land development will be attracted closer in to the
city rather than in highly car dependent suburbs
on the urban fringe. Such changes in land use
not only make the economics of urban rail much
more attractive, they also reduce greenhouse gas
pollution on the train and on all the travel done
by those living closer to the city.
These very large emission reductions show the
potential of quality public transport such as light
rail, running on renewable energy, to drastically
reduce greenhouse gas emissions on a per
passenger basis and cut greenhouse gas pollution
for the transport sector. In the longer term, the
light rail network will become the backbone of
a transformed transit system – integrated with
bus routes, cycleways, walking corridors and
electric vehicle charging stations – delivering
an efficient, resilient, carbon-free transit system,
powered by renewable energy.
Commencing construction in 2016, the
Australian Capital Territory’s Capital Metro Light
Rail (CMLR) system will be a transformative
project for the Canberra-Queanbeyan urban
area, bringing a wide range of economic, health,
social and environmental benefits. Climate
benefits are an important component of that list.
The first stage of the CMLR system – a 12
kilometre line from the northern town centre
of Gungahlin to Canberra’s city centre – will
be fully operational in 2019. It will achieve a
reduction in greenhouse gas emissions along
the transit corridor of up to 30% compared to the
business-as-usual case with no light rail, based
on the number of passengers who shift from
private cars to light rail.
Even more impressive are the reductions on a
per-passenger basis. For every passenger who
switches from a car to the light rail, emissions
will be reduced by 100%, that is, a complete
decarbonisation of the trip.
The reason for this massive reduction in per-
passenger emissions is two-fold. First, moving
from a car to the light rail system reduces
emissions to only a sixth of what it would
have been had the passenger stayed in the car.
Second, the CMLR trains will be powered by
electricity, not by liquid fuels such as petrol that
directly emit CO2 on combustion.
7CHAPTER 02
TRANSPORT AND CLIMATE CHANGE

3. Transport emissions: How does Australia compare?An international scorecard comparing the energy efficiency of the world’s top energy consuming countries consistently places Australia at the “back of the pack” on transport energy efficiency due to:
Australia lags behind Russia, Mexico and Indonesia on transport efficiency.
› High polluting cars
› Lack of greenhouse gas emissions
standards (or fuel efficiency standards)
in place
› High car use
› The relatively high distances travelled
per person (by car)
› Low share of trips taken by public
transport
› Low ratio of capital spending on public
transport compared to roads (ACEEE
2014; 2016; 2018)
8 WAITING FOR THE GREEN LIGHT:
TRANSPORT SOLUTIONS TO CLIMATE CHANGE

HOW DOES
Australia is consistently at the “back of the pack” on transport energy eciency.
2018 GLOBAL RANKINGS: TRANSPORT ENERGY EFFICIENCY
High polluting cars
Lack of greenhouse gas emissions standards (or fuel eciency standards) in place
High car use
The relatively high distances travelled per person (by car)
Low share of trips taken by public transport
Low ratio of spending on public transport compared to roads (ACEEE 2014; 2016; 2018)
WHY IS AUSTRALIA SO POOR?
BACK OF THE PACK
TOP
BOTTOM
INDIA2ND
ITALY3RD
CHINA4TH
UK5TH
AUSTRALIA20TH
THAILAND23RD
JAPAN6TH
FRANCE1ST
SOUTHAFRICA
22ND
SAUDI ARABIA24TH
UNITED ARABEMIRATES
25TH
AUSTRALIA COMPARE?TRANSPORT EMISSIONS:
TURKEY21ST
Sources: ACEEE 2018.
Figure 4: 2018 International Energy Efficiency Score Card - Transport.

3.1 Australian cars pollute more Australian vehicles emit more greenhouse
gas pollution per kilometre than
comparable countries. The average car
purchased in Australia emits 182g of
carbon dioxide per kilometre (g/km)
(NTC 2017). This is much higher than
comparable countries. For example, the
emissions intensity of Australian vehicles
is 46% higher than vehicles in European
countries (NTC 2017; Figure 5).
AVERAGE EMISSIONS INTENSITY FOR NEW PASSENGER VEHICLES BY COUNTRY, 2015
Av
erag
e em
issi
on
s in
ten
sity
(g
/km
)
180
160
140
120
100
80
60
40
20
0
Po
rtu
gal
Net
her
lan
ds
Den
mar
k
Gre
ece
Fra
nce
Cro
atia
Mal
ta
Irel
and
Ital
y
Sp
ain
Bel
giu
m
Eu
rop
e
Slo
ven
ia
Fin
lan
d
Un
ited
Kin
gd
om
Au
stri
a
Cze
ch R
epu
bli
c
Ro
man
ia
Sw
eden
Cy
pru
s
Slo
vak
ia
Po
lan
d
Bu
lgai
ra
Hu
ng
ary
Lu
xem
bo
urg
Lit
hu
ania
Ger
man
y
Lat
via
Est
on
ia
Au
stra
lia
Figure 5: Emissions intensity for new passenger vehicles - Australia compared with European countries.
Source: NTC 2017.
10 WAITING FOR THE GREEN LIGHT:
TRANSPORT SOLUTIONS TO CLIMATE CHANGE

Australian cars pollute more per kilometre
than other comparable countries due to a
range of factors, including vehicle size, the
lack of mandatory greenhouse gas emissions
standards for cars, as well as purchasing
decisions made by individuals, business
and government fleet buyers (NTC 2017).
Since 2011, diesel emissions have gone up
significantly as more people choose diesel
vehicles (TAI 2018; Figure 6).
CHANGES IN EMISSIONS FROM ROAD TRANSPORT FUELS
Em
issi
on
s (M
tCO
2-e
)
12
10
8
6
4
2
0
-2
-4
June 2011 June 2012 June 2013 June 2014 June 2015 June 2016 June 2017
Petrol Auto LPG Retail diesel Total
Figure 6: Diesel emissions have risen as more people choose diesel cars.
Source: TAI 2018.
11CHAPTER 03
TRANSPORT EMISSIONS: HOW DOES AUSTRALIA COMPARE?

3.2 Australians depend heavily on cars to get around Australians rely heavily on their cars to get
around, particularly when travelling to work,
school or university. A greater proportion
of people drive in Australian cities (rather
than using public transport) compared to
overseas (ACOLA 2015). For example, nearly
87% of Australian commuters travel to work
by car with a much smaller proportion
taking public transport (5%), walking (5%) or
riding a bicycle (1%) (BITRE 2017).
An international scorecard for transport
energy efficiency ranked Australia third
highest for car distance travelled per capita
on an annual basis (8,853 kilometres per
person), after the United States (highest,
14,724 kilometres per person) and Canada
(second highest, 8,864 kilometres per
person) compared with 25 high energy
consuming nations (ACEEE 2018).
Sydney, Melbourne and Brisbane are
Australia’s most populous cities and have
higher car ownership than other global cities
(UITP 2015). Global research comparing
transport trends in more than 60 cities
worldwide found Australian cities (Brisbane,
Melbourne and Sydney) were amongst the
top third of cities in terms of car ownership
per capita. Of the cities compared, Brisbane
had the fourth highest car ownership per
capita overall after Portland (US), Turin and
Rome (Italy) (UITP 2015).
There are some signs of a cultural shift
away from private car ownership. Younger
Australians (born after 1982) are less likely
to obtain a drivers license, less likely to own
their own vehicle and more likely to prefer
walking and public transport. Technological
developments such as autonomous vehicles,
electric vehicles, car sharing and ride sharing
are expected to change car ownership
patterns, but not necessarily reduce car use
(NRMA 2017).
Nearly 9 out of 10 Australians travel to work, school or university by car.
12 WAITING FOR THE GREEN LIGHT:
TRANSPORT SOLUTIONS TO CLIMATE CHANGE

3.3 Low use and limited access to public transport in Australian cities Australia’s most populous cities - Sydney,
Melbourne and Brisbane - have lower supply
of and use of public transport compared
with other global cities (UITP 2015).
A study of 39 countries placed Australia
among the lowest for levels of public
transport use in terms of journeys per
capita (UITP 2017).
Research comparing transport trends
in more than 60 cities worldwide found
Australian cities (Brisbane, Melbourne
and Sydney) were among the lowest 25%
based on supply of public transport
(measured in total public transport vehicle
kilometres per capita) and demand for
public transport (measured in passenger
kilometres per capita) (UITP 2015).
However, demand for public transport is
growing in Australia, linked to inner city
population growth and investment in new
lines and services (UITP 2017).
Solutions to reduce Australia’s greenhouse
gas pollution from the transport sector are
outlined in Section 4.
Table 1: Public transport use.
Higher use (More than 10% larger than average)
Medium use(Within 10% of average)
Lower use(More than 10% smaller use than average)
Singapore, Czech Republic, Hungary, Austria, Luxembourg, Japan, Republic of Korea, Estonia, Switzerland, Lithuania, Germany, Sweden, Poland, Latvia, Romania, Croatia, Ukraine, France, Slovakia, UK, Norway
Italy, Turkey, Belgium, Bulgaria, Russia, Finland, Brazil, China
Denmark, Portugal, Canada, Spain, Malta, Australia, Ireland, Slovenia, US, New Zealand
Source: UITP 2017.
13CHAPTER 03
TRANSPORT EMISSIONS: HOW DOES AUSTRALIA COMPARE?
4. Pressures on and impacts from transport in Australian cities Population growth in Australian cities is placing increased pressure on both road and public transport networks, leading to issues such as overcrowding and congestion. The approach to transport in our cities has a number of social, economic and environmental implications.
Population growth in Australian cities is putting pressure on transport networks.
14 WAITING FOR THE GREEN LIGHT:
TRANSPORT SOLUTIONS TO CLIMATE CHANGE
CHAPTER 04
PRESSURES ON AND IMPACTS FROM TRANSPORT IN AUSTRALIAN CITIES
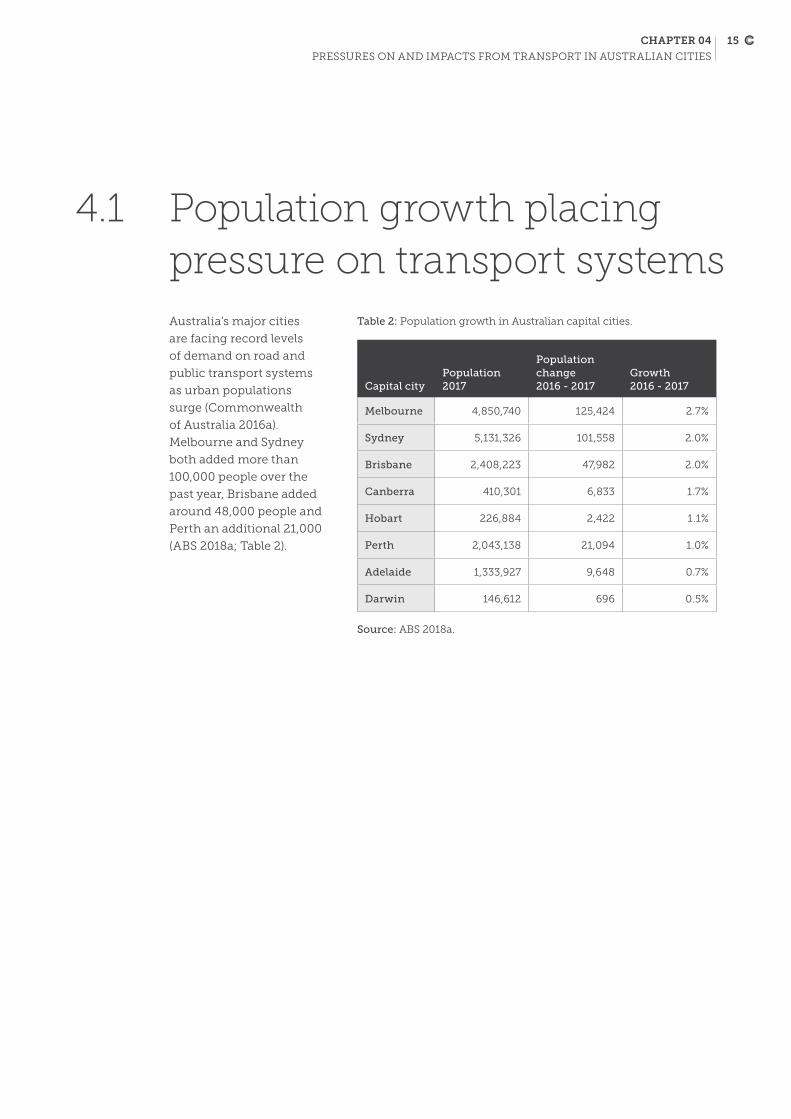
4.1 Population growth placing pressure on transport systems Australia’s major cities
are facing record levels
of demand on road and
public transport systems
as urban populations
surge (Commonwealth
of Australia 2016a).
Melbourne and Sydney
both added more than
100,000 people over the
past year, Brisbane added
around 48,000 people and
Perth an additional 21,000
(ABS 2018a; Table 2).
Table 2: Population growth in Australian capital cities.
Capital cityPopulation2017
Population change2016 - 2017
Growth2016 - 2017
Melbourne 4,850,740 125,424 2.7%
Sydney 5,131,326 101,558 2.0%
Brisbane 2,408,223 47,982 2.0%
Canberra 410,301 6,833 1.7%
Hobart 226,884 2,422 1.1%
Perth 2,043,138 21,094 1.0%
Adelaide 1,333,927 9,648 0.7%
Darwin 146,612 696 0.5%
Source: ABS 2018a.
15

4.2 Congested roads Many Australian roads are congested at
peak times. The average car trip to the
city in Sydney or Melbourne takes 50-70%
longer during the morning peak than it
would at night (Terrill M 2017). Travel times
in all four big Australian cities have grown
beyond the 30-minute average travel time,
a period considered to be an acceptable
journey time from home to work (Newman
and Kenworthy 2015; Figure 7).
On average, one in three cars on the road
during the morning peak are people
making their way to work. Approximately
one in five are travelling to school or
university (BITRE 2016a). More than 60%
of children are now driven to and from
school (ACOLA 2015), with some parents
reportedly travelling up to 100 kilometres
to drive children to their school of choice
(SMH 2018a; The Age 2018a).
AVERAGE COMMUTING TIMES FOR WORKERS
Av
erag
e co
mm
uti
ng
tim
e (m
inu
tes)
2002
Sydney Melbourne Brisbane Perth
20
25
40
35
30
2003 2004 2005 2006 2007 2008 2009 2010
Figure 7: Average commuting times for full time workers in Sydney, Melbourne, Brisbane and Perth.
Source: BITRE 2016b.
16 WAITING FOR THE GREEN LIGHT:
TRANSPORT SOLUTIONS TO CLIMATE CHANGE

CHAPTER 04
PRESSURES ON AND IMPACTS FROM TRANSPORT IN AUSTRALIAN CITIES
Congestion represents a cost to the economy
and a handbrake on the productivity of our
cities. In Australia, the annual economic
cost of congestion - measured in lost private
and business time, vehicle costs and air
pollution - is estimated at over $16 billion
per year and is expected to rise (BITRE
2016b). While congestion represents a cost
to the economy, it is important to note that
reducing congestion is not without cost,
often requiring new investment in public
transport or funds for administering road
pricing policies (Terrill 2017). Eliminating
congestion entirely from major city roads
is an unrealistic goal, given a certain
amount of congestion reflects an efficient
use of road space (Whitehead 2015).
Reducing congestion requires investing
in public and active transport alternatives
together with congestion charges or
disincentives discouraging people from
driving at peak times (Aftabuzzaman et
al 2010; Glover 2013; Whitehead 2015). On
the other hand, building more roads often
contributes to increased traffic, as more
people decide to drive, in turn increasing
road congestion (Glover 2013; Beck and
Bliemer 2015; Whitehead 2015).
New roads are often sold to the public as
“congestion busters”; however, research
consistently shows that increasing road
capacity can actually increase congestion
by encouraging additional car trips as traffic
increases to fill the available road space
(Litman 2015). While counter-intuitive,
removing roads may over-time result in
improved traffic conditions (Beck and
Bliemer 2015).
Congestion is a $16 billion dollar handbrake on the productivity of Australian cities.
Where public transport provides an
alternative service to driving that is efficient,
affordable, and meets people’s travel needs,
this can lead to more and more people
using public transport and less tolerance
for driving and road congestion, ultimately
creating a lasting improvement in road
traffic conditions. Importantly though,
this will only happen if planners resist the
temptation to undermine the mode shift to
public transport (and away from private cars)
by adding more road capacity.
For example, Beijing has successfully
reduced congestion by 50% year-on-year
from 2010 by prioritizing public transport
in planning and investment, expanding
the rail network by three new subway lines
(totalling 36 kilometres of rail) and limiting
increases in car ownership. Public transport
now accounts for over 40% of all trips, and
peak hour travel speeds have improved by
more than 10% (International Transport
Forum 2013).
17

4.3 Increasing demand for public transport systems Most Australian capital cities offer a range
of public transport services: rail (in the
form of trains and light rail), buses and in
some cases ferries. In 2016, public transport
users in Sydney, Melbourne (e.g. Figure
8), Brisbane, Adelaide and Perth took 680
million trips by rail (trains) and 230 million
trips on light rail (BITRE 2017).
Population growth in Australian cities
is driving increased demand for public
transport. Infrastructure Australia
forecasts an 89% increase in demand for
public transport between 2011 and 2031
(Infrastructure Australia 2016).
The capacity of public transport to move
more people in Australian cities and towns
depends on diverse factors including
infrastructure, technology measures (e.g.
signalling), fleet size, staffing, and even the
design of stations and interchanges.
Light rail and urban trains generally tend
to service inner city suburbs, or extend
like spokes of a wheel, connecting the
central city to outer suburbs. Trams (street-
based light rail) generally operate up to
around 10 kilometres from the central city
(Victorian Auditor General 2014), whereas
light rail can extend further into suburbs
and hinterlands. In recent years most
Australian cities have been building fast
Figure 8: Melbourne’s Flinders Street Station.
18 WAITING FOR THE GREEN LIGHT:
TRANSPORT SOLUTIONS TO CLIMATE CHANGE

CHAPTER 04
PRESSURES ON AND IMPACTS FROM TRANSPORT IN AUSTRALIAN CITIES
rail into the outer suburbs to ease the travel
times of people living a long way from work
and these have been highly successful in
drawing people out of cars (Glazebrook and
Newman 2018). The Western Australian
Government’s MetroNet program has major
rail connections into five corridors of Perth
costing over $5 billion. Other significant rail
investments include Adelaide’s rail extension
to Noarlunga, Sydney’s North West and
South West rail projects, Melbourne’s new
South West line and Melbourne Metro,
the Canberra and Gold Coast Light Rail
projects and Sunshine Coast rail projects.
Pressure on existing transport systems and
communities experiencing long travel times
to work and other major services have been
strong drivers for these rail investments.
The change in priorities from spending on
roads and buses to building fast rail services
has happened mostly over this century and
is paralleled by changes across the world
(Newman, Glazebrook and Kenworthy 2012;
Glazebrook and Newman 2018).
The trend to build urban rail in recent
decades across the globe has been
documented by Newman and Kenworthy
(2015) who show that urban or metro rail
is now faster than traffic in most cities
(including Australia) as traffic has slowed
from congestion and new fast rail systems
are being built that go over, around or under
the traffic. Table 3 shows this trend and the
opportunity through rail to enable large
shifts in modal split away from cars.
Buses have provided the backbone of public
transport in Australian cities, particularly
for those living in the outer suburbs, for
the past 50 years. A study of Melbourne
public transport found nearly 90% of homes
are located within walking distance (400
metres) to one or more modes of public
transport - over 80% lived near a local bus,
around 30% near a train, and 20% near a
tram (Victorian Auditor General 2014).
Figure 9: Canberra Bus.
19

Table 3: Ratio of overall average transit system and rail speed to general road traffic speed in cities, 1960 to 2005.
Comparative speeds in global ciites 1960 1970 1980 1990 1995 2005
Ratio of overall public transport system
American Cities 0.46 0.48 0.55 0.50 0.55 0.54
Canadian Cities 0.54 0.54 0.52 0.58 0.56 0.55
Australian Cities 0.56 0.56 0.63 0.64 0.75 0.75
European Cities 0.72 0.70 0.82 0.91 0.81 0.90
Asian Cities - 0.77 0.84 0.79 0.86 0.86
Global average for all cities 0.55 0.58 0.66 0.66 0.71 0.70
Ratio of metro/suburban rail speed to road speed
American Cities - 0.93 0.99 0.89 0.96 0.95
Canadian Cities - - 0.73 0.92 0.85 0.89
Australian Cities 0.72 0.68 0.89 0.81 1.06 1.08
European Cities 1.07 0.80 1.22 1.25 1.15 1.28
Asian Cities - 1.40 1.53 1.60 1.54 1.52
Global average for all cities 0.88 1.05 1.07 1.11 1.12 1.13
Source: Newman and Kenworthy (2015).
1 Accessibility is defined geographically and does not take into account the quality or how frequent the service is.
Accessibility of public transport is critical
to encouraging more people to take the
bus, light rail or train instead of driving.
Hobart and Sydney ranked the highest in
terms of the percentage of residents with
high or very high accessibility (of nearby
public transport stops). However, this does
not matter if the speed and quality of the
public transport option is not better than
that provided by cars1. Out of the capital
cities, Brisbane had the largest proportion
of residents having low or limited access
to public transport (Commonwealth of
Australia 2016b; Figure 10).
Accessibility of public transport services is critical.
20 WAITING FOR THE GREEN LIGHT:
TRANSPORT SOLUTIONS TO CLIMATE CHANGE

CHAPTER 04
PRESSURES ON AND IMPACTS FROM TRANSPORT IN AUSTRALIAN CITIES
Very high accessibility
High accessibility
Moderate accessibility
Low accessibility
Limited accessibility
Figure 10: Accessibility of public transport in Australian cities.
Source: Commonwealth of Australia 2016b.
21

Many public transport systems in our
major cities, particularly light rail and train
services, are bursting at the seams. Many
public transport services are already at
or beyond capacity during peak periods,
leading to crowding, delays and worsening
quality of service. Ongoing rapid growth
and investment in new high quality
public transport systems is needed to
tackle climate change and make our cities
responsive and resilient.
In contrast, many bus services are
characterised by low use and low levels of
satisfaction. Issues affecting bus services
and levels of use include indirect routes,
infrequent services, limited hours of
operation and poor coordination with
trains and light rail (Victorian Auditor
General 2014).
Light rail and trains in Australian cities are bursting at the seams.
Buses can be very slow in the transport
system. In recent decades our streets have
become more congested and unfortunately
buses are also stuck in the traffic. This
drawback for efficient bus systems has
partly contributed to the preference in
Australian cities for a faster rail connection
to the outer suburbs.
In general, the service level of buses and
light rail in our major cities (like Sydney
and Melbourne) are poor compared to other
global cities in terms of provision, frequency,
average speeds and unplanned disruptions.
Investment in and increases in public
transport service have not kept pace with
population growth (Currie 2016).
Rapid growth and investment in public transport systems is needed to tackle climate change.
22 WAITING FOR THE GREEN LIGHT:
TRANSPORT SOLUTIONS TO CLIMATE CHANGE

CHAPTER 04
PRESSURES ON AND IMPACTS FROM TRANSPORT IN AUSTRALIAN CITIES
4.4 Health and wellbeing impacts from transport choices People living in Australian cities are
spending a large proportion of time
travelling to and from work, school or
university. Those living in Sydney (5:42
hours per week), and Brisbane (5:00 hours)
are spending a large amount of time each
week in the car, train, light rail, tram or
bus (AMP 2011, e.g. Figure 11). However
those living in the Northern Territory are
spending less than three hours a week
commuting to work.
Time spent commuting impacts on
people’s work and leisure time. Long
commutes also negatively affect people’s
wellbeing, stress levels, and their
relationships with families, communities
and workplaces (TAI 2005).
People living in Australia’s major cities are spending between four and six hours a week in the car, train, light rail, tram or bus.
The way people travel - by car or public
transport - can have ramifications for their
health. Public transport use is linked to lower
weight and higher levels of physical activity
compared to driving. This is due to incidental
physical activity such as walking to or
from the train station or bus stops (Rissel
et al 2012). Compared with driving, public
transport users:
› are 3.5 times more likely to meet
recommended levels of physical activity
(30 minutes a day)
› walk an extra 8 to 33 additional minutes
each day
› are less likely to be sedentary or obese
(Rissel et al 2012).
23

A study of incidental physical activity
associated with public transport use in
Melbourne found car drivers average 10
minutes of daily physical activity, whereas
public transport users achieve 35 minutes,
and walkers and cyclists 38 minutes (Beavis
and Moodie 2014).
One of the healthiest forms of travel is
walking. The rebuilding of cities to make
them more walkable has been the life
work of Danish urban designer Jan Gehl
(Matan and Newman 2016). Gehl’s work in
Melbourne, Sydney, Adelaide and Perth has
been critical to their becoming far more
walkable in their central cities, regenerating
the original walking urban fabric (Newman
et al 2016). This has been the basis of strong
economic performance, higher liveability,
greater health and reduced car use. Such
activities have demonstrated the importance
of co-benefits in achieving reductions in
transport greenhouse gas pollution.
Public transport users are more likely to meet recommended levels of exercise.
Figure 11: Traffic congestion in Sydney.
24 WAITING FOR THE GREEN LIGHT:
TRANSPORT SOLUTIONS TO CLIMATE CHANGE

CHAPTER 04
PRESSURES ON AND IMPACTS FROM TRANSPORT IN AUSTRALIAN CITIES
4.5 Urban air pollution and noise In Australia, an estimated 1,700 deaths
occur every year as a result air pollution
from cars, trucks and buses - larger than
the national road toll (Schofield et al 2017;
Department of Infrastructure, Regional
Development and Cities 2018).
Diesel cars, trucks and buses are key
sources of urban air pollution. Diesel
is becoming an increasing source
of air pollution in Australian cities
(Commonwealth of Australia 2016a).
Diesel-fuelled vehicles emit air pollutants
such as nitrogen oxides and particulate
matter, which can cause cancer and
respiratory problems (Nieuwenhuis 2017).
The use of diesel is increasing across
Australia both for road transport and other
activities (agriculture, mining, construction)
(TAI 2018). Sales of diesel cars are growing in
Australia, increasing 8.5% between 2015 and
2016 (NTC 2017). Bus routes in Australia are
predominantly serviced by diesel buses. Out
of 97,000 buses on Australian roads, four out
of every five are diesel (ABS 2017c).
Across the world many cities are banning
diesel for health reasons and because electric
vehicle alternatives of all kinds are now the
rapidly growing new market. Electric vehicles
can reduce urban air pollution and noise.
Simple measures such as discouraging the
practice of idling (when a vehicle’s engine
is left running unnecessarily) near schools
and childcare centres can reduce children’s
exposure to noxious chemicals as well as
reducing greenhouse gas pollution (Schofield
et al 2017; The Age 2017).
Diesel buses, trucks and cars are a key source of air pollution.
25

4.6 The cost of transport Despite the recent focus on energy bills, the
average Australian household spends seven
times more on transport (over $11,000 per
year) than electricity (around $1,500 per
year) (ABS 2017b; ACCC 2017).
Compared to driving, public transport is
cheaper for individuals, households, and
society, particularly when all external
costs are factored in (for example, public
expenditure, accidents, congestion, air
pollution, and noise costs).
At a household or individual level, deciding
to take public transport instead of the car
can save between $5,500 (if a car is kept at
home and not used) and $9,400 (if using
public transport avoids the purchase of a
car, or second car) per year (Wang 2013).
A study of Sydney transport costs to
the taxpayer found cars to be the most
expensive mode of travel costing society
86c/passenger kilometre, compared with
rail (the cheapest) at 47c and buses at 57c
(Glazebrook 2009).
The external costs of road-based transport
are significant. Globally, around 1.3 million
people are killed every year by motor
vehicles, and an additional 20-50 million
people are seriously injured (Sims et al
2014). In Australia, the annual road toll
results in around 1,200 lives lost due to car
accidents (Department of Infrastructure,
Regional Development and Cities 2018).
Households spend seven times more on transport than what they spend on electricity.
26 WAITING FOR THE GREEN LIGHT:
TRANSPORT SOLUTIONS TO CLIMATE CHANGE

CHAPTER 05
TRANSPORT CLIMATE SOLUTIONS
5. Transport climate solutions While the transport sector is Australia’s second largest source of greenhouse gas pollution, there are significant opportunities to reduce emissions through a shift to public and active transport alternatives, and to renewable-powered electric vehicles (ClimateWorks 2014; Hawken 2017).
Key climate solutions to drive down
transport emissions involve:
› providing viable alternatives to driving,
such as expanding access to reliable,
comfortable public transport, cycling and
walking alternatives.
› electrifying and powering cars, buses,
trains and light rail with 100% renewable
energy (eg. Canberra’s light rail).
› adopting policies and incentives to
encourage lower emitting vehicles, such
as mandatory greenhouse gas emissions
standards and electric vehicle targets
(Table 4).
27

Table 4: Transport solutions to reduce greenhouse gas pollution.
Solution Mode shift to public and active transport alternatives
Renewable energy powered electric vehicles
Policies and incentives for more fuel efficient vehicles
What is it? Increasing public and active transport use by providing viable alternatives to driving, such as high quality, efficient and accessible public transport, cycling and walking alternatives.
Electrifying bicycles, cars, buses, light rail and trains and powering them with 100% renewable energy.
Mandatory fuel emissions standards set targets for new cars to meet lower emissions (per kilometre travelled) over time. The overall emissions intensity of the car fleet is reduced over time as new, more efficient vehicles are purchased to replace older ones.
Targets and incentives to drive the uptake of electric bicycles, cars and buses.
Benefits (in addition to reduced greenhouse gas pollution)
Reduced congestion
Safer (reduced car accidents)
More physical activity
More inclusive (transport access for people without access to a car or unable to drive)
Improved air quality
Lower transport costs (compared to driving)
Reduced public space dedicated to cars
Reduced urban air pollution and noise
Electric vehicles can be powered by renewable energy
Lower running costs
Covers a broad range of vehicles, driving down emissions across the entire car fleet
Lower running costs
Barriers Car oriented planning, urban design and infrastructure budgets
Lack of investment in public and active transport infrastructure
Requires behaviour change
Lack of charging infrastructure
Lack of policy and incentives to drive take up (emissions standards/ targets)
Upfront cost (offset by lower running costs)
Perceptions, e.g. concerns about distance per charge
Government inaction
Sources: ESAA 2013; CCA 2014; Hawken 2017.
28 WAITING FOR THE GREEN LIGHT:
TRANSPORT SOLUTIONS TO CLIMATE CHANGE

CHAPTER 05
TRANSPORT CLIMATE SOLUTIONS
Globally transport
solutions have the
potential to significantly
reduce greenhouse
gas emissions by 2050
(Table 5).
Table 5: Emissions reduction potential from transport solutions.
SolutionGlobal emissions reduction potential to 2050 (gigatonnes CO2e)
Mode shift
Mass transit 6.57
Walkable cities 2.92
Bike infrastructure 2.31
Digital communications (as an alternative to travel)
1.99
High speed rail 1.42
Ride-sharing 0.32
Total 15.53
Renewable powered electric vehicles
Electric vehicles 10.8
Electric trains 0.52
Electric bikes 0.96
Total 12.28
Greenhouse gas standards
Cars 4.0
Trucks 6.18
Total 10.18
Source: Hawken 2017.
29

5.1 Increasing public transport use to move more people with less pollution Mode shift from car travel to public and
active transport is one of the most effective
measures available to reduce transport
energy use and greenhouse gas pollution.
Federal and state governments can play a
major role in encouraging mode shift to
public transport through both infrastructure
provision and efficient day-to-day service
planning (such as coordinated timetables
and running more frequent public transport
services on existing routes).
European cities have led the shift from
car travel to public transport, with Vienna,
Paris, London, Oslo, Prague and Geneva
increasing the share of journeys by public
transport by 20% or more by increasing
public transport supply and discouraging
car travel (for example through parking
restrictions and congestion charging). In
Vienna, Austria - which recently overtook
Melbourne as the “world’s most liveable
city” - more trips (54%) are now made by
public transport than by private vehicle
(UITP 2015; The Guardian 2018).
Even cities famous for their car dependent,
sprawling suburban development such
as Houston and Dallas in Texas, United
States have been taking steps - rolling
out new light rail and train systems and
investing in improving bus services - to
increase the use and availability of public
transport (Case Study 9). The number of
light rail systems in American cities has
doubled since 1995. Use of public transport
is growing in the United States, particularly
on light rail and trains (Newman et al 2012).
Almost every capital city in Australia is
now planning, building or extending new
light rail or train services (The Age 2018b,
e.g. Figure 12).
Figure 12: Adelaide Tram.
30 WAITING FOR THE GREEN LIGHT:
TRANSPORT SOLUTIONS TO CLIMATE CHANGE

CHAPTER 05
TRANSPORT CLIMATE SOLUTIONS
5.1.1 CREATING A PUBLIC TRANSPORT “NETWORK EFFECT”
An effective public transport service
recognises that not all journeys - for work,
education, or social activities - involve
travelling to and from the city. Providing
a seamless public transport service that
enables people to travel from any part of
the city or suburbs, to any destination in a
direct, efficient and low cost way is critical
to encouraging higher levels of public
transport use. The key to encouraging a
shift to public transport is by creating a
“network effect”, resembling a grid or web
pattern criss-crossing the city.
Key elements required for an efficient,
high quality public transport network
include implementing:
› Regular, reliable and frequent services.
› A network or grid of high speed, high
capacity cross-city public transport links
and local feeder bus services.
› A series of well-designed interchanges,
or connection points, and simple,
coordinated timetables enabling
commuters to quickly and easily switch
from one route or mode to another.
› Integrated ticketing.
› Information, including public transport
maps which are comprehensive and easy
to use as well as effective signage at rail
and bus stations.
(Victorian Auditor General 2014; Stone and
Kirk 2017).
Real world data on cities (such as Vancouver,
Canada, Zurich, Switzerland and Vienna,
Austria) that have implemented this kind
of public transport network, have recorded
higher levels of public transport use,
compared to similar cities where public
transport follows a radial pattern (focused
on travel to and from the city) (Stone and
Kirk 2017).
This public transport “network effect” can
even be retrofitted onto existing transport
systems by re-designing bus routes in a way
that provides efficient and direct cross-city
services, to integrate with existing high
capacity routes (such as rail lines) to and
from the city. A number of cities around the
world, and in Australia are now seeking to
apply the principles of the “network effect” in
redesigning their public transport systems
in order to achieve higher rates of use such
as Houston, Texas (Case Study 9).
31

5.1.2 LAND USE PLANNING AND PUBLIC TRANSPORT
The Australian Government’s Smart Cities
Plan promotes the concept of a “30 minute
city”, or one where in each part of the
city it is possible to reach a major centre
for work and services within 30 minutes
(Commonwealth of Australia 2016c). The
idea is for land use planning to design
cities and their transport systems so that
residents can access jobs, education, shops
and recreational facilities within 30 minutes
from their home. The new Sydney strategic
plan A Plan for Growing Sydney sets out this
as its basic strategic idea, and the Victorian
Government’s Plan Melbourne aims to
achieve a 20 minute city (Commonwealth of
Australia 2016c). Many other Australian cities
have similar plans and objectives, often
supported by local government planning.
However, delivering on the concept,
where people have much less need for a
car and many more local and cross-city
transport options, is not straightforward
or easy. Much of the land use in inner
cities is rapidly redeveloping at higher
densities due to large demand by people to
live nearer urban amenities and jobs, but
middle and outer suburbs are struggling to
redevelop with the kind of densities needed
in suburban centres that can make them
viable (Thomson et al 2016).
If land use planning is conducted in isolation
from transit planning then problems follow.
For example, parts of Australian inner
cities have been developing in the absence
of additional public transport investment
contributing to overcrowding on public
transport. Many cities are encouraging infill
development of new high and medium
rise developments along existing public
transport corridors in the inner city. Where
such development and population growth
occurs without a corresponding increase
in the frequency and provision of public
transport, this can further exacerbate
pressures on transport systems.
A number of Australian cities are also
expanding outer suburban boundaries and
opening up new areas for development. This
can result in the creation of outer suburbs
beyond the reach of existing public transport
networks. As a result, people living in outer
suburbs of Australian cities often have access
to fewer public transport options than inner
city areas or no public transport options at all.
Where public transport services do exist in
these outer areas, they are often less direct,
meaning longer travel times (Infrastructure
Australia 2016).
When urban development (such as new
apartments, shops and offices) is planned
around rail stations then not only do more
people have easy access to the train but they
have much less need to travel in general,
have shorter distances to travel by car and
easier walking and cycling distance to shops
and services. Such integrated developments
dramatically improve the value for money
for public transport projects (Newman and
Kenworthy 2015).
Integrating transport planning and land
development can be combined into train
and land packages, and can help finance
the development of public transport. This
approach called the Entrepreneur Rail
Model (Newman et al 2017) is how tram
and train lines were first built and has been
rediscovered in Japan and Hong Kong
with increasing numbers of projects now
attempting such partnerships in America
and Australia (Newman et al 2017). This
integration of transit, land development and
finance is being pursued as part of City Deals
with the Federal Government and suggests
that some structural reform of transport
systems may be underway.
32 WAITING FOR THE GREEN LIGHT:
TRANSPORT SOLUTIONS TO CLIMATE CHANGE

CHAPTER 05
TRANSPORT CLIMATE SOLUTIONS
5.1.3 CAPTURING “LOW HANGING FRUIT” WITH SERVICE PLANNING AND NEW TECHNOLOGY
In addition to investing in upgrading
existing and building new public transport
infrastructure, network planning and
improved services are critical to encouraging
more people to use public transport.
Australian governments have a history
of investing in large public transport
infrastructure projects but then failing to
enact service plans to make full use of the
added capacity. For example, the Melbourne
City Loop was planned in the early 1970s
as a measure to increase peak hour central-
area train capacity, yet from the time it
opened in 1981 until 2008, the number of
train arrivals at Flinders Street station in the
busiest hour remained below the 95 arrivals
in the 1960 timetable (excluding the St Kilda
and Port Melbourne lines). Following the
completion of the Regional Rail Link in 2015,
the number of train arrivals at Flinders Street
via Newport between 8am and 9am has
increased by just 1, from 11 to 12.
There are many opportunities in Australian
cities to capture ‘low hanging fruit’ by
providing additional services (more frequent
buses, or rail services) on existing routes
without costly infrastructure investment.
For example in Melbourne, many suburban
train lines have the capacity to provide
service every 10 minutes all day, 7 days
a week, following the example set by the
Frankston and Dandenong lines. This is
possible because main train lines already
provide service better than every 10 minutes
during peak times. For bus routes, providing
additional services requires nothing more
than an expanded fleet, additional depot
space and drivers.
There are also a number of ways to increase
the speed of buses by making their routes
more direct and giving them right of way.
New technology like the Trackless Tram offers
ways of significantly increasing speed, ride
quality and patronage without significant
cost (Glazebrook and Newman 2018).
33

5.1.4 BENEFITS OF PUBLIC TRANSPORT
Compared to building new roads,
investment in public transport is a more
efficient (e.g. transporting more people,
requiring less land use) way of meeting the
transport needs of growing populations in
Australian cities. Roads and car travel use
a disproportionately large amount of land
compared to public transport, especially in
the inner city (e.g. Figure 13). For example,
in the City of Melbourne, more than 60% of
street space is dedicated to roads and car
parking, even though driving only accounts
for around a third of trips to the city (City of
Melbourne 2018a).
Public transport options can carry more
people and require less land use compared to
roads with cars carrying one or two people
(Infrastructure Australia 2016; Figure 13).
For example, in Melbourne, trams along
Swanston Street carry more people to and
from the city each day than the West Gate
Bridge (City of Melbourne 2018b).
Figure 13: Cars use a disproportionately large amount of land compared to public and active transport.
34 WAITING FOR THE GREEN LIGHT:
TRANSPORT SOLUTIONS TO CLIMATE CHANGE

CHAPTER 05
TRANSPORT CLIMATE SOLUTIONS
Walk
1 person
Cycle
1 person
Vehicle
Up to5 people
Bus
Up to60 people
Bendy Bus
Up to100 people
Light Rail
Up to 300 people
Heavy Rail
Up to 1,200 people
INDICATIVE CARRYING CAPACITY OF DIFFERENT TRANSPORT VEHICLES
Figure 14: Carrying capacity of different transport modes.
Source: Transport for NSW.
Expanding access to and use of high quality
public transport is a proven way to reduce
car use and associated greenhouse gas
pollution. People who live in communities
with accessible public transport tend to
own fewer vehicles, drive less and rely
more on public transport than other areas
(Litman 2010).
35
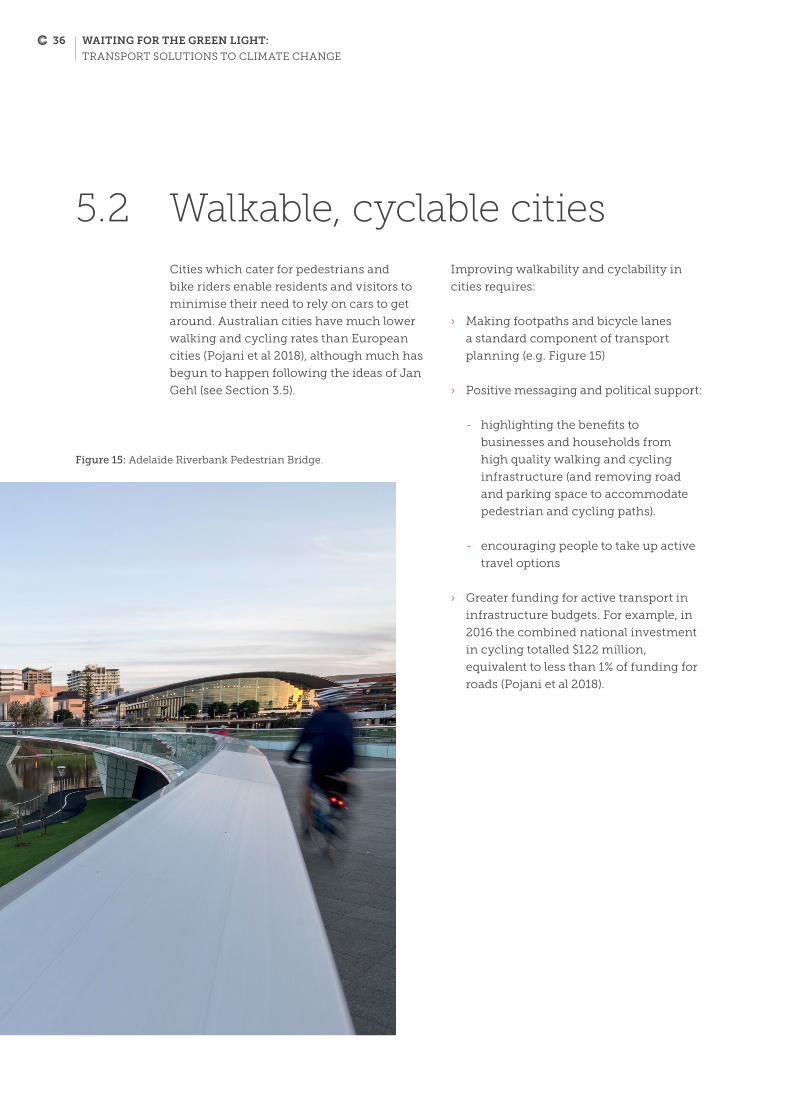
5.2 Walkable, cyclable cities Cities which cater for pedestrians and
bike riders enable residents and visitors to
minimise their need to rely on cars to get
around. Australian cities have much lower
walking and cycling rates than European
cities (Pojani et al 2018), although much has
begun to happen following the ideas of Jan
Gehl (see Section 3.5).
Improving walkability and cyclability in
cities requires:
› Making footpaths and bicycle lanes
a standard component of transport
planning (e.g. Figure 15)
› Positive messaging and political support:
- highlighting the benefits to
businesses and households from
high quality walking and cycling
infrastructure (and removing road
and parking space to accommodate
pedestrian and cycling paths).
- encouraging people to take up active
travel options
› Greater funding for active transport in
infrastructure budgets. For example, in
2016 the combined national investment
in cycling totalled $122 million,
equivalent to less than 1% of funding for
roads (Pojani et al 2018).
Figure 15: Adelaide Riverbank Pedestrian Bridge.
36 WAITING FOR THE GREEN LIGHT:
TRANSPORT SOLUTIONS TO CLIMATE CHANGE

CHAPTER 05
TRANSPORT CLIMATE SOLUTIONS
5.3 Renewable powered electric vehicles While there has been significant media
and public focus on electric cars, there are
significant benefits of shifting to battery
electric buses, bicycles and trucks as well
as cars.
The source of electricity for electric car
charging is critical to reducing emissions.
As electric vehicle uptake grows, this
must be accompanied by new, additional
investments in renewable energy. As
electric vehicles are an additional source
of electricity demand, it is important that
new renewable electricity sources for
charging electric cars are additional to
those that would otherwise be provided, so
as not to undermine pollution reductions
being made in the electricity sector.
5.3.1 RENEWABLE POWERED PUBLIC TRANSPORT
Some Australian states and cities are taking
steps towards renewable powered public
transport. In 2013, Adelaide led the way
as the first city in the world to introduce
a solar-charged electric bus operating on
the city’s free connector service (City of
Adelaide 2013), while Flinders University
is trialling an autonomous solar-powered
electric bus to shuttle students from its
nearby train station. A similar trial is
underway at Curtin University. Canberra,
a city on track for 100 per cent renewable
energy by 2020, is trialling two electric
buses, and is ultimately planning to
transition its ageing bus fleet to electric
(ACT 2018). Melbourne’s tram network will
soon get their electricity from large-scale
solar plants in the north of Victoria (Case
Study 10). New South Wales’ 87MW Beryl
solar project has been contracted to power
Sydney’s new north-west rail line (Renew
Economy 2018a).
37

5.3.2 ELECTRIC BUSES
Electric buses offer significant benefits over
their diesel and gas counterparts, which
dominate inner city bus fleets in Australian
cities today. While diesel buses are noisy and
their exhaust is bad for health and climate
change, electric buses are modern, quiet,
and clean people movers. Electric buses are
more expensive upfront, but with lower fuel,
maintenance and running costs.
Switching from gas or diesel to battery
electric buses significantly reduces
greenhouse gas emissions (Dallman et al
2017). Battery electric buses produce less
greenhouse gas pollution per kilometre than
buses running on compressed natural gas
or diesel. This is the case, even in countries
like Australia where fossil fuels like coal and
gas make up a relatively high proportion of
electricity generation (Dallman et al 2017).
As the percentage of renewable energy in
the electricity mix increases, the climate
benefits associated with switching to
electric buses also increases.
A shift away from diesel buses can also
dramatically reduce ‘black carbon’ emissions
from diesel exhaust. Black carbon is a sooty
black material that is both harmful to human
health, and a potent greenhouse gas. In the
atmosphere, black carbon contributes to
over 3,000 times the warming over 20 years
compared to carbon dioxide.
Shifting from diesel to electric buses would
improve air quality, particularly in inner
urban areas where there is a concentration
of bus services.
Buses operating in cities are particularly
well suited to switching to electric, as they
have known routes and timetables. Charging
infrastructure (as well as solar panels)
can be readily installed on bus terminals
and interchanges. Electric bus models are
now available which can drive up to 1,700
kilometres on a single charge - meaning
buses can operate throughout the day
without needing charging (Quartz 2017)
While in some cases today, electric buses
have a higher upfront cost than their diesel
equivalents; electric buses are already cost-
competitive with diesel over their operating
life, when the substantially lower operating
and maintenance costs of electric buses are
taken into consideration (BNEF 2018a; WRI
2018). Furthermore, the cost of electric buses
is coming down rapidly as global uptake
increases. Electric buses are expected to
be the same or cheaper than diesel buses
by 2030 or earlier. Bloomberg New Energy
Finance projects electric buses will make up
nearly half of the global fleet of buses by
2025 (BNEF 2018b).
In 2017, the city of Shenzhen in China
became the first major city in the world
to switch its entire bus fleet to electric.
Numerous other cities and towns are
following suit. Fourteen major cities -
London, Copenhagen, Auckland, Paris,
Milan, Los Angeles, Barcelona, Vancouver,
Mexico City, Rome, Heidelberg, Quito, Seattle
and Cape Town have pledged to buy only
electric buses from 2025 to reduce pollution
(C40 2017). Many of these cities are already
investing in electric buses, with Los Angeles
ordering 100 electric buses while London
introduced long-distance electric double
decker buses (Elektrek 2017). San Francisco’s
transport agency will only purchase electric
buses from 2025 and aims to switch its entire
bus fleet to electric by 2035 (SFMTA 2018).
38 WAITING FOR THE GREEN LIGHT:
TRANSPORT SOLUTIONS TO CLIMATE CHANGE

CHAPTER 05
TRANSPORT CLIMATE SOLUTIONS
5.3.3 ELECTRIC CARS
Compared to petrol and diesel counterparts,
electric cars bring benefits through reduced
greenhouse gas pollution, reduced reliance
on imported fuels, cleaner air and the
potential to attract investment and jobs in
vehicle manufacturing.
The source of electricity for electric car
charging is critical to reducing emissions.
As electric cars are an additional source of
electricity demand, it is important that new
renewable electricity sources for charging
electric cars are additional to those that
would otherwise be provided, so as not to
undermine pollution reductions being made
in the electricity sector. Public provision of
electric vehicle charging infrastructure can
ensure that these charge-points are powered
by 100% renewable energy.
Electric vehicles powered entirely on
renewable energy have negligible emissions,
compared to an average new car (182gCO2/
km) (The ICCT 2015; National Transport
Commission 2017). Charging an electric
vehicle with renewable energy - be it
rooftop solar panels or 100% GreenPower
purchased from an electricity retailer - is
substantially cheaper than the cost of fuel
for an equivalent petrol car (AECOM 2015).
In most cases, charging an electric
vehicle from the electricity grid results
in less greenhouse gas pollution than a
conventional vehicle. Even without 100%
Greenpower or solar panels, charging an
electric vehicle from the electricity grid
results in less greenhouse gas pollution
compared to a conventional vehicle, in every
state except Victoria (ClimateWorks 2018).
Solar powered electric cars would seem to be
a good fit for Australia, with its world-leading
uptake of household solar (Australian Energy
Council 2016), and high dependence on
cars to get around. As more Australians put
solar on their rooftops, and the proportion
of renewable electricity in the grid grows,
emissions associated with electric vehicles
will fall further.
Shifting from diesel and petrol to electric
vehicles would improve air quality,
particularly in inner urban areas.
Today an electric car often costs more
upfront than a conventional car. However,
as global production increases, costs are
coming down rapidly. By 2025, an electric
car is anticipated to be similar in terms of
upfront cost compared to a conventional
(petrol or diesel) vehicle.
Falling costs together with supportive
government policies are driving global
growth in electric vehicles. Worldwide
electric vehicle sales reached 1.2 million in
2017, increasing rapidly from hundreds in
2010. There are now over 3.2 million electric
cars on the road worldwide (Lutsey et al 2018).
Car manufacturers are investing more than
$150 billion to increase the production of
electric vehicles (Lutsey et al 2018) and are
aiming to achieve annual sales of 13 million
electric cars by 2025 (from 1.2 million in
2017). Over 90% of global vehicle sales and
production occurs in China, Europe, Japan
and the United States (Lutsey et al 2018).
39

Governments around the world at
national, state and local levels are
seeking to accelerate the shift to electric
vehicles. Mandatory greenhouse gas
standards operating in 80% of the global
car market are one factor driving the
adoption of electric vehicles. In addition,
specific targets to drive electric vehicle
uptake have been put in place in China,
California (United States), and Quebec
(Canada) and are under consideration in
Europe (Lutsey et al 2018).
In Australia, the adoption of electric
vehicles is being held back by the lack
of policy support or incentives, higher
upfront cost, limited choice of available
electric vehicles for sale in Australia, and
the availability of public vehicle charging
infrastructure (Business Insider 2017).
According to ClimateWorks, 2,284 electric
vehicles were sold in Australia in 2017,
around 0.2% of new cars sold that year
(ClimateWorks 2018; NTC 2017). Contrast
this to Norway, where 39% of all new cars
sold are electric (Reuters 2018a).
In New Zealand, which has a target to
reach 64,000 electric cars by 2021, new
electric car sales, outstripped sales here
in Australia (Table 6).
A number of countries have signaled
they will move to ban fossil fuelled
(petrol, gas and diesel) cars, including:
› Norway by 2025
› India by 2030
› The Netherlands by 2030
› United Kingdom by 2040
› France by 2040 (CNN 2017; ACT
Government 2018).
Table 6: Australia and New Zealand electric car uptake compared.
Australia New Zealand
2,284 new electric cars sold in 2017
Proportion of new car sales - 0.2%
3,659 new electric cars sold in 2017
Proportion of new car sales - 3.4%
7,341 total electric cars by end 2017
Proportion of total registered vehicles - 0.04%
6,209 total electric cars by end 2017
Proportion of total registered vehicles - 0.12%
No national electric vehicle target
Target: 64,000 electric vehicles on the road by 2021
Sources: ABS 2018b; ClimateWorks 2018; FCAI 2018; Motor Industry Association 2018; NZ Transport Agency 2018; Transport NZ 2018.
New Zealand’s electric car sales surpasses Australia’s.
40 WAITING FOR THE GREEN LIGHT:
TRANSPORT SOLUTIONS TO CLIMATE CHANGE

CHAPTER 05
TRANSPORT CLIMATE SOLUTIONS
Sources: Institute for Sensible Transport 2016; Kleinman and Rohr (2018).
BOX 2: WHAT ABOUT EMERGING TRANSPORT TECHNOLOGIES?
For example, considerations may include
whether individual technologies will:
› improve or worsen associated greenhouse
gas pollution
› reduce or increase demand for private or
public transport
› improve or worsen car dependency and
congestion levels
› increase or decrease the cost of transport to
individual users and society
› cannibalise existing services (e.g. traditional
taxi services) or substitute for car use or for
other modes such as public transport,
cycling or walking
› change car ownership
› increase or decrease competition
› support or undermine public transport services
› impacts on physical activity levels
› impacts on land use allocated to private
vehicles and parking
› impacts on pedestrians and bike riders
› provide transport access to vulnerable groups
› create other impacts or trade-offs, for
example accessing user data, associated
advertising, flow on impacts for other
services and businesses, changing nature
of employment conditions.
New transport technologies are rapidly
emerging on the scene, variously referred
to as ‘disruptive technologies’, the ‘gig
economy’, or the ‘sharing economy’. These
new transportation technologies range from
autonomous (driverless) vehicles, ride sourcing
applications to public transport applications
and bicycle share schemes. Each of these new
technology driven transport options can have
complex interactions with existing transport
services and potentially significant positive or
negative implications on greenhouse gas
pollution levels.
Examples of emerging transport technologies
include car-sharing services (where users can
access shared vehicles rather than owning their
own e.g. Flexicar), ride sourcing applications
(e.g. Uber), public transport journey planning
and payment applications, autonomous or
driverless vehicles, bike sharing schemes (e.g.
obikes) and drones.
Policy makers should consider the potential
implications for individual technologies,
particularly any environmental, social and
economic impacts and whether proactive
policy or regulation is necessary to avoid
adverse or unintended outcomes.
41

5.4 Policies, standards and targets Mandatory greenhouse gas standards are
government policies or regulations that
require car manufacturers to reduce the
emissions from new cars over time.
Mandatory greenhouse gas standards (or
vehicle efficiency standards) apply to over
80% of the world’s car market (including
the United States, Europe, Japan, Korea,
China, India, Canada and Mexico) (CCA
2014; Lutsey et al 2018). Australia is one of
only a handful of OECD countries without
mandatory greenhouse gas standards for
vehicles (ACEEE 2018).
The sooner mandatory emissions
standards are introduced, and rapidly
strengthened, the greater the impact. If
strict standards are introduced, Australia
can prevent up to 65 MtCO2 of emissions
by 2030 (Australian Government 2017).
This is equivalent to the annual emissions
from seven Liddell Power Stations (Clean
Energy Regulator 2018). Urgency is key.
Mandatory emissions standards have
wider benefits, reducing fuel bills for car
owners, saving an estimated $8,500 over
a vehicle’s lifetime (CCA 2014).
Since 2015, the Federal Government has
considered in detail the introduction of
emissions standards for cars and light
vehicles, but the Federal Government has
yet to implement any such policy.
The success of mandatory emissions
standards in cutting greenhouse gas
emissions relies on new lower emissions
vehicles replacing existing higher
emissions vehicles over time. Even with
the introduction of strong mandatory
emissions standards, it will be important to
ensure that higher emissions vehicles are
retired, or taken off the road, over time so
that new vehicles (whether they be lower
emissions, or electric) don’t simply add to
the total number of vehicles on the road,
and the total vehicle-kilometres travelled.
Australia is one of only a handful of OECD countries without greenhouse gas standards for vehicles.
42 WAITING FOR THE GREEN LIGHT:
TRANSPORT SOLUTIONS TO CLIMATE CHANGE

CHAPTER 06
CASE STUDIES
6.1 Australia CASE STUDY 1:
Gold Coast Light Rail
The first stage of the new Gold Coast Light
Rail project opened in 2014, connecting
16 stations along 13 kilometres of track.
Services run at least every 15 minutes on
weekdays. Already the light rail project
has carried 21,000 passengers on average
every day, and contributed to 23% growth in
public transport use between 2015 and 2016.
The project has also reduced vehicle
traffic on the Gold Coast Highway at
Broadbeach by 21% (City of Gold Coast
2017). Stage 2 of the light rail opened in
December 2017, extending the line by a
further 7.3km (Gold Coast Light Rail 2017).
This is just the first of several stages, as
part of the Gold Coast City’s Transport
Strategy 2031.
6. Case studies
Figure 16: The Gold Coast light rail has reduced vehicle traffic on the highway at Broadbeach by 21%.
43

CASE STUDY 2:
Electric Buses Driving New Manufacturing Jobs in Adelaide
In July 2017, the first Australian designed,
engineered and manufactured electric
bus rolled off the production line and
onto Adelaide’s streets, becoming part
of Adelaide’s public transport network.
The success of this project has seen the
manufacturers Precision Buses contracted
to produce 50 more low carbon buses
for New South Wales, Queensland and
Victoria. This will increase the number of
employees at the organisation from 29 to
79 (Business Insider 2017).
CASE STUDY 3:
ACT Zero Emission Vehicle Action Plan
The ACT Government is on track to
achieve 100% renewable electricity by
2020, and has a target to reach net zero
emissions before 2050. With transport a
key source of greenhouse gas pollution
in the ACT, the Government has released
an action plan to dramatically reduce
greenhouse gas pollution from vehicles as
well as encouraging people to walk, cycle
and use public transport instead of driving.
The ACT Government has already
undertaken a number of actions including:
› Transitioning the ACT Government
fleet to zero emissions vehicles. The
ACT Government now has 17 electric
vehicles, 7 plug-in hybrid vehicles, 62
hybrid vehicles and 8 electric bikes
› Trialling battery electric buses on a
number of routes throughout Canberra
› Investigating hydrogen vehicles
› Encouraging the rollout of public
charging infrastructure
Future actions include:
› All newly leased ACT Government
vehicles will be zero emissions from
2020-21
› Investigating covered car parks with
solar powered vehicle charging stations
› Creating incentives for zero emissions
vehicles such as parking priority and
ability to drive in transit lanes (ACT
Government 2018)
44 WAITING FOR THE GREEN LIGHT:
TRANSPORT SOLUTIONS TO CLIMATE CHANGE

CHAPTER 06
CASE STUDIES
CASE STUDY 4:
Queensland Electric Vehicle Superhighway
The Queensland Government have
recently rolled out stage one of what they
claim to be the world’s longest electric
vehicle highway in a single state. The
project came online in January 2018 and
connects Coolangatta in the south east of
the state to Cairns in the far North. All of
these chargers are superfast DC chargers
and most of them have been installed by
Brisbane-based company Tritium. Tritium’s
DC chargers can charge an EV battery in as
little as 10 minutes (Reneweconomy 2018b).
This project enables long distance trips
to be undertaken in electric vehicles
across Queensland. Further charging
stations will come online later this year
(Reneweconomy 2018b).
CASE STUDY 5:
Melbourne’s Solar Powered Tram Network
Victoria’s tram network is one of the largest
in the world, with 200 million boardings
every year (Yarra Trams 2018). The entire
tram network will soon be powered by 100%
renewable energy, with the construction of
138MW of solar capacity by the end of 2018.
The Bannerton and Numurkah solar farms
in northern Victoria are being built after
winning a Victoria government tender in
2017 (Premier of Victoria 2017).
Figure 17: Melbourne’s trams will soon get all their electricity from solar plants.
45

CASE STUDY 6:
Adelaide’s World First Solar Electric Bus and electric vehicle charging stations
Adelaide is home to the world’s only pure
electric bus powered entirely by solar energy.
Unlike other solar powered transport, the
“Tindo” bus does not have solar panels on
its roof. Instead it is recharged by energy
from solar panels on the roof of the Adelaide
Central Bus Station. The bus runs on
Adelaide’s free connector bus service every
day (City of Adelaide 2013).
The City of Adelaide installed 19 fast-
charging stations in the Central Market
precinct in 2017. These charging stations
are DC chargers. This means they can fully
charge an electric vehicle with a range of
52 km (eg. Mitsubishi Outlander) in just 30
minutes. Tesla Superchargers have also been
installed, which can charge a Tesla Model
S and Model X with a range of 270 km - in
just 30 minutes. The Tesla Superchargers
will eventually be rolled out across South
Australia and enable a Tesla car to travel
from Adelaide up to Brisbane (Premier of
South Australia 2017).
A further 25 charging stations will be
installed throughout the city by mid-2018
(Premier of South Australia 2017).
Figure 18: Adelaide’s world-leading solar electric bus.
46 WAITING FOR THE GREEN LIGHT:
TRANSPORT SOLUTIONS TO CLIMATE CHANGE

CHAPTER 06
CASE STUDIES
CASE STUDY 7:
Sustainable Transport Moreland, Victoria - integrated transport strategy
The city of Moreland in inner urban
Melbourne has developed an integrated
strategy for transport which aims to achieve
a shift to more environmentally sustainable
travel behaviour; support transport access
for all parts of the community; and improve
safety and support development around
transport hubs (with access to trains, trams,
bicycle and walking paths) in Moreland.
Moreland supports car sharing services
for residents who don’t own a car. In 2012,
the council installed Victoria’s first electric
vehicle charging station, it now has three
charging points throughout the city, and
is integrating electric cars into its council
fleet (Figure 19). The council has strategies
to encourage walking, cycling and public
transport in Moreland (City of Moreland 2017).
Figure 19: One of Moreland City Council’s electric vehicle charging points.
City of Moreland installed Victoria’s first electric vehicle charging station.
47

6.2 International CASE STUDY 8:
Sustainable transport Washington, D.C. - transport targets and actions
In 2012, Washington DC (population
643,000), embarked on an ambitious and
comprehensive plan “Sustainable DC”,
to tackle the city’s key sustainability
challenges of jobs and economic growth;
health and wellness; equity and diversity;
and climate and environment (Sustainable
DC 2016). The plan includes a target for 50%
of city’s power use (both council operations
and the community) to come from
renewable energy sources by 2032.
Transportation was identified as one of
the Sustainable DC plan’s seven key areas.
Specific targets were set for trips within
the city by 2032 - with car travel to decrease
to less than 25% of trips, public transport
trips to increase to 50%, and biking and
walking to increase to 25%. The goals and
targets were underpinned by a detailed
action plan (Table 7).
As a result of its actions, 2016 saw
Washington DC become the equal first out
of 50 US cities (tied with Boston) for the
proportion of commuters walking or cycling,
and second best (after New York) when
public transport was included (Alliance for
Biking and Walking 2016). The city was one
of two major cities (with Portland, Oregon)
to make a significant gain in the share of
commuters biking and walking (Alliance for
Biking and Walking 2016).
Nearly 39% of Washington DC residents now
commute by public transport, nearly 13%
walk and 4% ride (Alliance for Biking and
Walking 2016). These shares are significantly
higher than the average mode shares for
Australian cities - 14% by public transport,
3.8% walk and 1.3% ride on average
(Australian Government 2013).
Figure 20: Washington DC Capital bike share scheme.
48 WAITING FOR THE GREEN LIGHT:
TRANSPORT SOLUTIONS TO CLIMATE CHANGE

CHAPTER 06
CASE STUDIES
Table 7: Sustainable DCs Transportation Goals, Targets and Actions.
Goals Targets Actions
Improve connectivity and accessibility through efficient, integrated, and affordable transit systems
Increase use of public transit to 50% of all commuter trips
› Complete 60 kilometres of tram networks
› Improve transit connections to employment and activity centers from underserved areas
› Define and secure permanent funding for transit planning and improvements
› Design transit systems for resilience to extreme weather events
Expand provision of safe, secure infrastructure for cyclists and pedestrians
Increase biking and walking to 25% of all commuter trips
› Develop a citywide, 100-mile bicycle lane network
› Expand the Capital Bikeshare program by 200 stations
› Partner with community organizations to deliver bike and pedestrian safety education
› Collect data to improve understanding of cyclist and pedestrian travel patterns
› Program crosswalks and traffic lights for improved safety and convenience of pedestrians and cyclists
Reduce traffic congestion to improve mobility
Reduce commuter trips made by car or taxi to 25%
› Implement an expanded Performance-Based Parking program
› Expand car-sharing programs to low-income residents using financial tools
› Encourage private businesses to offer incentives for employee travel by transit, walking, or biking
› Encourage and promote telecommuting and alternative work schedules for employees
› Study the feasibility of a regional congestion fee for travel during peak hours
Improve air quality along major transportation routes
Eliminate all “unhealthy” air quality index days, including “unhealthy for sensitive groups”
› Strictly limit idling engines.
› Require District Government, and encourage private businesses, to purchase clean fuel, low-emission fleet vehicles.
› Expand electric vehicle charging infrastructure throughout the city
› Offer incentives to avoid driving and other emission-generating activities on predicted Code Red and Orange air quality days
› Track and report mileage data from clean fuel, low-emission, and electric vehicles
Source: Sustainable DC 2016.
49

CASE STUDY 9:
Houston bus network re-design
Houston is often regarded as one of the
world’s most car-dependent cities. Three
years ago Houston made dramatic changes
to the design of its bus network in order to
encourage more commuters out of their
cars and onto public transport.
In 2015, the Houston Metro completely
redesigned the city’s bus network, routes
and timetables. The transformation
involved shifting away from a system where
most routes ran to and from the city, to a
grid network of bus routes cutting across
the city, with more frequent services.
Key elements of the redesign included:
› More frequent buses running at least
every 15 minutes along major routes
› Routes and timetables that enable
commuters to easily transfer from one
route to another
› More predictable buses run on the same
schedules on weekdays and weekends
› New routes following a grid pattern
enabling people to more easily and
directly travel to and from a greater range
of locations across Houston (not just the
city centre) (Mobility Lab 2018).
Prior to the re-design, the bus service had
experienced a 20% decline in patronage
between 2007 and 2011 (Mobility Lab 2018).
The bus network overhaul is widely judged
to have been a success with local bus and
light-rail systems recording a gain of 4.5
million boardings – an increase of 6.8% -
between September 2015 and July 2016 (City
Lab 2016). Bus ridership on Saturdays and
Sundays has increased even more, with 13%
and 34% increases respectively (City Lab
2016). Houston is one of only two United
States cities (along with Seattle) to increase
bus patronage in the last three years.
50 WAITING FOR THE GREEN LIGHT:
TRANSPORT SOLUTIONS TO CLIMATE CHANGE

Figure 21: Houston Metro Re-design - before and after.

CASE STUDY 10:
New Zealand Urban Cycleways Programme
The New Zealand Government is investing
NZ$333 million on cycling infrastructure
through its Urban Cycleways Programme.
The program is funding over 50 new
cycleways, with 36 of the projects completed
or under construction.
The completed cycleway projects are already
encouraging an increase in cycling, for
example in Christchurch there has been a 21%
annual increase in people riding their bikes
into the city (New Zealand Government 2017).
CASE STUDY 11:
China’s Train Metro Network
Since 1995, the number of Chinese cities with
metro lines has increased from 1 to 25 and
that number is still rising. Across the country,
there are now more than 5,000 kilometres of
metro lines (not including commuter services
between cities and the country’s extensive high
speed rail network) (The Transport Politic 2018).
This investment has led to massive increases in
public transport use. Ridership on Beijing and
Shanghai’s metro systems alone has doubled
since 2010 (The Transport Politic 2018).
A recent study by Gao and Newman (2018) has
shown that Shanghai and Beijing have both
peaked in private car use per capita as both
Metros have grown so popular. The result has
been a decoupling of economic growth from
car use, showing how it is feasible to enable
the transition to low carbon options without
losing jobs and economic opportunities.
Figure 22: Aucklands Nelson Street cycleway.
Figure 23: Inside a train in the Shanghai metro.
52 WAITING FOR THE GREEN LIGHT:
TRANSPORT SOLUTIONS TO CLIMATE CHANGE

CHAPTER 06
CASE STUDIES
CASE STUDY 12:
Shenzhen, China - world’s first fully electric bus fleet
China is leading the global rollout of electric
buses, with over 300,000 on the road at the
end of 2017. In the Chinese city of Shenzhen,
the city’s entire 16,000-strong bus fleet was
converted to electric vehicles by the end of last
year. The replacement of the city’s diesel bus
fleet began with a pilot in 2011 – just 7 years
ago. Now, the city of 11.9 million people – half
the size of Australia – is entirely serviced by
electric buses (CleanTechnica 2017).
Figure 25: One of Shenzhen’s electric buses being charged.
ELECTRIC BUS ADOPTION IN SHENZHEN, CHINA
Nu
mb
er o
f v
ehic
les
2017
5,000
0
10,000
15,000
20,000
20162015201420132012
16,359
14,063
4,877
1,277697277
Figure 24: Electric bus adoption in Shenzhen, China.
Source: WRI 2018.
53

CASE STUDY 13:
Santiago’s Public Transport Powered by Solar
The public transport system in Santiago,
the capital of Chile in South America, will
be run almost entirely on solar energy,
after a power purchase agreement was
signed to supply the system with solar
power. The agreement will support the
construction of a 100MW solar farm that
will begin operating in 2018. This will
massively reduce pollution from Chile’s
public transport system, which currently
transports 2.2 million passengers a day
(CleanTechnica 2016).
CASE STUDY 14:
One Third of New Zealand Government Cars to be EV’s
The New Zealand Government has pledged
that one-third of the government car fleet
will be hybrid or electric by 2021. The
Government currently has 15,500 vehicles,
so by 2021, it will have 5,000 hybrid or
electric vehicles. This will contribute to
New Zealand’s plan to have 64,000 electric
vehicles by 2021 (National 2017).
Currently New Zealand has just 4,200
electric vehicles, although this is
significantly higher than in May 2016,
when just 1,300 vehicles were electric
(National 2017).
Figure 26: A view of Santiago’s metro train line, which will soon be powered by solar.
54 WAITING FOR THE GREEN LIGHT:
TRANSPORT SOLUTIONS TO CLIMATE CHANGE

CHAPTER 06
CASE STUDIES
Figure 27: Electric Vehicles in India.
CASE STUDY 15:
California Aims for Five Million Electric Vehicles
California has ambitious plans for electric
vehicles, with a target for 1.5 million by
2025 and 5 million by 2030 (Reuters 2018b).
The state is already on its way to meeting
the 2025 target, with the second largest
EV market in the world consisting of over
300,000 fully electric and hybrid vehicles
(Forbes 2017). Importantly the EV target
is accompanied by other policies, such as
the addition of 250,000 vehicle charging
stations and 200 hydrogen fuelling
stations by 2025 - at a cost of $2.5 billion
(Reuters 2018b).
Strong, clear policies like California’s EV
targets have motivated car makers to build
dozens of new EV models (Reuters 2018b).
CASE STUDY 16:
India Plans for EV Future by 2030
In order to deal with poor air quality and
pollution, India plan to phase out the sale
of all diesel cars by 2030. This ambitious
target would require around 10 million
electric cars to be sold in 2030 - dwarfing
the global total of electric cars in 2015
(which stood at just 1.3 million). In 2016,
there were just 5,000 EV’s on Indian roads
(Bloomberg 2017).
Along with significantly reducing toxic
pollution and CO2 emissions, the plan
would also significantly cut India’s oil
imports (Bloomberg 2017).
55

CASE STUDY 17:
Electric Car Targets in Europe and beyond
There is a range of countries in Europe
that have set up electric vehicle targets
including Germany, France, the United
Kingdom, Spain, Denmark, Ireland, Austria,
Portugal and the Netherlands. These
targets vary from the partial uptake of
electric cars to the complete replacement
of petrol and diesel cars (IEA 2017a).
Eight states in the United States have also
introduced electric car targets, as have
China, Japan, South Korea and India (see
above). Combining all these targets, the
International Energy Agency estimates
that 13 million electric cars will be
deployed amongst these countries by
2020 (IEA 2017a).
CASE STUDY 18:
Car Companies Building a European Charging Network
Volkswagen, BMW, Ford and Daimler (part of
Mercedes) are starting construction on a $50
billion fast charging network along highways
across Europe. The companies plan to have
100 fast charging stations in place by the
end of 2018 and 400 by 2020. This project
will enable owners of electric cars to make
transcontinental journeys without having
to worry about where to charge their cars
(Automotive News Europe 2018).
This project builds upon the leadership
shown by a range of European countries.
Germany has already developed a
comprehensive charging network that
includes 8,515 charging outlets. This is one
third higher than the 2016 total (Automotive
News Europe 2018).
56 WAITING FOR THE GREEN LIGHT:
TRANSPORT SOLUTIONS TO CLIMATE CHANGE

CONCLUSION
7. Conclusion Now is Australia’s opportunity to cut greenhouse gas pollution from transport while moving people in our cities more efficiently, reducing urban air pollution and noise and saving commuters money.
Australia’s growing cities are starting to
see breakdowns in the performance of
the current transport systems. Stress,
congestion, air pollution, noise, ever
increasing public space dedicated to roads,
and the high cost of private transport are
all exacerbated by our current reliance on
roads and high polluting cars.
Cities around the world are fast-tracking
transport solutions to climate change with
three key strategies for reducing pollution
from the transport sector:
1. Avoiding or reducing the need to
travel. This can be achieved through
improved telecommunications and
urban planning.
2. Providing viable alternatives to driving,
such as expanding access to reliable,
comfortable public transport, cycling
and walking alternatives.
3. Reducing pollution across transport
modes and vehicles. This can be
achieved by electrifying and powering
cars, buses, trains and light rail with
100% renewable energy. In addition,
policies supporting stringent,
mandatory greenhouse gas emissions
standards for cars and other vehicles
(and strengthening these over time)
could be adopted.
It’s time for Australia to get on board with
transport solutions to climate change.
57

ReferencesABS (Australian Bureau of Statistics) (2017a) 3101.0 - Australian Demographic Statistics, Dec 2016. Accessed at http://www.abs.gov.au/AUSSTATS/[email protected]/Lookup/3101.0Main+Features1Dec%202016?OpenDocument
ABS (2017b) 6530.0 - Household Expenditure Survey, Australia: Summary of Results, 2015-16. Accessed at http://www.abs.gov.au/ausstats/[email protected]/Latestproducts/6530.0Main%20Features32015-16
ABS (2017c) 2017 Motor Vehicle Census. Accessed at http://www.abs.gov.au/AUSSTATS/[email protected]/DetailsPage/9309.031%20Jan%202017?OpenDocument
ABS (2018a) 3218.0 - Regional Population Growth, Australia, 2016-17. Accessed at http://www.abs.gov.au/ausstats/[email protected]/latestProducts/3218.0Media%20Release12016-17?OpenDocument
ABS (2018b) 9309.0 - Motor Vehicle Census, Australia, 31 Jan 2018. Accessed at http://www.abs.gov.au/ausstats/[email protected]/mf/9309.0
ACCC (Australian Competition and Consumer Commission) (2017) Retail Electricity Pricing Inquiry.Preliminary Report. Accessed at https://www.accc.gov.au/system/files/Retail%20Electricity%20Inquiry%20-%20Preliminary%20report%20-%2013%20November%202017.pdf
ACEEE (American Council for an Energy-Efficient Economy) (2014) The 2014 International Energy Efficiency Scorecard. Accessed at http://aceee.org/research-report/e1402
ACEEE (2016) The 2016 International Energy Efficiency Scorecard. Accessed at http://aceee.org/research-report/e1602
ACEEE (2018) The 2018 International Energy Efficiency Scorecard.
ACOLA (Australian Council of Leaned Academies) (2015) Delivering Sustainable Urban Mobility. Accessed at https://acola.org.au/wp/PDF/SAF08/SAF08_FullReport_web.pdf
ACT Government (2018) The ACT’s Transition to Zero Emissions Vehicles. Accessed at https://www.environment.act.gov.au/__data/assets/pdf_file/0012/1188498/2018-21-ACTs-transition-to-zero-emissions-vehicles-Action-Plan-ACCESS.pdf
Adelaide City Council (2017) Sustainability Incentives Scheme. Accessed at https://www.cityofadelaide.com.au/your-council/funding/sustainable-city-incentives-scheme/
AECOM (2015) Energy Storage Study. Funding and knowledge sharing priorities. Prepared for ARENA. Accessed at http://arena.gov.au/files/2015/07/AECOM-Energy-Storage-Study.pdf
Aftabuzzaman M, Currie G and Sarvi M (2010) Evaluating the Congestion Relief Impacts of Public Transport in Monetary Terms. Journal of Public Transportation, Vol. 13, No. 1, 2010. Accessed at http://www.nctr.usf.edu/wp-content/uploads/2010/05/JPT13-1Aftabuzzaman.pdf.
Alliance for Biking and Walking (2016) Bicycling and Walking in the United States. 2016 Benchmarking Report. Accessed at http://www.bikewalkalliance.org/storage/documents/reports/2016benchmarkingreport_web.pdf.
AMP (2011) Race against time. How Australians spend their time. Accessed at http://media.corporate-ir.net/media_files/IROL/21/219073/AMP_NATSEM_Income_&_Wealth_Report_Race_against_time.pdf
Australian Energy Council (2016) Renewable Energy in Australia. How do we really compare? Accessed at https://www.energycouncil.com.au/media/1318/2016-06-23_aecrenewables-fact-sheet.pdf
Australian Government (2013) Walking, Riding and Access to Public Transport: Supporting Active Travel in Australian Communities. Accessed at https://infrastructure.gov.au/infrastructure/pab/active_transport/files/infra1874_mcu_active_travel_report_final.pdf.
Australian Government (2017) Review of climate change policies. Discussion Paper. Accessed at https://www. environment.gov.au/system/files/consultations/dcb346e1- f0c0-4ba4-aa83-047c062b4bbc/files/discussion-paperreview-of-climate-change-policies-2017.pdf.
Automotive News Europe (2018) ‘Charging on highways in Germany is very easy’. 13 February 2018. Accessed at: http://europe.autonews.com/article/20180213/COPY/302139921/charging-on-highways-in-germany-is-very-easy
Beavis M and Moodie M (2014) Incidental physical activity in Melbourne, Australia: health and economic impacts of mode of transport and suburban location. Health Promotion Journal of Australia. 2014 December 25(3): 174-81.
Beck M and Bliemer M (2015) Do more roads really mean less congestion for commuters? The Conversation. Accessed at https://theconversation.com/do-more-roads-really-mean-less-congestion-for-commuters-39508
BITRE (Bureau of Infrastructure, Transport and Regional Economics) (2016a) Five facts about commuting in Australia. Accessed at https://bitre.gov.au/publications/2016/files/is_077.pdf
BITRE (2016b) Traffic and congestion cost trends for Australian capital cities. Accessed at https://bitre.gov.au/publications/2015/is_074.aspx
BITRE (2016b) Cities. Lengthy commutes in Australia. Accessed at https://bitre.gov.au/publications/2016/files/rr_144.pdf
58 WAITING FOR THE GREEN LIGHT:
TRANSPORT SOLUTIONS TO CLIMATE CHANGE

REFERENCES
BITRE (2017) Australian Infrastructure Statistics Yearbook 2017. Accessed at https://bitre.gov.au/publications/2017/files/yearbook_2017.pdf
Bloomberg (2017) India’s 2030 All-Electric Car Target Seen ‘Ambitious’ by IEA. 12 May 2017. Accessed at: https://www.bloomberg.com/news/articles/2017-05-11/india-s-2030-all-electric-car-target-seen-ambitious-by-iea
BNEF (Bloomberg New Energy Finance) (2018a) Electric Buses in Cities. Accessed at https://c40-production-images.s3.amazonaws.com/other_uploads/images/1724_BNEF_C40_Electric_buses_in_cities_FINAL_APPROVED.original.pdf?1523349304
BNEF (2018b) Electric Buses Will Take Over Half the World Fleet by 2025. Accessed at https://www.bloomberg.com/news/articles/2018-02-01/electric-buses-will-take-over-half-the-world-by-2025
Business Insider (2017) South Australia just built the nation’s first electric bus. 27 June 2017. Accessed at: https://www.businessinsider.com.au/south-australia-just-built-the-nations-first-electric-bus-2017-6
C40 Cities (2017) C40 Fossil-Fuel-Free Streets Declaration. Accessed at https://www.c40.org/other/fossil-fuel-free-streets-declaration
CCA (2014) Light Vehicle Emissions Standards for Australia Research Report. Accessed at http://www.climatechangeauthority.gov.au/files/files/Light%20Vehicle%20Report/Lightvehiclesreport.pdf.
City of Adelaide (2013) Tindo The World’s First Solar Electric Bus. Accessed at https://www.cityofadelaide.com.au/assets/documents/FACTSHEET-tindosolar-bus.pdf
City Lab (2016) A Year After a Radical Route Rethink, Houston’s Transit Ridership Is Up. 18 August 2016. Accessed at: https://www.citylab.com/transportation/2016/08/houston-bus-system-ridership/496313/
City of Gold Coast (2017) Light rail. Accessed at: http://www.goldcoast.qld.gov.au/rapid-transit-6004.html
City of Melbourne (2018a) Transport Strategy Discussion Paper City Space. Accessed at https://s3.ap-southeast-2.amazonaws.com/hdp.au.prod.app.com-participate.files/9515/2280/6517/Transport_Strategy_Refresh_-_Discussion_paper_city_space.pdf
City of Melbourne (2018b) Public Transport Network. Transport Strategy Discussion. Accessed at https://participate.melbourne.vic.gov.au/transportstrategy/public-transport-network
City of Moreland (2017) Sustainable transport. Accessed at http://www.moreland.vic.gov.au/environment-bins/environment/sustainable-transport/.
Clean Energy Regulator (2018) Electricity sector emissions and generation data 2016–17. Accessed at http://www.cleanenergyregulator.gov.au/NGER/National%20greenhouse%20and%20energy%20reporting%20data/electricity-sector-emissions-and-generation-data/electricity-sector-emissions-and-generation-data-2016-17?Paged=TRUE&PagedPrev=TRUE&p_Title=Corporate%20Total&p_ID=561&View=%7b14EFC728-3B4A-49C8-BFA7-BACFD39B7323%7d&PageLastRow=100
CleanTechnica (2016) World’s 1st Public Transport System to Run on Solar. 24 May 2016. Accessed at: https://cleantechnica.com/2016/05/24/worlds-first-public-transport-system-run-solar/
CleanTechnica (2017) 100% Electric Bus Fleet for Shenzhen (Population 11.9 Million) By the End of 2017. 12 November 2017. Accessed at: https://cleantechnica.com/2017/11/12/100-electric-bus-fleet-shenzhen-pop-11-9-million-end-2017/
Climate Council (2018) 2017: Another Record-Breaking Year for Heat and Extreme Weather. Accessed at https://www.climatecouncil.org.au/uploads/8e9c2b91ce3c3ebb7d97e403 a6fdf38e.pdf.
ClimateWorks (2014) Pathways to Deep Decarbonisation in 2050: How Australia can prosper in a low carbon world. Accessed at https://www.climateworksaustralia.org/sites/default/files/documents/publications/climateworks_pdd2050_technicalreport_20140923.pdf
ClimateWorks (2018) The State of Electric Vehicles in Australia. Second Report.
CNN (2017) These countries want to ditch gas and diesel cars. Accessed at http://money.cnn.com/2017/07/26/autos/countries-that-are-banning-gas-cars-for-electric/index.html
Commonwealth of Australia (2016a) State of the Environment. Increased pollution. Accessed at https://soe.environment.gov.au/theme/built-environment/topic/2016/increased-pollution
Commonwealth of Australia (2016b) State of the Environment. Liveability: Transport. Increased pollution. Accessed at https://soe.environment.gov.au/theme/built-environment/topic/2016/livability-transport
Commonwealth of Australia (2016c) Smart Cities Plan
Currie G (2016) Benchmarking Public Transport in Melbourne. Accessed at http://publictransportresearchgroup.info/wp-content/uploads/2017/02/PRESENTATION-2016-Transport-for-Melbourne-Benchmarking-PT-in-Melbourne.pdf
Dallmann T, Du L, Minjares R (2017) Low-carbon technology pathways for soot-free urban bus fleets in 20 megacities. Accessed at https://www.theicct.org/sites/default/files/publications/Low-carbon-tech-pathways-soot-free-buses-megacities_ICCT-working-paper_31082017_vF.pdf
59

IEA (International Energy Agency) (2017a) Global EV Outlook 2017. Accessed at: https://www.iea.org/publications/freepublications/publication/GlobalEVOutlook2017.pdf
IEA (2017b) Tracking Clean Energy Progress 2017. Accessed at https://www.iea.org/publications/freepublications/publication/TrackingCleanEnergyProgress2017.pdf
Infrastructure Australia (2016) Australian Infrastructure Plan. Accessed at http://infrastructureaustralia.gov.au/policy-publications/publications/files/Australian_Infrastructure_Plan.pdf
Institute for Sensible Transport (2016) Emerging transport technologies: Assessing impacts and implications for the City of Melbourne. Accessed at https://www.melbourne.vic.gov.au/sitecollectiondocuments/emerging-transport-technologies-report.pdf
International Transport Forum (2013) Funding Urban Public Transport. Case Study Compendium 2013. Accessed at http://www.internationaltransportforum.org/pub/pdf/13Compendium.pdf.
IPCC (2014) Summary for Policymakers. In: Climate Change 2014: Mitigation of Climate Change. Contribution of Working Group III to the Fifth Assessment Report of the Intergovernmental Panel on Climate Change [Edenhofer, O., R. Pichs-Madruga, Y. Sokona, E. Farahani, S. Kadner, K. Seyboth, A. Adler, I. Baum, S. Brunner, P. Eickemeier, B. Kriemann, J. Savolainen, S. Schlömer, C. von Stechow, T. Zwickel and J.C. Minx (eds.)]. Cambridge University Press, Cambridge, United Kingdom and New York, NY, USA.
Kleinman and Rohr (2018) What if autonomous vehicles actually make us more dependent on cars? https://theconversation.com/what-if-autonomous-vehicles-actually-make-us-more-dependent-on-cars-98498
Litman (2010) Raise My Taxes, Please! Evaluating Household Savings From High Quality Public Transit Service. Victoria Transport Policy Institute. Accessed at http://www.vtpi.org/raisetaxes.pdf
Lutsey L, Grant M, Wappelhorst S, Zhou H (2018) Power Play: How Governments are Spurring the Electric Vehicle Industry. Accessed at https://www.theicct.org/sites/default/files/publications/EV_Government_WhitePaper_20180514.pdf
Matan A and Newman P (2016) People Cities: The Life and Legacy of Jan Gehl, Island Press, Washington DC
Mobility Lab (2018) Houston bucks national trend of transit bus system decline. Accessed at https://mobilitylab.org/2018/03/21/houston-bucks-national-trend-transit-bus-system-decline/
Motor Industry Association (2018) Vehicle Sales. Accessed at https://www.mia.org.nz/Portals/0/MIA-Sales%20Data/Vehicle%20Sales/Monthly%20Passenger%20Sales%20Stats/Passenger%20Registration%20Stats%20Full%20Year%202017%20.pdf
National (2017) Bold new electric vehicle target for Government. 12 August 2017. Accessed at: https://www.national.org.nz/bold_new_electric_vehicle_target_for_government
Department of the Environment and Energy (2017) Australia’s emissions projections 2017. Accessed at http://www.environment.gov.au/system/files/resources/eb62f30f-3e0f-4bfa-bb7a-c87818160fcf/files/australia-emissions-projections-2017.pdf
Department of the Environment and Energy (2018a) Quarterly Update of Australia’s National Greenhouse Gas Inventory: December 2017 Incorporating NEM electricity emissions up to March 2018. Accessed at http://www.environment.gov.au/system/files/resources/7b9824b8-49cc-4c96-b5d6-f03911e9a01d/files/nggi-quarterly-update-dec-2017-revised.pdf
Department of the Environment and Energy (2018b) State and Territory Greenhouse Gas Inventories 2016. Accessed at http://www.environment.gov.au/system/files/resources/a97b89a6-d103-4355-8044-3b1123e8bab6/files/state-territory-inventories-2016.pdf
Department of Infrastructure, Regional Development and Cities (2018) Road deaths Australia. Accessed at https://bitre.gov.au/publications/ongoing/rda/files/RDA_June_2018_rev.pdf
Electrek (2017) 12 major cities pledge to only buy all-electric buses starting in 2025. 23 October 2017. Accessed at: https://electrek.co/2017/10/23/electric-buses-12-major-cities-pledge-2025/
ESAA (Energy Supply Association of Australia) (2013)Sparking an Electric Vehicle Debate in Australia. Accessed at http://ewp.industry.gov.au/files/Sparking%20an%20Electric%20Vehicle%20Debate%20in%20Australia.pdf.
FCAI (Federal Chamber of Automotive Industries) (2018) Sales. Accessed at https://www.fcai.com.au/sales
Forbes (2017) California wants more than 4.2 million electric vehicles by 2030; a new plan charts the road ahead. 14 December 2017. Accessed at: https://www.forbes.com/sites/energyinnovation/2017/12/14/california-wants-4-2-million-electric-vehicles-by-2030-a-new-state-plan-charts-the-road-ahead/#20495fa14b44
Gao Y and Newman P (2018) Beijing’s Peak Car Transition: Hope for Emerging Cities in the 1.5 °C Agenda. Urban Planning (ISSN: 2183–7635) 2018, Volume 3, Issue 2, Pages 82–93 DOI: 10.17645/up.v3i2.1246
Glazebrook G (2009) Taking the Con Out of Convenience: The True Cost of Transport Modes in Sydney. Urban Policy and Research
Glazebrook G and Newman P (2018) The City of the Future. Urban Planning (ISSN: 2183–7635) 2018, Volume 3, Issue 2, Pages 1–20 DOI: 10.17645/up.v3i2.1247
Glover L (2013) New freeways cure congestion: time to put the myth to bed. The Conversation. Accessed at https://theconversation.com/new-freeways-cure-congestion-time-to-put-the-myth-to-bed-13896
Gold Coast Light Rail (2017) Gold Coast Light Rail Stage 2. Accessed at: http://www.goldcoastlightrail.com.au/gold-coast-light-rail-stage-2/
Hawken P (2017) Drawdown: the most comprehensive plan ever proposed to reverse global warming, New York, New York Penguin Books.
60 WAITING FOR THE GREEN LIGHT:
TRANSPORT SOLUTIONS TO CLIMATE CHANGE

REFERENCES
Pojani D, Butterworth E, Cooper J, Corcoran J, Sipe N (2018) Australian cities are far from being meccas for walking and cycling. The Conversation. https://theconversation.com/australian-cities-are-far-from-being-meccas-for-walking-and-cycling-87331
Premier of South Australia (2017) Adelaide charged up as hub for electric vehicles. 27 September 2017. Accessed at: https://www.premier.sa.gov.au/index.php/jay-weatherill-news-releases/8080-adelaide-charged-up-as-hub-for-electric-vehicles
Premier of Victoria (2017) Renewable Energy a Jobs Boom for Victoria. 23 August 2017. Accessed at: https://www.premier.vic.gov.au/renewable-energy-a-jobs-boom-for-victoria/
Quartz (2017) An electric bus just snagged a world record by driving 1,100 miles on a single charge. Accessed at https://qz.com/1078326/an-electric-bus-just-snagged-a-world-record-by-driving-1100-miles-on-a-single-charge/
Renew Economy (2018a) Beryl solar farm to power NSW trains, may add battery storage. Accessed at https://reneweconomy.com.au/beryl-solar-farm-power-nsw-trains-may-add-battery-storage-25337/
Renew Economy (2018b) Phase one of “world’s largest” EV fast-charging network completed in Queensland. 31 January 2018. Accessed at: http://reneweconomy.com.au/phase-one-worlds-largest-ev-fast-charging-network-completed-queensland-15062/
Reuters (2018a) Norway powers ahead (electrically): over half new car sales now electric or hybrid. Accessed at https://www.reuters.com/article/us-environment-norway-autos/norway-powers-ahead-over-half-new-car-sales-now-electric-or-hybrid-idUSKBN1ES0WC
Reuters (2018b) California looks to ramp up electric vehicle sales. 27 January 2018. Accessed at: https://www.reuters.com/article/us-autos-emissions-california/california-looks-to-ramp-up-electric-vehicle-sales-idUSKBN1FF2XG
Rissel C, Curac N, Greenaway M and Bauman A (2012) Physical Activity Associated with Public Transport Use—A Review and Modelling of Potential Benefits. Int. J. Environ. Res. Public Health 2012, 9(7), 2454-2478. Accessed at http://www.mdpi.com/1660-4601/9/7/2454/htm.
Schofield R, Walter C, Silver J, Brear M, Rayner P, Bush M (2017) Submission on the “Better fuel for cleaner air” discussion paper. Clean Air and Urban Landscapes Hub. Accessed at http://www.nespurban.edu.au/publications-resources/research-reports/CAULRR06_SubmissionFuelQualityStandardsAct2000_Mar2017.pdf
SFMTA (San Francisco Municipal Transportation Agency) (2018) San Francisco Commits To All-Electric Bus Fleet By 2035. Accessed at https://www.sfmta.com/press-releases/san-francisco-commits-all-electric-bus-fleet-2035
Newman P, Beatley T and Boyer H (2009) Resilient Cities. Responding to Peak Oil and Climate Change. Island Press: Washington, Covelo, London, 166pp.
Newman P, Beatley T and Boyer H (2017) Resilient Cities: Overcoming Fossil Fuel Dependence, Island Press, Washington DC
Newman P, Glazebrook G, Kenworthy J (2012) All aboard: the growth of global rail and our future cities. Accessed at https://theconversation.com/all-aboard-the-growth-of-global-rail-and-our-future-cities-10377
Newman P and Kenworthy J (2015) The End of Automobile Dependence: How Cities are Moving Beyond Car-based Planning, Island Press, Washington DC.
Newman P (2017) Low carbon mobility and reducing automobile dependence. In Low Carbon Mobility for Future Cities Principles and Applications, 65-90. London, United Kingdom: IET.
Newman P, Davies-Slate S, Jones E (2017) The Entrepreneur Rail Model: Funding urban rail through majority private investment in urban regeneration, Research in Transportation Economics (2017) http://dx.doi.org/10.1016/j.retrec.2017.04.005
Newman P, Kosonen L, Kenworthy J (2016) Theory of urban fabrics: Planning the walking, transit/public transport and automobile/motor car cities for reduced car dependency
News.com.au (2018a) Flying foxes ‘boiled alive’ in Sydney heatwave. Accessed at http://www.news.com.au/technology/environment/flying-foxes-boiled-aliveinsydney-heatwave/news-story/4b7bc870520851c377832d1cf37ce8b1.
New Zealand Government (2017) Govt $333m Urban Cycleways Programme achieves halfway point. Accessed at https://www.beehive.govt.nz/release/govt-333m-urban-cycleways-programme-achieves-halfway-point
Nieuwenhuis (2017) Fact Check: are diesel cars really more polluting than petrol cars? The Conversation. Accessed at https://theconversation.com/fact-check-are-diesel-cars-really-more-polluting-than-petrol-cars-76241
NOAA (National Oceanic and Atmospheric Administration) (2018) Global Analysis - Global Climate Report -Annual 2017. Accessed at: https://www.ncdc.noaa.gov/sotc/global/201713
NRMA (2017) The future of car ownership. Accessed at https://www.mynrma.com.au/-/media/documents/reports-and-subs/the-future-of-car-ownership.pdf?la=en
NTC (National Transport Commission) (2017) Carbon Dioxide Emissions Intensity for New Australian Light Vehicles 2016. Accessed at https://www.ntc.gov.au/Media/Reports/(35220AEE-C4EA-9AC6-1BB6-88D8C66D80F5).pdf
NZ Transport Agency (2018) National Vehicle Fleet Status. Accessed at https://www.nzta.govt.nz/resources/new-zealand-motor-vehicle-register-statistics/national-vehicle-fleet-status/
Office of the Mayor (2016) Washington, DC Population Now Highest in 40 Years. Accessed at https://mayor.dc.gov/release/washington-dc-population-now-highest-40-years.
61

The Guardian (2018) Vienna named world’s most liveable city as Melbourne loses crown. Accessed at https://www.theguardian.com/australia-news/2018/aug/14/vienna-named-worlds-most-liveable-city-as-melbourne-loses-crown
The ICCT (The International Council on Clean Transportation) (2015) Global passenger vehicle standards. Accessed at http://www.theicct.org/info-tools/globalpassenger-vehicle-standards.
The ICCT (2017) Status of policies for clean vehicles and fuels in select G20 countries. Accessed at https://www.theicct.org/sites/default/files/publications/Status-of-policy-post-TTG_ICCT-Briefing_15082017_vF.pdf
The Transport Politic (2018) In response to growth, Chinese cities choose metros. 17 January 2018. Accessed at: https://www.thetransportpolitic.com/2018/01/17/in-response-to-growth-chinese-cities-choose-metros/
Thomson G, Newton P, Newman P (2016) Urban regeneration and urban fabrics in Australian cities. Vol. 10, 2, 1–22 Journal of Urban Regeneration and Renewal
Transport NZ (2018) Monthly electric and hybrid light vehicle registrations. Accessed at https://www.transport.govt.nz/resources/vehicle-fleet-statistics/monthly-electric-and-hybrid-light-vehicle-registrations/
UITP (International Association of Public Transport) (2015) Mobility in Cities Database. Accessed at http://www.uitp.org/MCD
UITP (2017) Statistics Brief. Urban Public Transport in the 21st Century. Accessed at http://www.uitp.org/sites/default/files/cck-focus-papers-files/UITP_Statistic%20Brief_national%20PT%20stats.pdf
Victorian Auditor General (2014) Coordinating Public Transport. Accessed at https://www.audit.vic.gov.au/sites/default/files/20140806-Public-Transport.pdf
Wang (2013) Commuter costs and potential savings: Public transport versus car commuting in Australia. Accessed at https://ara.net.au/sites/default/files/Commuter-costs-potential-savings-report-FINAL%20%281%29.pdf
Whitehead J (2015) Traffic congestion: is there a miracle cure? (Hint: it’s not roads). The Conversation. Accessed at https://theconversation.com/traffic-congestion-is-there-a-miracle-cure-hint-its-not-roads-42753
WRI (World Resources Institute) (2018) How Did Shenzhen, China Build World’s Largest Electric Bus Fleet? Accessed at http://www.wri.org/blog/2018/04/how-did-shenzhen-china-build-world-s-largest-electric-bus-fleet
Yarra Trams (2018) Facts & Figures. Accessed at: http://www.yarratrams.com.au/about-us/who-we-are/facts-figures/
Sims et al (Sims R, Schaeffer R, Creutzig F, Cruz-Nunez X, D’Agosto M, Dimitriu D, Figueroa M, Fulton L, Kobayashi S, Lah O, McKinnon A, Newman P, Ouyang M, Schauer J, Sperling D, Tiwari G) (2014) Transport: In Climate Change 2014: Mitigation of Climate Change. Contribution of Working Group III to the Fifth Assessment Report of the Intergovernmental Panel on Climate Change [Edenhofer, O., R. Pichs-Madruga, Y. Sokona, E. Farahani, S. Kadner, K. Seyboth, A. Adler, I. Baum, S. Brunner, P. Eickemeier, B. Kriemann, J. Savolainen, S. Schlömer, C. von Stechow, T. Zwickel and J.C. Minx (eds.)]. Cambridge University Press, Cambridge, United Kingdom and New York, NY, USA.
SMH (2018a) Sydney clocks the hottest place on Earth as hot weather continues. Accessed at http://www.smh.com.au/ environment/weather/sydney-clocks-the-hottest-place-onearth-as-hot-weather-continues-20180107-h0etl6.html
SMH (2018b) The Sydney students travelling ‘phenomenal distances’ to get to school every day. Accessed at https://www.smh.com.au/national/nsw/the-sydney-students-travelling-phenomenal-distances-to-get-to-school-every-day-20180403-p4z7lo.html
Steffen W, Percival T and Flannery D (2015) Greenhouse gas emission reductions from Canberra’s light rail project. Australian Planner
Stone J and Kirk Y (2017) The ‘disruption’ we really need: public transport for the urban millennium. Chapter 7 Low carbon mobility for future cities: principles and applications.
Sustainable DC (2016) Sustainable DC. April 2016. Third Year Progress Report. Accessed at http://www.sustainabledc.org/wp-content/uploads/2014/04/SustainableDC2016ProgressReport.pdf.
TAI (The Australia Institute) (2005) Off to Work. Commuting in Australia. Accessed at http://www.tai.org.au/sites/defualt/files/DP78_8.pdf
TAI (2018) National Energy Emissions Audit: June. Accessed at http://www.tai.org.au/content/national-energy-emissions-audit-june
Terrill M (2017) Stuck in traffic: busting Melbourne versus Sydney myths and identifying the worst commutes. The Converstation. Accessed at https://theconversation.com/stuck-in-traffic-busting-melbourne-versus-sydney-myths-and-identifying-the-worst-commutes-79343
The Age (2017) Call to fine parents who idle car engines near school and childcare zones. Accessed at https://www.theage.com.au/national/victoria/call-to-fine-parents-who-idle-car-engines-near-school-and-childcare-zones-20170410-gvhvky.html
The Age (2018a) The great trek to prep: The city kids travelling up to 30km for school. Accessed at https://www.theage.com.au/national/victoria/the-great-trek-to-prep-the-city-kids-travelling-up-to-30km-for-school-20180129-p4yz0i.html
The Age (2018b) New tram line planned to run from Caulfield to Rowville via Chadstone. Accessed at https://www.theage.com.au/politics/victoria/new-tram-line-planned-to-run-from-caulfield-to-rowville-via-chadstone-20180409-p4z8lo.html
62 WAITING FOR THE GREEN LIGHT:
TRANSPORT SOLUTIONS TO CLIMATE CHANGE

IMAGE CREDITS
Image CreditsCover image: Photo by chuttersnap on Unsplash.
Figure 8: Page 18 “Flinders Street” by Flickr user Josh Janssen licensed under CC BY-ND 2.0.
Figure 9: Page 19 “Green Rapid bus to Belconnen at Tuggeranong Bus Station, Canberra” by Flickr user Philip Mallis licensed under CC BY-SA 2.0.
Figure 11: Page 24 “Jun 9th, 2011” by Flickr user Reuben Bedingfield licensed under CC BY-NC 2.0.
Table 4: Page 28 “Adelaide tram at Victoria Square” by Flickr user Philip Mallis licensed under CC BY-SA 2.0
Table 4: Page 28 “Nissan Leaf, Ford C-Max Energi and Honda Fit EV at a public charging station in front of San Francisco City Hall” by Flickr user mariordo59 licensed under CC BY-SA 2.0.
Table 4: Page 28 “Vehicle Systems Integration lab” by Flickr user Oak Ridge National Laboratory licensed under CC BY 2.0.
Figure 12: Page 30 “Adelaide Tram 114 at Adelaide Entertainment Centre Tram terminus” by Flickr user Luke David O’Rourke licensed under CC BY-ND 2.0.
Figure 13: Page 34 “Canberra Transport Photo_x3”. Image courtesy of We Ride Australia.
Figure 15: Page 36 “Foot bridge - the other side” by Flickr user MoiVous licensed under CC BY-NC-ND 2.0.
Figure 16: Page 43 “Gold coast light rail” by Flickr user Francisco Anzola licensed under CC BY 2.0.
Figure 17: Page 45 “C class tram (Citadis)” by Flickr user Fluoride (sasablog) licensed under CC BY-NC-ND 2.0.
Figure 18: Page 46 “Solar powered Bus” by Flickr user NH53 licensed under CC BY 2.0.
Figure 19: Page 47 “EV Zero Carbon Evolution Walking Tour” by Flickr user Takver licensed under CC BY-SA 2.0.
Figure 20: Page 48 “Capitol Bikeshare + Washington Monument” by Flickr user Snm01229 licensed under CC BY 2.0.
Figure 21: Page 51 Metropolitan Transit Authority of Harris County.
Figure 22: Page 52 “New Zealand - Auckland - Cycleway” by Flickr user Harshil Shah licensed under CC BY-ND 2.0.
Figure 23: Page 52 “Where Everybody Looks at Screens” by Flickr user Anton Strogonoff licensed under CC BY 2.0.
Figure 25: Page 53 “Shenzhen October 2010” by Flickr user Remko Tanis licensed under CC BY-NC-SA 2.0.
Figure 26: Page 54 “Santiago Metro” by Flickr user BernieCB licensed under CC BY-ND 2.0.
Figure 27: Page 55 “E-rickshaws literally scraping past each other” by Flickr user Shankar s. licensed under CC BY 2.0.
63

The Climate Council is an independent, crowd-funded organisation
providing quality information on climate change to the Australian public.
The Climate Council is a not-for-profit organisation and does not receive any money from the Federal Government. We rely upon donations from the public. We really appreciate your contributions.
Thank you for supporting the Climate Council.
CLIMATE COUNCIL
twitter.com/climatecouncil
climatecouncil.org.au/donateDONATE
facebook.com/climatecouncil
climatecouncil.org.au