Embed Size (px)
Citation preview
Quality in Health
By Aaron Fuhrman and Daniel Gonzalez
Wait Time for Treatment
in Hospital ED
SIGMA LEVEL
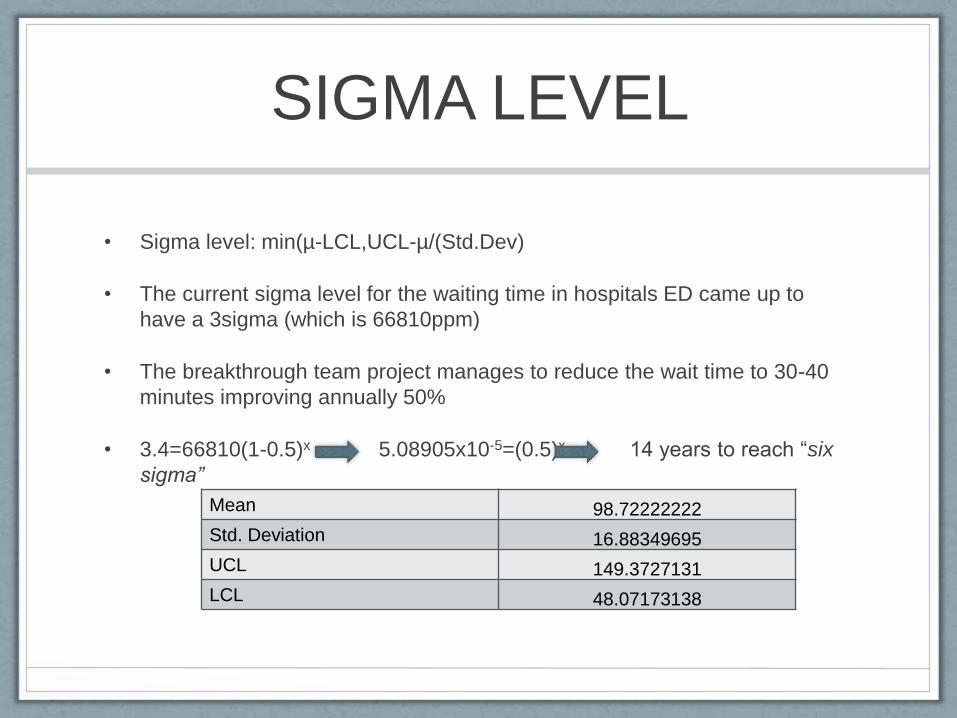
• Sigma level: min(µ-LCL,UCL-µ/(Std.Dev)
• The current sigma level for the waiting time in hospitals ED came up to
have a 3sigma (which is 66810ppm)
• The breakthrough team project manages to reduce the wait time to 30-40
minutes improving annually 50%
• 3.4=66810(1-0.5)x 5.08905x10-5=(0.5)x 14 years to reach “six
sigma”
Mean 98.72222222
Std. Deviation 16.88349695
UCL 149.3727131
LCL 48.07173138
DEFINE
• The objective of this project was to minimize the waiting time in emergency hospitals.
From 2003 to 2009 the wait time has increased 25%, from 46.5 minutes to 58.1
minutes, converting this into an important issue to be solved. After obtaining data from
2013 from 54 different hospitals we found out that the waiting time for ED has
increased, accounting for a mean of 98.72 minutes. This number is unacceptable for
the patience.
• The data from 2003 to 2009 was obtained from an organization called center of
disease and control prevention whilst the data from the different hospitals in 2013 was
obtained from “beckers hospital review”.
• Excel was used to analyze the data. Scatter plots were generated to analyze the
trends of the mean and median of the historical data.
• Minitab was used to analyze the normal distribution to confirm that it is normally
distributed in order to obtain a sigma level. We also did a histogram to create the
frequency vs minutes in the emergency department.
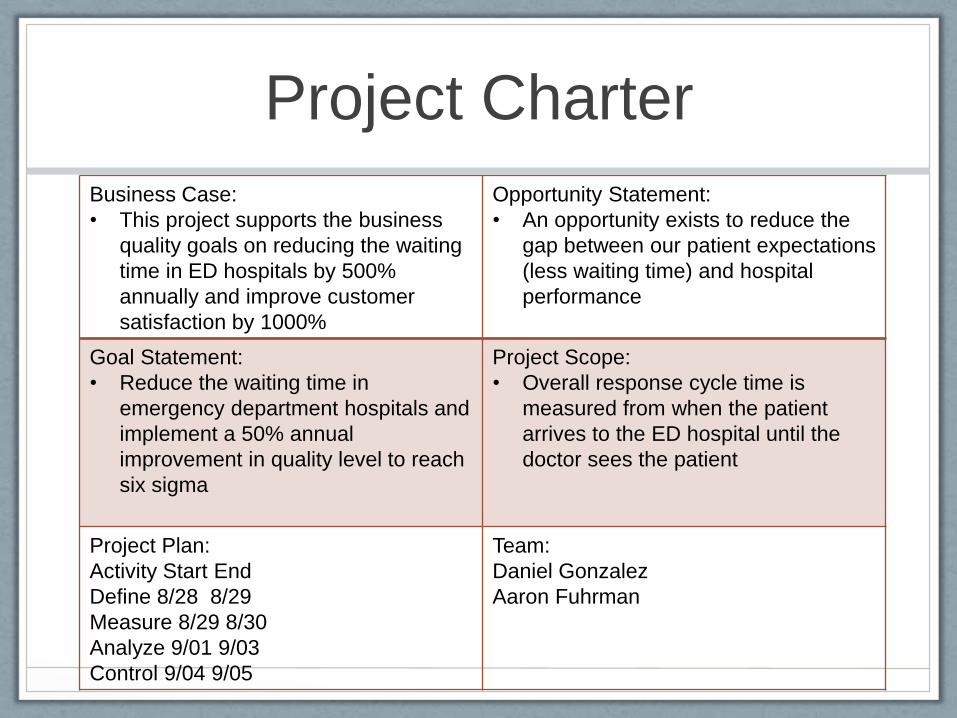
Business Case:
• This project supports the business
quality goals on reducing the waiting
time in ED hospitals by 500%
annually and improve customer
satisfaction by 1000%
Opportunity Statement:
• An opportunity exists to reduce the
gap between our patient expectations
(less waiting time) and hospital
performance
Goal Statement:
• Reduce the waiting time in
emergency department hospitals and
implement a 50% annual
improvement in quality level to reach
six sigma
Project Scope:
• Overall response cycle time is
measured from when the patient
arrives to the ED hospital until the
doctor sees the patient
Project Plan:
Activity Start End
Define 8/28 8/29
Measure 8/29 8/30
Analyze 9/01 9/03
Control 9/04 9/05
Team:
Daniel Gonzalez
Aaron Fuhrman
Project Charter
Measure(Historical Records)
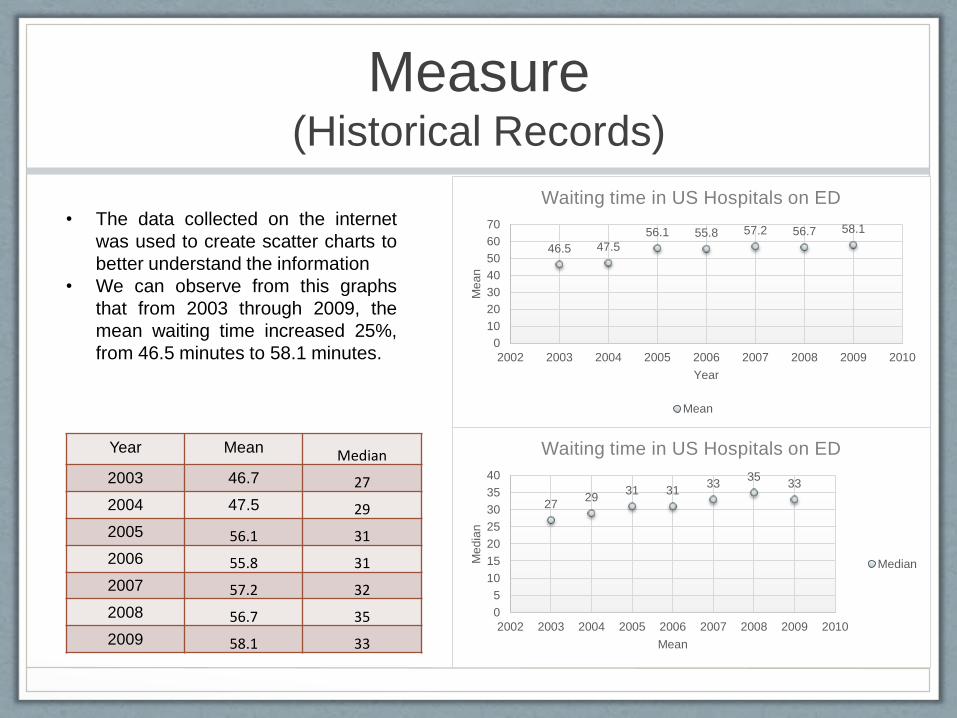
Year Mean Median
2003 46.7 27
2004 47.5 29
2005 56.1 31
2006 55.8 31
2007 57.2 32
2008 56.7 35
2009 58.1 33
46.5 47.5
56.1 55.8 57.2 56.7 58.1
0
10
20
30
40
50
60
70
2002 2003 2004 2005 2006 2007 2008 2009 2010
Me
an
Year
Waiting time in US Hospitals on ED
Mean
2729
31 3133
3533
0
5
10
15
20
25
30
35
40
2002 2003 2004 2005 2006 2007 2008 2009 2010
Me
dia
n
Mean
Waiting time in US Hospitals on ED
Median
• The data collected on the internet
was used to create scatter charts to
better understand the information
• We can observe from this graphs
that from 2003 through 2009, the
mean waiting time increased 25%,
from 46.5 minutes to 58.1 minutes.
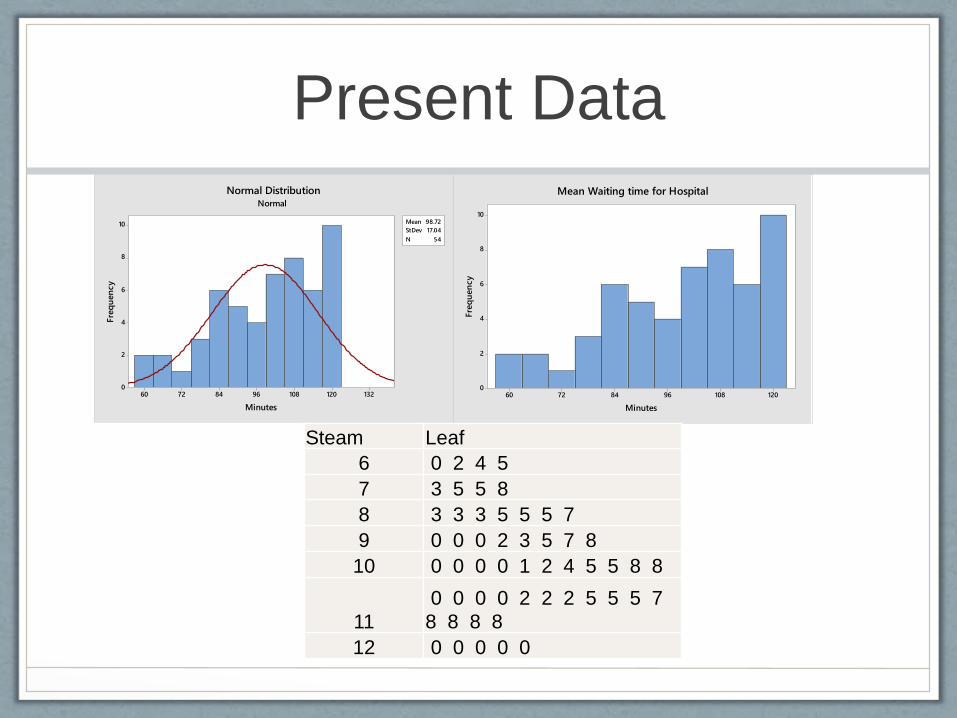
Present Data
13212010896847260
10
8
6
4
2
0
Mean 98.72
StDev 17.04
N 54
Minutes
Fre
qu
en
cy
Normal
Normal Distribution
12010896847260
10
8
6
4
2
0
Minutes
Fre
qu
en
cy
Mean Waiting time for Hospital
Steam Leaf
6 0 2 4 5
7 3 5 5 8
8 3 3 3 5 5 5 7
9 0 0 0 2 3 5 7 8
10 0 0 0 0 1 2 4 5 5 8 8
11
0 0 0 0 2 2 2 5 5 5 7
8 8 8 8
12 0 0 0 0 0
Analyze
0 10 20 30 40 50 60 70
Immediate (2%)
Emergent (10%)
Urgent(41%)
Semiurgent (35%)
Nonurgent(7%)
No triage (4%)
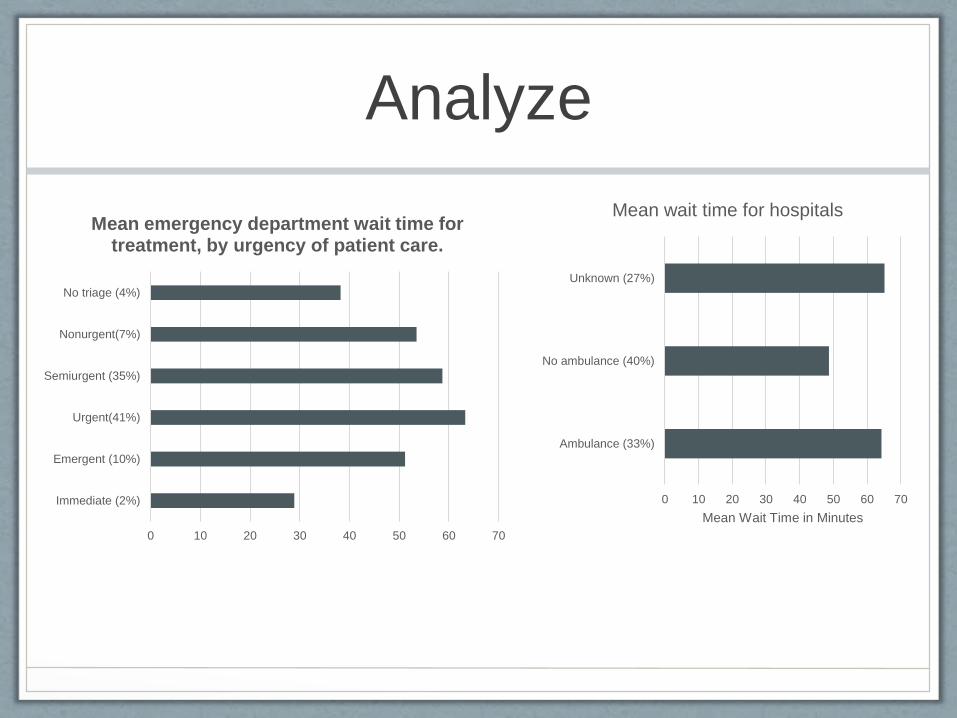
Mean emergency department wait time for treatment, by urgency of patient care.
0 10 20 30 40 50 60 70
Ambulance (33%)
No ambulance (40%)
Unknown (27%)
Mean Wait Time in Minutes
Mean wait time for hospitals
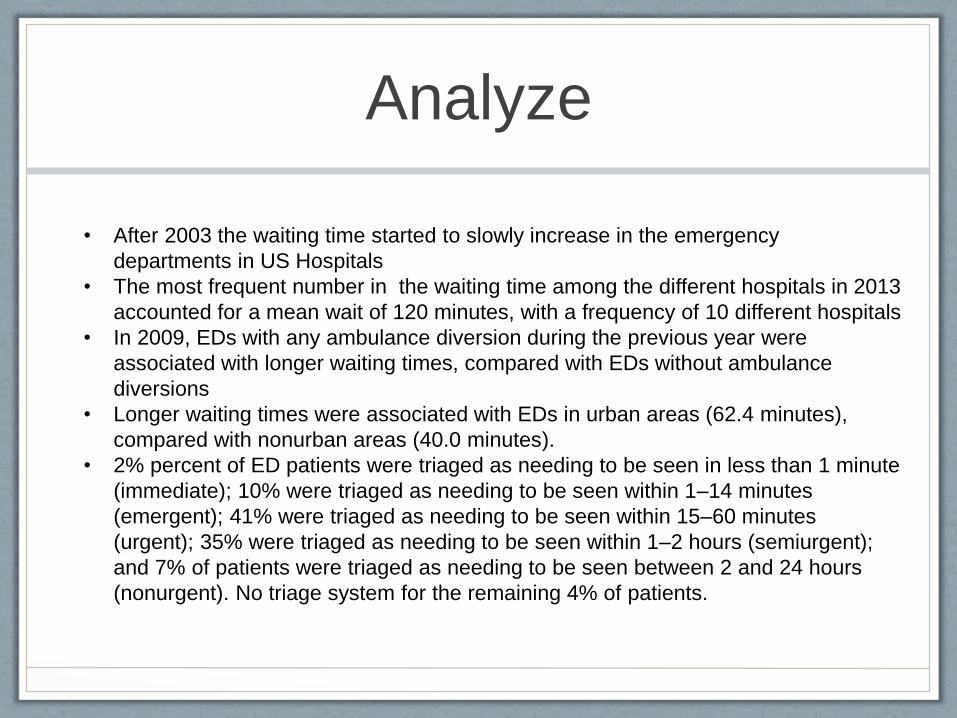
Analyze
• After 2003 the waiting time started to slowly increase in the emergency
departments in US Hospitals
• The most frequent number in the waiting time among the different hospitals in 2013
accounted for a mean wait of 120 minutes, with a frequency of 10 different hospitals
• In 2009, EDs with any ambulance diversion during the previous year were
associated with longer waiting times, compared with EDs without ambulance
diversions
• Longer waiting times were associated with EDs in urban areas (62.4 minutes),
compared with nonurban areas (40.0 minutes).
• 2% percent of ED patients were triaged as needing to be seen in less than 1 minute
(immediate); 10% were triaged as needing to be seen within 1–14 minutes
(emergent); 41% were triaged as needing to be seen within 15–60 minutes
(urgent); 35% were triaged as needing to be seen within 1–2 hours (semiurgent);
and 7% of patients were triaged as needing to be seen between 2 and 24 hours
(nonurgent). No triage system for the remaining 4% of patients.
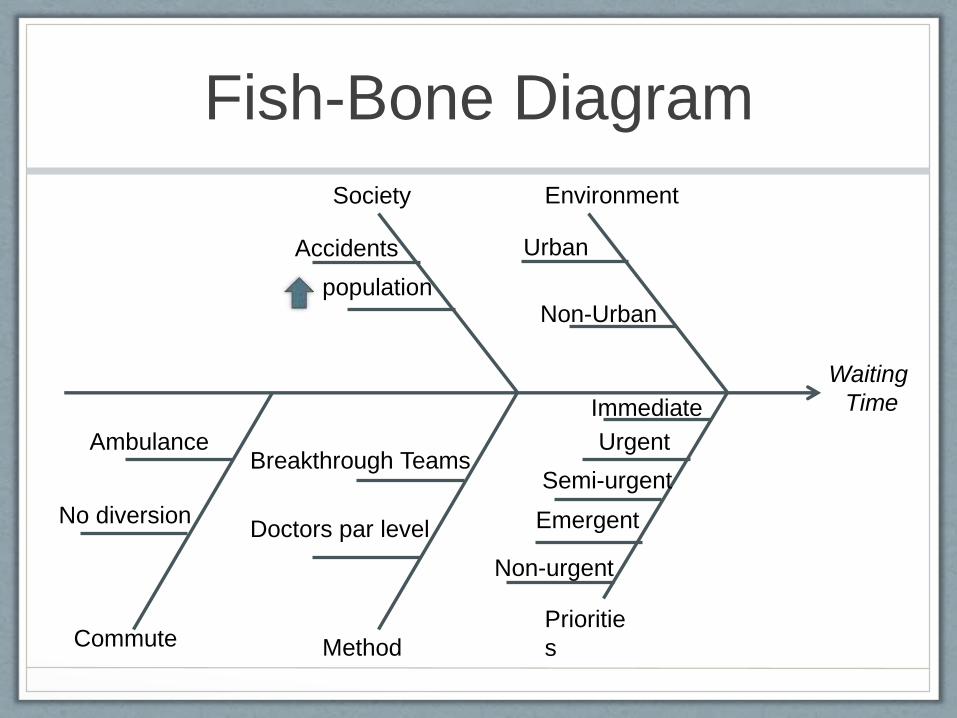
Fish-Bone Diagram
Prioritie
sMethod
Society Environment
Commute
Accidents
population
Urban
Non-Urban
Ambulance
No diversion
Breakthrough Teams
Doctors par level
Immediate
Semi-urgent
Urgent
Emergent
Non-urgent
Waiting
Time
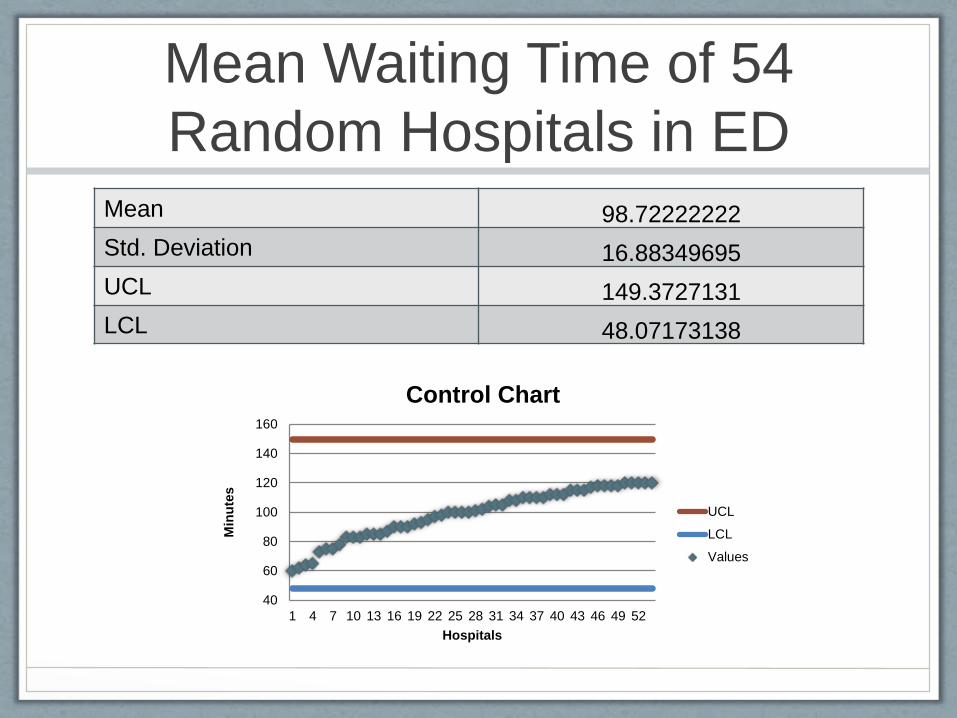
Mean Waiting Time of 54
Random Hospitals in EDMean 98.72222222
Std. Deviation 16.88349695
UCL 149.3727131
LCL 48.07173138
40
60
80
100
120
140
160
1 4 7 10 13 16 19 22 25 28 31 34 37 40 43 46 49 52
Min
ute
s
Hospitals
Control Chart
UCL
LCL
Values
Improve
• Change the process to the Breakthrough Team system
• This system will adopt the “Toyota Lean Manufacturing Process”
which focuses upon improving the flow of work, thereby eliminating
“un-evenness” through the system.
• With this process, staff members have been able improve how
patients were being processed in the emergency room, have
identified and removed redundant steps in the process, designed a
more patient-centered flow, and evaluated results to ensure
sustainment
• Another solution is to increment the par levels of doctors in the
hospitals. However this method is more costly than the previous
one
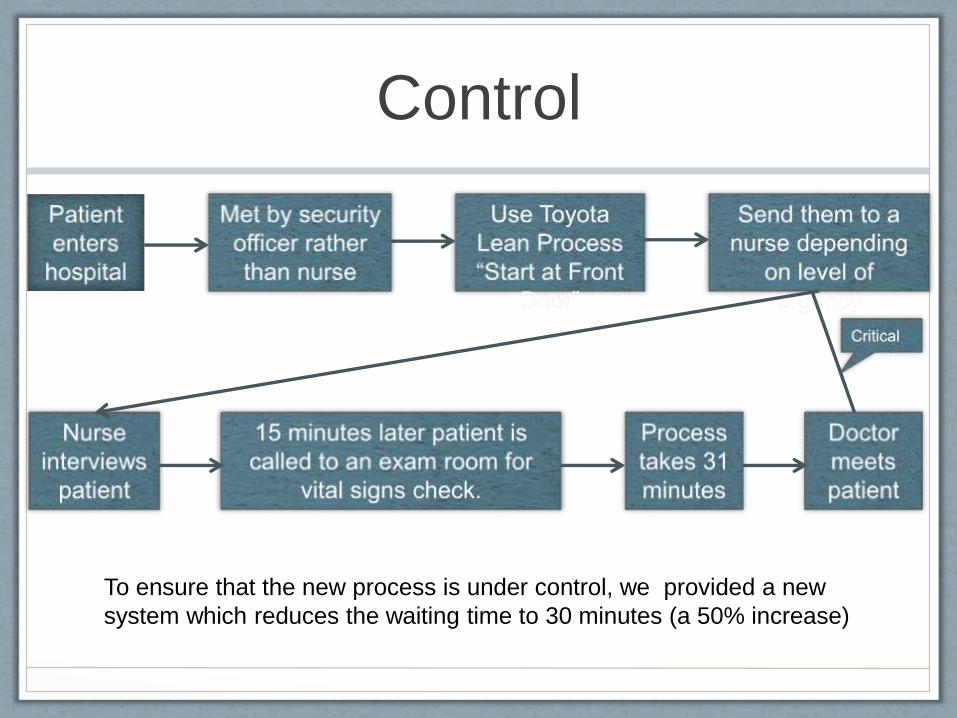
Control
To ensure that the new process is under control, we provided a new
system which reduces the waiting time to 30 minutes (a 50% increase)
Reference
• Hing, Esther. "Wait Time for Treatment in Hospital Emergency
Departments." Centers for Disease Control and Prevention.
Centers for Disease Control and Prevention, 28 Aug. 2012. Web.
08 Sept. 2014.
• "Reduced Wait Times, More Efficient Emergency Departments."
Reduced Wait Times, More Efficient Emergency Departments.
NYC Gov, 12 May 2013. Web. 08 Sept. 2014.
• Rizzo, Ellie. "Hospitals With the Shortest ED Wait Times." Hospitals
With the Shortest ED Wait Times. Beckers Hospital Review, 2012.
Web. 08 Sept. 2014.