Embed Size (px)
Citation preview
Archives of Assessment Psychology, Vol. 3, No. 1, (57) © 2013 American Board of Assessment Printed in U.S.A. All rights reserved Psychology
_____________________________________________________________________________
WAIS-IV Index and Full Scale Intelligence Quotient Score Differences between Standard and Prorated Scoring
Methods
Traci W. Olivier, M.S., Charles J. Golden, Ph.D., Amarilis Acevedo, Ph.D., Victoria I. Sterk, B.S., Kristina M. Espinosa, B.S., and Kayla M. Spengler, B.A.
Abstract
The purpose of this study is to explore differences in WAIS-IV Verbal Comprehension, Perceptual Reasoning, and Full Scale IQ Index scores as a result of using standard versus prorated scoring methods. Participants were 149 adults, ages 18 to 84, who were previously administered the WAIS-IV. Protocols were scored using standard scoring methods and then re-scored using each alternate proration combination for Verbal Comprehension, Perceptual Reasoning, and Full Scale IQ Indices. One-factor repeated measures ANOVAs and post-hoc paired t-tests revealed that any verbal subtest may be removed without significantly altering Verbal Comprehension Index scores. Block Design + Matrix Reasoning produced the most accurate Perceptual Reasoning Index score estimates. When verbal and perceptual tests were removed from Full Scale IQ calculations, Block Design + Visual Puzzles produced significantly lower Full Scale IQ Index scores, and any inclusion of Matrix Reasoning + Visual Puzzles (in isolation or in combination with any of the Verbal Comprehension Index proration options) produced significantly higher Full Scale IQ scores. Results of removing working memory and/or processing speed subtests indicated that omitting Digit Span alone and omitting Symbol Search alone were the only two proration options that did not artificially inflate Full Scale IQ Index score estimations. The risks of prorating scores at the expense of losing accuracy must be measured against the benefits gained by doing so, and which subtests to omit must be chosen judiciously. The results of this study provide clinicians with guidelines to use when attempting to obtain prorated scores that are not significantly different from standard index scores.
Introduction The Wechsler Adult Intelligence Scale, Fourth Edition (WAIS-IV) produces subtest
scaled scores and index standard scores designed to be representative of adults’ overall cognitive and intellectual functioning. This assessment is comprised of 10 core subtests which produce four index scores (i.e., Verbal Comprehension Index, Perceptual Reasoning Index, Working

Olivier, Golden, Acevedo, Sterk, Espinosa, and Spengler
________________________________________________________________________ 58
Memory Index, Processing Speed Index) and an overall Full Scale IQ Index score. The Full Scale IQ Index score is designed to be the most comprehensive and general score, and it is derived from all 10 core subtests. The Verbal Comprehension and Perceptual Reasoning Index scores are each derived from three core subtests; and the Working Memory and Processing Speed Index scores are each derived from two core subtests.
Each WAIS-IV index is also composed of at least one supplemental subtest. Although index scores are generally composed of only core subtests, in certain instances (e.g., when a patient has sensory deficits that inhibit performance, when testing conditions are less than optimal), a supplemental subtest may be substituted for a core subtest so that an index score may be computed. Research suggests that administering supplemental subtests in addition to core subtests can increase total administration time considerably. On the WAIS-IV, for example, approximately 24 minutes may be saved by omitting supplemental subtests (Wechsler, 2008). Due to the time and financial constraints faced by many psychologists, oftentimes only the core battery is administered; yet, there are instances in which even the entire core battery is not administered. Despite warnings against doing so unless absolutely necessary, psychologists may prorate scores from available core subtests in order to compute index scores. Sattler (2009) indicates that the sum of scaled scores of WAIS-IV subtests may be prorated for the Verbal Comprehension and Perceptual Reasoning Indices when two of the three core subtests composing either index had been administered. For indices such as the Working Memory Index and Processing Speed Index, each of which is composed of only two core subtests, proration may not be used because two subtest scores are required to compute the index score. Full Scale IQ scores can be prorated by using prorated Verbal Comprehension and/or Perceptual Reasoning Index scores, or by removing Working Memory and Processing Speed Index subtests. The literature suggests, however, that clinicians should indicate when proration is used by writing “estimate” or “prorated” next to index scores, as well as next to the Full Scale IQ Index scores, on both the assessment protocol and within the report (Sattler, 2008; Flanagan & Kaufman, 2004).
To date, only one published study has examined the relationship between WAIS-IV prorated and standard scoring methods (Umfleet, Ryan, Gontkovsky, & Morris, 2012). Although such research has been conducted on the WAIS-III, current studies are needed to determine whether the reported results will be replicated using WAIS-IV data. For example, in comparison to standard scoring methods, prorated scores on the WAIS-III generally demonstrated large correlations with the full, 11 core subtest version of this measure, as well as few significant differences between scoring methods. Furthermore, it is imperative that current studies be conducted as the structure of the WAIS-IV is quite different from that of its predecessor. “Factor scores” have been renamed to “index scores,” and some of the “IQ scores” have been eliminated (e.g., Verbal IQ, Performance IQ). Also, although the WAIS-IV retained many of the subtests from the WAIS-III, a new perceptual core subtest was also introduced (i.e., Visual Puzzles) which may affect the nature of prorated Perceptual Reasoning Index and resulting Full Scale IQ Index scores. A Brief History of Proration on Wechsler Measures The original Wechsler intelligence test, the Bellevue Intelligence Examination, consisted of five core verbal subtests (Information, Comprehension, Arithmetic, Digit Span, and Similarities) and five core non-verbal subtests (Picture Arrangement, Picture Completion, Block Design, Digit Symbol, and Object Assembly). These 10 core subtests were used to compute a

WAIS-IV Index and Full Scale Intelligence Quotient Score
________________________________________________________________________ 59
Verbal IQ score, a Performance IQ score, and a Full Scale IQ score (Wechsler, 1944). In discussing whether it was possible to shorten the Bellevue Intelligence Examination, Wechsler (1944) indicated that high correlations (i.e., exceeding .90 for all but three of the subtests) between the individual subtests and the total scale scores allowed for up to five subtests to be eliminated while at the same time preserving the relative reliability of the measure. As stated by Wechsler (1944), “the scale may be shortened to include as few as five subtests, without seriously altering its reliability providing a judicious choice of subtests is made” (p. 145). Wechsler indicated that the most conservative approach to shortening this measure would be to administer only the verbal subtests and use these data to estimate the individual’s full scale intelligence. Recognizing that examiners may desire to administer a shortened version that includes both verbal and performance subtests, however, Wechsler advised that in such cases, the subtests to be administered should be chosen based on their correlations with the total scores, and that at least six subtests be administered. The chosen subtests’ weighted scores would then have to be prorated before being used to compute a Full Scale IQ score. Wechsler (1944) cautioned that “reduction in the number of the tests used not only restricts the areas in which one can observe the subject function, but makes attempt at pattern analysis extremely difficult, if not impossible” (p. 145). Although Wechsler stated, “wherever practical it is desirable to give the Full Scale” (p. 171), he discussed three situations in which it may be preferable to give fewer than all 10 core subtests. When individuals have physical limitations that would prevent them from completing the performance subtests, it was advised that only the verbal subtests be administered. For individuals who cannot read or are not proficient in English, it was advised that only the performance subtests be administered. Finally, in older adults who may have vision or hearing difficulties, it was suggested that tests in which they would otherwise be penalized for their deficits be eliminated from the battery. It should be noted, however, that poor performance on a subtest other than for the reasons discussed above would not be a valid reason for eliminating a given subtest from the battery, according to Wechsler. There were two guidelines that would have needed to be considered whenever only a selection of verbal and performance tests from the Bellevue Intelligence Examination was utilized. First, subtests should have been selected on the basis of their correlations with the total score; that is, those with the highest correlations should be chosen first. Secondly, at least six of the 10 core subtests should have been included in the shortened battery. If the examiner was interested in obtaining an overall estimate of intelligence, however, it would have been preferable to have used eight or nine subtests to obtain a prorated Full Scale IQ score (Wechsler, 1944). Wechsler stated, “In any case, no rating should be given on a ‘Full’ scale examination consisting of less than 8 tests; in most cases at least 9 tests should be employed. Our own experience has shown that one seldom has to omit more than one test” (1944, pp. 171-172). Numerous studies have been conducted examining “short-forms” of the WAIS-R and WAIS-III in comparison to each other and to the full, standard administration of these measures. Short-forms are alternate versions of the full measure that include only certain subtests, allowing examiners to save time and provide for ease of administration. Not all short-forms, however, rely on proration methods. Researchers have developed alternate formulas for calculating short-form scores, with such studies having been conducted in the United States and abroad. For a comprehensive review of the history of Wechsler short-forms, beginning with the Bellevue Intelligence Examination (or Wechsler-Bellevue Scale), the reader is directed to Palmer, Taylor, and Heaton (2003), as such a review is beyond the scope of this paper. The following discussion

Olivier, Golden, Acevedo, Sterk, Espinosa, and Spengler
________________________________________________________________________ 60
is intended to provide a concise overview of proration on the WAIS-III and WAIS-IV. Research regarding prorating index and IQ scores on the WAIS-III resulted in large correlations between prorated and full scores with some significant differences reported between scoring methods. Regarding index score comparisons, Axelrod, Dingell, Ryan, and Ward (2000) reported that prorated Verbal Comprehension Index scores were significantly higher and that prorated Processing Speed Index scores were significantly lower than the full factor scores. When Block Design was included in Perceptual Organization Index score prorations, the estimated index scores were slightly lower. Regarding IQ score comparisons, Axelrod and Ryan (2000) reported that prorated Performance IQ and Full Scale IQ scores were slightly lower than the standard IQ scores, but small effect sizes suggest that these results were not clinically meaningful. Yet, in another study, Axelrod, Ryan, and Ward (2001) reported that all prorations (Verbal IQ, Performance IQ, and Full Scale IQ) resulted in significantly lower IQ score estimates. Finally, Palmer et al. (2003) did not examine statistically significant differences between scoring methods, yet the researchers’ data indicated that Information and Similarities produced the most accurate Verbal Comprehension Index and the inclusion of Picture Completion resulted in the most accurate Perceptual Reasoning Index score estimates. Prorated Full Scale IQ scores using their short-form appeared comparable to the standard Full Scale IQ scores. Prorating Scores on the WAIS-IV As discussed above, there is only one published study to date examining the relationship between prorated estimates and standard scoring method index scores on the WAIS-IV. In a sample of 141 individuals referred for neuropsychological or rehabilitative services, Umfleet et al. (2012) investigated the relationship between prorated WAIS-IV Verbal Comprehension and Perceptual Reasoning Index scores and their standard index score counterparts. Participants were divided into two subgroups: a “brain-damaged” group (n = 104) consisting of diagnoses such as multiple sclerosis, dementia, traumatic brain injury, mild cognitive impairment, and stroke; and a “medical” group (n = 37) consisting of diagnoses such as psychiatric conditions, Learning Disabilities/Attention-Deficit/Hyperactivity Disorder, congenital conditions, cancer, fibromyalgia, lupus, and alcohol dependence. Participants were administered the 10 subtest core battery of the WAIS-IV, and the measures were scored using standard procedures. Prorated sum of scaled scores for the Verbal Comprehension Index and the Perceptual Reasoning Index were then computed and converted to estimated index scores in accordance with the WAIS-IV manual (Wechsler, 2008; Tables A.8 and A.3, respectively), using each possible two-subtest proration combination for each index. For example, the Verbal Comprehension Index was estimated using the following three combinations: Similarities and Vocabulary; Similarities and Information; and Vocabulary and Information. The Perceptual Reasoning Index was estimated using the following three combinations: Block Design and Matrix Reasoning; Block Design and Visual Puzzles; and Matrix Reasoning and Visual Puzzles. Results indicated large correlations between all Verbal Comprehension Index score estimates and the standard index scores in both samples (i.e., r > .91). Correlations between all Perceptual Reasoning Index score estimates and the standard index scores were also large in both samples, although smaller than the correlations demonstrated for verbal scores (i.e., r > .87). Only one significant difference was found between verbal and performance estimates and their standard scoring method counterparts. The Vocabulary and Information subtest combination produced index score estimates that were significantly larger than the standard Verbal
WAIS-IV Index and Full Scale Intelligence Quotient Score
________________________________________________________________________ 61
Comprehension Index score, t(103) = -6.08, p < .008, in the “brain-damaged” sample. Finally, in this same sample, Similarities and Information produced estimates with the highest percentage of exact agreement with the standard Verbal Comprehension Index score (21 percent). In regard to perceptual tests, Block Design and Matrix Reasoning produced estimates with the highest percentage of exact agreement with the standard Perceptual Reasoning Index score (21 percent). In the “medical” sample, the combination of Similarities and Information yielded the highest percentage of exact agreement with the standard Verbal Comprehension Index scores (19 percent). Block Design and Matrix Reasoning and Block Design and Visual Puzzles produced estimates that yielded the highest percentage of exact agreement with the standard index score counterparts (22 percent). The results of this study suggest that there are large correlations between prorated Verbal Comprehension and Perceptual Reasoning Index scores and their standard index score counterparts, yet across samples, Similarities and Information and Block Design and Matrix Reasoning appeared to produce the most accurate index score estimates. Impetus of the Current Study
The purpose of the present study is to explore differences in WAIS-IV Verbal Comprehension Index, Perceptual Reasoning Index, and Full Scale IQ Index scores as a result of using standard versus prorated scoring methods by examining each possible proration combination for these indices. As noted above, only one published study to date has examined these effects within the current, fourth edition of this assessment (Umfleet et al., 2012). Furthermore, few of the previous studies have examined numerous proration combinations within each index, instead opting to examine a particular subtest combination to obtain prorated index scores. In the present study, we examined each possible proration combination for WAIS-IV Verbal Comprehension Index and Perceptual Reasoning Index, in addition to the effects that prorating these indices would have upon the Full Scale IQ Index score. Also, although prorated index scores for the Working Memory Index and the Processing Speed Index could not be calculated, the effects of removing one subtest from either of these indices and one subtest from both of these indices upon Full Scale IQ Index were examined.
We hypothesized that the combination of Vocabulary and Similarities would predict WAIS-IV Verbal Comprehension Index scores significantly better than combinations of a) Vocabulary and Information and b) Similarities and Information. Second, we hypothesized that the combination of Block Design and Visual Puzzles would predict Perceptual Reasoning Index scores significantly better than combinations of a) Matrix Reasoning and Visual Puzzles and b) Block Design and Matrix Reasoning. Third, we hypothesized that using Vocabulary and Similarities to predict Verbal Comprehension Index in combination with using Block Design and Visual Puzzles to predict Perceptual Reasoning Index scores would predict Full Scale IQ scores significantly better than each of the alternate Full Scale IQ scoring methods. Finally, we hypothesized that the combination of Arithmetic from the Working Memory Index and Symbol Search from the Processing Speed Index, in combination with standard Verbal Comprehension Index and Perceptual Reasoning Index scores, would predict Full Scale IQ Index scores significantly better than each alternate Full Scale IQ scoring method.
Method
Participants. Archival data from a South Florida university outpatient clinic were utilized for this study. Participants included 149 adults, ages 18 to 84 (M = 34; SD = 13.99) with

Olivier, Golden, Acevedo, Sterk, Espinosa, and Spengler
________________________________________________________________________ 62
a mean education level of 13.71 years (SD = 2.20) who were previously administered the WAIS-IV. Participants were primarily Caucasian (61 percent, n = 92), followed by Hispanic (19 percent, n = 28), African American (10 percent, n = 14), and others/missing ethnicity data (10 percent, n = 15). In this sample, 59.1 percent were female (n = 88) and 79.9 percent were right handed (n = 119). The following is a list of diagnoses represented by this sample: Learning Disorders (30 percent, n = 45), Mood Disorders (17.5 percent, n = 26), Cognitive Disorder, Not Otherwise Specified (7 percent, n = 11), Attention-Deficit/Hyperactivity Disorder (6 percent, n = 9), Adjustment Disorder (5 percent, n = 7), Schizophrenia (1 percent, n = 1), and Substance Dependence (1 percent, n = 1). Some individuals received diagnosis deferred (21.5 percent, n = 32) or were missing diagnoses in the dataset (11 percent, n = 17). Assessments were administered by doctoral-level graduate students and supervised by licensed clinical neuropsychologists as part of comprehensive neuropsychological evaluations.
Measures. The WAIS-IV is designed to measure global intellectual/cognitive functioning in adolescents and adults ages 16 to 90, in addition to specific domains of cognition, through the administration of 10 core subtests (Wechsler, 2008). Through various permutations, these 10 subtests allow for the computation of a global Full Scale IQ score and four, more specific, index scores. The Verbal Comprehension Index is composed of the following three core subtests: Vocabulary, Similarities, and Information. The Perceptual Reasoning Index is composed of the following three core subtests: Block Design, Matrix Reasoning, and Visual Puzzles. There are two indices that are each composed of two core subtests. Digit Span and Arithmetic are used to compute the Working Memory Index; Coding and Symbol Search are used to compute the Processing Speed Index. The WAIS-IV is scored by summing the raw scores for each subtest; each raw subtest score is then converted to a scaled scored (M = 10; SD = 3). To obtain each index score, the sum of scaled scores is computed for the core subtests that comprise each index and then converted to a standard score. To obtain the Full Scale IQ Index score, the sum of scaled scores is computed for the 10 core subtests and then converted to a standard score (M = 100; SD =15).
Design and Procedure. De-identified data were gleaned from the archival database described above. For each participant, the following information was collected: age; education level; ethnicity; handedness; diagnosis; and WAIS-IV raw scores and scaled/standard scores. All protocols were initially scored using the standard scoring methods set forth in the test manuals (Wechsler, 2003, 2008). Each participant’s assessment was then re-scored using each alternate scoring method noted in the hypotheses section above. To compute prorated Verbal Comprehension Index and Perceptual Reasoning Index scores, scaled scores from each two-subtest proration combination were adjusted to produce prorated sum of scaled scores, which were then used to produce the estimated index score. Prorated sum of scaled scores were computed using the following formula: scaled score sum of the two-subtest combination multiplied by 3/2 or 1.5, with the fraction numerator representing the total number of core subtests available in the index and the denominator representing the number of core subtests actually administered (Table A.8 [p. 226] of the WAIS-IV manual [Wechsler, 2008]). The prorated sum of scaled scores was then used to produce an index score from Tables A.3 and A.4 (WAIS-IV; Wechsler, 2008). The Full Scale IQ Index scores were prorated in accordance with each hypothesis above. Specifically, the sum of scaled scores values were prorated by using the following formula: scaled score sum of eight or nine valid core subtests multiplied by 10/9 or 10/8, respectively. This prorated sum of scaled scores was then used to compute a Full Scale IQ Index score using Table A.7 of the WAIS-IV manual (Wechsler, 2008).

WAIS-IV Index and Full Scale Intelligence Quotient Score
________________________________________________________________________ 63
Results Analyses of Group Mean Differences. A one-way repeated measures ANOVA was
utilized for each hypothesis. Epsilon adjustments were used to address the assumption of sphericity, which asserts that the sample variances on all scores are equal (Myers, Well, & Lorch, 2010). The Huynh-Feldt correction for the assumption of sphericity was used if the epsilon value was greater than .75, as it has more power than the Greenhouse-Geisser correction. If the epsilon value was lower than .75, the Greenhouse-Geisser correction was used because it provides better protection against Type I error (Myers et al., 2010). Post-hoc analyses, if applicable, were conducted using pairwise comparisons to analyze specific differences between the standard scoring method and the alternate scoring methods, using Bonferonni adjustments to maintain a familywise Type I error rate of α = .05. Results were considered significant at the p < .05 level. Correlations between prorated and standard scoring methods were also analyzed, and results were considered significant at the p < .001 level.
For the Verbal Comprehension Index, no significant differences between scoring methods were found, F(1.953, 444) = 1.442, p > .05, η2= .010, with an observed power of .304. All prorated scoring methods were highly correlated with the standard Verbal Comprehension Index score (r > .946, p < .001) and the standard error for each estimate did not exceed 1.260. Descriptive statistics and correlations for the Verbal Comprehension Index scoring methods are outlined in Tables 1 and 2, respectively. Table 1 Descriptive Statistics for WAIS-IV Verbal Comprehension Index Scoring Methods
95% CI
Verbal Comprehension Index Scoring Method M (SD) SE LL UL
Standard Index Score 100.09 (14.18) 1.161 97.80 102.39
Prorated using Vocabulary + Similarities 100.41 (15.37) 1.260 97.92 102.90
Prorated using Vocabulary + Information 101.09 (14.86) 1.217 98.69 103.50
Prorated using Similarities + Information 100.36 (14.58) 1.195 98.18 102.72 Note. SE = standard error. CI = confidence interval. LL = lower limit. UL = upper limit.
Table 2 Correlations between WAIS-IV Standard and Prorated Verbal Comprehension Index Scores
Prorated Scoring Methods Standard Verbal Comprehension Index Vocabulary + Similarities .965 Vocabulary + Information .946 Similarities + Information .957 Note. All p values significant at <.001.
Olivier, Golden, Acevedo, Sterk, Espinosa, and Spengler
________________________________________________________________________ 64
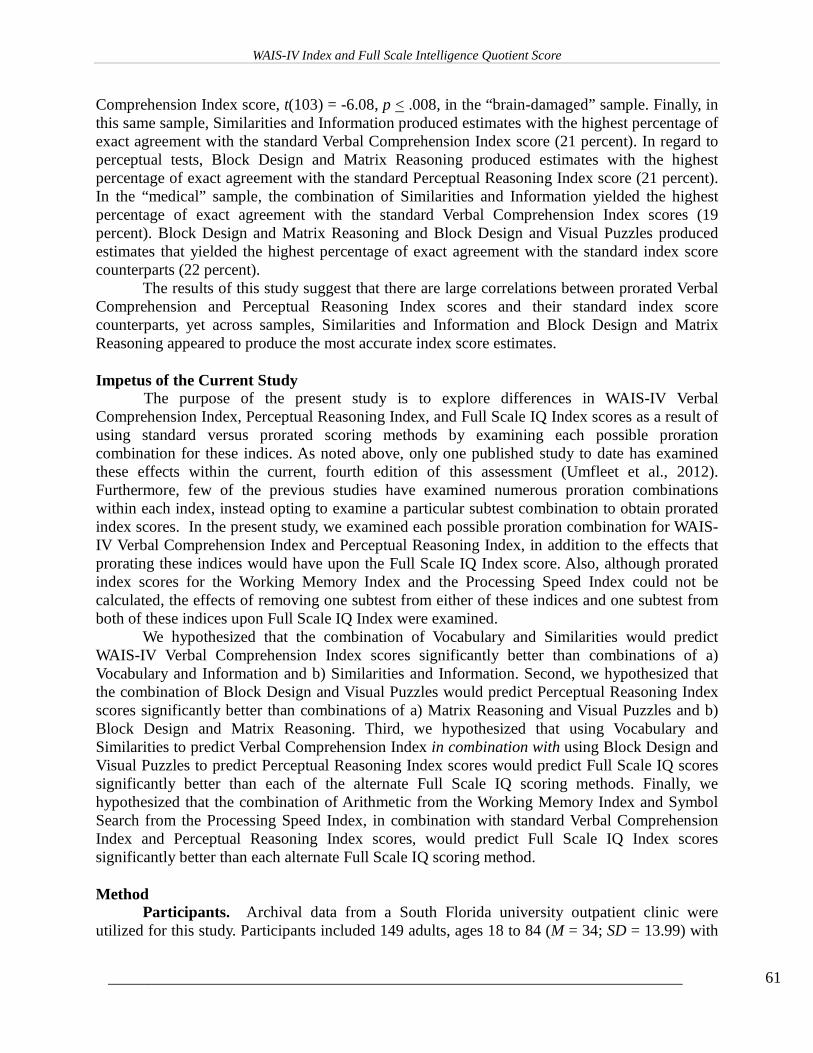
Significant differences between Perceptual Reasoning Index scoring methods were found, F(1.935, 444) = 30.312, p < .001 η2= .170, with an observed power of 1.00. Post-hoc pairwise comparisons indicated that Matrix Reasoning + Visual Puzzles produced significantly higher scores in comparison to the standard Perceptual Reasoning Index score, t(3) = 8.715, p < .001, Block Design + Visual Puzzles, t(3) = 7.502, p < .001, and Block Design + Matrix Reasoning, t(3) = 4.251, p < .01. Block Design + Visual Puzzles produced significantly lower scores in comparison to the standard index score, t(3) = -5.000, p < .001, Matrix Reasoning + Visual Puzzles, t(3) = -7.502, p < .001, and Block Design + Matrix Reasoning, t(3) = -3.999, p < .01. Furthermore, Block Design + Matrix Reasoning evidenced no significant differences with the standard Perceptual Reasoning Index score and produced the least mean difference from the standard index score (0.523). All prorated scoring methods were highly correlated with the standard index score (r >.872, p < .001) and the standard error for each estimate did not exceed 1.313. Complete descriptive statistics and correlations for the Perceptual Reasoning Index scoring methods are found in Tables 3 and 4, respectively.
Table 3
Descriptive Statistics for WAIS-IV Perceptual Reasoning Index Scoring Methods
95% CI Perceptual Reasoning Index
Scoring Method M (SD) SE LL UL
Standard Index Score 95.38 (14.62) 1.197 93.01 97.74
Prorated using Block Design + Visual Puzzles 93.19 (16.03) 1.313 90.59 95.78
Prorated using Matrix Reasoning + Visual Puzzles 98.03 (14.82) 1.214 95.63 100.43
Prorated using Block Design + Matrix Reasoning 95.90 (14.76) 1.209 93.51 98.29 Note. SE = standard error. CI = confidence interval. LL = lower limit. UL = upper limit.
Table 4
Correlations between WAIS-IV Standard and Prorated Perceptual Reasoning Index Scores
Prorated Scoring Methods Standard Perceptual Reasoning Index Block Design + Visual Puzzles .943 Matrix Reasoning + Visual Puzzles .872 Block Design + Matrix Reasoning .914 Note. All p values significant at <.001.
Significant differences emerged between standard and prorated Full Scale IQ Index score scoring methods when Verbal Comprehension Index and/or Perceptual Reasoning Index subtests

WAIS-IV Index and Full Scale Intelligence Quotient Score
________________________________________________________________________ 65
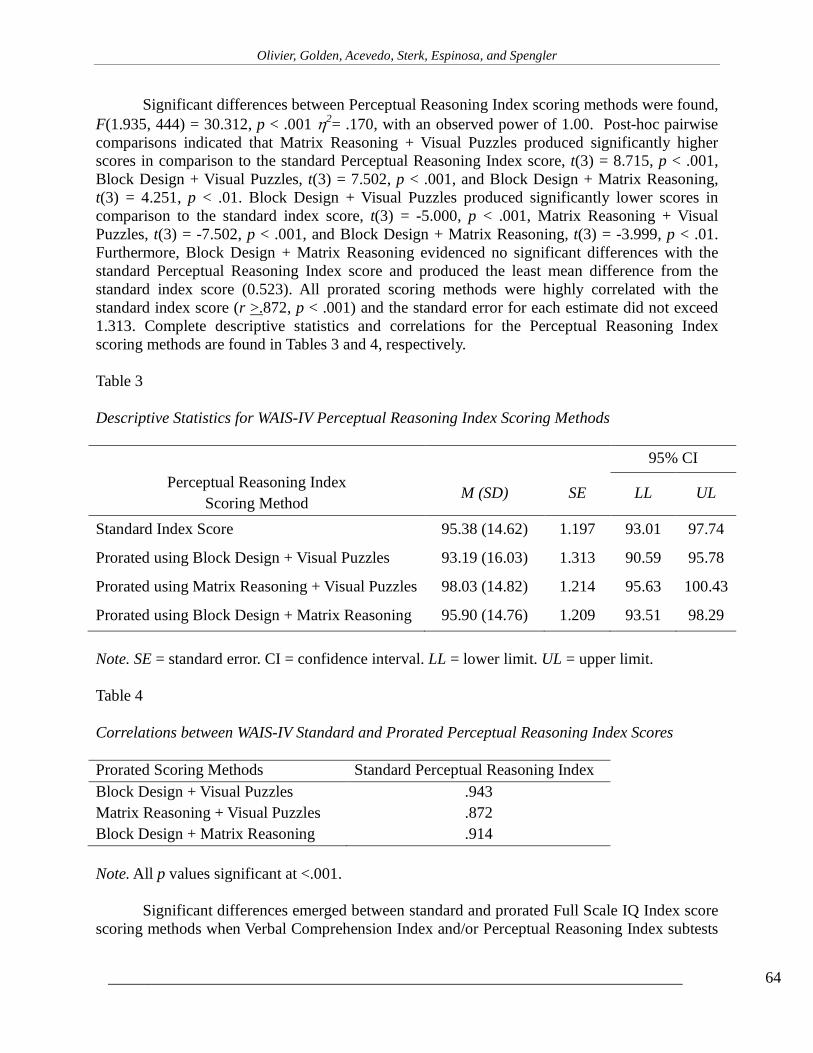
were omitted, F(4.064, 2220) = 15.400, p < .001 η2= .094, with an observed power of 1.00. Post-hoc pairwise comparisons indicated that Block Design + Visual Puzzles produced significantly lower scores in comparison to the standard Full Scale IQ Index score, t(15) = -3.976, p < .05. Whenever Matrix Reasoning + Visual Puzzles was used in Full Scale IQ calculations, whether in isolation or in combination with a prorated Verbal Comprehension Index score, scores were significantly higher than standard Full Scale IQ index scores (Matrix reasoning + Visual Puzzles, t(15) = 7.324, p < .001; Vocabulary + Similarities and Matrix Reasoning + Visual Puzzles, t(15) = 7.413, p < .001; Vocabulary + Information and Matrix Reasoning + Visual Puzzles, t(15) = 6.871, p < .001; and Similarities + Information and Matrix Reasoning + Visual Puzzles, t(15) = 6.319, p < .001). All prorated scoring methods were highly correlated with the standard Full Scale IQ Index score (r > .981, p < .001) and the standard error for each estimate did not exceed 1.207. Descriptive statistics and correlations for Full Scale IQ scoring methods are found in Tables 5 and 6, respectively.
Table 5
Descriptive Statistics for WAIS-IV Full Scale IQ Index Scoring Methods
95% CI Full Scale IQ Index Scoring Method M (SD) SE LL UL
Standard Index Score 94.15 (14.31) 1.172 91.84 96.47 Prorated FSIQ using 9 core subtests: Omission of one VCI or one PRI subtest
Vocabulary + Similarities 94.44 (14.57) 1.194 92.07 96.80
Vocabulary + Information 94.61 (14.37) 1.177 92.28 96.94
Similarities + Information 94.38 (14.38) 1.178 92.05 96.71
Block Design + Visual Puzzles 93.49 (14.52) 1.190 92.14 95.84
Matrix Reasoning + Visual Puzzles 95.19 (14.38) 1.178 92.87 97.52
Block Design + Matrix Reasoning 94.46 (14.40) 1.179 92.13 96.79 Prorated FSIQ using 8 core subtests: Omission of one VCI and one PRI subtest
Vocabulary + Similarities & Block Design + Visual Puzzles
93.68 (14.73) 1.207 91.29 96.06
Vocabulary + Similarities & Matrix Reasoning + Visual Puzzles
95.43 (14.60) 1.196 93.07 97.79
Vocabulary + Similarities & Block Design + Matrix Reasoning
94.64 (14.59) 1.195 92.28 97.01
Vocabulary + Information & Block Design + Visual Puzzles
93.87 (14.55) 1.192 91.51 96.22
Olivier, Golden, Acevedo, Sterk, Espinosa, and Spengler
________________________________________________________________________ 66
Vocabulary + Information & Matrix Reasoning + Visual Puzzles
95.59 (14.36) 1.176 93.27 97.92
Vocabulary + Information & Block Design + Matrix Reasoning
94.83 (14.33) 1.174 92.51 97.15
Similarities + Information & Block Design + Visual Puzzles
93.66 (14.58) 1.195 91.30 96.03
Similarities + Information & Matrix Reasoning + Visual Puzzles
95.34 (14.39) 1.179 93.01 97.67
Similarities + Information & Block Design + Matrix Reasoning
94.60 (14.37) 1.178 92.28 96.93
Note. SE = standard error. CI = confidence interval. LL = lower limit. UL = upper limit.
Table 6
Correlations between WAIS-IV Standard and Prorated Full Scale IQ Index Scores
Prorated Scoring Methods Standard Full Scale IQ Index Prorated FSIQ using 9 core subtests: Omission of one VCI or one PRI subtest
Vocabulary + Similarities .992
Vocabulary + Information .987
Similarities + Information .991
Block Design + Visual Puzzles .990
Matrix Reasoning + Visual Puzzles .993
Block Design + Matrix Reasoning .990 Prorated FSIQ using 8 core subtests: Omission of one VCI and one PRI subtest
Vocabulary + Similarities & Block Design + Visual Puzzles
.987
Vocabulary + Similarities & Matrix Reasoning + Visual Puzzles
.990
Vocabulary + Similarities & Block Design + Matrix Reasoning
.987
Vocabulary + Information & Block Design + Visual Puzzles
.981
Vocabulary + Information & Matrix Reasoning + Visual Puzzles
.984
WAIS-IV Index and Full Scale Intelligence Quotient Score
________________________________________________________________________ 67
Vocabulary + Information & Block Design + Matrix Reasoning
.983
Similarities + Information & Block Design + Visual Puzzles
.986
Similarities + Information & Matrix Reasoning + Visual Puzzles
.987
Similarities + Information & Block Design + Matrix Reasoning
.985
Note. All p values significant at <.001.
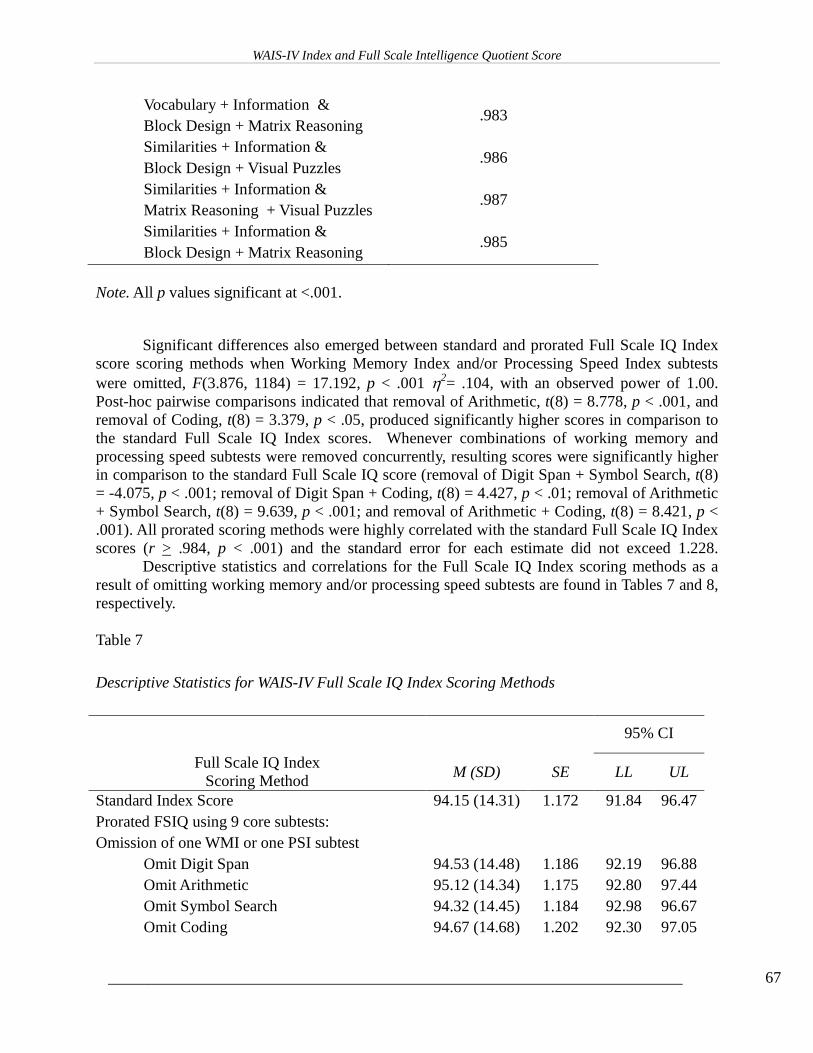
Significant differences also emerged between standard and prorated Full Scale IQ Index score scoring methods when Working Memory Index and/or Processing Speed Index subtests were omitted, F(3.876, 1184) = 17.192, p < .001 η2= .104, with an observed power of 1.00. Post-hoc pairwise comparisons indicated that removal of Arithmetic, t(8) = 8.778, p < .001, and removal of Coding, t(8) = 3.379, p < .05, produced significantly higher scores in comparison to the standard Full Scale IQ Index scores. Whenever combinations of working memory and processing speed subtests were removed concurrently, resulting scores were significantly higher in comparison to the standard Full Scale IQ score (removal of Digit Span + Symbol Search, t(8) = -4.075, p < .001; removal of Digit Span + Coding, t(8) = 4.427, p < .01; removal of Arithmetic + Symbol Search, t(8) = 9.639, p < .001; and removal of Arithmetic + Coding, t(8) = 8.421, p < .001). All prorated scoring methods were highly correlated with the standard Full Scale IQ Index scores (r > .984, p < .001) and the standard error for each estimate did not exceed 1.228. Descriptive statistics and correlations for the Full Scale IQ Index scoring methods as a result of omitting working memory and/or processing speed subtests are found in Tables 7 and 8, respectively.
Table 7 Descriptive Statistics for WAIS-IV Full Scale IQ Index Scoring Methods
95% CI
Full Scale IQ Index Scoring Method M (SD) SE LL UL
Standard Index Score 94.15 (14.31) 1.172 91.84 96.47 Prorated FSIQ using 9 core subtests: Omission of one WMI or one PSI subtest
Omit Digit Span 94.53 (14.48) 1.186 92.19 96.88 Omit Arithmetic 95.12 (14.34) 1.175 92.80 97.44 Omit Symbol Search 94.32 (14.45) 1.184 92.98 96.67 Omit Coding 94.67 (14.68) 1.202 92.30 97.05

Olivier, Golden, Acevedo, Sterk, Espinosa, and Spengler
________________________________________________________________________ 68
Prorated FSIQ using 8 core subtests: Omission of one WMI and one PSI subtest
Omit Digit Span + Symbol Search 95.21 (14.72) 1.205 92.83 97.59 Omit Digit Span + Coding 95.11 (14.99) 1.228 92.69 97.54 Omit Arithmetic + Symbol Search 95.88 (14.50) 1.188 93.53 98.28 Omit Arithmetic + Coding 95.78 (14.77) 1.201 93.34 98.17
Note. SE = standard error. CI = confidence interval. LL = lower limit. UL = upper limit. Table 8 Correlations between WAIS-IV Standard and Prorated Full Scale IQ Index Scores Prorated Scoring Methods Standard Full Scale IQ Index Prorated FSIQ using 9 core subtests: Omission of one WMI or one PSI subtest
Omit Digit Span .993 Omit Arithmetic .995 Omit Symbol Search .986 Omit Coding .992
Prorated FSIQ using 8 core subtests: Omission of one WMI and one PSI subtest
Omit Digit Span + Symbol Search .984 Omit Digit Span + Coding .984 Omit Arithmetic + Symbol Search .988 Omit Arithmetic + Coding .987
Note. All p values significant at <.001. Analyses of Individual Differences. Individual differences between prorated scores and the standard index score counterparts were calculated for each proration combination outlined above. Difference scores between prorated and standard index scores were calculated for each proration combination, and percentage of exact agreement is reported below. Complete individual difference data is outlined in Tables 9 through 14. Table 9 Agreement, Overestimated, and Underestimated Percentages for Verbal Comprehension Index Proration Combinations Prorated Scoring Methods Percentages
Vocabulary + Similarities

WAIS-IV Index and Full Scale Intelligence Quotient Score
________________________________________________________________________ 69
Exact Agreement 22.8 Overestimated between 2 and 9 points 37.6 Underestimated between 1 and 11 points 39.6 Vocabulary + Information Exact Agreement 10.7 Overestimated between 1 and 9 points 37.6 Underestimated between 1 and 14 points 51.7 Similarities + Information Exact Agreement 17.4 Overestimated between 1 and 14 points 37.5 Underestimated between 1 and 14 points 45.1 Table 10 Agreement, Overestimated, and Underestimated Percentages for Perceptual Reasoning Index Proration Combinations Prorated Scoring Methods Percentages
Block Design + Visual Puzzles Exact Agreement 16.1 Overestimated between 1 and 25 points* 54.4 Underestimated between 1 and 14 points 29.5 Matrix Reasoning + Visual Puzzles Exact Agreement 19.5 Overestimated between 1 and 10 points 14.8 Underestimated between 1 and 11 points 65.7 Block Design + Matrix Reasoning Exact Agreement 18.1 Overestimated between 1 and 31 points* 34.2 Underestimated between 1 and 11 points 47.7 *large overestimate values due to one individual’s poor performance on Block Design (scaled score = 3).
Olivier, Golden, Acevedo, Sterk, Espinosa, and Spengler
________________________________________________________________________ 70
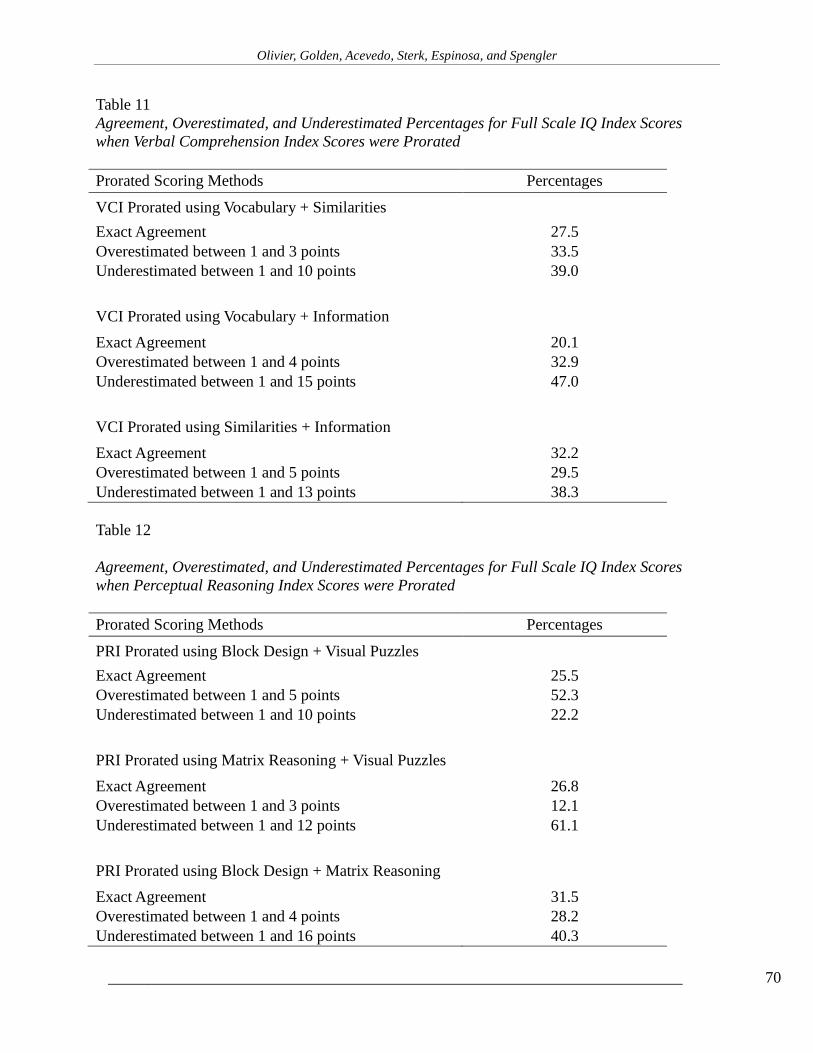
Table 11 Agreement, Overestimated, and Underestimated Percentages for Full Scale IQ Index Scores when Verbal Comprehension Index Scores were Prorated Prorated Scoring Methods Percentages
VCI Prorated using Vocabulary + Similarities Exact Agreement 27.5 Overestimated between 1 and 3 points 33.5 Underestimated between 1 and 10 points 39.0 VCI Prorated using Vocabulary + Information Exact Agreement 20.1 Overestimated between 1 and 4 points 32.9 Underestimated between 1 and 15 points 47.0 VCI Prorated using Similarities + Information Exact Agreement 32.2 Overestimated between 1 and 5 points 29.5 Underestimated between 1 and 13 points 38.3 Table 12 Agreement, Overestimated, and Underestimated Percentages for Full Scale IQ Index Scores when Perceptual Reasoning Index Scores were Prorated Prorated Scoring Methods Percentages
PRI Prorated using Block Design + Visual Puzzles Exact Agreement 25.5 Overestimated between 1 and 5 points 52.3 Underestimated between 1 and 10 points 22.2 PRI Prorated using Matrix Reasoning + Visual Puzzles Exact Agreement 26.8 Overestimated between 1 and 3 points 12.1 Underestimated between 1 and 12 points 61.1 PRI Prorated using Block Design + Matrix Reasoning Exact Agreement 31.5 Overestimated between 1 and 4 points 28.2 Underestimated between 1 and 16 points 40.3
WAIS-IV Index and Full Scale Intelligence Quotient Score
________________________________________________________________________ 71
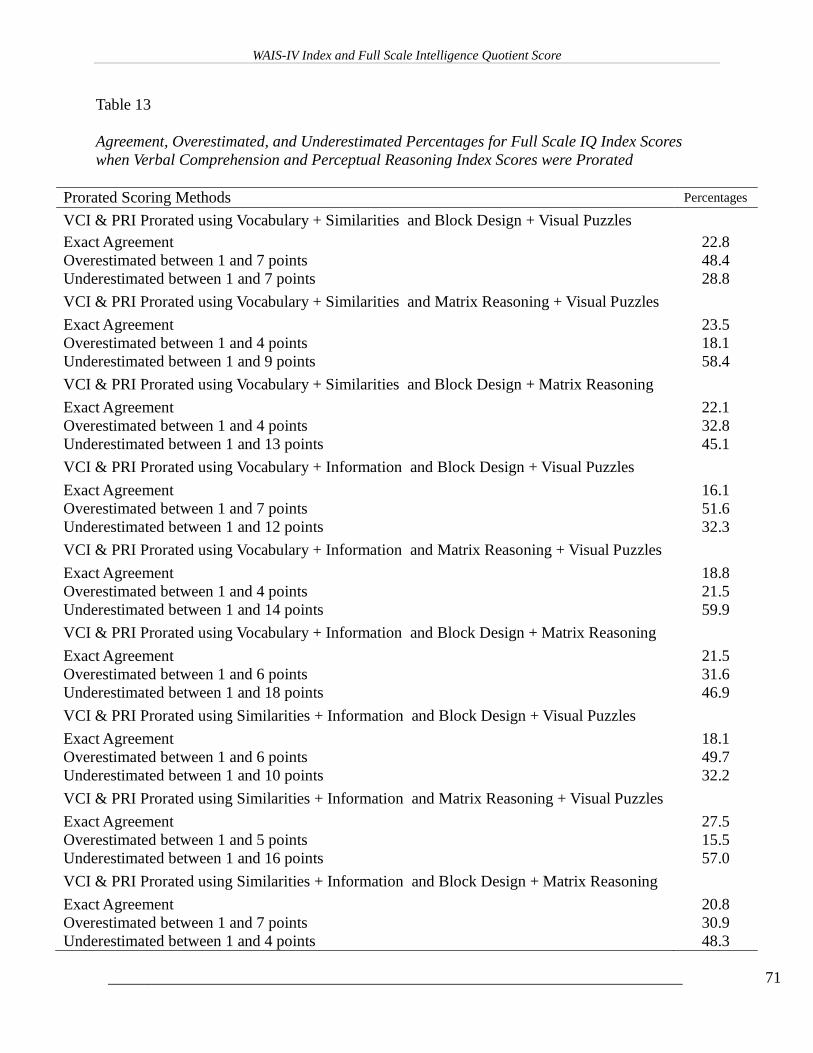
Table 13 Agreement, Overestimated, and Underestimated Percentages for Full Scale IQ Index Scores when Verbal Comprehension and Perceptual Reasoning Index Scores were Prorated
Prorated Scoring Methods Percentages VCI & PRI Prorated using Vocabulary + Similarities and Block Design + Visual Puzzles Exact Agreement 22.8 Overestimated between 1 and 7 points 48.4 Underestimated between 1 and 7 points 28.8 VCI & PRI Prorated using Vocabulary + Similarities and Matrix Reasoning + Visual Puzzles Exact Agreement 23.5 Overestimated between 1 and 4 points 18.1 Underestimated between 1 and 9 points 58.4 VCI & PRI Prorated using Vocabulary + Similarities and Block Design + Matrix Reasoning Exact Agreement 22.1 Overestimated between 1 and 4 points 32.8 Underestimated between 1 and 13 points 45.1 VCI & PRI Prorated using Vocabulary + Information and Block Design + Visual Puzzles Exact Agreement 16.1 Overestimated between 1 and 7 points 51.6 Underestimated between 1 and 12 points 32.3 VCI & PRI Prorated using Vocabulary + Information and Matrix Reasoning + Visual Puzzles Exact Agreement 18.8 Overestimated between 1 and 4 points 21.5 Underestimated between 1 and 14 points 59.9 VCI & PRI Prorated using Vocabulary + Information and Block Design + Matrix Reasoning Exact Agreement 21.5 Overestimated between 1 and 6 points 31.6 Underestimated between 1 and 18 points 46.9 VCI & PRI Prorated using Similarities + Information and Block Design + Visual Puzzles Exact Agreement 18.1 Overestimated between 1 and 6 points 49.7 Underestimated between 1 and 10 points 32.2 VCI & PRI Prorated using Similarities + Information and Matrix Reasoning + Visual Puzzles Exact Agreement 27.5 Overestimated between 1 and 5 points 15.5 Underestimated between 1 and 16 points 57.0 VCI & PRI Prorated using Similarities + Information and Block Design + Matrix Reasoning Exact Agreement 20.8 Overestimated between 1 and 7 points 30.9 Underestimated between 1 and 4 points 48.3
Olivier, Golden, Acevedo, Sterk, Espinosa, and Spengler
________________________________________________________________________ 72
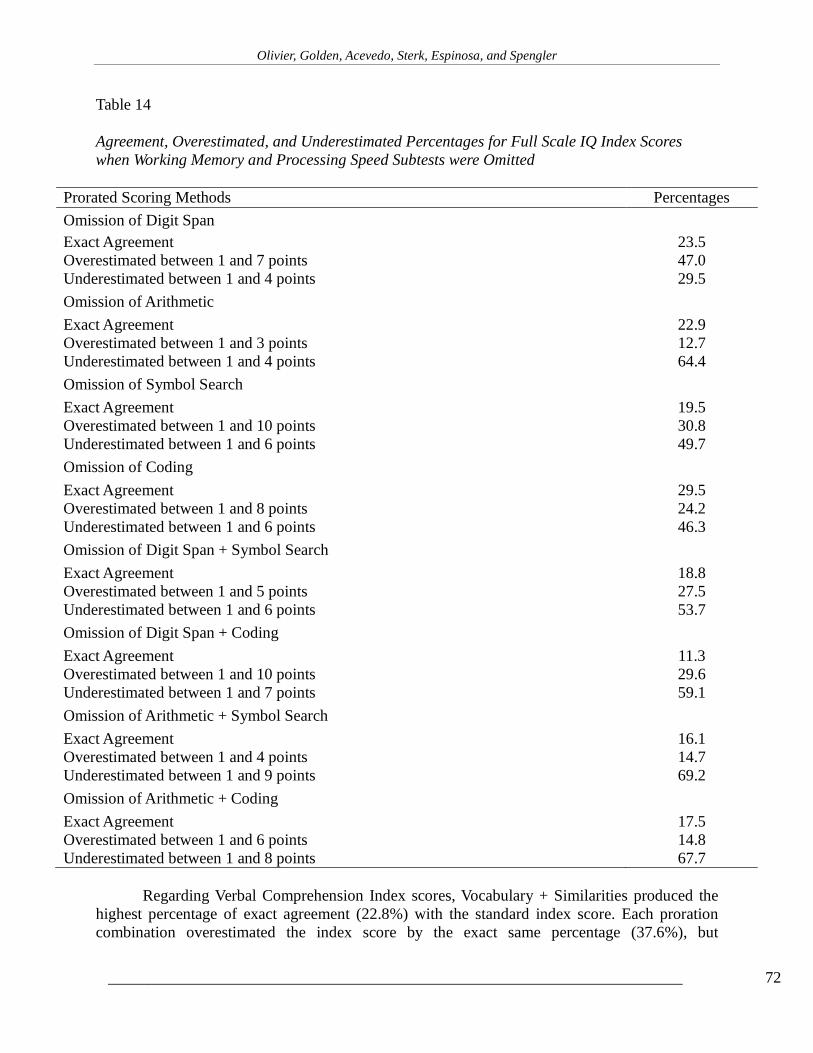
Table 14 Agreement, Overestimated, and Underestimated Percentages for Full Scale IQ Index Scores when Working Memory and Processing Speed Subtests were Omitted
Prorated Scoring Methods Percentages Omission of Digit Span Exact Agreement 23.5 Overestimated between 1 and 7 points 47.0 Underestimated between 1 and 4 points 29.5 Omission of Arithmetic Exact Agreement 22.9 Overestimated between 1 and 3 points 12.7 Underestimated between 1 and 4 points 64.4 Omission of Symbol Search Exact Agreement 19.5 Overestimated between 1 and 10 points 30.8 Underestimated between 1 and 6 points 49.7 Omission of Coding Exact Agreement 29.5 Overestimated between 1 and 8 points 24.2 Underestimated between 1 and 6 points 46.3 Omission of Digit Span + Symbol Search Exact Agreement 18.8 Overestimated between 1 and 5 points 27.5 Underestimated between 1 and 6 points 53.7 Omission of Digit Span + Coding Exact Agreement 11.3 Overestimated between 1 and 10 points 29.6 Underestimated between 1 and 7 points 59.1 Omission of Arithmetic + Symbol Search Exact Agreement 16.1 Overestimated between 1 and 4 points 14.7 Underestimated between 1 and 9 points 69.2 Omission of Arithmetic + Coding Exact Agreement 17.5 Overestimated between 1 and 6 points 14.8 Underestimated between 1 and 8 points 67.7
Regarding Verbal Comprehension Index scores, Vocabulary + Similarities produced the highest percentage of exact agreement (22.8%) with the standard index score. Each proration combination overestimated the index score by the exact same percentage (37.6%), but

WAIS-IV Index and Full Scale Intelligence Quotient Score
________________________________________________________________________ 73
elimination of Vocabulary (i.e., Similarities + Information) produced the greatest range of overestimated scores (i.e., 1 to 14 points). Underestimation percentages and ranges among the three proration combinations were not significantly different. The Perceptual Reasoning Index proration combination using Matrix Reasoning + Visual Puzzles produced the highest percentage of exact agreement with standard scores (19.5%), followed closely by Block Design + Matrix Reasoning (18.1%). Matrix Reasoning + Visual Puzzles had the highest percentage of underestimates (65.7%), but a very low rate of overestimates (14.8%). The ranges of underestimates for all three proration combinations were comparable (i.e., between 1 and 11 points and 1 and 14 points). Finally, it should be noted that the ranges of overestimates varied significantly, due to one participant’s very poor performance on Block Design (scaled score = 3). Regarding individual differences on Full Scale IQ, prorated Verbal Comprehension Index only, using Similarities + Information resulted in the highest percentage of exact agreement with standard Full Scale IQ index scores (32.2%). In regard to removing Working Memory and Processing Speed Index subtests from Full Scale IQ calculations, results suggested that omission of Coding alone produced the highest percentage of exact agreement (29.5%). Discussion The results of this study suggest that there are numerous proration combinations that will not cause statistically significant differences in comparison to the standard index scores. In regard to the Verbal Comprehension Index, results suggested that any verbal subtest may be removed without significantly altering the index score, despite the fact that Vocabulary accounts for the greatest percentage of variance within the general intelligence, or g, factor (Sattler, 2009). It is recommended that Vocabulary not be omitted, as this subtest may provide particularly useful information, such as an estimate of premorbid functioning (Axelrod et al., 1999). Furthermore, analyses of individual differences revealed that Vocabulary + Similarities produced the highest percentage of exact agreement with standard Verbal Comprehension Index scores (22.8% exact agreement). These findings are discrepant from previous research suggesting that Vocabulary + Information produced artificially inflated index score estimates in a neuropsychologically impaired sample of relatively similar size as the present study (Umfleet et al., 2012). As the participants in this study had similar education levels as those in the Umfleet et al. study, this discrepancy may be due to the fact that the present sample included individuals with a younger mean age (M age = 34 years) than the Umfleet et al. study (M age = 52 years for “brain-damaged” group and 49 years for “medical” group). Therefore, despite similar mean education levels, perhaps individuals in the Umfleet et al. study obtained higher mean scores on Vocabulary and/or Information due to the experience and greater fund of common knowledge that accompanies age. Perceptual Reasoning Index score results suggest that Block Design + Matrix Reasoning may produce the most accurate index score estimates, as it was the only combination that did not produce significantly discrepant scores in comparison to the standard index score. Matrix Reasoning + Visual Puzzles produced the highest percentage of exact agreement with standard index score counterparts, yet this combination produced significantly higher index scores in comparison to the standard index score and all other proration combinations. Block Design + Visual Puzzles produced significantly lower scores than the standard index score and all other proration combinations. It was hypothesized that Block Design + Visual Puzzles would produce the most accurate estimations of Perceptual Reasoning Index scores, due to the assumption that

Olivier, Golden, Acevedo, Sterk, Espinosa, and Spengler
________________________________________________________________________ 74
these two subtests measured a wider range of cognitive abilities than did Matrix Reasoning. Results of the final hypothesis suggest that the combination of Block Design + Visual Puzzles artificially deflates estimated Full Scale IQ Index scores, which was an unexpected finding. Conversely, any inclusion of Matrix Reasoning and Visual Puzzles will inflate estimated Full Scale IQ scores, which was expected due to the inflating effects this combination of subtests had upon the Perceptual Reasoning Index. These findings are also discrepant from the findings reported by Umfleet et al. (2012). Specifically, these researchers found no significant differences between Perceptual Reasoning Index scoring methods. When examining the effects of removing working memory and processing speed subtests, results indicated that omitting Digit Span alone and omitting Symbol Search alone are the only two proration options that will not artificially inflate Full Scale IQ Index score estimations. Yet, removal of Coding alone produced the highest percentage of exact agreement with standard score counterparts. It was initially hypothesized that inclusion of both Arithmetic and Symbol Search (i.e., at the expense of omitting Digit Span and Coding) would provide the most accurate estimate of Full Scale IQ Index scores. It was suggested that Arithmetic encompassed all of the skills required to complete Digit Span (e.g., rote memorization initially and then gradually requires enough short-term memory and mental flexibility/manipulation of data to produce digits backward and digits in sequence) in addition to the ability to execute simple mathematical operations mentally within a specified time limit and would therefore significantly contribute to Full Scale IQ scores. Secondly, it was suggested that Symbol Search assessed a wider range of cognitive skills, as it did not allow memory to assist in aiding performance. There were two specific ways in which this hypothesis was not supported. First, when any combination of both a working memory and processing speed subtest is removed, the resulting Full Scale IQ Index score will be elevated in comparison to the standard index score. It appears that one subtest from each of these indices must be included in Full Scale IQ Index score calculations to produce an accurate estimated score (i.e., a score that does not deviate significantly from the standard index score). Secondly, although these results support the inclusion of Arithmetic, they do not support the inclusion of Symbol Search at the omission of Coding. It is possible that because Coding encompasses the skills required in Symbol Search, such as visual-spatial scanning plus intact short-term memory functioning (Sattler, 2009), this subtest actually measures a wider range of cognitive skills than Symbol Search alone. Implications Clinical psychologists today face considerable constraints upon their time and resources. Neuropsychologists especially are often further constrained due to the large test batteries many administer and the long reports that are generated. Additionally, outpatients often desire to complete testing as quickly as possible. At first glance, the results of this study appear to suggest that the Wechsler batteries may be shortened by up to two subtests without significant effects on the resulting index scores. However, there are differences between statistical significance and clinical significance that must be carefully considered, especially when results suggest that statistically significant differences do not exist. Statistical significance is determined by mean differences. Therefore, despite the lack of statistical significance, important discrepancies may exist on individual bases (e.g., proration scoring methods on WAIS-IV Verbal Comprehension Index produced differences between estimates and standard scores of nearly one standard deviation for some participants). Such individual difference data were included in this study to aid the psychologist in making judicial choices regarding which subtests to remove from
WAIS-IV Index and Full Scale Intelligence Quotient Score
________________________________________________________________________ 75
administration. The risks of prorating scores at the expense of potentially losing accuracy must be measured against the benefits gained by doing so, and when presented with a choice of proration combinations, subtests must be chosen judiciously. The results of this study provide clinicians with suggested guidelines to use when attempting to obtain prorated scores that are not significantly different from standard index scores. Secondly, the results of this study suggest that there are large correlations between prorated and standard index scores. Wechsler (1944) recommended that when attempting to shorten the original Bellevue Intelligence Examination, the choice of which subtests to administer should be guided by the subtests’ correlations with the more general scores. These data suggest, however, that despite large correlations between prorated and standard index scores, significant differences still exist. Such results appear to suggest that there are few, if any, differences between scoring methods, yet significant differences existed. Therefore, it is important that the data not be misinterpreted. Thirdly, whenever prorated scoring methods are utilized in clinical settings, prorated scores should be clearly indicated in the psychological report. For the sake of brevity, many clinicians choose not to report detailed test scores. This can cause considerable complications in some cases. Consider for example the patient involved in litigation who is examined by two psychologists – one working for the prosecuting attorney and one working for the defense. The choice of one practitioner to prorate Wechsler intelligence scores while the other administers the entire core battery could result in significant index score differences, considering this intra-individual example; and if index scores are reported in isolation, it becomes more difficult to decipher the reasons behind the drastic score differences. Therefore, whenever a standardized test is altered in any way, such alterations should be clearly noted in the report. Finally, the sample in this study was representative of a typical clinical sample with numerous diagnoses such as learning disorders, mood disorders, attentional disorders, and others that would normally be observed on an outpatient basis. Diagnostic variability is useful in terms of generalizing results to large groups of patients. Conversely, it is unknown whether similar results would be found within more diagnostically homogeneous samples. Limitations This study has a number of limitations that must be addressed. First, as discussed above, it is unclear whether these results would be replicated in more specific diagnostic samples. For example, neurological (e.g., brain tumors, multiple sclerosis, seizure disorders) and acute impairment (e.g., states of active psychosis and acute traumatic brain injuries) conditions may cause decreased Working Memory Index and Processing Speed Index scores. In such cases, removing subtests that are sensitive to impairment may cause artificially inflated Full Scale IQ Index score estimates, despite the results of this study that purport it may be safe to omit Digit Span or Symbol Search. Future research endeavors should therefore focus on whether proration causes significant index score differences in different diagnostic groups. Second, although this study included rather large sample sizes, results were not analyzed according to age groups. Future studies should analyze results by the age groups set forth in the WAIS-IV administration and scoring manual to examine whether proration affects scores at various age levels.
Olivier, Golden, Acevedo, Sterk, Espinosa, and Spengler
________________________________________________________________________ 76
About the Authors
Traci W. Olivier, M.S. is with Nova Southeastern University’s Center for Psychological Studies. Correspondence regarding this article should be addressed to Traci W. Olivier, Nova Southeastern University, Center for Psychological Studies, 3301 College Avenue, Ft. Lauderdale, Florida, 33314-7796. Email: [email protected]
Charles J. Golden, Ph.D. is with Nova Southeastern University’s Center for
Psychological Studies. Email: [email protected]
Amarilis Acevedo, Ph.D. is with Nova Southeastern University’s Center for
Psychological Studies. Victoria I. Sterk, B.S. is with Nova Southeastern University’s Center for Psychological
Studies. Kristina M. Espinosa, B.S. is with Nova Southeastern University’s Center for
Psychological Studies. Kayla M. Spengler, B.A. is with Nova Southeastern University’s Center for
Psychological Studies. References Axelrod, B. N., Dingell, J. D., Ryan, J. J., & Ward, L. C. (2000). Estimation of Wechsler Adult
Intelligence Scale-III index scores with the 7-subtest short form in a clinical sample. Assessment, 7(2), 157-161. doi: 10.1177/107319110000700207
Axelrod, B. N. & Ryan, J. J. (2000). Prorating Wechsler Adult Intelligence Scale-III summary
scores. Journal of Clinical Psychology, 56(6), 807-811. doi: 10.1002/(SICI)1097-4679(200006)56:6
Axelrod, B. N., Ryan, J. J. & Ward, L. C. (2001). Evaluation of seven-subtest short forms of the
Wechsler Adult Intelligence Scale-III in a referred sample. Archives of Clinical Neuropsychology, 16, 1-8. doi: 10.1016/S0887-6177(99)00054-2
Axelrod, B. N., Vanderploeg, R. D., & Schinka, J. A. (1999). Comparing methods for estimating
premorbid intellectual functioning. Archives of Clinical Neuropsychology, 14(4), 341-346. doi:10.1016/S0887-6177(98)00028-6
Benson, N., Hulac, D. M., & Kranzler, J. H. (2010). Independent examination of the Wechsler
Adult Intelligence Scale – Fourth Edition (WAIS-IV): What does the WAIS-IV measure? Psychological Assessment, 22(1), 121-130. doi: 10.1037/a0017767

WAIS-IV Index and Full Scale Intelligence Quotient Score
________________________________________________________________________ 77
Myers, J. L., Well, A. D., & Lorch, R. F. (2010). Research design and statistical analyses, third
edition. New York, NY: Routledge.
Palmer, B. W., Taylor, M. J. & Heaton, R. K. (2003). Accuracy of WAIS-III – WMS-III joint factor scores when one or more subtests is omitted or an alternate subtest is employed. In D. S. Tulsky (Ed.), Clinical interpretation of the WAIS-III and WMS-III (pp.391-450). San Diego, CA: Academic Press.
Sattler, J. M. & Ryan, J. J. (2009). Assessment with the WAIS-IV. La Mesa, CA: Jerome M.
Sattler, Publisher, Inc.
Umfleet, L. G., Ryan, J. J., Gontkovsky, S. T. & Morris, J. (2012). Estimating WAIS-IV indices: Proration versus linear scaling in a clinical sample. Journal of Clinical Psychology, 68(4), 390-396. doi: 10.1002/jclp.21827
Wechsler, D. (1944). The measurement of adult intelligence (3rd ed.). Baltimore, MD: The
Williams and Wilkins Company. Wechsler, D. (2008). Wechsler Adult Intelligence Scale (4th ed.). San Antonio, TX: The
Psychological Corporation.