Embed Size (px)
Citation preview
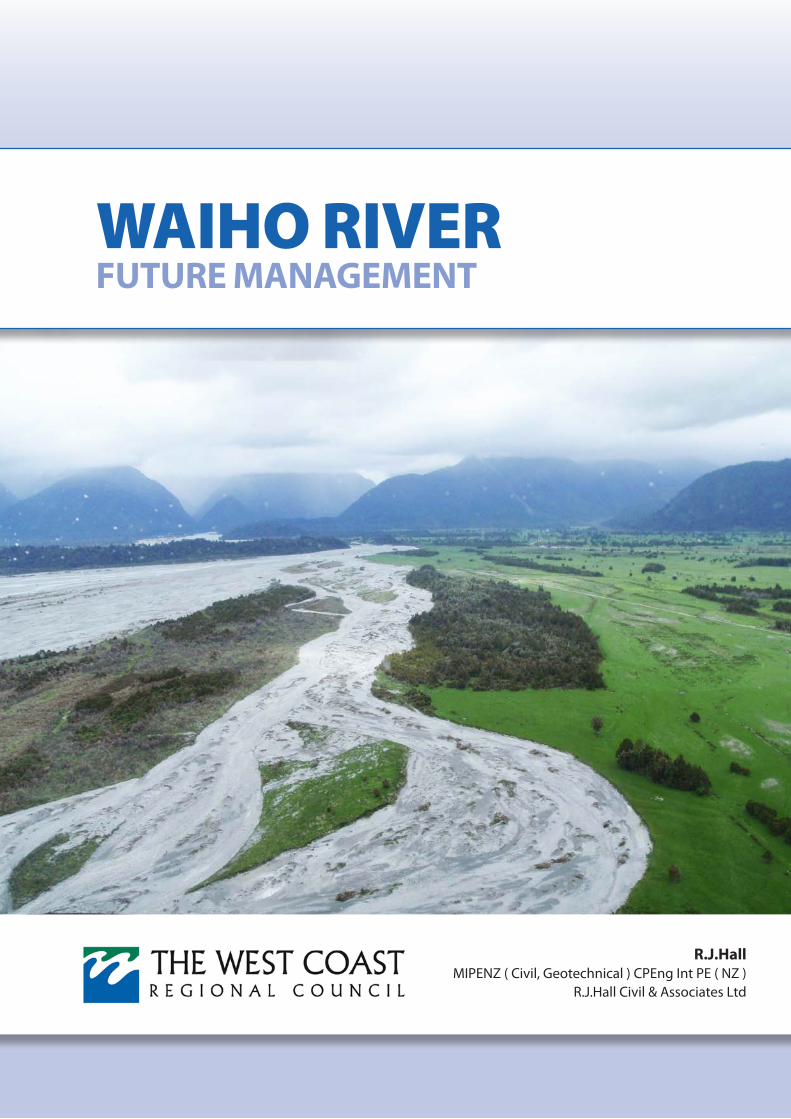
Waiho RiveR Future ManageMent
rJHallMIPENZ ( Civil Geotechnical ) CPEng Int PE ( NZ )
RJHall Civil amp Associates Ltd
ExEcutivE Summary
WaiHo riVer Future ManageMent
1 The Waiho River from itrsquos confluence with the Callery River through to the Waiho Loop has a steep gradient perched on an alluvial fan formed over a long timespan by that river The river presently has an active braiding form constrained laterally over the greater part of this length by man made river protection measures (stopbanks rock rip rap facing rock rip rap groynes) In times of high flow much if not all of the riverbed will experience live bed conditions These conditions generate deep scour and aggressive sediment movement In terms of sediment transport this river is categorised as a bed load dominant river meaning that the riverbed shape (width depth) is largely determined by the throughput of bed load sediments rather than the sediments that are suspended in the rivers flowing water
2 The riverbed is presently aggrading over its entire length from the Callery River confluence through to and immediately beyond the Waiho Loop This situation has remained reasonably consistent for the last 30 to 40 years Aggradation rates are increasing and are higher in the upper end of this reach diminishing as you move downstream to the Waiho Loop
3 There is insufficient information available at this time on river form below the Waiho Loop to quantify whether the river is stable aggrading or degrading below the Loop
4 The scale of this persistent and growing aggradational trend is such that freeboard on the stopbanks along the river margins are routinely compromised requiring the stopbanks to be raised and extended to combat raised bed levels The present riverbed at and below the State Highway (SH) 6 bridge on the true left bank over much of its length is elevated above the natural groundline outside the stopbank It is likely that the same is true of the true right stopbanks but insufficient ground level information is presently available on that side of the river to accurately quantify this
5 Research indicates that the river was in a state of dynamic equilibrium prior to the construction of these defences (stopbanks rock rip rap groynes) that is to say a natural balance existed between sediment supply to the alluvial fan the amount of sediment stored in the river system on the alluvial fan the river flows the plan form extent of the active braided river form and current sea level at the distal end of the alluvial fan From time to time in its unmodified form and as a result of alterations in sediment supply rates to the fan movements on the Alpine Fault and climate variations which altered the frequency and size of floods and normal river flows the rivers active boundaries will have over time expanded and contracted and the river migrated around on its alluvial fan surface The river boundary defences effectively prevent such movement on the true left side of the river from the SH 6 Bridge to the Waiho Loop The same is true for the true right bank from the SH 6 Bridge through to the oxidation ponds
6 Current thinking indicates that if these natural trends are prevented from following their natural course in a bed load dominated river situation such that non-natural boundary constraints are imposed which effectively resist the expansion and or migration of the active braided bed whilst the river retains a braided form then aggradation will occur These conclusions are supported by theoretical analysis and physical micro-scale models of this river system
1 Waiho RiveR optimal FutuRe management
14 In considering the foregoing it is opined that a continuation of the existing river management practices of raising and extending stopbanks as a response to rising mean bed levels within the active riverbed in order to preserve flood carrying capacity in the long term is unsustainable Ultimately the consequences of causing the riverbed to be elevated significantly above the alluvial fan surface outside of the stopbank systems will be to reach a point where if stopbank failure occurs it may not be physically or economically possible to restore the river to its pre-breach condition Further to that based on current trends it could be expected that the present aggradation trends will prograde downstream below the Waiho Loop placing additional demands on the Special Rating Districts on that side of the river
15 At this point in time the most obvious outcome in the absence of intervention will be a break out to the Tartare River As has been already noted this may provide some relief in the medium term but ultimately if sediment supply rates are maintained to the river system at rates comparable with the present and recent past assuming the present river boundary constraints remain a situation not dissimilar to that of the present will re-emerge within the Waiho Riverbed
16 The scale at which sediment is accumulating within the Waiho Riverbed is such that it is considered neither physically practical to remove it in order to retain the status quo or better reduce the present threat nor would it be affordable On that basis that strategy was and will remain unsustainable
17 In short there are no simple solutions on offer Whilst it is acknowledged that allowing an avulsion to occur to the Tartare River will have significant impacts on those persons whose land will be affected and also on the Tartare River itself in the absence of intervention to prevent such an outcome on present trends it is an inevitable outcome Accordingly the best strategy available at present would be to prepare for that outcome It is opined therefore that consideration needs to be given to determining what further information is needed in order to understand how this outcome might progress what is the likely nature and scale (including time scale) of the changes which will ensue and who is likely to be affected by these changes and to what extent
18 This strategy should also embrace a longer term strategy to cover the situation where the Waiho River subsequently regrades post the avulsion to a condition not dissimilar to that presently being experienced In this context it is opined that such considerations will need to consider the long term viability of the Franz Josef Township at its present location and could be incorporated into similar studies associated with the consequences of the next movement on the Alpine Fault [Langridge and Beban (2011)]
19 As a precursor for such a study it will be necessary to re-survey the Waiho River cross sections in order to update the present estimates of aggradational trends on the river and to provide a suitably scaled contour survey of the area between the Waiho and Tartare River both upstream and downstream of the northern end of the Waiho Loop and through that part of the Loop as well to provide a basis for investigating the likely progression and consequences of an avulsion in and along this route The riverbed surveys need to be extended on the true right side of the Waiho River at and below the Township in order to obtain a clearer impression on the elevational differences between bed levels in the river and the ground surfaces on the alluvial fan beyond the present rivers true right boundary in this reach
13 January 2012
7 Aggradation of the riverbed at the SH 6 Bridge has required the bridge to be raised a number of occasions over the last 20 years or so to preserve its integrity and further raisings must be expected in the coming years to accommodate rising bed levels at this site
8 Aggradation trends on the riverbed in the reach upstream of the SH 6 bridge should they persist at rates consistent with the present threaten a break out through the forest on the true right bank and into the Franz Josef township within the next 5 to 10 years unless the putative overflow route is sealed off Initially this would manifest as flood spills into the township but if left unchecked could ultimately lead to a permanent re-routing of the river through the Township (ie an avulsion)
9 Present aggradational trends on the river in the reach extending downstream from the SH 6 bridge through to the Waiho Loop is such that in the absence of human intervention an avulsion of the Waiho River into the Tartare River resulting from overflows in times of flood across the true right natural river bank at and below the oxidation ponds is imminent It is noted that overflows of this kind occurred during the December 2010 flood on the Waiho River and initiated headward erosion along the overflow corridor commencing from the true left bank of the Tatare River This erosion did not progress any great distance back towards the Waiho River during that event but it is expected that further erosion will occur in subsequent floods that spill water down this overflow corridor
10 It can be expected that when this process is complete headward erosion will have progressed into the Waiho River and moved progressively upstream degrading the Waiho Riverbed as it does so In the short to medium term this may ameliorate some of the problems presently being experienced in terms of repeated erosion of freeboard on stopbanks but exactly what path the degrading channel takes cannot be predicted with any confidence and accordingly could result in the destruction of sections of stopbanks as a result on either or both sides of the river
11 Should this situation eventuate and it is anticipated that it is highly probable that it will within the next 10 years given the present trends provided no human intervention measures are implemented to prevent it flow including flood flows along the southern side of the Waiho Loop (present river course) will diminish or cease altogether In the interim as increasing percentages of the flood flows approaching the avulsion upstream entry point divert towards and into the Tartare River further aggradation of the Waiho River between that point and the Waiho Loop can be anticipated as the Waiho River endeavours to secure a full avulsion into the Tartare River
12 If intervention measures are introduced to prevent an avulsion of the Waiho River into the Tartare River in the manner described above eg the construction of a new stopbank from the Oxidation Ponds through to the Waiho Loop then aggradation of the riverbed in this reach will continue albeit quiet probably at a greater rate than presently being experienced
13 The most recent riverbed surveys indicate that aggradation is now occurring over the full reach of the river between the WaihondashCallery Riversrsquo confluence and into and through the Waiho Loop If the intervention approach described in 12 above is implemented it must be anticipated that unless sediment supply to the river system below the CalleryndashWaiho Riversrsquo confluence falls well below present rates mean bed levels will continue to rise and the disparity between riverbed levels and hence flood levels and the berm lands outside the stopbanks will continue to increase
2 3 Waiho RiveR optimal FutuRe management Waiho RiveR optimal FutuRe management
Waiho RiveR Future ManageMent
Contents
chaptEr 1 Preamble 9
chaptEr 2 Information and Literature Reviewed during this Investigation 11
chaptEr 3 Critical Considerations for River Management on the Waiho River 13
chaptEr 4 Catchment Processes and Sediment Sources Supplying the Waiho River Alluvial Fan 15
chaptEr 5 Present condition of the Waiho River 23
chaptEr 6 Review of the Catchment Hydrology 27
chaptEr 7 Commentary on River Protection Works 29
chaptEr 8 Engineering Issues 31
chaptEr 9 Stopbank Failure 33
chaptEr 10 Other Avulsion Threats 35
chaptEr 11 Future Management Options 37
chaptEr 12 Conclusions 39
chaptEr 13 Acknowledgements 41
appEndix 1 Stopbank Breach Mechanisms 43
appEndix 2 Chris Coll Survey Ltd March 2011 River Bed Survey Plans 45
appEndix 3 Chris Coll Survey Ltd June 2011 Waiho Bush Block 61
appEndix 4 References 65
appEndix 5 Tables 67
appEndix 6 Figures 69
appEndix 7 Glossary of Terms 71
This Report and the survey plans are available electronically at the West Coast Regional Council website
wwwwcrcgovtnz
7 Waiho RiveR optimal FutuRe management
chaptEr 1
PreaMble
River cross section surveys undertaken by Chris Coll Surveyors Ltd (CCSL) of Westport in March 2011 under contract to the West Coast Regional Council (WCRC) indicated that there had been significant aggradation in the riverbed between the WaihondashCallery River confluence through to Rata Knoll since the previous survey of June 2008 (Fig 1) A cursory examination of cross section information indicated that the most recent changes were not dissimilar to that which had been determined between the January 2002 and June 2008 surveys (the former survey also undertaken by CCSL) albeit to a lesser extent than the March 2011 surveys indicate The CCSL survey plans have been attached to this report as Appendix 2 Further survey work was undertaken by CCSL in June 2011 in the reach upstream of SH 6 and the forested area on the true right bank of that reach the Waiho Bush Block The survey drawings associated with that work are attached to this report as Appendix 3
100
0
-10010000 2000 3000 4000 5000 6000 7000
thalweg Distance From CS 10 ( m )
av
Rat
e of
mB
l C
han
ge
( m y
r )
Column I
Column J
Fig 1 Waiho River at Franz Josef Mean Bed Level Changes in the Active Bed from 1983 -2011
Following receipt of the CCSL data in 2008 the WCRC in conjunction with the New Zealand Transport Agency (NZTA) engaged Good Earth Matters Ltd (GEML) of Palmerston North to investigate the flood carrying capacity of the river system with respect to the three special rating districts managed by the WCRC and the NZTA river protection works (stopbanks) in place on the river at that time GEML subsequently compiled a report WCRC Waiho River Flood Protection Schemes ndash Design Flood Levels (July 2008) Central to this study was a estimation of peak flood flows for the Waiho River below the WaihondashCallery River confluence through to and beyond the Waiho Loop for average recurrence intervals of 20 50 and 100 years and the construction and running of a one dimensional hydraulic model designed to provide indicative steady state flood profiles for these flood events (1850 2100 and 2300 cumec) GEML were careful to highlight the difficulties and limitations of such a study citing the use of synthetic flood estimates the variable nature behaviour during floods of steep braided bed load dominated rivers such as this with a fluctuating sediment supply under live bed conditions and possible limitations in the extent of information captured from cross sectional surveys The latter was not intended as a criticism of the survey work undertaken but rather highlighting the fact that critical changes in bed and natural bank heights could occur or be present that were not captured by the survey work presently available They indicated at that time that a solution to this might be to access or undertake if not presently available LIDAR information This information if it were available might enable a more sophisticated two dimensional hydraulic model to be employed and perhaps gain a clearer picture of the rivers hydraulic characteristics under flood identifying potential outflow routes where stopbank failure occurs (failure through overtopping and or lateral bank erosion) and or overbank flow where stopbanking is not present
9 Waiho RiveR optimal FutuRe management
Chapter 1 preamble
chaptEr 2
inForMation and literature reVieWed during tHis inVestigation
In the course of this investigation a variety of information and literature was examined by the Author Appendix 4 of this report identifies these references
In addition the Author visited Franz Josef in April 2011 and inspected the river from the ground in the company of WCRC River Engineer W Moen It was the intention to view the Callery River catchment by helicopter but inclement weather forced a cancellation of the flight The intention of this flight was to view the state of the Callery River catchment in particular its sediment sources and the current form of the Waiho River at and below the WaihondashCallery River confluence downstream to the Waiho Loop This fly over was rescheduled and took place on 27 October 2011 In the course of this fly over it was established that the landslide dam that blocked the Callery River and formed a small lake shortly prior to 3 September 2011 had overtopped and washed out leaving little evidence of its earlier presence at the site other than the landslide scar which was clearly evident It is opined that the breaching of the dam and its ultimate destruction occurred as a result of heavy rain in the area in the week preceding the 27 October 2011 fly over by RJ Hall
It is opined that this approach may have some benefits but it needs to be appreciated this river has demonstrated that substantial episodic sediment movement occurring in times of flood not necessarily related to flood peak as such but being influenced by sediment availability and probably also flood volume as well as aggressive alluvial fan aggradation variously between the WaihondashCallery River confluence through to Rata Knoll at this time At this time cross sectional surveys of the river do not extend much beyond the Waiho Loop and accordingly it is not possible to determine in any quantitative sense what changed in bed condition (aggradation degradation) is occurring in these lower reaches
In response to the March 2011 survey WCRC engaged RJ Hall amp Associates Ltd to evaluate these results and provide an independent river engineerrsquos opinion on the likely future behaviour of the Waiho River and on its future management In particular the WCRC wished to form a picture of the likely river course scenarios in the short to medium term (1 ndash 10 years) They noted that a primary concern of WCRC was the safety of the Franz Josef community but also needed to give cognizance to the flood plain(s) below the township The reason for this requirement arises from the responsibility the WCRC has to its special rating districts in that area This engagement required consideration of the potential risks to SH 6 and in particular to the SH 6 Bridge in its present location The strategic importance of that structure to the township of Franz Josef and the West Coast in general was stressed Further to that the WCRC were seeking an objective and critical review of the river training and protection works that have been put in place over the years by the WCRC NZTA (and its predecessors) and others It is interpreted that this critical review address the suitability of the works undertaken to date having regard to the nature of this river in its current morphological status and how best to manage it going forward in the short to medium term
With regard to the above the WCRC advised that they were seeking a long term strategy that could be employed to most effectively manage the river in the longer term
bull Keeptheriverflowingwithinitscurrentbanksand
bull Minimizetherisktolifeandpropertyand
bull Usethenaturalforcesoftherivertoshiftthecurrentldquoslugrdquoofgraveldownstreamasquicklyaspossible while minimizing any risk to those downstream of the township
This report summarises the findings of the investigations undertaken by RJ Hall and Associates Ltd in addressing the issues raised by the WCRC and provides advice and comment on the key issues associated with the future management of this river system in the manner sought by the WCRC through this engagement This investigation specifically excludes consideration of civil defence emergency management matters such as flood warning and evacuation
10 11 Waiho RiveR optimal FutuRe management Waiho RiveR optimal FutuRe management
Chapter 2 InformatIon and lIterature revIewed durIng thIs InvestIgatIon
chaptEr 3
CritiCal Considerations For riVer ManageMent on tHe WaiHo riVer
There are a number of high value assets which are presently afforded a measure of protection from the Waiho River at Franz Josef by river protection and training works These have been installed over the years by WCRC NZTA and their predecessors and others Maintenance of SH 6 through the Franz Josef area and particularly across and past the Waiho River is acknowledged as being of great importance to the economy of the West Coast in addition to the safety and wellbeing of the Franz Josef and environs community on both sides of the river Security of this route and of Franz Josef and its environs is of critical importance so much so that the various protection works that have been installed and are currently maintained by the WCRC and NZTA have been designed constructed and maintained to a standard appropriate to that requirement The works that presently exist are the culmination of half a century or more of experience with the river but the present condition of the river is seriously challenging these two agencies
31 nZta Works
In particular a series of rock riprap spur groynes on the Waiho River upstream of the SH 6 Bridge on both sides of the river afford protection to the SH6 Bridge These structures were installed and are being maintained by NZTA extending from SH 6 through to Canavans Knob on the river true left bank downstream of SH 6 The latter structures also employs rock riprap spur groynes to provide protection to the compacted gravel stopbank This stopbank and its appurtenant structures (spur groynes) has been constructed (and recently reconstructed on a new alignment on the river side of an earlier stopbank of similar construction) to provide protection to SH 6 between the SH 6 bridge and Canavans Knob endeavouring to prevent the break out of the river in this reach across the southern part of the rivers historical alluvial fan surface towards and into Docherty Creek to the North of the Waiho River
32 WCrC Works
The WCRC and its predecessor the Westland Catchment Board and Regional Water Board have over the years variously assumed control and maintenance of various works adjacent to the Franz Josef township that predated their existence and have constructed reconstructed repaired and maintained and in some cases abandoned river training and protection works on the river extending downstream from the SH 6 bridge on both banks of the river These works are managed for and on behalf of the Franz Josef Lower Waiho and Canavans Knob Special Rating Districts
The Franz Josef Special Rating District works comprise stopbanks rockwork (rock rip rap cladding) and a rock spur groyne on the true right of the river providing protection to Franz Josef township proper including an historic church the Department of Conservation headquarters and airstrip River protection works on the true left bank and of a similar type to those on the true right bank affords protection to the Motels Backpackers and Holiday Park as well as two private dwellings
12 13 Waiho RiveR optimal FutuRe management Waiho RiveR optimal FutuRe management
Chapter 3 CrItICal ConsIderatIons for rIver management on the waIho rIver
chaptEr 4
CatCHMent ProCesses and sediMent sourCes suPPlying tHe WaiHo riVer alluVial Fan
The Waiho River at SH 6 has a tributary catchment in the order of 170 square kilometres with rainfall in the headwaters exceeding 10 metres per annum (typically 11 to 14 metres per annum falling In these headwaters) There are two main tributaries the Callery River 92 Km2 (18 in ice glaciers) and the Waiho River (77 Km2 18 ice glacier) Approximately 15 Km2 of the Waiho catchment area contributes water and sediment directly to the river The balance delivers water and sediment through glacier internal drainage systems In contrast some 30 Km2 of the Callery River catchment delivers water and sediment directly to the Waiho River below its confluence with the Callery River (Davies and McSaveney [2000]) In effect this means that at this time substantially more than 50 of sediment supplied to the fan is sourced from the Callery River catchment Sediment source areas in the Callery River comprise glacial derived rocky material upper catchment landslide material active gully erosion (including debris flow activity) and shallow slab avalanches (slides) of regolith from the steep sides of the Callery Gorge (transfer reach)
A small landslide dam approximately 10 hectare in area is located in the upper reaches of a northern tributary of the Callery River This dam is presently in-filling from sediment moving down valley from steep eroding sites upstream of the dam including the Callery Glacier the dam in effect acts as a debris trap The dam has a small volume of stored water is relatively low in structure with a limited catchment area upstream of it and accordingly it poses no material threat in terms of dam break In the fullness of time however this dam will fill with sediment and once that happens the potential for it to erode out and release stored detritus may rise
Sediment is also being supplied to the river from both the Spencer and Burdon Glaciers (true left side of the Callery River catchment) The supply rate from these sources could be expected to be on the increase if these glaciers are in retreat and they like the Franz Josef glacier will from time to time eject large pulses of material into the system as a result of the release of water and sediment impounded beneath the glacier when sub-glacial drainage systems temporarily block and then breach
Steep faces in the lower end of the valley containing the Spencer Glacier and a substantial area of the next catchment on the true left of the Callery immediately down valley from the Spencer catchment contains very active gully erosion Geological maps show a series of fault lines running sub-parallel to these tributary valleys (splinter faults to the Alpine Fault 8 km or so to the north It is opined that the presence of these faults is likely to have predisposed bed rock in those tributary catchments to the active gully erosion including debris flow activity Evidence of both of these phenomena currently exists at this time in the Callery River catchment
For much of the Callery River upstream of the WaihondashCallery River confluence the river flows in a deeply incised gorge with steep faces graded at up to 600 with face lengths of some 2000m (Davies and McSaveney [2000]) These faces are vegetated in a combination of forest and sub-alpine vegetation but show clear signs of major disturbances in recent times These
The Lower Waiho Special Rating District works includes stop banking between Caravans Knob and Rata Knoll and includes the Milton and Otherrsquos stop bank below Rata Knoll These works provide in addition to the stop banking rock riprap and spur groins protection works
33 Comment
Whilst these various river protection works have been well constructed in a robust form over the years and systematically maintained they are nevertheless located on part of a morphologically active alluvial fan It needs to be appreciated that these river protection works are in effect constraining the active riverbed river within artificial boundaries resulting in implications in the short medium and long term arising from that circumstance The Waiho River in its reach from the confluence of itrsquos two primary tributaries the Waiho River and Callery River through to the sea is best described as steep bed load dominated braided high energy river presently in an active and aggressively aggrading condition in the reach from the confluence of the Callery River and Waiho River through to and just beyond the Waiho Loop Aggradations may be occurring downstream of the Waiho Loop or are about to begin but the absence of survey cross sectional information in the reach below the Waiho Loop (cross section 23 accepted) does not allow quantification of such changes if they are in fact present or emerging Whilst the 2011 survey included a new cross section Cross Section 24 (CS) below the Waiho Loop the earlier surveys did not survey this particular section
The fluvial characteristics and current morphological condition of the river is presenting very challenging conditions for those charged with the responsibility of managing it and the related natural hazard presented to Franz Josef township and its environs including SH 6 the SH 6 bridge the Franz Josef Glacier Access and the WCRC Special Rating District communities
14 15 Waiho RiveR optimal FutuRe management Waiho RiveR optimal FutuRe management
Chapter 4 CatChment proCesses and sedIment sourCes supplyIng the waIho rIver alluvIal fan Chapter 4 CatChment proCesses and sedIment sourCes supplyIng the waIho rIver alluvIal fan
conditions) and from time to time the formation and failure of large landslide dams triggered by these same conditions Some of these processes may experience a period of accumulation before injection into the gorge with sediment release occurring following the exceedence of some threshold flood event This threshold could be expected to vary depending on the amount of material stored at any one time at a specific location its predisposition to erosion and the size of the flood event that causes the deposits to erode in part or in whole The longer the period of accumulation the smaller the event required to trigger erosion of those deposits This situation is likely to prevail for glacial retreat situations On the other hand landslide debris that is rapidly injected into the gorge will erode out within a reasonably short time span from emplacement
This situation means that sediment movement through particularly the Callery River which subsequently feeds into the Waiho River might over time manifest as a reasonably steady base flow of sediment input to the Waiho River below the confluence but none the less it will actually comprise a series of episodic sediment injections from upstream From time to time significant sediment injections will occur and these will give rise to fluctuations in sediment loads above the base level of sediment throughput just described When this occurs fan building activity can be expected At other times sediment supply will fall off and when that occurs channel degradation will occur somewhere on the alluvial fan surface Over an extended period of time these natural swings in sediment supply may reach some equilibrium state where a balance between supply and storage is achieved in step with sea levels where that is relevant as is the case with the Waiho River at the distal end of the fan This state is referred to as dynamic equilibrium McSaveney and Davies (2000 2006) and McSaveney Davies and Clarkeson (2003) discuss this in some detail in the context of the Waiho River catchment
Clearly this dynamic equilibrium will be interrupted if sea level changes occurs (eg climate change effects) or where greater annual rainfalls depths are experienced in the catchment with or without increased event rainfall depths intensities andor durations or when major movements occur on the Alpine Fault Given sufficient time dynamic equilibrium conditions can be expected to re-establish albeit with an alluvial fan geometry different to that which existed prior to the changes occurring It is important when considering the dynamic equilibrium condition to recognise as described above that there will be periods when an alluvial fan is in an aggrading phase and at other times in a degrading phase However over time one tends to compensate the other and the net volume of material stored on the alluvial fan fluctuates about a reasonable stable volume ie the overall aerial location shape and gradient of the fan surface remains constant albeit that the river course over the fan varies both in form (semi ndash braided braided or entrenched) location and trajectory
McSaveney and Davies (2000 2006) citing Carsons and Griffiths (1987) postulate that prior to human intervention in terms of the introduction of river protection measures over the last century or so the Waiho River alluvial fan was in a state of dynamic equilibrium or near so Further to that they opine that the effects of these various works have been to constrain the Waiho River over a considerable length downstream of the WaihondashCallery River confluence and in so doing cause the river to depart from its dynamic or quasi-dynamic equilibrium state and actively aggrade over part of the fan surface on which the river has immediate access Micro scale hydraulic fluvial modelling of the Waiho River alluvial fan undertaken and reported by McSaveney Davies and Clarkeson (2003) tend to provide support for this hypothesis McSaveney and Davies (2006) explore the physical processes (geomorphic constraints) that operate in a general sense with river systems in order to better understand why it is that situations such as that now occurring on the Waiho River could arise through human intervention
disturbances are identifiable as the re-vegetation of shallow relatively long narrow regolith slides all of which appear to be of a comparable age and less than 30 years judging by the nature and size of the re-growth on those surfaces It could be expected that each of these slides could result in relatively small debris landslide induced debris dams in the floor of the Callery Gorge as occurred in September 2011 For the most part and judging from the size of the slides and comparing those with the September 2011 event the structures they form and the volume of water impounded will be relatively small These structures can be expected to overtop and fail in subsequent freshes or floods on the Callery River and when they do will give rise to dam break surges downstream and generate pulses of sediment downstream into the Waiho River The size of the surges will be largely controlled by the rate at which the obstruction disintegrates and the volume of water stored prior to failure The greater the landslide volume the larger the flood surge and the greater the volume of detritus transported through the gorge to the Waiho River at and below the WaihondashCallery River confluence The October 2011 dam debris dam failure was on the lower end of this type of phenomena and caused no obvious material damage That will not always be the case Davies and Scott (1997) reference the occurrence of a landslide event in 1930 which created a landslide debris dam in the order of 50m in height and blocked the Callery River for one day Given the gorge characteristics at the site they estimate some 2 million cubic metres of water may have been temporarily stored behind this obstruction and released on failure to generate a dam break flood peak in the order of 1400 cumec Further to this Davies (2002) investigated and described the dam break flood hazard sourced from the Callery River catchment That study provides an overview on the likely frequency scale and associated hazards such events on the Waiho River downstream of the Callery River confluence Putting aside for the purposes of this report the natural hazards associated with such events these types of events have the capacity to transfer substantial volumes of debris (rock silt sand gravel woody debris) out of the Callery Gorge and into the Waiho River down stream of its confluence with the Waiho River over a very short time interval as a debris slug materially affecting riverbed aggradation and degradation processes
The steep rock lined confined nature of the Callery Gorge means that whilst sediment inputs occur into the main channel routinely and in an episodic manner the residence time in the gorge is short ie with the possible exception of major landslides floods and freshes subsequent to the sediment entering the gorge sediment entering the gorge will pass through and be discharged into the Waiho River below the WaihondashCallery River confluence in a relatively short time frame
Given the proximity of the Callery River and Waiho River sediment source areas to the active Alpine Fault it must be anticipated that major seismic induced mass movements will occur followed by aseismic activity that will inject (again episodically) great volumes of detritus into the river system both at the time of the fault rupturing and for some considerable time after This will manifest itself as debris loadings greater than are presently being experienced and local vertical and transverse displacements within the riverbed where the fault crosses the Waiho River near the SH 6 Bridge Elevated terracing at and upstream of SH 6 and within the Franz Josef township some of which is now forest covered is evidence of the active fan building episode that occurred following the 1717 rupture of the Alpine Fault
In considering the nature of the sediment sources identified above it is opined that a variety of temporal supply mechanisms will be operating simultaneously at any one time These include the wasting out of previous Alpine Fault deposits and glacier retreat deposits slugs of debris from the active gully erosion sites during high intensity short duration or prolonged heavy rainfall events relatively small scale mass movement (shallow regolith avalanches) occurring as a result of prolonged wet conditions in the catchment (high antecedent rainfall conditions) with or without subsequent high intensity short duration storms (La Nina
16 17 Waiho RiveR optimal FutuRe management Waiho RiveR optimal FutuRe management
Chapter 4 CatChment proCesses and sedIment sourCes supplyIng the waIho rIver alluvIal fan Chapter 4 CatChment proCesses and sedIment sourCes supplyIng the waIho rIver alluvIal fan
Cross section profiles of river cross sections extending down stream from the WaihondashCallery River confluence (CS 10) through to just beyond the Waiho Loop (CS 23) clearly show such changes between January 2002 June 2008 and March 2011 surveys Variations in mean bed levels calculated across the active river on each of these cross sections between the January 2002 and June 2008 and the June 2008 and March 2011 surveys is given in Table 1 Shown also in this table is an estimate of the volume of aggradation that has occurred between successive cross sections during this time and the volume that has accumulated in total on the alluvial fan for the same period These values are plotted on Fig 3 and 4
If the OICL record of the temporal pattern to these changes on the river as a whole then it is possible that the mean bed level changes recorded between the CCSL surveys of June 2008 and March 2011 may have actually occurred largely between March 2010 and March 2011
mea
n B
ed l
evel
( m
)
170
160
150
140
130
120
110
100
901985 1990 1995 2000 2005 20101980
Year
Fig 3 Waiho River at Franz Josef Average Rate of Mean Bed Level Change per Year Jan 2002 to June 2008 and June 2008 to March 2011 surveys
The March 2011 CCLS survey shows the mean bed level gain on CS 10 located near the confluence of the Callery River and Waiho Rivers some 023m less than that on CS 11 200m downstream Further to that the OICL mean bed level record at the SH 6 Bridge shows a small reduction in mean bed levels between their 21 March 2011 survey and their 4 May 2011 survey of 012m Taken together and with cognizance to the trends evident (saw tooth pattern) in the OICL mean bed level record at this site it is would be premature to conclude that a reduction in the long term aggradational trend on the fan has occurred since March 2011 The prudent approach is to assume that the aggradational trends presently evident will persist in much the same manner as has been observed in recent years It must also be anticipated that from time to time sudden local increases will occur as is evident in the OICL mean bed level record at SH 6 (May ndash Nov 1999 March 2009 and Jan 2011 ndash March 2011) These local increases in mean bed level are likely to represent significant increases in sediment supply associated with a major flood event flushing sediment accumulations through the transfer reaches of the Callery River primarily but also In the Waiho River an increase in frequency of shallow slides in the Callery Gorge as a result of high antecedent
It is not the intention of the author to describe in detail the works cited above but in short the findings are that for a bed load dominated river such as the Waiho River which exists in a state of dynamic or quasi-dynamic equilibrium and has a braided form will aggrade if artificial constraints (stopbanks rock rip rap groynes rock armoured hook groynes etc) are introduced along or inside the active margins of that river provided the braided form is not fully suppressed This change in equilibrium comes about even though there may be no material alteration in the medium to long term sediment andor water inputs to the system The basic tenant to this argument is that a river in a natural state corresponds to a local maximum in terms of bedload sediment transport capacity Hence any moderate alteration to the river form (eg introduction of river boundary constraints) will cause a reduction in sediment transport capacity (McSaveney and Davies (2006) In order to accommodate this shift a river such as the Waiho River will aggrade in order to steepen the channel in an endeavour to increase bed load transport and bring the river back towards an equilibrium state
In considering the present situation on the Waiho River we clearly have artificial constraints in the form of river protection works in place and these have been present for some considerable time and in varying degrees (number form location effectiveness) It is clear that the Waiho River downstream of its confluence with the Callery River dramatically altered its form sometime and most probably progressively between 1948 and 1997 (fig 5 McSavaney and Davies [2000]) These authors postulate that the change most likely occurred between 1965 and 1981 as a result of a series of rainstorms or a particular event and they cite a 3 day rainstorm in March 1979 where 750mm of rain was recorded in the Franz Josef village as a possible culprit
An examination of the OICL mean bed level records at the SH 6 bridge site (Fig 2) on the Waiho River from Jan 1997 through to May 2011 show distinct step ups in mean bed levels at that site occurring around January through March 1999 (900 mm or so) and again from January 2009 through to January 2010 (900mm) and more dramatically upward movement from January 2011 to February 2011 (1000mm) These changes are also evident in the riverbed both upstream and downstream of the SH 6 bridge in the riverbed surveys reported by CCSL (2011)
Date
mea
n B
ed l
evel
153
152
151
150
149
148
147
146
145
144
143
Jan
1997
Jan
1998
Jan
1999
Jan
2000
Jan
2001
Jan
2002
Jan
2003
Jan
2004
Jan
2005
Jan
2006
Jan
2007
Jan
2008
Jan
2009
Jan
2010
Jan
2011
Jan
2012
Soffit Level
Design Flood Level
Design Bed Level
Mean Bed Level
Fig 2 Waiho River Mean Bed Levels at the SH 6 Bridge (Opus)
18 19 Waiho RiveR optimal FutuRe management Waiho RiveR optimal FutuRe management
Chapter 4 CatChment proCesses and sedIment sourCes supplyIng the waIho rIver alluvIal fan Chapter 4 CatChment proCesses and sedIment sourCes supplyIng the waIho rIver alluvIal fan
McSaveney Davies amp Clarkeson (2003) In the light of this body of research and given that the greater part of it has been derived from studies of the behaviour of this river it must be evident that reducing the available braided width of this river as occurred with these works could well exacerbate on-going aggradational trends which might inevitably lead to reduced freeboard on the NZTA stopbanks in this reach of the river Such effects will not be limited solely to the NZTA stopbanks but must inevitably have a similar effect on stopbanks outside their control elsewhere on the river Further to that as will be discussed later in this report aggradation now evident in the river in this particular reach is causing overbank spills on the true right bank between the oxidation ponds and the Waiho Loop presenting a real threat of avulsion of the Waiho River into the Tatare River which would result in capture of the Waiho River by the Tartare River Overbank spill on the true right bank of the Waiho River in the floods of December 2010 followed this trend and there is clear evidence of headward erosion occurring as a result in the lower end of the overflow corridor extending back and upstream from where the Waiho River spills entered the Tartare River (Plate 2) The statement in the NZTA resource consent application (72) It is not anticipated that structures will cause or exacerbate flooding or erosion on other properties during flood flows may not be consistent with the present situation and may need reviewing
The need to protect SH 6 is not questioned the importance of this highway to the West Coast economy is absolute Notwithstanding that cognizance needs to be given to the insights now available on the effect of boundary constraint on river behaviour (aggradation) in a bed load dominated river (Waiho River) These insights indicate that persisting with the present river management strategy which relies on boundary constraint will only lead to further riverbed aggradation and ultimately to avulsions This situation arises because the riverbed in a number of places is now elevated well above the fan surface that lies beyond the protection systems on this river and these same works have significantly reduced the area of the alluvial fan surface available to the river for sediment storage
Responses must now be sought that minimise the risk of break out and avulsion or at lease allow the river to avulse to areas where it is already predisposed to do so if it cannot realistically be prevented It must be recognised though that if breakouts were to be prevented by raising stopbank levels and or constructing new stopbanks in due course the whole protection system will inevitably be put at risk at some later time by overtopping and or avulsion with the multiple consequences that would ensue if the current aggradation trends persists or worsen It is to be noted that a river management policy that relies on containing river aggradation by periodically raising stopbanks to preserve flood containment inevitably increases future risk and poses significant engineering and environmental problems when breakout eventually occurs as a result of the riverbed being elevated above the surrounding alluvial fan surface
rainfall conditions preceding an intense or series of intense or prolonged rainfalls or the formation and subsequent failure by erosion of a landslide dam (s)
note the SH6 cross section monitored by NIWA for OICL is located at the SH 6 bridge site whereas the CCSL CS 13 is located just downstream of that bridge Further to that the OICL reduced levels are based on a reference bench mark level which is different to the Lyttelton Vertical Datum 1937 used by CCSL In order to compare the results of these two surveys it is necessary to add a correction of 144m to the NIWA Datum before comparing the NIWA bed levels with the CCSL bed levels
The CCSL surveys of the river in June 2008 and March 2011 show two distinct gradients the first between CS 11 to CS 16 and the second between CS 16 and CS 22 (Fig 2) Between June 2008 and March 2011 the reach CS 11 ndash CS 16 steepened from an average gradient of 00103 to 00111 (approximately an 8 increase) whereas the reach CS 16 to CS 22 steepened from 00106 to 00108 (approximately an 2 increase) These changes in gradient will reflect in a reduction in average water depth and an increase in average section velocity for any given flow covering the full riverbed width and with the channel roughness remaining constant A 4 reduction in average depth will occur in the reach CS 11 to CS 16 and a 1 reduction in average depth in the reach CS 16 to CS 22 For example for an average flow depth of 15m reductions of 60mm occur in the reach CS 11 to CS 16 whereas in reach CS 16 to CS 22 the reduction would be 15mm These modest gains will not materially offset the deleterious effects of aggradation that is raising the mean bed levels in the reach CS 11 ndash CS 16 by 10 to 30 times that resulting from an increase in gradient The same is true of the reach CS 16 to CS 22 but to a lesser extent (4 times)
Reflecting on the implications for lateral constraint of a braided bed load dominated river such as the Waiho River at Franz Josef as posited variously by McSaveney and Davies (2000) and McSavenay Davies and Clarkson (2003) it needs to be understood that the works which may have influenced and subsequently contributed to the level of aggradation now being experienced on this river were not appreciated at the time that the earliest works were constructed In fact the type and form of the protection works being constructed on the Waiho River at that time was standard practice for river works of this type throughout New Zealand
Since that time further works of a similar nature have been undertaken both to repair works damaged during flood events and to upgrade (raise re-align reconstruct) and extend existing stopbanks to offset the deleterious effects of riverbed aggradation compromising stopbank freeboards These works have been accompanied by the construction of rock stub groynes on the riverside toe of the stopbanks to mitigate against lateral bank erosion of the stopbanks The primary driver for these upgrades have been to protect SH 6 on the true left bank of the Waiho River the Franz Josef Glacier access road and to a lesser extent the West Coast Regional Councilrsquos special rating district areas on the southern side of the river An examination of the NZTA resource consent application (August 2009) lodged in respect of stopbank upgrades of the form described and their assessment of environmental effects (Sec 70) in particular Sec 72 it is clear that their focus was on the need to contain flood flows in the river in the face of on-going riverbed aggradation (SH 6 Bridge to Canavans Knob reach) that was eroding freeboard and hence elevating the risk of flooding to SH 6 on the south side of the river below the SH 6 bridge This document gives no indication that consideration was given to why the river was aggrading in this way notwithstanding the considerable and detailed research undertaken on that subject in particular the extent that boundary constraint plays in influencing aggradational trends in bed load dominated rivers [Carson amp Griffiths (1987) Rouse Day amp Davies (2000) McSaveney amp Davies (2000 2006)
20 21 Waiho RiveR optimal FutuRe management Waiho RiveR optimal FutuRe management
Chapter 4 CatChment proCesses and sedIment sourCes supplyIng the waIho rIver alluvIal fan
chaptEr 5
Present Condition oF tHe WaiHo riVer
The GEML (2002) report cites an estimate made by CCSL of nett aggradation in the river system between cross section 10 (WaihondashCallery River confluence) and cross section 23 (just downstream of the Waiho Loop) of 1700000 m3 between the Jan 2002 and June 2008 surveys A similar exercise undertaken by RJ Hall of RJ Hall and Associates Ltd (RJHAL) based on the June 2008 and March 2011 surveys indicate that a further 170000 bulk m3 has accumulated in this reach (Table 1) More significantly though if the assessment is made from CS 10 to CS 21 ie from the WaihondashCallery River confluence to the upstream end of the Waiho Loop the picture is quiet different Between the 2002 and 2008 surveys it is estimated that some 076 bulk m3 of material was stored on the fan between CS 10 and CS 21 (average annual accumulation rate 118000 m3 yr) and between 2008 and 2011 1490000 bulk m3 (average annual accumulation rate of 540000 m3 yr) An examination of OPUS International Consulting Ltd (OICL) mean bed level record at CS 3 (ie at the SH 6 Bridge) shown on Fig 2 indicates that the bulk of this change may in fact have occurred between March 2009 and March 2011 Of significance some 47 of this aggradation occurred between CS 17 (lower end of the Franz Josef stopbank true right bank where SH6 turns north east away from the river) and CS 21 (a short distance upstream from where the river turns and begins its approach to the gap between Rata Knoll and the Waiho Loop) Fig 4 also shows the changes in volume stored per unit length of riverbed between 1993 and 1999 (Fig 6 of McSaveney amp Davies [2000])
1000000
800000
600000
400000
200000
00000
-200000
-400000
-600000
-800000
-1000000
-120000010000 2000 3000 4000 5000 6000 7000
thalweg Distance From CS 10 ( m )
volu
me
chan
ge
( m3
) K
m a
lon
g t
hal
weg
Column AB
Column Y
Column O
Fig 4 Waiho River at Franz Josef CS 10 to CS 23 Volumetric Rate of Change along the Thalweg Jan 2002 to June 2008 and June 2008 to March 2011 surveys including TRH Davies Data 1993 to 1999
A comparison between the changes that took place between 1993 and 1999 and the changes that have occurred now ie 2008 to 2011 show similar trends although it is noted that there are some clear differences apparent Upstream of the SH 6 bridge there has been significant increase in the rate of aggradation in recent times The 400m reach extending immediately downstream from the bridge remains more or less unchanged but below that point in the reach through to Rata Knoll the situation has changed significantly Whereas in the period 1993 to 1999 there was net degradation evident in the reach between the
22 23 Waiho RiveR optimal FutuRe management Waiho RiveR optimal FutuRe management
Chapter 5 present CondItIon of the waIho rIver Chapter 5 present CondItIon of the waIho rIver
Fig 5B Waiho River at Franz Josef CS 18 Corridor Plots based on the January 2002 June 2008 and March 2011 River Surveys
0 20 40 60 80 100 120
128
126
124
122
mea
n B
ed l
evel
( m
)
Row 9
Row 22
Row 39
elapsed time from Jan 2002 ( months )
Fig 5C Waiho River at Franz Josef CS 19 Corridor Plots based on the January 2002 June 2008 and March 2011 River Surveys
0 20 40 60 80 100 120
120
115
110
mea
n B
ed l
evel
( m
) Row 10
Row 23Row 40
elapsed time from Jan 2002 ( months )
Fig 5D Waiho River at Franz Josef CS 20 Corridor Plots based on the January 2002 June 2008 and March 2011 River Surveys
In considering these results ie 700000 m3 fan aggradation (January 2002 - June 2008) and then 1500000 m3 fan aggradation (June 2008 ndash March 2011) between CS 10 and CS 21 and the fact that aggradation is now well advanced between Canavans Knob and the Waiho Loop and is evidently extending downstream from the Waiho Loop with mean bed levels now close to at or above the natural ground level on the true right bank at and downstream of the Oxidation Ponds through to the Waiho Loop the following preliminary conclusions are drawn
1 Mean bed levels on the true right bank of the active braided bed of the Waiho River between the Oxidation Ponds (CS 19) and the Waiho Loop (CS 20) are such that the bed levels is at or marginally higher than the berm area on that side of the river Further to that a more detailed examination of CS 19 to CS 20 show a pronounced cross fall over the riverbed in this reach extending from the true left bank towards the true right bank an effect that has been present and maintained from the 2002 riverbed surveys through to the 2011 survey These trends presently predispose the river to overflow its true right bank in this reach during floods
2 Overflows from the Waiho River in the vicinity and down stream of the Oxidation Ponds through to the Waiho Loop on the true right bank must be anticipated in flood events at least as low as annual exceedence probability of 20 (1 in 5 yr recurrence interval) noting that overflows towards the Tatare River occurred in this area in the December 2010 flood
Oxidation Ponds and the Waiho Loop that trend has now completely reversed Aggradation in this reach is now occurring to varying degrees at rates per unit thalweg length two to three times that of the period 1993 ndash 1999 with aggradation now evident extending over the full length of the river from the WaihondashCallery River confluence through to just downstream of the Waiho Loop
The changes that occurred between the 1993 ndash 1999 period and the 2008 ndash 2011 period indicate that the alluvial fan is now aggraded over its length from the WaihondashCallery River confluence to at least immediately below the Waiho Loop This means that the Waiho River alluvial fan is now prograding within the artificial boundary constraints present on the true left bank through to and downstream of the Waiho Loop and on the true right bank from the SH 6 bridge through to the Oxidation Ponds
An analysis of mean bed levels in the reach extending from CS 16 to CS 21 shows a pronounced cross fall on the river extending from the true left bank towards the true right bank (Fig 5A to 5D inclusive) This analysis has been made by splitting each of the cross sections used in the analysis into three equal length sections and calculating mean bed levels for each of these sub ndash section widths Further to that CS 17 CS 19 and CS 20 have been corrected for skew by rotating each of these cross sections in a clockwise direction eg 63ordm (CS 17) 111ordm (CS 19)and 101ordm (CS 20) and then adjusting the sub section mean bed levels to reflect the effects of the rotations This step was taken in order that the modified cross section was orientated approximately normal (ie at right angles) to the rivers overall flood flow direction What these plots clearly show is the true left subndashwidth sections being elevated above both the central and true right subndashwidth sections this clearly indicates the presence of the cross fall and its persistence from the January 2002 through to the March 2011 surveys This situation will have the effect of predisposing the river to move towards the true right bank and overflow in the reach between CS 19 (Oxidation Ponds) and CS 20 (upstream side of Waiho Loop) and contribute to the risk of avulsion of the Waiho River into the Tartare River whilst these trends prevail
0 20 40 60 80 100 120
140
135
130
mea
n B
ed l
evel
( m
)
Row 7
Row 20
Row 37
elapsed time from Jan 2002 ( months )
Fig 5A Waiho River at Franz Josef CS 17 Corridor Plots based on the January 2002 June 2008 and March 2011 River Surveys
0 20 40 60 80 100 120
140
135
130
125
mea
n B
ed l
evel
( m
)
Row 20
Row 8
Row 38
elapsed time from Jan 2002 ( months )24 25 Waiho RiveR optimal FutuRe management Waiho RiveR optimal FutuRe management
Chapter 5 present CondItIon of the waIho rIver
chaptEr 6
reVieW oF tHe CatCHMent Hydrology
A review of the catchment hydrology has been undertaken using the NIWA record from the Whataroa River hydrometric site at SH 6 (1985 ndash 2011) catchment area 445 Km2 The Waiho River at SH 6 has a catchment in the order of 170 Km2 An EV1 (Gumbel) analysis was carried out on the Whataroa River using the annual series maxima for that river and from the flood frequency estimates for the Waiho River flood estimated on the basis of the ratio of the catchment area of the Waiho River to that of the Whataroa River raised to the power of 08 The Whataroa River catchment was chosen because of its proximity to the Callery River they have a common boundary both are clad in a combination of forest and subalpine vegetation similar lithologies and lie on the western side of the Main Divide Estimates have also been made to take into account projected climate change effects through to 2040 using the MFE (2006) procedure An increase in temperature ranging between 14ordmC and 19ordmC was used (cf Table 2 MFE) and a 24 hr to 48 hr storm duration rainfall percentage increase of 75 ordmC to 80 ordmC (cf Table 7 MFE) which suggests storm rainfall increases of between 10 and 15 These percentages have then been applied directly to the EV1 flood frequency estimates derived from the Whataroa River at SH 6 to provide an indication of possible future changes in flood frequency values
The results of this assessment are set out in Table 2
recurrence interval t
(yrs)
Qpk(eV 1)
(cumec)
Qpk + 10(cumec)
Qpk + 15(cumec)
23 1230 1350 1400
5 1550 1700 1800
10 1640 1800 1900
20 1730 1900 2000
50 1820 2000 2100
100 1910 2100 2200
note Waiho River estimates derived from an EV 1 analysis of Whataroa River at SH 6 which were scaled by the area factor [A waiho A whataroa]⁰⁸
TABle 2 Flood Frequency Estimates Waiho River at SH 6
3 That progradation of the fan below Canavans Knob through to and beyond the Waiho Loop will persist if the sediment supply rates to the fan observed since 2002 persist
4 The present flood capacity of the Milton and Otherrsquos stopbank is provisionally assessed as marginal in a flow of 1850 cumec (aep 5 ie 1 in 20 year recurrence interval) based on GEML hydraulic modeling (n = 0037) adjusted for increases in mean bed level since that work was completed (see further note below)
5 Given points 1 And 2 above the prospect of an avulsion progressively developing into the Tatare River over the true right bank at and downstream of the Oxidation Ponds is now a very real prospect
6 An avulsion into the Tartare River system by the Waiho River (ie the Tatare River captures the Waiho River downstream of Canavans Knob) is likely to progress relatively slowly at first and will be accompanied by an increase in aggradation within the active bed of the Waiho River where it presently flows through and beyond Rata Knoll This will occur as a portion of the flood flows approaching this critical reach is systematically bled off the Waiho River and spills into the Tatare River This situation may result in a reduction in flood carrying capacity in the reach where the Milton and Otherrsquos stopbank is located leading to overtopping during floods provisionally assessed in excess of an aep 10 (ie 10 year recurrence interval flow 1600 cumec)
7 The GEML hydraulic modeling results of July 2008 indicated that much of the stopbanking along the true right bank below SH 6 through to the Oxidation Ponds had been substantially compromised by river aggradation such that it would not contain a flood discharge of 1850 cumec with 1m of freeboard An analysis of the March 2011 CCSL survey indicates that the situation is now worse as a result of increases in mean bed levels that vary from 118m at CS 14 (airstrip) through to 055m at CS 18 (Oxidation Ponds) [note CS = cross section]
note The GEML hydraulic modeling study used a riverbed roughness of ldquonrdquo varyingbetween 0030 to 0040 (predominantly 0037) and arrived at those values by a combination ofreferencetoldquoRoughnessCharacteristicsofNZRivers(DMHicksandPDMason1991)site inspections aerial photography and a calibration model run They noted that their calibration run was approximate and largely based on anecdotal evidence which was not fully substantiated They tested their model by running it with roughness increased by 20 (ie predominantly 0044) and this gave rise to increases in flood level of between 006 and 022m It is the Authors experience that roughness values in the order of 005 to 006 are more realistic in rivers of this kind given that bed form resistance is almost certainly present under live bed conditions Live bed conditions will result in both the entrainment and transport of coarse sediment in the flow and as bed load the latter resulting in bed forms (undulations on the floor of the river bed formation translation destruction and reformation of gravel bars etc) It is anticipated that the onset of live bed conditions will occur over a significant proportion of the Waiho Riverbed when flows reach 450 to 500 cumec (Clausen Plew 2004) and will be well established with flows in excess of 1000 cumec In considering the output from these models it needs to be appreciated that replicating known flood profiles on the river in full flow with live bed conditions present and no real certainty of what the flood flow actually is at that time places real constraints on the models validity particularly as a predictive tool Notwithstanding that limitation of necessity some reliance needs to be placed on the output of such models to give guidance on the possible form of the flood profiles that could occur at different flood discharges However this must be tempered by the knowledge that rivers of this kind under live bed conditions can behave in unpredictable ways
26 27 Waiho RiveR optimal FutuRe management Waiho RiveR optimal FutuRe management
Chapter 6 revIew of the CatChment hydrology
chaptEr 7
CoMMentary on riVer ProteCtion Works
As has been noted earlier in this report a range of river protection works have been constructed on this river at various locations over an extended period of time In general they have been designed to either constrain the lateral migration of the river in order to try and mitigate against lateral erosion of natural banks and man made stopbanks and or to contain flood flows The erosion prevention structures include rock riprap stub groynes aligned at 900 to the natural bank or stopbank alignment or on curves at 90ordm to the tangent to the curve Typically these structures are some 15m in length and evenly spaced at about 6 times the length (Glacier Access Road and true left bank stopbank below the Backpackers) to 35 times their length (Backpackers to Canavans Knob stopbank) The WCRC stopbank on the true right bank downstream of SH 6 has heavy rock cladding on the riverside of the bank to provide protection against lateral scour The stopbanks are constructed in heavily compacted sandy gravels sourced from the river Typically they have batters 2H 1V and varying crest widths but typically 5 to 6 m As the river aggrades freeboards on the stopbanks reduce below their intended design requirements (WCRC stopbanks eg 1m) and adjustments are necessary to restore freeboard
In the reach upstream of SH 6 the Franz Josef Glacier access road presents a unique problem In this reach the river is confined by natural terraces and stub groynes (true right bank) and the access road and stub groynes on the true left bank As the river aggrades in this reach the access road needs to be raised to maintain freeboard Inevitably when the road is raised the result is further encroachment into an already confined reach At CS 12 for example the natural width before the access road was constructed is estimated to have been somewhere in the order of 280m With the construction of the road this width has reduced to approximately 250m and the presence of rock rip rap stub groynes has reduced the active river width to more like 230m in effect a width reduction of some 15 to 20 The SH 6 bridge waterway is similarly affected with the natural width reducing from about 250m to 145m a reduction in active width of 42 The SH 6 Bridge is at the downstream end of the WaihondashCallery River transfer reach and in effect at the head of the Waiho River alluvial fan The construction of river protection works (stopbanks rock rip rap stub groynes) at and downstream of the SH 6 Bridge has in effect constrained the river in such a manner that the natural apex sector angle of the alluvial fan has been systematically reduced from 90⁰ to about 30⁰ The consequences of these modifications to the natural river form and the associated landscape is that those parts of the alluvial fan comprising the forested and farmed land through to Docherty Creek on the true left bank and the Franz Josef Township on the true right bank including the farmed land downstream of the Township are no longer accessible by the river for the purposes of storing sands and gravels during an aggrading phase
The work of McSaveney and Davies (2000 2006) and McSaveney Davies and Clarkson (2003) suggests that the constraining of this steep braided bed load dominated river by river control structures has on balance and more likely than not significantly contributed to the aggradation that has and is now being observed on this river The Waiho River is not unique in that regard a similar situation is evident on the North Ashburton River in mid Canterbury In both cases the active bed is now elevated well above the natural ground levels outside
28 29 Waiho RiveR optimal FutuRe management Waiho RiveR optimal FutuRe management
Chapter 7 Commentary on rIver proteCtIon works
chaptEr 8
engineering issues
The steady increase in bed levels within the active bed of the Waiho River from its confluence with the Callery River through to beyond Rata Knoll has meant that bed levels are now higher than the natural groundline on the landward side of the stopbanks by some metres and this difference is increasing This trend must be expected to continue in the short to medium term (1 to 10 years) That assumption is made on the basis that sediment and water supply rates to the fan in that time span will remain more or less as they have been over the preceding 20 to 30 years The practice to date exercised by both NZTA and the WCRC is to periodically increase the height of the stopbank crest in order to maintain freeboards This practice does not address the problem of increasing mean bed levels as such it simply endeavours to preserve the design flood carrying capacity of the system being managed It should also be noted that it does not address the core issue of the river response to artificial constraint of the active braiding riverbed boundaries in a bed load dominated river
Stopbank failures occur from time to time in most river systems where they have been constructed This can be the result of overtopping either as a result of diminishing freeboard caused by local or more general aggradation within the constrained river system (the Waiho River situation) where inadequate provision has been made for super-elevational effects around bends with the river in high flood (or a combination of both of these effects) or through lateral bank erosion suffosion piping or seepage induced face instability or as a result of crest settlement resulting from strong ground motion (eg Waimakariri River stopbanks September 2010 and February 2011 earthquakes) Lateral bank erosion is more likely to occur on the falling limb of a flood hydrograph as water levels drop average velocities fall off and the bed load sediment transport capacity reduces
At some point during the recession gravel bars will begin to form in the bed and sinusoidal braided flow patterns re-emerge as a result Often when this happens strong flow concentrations can develop that impinge sharply on the stopbank riverside toe When that occurs riprap facing if present can be stripped stub groynes damaged or destroyed and or the stopbank proper eroded If river erosion is sufficiently intense at such locations and persists for long enough the stopbank may be breached With well constructed stopbanks (eg those composed of heavily compacted sandy gravels on good foundations with batters in the order of 2H 1V or flatter and crests of 4m plus) overtopping can be sustained for upwards of 2 hours before breaching occurs Typically failure occurs as a result of erosion at the landward toe which then headcuts through the embankment the higher the stopbank the more aggressive this action is Overtopping failure is likely to be catastrophic in nature whereas lateral bank failure less likely to be given that in the latter case lower water levels (falling stage) conditions are most likely present which tends to limit the outflows that will occur through the breach both in terms of size and duration
note the particular situation and failure consequences of stopbanks where the riverbed is elevated above the surrounding land as now occurs on the Waiho River is considered later in this report cf Sec 90]
In reviewing these comments in the context of the Waiho River stopbanks it is concluded that overtopping and or lateral bank erosion are the two situations which are most likely to cause stopbank failure and in some cases this could result in catastrophic failure The
the stopbanks In the Waiho River case these changes are occurring rapidly and although episodic nevertheless have persisted for some 20 to 30 years and should be expected to continue to persist into the short to medium term (1 to 10 years)
This disparity between natural ground levels on the outside of the stopbank with steadily increasing mean bed levels on the river side of the banks presents a number of engineering problems which need to be addressed
30 31 Waiho RiveR optimal FutuRe management Waiho RiveR optimal FutuRe management
Chapter 8 engIneerIng Issues
chaptEr 9
stoPbank Failure
Stopbank failure along the true left bank upstream of SH 6 would result in loss of the Glacier Access Road and flood damage to SH 6 the Motels Back Packers and any dwellings in its path down stream The southern approach and abutments to the SH 6 Bridge could be damaged in this scenario
Stopbank failure of the structure (s) between SH 6 and Canavans Knob could also affect SH 6 the Motels and Back Packers depending on where the failure occurs Of equal concern is that it might result in an avulsion of the Waiho River through to Dochertyrsquos Creek The double parallel stopbank system presently available in this reach notwithstanding the elevation of the riverbed now well above the natural groundline along SH 6 is a reasonable protection against such an outcome but only if freeboards are maintained and adequate protection against lateral bank erosion is maintained If such an avulsion were to occur there will be major difficulties to overcome to return the river to within the stopbanks Substantial erosion and deposition will almost certainly occur and SH 6 will be out of action until such time repairs can be affected
Overtopping and or lateral erosion of the Canavans Knob to Rata Knoll and the Milton and Otherrsquos stopbanks would result in breaching flows coursing through to Dochertyrsquos Creek damage to SH 6 and flooding through the Lower Waiho Special Rating District area As with the SH 6 bridge to Canavans Knob stopbanks the elevational difference between the riverbed and the surrounding ground outside the stopbank may give rise to an avulsion as well Again the consequences of such an outcome will be great and major difficulties (and cost) experienced in returning the river to its former course and trying to prevent a repeat
Overtopping and or lateral bank erosion on the true right bank below SH 6 will result in substantial damage to parts of the Franz Josef Township loss of the airstrip and almost certainly destruction of the oxidation ponds depending on the location nature and extent of the breaches The consequences of avulsion as described for breaches of the true left stopbank must also be considered here
Stopbank failure can also occur as a result of piping suffusion consolidated settlement of weak foundation material and slumping (ie aseismic failures) and or through the effects of crest settlement as a result of strong ground motions during earthquakes (ie seismic failures) Failure can be either catastrophic or non-catastrophic Catastrophic failures typically occur when a stopbank overtops and fails rapidly whereas non-catastrophic failures occur when these conditions are absent but the stopbank efficacy has never the less been compromised eg suffosion results in flood water leaking through the embankment during high flows where lateral bank erosion damages the stopbank of a flood recession without necessarily breaching the embankment and where crest settlement occurs during earthquakes when the river is not in flood
A more detailed description of these types of failure mechanisms is given in Appendix 1
materials used in their construction the manner in which they have been constructed and the foundations on which they have build suggest that piping failure is highly unlikely Suffosion if it occurs and that is considered reasonably likely with these types of stopbanks will be more of a nuisance that a direct threat to stopbank stability
Clearly in times of flood when high hydraulic gradients are present through the stopbanks because riverbed and hence flood levels are now raised well above the natural groundline outside and on the landward side of the stopbank seepage flow with or without suffosion being present is likely to be readily evident during floods and possible also post flood as shallow groundwater within the elevated riverbed falls Evidence of this phenomena presently exists eg adjacent to the motels on the true left side of the river downstream from the SH 6 bridge and possibly also between the parallel stopbank system extending down to Canavans Knob also on the true left bank of the river
32 33 Waiho RiveR optimal FutuRe management Waiho RiveR optimal FutuRe management
Chapter 9 stopbank faIlure
chaptEr 10
otHer aVulsion tHreats
Two other avulsion threats have been identified in this investigation the first through a low saddle area in the forest on the true right bank of the Waiho River located some 150 to 200m upstream of the SH6 bridge true right abutment and the second across the true right bank at or down stream of the Oxidation Ponds into the Tatare River as discussed earlier in this report
101 Franz Josef township overflow Corridor
The low saddle has an elevation of RL 1600 m (CCSL survey June 2011 Appendix 3) or so which is presently some 66m higher than the mean bed level at that location as extrapolated from the March 2011 mean bed levels calculated at CS 12 and CS 13 Using the calculated mean bed level differences between the June 2008 and March 2011 CCSL surveys on CS 12 and CS 13 an aggradation rate of between 07 and 10myear is derived for this reach adjacent to the low saddle area This has been calculated on the basis that 197m of aggradation occurred between the two surveys and that that change took place either between June 2008 and March 2011 (33 months) or more likely with reference to the OICL SH 6 bridge mean bed level records between March 2009 and March 2011 (24 months) On that basis if the sediment and water supplies to the reach between the WaihondashCallery River confluence and the SH 6 bridge remain more or less as they have over the past 20 to 30 years and the aggradation rates referred to above are reasonable reflections on likely future rates in this critical reach in the short to medium term (1 to 10 years) then overtopping through the low saddle into the Franz Josef Township via this potential overflow corridor may occur with in the next 6 to 10 years If it were allowed to persist an avulsion could conceivably occur (the consequences) for which would be materially worse than flooding and deposition from earlier overflows This scenario would result in the loss of SH 6 in the township Clearly if for any reason erosion rates were to increase significantly from those presently being experienced or any other reason resulting in an increase in the background aggradation rates in this reach used in this calculation then the situation being described could conceivably occur sooner that the 6 to 10 year time span estimated above The converse is also true A reduction in aggradation rates could prolong the initiation of overflows the prospect of degradation occurring which might effectively remove the threat while possible is not considered realistic given the history of aggradation that has been observed and the circumstances that would be necessary on the whole active fan surface to allow this to happen Although gravel extraction could be employed as a short term measure to alleviate the threat the cost of maintaining freeboards by these means on a more permanent basis is considered likely to be unsustainable in the short to medium term and an unrealistic expectation Compounding this approach would be what to do with the excavated material and the knowledge that it Is likely that any material excavated would within a very short time frame be replaced by the river from upstream
On that basis it is opined that the only realistic remedy for preventing this outcome assuming Franz Josef township is to remain in its present location in the foreseeable future would be to construct a suitably robust structure across this potential overflow corridor This would require a significant disturbance to the native forest at that location In coming to this conclusion the caveats that apply from the McSaveney and Davies (2000) and McSaveney Davies and Clarkeson (2003) work are acknowledged and are likely to apply to this suggested
34 35 Waiho RiveR optimal FutuRe management Waiho RiveR optimal FutuRe management
Chapter 10 other avulsIon threats
chaptEr 11
Future ManageMent oPtions
In considering the assessment made here the following options present themselves
1 Do nothing or
2 Status quo or
3 Acceptance of avulsion to the Tartare River or
4 Boundary relaxation
111 the do nothing option
The do nothing option will inevitably lead to overtopping during a flood or floods of any stopbank where freeboards have been eliminated through ongoing bed aggradation That option clearly is not likely to be tenable for NZTA (SH 6 and SH 6 bridge threat) nor the Department of Conservation (Glacier Access Road) and accordingly it is anticipated that these Agencies will continue to raise the stopbanks the Glacier Access Road and the SH 6 Bridge and its approaches in order to preserve these routes If the stopbanks under the management of the WCRC are not similarly adjusted to maintain freeboard then stopbank failure with widespread flooding of the Waiho River Flats the land between the Waiho River and Docherty Creek and parts of Franz Josef and its environs will ultimately occur relatively soon (within 10 years) The area(s) affected in this way will be determined on the basis of where overtopping (or lateral erosion) first occurs This option on the basis of the present evidence indicates strongly that an avulsion into the Tartare River from CS 16 to CS 21 is highly probable in the short to medium term
112 the status Quo option
The status quo option is most probably the one likely to be favoured in the short term both by NZTA Department of Conservation and the WCRC Special Ratings Districts although with respect to the latter the ongoing affordability of that option is something that needs to be addressed This entails continuing to upgrade stopbanks and associated river protection measures to maintain freeboard It is opined that for both options and the do nothing option serious consideration should be given to abandoning rock rip rap spur groynes at least in the reach upstream of SH 6 in favour of rock rip rap cladding in order to preserve as far as practicable the waterway area that can be utilised in order to minimise the active braid in this reach This will entail founding the cladding as the WCRC has done at depth in the bed to minimise the likelihood of scour damage at the toe in major floods An assessment needs to be made of what this depth ought to be having regard to accepted analytical methodologies local knowledge and experience It is accepted that this is not likely to be a long term solution for all parties given that affordability and growth of the hazard will occur as stopbank heights are systematically raised and the elevational difference between the floodplain and the constrained aggrading riverbed gets progressively larger
113 acceptance of avulsion to the tartare river
Regardless of whether the do nothing or status quo options are chosen in the medium to long term if not sooner without human intervention by way of the construction of a
response However on balance it is likely that the works that confine the river already are implicated and what is being proposed will not materially alter what has already occurred and is persisting
102 tatare overflow Corridor
As has previously been described the aggradation which has occurred in the Waiho River active braided riverbed downstream of CS 16 of the CCSL surveys has raised mean bed levels to and possibly higher than the natural banks of the rivers true right berms from the Oxidation ponds through to the Waiho Loop Cross falls are evident on cross sections through this reach which fall towards the true right bank eg CS 16 00055 CS 19 00057 Further to that the land falls in a direct line from the Waiho River true right bank some 49m over a distance of 3130m into the bed of the Tatare at the point where the Tatare begins its cut through the Waiho Loop A similar situation exists from CS 21 where a fall of 10m occurs over a distance of some 890m The fall between these points is estimated at 00105 (CS 23 to Tatare) and 00156 (CS 16) By way of example if we assume a break out occurs around CS 20 into the Tatare a fall of 36 m over 2350m is available overland (s = 0015) If the initial overflow width is in the order of 300m and the hydraulic roughness is set at 008 05m average overflow depth gives a spill discharge in the order of 145 cumec at 10m overflow depth for the same width the overflow discharge becomes 460 cumec Average velocities for the 05m depth will be about 1ms and for the 10m overflow depth 15ms One must expect higher velocities than this because there will be areas where existing swales occur and depths are greater Greater depth results in higher velocities Surface scour will take place where velocities get above 15 ms and headcutting back from the Tatare true left bank must be anticipated as overflows begin spilling into that watercourse If this situation is allowed to occur ie no intervention (stopbanks) take place then over time as this situation is repeated the headward migration of channel erosion back towards the Waiho River from the Tartare River will ultimately lead to either partial or more likely complete capture of the Waiho River by the Tartare River When that happens the present Waiho River course around the south western end of the Waiho Loop will be abandoned although it may still carry flow for a period following capture until full capture is complete At this point very substantial volumes of gravel will have been eroded from the area between the two rivers along the avulsion path and headward erosion will progress upstream in the Waiho Riverbed as the new channel develops Just how fast this process will be and what alignment across the area between the Tatare and Waiho River it takes and where it cuts headwards in the Waiho River is problematic at this point What is certain is that it will have a profound affect on both rivers and quite possibly lead to either the elimination of Lake Pratt or alternatively its growth Aggradation will also occur in the Tartare River However to what extent and how far upstream that progresses has not been assessed at this time Following on from that significant changes in the bed of the Waiho River below the Waiho Loop will be inevitable and just what those will be what their magnitude is and where they are likely to be located has not been assessed at this time
36 37 Waiho RiveR optimal FutuRe management Waiho RiveR optimal FutuRe management
Chapter 11 future management optIons
chaptEr 12
ConClusions
Reflecting on the original brief the following comments are made based on the findings of this investigation accepting that this amounts simply to the Authors view and should not be interpreted as reflecting that of the WCRC NZTA Department of Conservation or any other interested or affected party
1 Keeping the river within its banks is considered a realistic option in the short (1-5 yrs) but inevitably it will have cost and structural stability and hazard growth implications which must be addressed Unless it involves interventions to avert an avulsion of the Waiho River into the Tartare River then capture of the Waiho River by the Tatare now seems inevitable in the short to medium term (1 to 10 yrs) This will almost certainly require within the next 5 to 10 years the construction of a short stopbank on the true right bank of the Waiho River upstream of the SH 6 bridge to prevent overflows from the Waiho River into the Franz Josef township via a low saddle area between the township and the Waiho River If there is an increase in sediment supply which is greater than that observed over the last 20 to 30 years or so then this timeframe will shorten Conversely an easing of supply may well slow aggradation rates in this reach effectively delaying this outcome The likelihood of a degradation cycle occurring and persisting such that it eliminates this risk is not considered realistic in the medium term (10 to 50 years) unless an avulsion into the Tartare River occurs which ultimately lowers the bed levels in this reach to sufficiently remove the threat
2 It hardly needs saying but the management of this river now in the interests of minimising risk to life and property is an extraordinarily complex and difficult exercise Inevitably there must be losers The prospect of an avulsion by the Waiho River into the Tatare looks increasingly probable if not imminent If steps are taken to prevent it the aggressive aggradation now evident over the whole fan surface within the present manmade boundary constraints from the WaihondashCallery River confluence to below the Waiho Loop can be expected to persist if not worsen It is doubtful that maintaining the status quo option indefinitely is in fact possible The costs are likely to be unsustainable for all or some of the parties involved and ultimately the river might anyway have the final say regardless of the best efforts of those charged with maintaining the flood protection systems In light of this it is opined that the way forward may be to maintain the status quo in the short term and carefully evaluate the consequences of an avulsion in order to minimise hazard (to people land and other property ecosystems and community well being) in preparation for an avulsion in the manner described herein
3 The notion that there is a slug of gravel within the Waiho riverbed between the WaihondashCallery River confluence through to and beyond the Waiho Loop that could be encouraged to move on is a misconception and misplaced The aggradation that has occurred on this surface is the result of wholly natural alluvial fan processes and is operating on a scale well beyond effective human intervention management There is good reason to conclude that past and continuing intervention in the form of active river boundary constraints has and still is influencing to an unspecified degree the gradational trends and outcomes now clearly evident
By way of example in order to restore channel capacity and avert an avulsion to the Tartare might require the excavation of gravel deposits off the bed of the river over the reach extending from the SH 6 bridge though to say the downstream end of Miltons and Otherrsquos stop bank a distance of some 5 to 55 km If this channel were constructed 400m wide and 15 m deep we would need to excavate some 3000000 bulk cubic meters of sand and gravel at a cost probably in the order of $10M to $15M That poses three important questions could
stopbank to prevent overflows to the Tatare in times of flood and in the expectation that water and sediment inputs to the fan and hence presently observed aggradation rates are maintained much as they have in the last 20 to 30 years an avulsion to the Tatare looks more certain than any time in the past 10 to 20 years That said is community acceptance of this option tenable In order to determine that a good deal more needs to be learned about how such a situation might progress what consequences could arise and to endeavour to determine realistic bounds on such effects if that is possible The work undertaken to date does not allow that and this must be attended to before this approach could be pursued as a deliberate management option notwithstanding the likelihood of it occurring regardless for the reasons outlined above In effect this would become a medium to long term strategy working in conjunction with the status quo option in the short term with the latter wholly or partially abandoned once the avulsion option is operative
114 boundary relaxation
The boundary relaxation option is not new This option was considered by the WCRC NZTA Westland District Council working party in 2000 [Evaluation of Options for the Management of the Waiho River Aggradation Threats RJ Hall et al (2000)] In effect what it requires is a deliberate action(s) to allow the river to re-occupy part of its natural alluvial fan surface presently unavailable as a consequence of the present boundary constraints along the true left bank from upstream of SH 6 through to the Waiho Loop and downstream If implemented this would require the relocation of a number of dwellings the relocation of SH 6 on the south side of the river the relocation or demolition of the Motel on the south bank and the Backpackers and the abandonment of extensive farmland between the Waiho River and Dochertyrsquos Creek
38 39 Waiho RiveR optimal FutuRe management Waiho RiveR optimal FutuRe management
Chapter 12 ConClusIons
chaptEr 13
aCknoWledgeMents
The Author wishes to acknowledge the assistance and insights provided by staff of the WCRC provided in the course of this investigation in particular the Chief Executive Chris Ingle and Messerrsquos Michael Meehan and Wayne Moen Acknowledgment is also extended to the staff of the Department of Conservation (Franz Josef ) NZTA Opus International Consulting Ltd (Greymouth) for their comments and making available photographic and survey information relevant to this engagement to the staff of the Westland District Council for their comments and to Drrsquos TRH Davies and M McSaveney for their comments and use of material from their 2002 5th International Gravel Bed River Symposium paper Further to that the Author wishes to acknowledge the survey work undertaken by Chris Coll Survey Ltd on this river and the willingness of Chris and Jan Coll and their staff in providing access to and comment on the various surveys of the river undertaken by themselves and others over the years without which this report would have been seriously limited Appreciation is also expressed to Kathy Walters of NIWA for assistance in providing hydrological information from their hydrometric sites at Hokitika Greymouth and Whataroa
RJ HallMIPENZ (Civil Geotechnical) CPEng Int PE (NZ)
RJ Hall Civil amp Associates Ltd
February 2012
resource consent under the Resource Management Act be obtained to execute and maintain work of that kind and scale where would the money come from to do it and where would the spoil go Further to that given the current aggradation rates and giving cognizance to the fact that it is impractical to get the river down to a narrow enough width to promote throughput to the extent that it will not aggrade the present annual aggradation rates would probably fill the channel in less than 2 years at which point one would have to start all over again As has been noted earlier in order to develop a self-sustaining channel one would need to replicate something akin to that presently available in the Callery Gorge That would require a deeper narrower channel heavily rock armoured well beyond anything presently being used and founded at least 5 to 6 m beneath the bed if not more It is opined that the costs of constructing and maintaining such a channel would be well beyond the reach of the Franz Josef community the WCRCrsquos Special Rating Districts NZTA and the Department of Conservation even if cumulatively they favoured the concept The only realistic alternative to a human intervention approach in the manner described above would be to allow the Waiho River to be captured by the Tatare which in time may well provide the relief sought However in saying that there will be unavoidable consequences if and when that situation arises and the riverbed deflation process that is likely to arise on the Waiho River alluvial fan as a consequence may not necessarily be confined to the present braided river bed That is an attendant risk that must be faced
40 41 Waiho RiveR optimal FutuRe management Waiho RiveR optimal FutuRe management
Chapter 13 aCknowledgements
appEndix 1
stoPbank breaCH MeCHanisMs
Piping failure arises where stopbanks have either been constructed in sands and silts or have been built over deposits comprising those types of soils Water seeping through the sand and silts when the river is in flood can erode out fines from the point where the seepage flows exit the embankment and or its foundation As this happens a pipe develops from the outside exit point and systematically erodes in a headward direction back through the embankment or foundation As the pipe develops (lengthens) the soil thickness along the seepage path through which the seepage is occurring upstream from the inward progressing pipe shortens and the hydraulic gradient driving the seepage steepens so the seepage flow increases This results in a steadily increasing (accelerating) flow and at some point the embankment collapses locally (slumps) allowing flows to overtop through the local reduction in crest level and breaching rapidly progresses from there Failure by this means is catastrophic
Suffosion occurs only in coarse grained cohesionless soils such as sandy gravels where seepage flows passing through the embankment and or its foundation under flood systematically erode out the fines leaving a residual coarse grained skeletal soil Failure of a stopbank and or its foundation under these conditions is unlikely to be catastrophic Typically it occurs as steady seepage flows coursing out of the lower third of the outside batter or at the batter toe itself and in that case quiet often as boils that emerge some distance out from the toe proper These outflows can be disturbing to witness but do not necessarily pose an immediate risk although localised sloughing of topsoil and grass cover on the outside batter may occur
Instability of the embankment outer batter capable of causing failure of the embankment proper (deep seated circular failure surfaces) require either poor foundation strength or over steep poorly compacted embankments constructed in weak materials where well established pheratic surfaces have developed through the embankment during a flood These types of failures should they occur will almost certainly be catastrophic Well constructed stopbanks on good foundations and constructed with batters 2H1V or flatter are not likely to fail in this manner because they have both adequate strength to resist such failure and the high compacted soil densities present result in moderate to low soil permeabilities which it turn impede the development of a full pheratic surfaces ie there is insufficient time during a flood for a full pheratic surface to develop In situations where an embankment has experienced prolonged high antecedent rainfall conditions prior to a flood and water content in the embankment is high as a consequence as this water draining through the core a pheratic surface may form but the stopbank design and construction described above normally provides a satisfactory safeguard against this type of failure
Strong ground motions during major earthquakes can result in crest settlement with or without liquefaction being present in stopbanks constructed in well compacted sandy gravels Under these conditions longitudinal cracks can appear in the crest running sub-parallel with the longitudinal direction of the crest For example for a typical stopbank well constructed on good foundations say of 3m height that experiences a M 8 earthquake with peak ground accelerations of say 05 longitudinal cracks of 100 to 200 mm width may appear and settlements of up to 15 of the stopbank height plus foundation depth could occur If we allow a foundation depth of say 2m then the crest settlement could be expected to be in the order of 75 to 100mm It should be apparent that damage of this kind does not
42 43 Waiho RiveR optimal FutuRe management Waiho RiveR optimal FutuRe management
appendIx 1 stopbank breaCh meChanIsms
appEndix 2
CHris Coll surVey ltd MarCH 2011 riVer bed surVey Plans
lead to catastrophic failure unless the dam remains in a damaged state for a period of time after the earthquake unrepaired and a flood event subsequently occurs capable of causing full or partial failure
44 45 Waiho RiveR optimal FutuRe management Waiho RiveR optimal FutuRe management
appendIx 2 ChrIs Coll survey ltd marCh 2011 rIver bed survey plans appendIx 2 ChrIs Coll survey ltd marCh 2011 rIver bed survey plans
46 47 Waiho RiveR optimal FutuRe management Waiho RiveR optimal FutuRe management
appendIx 2 ChrIs Coll survey ltd marCh 2011 rIver bed survey plans appendIx 2 ChrIs Coll survey ltd marCh 2011 rIver bed survey plans
48 49 Waiho RiveR optimal FutuRe management Waiho RiveR optimal FutuRe management
appendIx 2 ChrIs Coll survey ltd marCh 2011 rIver bed survey plans appendIx 2 ChrIs Coll survey ltd marCh 2011 rIver bed survey plans
50 51 Waiho RiveR optimal FutuRe management Waiho RiveR optimal FutuRe management
appendIx 2 ChrIs Coll survey ltd marCh 2011 rIver bed survey plans appendIx 2 ChrIs Coll survey ltd marCh 2011 rIver bed survey plans
52 53 Waiho RiveR optimal FutuRe management Waiho RiveR optimal FutuRe management
appendIx 2 ChrIs Coll survey ltd marCh 2011 rIver bed survey plans appendIx 2 ChrIs Coll survey ltd marCh 2011 rIver bed survey plans
54 55 Waiho RiveR optimal FutuRe management Waiho RiveR optimal FutuRe management
appendIx 2 ChrIs Coll survey ltd marCh 2011 rIver bed survey plans appendIx 2 ChrIs Coll survey ltd marCh 2011 rIver bed survey plans
56 57 Waiho RiveR optimal FutuRe management Waiho RiveR optimal FutuRe management
appendIx 2 ChrIs Coll survey ltd marCh 2011 rIver bed survey plans appendIx 2 ChrIs Coll survey ltd marCh 2011 rIver bed survey plans
58 59 Waiho RiveR optimal FutuRe management Waiho RiveR optimal FutuRe management
appendIx 2 ChrIs Coll survey ltd marCh 2011 rIver bed survey plans
appEndix 3
CHris Coll surVey ltd June 2011 WaiHo busH bloCk
60 61 Waiho RiveR optimal FutuRe management Waiho RiveR optimal FutuRe management
appendIx 3 ChrIs Coll survey ltd June 2011 waIho bush bloCk appendIx 3 ChrIs Coll survey ltd June 2011 waIho bush bloCk
62 63 Waiho RiveR optimal FutuRe management Waiho RiveR optimal FutuRe management
appendIx 3 ChrIs Coll survey ltd June 2011 waIho bush bloCk
appEndix 4
reFerenCes
1 Influence of Channel Width on Bed Load Transport Capacity MA Carson and GA Griffith ASCE Journal of Hydraulic Engineering Vol 113 No 12 Dec 1987 (pp 1489 -1509)
2 Dam Break Flood Hazard from the Callery River Westland New Zealand TR Davies and BK Scott Journal of Hydrology (NZ) 36 (1) 1-13 (1997)
3 Natural Hazards Assessment for the Township of Franz Josef and its Environs MJ McSaveney TRH Davies IGNS Client Report 44714B10 (July 1998)
4 Peer Review of the Institute of Geological and Nuclear Sciences Ltd Report No 44714B10 (July 1998) Natural Hazards Assessment for the Township of Franz Josef and its Environs RJ Hall RJ Hall Civil amp Environmental Consulting Ltd (August 1998)
5 Evaluation of Options for the Management of the Waiho River Aggradation Threats RJ Hall et al (2000)6 Anthropogenic Fanhead Aggradation Waiho River Westland New Zealand TR Davies MJ McSaveney
Proceedings 5th International Gravel-bed Rivers Symposium Christchurch and Franz Josef (2000)7 The Transit New Zealand Waiho Workshop HL Rouse TJ Day TRH Davies Proceedings 5th International
Gravel-bed Rivers Symposium Christchurch and Franz Josef (2000)8 Landslide-dambreak Floods at Franz Josef Glacier Township Westland New Zealand a Risk Assessment TR Davies
Journal of Hydrology (NZ) Vol 41 No 1 (2002) 9 Anthropogenic Aggradation of the Waiho River Westland New Zealand TR Davies MJ McSaveney PJ
Clarkeson Earth Surfaces Processes and Landforms 28 209-218 (2003)10 How High are Bed Moving Flows in New Zealand Rivers B Clausen D Plew Journal of Hydrology (NZ) Vol 43 No
1 (2004)11 Geomorphic Constraints on the Management of Bed-load Dominated Rivers TR Davies MJ McSaveney Journal
of Hydrology (NZ) 45 (2) 69-88 (2006) 12 Geology of the Aoraki Area 1 250000 Geological Map 15 SC Cox DJA Barrell compilers IGNS (2007)13 West Coast Regional Council Waiho River Flood Protection Scheme Design Flood Levels Good Earth Matters Ltd
(2008)14 Preparing For Climate Change A Guide for Local Government in New Zealand Ministry for the Environment (2008)15 Waiho River Bed Surveys June 2008 and March 2011 Chris Coll Surveying Ltd (2011)16 Topographical Survey of the Waiho Bush Block Chris Coll Surveying Ltd (2011)17 Mean Bed Level Survey Record Waiho River SH 6 Bridge February 1997 ndash May 2011 Opus International Consultants
Ltd 18 WCRC Asset Management Plans for the Franz Josef Special Rating Area the Lower Waiho Rating District (December
2010)19 Video of Callery Fly Over 2011 Opus International Consultants Ltd (2011)20 Oblique Stills Callery Fly Over 2011 Department of Conservation Franz Josef (2011)21 WCRC Staff Aerial Inspection ndash Callery 6 September 2011 W Moen WCRC (7 September 2011)22 Planning for a Safer Franz Josef ndash Waiau Community Westland District Considering Rupture of the Alpine Fault
RM Langridge amp JG Beban GNS Science Consultancy Report 2011217 (September 2011)23 Callery River Landslide Dam Rapid Assessment of Dam Failure Consequences for West Coast Regional Council R
Measures M Duncan NIWA (September 2011)24 NIWA Flood Annual Flood Record and Annual Means Site 89301 Whataroa River at SH 6 1985 ndash 2011 NIWA (2011)25 Report on West Coast Weather Event 27 amp 28 December 2010 West Coast Regional Council report (2011)
64 65 Waiho RiveR optimal FutuRe management Waiho RiveR optimal FutuRe management
appendIx 4 referenCes
appEndix 5
tables
Cros
s se
ctio
n
thal
weg
dis
tanc
e ( m
)
Mbl
Jan-
02 (
rl m
)
Mbl
Jun-
08 (
rl m
)
Mbl
Mar
-11
( rl
m )
Chan
ge M
bl Ja
n 02
- Ju
ne 0
8 ( r
l m
)
Chan
ge M
bl Ju
ne 0
8 - M
ar
2011
( r
l m
)
rate
Cha
nge
Mbl
Jan
02 -
June
08
( m
yr )
rate
Cha
nge
Mbl
June
08
- M
ar 2
011
( m
yr
)
rati
o M
bl C
hang
e pe
r yr
2008
- 20
11 to
200
2 - 2
011
Chan
ge in
Vol
ume
( m
3 ) 20
02 -
2008
Chan
ge in
Vol
ume
( m
3 ) 20
02 -
2011
10 0 15305 15855 16039 551 184 0816 0689 08
11 209 15484 15572 157785 088 207 0131 0775 59 103269 68536
12 417 15308 15328 154969 020 169 0030 0632 212 21893 81442
13 821 15053 15043 15139 -010 097 -0015 0363 00 4656 129254
14 1113 14594 14656 14754 062 098 0092 0369 40 18638 70075
15 1377 14354 14387 14463 033 076 0049 0284 58 36017 68155
16 1795 13934 13963 14017 029 055 0043 0205 48 79237 159891
17 2268 13428 13452 13515 024 063 0035 0237 68 115310 261502
18 2740 12947 12918 12971 -029 053 -0043 0197 -45 -3499 247856
19 3158 12449 12484 12522 034 038 0051 0143 28 -54 147467
20 3923 11626 11678 11703 051 026 0076 0097 13 156610 134985
21 4618 10901 10932 10949 031 017 0045 0065 14 224717 123676
22 5418 10101 10104 10100 003 -005 0004 -0017 -40 613958 -560100
23 6114 9343 9504 9397 161 -108 0239 -0403 00 635880 -761619
2006631 171120
TABle 1 Waiho River at Franz Josef Mean Bed Level and Volumetric Changes Summary January 2002 ndash June 2008 and June 2008 ndash March 2011 River Bed Surveys
66 67 Waiho RiveR optimal FutuRe management Waiho RiveR optimal FutuRe management
appendIx 5 tables
recurrence interval t
(yrs)
Qpk(eV 1)
(cumec)
Qpk + 10(cumec)
Qpk + 15(cumec)
23 1230 1350 1400
5 1550 1700 1800
10 1640 1800 1900
20 1730 1900 2000
50 1820 2000 2100
100 1910 2100 2200
note Waiho River estimates derived from an EV 1 analysis of Whataroa River at SH 6 which were scaled by the area factor [A waiho A whataroa]⁰⁸
TABle 2 Flood Frequency Estimates for the Waiho River based on the Whataroa River at SH 6
appEndix 6
Figures
68 69 Waiho RiveR optimal FutuRe management Waiho RiveR optimal FutuRe management
appendIx 5 tables
appEndix 7
glossary oF terMs
active gully erosion Erosion that is presently occurring on the sides and floor of a gully during rainstorms which results in an expansion of the gully (viz depth width) and delivers sediment downstream into the main river system of which it is an integral part
aggradation The process whereby sands and gravels accumulate in a riverbed causing the bed level to riseaggrading Phase A term used to describe a period when aggradation is occurring in a river or on an active
alluvial fanalluvial Fan The fan shaped surface built up by a river over extended time where it exits in a confined reach
typically where a river emerges from a hill catchmentannual exceedence Probability The probability that an event (rainstorm flood) of a specific size will occur on
average in any one year (the mathematical reciprocal of the return period or recurrence interval for that event)
annual series Maxima A table comprising the highest flow recorded at a hydrometric site for each year of record and is used for determining the flood frequency characteristics of that site
antecedent rainfall That rainfall that occurs prior to the onset of a rainstorm and which pre-soaks the soil assisting in the development of runoff from the storm when it occurs
anthropogenic Something which has occurred or will occur as a result of human activity or influenceappurtenant structures A structure that is integrally required for the satisfactory performance of another
structure eg rock riprap stub groynes to provide protection to the riverside toe and batter of a stopbankaverage Water depth The water depth averaged over a cross section for a particular flowavulsion The sudden change in direction of a river that occurs as a result of a break out usually occurring during
a flood so that the river abandons its original course in favour of the new alignmentbedload dominated river A river in whose form has been sculptured by the erosion storage and transport of
gravel as bedloadbenchmark level The level referenced to a particular survey datum that is set on a permanent reference point
(bench mark) for survey purposesboils The localised appearance of water and fine soil particles such as sands and silts that occur where
concentrated seepage flows emerge at groundlinebraided river The description for a wide generally steep gravel bed river that has a multitude of interlacing
channelsCalibration run The running of an hydraulic model using selected known flows and water profiles in order to
determine what surface roughnessrsquos are required to obtain realistic model performanceCatchment Processes The physical processes operating within a catchment which influence the rate of runoff
and hence river flow during rainstormsChannel gradient The average slope of a channel reach measured along the flow path of the riverCross Fall The gradient that occurs on the bed of a river that runs at right angles to the primary down valley
gradient of the riverbedCrest settlement The lowering of the crest level of a stopbank caused by either settlement in the stopbank
foundation where weak materials are present or as a result of internal erosion of the stopbank or where liquefaction has occurred or through slumping caused by erosion of the stopbank or lateral spreading of the stopbank foundation as a result of earthquake action
Current Morphological status The present state that a river is in given that the rivers form tends to change over time in response to climatic and geological influences which can affect sediment supply catchment runoff and hence river flows channel gradient and sea level
dam break surges The waves of water and debris that move rapidly downstream from a debris dam when it fails
debris dams Obstructions that occur in confined river reaches from time to time and typically comprise rock regolith vegetation etc which obstruct the flow of water and cause it to dam
debris Flow A fluvial phenomena that can occur in steep channels usually as a result of intense rainfall on an already wet catchment the debris flow manifests as a slug or series of slugs of water and sediment travelling
DoCheRtY CReeK
1km 1mi
FRanZ JoSeF toWnShip
Canvans Knob
Franz Josef Stopbanks
Canavans Knob Stopbank
Rubbish Dump Stopbank
milton amp others Stopbank
State highway
State highway
Bridge
Sewerage ponds
nZta
WCRC
hokitika airport authority
Department of Conservation
Westland District Council
tartare gorge
Waiho loop
Rata Knoll
WAIHO RIVER
CalleRY RiveR
70 71 Waiho RiveR optimal FutuRe management Waiho RiveR optimal FutuRe management
appendIx 7 glossary of terms appendIx 7 glossary of terms
rapidly downstream as a dense slurry which may have incorporated within it woody debris such as tree trunks and branches
debris Flow activity The occurrence of debris flowsdebris traps Places within a catchments river system where sediment tends to accumulatedegradation The opposite process to aggradation whereby sands and gravels are eroded out of the riverbed
and the riverbed fallsdeflation of the bed The steady reduction in elevation of an eroding surface (river bed) over time under the
influence of surface erosion processesdesign Flood levels The maximum water level relative to a prescribed design datum set at a particular location
on a river required to contain the design flood carrying capacity of the river control systemdetritus The products of erosion that is delivered into a river system form the slopes where it has been generated
by weathering and erosion processesdistal end of an alluvial Fan The furthest end of an alluvial fan from the fan head and typically the lowest
elevation on the fan surface provided the fan has not been truncated by erosion by the river or by wave action on a lake or the sea
episodic Events that occur irregularly in timeFalling limb of a Hydrograph That part of the flood hydrograph after the peak where the flood recession
occursFlood Carrying Capacity An estimate of the peak flow in m3 per second that a river control system (can contain
without exceeding its freeboard where a river has stopbanks it is the flow contained within the stopbanks whilst maintaining the design freeboard
Flood Frequency estimates A statistical process for estimating the recurrence interval of various flood discharges for a particular hydrometric site using the annual maxima series for that site
Flood Peak The maximum flow reached by a river in flood measured in m3 per secondFlood Plain The surface over which a river can spread in times of flood once it overtops its natural banks Flood Volume The total volume of water delivered by a river in flood over the duration of the flood and measured
in m3 Fluvial Characteristics The characteristics of a river which describe the storage transport and reworking of river
sediments by the rivers flowsgeomorphic Constraints Physical factors such a rate of uplift hardness of basement rock present sea level
which limit for example the generation of sediment supply and gradient of a river and hence influence the form of a river
glacial internal drainage systems Subsurface watercourses located in and beneath a glacier that convey water from the surface and sides of a glacier into through and beneath a glacier and discharge to the valley floor at the glacier terminal face
glacier retreat The process whereby the terminal face of the glacier is located progressively up the valley as the glacier ice volume is reduced by ablation
Headcut The formation of an erosion cusp in a channel that results in a localised step in a channel bedHeadward erosion The erosion that generates and maintains the headward movement of the erosion cusp
(headcut)Hydraulic Characteristics The flow characteristics of a river system such as flow depth water velocity channel
surface roughness and channel slope (gradient)Hydraulic gradient The slope on a flowing water surfaceHydrometric site A water level measuring site which continuously measures and records water depth at the site
at specific time intervals used for establishing flow records over the full range from low to high flow landslide dam A dam that forms in a confined reach of a river as a result of landslide occurring and partially
blocking the valley through which the river is flowinglateral bank erosion The processes whereby a river erodes its banks generally used with reference to the
erosion of stopbanks when a river moves side ways in a flood eroding the stopbank in the process on the riverside of the stopbank
liquefaction The sudden loss of strength of an unconsolidated or poorly consolidated saturated fine sand soil induced by violent earthquake shaking
lithologies A geological term used for describing rock typeslive bed Conditions The condition that may occur in a riverbed in flood when the deposits which form the
riverbed and banks begin to mobilise and become entrained in the flow and move downstreamMass Movement The downslope movement of regolith and other erosion products in bulk eg slab avalanches
landslides debris flows
Mean bed level The average level of a riverbed across a particular cross section at a particular time estimated from a surveyed cross section at a particular time
Micro scale Modeling The development and running of a small scale physical replica of a particular physical feature such as an active alluvial fan in a laboratory situation
Morphologically active alluvial Fan An alluvial fan that is either aggrading or degrading under its present sediment and water supply and under the influence of local morphological constraints
natural Hazards Any atmospheric or earth or water related occurrence (in the Waiho River context including earthquake erosion landslip Subsidence sedimentation wind drought or flooding) the actions of which adversely affects or may affect human life property or other aspects of the environment
overtopping The term used to describe the situation where floodwaters in a river in flood begin to spill over the rivers banks or stopbanks whichever is relevant to the particular situation being considered
Permeability A term used to describe and quantify that property of a soil that permits water to flow through the pores of the soil under a hydraulic gradient
Pheratic surface The curvilinear water surface within the soils of a stopbank or dam through which water is seeping marking the boundary between saturated and un-saturated soils
Predictive tool A procedure such as a hydraulic model that is developed in order to try and determine how a particular physical situation might develop over time under specified inputs (eg water bedload supply)
Prograding The episodic growth of an alluvial fan surface which causes the distal end of the fan to extend downstream away from the fan head
recession That period during a flood when the river has passed its peak and water levels and hence flow rates are dropping
recurrence interval A statistical term used to describe the relative size of an event (synonymous with the term average return period) eg a particular rainfall depth or flood flow A 1 in 100 year flood has a recurrence interval of 100 years on average It does not mean that an hundred year flood will not occur again for 100 years if an event of that size has just been experienced
regolith The accumulation of soil material on a hill slope as a result of the weathering of the hill slope over time Typically regolith includes clay and sand size particles rock fragments and soil
regolith avalanches The localised movement of regolith rapidly off a hill slope onto the valley floor or riverbed in the form of an avalanche
residence time The time that elapses for example between bed load sediments accumulating at a particular location and subsequently being eroded out
revegetation The decolonization with new vegetation on areas such as slopes denuded of vegetation by landslides
river bed roughness A hydraulic term which reflects the relative roughness of the surface of a riverbed or its berms that is used in hydraulic computations
river Cross sections A survey of ground levels extending across a river from its true left bank to its true right bank aligned more or less at right angles to the rivers flow in times of flood
river reach A description for a particular stretch of a riverriver training and Protection Works Structures erected by humans in an attempt to mitigate against riverbank
erosion and channel migration during floodsrelaxation Removing the boundary constrains on a stopbanked river to allow the river to reassert its natural
form on the floodplain unimpeded by man made flood containment structuresrock rip rap A term used to describe the coarse hard rock that is placed against a surface that may be eroded
by river flows in order to mitigate against such erosion sediment sources Those parts of a river catchment that supply sediment to the river as sediment supplysediment supply The sediment that passes through a river system typically of an episodic nature ie the rate of
supply varying over time typically in response to climatic conditions and river flowseismic induced Mass Movement Landslide activity caused by seismic activityshallow slab avalanches Landslides that typically occur on steep valley sides where the basement rock is close
to the surface (eg within 1 to 2 metres of the surface)sinusoidal braided Flow PatternsTheldquoSrdquoshapedchannelinducedflowpatternsobservedinbraidedriversspecial rating district A Rating District established for the construction and ongoing repair and maintenance
of a river control scheme the rating district is administered by the West Coast Regional Councilsplinter Faults Fault lines that extend out at an angle from a main fault linespur groynes Short groynes that are constructed at the toe of a natural river bank or stopbank that project out
into the riverbed designed to ease high flow velocities of the natural bank or stopbank toe in order to lessen the risk of lateral erosion by the river in flood
72 73 Waiho RiveR optimal FutuRe management Waiho RiveR optimal FutuRe management
appendIx 7 glossary of terms
stopbank A structure erected on a rivers floodplain typically sub-parallel to the rivers flow in times of flood to contain flood flows up to the design standard of the flood protection scheme to prevent them from spilling onto the floodplain
sub-alpine vegetation Typically shrubby bushes grasses and stunted trees that grow above the bush line but below the sparsely vegetated alpine area of a mountain range
sub ndash Parallel More or less parallelsuper-elevation effect The local elevation of water levels around the outside of a bend in a river caused by
centrifugal forces generated by the water moving around the river bendswale The remnant of a river channel on a riversrsquo floodplain that has been etched by river flows in the past and
has subsequently been abandoned by the normal flow of the river but can activate when rivers overtop their natural banks and flow onto the flood plain they may also convey surface runoff from local rainstorms from time to time
temporal supply Mechanism A process that generates sediment supply to the river system and is time dependent
thalweg The centreline path the active riverbed takes as it flows down plainthreshold Flood event A flood event of sufficient size that it overtops a rivers confining banks natural or man
made transfer reach That part of a mountain catchment located in the foothill area upstream of the head (or apex)
of an alluvial fan generally a gorge or narrow confined reach with little opportunity for coarse sediment storage coarse sediments tend to flush through these reaches during floods rather than accumulate as they might on the fan surface proper
two dimensional Hydraulic Model A computer model that incorporates a digital terrain model to provide the basis for determining water depths and velocities over that surface for a particular design flood flow
Wasting out The eroding out of deposits over time
74 Waiho RiveR optimal FutuRe management
388 Main South Road PO Box 66 Greymouth
phone +64 3 768 0466
email infowcrcgovtnz
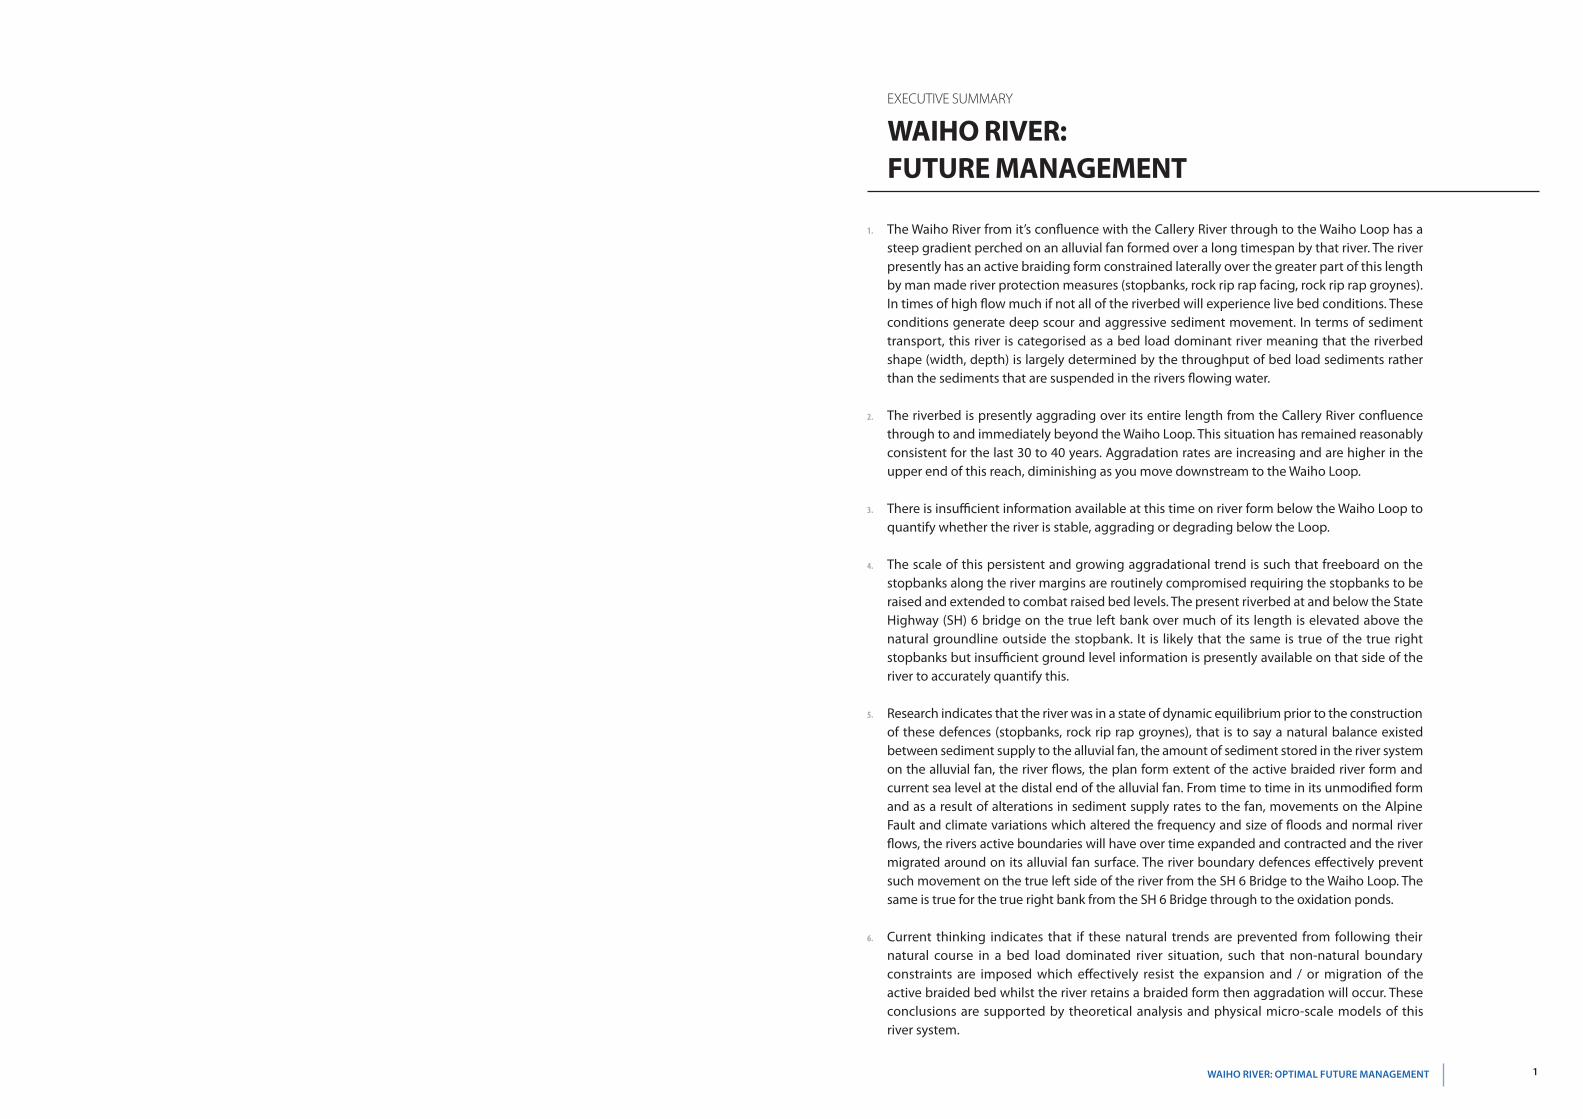
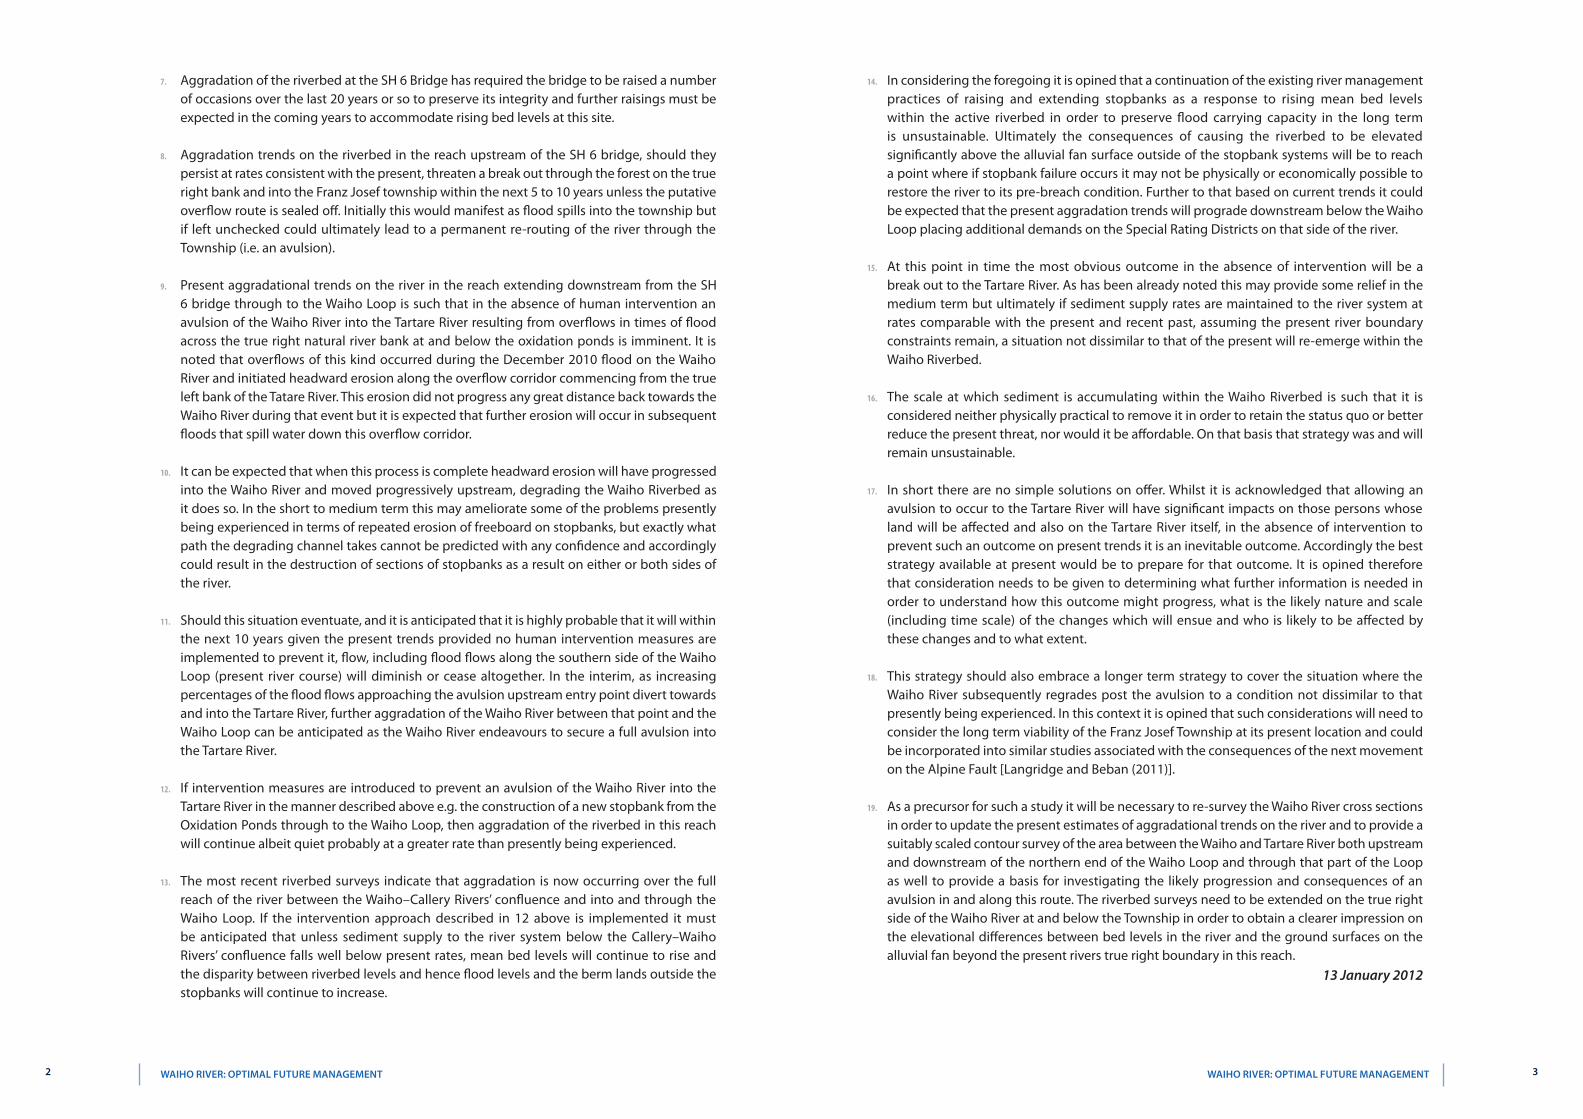
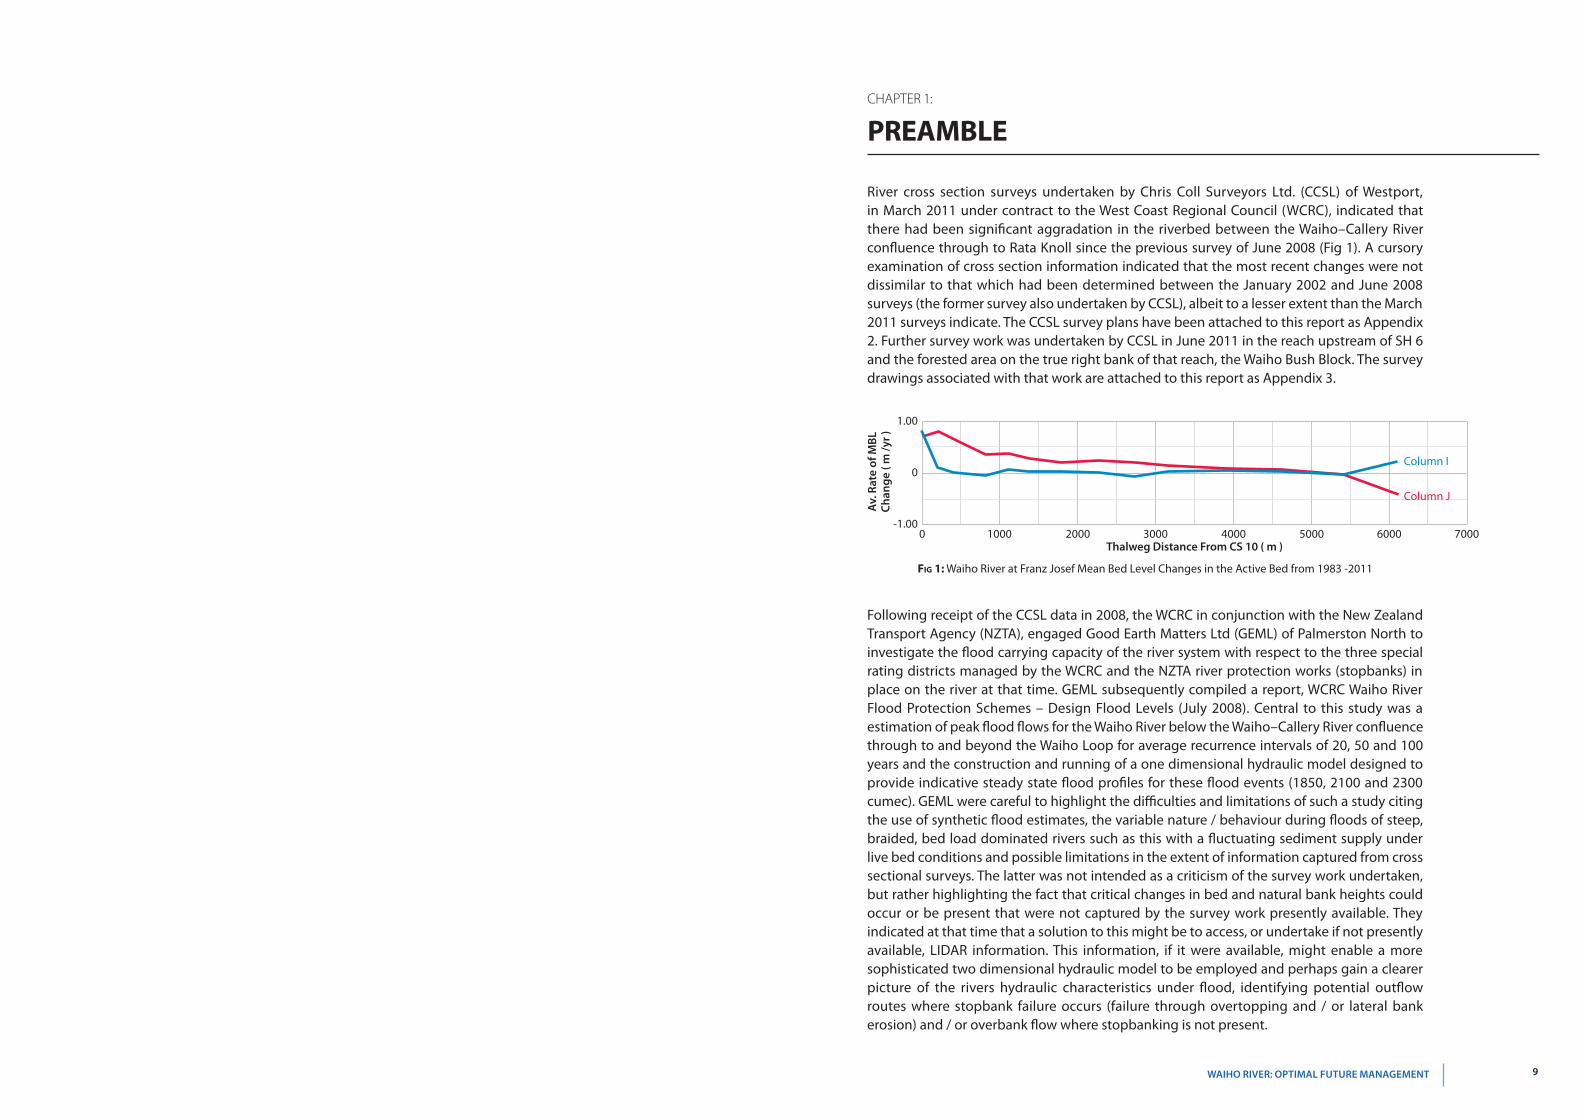
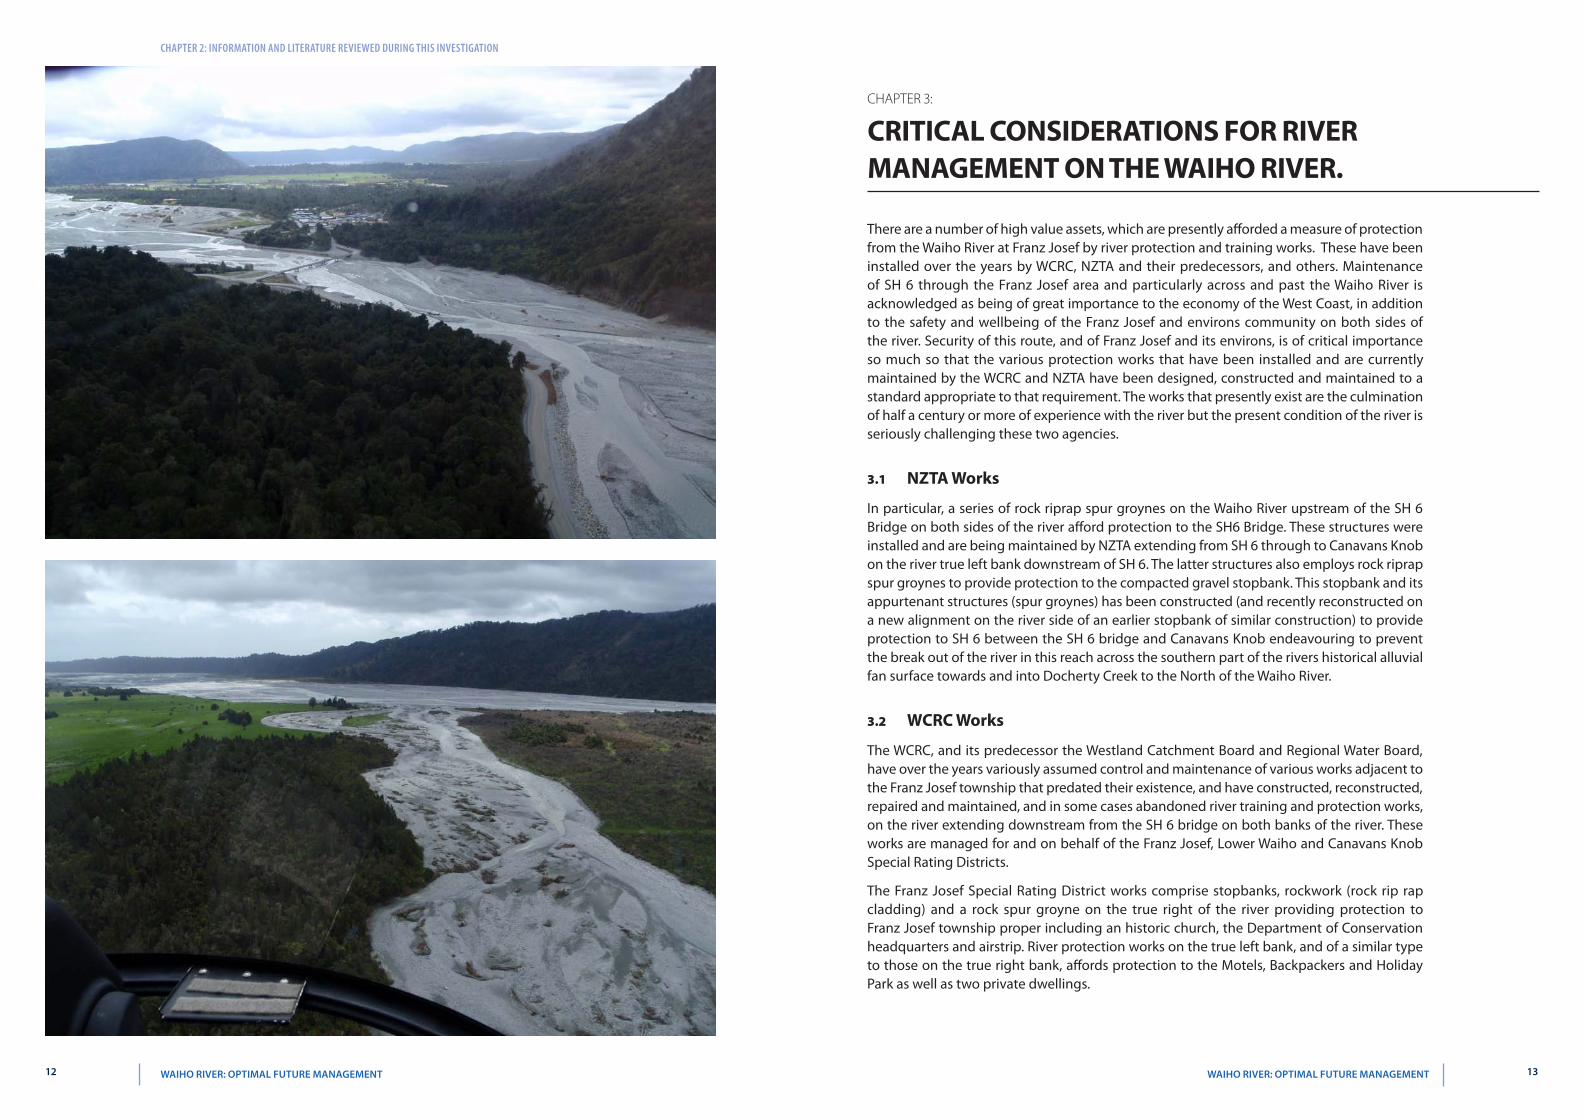
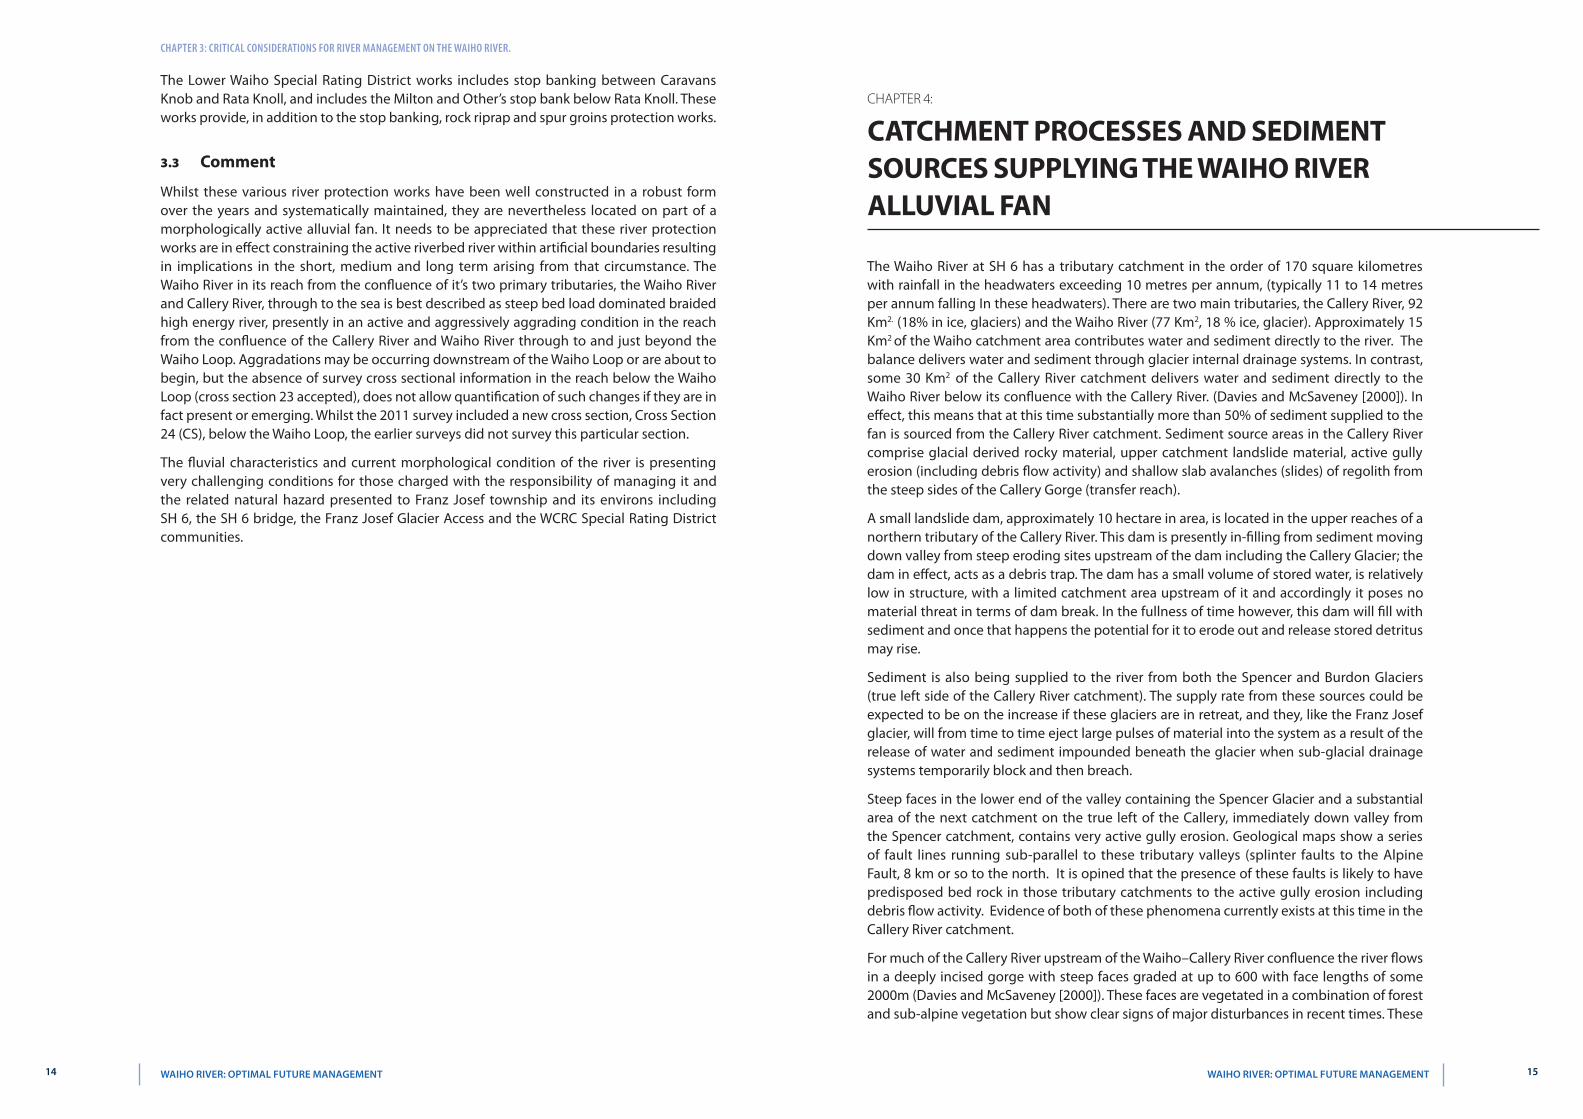
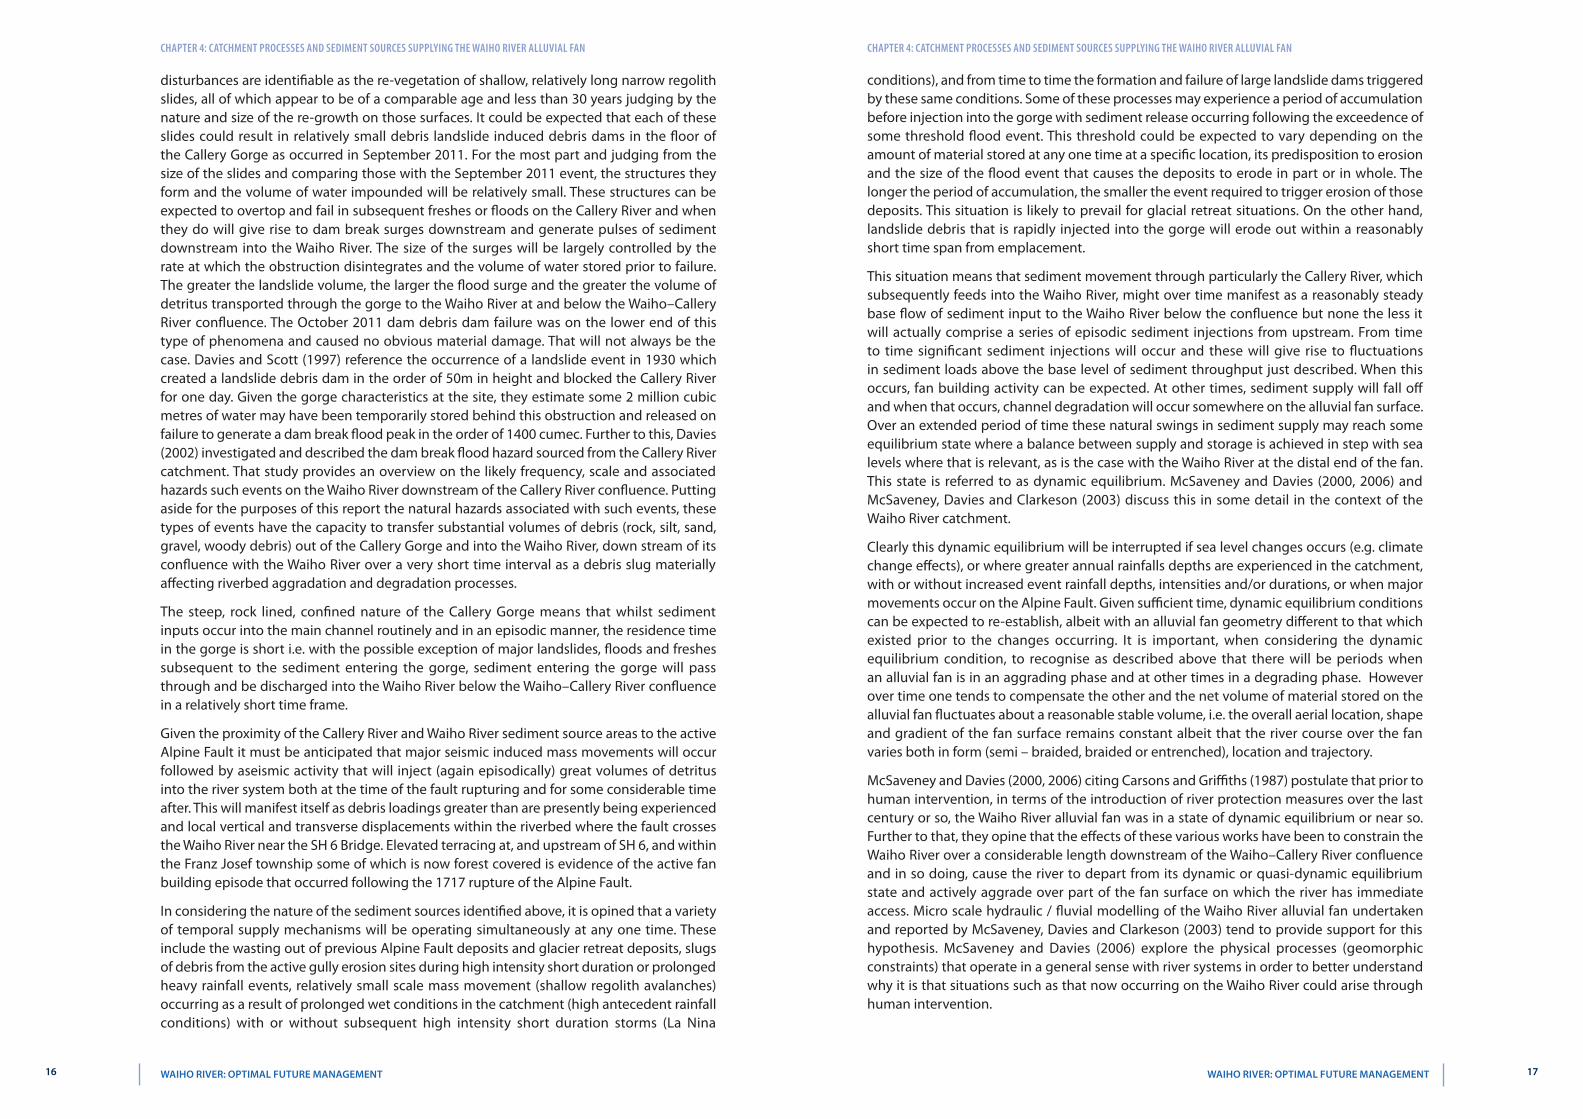
Chapter 4 CatChment proCesses and sedIment sourCes supplyIng the waIho rIver alluvIal fan Chapter 4 CatChment proCesses and sedIment sourCes supplyIng the waIho rIver alluvIal fan
conditions) and from time to time the formation and failure of large landslide dams triggered by these same conditions Some of these processes may experience a period of accumulation before injection into the gorge with sediment release occurring following the exceedence of some threshold flood event This threshold could be expected to vary depending on the amount of material stored at any one time at a specific location its predisposition to erosion and the size of the flood event that causes the deposits to erode in part or in whole The longer the period of accumulation the smaller the event required to trigger erosion of those deposits This situation is likely to prevail for glacial retreat situations On the other hand landslide debris that is rapidly injected into the gorge will erode out within a reasonably short time span from emplacement
This situation means that sediment movement through particularly the Callery River which subsequently feeds into the Waiho River might over time manifest as a reasonably steady base flow of sediment input to the Waiho River below the confluence but none the less it will actually comprise a series of episodic sediment injections from upstream From time to time significant sediment injections will occur and these will give rise to fluctuations in sediment loads above the base level of sediment throughput just described When this occurs fan building activity can be expected At other times sediment supply will fall off and when that occurs channel degradation will occur somewhere on the alluvial fan surface Over an extended period of time these natural swings in sediment supply may reach some equilibrium state where a balance between supply and storage is achieved in step with sea levels where that is relevant as is the case with the Waiho River at the distal end of the fan This state is referred to as dynamic equilibrium McSaveney and Davies (2000 2006) and McSaveney Davies and Clarkeson (2003) discuss this in some detail in the context of the Waiho River catchment
Clearly this dynamic equilibrium will be interrupted if sea level changes occurs (eg climate change effects) or where greater annual rainfalls depths are experienced in the catchment with or without increased event rainfall depths intensities andor durations or when major movements occur on the Alpine Fault Given sufficient time dynamic equilibrium conditions can be expected to re-establish albeit with an alluvial fan geometry different to that which existed prior to the changes occurring It is important when considering the dynamic equilibrium condition to recognise as described above that there will be periods when an alluvial fan is in an aggrading phase and at other times in a degrading phase However over time one tends to compensate the other and the net volume of material stored on the alluvial fan fluctuates about a reasonable stable volume ie the overall aerial location shape and gradient of the fan surface remains constant albeit that the river course over the fan varies both in form (semi ndash braided braided or entrenched) location and trajectory
McSaveney and Davies (2000 2006) citing Carsons and Griffiths (1987) postulate that prior to human intervention in terms of the introduction of river protection measures over the last century or so the Waiho River alluvial fan was in a state of dynamic equilibrium or near so Further to that they opine that the effects of these various works have been to constrain the Waiho River over a considerable length downstream of the WaihondashCallery River confluence and in so doing cause the river to depart from its dynamic or quasi-dynamic equilibrium state and actively aggrade over part of the fan surface on which the river has immediate access Micro scale hydraulic fluvial modelling of the Waiho River alluvial fan undertaken and reported by McSaveney Davies and Clarkeson (2003) tend to provide support for this hypothesis McSaveney and Davies (2006) explore the physical processes (geomorphic constraints) that operate in a general sense with river systems in order to better understand why it is that situations such as that now occurring on the Waiho River could arise through human intervention
disturbances are identifiable as the re-vegetation of shallow relatively long narrow regolith slides all of which appear to be of a comparable age and less than 30 years judging by the nature and size of the re-growth on those surfaces It could be expected that each of these slides could result in relatively small debris landslide induced debris dams in the floor of the Callery Gorge as occurred in September 2011 For the most part and judging from the size of the slides and comparing those with the September 2011 event the structures they form and the volume of water impounded will be relatively small These structures can be expected to overtop and fail in subsequent freshes or floods on the Callery River and when they do will give rise to dam break surges downstream and generate pulses of sediment downstream into the Waiho River The size of the surges will be largely controlled by the rate at which the obstruction disintegrates and the volume of water stored prior to failure The greater the landslide volume the larger the flood surge and the greater the volume of detritus transported through the gorge to the Waiho River at and below the WaihondashCallery River confluence The October 2011 dam debris dam failure was on the lower end of this type of phenomena and caused no obvious material damage That will not always be the case Davies and Scott (1997) reference the occurrence of a landslide event in 1930 which created a landslide debris dam in the order of 50m in height and blocked the Callery River for one day Given the gorge characteristics at the site they estimate some 2 million cubic metres of water may have been temporarily stored behind this obstruction and released on failure to generate a dam break flood peak in the order of 1400 cumec Further to this Davies (2002) investigated and described the dam break flood hazard sourced from the Callery River catchment That study provides an overview on the likely frequency scale and associated hazards such events on the Waiho River downstream of the Callery River confluence Putting aside for the purposes of this report the natural hazards associated with such events these types of events have the capacity to transfer substantial volumes of debris (rock silt sand gravel woody debris) out of the Callery Gorge and into the Waiho River down stream of its confluence with the Waiho River over a very short time interval as a debris slug materially affecting riverbed aggradation and degradation processes
The steep rock lined confined nature of the Callery Gorge means that whilst sediment inputs occur into the main channel routinely and in an episodic manner the residence time in the gorge is short ie with the possible exception of major landslides floods and freshes subsequent to the sediment entering the gorge sediment entering the gorge will pass through and be discharged into the Waiho River below the WaihondashCallery River confluence in a relatively short time frame
Given the proximity of the Callery River and Waiho River sediment source areas to the active Alpine Fault it must be anticipated that major seismic induced mass movements will occur followed by aseismic activity that will inject (again episodically) great volumes of detritus into the river system both at the time of the fault rupturing and for some considerable time after This will manifest itself as debris loadings greater than are presently being experienced and local vertical and transverse displacements within the riverbed where the fault crosses the Waiho River near the SH 6 Bridge Elevated terracing at and upstream of SH 6 and within the Franz Josef township some of which is now forest covered is evidence of the active fan building episode that occurred following the 1717 rupture of the Alpine Fault
In considering the nature of the sediment sources identified above it is opined that a variety of temporal supply mechanisms will be operating simultaneously at any one time These include the wasting out of previous Alpine Fault deposits and glacier retreat deposits slugs of debris from the active gully erosion sites during high intensity short duration or prolonged heavy rainfall events relatively small scale mass movement (shallow regolith avalanches) occurring as a result of prolonged wet conditions in the catchment (high antecedent rainfall conditions) with or without subsequent high intensity short duration storms (La Nina
16 17 Waiho RiveR optimal FutuRe management Waiho RiveR optimal FutuRe management
Chapter 4 CatChment proCesses and sedIment sourCes supplyIng the waIho rIver alluvIal fan Chapter 4 CatChment proCesses and sedIment sourCes supplyIng the waIho rIver alluvIal fan
Cross section profiles of river cross sections extending down stream from the WaihondashCallery River confluence (CS 10) through to just beyond the Waiho Loop (CS 23) clearly show such changes between January 2002 June 2008 and March 2011 surveys Variations in mean bed levels calculated across the active river on each of these cross sections between the January 2002 and June 2008 and the June 2008 and March 2011 surveys is given in Table 1 Shown also in this table is an estimate of the volume of aggradation that has occurred between successive cross sections during this time and the volume that has accumulated in total on the alluvial fan for the same period These values are plotted on Fig 3 and 4
If the OICL record of the temporal pattern to these changes on the river as a whole then it is possible that the mean bed level changes recorded between the CCSL surveys of June 2008 and March 2011 may have actually occurred largely between March 2010 and March 2011
mea
n B
ed l
evel
( m
)
170
160
150
140
130
120
110
100
901985 1990 1995 2000 2005 20101980
Year
Fig 3 Waiho River at Franz Josef Average Rate of Mean Bed Level Change per Year Jan 2002 to June 2008 and June 2008 to March 2011 surveys
The March 2011 CCLS survey shows the mean bed level gain on CS 10 located near the confluence of the Callery River and Waiho Rivers some 023m less than that on CS 11 200m downstream Further to that the OICL mean bed level record at the SH 6 Bridge shows a small reduction in mean bed levels between their 21 March 2011 survey and their 4 May 2011 survey of 012m Taken together and with cognizance to the trends evident (saw tooth pattern) in the OICL mean bed level record at this site it is would be premature to conclude that a reduction in the long term aggradational trend on the fan has occurred since March 2011 The prudent approach is to assume that the aggradational trends presently evident will persist in much the same manner as has been observed in recent years It must also be anticipated that from time to time sudden local increases will occur as is evident in the OICL mean bed level record at SH 6 (May ndash Nov 1999 March 2009 and Jan 2011 ndash March 2011) These local increases in mean bed level are likely to represent significant increases in sediment supply associated with a major flood event flushing sediment accumulations through the transfer reaches of the Callery River primarily but also In the Waiho River an increase in frequency of shallow slides in the Callery Gorge as a result of high antecedent
It is not the intention of the author to describe in detail the works cited above but in short the findings are that for a bed load dominated river such as the Waiho River which exists in a state of dynamic or quasi-dynamic equilibrium and has a braided form will aggrade if artificial constraints (stopbanks rock rip rap groynes rock armoured hook groynes etc) are introduced along or inside the active margins of that river provided the braided form is not fully suppressed This change in equilibrium comes about even though there may be no material alteration in the medium to long term sediment andor water inputs to the system The basic tenant to this argument is that a river in a natural state corresponds to a local maximum in terms of bedload sediment transport capacity Hence any moderate alteration to the river form (eg introduction of river boundary constraints) will cause a reduction in sediment transport capacity (McSaveney and Davies (2006) In order to accommodate this shift a river such as the Waiho River will aggrade in order to steepen the channel in an endeavour to increase bed load transport and bring the river back towards an equilibrium state
In considering the present situation on the Waiho River we clearly have artificial constraints in the form of river protection works in place and these have been present for some considerable time and in varying degrees (number form location effectiveness) It is clear that the Waiho River downstream of its confluence with the Callery River dramatically altered its form sometime and most probably progressively between 1948 and 1997 (fig 5 McSavaney and Davies [2000]) These authors postulate that the change most likely occurred between 1965 and 1981 as a result of a series of rainstorms or a particular event and they cite a 3 day rainstorm in March 1979 where 750mm of rain was recorded in the Franz Josef village as a possible culprit
An examination of the OICL mean bed level records at the SH 6 bridge site (Fig 2) on the Waiho River from Jan 1997 through to May 2011 show distinct step ups in mean bed levels at that site occurring around January through March 1999 (900 mm or so) and again from January 2009 through to January 2010 (900mm) and more dramatically upward movement from January 2011 to February 2011 (1000mm) These changes are also evident in the riverbed both upstream and downstream of the SH 6 bridge in the riverbed surveys reported by CCSL (2011)
Date
mea
n B
ed l
evel
153
152
151
150
149
148
147
146
145
144
143
Jan
1997
Jan
1998
Jan
1999
Jan
2000
Jan
2001
Jan
2002
Jan
2003
Jan
2004
Jan
2005
Jan
2006
Jan
2007
Jan
2008
Jan
2009
Jan
2010
Jan
2011
Jan
2012
Soffit Level
Design Flood Level
Design Bed Level
Mean Bed Level
Fig 2 Waiho River Mean Bed Levels at the SH 6 Bridge (Opus)
18 19 Waiho RiveR optimal FutuRe management Waiho RiveR optimal FutuRe management
Chapter 4 CatChment proCesses and sedIment sourCes supplyIng the waIho rIver alluvIal fan Chapter 4 CatChment proCesses and sedIment sourCes supplyIng the waIho rIver alluvIal fan
McSaveney Davies amp Clarkeson (2003) In the light of this body of research and given that the greater part of it has been derived from studies of the behaviour of this river it must be evident that reducing the available braided width of this river as occurred with these works could well exacerbate on-going aggradational trends which might inevitably lead to reduced freeboard on the NZTA stopbanks in this reach of the river Such effects will not be limited solely to the NZTA stopbanks but must inevitably have a similar effect on stopbanks outside their control elsewhere on the river Further to that as will be discussed later in this report aggradation now evident in the river in this particular reach is causing overbank spills on the true right bank between the oxidation ponds and the Waiho Loop presenting a real threat of avulsion of the Waiho River into the Tatare River which would result in capture of the Waiho River by the Tartare River Overbank spill on the true right bank of the Waiho River in the floods of December 2010 followed this trend and there is clear evidence of headward erosion occurring as a result in the lower end of the overflow corridor extending back and upstream from where the Waiho River spills entered the Tartare River (Plate 2) The statement in the NZTA resource consent application (72) It is not anticipated that structures will cause or exacerbate flooding or erosion on other properties during flood flows may not be consistent with the present situation and may need reviewing
The need to protect SH 6 is not questioned the importance of this highway to the West Coast economy is absolute Notwithstanding that cognizance needs to be given to the insights now available on the effect of boundary constraint on river behaviour (aggradation) in a bed load dominated river (Waiho River) These insights indicate that persisting with the present river management strategy which relies on boundary constraint will only lead to further riverbed aggradation and ultimately to avulsions This situation arises because the riverbed in a number of places is now elevated well above the fan surface that lies beyond the protection systems on this river and these same works have significantly reduced the area of the alluvial fan surface available to the river for sediment storage
Responses must now be sought that minimise the risk of break out and avulsion or at lease allow the river to avulse to areas where it is already predisposed to do so if it cannot realistically be prevented It must be recognised though that if breakouts were to be prevented by raising stopbank levels and or constructing new stopbanks in due course the whole protection system will inevitably be put at risk at some later time by overtopping and or avulsion with the multiple consequences that would ensue if the current aggradation trends persists or worsen It is to be noted that a river management policy that relies on containing river aggradation by periodically raising stopbanks to preserve flood containment inevitably increases future risk and poses significant engineering and environmental problems when breakout eventually occurs as a result of the riverbed being elevated above the surrounding alluvial fan surface
rainfall conditions preceding an intense or series of intense or prolonged rainfalls or the formation and subsequent failure by erosion of a landslide dam (s)
note the SH6 cross section monitored by NIWA for OICL is located at the SH 6 bridge site whereas the CCSL CS 13 is located just downstream of that bridge Further to that the OICL reduced levels are based on a reference bench mark level which is different to the Lyttelton Vertical Datum 1937 used by CCSL In order to compare the results of these two surveys it is necessary to add a correction of 144m to the NIWA Datum before comparing the NIWA bed levels with the CCSL bed levels
The CCSL surveys of the river in June 2008 and March 2011 show two distinct gradients the first between CS 11 to CS 16 and the second between CS 16 and CS 22 (Fig 2) Between June 2008 and March 2011 the reach CS 11 ndash CS 16 steepened from an average gradient of 00103 to 00111 (approximately an 8 increase) whereas the reach CS 16 to CS 22 steepened from 00106 to 00108 (approximately an 2 increase) These changes in gradient will reflect in a reduction in average water depth and an increase in average section velocity for any given flow covering the full riverbed width and with the channel roughness remaining constant A 4 reduction in average depth will occur in the reach CS 11 to CS 16 and a 1 reduction in average depth in the reach CS 16 to CS 22 For example for an average flow depth of 15m reductions of 60mm occur in the reach CS 11 to CS 16 whereas in reach CS 16 to CS 22 the reduction would be 15mm These modest gains will not materially offset the deleterious effects of aggradation that is raising the mean bed levels in the reach CS 11 ndash CS 16 by 10 to 30 times that resulting from an increase in gradient The same is true of the reach CS 16 to CS 22 but to a lesser extent (4 times)
Reflecting on the implications for lateral constraint of a braided bed load dominated river such as the Waiho River at Franz Josef as posited variously by McSaveney and Davies (2000) and McSavenay Davies and Clarkson (2003) it needs to be understood that the works which may have influenced and subsequently contributed to the level of aggradation now being experienced on this river were not appreciated at the time that the earliest works were constructed In fact the type and form of the protection works being constructed on the Waiho River at that time was standard practice for river works of this type throughout New Zealand
Since that time further works of a similar nature have been undertaken both to repair works damaged during flood events and to upgrade (raise re-align reconstruct) and extend existing stopbanks to offset the deleterious effects of riverbed aggradation compromising stopbank freeboards These works have been accompanied by the construction of rock stub groynes on the riverside toe of the stopbanks to mitigate against lateral bank erosion of the stopbanks The primary driver for these upgrades have been to protect SH 6 on the true left bank of the Waiho River the Franz Josef Glacier access road and to a lesser extent the West Coast Regional Councilrsquos special rating district areas on the southern side of the river An examination of the NZTA resource consent application (August 2009) lodged in respect of stopbank upgrades of the form described and their assessment of environmental effects (Sec 70) in particular Sec 72 it is clear that their focus was on the need to contain flood flows in the river in the face of on-going riverbed aggradation (SH 6 Bridge to Canavans Knob reach) that was eroding freeboard and hence elevating the risk of flooding to SH 6 on the south side of the river below the SH 6 bridge This document gives no indication that consideration was given to why the river was aggrading in this way notwithstanding the considerable and detailed research undertaken on that subject in particular the extent that boundary constraint plays in influencing aggradational trends in bed load dominated rivers [Carson amp Griffiths (1987) Rouse Day amp Davies (2000) McSaveney amp Davies (2000 2006)
20 21 Waiho RiveR optimal FutuRe management Waiho RiveR optimal FutuRe management
Chapter 4 CatChment proCesses and sedIment sourCes supplyIng the waIho rIver alluvIal fan
chaptEr 5
Present Condition oF tHe WaiHo riVer
The GEML (2002) report cites an estimate made by CCSL of nett aggradation in the river system between cross section 10 (WaihondashCallery River confluence) and cross section 23 (just downstream of the Waiho Loop) of 1700000 m3 between the Jan 2002 and June 2008 surveys A similar exercise undertaken by RJ Hall of RJ Hall and Associates Ltd (RJHAL) based on the June 2008 and March 2011 surveys indicate that a further 170000 bulk m3 has accumulated in this reach (Table 1) More significantly though if the assessment is made from CS 10 to CS 21 ie from the WaihondashCallery River confluence to the upstream end of the Waiho Loop the picture is quiet different Between the 2002 and 2008 surveys it is estimated that some 076 bulk m3 of material was stored on the fan between CS 10 and CS 21 (average annual accumulation rate 118000 m3 yr) and between 2008 and 2011 1490000 bulk m3 (average annual accumulation rate of 540000 m3 yr) An examination of OPUS International Consulting Ltd (OICL) mean bed level record at CS 3 (ie at the SH 6 Bridge) shown on Fig 2 indicates that the bulk of this change may in fact have occurred between March 2009 and March 2011 Of significance some 47 of this aggradation occurred between CS 17 (lower end of the Franz Josef stopbank true right bank where SH6 turns north east away from the river) and CS 21 (a short distance upstream from where the river turns and begins its approach to the gap between Rata Knoll and the Waiho Loop) Fig 4 also shows the changes in volume stored per unit length of riverbed between 1993 and 1999 (Fig 6 of McSaveney amp Davies [2000])
1000000
800000
600000
400000
200000
00000
-200000
-400000
-600000
-800000
-1000000
-120000010000 2000 3000 4000 5000 6000 7000
thalweg Distance From CS 10 ( m )
volu
me
chan
ge
( m3
) K
m a
lon
g t
hal
weg
Column AB
Column Y
Column O
Fig 4 Waiho River at Franz Josef CS 10 to CS 23 Volumetric Rate of Change along the Thalweg Jan 2002 to June 2008 and June 2008 to March 2011 surveys including TRH Davies Data 1993 to 1999
A comparison between the changes that took place between 1993 and 1999 and the changes that have occurred now ie 2008 to 2011 show similar trends although it is noted that there are some clear differences apparent Upstream of the SH 6 bridge there has been significant increase in the rate of aggradation in recent times The 400m reach extending immediately downstream from the bridge remains more or less unchanged but below that point in the reach through to Rata Knoll the situation has changed significantly Whereas in the period 1993 to 1999 there was net degradation evident in the reach between the
22 23 Waiho RiveR optimal FutuRe management Waiho RiveR optimal FutuRe management
Chapter 5 present CondItIon of the waIho rIver Chapter 5 present CondItIon of the waIho rIver
Fig 5B Waiho River at Franz Josef CS 18 Corridor Plots based on the January 2002 June 2008 and March 2011 River Surveys
0 20 40 60 80 100 120
128
126
124
122
mea
n B
ed l
evel
( m
)
Row 9
Row 22
Row 39
elapsed time from Jan 2002 ( months )
Fig 5C Waiho River at Franz Josef CS 19 Corridor Plots based on the January 2002 June 2008 and March 2011 River Surveys
0 20 40 60 80 100 120
120
115
110
mea
n B
ed l
evel
( m
) Row 10
Row 23Row 40
elapsed time from Jan 2002 ( months )
Fig 5D Waiho River at Franz Josef CS 20 Corridor Plots based on the January 2002 June 2008 and March 2011 River Surveys
In considering these results ie 700000 m3 fan aggradation (January 2002 - June 2008) and then 1500000 m3 fan aggradation (June 2008 ndash March 2011) between CS 10 and CS 21 and the fact that aggradation is now well advanced between Canavans Knob and the Waiho Loop and is evidently extending downstream from the Waiho Loop with mean bed levels now close to at or above the natural ground level on the true right bank at and downstream of the Oxidation Ponds through to the Waiho Loop the following preliminary conclusions are drawn
1 Mean bed levels on the true right bank of the active braided bed of the Waiho River between the Oxidation Ponds (CS 19) and the Waiho Loop (CS 20) are such that the bed levels is at or marginally higher than the berm area on that side of the river Further to that a more detailed examination of CS 19 to CS 20 show a pronounced cross fall over the riverbed in this reach extending from the true left bank towards the true right bank an effect that has been present and maintained from the 2002 riverbed surveys through to the 2011 survey These trends presently predispose the river to overflow its true right bank in this reach during floods
2 Overflows from the Waiho River in the vicinity and down stream of the Oxidation Ponds through to the Waiho Loop on the true right bank must be anticipated in flood events at least as low as annual exceedence probability of 20 (1 in 5 yr recurrence interval) noting that overflows towards the Tatare River occurred in this area in the December 2010 flood
Oxidation Ponds and the Waiho Loop that trend has now completely reversed Aggradation in this reach is now occurring to varying degrees at rates per unit thalweg length two to three times that of the period 1993 ndash 1999 with aggradation now evident extending over the full length of the river from the WaihondashCallery River confluence through to just downstream of the Waiho Loop
The changes that occurred between the 1993 ndash 1999 period and the 2008 ndash 2011 period indicate that the alluvial fan is now aggraded over its length from the WaihondashCallery River confluence to at least immediately below the Waiho Loop This means that the Waiho River alluvial fan is now prograding within the artificial boundary constraints present on the true left bank through to and downstream of the Waiho Loop and on the true right bank from the SH 6 bridge through to the Oxidation Ponds
An analysis of mean bed levels in the reach extending from CS 16 to CS 21 shows a pronounced cross fall on the river extending from the true left bank towards the true right bank (Fig 5A to 5D inclusive) This analysis has been made by splitting each of the cross sections used in the analysis into three equal length sections and calculating mean bed levels for each of these sub ndash section widths Further to that CS 17 CS 19 and CS 20 have been corrected for skew by rotating each of these cross sections in a clockwise direction eg 63ordm (CS 17) 111ordm (CS 19)and 101ordm (CS 20) and then adjusting the sub section mean bed levels to reflect the effects of the rotations This step was taken in order that the modified cross section was orientated approximately normal (ie at right angles) to the rivers overall flood flow direction What these plots clearly show is the true left subndashwidth sections being elevated above both the central and true right subndashwidth sections this clearly indicates the presence of the cross fall and its persistence from the January 2002 through to the March 2011 surveys This situation will have the effect of predisposing the river to move towards the true right bank and overflow in the reach between CS 19 (Oxidation Ponds) and CS 20 (upstream side of Waiho Loop) and contribute to the risk of avulsion of the Waiho River into the Tartare River whilst these trends prevail
0 20 40 60 80 100 120
140
135
130
mea
n B
ed l
evel
( m
)
Row 7
Row 20
Row 37
elapsed time from Jan 2002 ( months )
Fig 5A Waiho River at Franz Josef CS 17 Corridor Plots based on the January 2002 June 2008 and March 2011 River Surveys
0 20 40 60 80 100 120
140
135
130
125
mea
n B
ed l
evel
( m
)
Row 20
Row 8
Row 38
elapsed time from Jan 2002 ( months )24 25 Waiho RiveR optimal FutuRe management Waiho RiveR optimal FutuRe management
Chapter 5 present CondItIon of the waIho rIver
chaptEr 6
reVieW oF tHe CatCHMent Hydrology
A review of the catchment hydrology has been undertaken using the NIWA record from the Whataroa River hydrometric site at SH 6 (1985 ndash 2011) catchment area 445 Km2 The Waiho River at SH 6 has a catchment in the order of 170 Km2 An EV1 (Gumbel) analysis was carried out on the Whataroa River using the annual series maxima for that river and from the flood frequency estimates for the Waiho River flood estimated on the basis of the ratio of the catchment area of the Waiho River to that of the Whataroa River raised to the power of 08 The Whataroa River catchment was chosen because of its proximity to the Callery River they have a common boundary both are clad in a combination of forest and subalpine vegetation similar lithologies and lie on the western side of the Main Divide Estimates have also been made to take into account projected climate change effects through to 2040 using the MFE (2006) procedure An increase in temperature ranging between 14ordmC and 19ordmC was used (cf Table 2 MFE) and a 24 hr to 48 hr storm duration rainfall percentage increase of 75 ordmC to 80 ordmC (cf Table 7 MFE) which suggests storm rainfall increases of between 10 and 15 These percentages have then been applied directly to the EV1 flood frequency estimates derived from the Whataroa River at SH 6 to provide an indication of possible future changes in flood frequency values
The results of this assessment are set out in Table 2
recurrence interval t
(yrs)
Qpk(eV 1)
(cumec)
Qpk + 10(cumec)
Qpk + 15(cumec)
23 1230 1350 1400
5 1550 1700 1800
10 1640 1800 1900
20 1730 1900 2000
50 1820 2000 2100
100 1910 2100 2200
note Waiho River estimates derived from an EV 1 analysis of Whataroa River at SH 6 which were scaled by the area factor [A waiho A whataroa]⁰⁸
TABle 2 Flood Frequency Estimates Waiho River at SH 6
3 That progradation of the fan below Canavans Knob through to and beyond the Waiho Loop will persist if the sediment supply rates to the fan observed since 2002 persist
4 The present flood capacity of the Milton and Otherrsquos stopbank is provisionally assessed as marginal in a flow of 1850 cumec (aep 5 ie 1 in 20 year recurrence interval) based on GEML hydraulic modeling (n = 0037) adjusted for increases in mean bed level since that work was completed (see further note below)
5 Given points 1 And 2 above the prospect of an avulsion progressively developing into the Tatare River over the true right bank at and downstream of the Oxidation Ponds is now a very real prospect
6 An avulsion into the Tartare River system by the Waiho River (ie the Tatare River captures the Waiho River downstream of Canavans Knob) is likely to progress relatively slowly at first and will be accompanied by an increase in aggradation within the active bed of the Waiho River where it presently flows through and beyond Rata Knoll This will occur as a portion of the flood flows approaching this critical reach is systematically bled off the Waiho River and spills into the Tatare River This situation may result in a reduction in flood carrying capacity in the reach where the Milton and Otherrsquos stopbank is located leading to overtopping during floods provisionally assessed in excess of an aep 10 (ie 10 year recurrence interval flow 1600 cumec)
7 The GEML hydraulic modeling results of July 2008 indicated that much of the stopbanking along the true right bank below SH 6 through to the Oxidation Ponds had been substantially compromised by river aggradation such that it would not contain a flood discharge of 1850 cumec with 1m of freeboard An analysis of the March 2011 CCSL survey indicates that the situation is now worse as a result of increases in mean bed levels that vary from 118m at CS 14 (airstrip) through to 055m at CS 18 (Oxidation Ponds) [note CS = cross section]
note The GEML hydraulic modeling study used a riverbed roughness of ldquonrdquo varyingbetween 0030 to 0040 (predominantly 0037) and arrived at those values by a combination ofreferencetoldquoRoughnessCharacteristicsofNZRivers(DMHicksandPDMason1991)site inspections aerial photography and a calibration model run They noted that their calibration run was approximate and largely based on anecdotal evidence which was not fully substantiated They tested their model by running it with roughness increased by 20 (ie predominantly 0044) and this gave rise to increases in flood level of between 006 and 022m It is the Authors experience that roughness values in the order of 005 to 006 are more realistic in rivers of this kind given that bed form resistance is almost certainly present under live bed conditions Live bed conditions will result in both the entrainment and transport of coarse sediment in the flow and as bed load the latter resulting in bed forms (undulations on the floor of the river bed formation translation destruction and reformation of gravel bars etc) It is anticipated that the onset of live bed conditions will occur over a significant proportion of the Waiho Riverbed when flows reach 450 to 500 cumec (Clausen Plew 2004) and will be well established with flows in excess of 1000 cumec In considering the output from these models it needs to be appreciated that replicating known flood profiles on the river in full flow with live bed conditions present and no real certainty of what the flood flow actually is at that time places real constraints on the models validity particularly as a predictive tool Notwithstanding that limitation of necessity some reliance needs to be placed on the output of such models to give guidance on the possible form of the flood profiles that could occur at different flood discharges However this must be tempered by the knowledge that rivers of this kind under live bed conditions can behave in unpredictable ways
26 27 Waiho RiveR optimal FutuRe management Waiho RiveR optimal FutuRe management
Chapter 6 revIew of the CatChment hydrology
chaptEr 7
CoMMentary on riVer ProteCtion Works
As has been noted earlier in this report a range of river protection works have been constructed on this river at various locations over an extended period of time In general they have been designed to either constrain the lateral migration of the river in order to try and mitigate against lateral erosion of natural banks and man made stopbanks and or to contain flood flows The erosion prevention structures include rock riprap stub groynes aligned at 900 to the natural bank or stopbank alignment or on curves at 90ordm to the tangent to the curve Typically these structures are some 15m in length and evenly spaced at about 6 times the length (Glacier Access Road and true left bank stopbank below the Backpackers) to 35 times their length (Backpackers to Canavans Knob stopbank) The WCRC stopbank on the true right bank downstream of SH 6 has heavy rock cladding on the riverside of the bank to provide protection against lateral scour The stopbanks are constructed in heavily compacted sandy gravels sourced from the river Typically they have batters 2H 1V and varying crest widths but typically 5 to 6 m As the river aggrades freeboards on the stopbanks reduce below their intended design requirements (WCRC stopbanks eg 1m) and adjustments are necessary to restore freeboard
In the reach upstream of SH 6 the Franz Josef Glacier access road presents a unique problem In this reach the river is confined by natural terraces and stub groynes (true right bank) and the access road and stub groynes on the true left bank As the river aggrades in this reach the access road needs to be raised to maintain freeboard Inevitably when the road is raised the result is further encroachment into an already confined reach At CS 12 for example the natural width before the access road was constructed is estimated to have been somewhere in the order of 280m With the construction of the road this width has reduced to approximately 250m and the presence of rock rip rap stub groynes has reduced the active river width to more like 230m in effect a width reduction of some 15 to 20 The SH 6 bridge waterway is similarly affected with the natural width reducing from about 250m to 145m a reduction in active width of 42 The SH 6 Bridge is at the downstream end of the WaihondashCallery River transfer reach and in effect at the head of the Waiho River alluvial fan The construction of river protection works (stopbanks rock rip rap stub groynes) at and downstream of the SH 6 Bridge has in effect constrained the river in such a manner that the natural apex sector angle of the alluvial fan has been systematically reduced from 90⁰ to about 30⁰ The consequences of these modifications to the natural river form and the associated landscape is that those parts of the alluvial fan comprising the forested and farmed land through to Docherty Creek on the true left bank and the Franz Josef Township on the true right bank including the farmed land downstream of the Township are no longer accessible by the river for the purposes of storing sands and gravels during an aggrading phase
The work of McSaveney and Davies (2000 2006) and McSaveney Davies and Clarkson (2003) suggests that the constraining of this steep braided bed load dominated river by river control structures has on balance and more likely than not significantly contributed to the aggradation that has and is now being observed on this river The Waiho River is not unique in that regard a similar situation is evident on the North Ashburton River in mid Canterbury In both cases the active bed is now elevated well above the natural ground levels outside
28 29 Waiho RiveR optimal FutuRe management Waiho RiveR optimal FutuRe management
Chapter 7 Commentary on rIver proteCtIon works
chaptEr 8
engineering issues
The steady increase in bed levels within the active bed of the Waiho River from its confluence with the Callery River through to beyond Rata Knoll has meant that bed levels are now higher than the natural groundline on the landward side of the stopbanks by some metres and this difference is increasing This trend must be expected to continue in the short to medium term (1 to 10 years) That assumption is made on the basis that sediment and water supply rates to the fan in that time span will remain more or less as they have been over the preceding 20 to 30 years The practice to date exercised by both NZTA and the WCRC is to periodically increase the height of the stopbank crest in order to maintain freeboards This practice does not address the problem of increasing mean bed levels as such it simply endeavours to preserve the design flood carrying capacity of the system being managed It should also be noted that it does not address the core issue of the river response to artificial constraint of the active braiding riverbed boundaries in a bed load dominated river
Stopbank failures occur from time to time in most river systems where they have been constructed This can be the result of overtopping either as a result of diminishing freeboard caused by local or more general aggradation within the constrained river system (the Waiho River situation) where inadequate provision has been made for super-elevational effects around bends with the river in high flood (or a combination of both of these effects) or through lateral bank erosion suffosion piping or seepage induced face instability or as a result of crest settlement resulting from strong ground motion (eg Waimakariri River stopbanks September 2010 and February 2011 earthquakes) Lateral bank erosion is more likely to occur on the falling limb of a flood hydrograph as water levels drop average velocities fall off and the bed load sediment transport capacity reduces
At some point during the recession gravel bars will begin to form in the bed and sinusoidal braided flow patterns re-emerge as a result Often when this happens strong flow concentrations can develop that impinge sharply on the stopbank riverside toe When that occurs riprap facing if present can be stripped stub groynes damaged or destroyed and or the stopbank proper eroded If river erosion is sufficiently intense at such locations and persists for long enough the stopbank may be breached With well constructed stopbanks (eg those composed of heavily compacted sandy gravels on good foundations with batters in the order of 2H 1V or flatter and crests of 4m plus) overtopping can be sustained for upwards of 2 hours before breaching occurs Typically failure occurs as a result of erosion at the landward toe which then headcuts through the embankment the higher the stopbank the more aggressive this action is Overtopping failure is likely to be catastrophic in nature whereas lateral bank failure less likely to be given that in the latter case lower water levels (falling stage) conditions are most likely present which tends to limit the outflows that will occur through the breach both in terms of size and duration
note the particular situation and failure consequences of stopbanks where the riverbed is elevated above the surrounding land as now occurs on the Waiho River is considered later in this report cf Sec 90]
In reviewing these comments in the context of the Waiho River stopbanks it is concluded that overtopping and or lateral bank erosion are the two situations which are most likely to cause stopbank failure and in some cases this could result in catastrophic failure The
the stopbanks In the Waiho River case these changes are occurring rapidly and although episodic nevertheless have persisted for some 20 to 30 years and should be expected to continue to persist into the short to medium term (1 to 10 years)
This disparity between natural ground levels on the outside of the stopbank with steadily increasing mean bed levels on the river side of the banks presents a number of engineering problems which need to be addressed
30 31 Waiho RiveR optimal FutuRe management Waiho RiveR optimal FutuRe management
Chapter 8 engIneerIng Issues
chaptEr 9
stoPbank Failure
Stopbank failure along the true left bank upstream of SH 6 would result in loss of the Glacier Access Road and flood damage to SH 6 the Motels Back Packers and any dwellings in its path down stream The southern approach and abutments to the SH 6 Bridge could be damaged in this scenario
Stopbank failure of the structure (s) between SH 6 and Canavans Knob could also affect SH 6 the Motels and Back Packers depending on where the failure occurs Of equal concern is that it might result in an avulsion of the Waiho River through to Dochertyrsquos Creek The double parallel stopbank system presently available in this reach notwithstanding the elevation of the riverbed now well above the natural groundline along SH 6 is a reasonable protection against such an outcome but only if freeboards are maintained and adequate protection against lateral bank erosion is maintained If such an avulsion were to occur there will be major difficulties to overcome to return the river to within the stopbanks Substantial erosion and deposition will almost certainly occur and SH 6 will be out of action until such time repairs can be affected
Overtopping and or lateral erosion of the Canavans Knob to Rata Knoll and the Milton and Otherrsquos stopbanks would result in breaching flows coursing through to Dochertyrsquos Creek damage to SH 6 and flooding through the Lower Waiho Special Rating District area As with the SH 6 bridge to Canavans Knob stopbanks the elevational difference between the riverbed and the surrounding ground outside the stopbank may give rise to an avulsion as well Again the consequences of such an outcome will be great and major difficulties (and cost) experienced in returning the river to its former course and trying to prevent a repeat
Overtopping and or lateral bank erosion on the true right bank below SH 6 will result in substantial damage to parts of the Franz Josef Township loss of the airstrip and almost certainly destruction of the oxidation ponds depending on the location nature and extent of the breaches The consequences of avulsion as described for breaches of the true left stopbank must also be considered here
Stopbank failure can also occur as a result of piping suffusion consolidated settlement of weak foundation material and slumping (ie aseismic failures) and or through the effects of crest settlement as a result of strong ground motions during earthquakes (ie seismic failures) Failure can be either catastrophic or non-catastrophic Catastrophic failures typically occur when a stopbank overtops and fails rapidly whereas non-catastrophic failures occur when these conditions are absent but the stopbank efficacy has never the less been compromised eg suffosion results in flood water leaking through the embankment during high flows where lateral bank erosion damages the stopbank of a flood recession without necessarily breaching the embankment and where crest settlement occurs during earthquakes when the river is not in flood
A more detailed description of these types of failure mechanisms is given in Appendix 1
materials used in their construction the manner in which they have been constructed and the foundations on which they have build suggest that piping failure is highly unlikely Suffosion if it occurs and that is considered reasonably likely with these types of stopbanks will be more of a nuisance that a direct threat to stopbank stability
Clearly in times of flood when high hydraulic gradients are present through the stopbanks because riverbed and hence flood levels are now raised well above the natural groundline outside and on the landward side of the stopbank seepage flow with or without suffosion being present is likely to be readily evident during floods and possible also post flood as shallow groundwater within the elevated riverbed falls Evidence of this phenomena presently exists eg adjacent to the motels on the true left side of the river downstream from the SH 6 bridge and possibly also between the parallel stopbank system extending down to Canavans Knob also on the true left bank of the river
32 33 Waiho RiveR optimal FutuRe management Waiho RiveR optimal FutuRe management
Chapter 9 stopbank faIlure
chaptEr 10
otHer aVulsion tHreats
Two other avulsion threats have been identified in this investigation the first through a low saddle area in the forest on the true right bank of the Waiho River located some 150 to 200m upstream of the SH6 bridge true right abutment and the second across the true right bank at or down stream of the Oxidation Ponds into the Tatare River as discussed earlier in this report
101 Franz Josef township overflow Corridor
The low saddle has an elevation of RL 1600 m (CCSL survey June 2011 Appendix 3) or so which is presently some 66m higher than the mean bed level at that location as extrapolated from the March 2011 mean bed levels calculated at CS 12 and CS 13 Using the calculated mean bed level differences between the June 2008 and March 2011 CCSL surveys on CS 12 and CS 13 an aggradation rate of between 07 and 10myear is derived for this reach adjacent to the low saddle area This has been calculated on the basis that 197m of aggradation occurred between the two surveys and that that change took place either between June 2008 and March 2011 (33 months) or more likely with reference to the OICL SH 6 bridge mean bed level records between March 2009 and March 2011 (24 months) On that basis if the sediment and water supplies to the reach between the WaihondashCallery River confluence and the SH 6 bridge remain more or less as they have over the past 20 to 30 years and the aggradation rates referred to above are reasonable reflections on likely future rates in this critical reach in the short to medium term (1 to 10 years) then overtopping through the low saddle into the Franz Josef Township via this potential overflow corridor may occur with in the next 6 to 10 years If it were allowed to persist an avulsion could conceivably occur (the consequences) for which would be materially worse than flooding and deposition from earlier overflows This scenario would result in the loss of SH 6 in the township Clearly if for any reason erosion rates were to increase significantly from those presently being experienced or any other reason resulting in an increase in the background aggradation rates in this reach used in this calculation then the situation being described could conceivably occur sooner that the 6 to 10 year time span estimated above The converse is also true A reduction in aggradation rates could prolong the initiation of overflows the prospect of degradation occurring which might effectively remove the threat while possible is not considered realistic given the history of aggradation that has been observed and the circumstances that would be necessary on the whole active fan surface to allow this to happen Although gravel extraction could be employed as a short term measure to alleviate the threat the cost of maintaining freeboards by these means on a more permanent basis is considered likely to be unsustainable in the short to medium term and an unrealistic expectation Compounding this approach would be what to do with the excavated material and the knowledge that it Is likely that any material excavated would within a very short time frame be replaced by the river from upstream
On that basis it is opined that the only realistic remedy for preventing this outcome assuming Franz Josef township is to remain in its present location in the foreseeable future would be to construct a suitably robust structure across this potential overflow corridor This would require a significant disturbance to the native forest at that location In coming to this conclusion the caveats that apply from the McSaveney and Davies (2000) and McSaveney Davies and Clarkeson (2003) work are acknowledged and are likely to apply to this suggested
34 35 Waiho RiveR optimal FutuRe management Waiho RiveR optimal FutuRe management
Chapter 10 other avulsIon threats
chaptEr 11
Future ManageMent oPtions
In considering the assessment made here the following options present themselves
1 Do nothing or
2 Status quo or
3 Acceptance of avulsion to the Tartare River or
4 Boundary relaxation
111 the do nothing option
The do nothing option will inevitably lead to overtopping during a flood or floods of any stopbank where freeboards have been eliminated through ongoing bed aggradation That option clearly is not likely to be tenable for NZTA (SH 6 and SH 6 bridge threat) nor the Department of Conservation (Glacier Access Road) and accordingly it is anticipated that these Agencies will continue to raise the stopbanks the Glacier Access Road and the SH 6 Bridge and its approaches in order to preserve these routes If the stopbanks under the management of the WCRC are not similarly adjusted to maintain freeboard then stopbank failure with widespread flooding of the Waiho River Flats the land between the Waiho River and Docherty Creek and parts of Franz Josef and its environs will ultimately occur relatively soon (within 10 years) The area(s) affected in this way will be determined on the basis of where overtopping (or lateral erosion) first occurs This option on the basis of the present evidence indicates strongly that an avulsion into the Tartare River from CS 16 to CS 21 is highly probable in the short to medium term
112 the status Quo option
The status quo option is most probably the one likely to be favoured in the short term both by NZTA Department of Conservation and the WCRC Special Ratings Districts although with respect to the latter the ongoing affordability of that option is something that needs to be addressed This entails continuing to upgrade stopbanks and associated river protection measures to maintain freeboard It is opined that for both options and the do nothing option serious consideration should be given to abandoning rock rip rap spur groynes at least in the reach upstream of SH 6 in favour of rock rip rap cladding in order to preserve as far as practicable the waterway area that can be utilised in order to minimise the active braid in this reach This will entail founding the cladding as the WCRC has done at depth in the bed to minimise the likelihood of scour damage at the toe in major floods An assessment needs to be made of what this depth ought to be having regard to accepted analytical methodologies local knowledge and experience It is accepted that this is not likely to be a long term solution for all parties given that affordability and growth of the hazard will occur as stopbank heights are systematically raised and the elevational difference between the floodplain and the constrained aggrading riverbed gets progressively larger
113 acceptance of avulsion to the tartare river
Regardless of whether the do nothing or status quo options are chosen in the medium to long term if not sooner without human intervention by way of the construction of a
response However on balance it is likely that the works that confine the river already are implicated and what is being proposed will not materially alter what has already occurred and is persisting
102 tatare overflow Corridor
As has previously been described the aggradation which has occurred in the Waiho River active braided riverbed downstream of CS 16 of the CCSL surveys has raised mean bed levels to and possibly higher than the natural banks of the rivers true right berms from the Oxidation ponds through to the Waiho Loop Cross falls are evident on cross sections through this reach which fall towards the true right bank eg CS 16 00055 CS 19 00057 Further to that the land falls in a direct line from the Waiho River true right bank some 49m over a distance of 3130m into the bed of the Tatare at the point where the Tatare begins its cut through the Waiho Loop A similar situation exists from CS 21 where a fall of 10m occurs over a distance of some 890m The fall between these points is estimated at 00105 (CS 23 to Tatare) and 00156 (CS 16) By way of example if we assume a break out occurs around CS 20 into the Tatare a fall of 36 m over 2350m is available overland (s = 0015) If the initial overflow width is in the order of 300m and the hydraulic roughness is set at 008 05m average overflow depth gives a spill discharge in the order of 145 cumec at 10m overflow depth for the same width the overflow discharge becomes 460 cumec Average velocities for the 05m depth will be about 1ms and for the 10m overflow depth 15ms One must expect higher velocities than this because there will be areas where existing swales occur and depths are greater Greater depth results in higher velocities Surface scour will take place where velocities get above 15 ms and headcutting back from the Tatare true left bank must be anticipated as overflows begin spilling into that watercourse If this situation is allowed to occur ie no intervention (stopbanks) take place then over time as this situation is repeated the headward migration of channel erosion back towards the Waiho River from the Tartare River will ultimately lead to either partial or more likely complete capture of the Waiho River by the Tartare River When that happens the present Waiho River course around the south western end of the Waiho Loop will be abandoned although it may still carry flow for a period following capture until full capture is complete At this point very substantial volumes of gravel will have been eroded from the area between the two rivers along the avulsion path and headward erosion will progress upstream in the Waiho Riverbed as the new channel develops Just how fast this process will be and what alignment across the area between the Tatare and Waiho River it takes and where it cuts headwards in the Waiho River is problematic at this point What is certain is that it will have a profound affect on both rivers and quite possibly lead to either the elimination of Lake Pratt or alternatively its growth Aggradation will also occur in the Tartare River However to what extent and how far upstream that progresses has not been assessed at this time Following on from that significant changes in the bed of the Waiho River below the Waiho Loop will be inevitable and just what those will be what their magnitude is and where they are likely to be located has not been assessed at this time
36 37 Waiho RiveR optimal FutuRe management Waiho RiveR optimal FutuRe management
Chapter 11 future management optIons
chaptEr 12
ConClusions
Reflecting on the original brief the following comments are made based on the findings of this investigation accepting that this amounts simply to the Authors view and should not be interpreted as reflecting that of the WCRC NZTA Department of Conservation or any other interested or affected party
1 Keeping the river within its banks is considered a realistic option in the short (1-5 yrs) but inevitably it will have cost and structural stability and hazard growth implications which must be addressed Unless it involves interventions to avert an avulsion of the Waiho River into the Tartare River then capture of the Waiho River by the Tatare now seems inevitable in the short to medium term (1 to 10 yrs) This will almost certainly require within the next 5 to 10 years the construction of a short stopbank on the true right bank of the Waiho River upstream of the SH 6 bridge to prevent overflows from the Waiho River into the Franz Josef township via a low saddle area between the township and the Waiho River If there is an increase in sediment supply which is greater than that observed over the last 20 to 30 years or so then this timeframe will shorten Conversely an easing of supply may well slow aggradation rates in this reach effectively delaying this outcome The likelihood of a degradation cycle occurring and persisting such that it eliminates this risk is not considered realistic in the medium term (10 to 50 years) unless an avulsion into the Tartare River occurs which ultimately lowers the bed levels in this reach to sufficiently remove the threat
2 It hardly needs saying but the management of this river now in the interests of minimising risk to life and property is an extraordinarily complex and difficult exercise Inevitably there must be losers The prospect of an avulsion by the Waiho River into the Tatare looks increasingly probable if not imminent If steps are taken to prevent it the aggressive aggradation now evident over the whole fan surface within the present manmade boundary constraints from the WaihondashCallery River confluence to below the Waiho Loop can be expected to persist if not worsen It is doubtful that maintaining the status quo option indefinitely is in fact possible The costs are likely to be unsustainable for all or some of the parties involved and ultimately the river might anyway have the final say regardless of the best efforts of those charged with maintaining the flood protection systems In light of this it is opined that the way forward may be to maintain the status quo in the short term and carefully evaluate the consequences of an avulsion in order to minimise hazard (to people land and other property ecosystems and community well being) in preparation for an avulsion in the manner described herein
3 The notion that there is a slug of gravel within the Waiho riverbed between the WaihondashCallery River confluence through to and beyond the Waiho Loop that could be encouraged to move on is a misconception and misplaced The aggradation that has occurred on this surface is the result of wholly natural alluvial fan processes and is operating on a scale well beyond effective human intervention management There is good reason to conclude that past and continuing intervention in the form of active river boundary constraints has and still is influencing to an unspecified degree the gradational trends and outcomes now clearly evident
By way of example in order to restore channel capacity and avert an avulsion to the Tartare might require the excavation of gravel deposits off the bed of the river over the reach extending from the SH 6 bridge though to say the downstream end of Miltons and Otherrsquos stop bank a distance of some 5 to 55 km If this channel were constructed 400m wide and 15 m deep we would need to excavate some 3000000 bulk cubic meters of sand and gravel at a cost probably in the order of $10M to $15M That poses three important questions could
stopbank to prevent overflows to the Tatare in times of flood and in the expectation that water and sediment inputs to the fan and hence presently observed aggradation rates are maintained much as they have in the last 20 to 30 years an avulsion to the Tatare looks more certain than any time in the past 10 to 20 years That said is community acceptance of this option tenable In order to determine that a good deal more needs to be learned about how such a situation might progress what consequences could arise and to endeavour to determine realistic bounds on such effects if that is possible The work undertaken to date does not allow that and this must be attended to before this approach could be pursued as a deliberate management option notwithstanding the likelihood of it occurring regardless for the reasons outlined above In effect this would become a medium to long term strategy working in conjunction with the status quo option in the short term with the latter wholly or partially abandoned once the avulsion option is operative
114 boundary relaxation
The boundary relaxation option is not new This option was considered by the WCRC NZTA Westland District Council working party in 2000 [Evaluation of Options for the Management of the Waiho River Aggradation Threats RJ Hall et al (2000)] In effect what it requires is a deliberate action(s) to allow the river to re-occupy part of its natural alluvial fan surface presently unavailable as a consequence of the present boundary constraints along the true left bank from upstream of SH 6 through to the Waiho Loop and downstream If implemented this would require the relocation of a number of dwellings the relocation of SH 6 on the south side of the river the relocation or demolition of the Motel on the south bank and the Backpackers and the abandonment of extensive farmland between the Waiho River and Dochertyrsquos Creek
38 39 Waiho RiveR optimal FutuRe management Waiho RiveR optimal FutuRe management
Chapter 12 ConClusIons
chaptEr 13
aCknoWledgeMents
The Author wishes to acknowledge the assistance and insights provided by staff of the WCRC provided in the course of this investigation in particular the Chief Executive Chris Ingle and Messerrsquos Michael Meehan and Wayne Moen Acknowledgment is also extended to the staff of the Department of Conservation (Franz Josef ) NZTA Opus International Consulting Ltd (Greymouth) for their comments and making available photographic and survey information relevant to this engagement to the staff of the Westland District Council for their comments and to Drrsquos TRH Davies and M McSaveney for their comments and use of material from their 2002 5th International Gravel Bed River Symposium paper Further to that the Author wishes to acknowledge the survey work undertaken by Chris Coll Survey Ltd on this river and the willingness of Chris and Jan Coll and their staff in providing access to and comment on the various surveys of the river undertaken by themselves and others over the years without which this report would have been seriously limited Appreciation is also expressed to Kathy Walters of NIWA for assistance in providing hydrological information from their hydrometric sites at Hokitika Greymouth and Whataroa
RJ HallMIPENZ (Civil Geotechnical) CPEng Int PE (NZ)
RJ Hall Civil amp Associates Ltd
February 2012
resource consent under the Resource Management Act be obtained to execute and maintain work of that kind and scale where would the money come from to do it and where would the spoil go Further to that given the current aggradation rates and giving cognizance to the fact that it is impractical to get the river down to a narrow enough width to promote throughput to the extent that it will not aggrade the present annual aggradation rates would probably fill the channel in less than 2 years at which point one would have to start all over again As has been noted earlier in order to develop a self-sustaining channel one would need to replicate something akin to that presently available in the Callery Gorge That would require a deeper narrower channel heavily rock armoured well beyond anything presently being used and founded at least 5 to 6 m beneath the bed if not more It is opined that the costs of constructing and maintaining such a channel would be well beyond the reach of the Franz Josef community the WCRCrsquos Special Rating Districts NZTA and the Department of Conservation even if cumulatively they favoured the concept The only realistic alternative to a human intervention approach in the manner described above would be to allow the Waiho River to be captured by the Tatare which in time may well provide the relief sought However in saying that there will be unavoidable consequences if and when that situation arises and the riverbed deflation process that is likely to arise on the Waiho River alluvial fan as a consequence may not necessarily be confined to the present braided river bed That is an attendant risk that must be faced
40 41 Waiho RiveR optimal FutuRe management Waiho RiveR optimal FutuRe management
Chapter 13 aCknowledgements
appEndix 1
stoPbank breaCH MeCHanisMs
Piping failure arises where stopbanks have either been constructed in sands and silts or have been built over deposits comprising those types of soils Water seeping through the sand and silts when the river is in flood can erode out fines from the point where the seepage flows exit the embankment and or its foundation As this happens a pipe develops from the outside exit point and systematically erodes in a headward direction back through the embankment or foundation As the pipe develops (lengthens) the soil thickness along the seepage path through which the seepage is occurring upstream from the inward progressing pipe shortens and the hydraulic gradient driving the seepage steepens so the seepage flow increases This results in a steadily increasing (accelerating) flow and at some point the embankment collapses locally (slumps) allowing flows to overtop through the local reduction in crest level and breaching rapidly progresses from there Failure by this means is catastrophic
Suffosion occurs only in coarse grained cohesionless soils such as sandy gravels where seepage flows passing through the embankment and or its foundation under flood systematically erode out the fines leaving a residual coarse grained skeletal soil Failure of a stopbank and or its foundation under these conditions is unlikely to be catastrophic Typically it occurs as steady seepage flows coursing out of the lower third of the outside batter or at the batter toe itself and in that case quiet often as boils that emerge some distance out from the toe proper These outflows can be disturbing to witness but do not necessarily pose an immediate risk although localised sloughing of topsoil and grass cover on the outside batter may occur
Instability of the embankment outer batter capable of causing failure of the embankment proper (deep seated circular failure surfaces) require either poor foundation strength or over steep poorly compacted embankments constructed in weak materials where well established pheratic surfaces have developed through the embankment during a flood These types of failures should they occur will almost certainly be catastrophic Well constructed stopbanks on good foundations and constructed with batters 2H1V or flatter are not likely to fail in this manner because they have both adequate strength to resist such failure and the high compacted soil densities present result in moderate to low soil permeabilities which it turn impede the development of a full pheratic surfaces ie there is insufficient time during a flood for a full pheratic surface to develop In situations where an embankment has experienced prolonged high antecedent rainfall conditions prior to a flood and water content in the embankment is high as a consequence as this water draining through the core a pheratic surface may form but the stopbank design and construction described above normally provides a satisfactory safeguard against this type of failure
Strong ground motions during major earthquakes can result in crest settlement with or without liquefaction being present in stopbanks constructed in well compacted sandy gravels Under these conditions longitudinal cracks can appear in the crest running sub-parallel with the longitudinal direction of the crest For example for a typical stopbank well constructed on good foundations say of 3m height that experiences a M 8 earthquake with peak ground accelerations of say 05 longitudinal cracks of 100 to 200 mm width may appear and settlements of up to 15 of the stopbank height plus foundation depth could occur If we allow a foundation depth of say 2m then the crest settlement could be expected to be in the order of 75 to 100mm It should be apparent that damage of this kind does not
42 43 Waiho RiveR optimal FutuRe management Waiho RiveR optimal FutuRe management
appendIx 1 stopbank breaCh meChanIsms
appEndix 2
CHris Coll surVey ltd MarCH 2011 riVer bed surVey Plans
lead to catastrophic failure unless the dam remains in a damaged state for a period of time after the earthquake unrepaired and a flood event subsequently occurs capable of causing full or partial failure
44 45 Waiho RiveR optimal FutuRe management Waiho RiveR optimal FutuRe management
appendIx 2 ChrIs Coll survey ltd marCh 2011 rIver bed survey plans appendIx 2 ChrIs Coll survey ltd marCh 2011 rIver bed survey plans
46 47 Waiho RiveR optimal FutuRe management Waiho RiveR optimal FutuRe management
appendIx 2 ChrIs Coll survey ltd marCh 2011 rIver bed survey plans appendIx 2 ChrIs Coll survey ltd marCh 2011 rIver bed survey plans
48 49 Waiho RiveR optimal FutuRe management Waiho RiveR optimal FutuRe management
appendIx 2 ChrIs Coll survey ltd marCh 2011 rIver bed survey plans appendIx 2 ChrIs Coll survey ltd marCh 2011 rIver bed survey plans
50 51 Waiho RiveR optimal FutuRe management Waiho RiveR optimal FutuRe management
appendIx 2 ChrIs Coll survey ltd marCh 2011 rIver bed survey plans appendIx 2 ChrIs Coll survey ltd marCh 2011 rIver bed survey plans
52 53 Waiho RiveR optimal FutuRe management Waiho RiveR optimal FutuRe management
appendIx 2 ChrIs Coll survey ltd marCh 2011 rIver bed survey plans appendIx 2 ChrIs Coll survey ltd marCh 2011 rIver bed survey plans
54 55 Waiho RiveR optimal FutuRe management Waiho RiveR optimal FutuRe management
appendIx 2 ChrIs Coll survey ltd marCh 2011 rIver bed survey plans appendIx 2 ChrIs Coll survey ltd marCh 2011 rIver bed survey plans
56 57 Waiho RiveR optimal FutuRe management Waiho RiveR optimal FutuRe management
appendIx 2 ChrIs Coll survey ltd marCh 2011 rIver bed survey plans appendIx 2 ChrIs Coll survey ltd marCh 2011 rIver bed survey plans
58 59 Waiho RiveR optimal FutuRe management Waiho RiveR optimal FutuRe management
appendIx 2 ChrIs Coll survey ltd marCh 2011 rIver bed survey plans
appEndix 3
CHris Coll surVey ltd June 2011 WaiHo busH bloCk
60 61 Waiho RiveR optimal FutuRe management Waiho RiveR optimal FutuRe management
appendIx 3 ChrIs Coll survey ltd June 2011 waIho bush bloCk appendIx 3 ChrIs Coll survey ltd June 2011 waIho bush bloCk
62 63 Waiho RiveR optimal FutuRe management Waiho RiveR optimal FutuRe management
appendIx 3 ChrIs Coll survey ltd June 2011 waIho bush bloCk
appEndix 4
reFerenCes
1 Influence of Channel Width on Bed Load Transport Capacity MA Carson and GA Griffith ASCE Journal of Hydraulic Engineering Vol 113 No 12 Dec 1987 (pp 1489 -1509)
2 Dam Break Flood Hazard from the Callery River Westland New Zealand TR Davies and BK Scott Journal of Hydrology (NZ) 36 (1) 1-13 (1997)
3 Natural Hazards Assessment for the Township of Franz Josef and its Environs MJ McSaveney TRH Davies IGNS Client Report 44714B10 (July 1998)
4 Peer Review of the Institute of Geological and Nuclear Sciences Ltd Report No 44714B10 (July 1998) Natural Hazards Assessment for the Township of Franz Josef and its Environs RJ Hall RJ Hall Civil amp Environmental Consulting Ltd (August 1998)
5 Evaluation of Options for the Management of the Waiho River Aggradation Threats RJ Hall et al (2000)6 Anthropogenic Fanhead Aggradation Waiho River Westland New Zealand TR Davies MJ McSaveney
Proceedings 5th International Gravel-bed Rivers Symposium Christchurch and Franz Josef (2000)7 The Transit New Zealand Waiho Workshop HL Rouse TJ Day TRH Davies Proceedings 5th International
Gravel-bed Rivers Symposium Christchurch and Franz Josef (2000)8 Landslide-dambreak Floods at Franz Josef Glacier Township Westland New Zealand a Risk Assessment TR Davies
Journal of Hydrology (NZ) Vol 41 No 1 (2002) 9 Anthropogenic Aggradation of the Waiho River Westland New Zealand TR Davies MJ McSaveney PJ
Clarkeson Earth Surfaces Processes and Landforms 28 209-218 (2003)10 How High are Bed Moving Flows in New Zealand Rivers B Clausen D Plew Journal of Hydrology (NZ) Vol 43 No
1 (2004)11 Geomorphic Constraints on the Management of Bed-load Dominated Rivers TR Davies MJ McSaveney Journal
of Hydrology (NZ) 45 (2) 69-88 (2006) 12 Geology of the Aoraki Area 1 250000 Geological Map 15 SC Cox DJA Barrell compilers IGNS (2007)13 West Coast Regional Council Waiho River Flood Protection Scheme Design Flood Levels Good Earth Matters Ltd
(2008)14 Preparing For Climate Change A Guide for Local Government in New Zealand Ministry for the Environment (2008)15 Waiho River Bed Surveys June 2008 and March 2011 Chris Coll Surveying Ltd (2011)16 Topographical Survey of the Waiho Bush Block Chris Coll Surveying Ltd (2011)17 Mean Bed Level Survey Record Waiho River SH 6 Bridge February 1997 ndash May 2011 Opus International Consultants
Ltd 18 WCRC Asset Management Plans for the Franz Josef Special Rating Area the Lower Waiho Rating District (December
2010)19 Video of Callery Fly Over 2011 Opus International Consultants Ltd (2011)20 Oblique Stills Callery Fly Over 2011 Department of Conservation Franz Josef (2011)21 WCRC Staff Aerial Inspection ndash Callery 6 September 2011 W Moen WCRC (7 September 2011)22 Planning for a Safer Franz Josef ndash Waiau Community Westland District Considering Rupture of the Alpine Fault
RM Langridge amp JG Beban GNS Science Consultancy Report 2011217 (September 2011)23 Callery River Landslide Dam Rapid Assessment of Dam Failure Consequences for West Coast Regional Council R
Measures M Duncan NIWA (September 2011)24 NIWA Flood Annual Flood Record and Annual Means Site 89301 Whataroa River at SH 6 1985 ndash 2011 NIWA (2011)25 Report on West Coast Weather Event 27 amp 28 December 2010 West Coast Regional Council report (2011)
64 65 Waiho RiveR optimal FutuRe management Waiho RiveR optimal FutuRe management
appendIx 4 referenCes
appEndix 5
tables
Cros
s se
ctio
n
thal
weg
dis
tanc
e ( m
)
Mbl
Jan-
02 (
rl m
)
Mbl
Jun-
08 (
rl m
)
Mbl
Mar
-11
( rl
m )
Chan
ge M
bl Ja
n 02
- Ju
ne 0
8 ( r
l m
)
Chan
ge M
bl Ju
ne 0
8 - M
ar
2011
( r
l m
)
rate
Cha
nge
Mbl
Jan
02 -
June
08
( m
yr )
rate
Cha
nge
Mbl
June
08
- M
ar 2
011
( m
yr
)
rati
o M
bl C
hang
e pe
r yr
2008
- 20
11 to
200
2 - 2
011
Chan
ge in
Vol
ume
( m
3 ) 20
02 -
2008
Chan
ge in
Vol
ume
( m
3 ) 20
02 -
2011
10 0 15305 15855 16039 551 184 0816 0689 08
11 209 15484 15572 157785 088 207 0131 0775 59 103269 68536
12 417 15308 15328 154969 020 169 0030 0632 212 21893 81442
13 821 15053 15043 15139 -010 097 -0015 0363 00 4656 129254
14 1113 14594 14656 14754 062 098 0092 0369 40 18638 70075
15 1377 14354 14387 14463 033 076 0049 0284 58 36017 68155
16 1795 13934 13963 14017 029 055 0043 0205 48 79237 159891
17 2268 13428 13452 13515 024 063 0035 0237 68 115310 261502
18 2740 12947 12918 12971 -029 053 -0043 0197 -45 -3499 247856
19 3158 12449 12484 12522 034 038 0051 0143 28 -54 147467
20 3923 11626 11678 11703 051 026 0076 0097 13 156610 134985
21 4618 10901 10932 10949 031 017 0045 0065 14 224717 123676
22 5418 10101 10104 10100 003 -005 0004 -0017 -40 613958 -560100
23 6114 9343 9504 9397 161 -108 0239 -0403 00 635880 -761619
2006631 171120
TABle 1 Waiho River at Franz Josef Mean Bed Level and Volumetric Changes Summary January 2002 ndash June 2008 and June 2008 ndash March 2011 River Bed Surveys
66 67 Waiho RiveR optimal FutuRe management Waiho RiveR optimal FutuRe management
appendIx 5 tables
recurrence interval t
(yrs)
Qpk(eV 1)
(cumec)
Qpk + 10(cumec)
Qpk + 15(cumec)
23 1230 1350 1400
5 1550 1700 1800
10 1640 1800 1900
20 1730 1900 2000
50 1820 2000 2100
100 1910 2100 2200
note Waiho River estimates derived from an EV 1 analysis of Whataroa River at SH 6 which were scaled by the area factor [A waiho A whataroa]⁰⁸
TABle 2 Flood Frequency Estimates for the Waiho River based on the Whataroa River at SH 6
appEndix 6
Figures
68 69 Waiho RiveR optimal FutuRe management Waiho RiveR optimal FutuRe management
appendIx 5 tables
appEndix 7
glossary oF terMs
active gully erosion Erosion that is presently occurring on the sides and floor of a gully during rainstorms which results in an expansion of the gully (viz depth width) and delivers sediment downstream into the main river system of which it is an integral part
aggradation The process whereby sands and gravels accumulate in a riverbed causing the bed level to riseaggrading Phase A term used to describe a period when aggradation is occurring in a river or on an active
alluvial fanalluvial Fan The fan shaped surface built up by a river over extended time where it exits in a confined reach
typically where a river emerges from a hill catchmentannual exceedence Probability The probability that an event (rainstorm flood) of a specific size will occur on
average in any one year (the mathematical reciprocal of the return period or recurrence interval for that event)
annual series Maxima A table comprising the highest flow recorded at a hydrometric site for each year of record and is used for determining the flood frequency characteristics of that site
antecedent rainfall That rainfall that occurs prior to the onset of a rainstorm and which pre-soaks the soil assisting in the development of runoff from the storm when it occurs
anthropogenic Something which has occurred or will occur as a result of human activity or influenceappurtenant structures A structure that is integrally required for the satisfactory performance of another
structure eg rock riprap stub groynes to provide protection to the riverside toe and batter of a stopbankaverage Water depth The water depth averaged over a cross section for a particular flowavulsion The sudden change in direction of a river that occurs as a result of a break out usually occurring during
a flood so that the river abandons its original course in favour of the new alignmentbedload dominated river A river in whose form has been sculptured by the erosion storage and transport of
gravel as bedloadbenchmark level The level referenced to a particular survey datum that is set on a permanent reference point
(bench mark) for survey purposesboils The localised appearance of water and fine soil particles such as sands and silts that occur where
concentrated seepage flows emerge at groundlinebraided river The description for a wide generally steep gravel bed river that has a multitude of interlacing
channelsCalibration run The running of an hydraulic model using selected known flows and water profiles in order to
determine what surface roughnessrsquos are required to obtain realistic model performanceCatchment Processes The physical processes operating within a catchment which influence the rate of runoff
and hence river flow during rainstormsChannel gradient The average slope of a channel reach measured along the flow path of the riverCross Fall The gradient that occurs on the bed of a river that runs at right angles to the primary down valley
gradient of the riverbedCrest settlement The lowering of the crest level of a stopbank caused by either settlement in the stopbank
foundation where weak materials are present or as a result of internal erosion of the stopbank or where liquefaction has occurred or through slumping caused by erosion of the stopbank or lateral spreading of the stopbank foundation as a result of earthquake action
Current Morphological status The present state that a river is in given that the rivers form tends to change over time in response to climatic and geological influences which can affect sediment supply catchment runoff and hence river flows channel gradient and sea level
dam break surges The waves of water and debris that move rapidly downstream from a debris dam when it fails
debris dams Obstructions that occur in confined river reaches from time to time and typically comprise rock regolith vegetation etc which obstruct the flow of water and cause it to dam
debris Flow A fluvial phenomena that can occur in steep channels usually as a result of intense rainfall on an already wet catchment the debris flow manifests as a slug or series of slugs of water and sediment travelling
DoCheRtY CReeK
1km 1mi
FRanZ JoSeF toWnShip
Canvans Knob
Franz Josef Stopbanks
Canavans Knob Stopbank
Rubbish Dump Stopbank
milton amp others Stopbank
State highway
State highway
Bridge
Sewerage ponds
nZta
WCRC
hokitika airport authority
Department of Conservation
Westland District Council
tartare gorge
Waiho loop
Rata Knoll
WAIHO RIVER
CalleRY RiveR
70 71 Waiho RiveR optimal FutuRe management Waiho RiveR optimal FutuRe management
appendIx 7 glossary of terms appendIx 7 glossary of terms
rapidly downstream as a dense slurry which may have incorporated within it woody debris such as tree trunks and branches
debris Flow activity The occurrence of debris flowsdebris traps Places within a catchments river system where sediment tends to accumulatedegradation The opposite process to aggradation whereby sands and gravels are eroded out of the riverbed
and the riverbed fallsdeflation of the bed The steady reduction in elevation of an eroding surface (river bed) over time under the
influence of surface erosion processesdesign Flood levels The maximum water level relative to a prescribed design datum set at a particular location
on a river required to contain the design flood carrying capacity of the river control systemdetritus The products of erosion that is delivered into a river system form the slopes where it has been generated
by weathering and erosion processesdistal end of an alluvial Fan The furthest end of an alluvial fan from the fan head and typically the lowest
elevation on the fan surface provided the fan has not been truncated by erosion by the river or by wave action on a lake or the sea
episodic Events that occur irregularly in timeFalling limb of a Hydrograph That part of the flood hydrograph after the peak where the flood recession
occursFlood Carrying Capacity An estimate of the peak flow in m3 per second that a river control system (can contain
without exceeding its freeboard where a river has stopbanks it is the flow contained within the stopbanks whilst maintaining the design freeboard
Flood Frequency estimates A statistical process for estimating the recurrence interval of various flood discharges for a particular hydrometric site using the annual maxima series for that site
Flood Peak The maximum flow reached by a river in flood measured in m3 per secondFlood Plain The surface over which a river can spread in times of flood once it overtops its natural banks Flood Volume The total volume of water delivered by a river in flood over the duration of the flood and measured
in m3 Fluvial Characteristics The characteristics of a river which describe the storage transport and reworking of river
sediments by the rivers flowsgeomorphic Constraints Physical factors such a rate of uplift hardness of basement rock present sea level
which limit for example the generation of sediment supply and gradient of a river and hence influence the form of a river
glacial internal drainage systems Subsurface watercourses located in and beneath a glacier that convey water from the surface and sides of a glacier into through and beneath a glacier and discharge to the valley floor at the glacier terminal face
glacier retreat The process whereby the terminal face of the glacier is located progressively up the valley as the glacier ice volume is reduced by ablation
Headcut The formation of an erosion cusp in a channel that results in a localised step in a channel bedHeadward erosion The erosion that generates and maintains the headward movement of the erosion cusp
(headcut)Hydraulic Characteristics The flow characteristics of a river system such as flow depth water velocity channel
surface roughness and channel slope (gradient)Hydraulic gradient The slope on a flowing water surfaceHydrometric site A water level measuring site which continuously measures and records water depth at the site
at specific time intervals used for establishing flow records over the full range from low to high flow landslide dam A dam that forms in a confined reach of a river as a result of landslide occurring and partially
blocking the valley through which the river is flowinglateral bank erosion The processes whereby a river erodes its banks generally used with reference to the
erosion of stopbanks when a river moves side ways in a flood eroding the stopbank in the process on the riverside of the stopbank
liquefaction The sudden loss of strength of an unconsolidated or poorly consolidated saturated fine sand soil induced by violent earthquake shaking
lithologies A geological term used for describing rock typeslive bed Conditions The condition that may occur in a riverbed in flood when the deposits which form the
riverbed and banks begin to mobilise and become entrained in the flow and move downstreamMass Movement The downslope movement of regolith and other erosion products in bulk eg slab avalanches
landslides debris flows
Mean bed level The average level of a riverbed across a particular cross section at a particular time estimated from a surveyed cross section at a particular time
Micro scale Modeling The development and running of a small scale physical replica of a particular physical feature such as an active alluvial fan in a laboratory situation
Morphologically active alluvial Fan An alluvial fan that is either aggrading or degrading under its present sediment and water supply and under the influence of local morphological constraints
natural Hazards Any atmospheric or earth or water related occurrence (in the Waiho River context including earthquake erosion landslip Subsidence sedimentation wind drought or flooding) the actions of which adversely affects or may affect human life property or other aspects of the environment
overtopping The term used to describe the situation where floodwaters in a river in flood begin to spill over the rivers banks or stopbanks whichever is relevant to the particular situation being considered
Permeability A term used to describe and quantify that property of a soil that permits water to flow through the pores of the soil under a hydraulic gradient
Pheratic surface The curvilinear water surface within the soils of a stopbank or dam through which water is seeping marking the boundary between saturated and un-saturated soils
Predictive tool A procedure such as a hydraulic model that is developed in order to try and determine how a particular physical situation might develop over time under specified inputs (eg water bedload supply)
Prograding The episodic growth of an alluvial fan surface which causes the distal end of the fan to extend downstream away from the fan head
recession That period during a flood when the river has passed its peak and water levels and hence flow rates are dropping
recurrence interval A statistical term used to describe the relative size of an event (synonymous with the term average return period) eg a particular rainfall depth or flood flow A 1 in 100 year flood has a recurrence interval of 100 years on average It does not mean that an hundred year flood will not occur again for 100 years if an event of that size has just been experienced
regolith The accumulation of soil material on a hill slope as a result of the weathering of the hill slope over time Typically regolith includes clay and sand size particles rock fragments and soil
regolith avalanches The localised movement of regolith rapidly off a hill slope onto the valley floor or riverbed in the form of an avalanche
residence time The time that elapses for example between bed load sediments accumulating at a particular location and subsequently being eroded out
revegetation The decolonization with new vegetation on areas such as slopes denuded of vegetation by landslides
river bed roughness A hydraulic term which reflects the relative roughness of the surface of a riverbed or its berms that is used in hydraulic computations
river Cross sections A survey of ground levels extending across a river from its true left bank to its true right bank aligned more or less at right angles to the rivers flow in times of flood
river reach A description for a particular stretch of a riverriver training and Protection Works Structures erected by humans in an attempt to mitigate against riverbank
erosion and channel migration during floodsrelaxation Removing the boundary constrains on a stopbanked river to allow the river to reassert its natural
form on the floodplain unimpeded by man made flood containment structuresrock rip rap A term used to describe the coarse hard rock that is placed against a surface that may be eroded
by river flows in order to mitigate against such erosion sediment sources Those parts of a river catchment that supply sediment to the river as sediment supplysediment supply The sediment that passes through a river system typically of an episodic nature ie the rate of
supply varying over time typically in response to climatic conditions and river flowseismic induced Mass Movement Landslide activity caused by seismic activityshallow slab avalanches Landslides that typically occur on steep valley sides where the basement rock is close
to the surface (eg within 1 to 2 metres of the surface)sinusoidal braided Flow PatternsTheldquoSrdquoshapedchannelinducedflowpatternsobservedinbraidedriversspecial rating district A Rating District established for the construction and ongoing repair and maintenance
of a river control scheme the rating district is administered by the West Coast Regional Councilsplinter Faults Fault lines that extend out at an angle from a main fault linespur groynes Short groynes that are constructed at the toe of a natural river bank or stopbank that project out
into the riverbed designed to ease high flow velocities of the natural bank or stopbank toe in order to lessen the risk of lateral erosion by the river in flood
72 73 Waiho RiveR optimal FutuRe management Waiho RiveR optimal FutuRe management
appendIx 7 glossary of terms
stopbank A structure erected on a rivers floodplain typically sub-parallel to the rivers flow in times of flood to contain flood flows up to the design standard of the flood protection scheme to prevent them from spilling onto the floodplain
sub-alpine vegetation Typically shrubby bushes grasses and stunted trees that grow above the bush line but below the sparsely vegetated alpine area of a mountain range
sub ndash Parallel More or less parallelsuper-elevation effect The local elevation of water levels around the outside of a bend in a river caused by
centrifugal forces generated by the water moving around the river bendswale The remnant of a river channel on a riversrsquo floodplain that has been etched by river flows in the past and
has subsequently been abandoned by the normal flow of the river but can activate when rivers overtop their natural banks and flow onto the flood plain they may also convey surface runoff from local rainstorms from time to time
temporal supply Mechanism A process that generates sediment supply to the river system and is time dependent
thalweg The centreline path the active riverbed takes as it flows down plainthreshold Flood event A flood event of sufficient size that it overtops a rivers confining banks natural or man
made transfer reach That part of a mountain catchment located in the foothill area upstream of the head (or apex)
of an alluvial fan generally a gorge or narrow confined reach with little opportunity for coarse sediment storage coarse sediments tend to flush through these reaches during floods rather than accumulate as they might on the fan surface proper
two dimensional Hydraulic Model A computer model that incorporates a digital terrain model to provide the basis for determining water depths and velocities over that surface for a particular design flood flow
Wasting out The eroding out of deposits over time
74 Waiho RiveR optimal FutuRe management
388 Main South Road PO Box 66 Greymouth
phone +64 3 768 0466
email infowcrcgovtnz
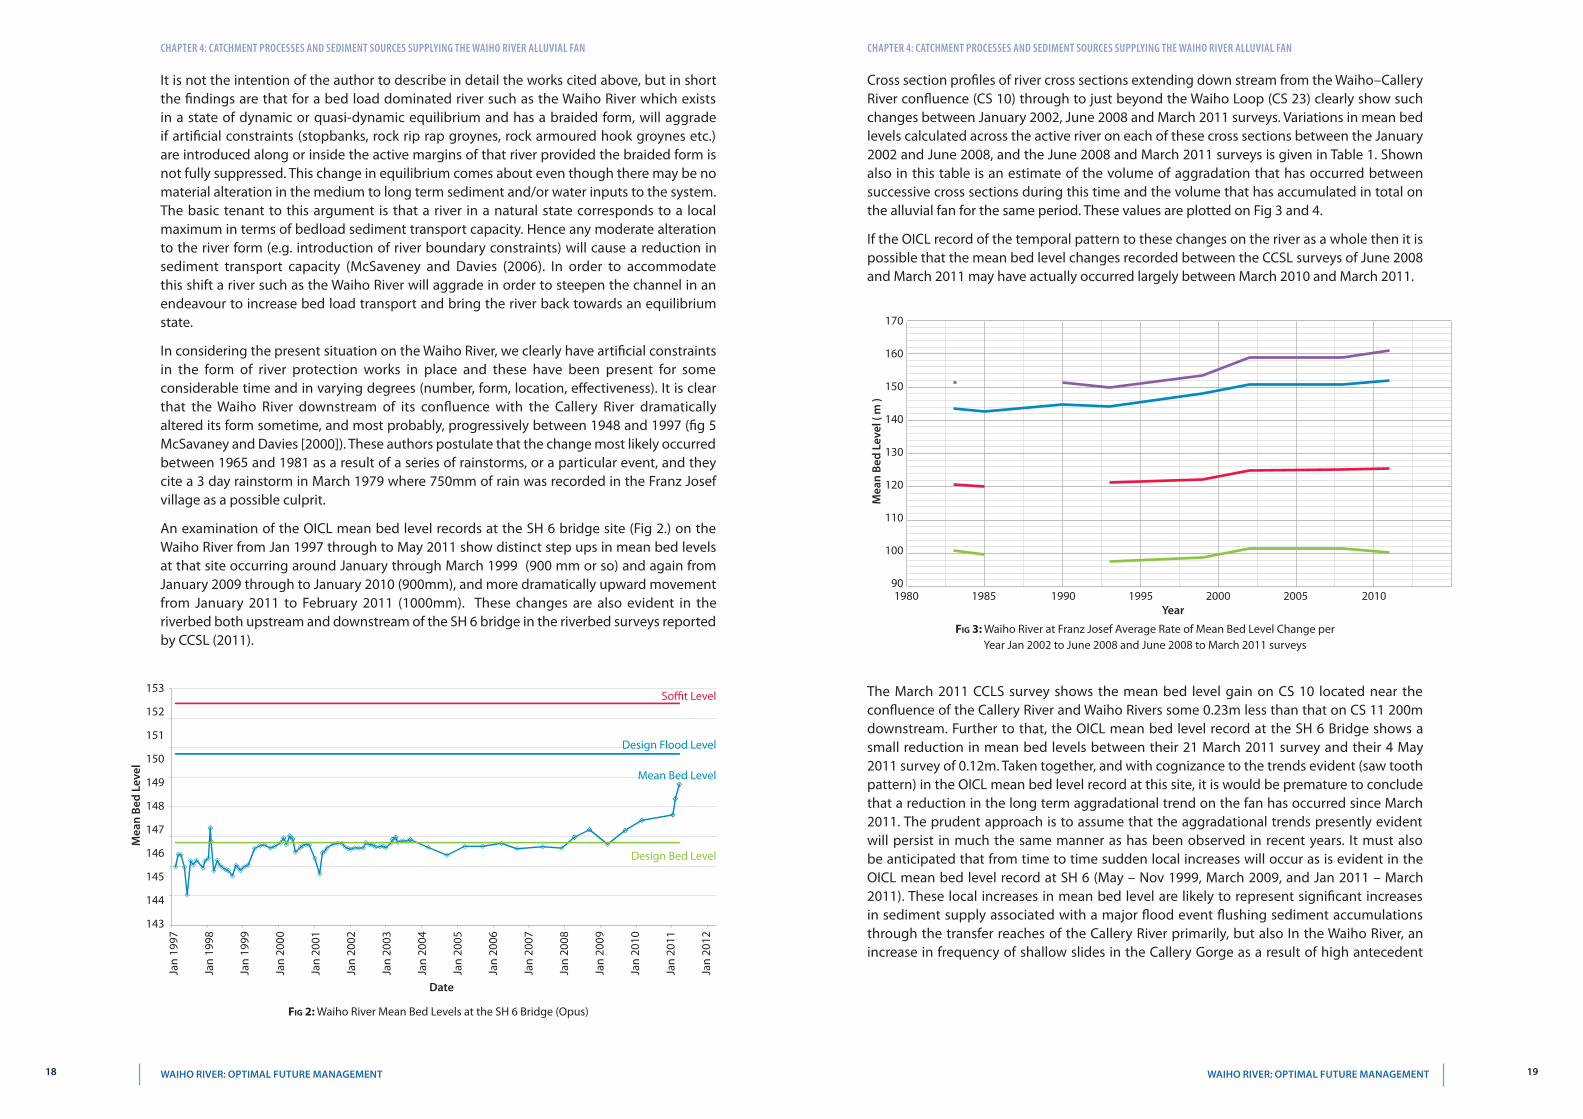
Chapter 4 CatChment proCesses and sedIment sourCes supplyIng the waIho rIver alluvIal fan Chapter 4 CatChment proCesses and sedIment sourCes supplyIng the waIho rIver alluvIal fan
Cross section profiles of river cross sections extending down stream from the WaihondashCallery River confluence (CS 10) through to just beyond the Waiho Loop (CS 23) clearly show such changes between January 2002 June 2008 and March 2011 surveys Variations in mean bed levels calculated across the active river on each of these cross sections between the January 2002 and June 2008 and the June 2008 and March 2011 surveys is given in Table 1 Shown also in this table is an estimate of the volume of aggradation that has occurred between successive cross sections during this time and the volume that has accumulated in total on the alluvial fan for the same period These values are plotted on Fig 3 and 4
If the OICL record of the temporal pattern to these changes on the river as a whole then it is possible that the mean bed level changes recorded between the CCSL surveys of June 2008 and March 2011 may have actually occurred largely between March 2010 and March 2011
mea
n B
ed l
evel
( m
)
170
160
150
140
130
120
110
100
901985 1990 1995 2000 2005 20101980
Year
Fig 3 Waiho River at Franz Josef Average Rate of Mean Bed Level Change per Year Jan 2002 to June 2008 and June 2008 to March 2011 surveys
The March 2011 CCLS survey shows the mean bed level gain on CS 10 located near the confluence of the Callery River and Waiho Rivers some 023m less than that on CS 11 200m downstream Further to that the OICL mean bed level record at the SH 6 Bridge shows a small reduction in mean bed levels between their 21 March 2011 survey and their 4 May 2011 survey of 012m Taken together and with cognizance to the trends evident (saw tooth pattern) in the OICL mean bed level record at this site it is would be premature to conclude that a reduction in the long term aggradational trend on the fan has occurred since March 2011 The prudent approach is to assume that the aggradational trends presently evident will persist in much the same manner as has been observed in recent years It must also be anticipated that from time to time sudden local increases will occur as is evident in the OICL mean bed level record at SH 6 (May ndash Nov 1999 March 2009 and Jan 2011 ndash March 2011) These local increases in mean bed level are likely to represent significant increases in sediment supply associated with a major flood event flushing sediment accumulations through the transfer reaches of the Callery River primarily but also In the Waiho River an increase in frequency of shallow slides in the Callery Gorge as a result of high antecedent
It is not the intention of the author to describe in detail the works cited above but in short the findings are that for a bed load dominated river such as the Waiho River which exists in a state of dynamic or quasi-dynamic equilibrium and has a braided form will aggrade if artificial constraints (stopbanks rock rip rap groynes rock armoured hook groynes etc) are introduced along or inside the active margins of that river provided the braided form is not fully suppressed This change in equilibrium comes about even though there may be no material alteration in the medium to long term sediment andor water inputs to the system The basic tenant to this argument is that a river in a natural state corresponds to a local maximum in terms of bedload sediment transport capacity Hence any moderate alteration to the river form (eg introduction of river boundary constraints) will cause a reduction in sediment transport capacity (McSaveney and Davies (2006) In order to accommodate this shift a river such as the Waiho River will aggrade in order to steepen the channel in an endeavour to increase bed load transport and bring the river back towards an equilibrium state
In considering the present situation on the Waiho River we clearly have artificial constraints in the form of river protection works in place and these have been present for some considerable time and in varying degrees (number form location effectiveness) It is clear that the Waiho River downstream of its confluence with the Callery River dramatically altered its form sometime and most probably progressively between 1948 and 1997 (fig 5 McSavaney and Davies [2000]) These authors postulate that the change most likely occurred between 1965 and 1981 as a result of a series of rainstorms or a particular event and they cite a 3 day rainstorm in March 1979 where 750mm of rain was recorded in the Franz Josef village as a possible culprit
An examination of the OICL mean bed level records at the SH 6 bridge site (Fig 2) on the Waiho River from Jan 1997 through to May 2011 show distinct step ups in mean bed levels at that site occurring around January through March 1999 (900 mm or so) and again from January 2009 through to January 2010 (900mm) and more dramatically upward movement from January 2011 to February 2011 (1000mm) These changes are also evident in the riverbed both upstream and downstream of the SH 6 bridge in the riverbed surveys reported by CCSL (2011)
Date
mea
n B
ed l
evel
153
152
151
150
149
148
147
146
145
144
143
Jan
1997
Jan
1998
Jan
1999
Jan
2000
Jan
2001
Jan
2002
Jan
2003
Jan
2004
Jan
2005
Jan
2006
Jan
2007
Jan
2008
Jan
2009
Jan
2010
Jan
2011
Jan
2012
Soffit Level
Design Flood Level
Design Bed Level
Mean Bed Level
Fig 2 Waiho River Mean Bed Levels at the SH 6 Bridge (Opus)
18 19 Waiho RiveR optimal FutuRe management Waiho RiveR optimal FutuRe management
Chapter 4 CatChment proCesses and sedIment sourCes supplyIng the waIho rIver alluvIal fan Chapter 4 CatChment proCesses and sedIment sourCes supplyIng the waIho rIver alluvIal fan
McSaveney Davies amp Clarkeson (2003) In the light of this body of research and given that the greater part of it has been derived from studies of the behaviour of this river it must be evident that reducing the available braided width of this river as occurred with these works could well exacerbate on-going aggradational trends which might inevitably lead to reduced freeboard on the NZTA stopbanks in this reach of the river Such effects will not be limited solely to the NZTA stopbanks but must inevitably have a similar effect on stopbanks outside their control elsewhere on the river Further to that as will be discussed later in this report aggradation now evident in the river in this particular reach is causing overbank spills on the true right bank between the oxidation ponds and the Waiho Loop presenting a real threat of avulsion of the Waiho River into the Tatare River which would result in capture of the Waiho River by the Tartare River Overbank spill on the true right bank of the Waiho River in the floods of December 2010 followed this trend and there is clear evidence of headward erosion occurring as a result in the lower end of the overflow corridor extending back and upstream from where the Waiho River spills entered the Tartare River (Plate 2) The statement in the NZTA resource consent application (72) It is not anticipated that structures will cause or exacerbate flooding or erosion on other properties during flood flows may not be consistent with the present situation and may need reviewing
The need to protect SH 6 is not questioned the importance of this highway to the West Coast economy is absolute Notwithstanding that cognizance needs to be given to the insights now available on the effect of boundary constraint on river behaviour (aggradation) in a bed load dominated river (Waiho River) These insights indicate that persisting with the present river management strategy which relies on boundary constraint will only lead to further riverbed aggradation and ultimately to avulsions This situation arises because the riverbed in a number of places is now elevated well above the fan surface that lies beyond the protection systems on this river and these same works have significantly reduced the area of the alluvial fan surface available to the river for sediment storage
Responses must now be sought that minimise the risk of break out and avulsion or at lease allow the river to avulse to areas where it is already predisposed to do so if it cannot realistically be prevented It must be recognised though that if breakouts were to be prevented by raising stopbank levels and or constructing new stopbanks in due course the whole protection system will inevitably be put at risk at some later time by overtopping and or avulsion with the multiple consequences that would ensue if the current aggradation trends persists or worsen It is to be noted that a river management policy that relies on containing river aggradation by periodically raising stopbanks to preserve flood containment inevitably increases future risk and poses significant engineering and environmental problems when breakout eventually occurs as a result of the riverbed being elevated above the surrounding alluvial fan surface
rainfall conditions preceding an intense or series of intense or prolonged rainfalls or the formation and subsequent failure by erosion of a landslide dam (s)
note the SH6 cross section monitored by NIWA for OICL is located at the SH 6 bridge site whereas the CCSL CS 13 is located just downstream of that bridge Further to that the OICL reduced levels are based on a reference bench mark level which is different to the Lyttelton Vertical Datum 1937 used by CCSL In order to compare the results of these two surveys it is necessary to add a correction of 144m to the NIWA Datum before comparing the NIWA bed levels with the CCSL bed levels
The CCSL surveys of the river in June 2008 and March 2011 show two distinct gradients the first between CS 11 to CS 16 and the second between CS 16 and CS 22 (Fig 2) Between June 2008 and March 2011 the reach CS 11 ndash CS 16 steepened from an average gradient of 00103 to 00111 (approximately an 8 increase) whereas the reach CS 16 to CS 22 steepened from 00106 to 00108 (approximately an 2 increase) These changes in gradient will reflect in a reduction in average water depth and an increase in average section velocity for any given flow covering the full riverbed width and with the channel roughness remaining constant A 4 reduction in average depth will occur in the reach CS 11 to CS 16 and a 1 reduction in average depth in the reach CS 16 to CS 22 For example for an average flow depth of 15m reductions of 60mm occur in the reach CS 11 to CS 16 whereas in reach CS 16 to CS 22 the reduction would be 15mm These modest gains will not materially offset the deleterious effects of aggradation that is raising the mean bed levels in the reach CS 11 ndash CS 16 by 10 to 30 times that resulting from an increase in gradient The same is true of the reach CS 16 to CS 22 but to a lesser extent (4 times)
Reflecting on the implications for lateral constraint of a braided bed load dominated river such as the Waiho River at Franz Josef as posited variously by McSaveney and Davies (2000) and McSavenay Davies and Clarkson (2003) it needs to be understood that the works which may have influenced and subsequently contributed to the level of aggradation now being experienced on this river were not appreciated at the time that the earliest works were constructed In fact the type and form of the protection works being constructed on the Waiho River at that time was standard practice for river works of this type throughout New Zealand
Since that time further works of a similar nature have been undertaken both to repair works damaged during flood events and to upgrade (raise re-align reconstruct) and extend existing stopbanks to offset the deleterious effects of riverbed aggradation compromising stopbank freeboards These works have been accompanied by the construction of rock stub groynes on the riverside toe of the stopbanks to mitigate against lateral bank erosion of the stopbanks The primary driver for these upgrades have been to protect SH 6 on the true left bank of the Waiho River the Franz Josef Glacier access road and to a lesser extent the West Coast Regional Councilrsquos special rating district areas on the southern side of the river An examination of the NZTA resource consent application (August 2009) lodged in respect of stopbank upgrades of the form described and their assessment of environmental effects (Sec 70) in particular Sec 72 it is clear that their focus was on the need to contain flood flows in the river in the face of on-going riverbed aggradation (SH 6 Bridge to Canavans Knob reach) that was eroding freeboard and hence elevating the risk of flooding to SH 6 on the south side of the river below the SH 6 bridge This document gives no indication that consideration was given to why the river was aggrading in this way notwithstanding the considerable and detailed research undertaken on that subject in particular the extent that boundary constraint plays in influencing aggradational trends in bed load dominated rivers [Carson amp Griffiths (1987) Rouse Day amp Davies (2000) McSaveney amp Davies (2000 2006)
20 21 Waiho RiveR optimal FutuRe management Waiho RiveR optimal FutuRe management
Chapter 4 CatChment proCesses and sedIment sourCes supplyIng the waIho rIver alluvIal fan
chaptEr 5
Present Condition oF tHe WaiHo riVer
The GEML (2002) report cites an estimate made by CCSL of nett aggradation in the river system between cross section 10 (WaihondashCallery River confluence) and cross section 23 (just downstream of the Waiho Loop) of 1700000 m3 between the Jan 2002 and June 2008 surveys A similar exercise undertaken by RJ Hall of RJ Hall and Associates Ltd (RJHAL) based on the June 2008 and March 2011 surveys indicate that a further 170000 bulk m3 has accumulated in this reach (Table 1) More significantly though if the assessment is made from CS 10 to CS 21 ie from the WaihondashCallery River confluence to the upstream end of the Waiho Loop the picture is quiet different Between the 2002 and 2008 surveys it is estimated that some 076 bulk m3 of material was stored on the fan between CS 10 and CS 21 (average annual accumulation rate 118000 m3 yr) and between 2008 and 2011 1490000 bulk m3 (average annual accumulation rate of 540000 m3 yr) An examination of OPUS International Consulting Ltd (OICL) mean bed level record at CS 3 (ie at the SH 6 Bridge) shown on Fig 2 indicates that the bulk of this change may in fact have occurred between March 2009 and March 2011 Of significance some 47 of this aggradation occurred between CS 17 (lower end of the Franz Josef stopbank true right bank where SH6 turns north east away from the river) and CS 21 (a short distance upstream from where the river turns and begins its approach to the gap between Rata Knoll and the Waiho Loop) Fig 4 also shows the changes in volume stored per unit length of riverbed between 1993 and 1999 (Fig 6 of McSaveney amp Davies [2000])
1000000
800000
600000
400000
200000
00000
-200000
-400000
-600000
-800000
-1000000
-120000010000 2000 3000 4000 5000 6000 7000
thalweg Distance From CS 10 ( m )
volu
me
chan
ge
( m3
) K
m a
lon
g t
hal
weg
Column AB
Column Y
Column O
Fig 4 Waiho River at Franz Josef CS 10 to CS 23 Volumetric Rate of Change along the Thalweg Jan 2002 to June 2008 and June 2008 to March 2011 surveys including TRH Davies Data 1993 to 1999
A comparison between the changes that took place between 1993 and 1999 and the changes that have occurred now ie 2008 to 2011 show similar trends although it is noted that there are some clear differences apparent Upstream of the SH 6 bridge there has been significant increase in the rate of aggradation in recent times The 400m reach extending immediately downstream from the bridge remains more or less unchanged but below that point in the reach through to Rata Knoll the situation has changed significantly Whereas in the period 1993 to 1999 there was net degradation evident in the reach between the
22 23 Waiho RiveR optimal FutuRe management Waiho RiveR optimal FutuRe management
Chapter 5 present CondItIon of the waIho rIver Chapter 5 present CondItIon of the waIho rIver
Fig 5B Waiho River at Franz Josef CS 18 Corridor Plots based on the January 2002 June 2008 and March 2011 River Surveys
0 20 40 60 80 100 120
128
126
124
122
mea
n B
ed l
evel
( m
)
Row 9
Row 22
Row 39
elapsed time from Jan 2002 ( months )
Fig 5C Waiho River at Franz Josef CS 19 Corridor Plots based on the January 2002 June 2008 and March 2011 River Surveys
0 20 40 60 80 100 120
120
115
110
mea
n B
ed l
evel
( m
) Row 10
Row 23Row 40
elapsed time from Jan 2002 ( months )
Fig 5D Waiho River at Franz Josef CS 20 Corridor Plots based on the January 2002 June 2008 and March 2011 River Surveys
In considering these results ie 700000 m3 fan aggradation (January 2002 - June 2008) and then 1500000 m3 fan aggradation (June 2008 ndash March 2011) between CS 10 and CS 21 and the fact that aggradation is now well advanced between Canavans Knob and the Waiho Loop and is evidently extending downstream from the Waiho Loop with mean bed levels now close to at or above the natural ground level on the true right bank at and downstream of the Oxidation Ponds through to the Waiho Loop the following preliminary conclusions are drawn
1 Mean bed levels on the true right bank of the active braided bed of the Waiho River between the Oxidation Ponds (CS 19) and the Waiho Loop (CS 20) are such that the bed levels is at or marginally higher than the berm area on that side of the river Further to that a more detailed examination of CS 19 to CS 20 show a pronounced cross fall over the riverbed in this reach extending from the true left bank towards the true right bank an effect that has been present and maintained from the 2002 riverbed surveys through to the 2011 survey These trends presently predispose the river to overflow its true right bank in this reach during floods
2 Overflows from the Waiho River in the vicinity and down stream of the Oxidation Ponds through to the Waiho Loop on the true right bank must be anticipated in flood events at least as low as annual exceedence probability of 20 (1 in 5 yr recurrence interval) noting that overflows towards the Tatare River occurred in this area in the December 2010 flood
Oxidation Ponds and the Waiho Loop that trend has now completely reversed Aggradation in this reach is now occurring to varying degrees at rates per unit thalweg length two to three times that of the period 1993 ndash 1999 with aggradation now evident extending over the full length of the river from the WaihondashCallery River confluence through to just downstream of the Waiho Loop
The changes that occurred between the 1993 ndash 1999 period and the 2008 ndash 2011 period indicate that the alluvial fan is now aggraded over its length from the WaihondashCallery River confluence to at least immediately below the Waiho Loop This means that the Waiho River alluvial fan is now prograding within the artificial boundary constraints present on the true left bank through to and downstream of the Waiho Loop and on the true right bank from the SH 6 bridge through to the Oxidation Ponds
An analysis of mean bed levels in the reach extending from CS 16 to CS 21 shows a pronounced cross fall on the river extending from the true left bank towards the true right bank (Fig 5A to 5D inclusive) This analysis has been made by splitting each of the cross sections used in the analysis into three equal length sections and calculating mean bed levels for each of these sub ndash section widths Further to that CS 17 CS 19 and CS 20 have been corrected for skew by rotating each of these cross sections in a clockwise direction eg 63ordm (CS 17) 111ordm (CS 19)and 101ordm (CS 20) and then adjusting the sub section mean bed levels to reflect the effects of the rotations This step was taken in order that the modified cross section was orientated approximately normal (ie at right angles) to the rivers overall flood flow direction What these plots clearly show is the true left subndashwidth sections being elevated above both the central and true right subndashwidth sections this clearly indicates the presence of the cross fall and its persistence from the January 2002 through to the March 2011 surveys This situation will have the effect of predisposing the river to move towards the true right bank and overflow in the reach between CS 19 (Oxidation Ponds) and CS 20 (upstream side of Waiho Loop) and contribute to the risk of avulsion of the Waiho River into the Tartare River whilst these trends prevail
0 20 40 60 80 100 120
140
135
130
mea
n B
ed l
evel
( m
)
Row 7
Row 20
Row 37
elapsed time from Jan 2002 ( months )
Fig 5A Waiho River at Franz Josef CS 17 Corridor Plots based on the January 2002 June 2008 and March 2011 River Surveys
0 20 40 60 80 100 120
140
135
130
125
mea
n B
ed l
evel
( m
)
Row 20
Row 8
Row 38
elapsed time from Jan 2002 ( months )24 25 Waiho RiveR optimal FutuRe management Waiho RiveR optimal FutuRe management
Chapter 5 present CondItIon of the waIho rIver
chaptEr 6
reVieW oF tHe CatCHMent Hydrology
A review of the catchment hydrology has been undertaken using the NIWA record from the Whataroa River hydrometric site at SH 6 (1985 ndash 2011) catchment area 445 Km2 The Waiho River at SH 6 has a catchment in the order of 170 Km2 An EV1 (Gumbel) analysis was carried out on the Whataroa River using the annual series maxima for that river and from the flood frequency estimates for the Waiho River flood estimated on the basis of the ratio of the catchment area of the Waiho River to that of the Whataroa River raised to the power of 08 The Whataroa River catchment was chosen because of its proximity to the Callery River they have a common boundary both are clad in a combination of forest and subalpine vegetation similar lithologies and lie on the western side of the Main Divide Estimates have also been made to take into account projected climate change effects through to 2040 using the MFE (2006) procedure An increase in temperature ranging between 14ordmC and 19ordmC was used (cf Table 2 MFE) and a 24 hr to 48 hr storm duration rainfall percentage increase of 75 ordmC to 80 ordmC (cf Table 7 MFE) which suggests storm rainfall increases of between 10 and 15 These percentages have then been applied directly to the EV1 flood frequency estimates derived from the Whataroa River at SH 6 to provide an indication of possible future changes in flood frequency values
The results of this assessment are set out in Table 2
recurrence interval t
(yrs)
Qpk(eV 1)
(cumec)
Qpk + 10(cumec)
Qpk + 15(cumec)
23 1230 1350 1400
5 1550 1700 1800
10 1640 1800 1900
20 1730 1900 2000
50 1820 2000 2100
100 1910 2100 2200
note Waiho River estimates derived from an EV 1 analysis of Whataroa River at SH 6 which were scaled by the area factor [A waiho A whataroa]⁰⁸
TABle 2 Flood Frequency Estimates Waiho River at SH 6
3 That progradation of the fan below Canavans Knob through to and beyond the Waiho Loop will persist if the sediment supply rates to the fan observed since 2002 persist
4 The present flood capacity of the Milton and Otherrsquos stopbank is provisionally assessed as marginal in a flow of 1850 cumec (aep 5 ie 1 in 20 year recurrence interval) based on GEML hydraulic modeling (n = 0037) adjusted for increases in mean bed level since that work was completed (see further note below)
5 Given points 1 And 2 above the prospect of an avulsion progressively developing into the Tatare River over the true right bank at and downstream of the Oxidation Ponds is now a very real prospect
6 An avulsion into the Tartare River system by the Waiho River (ie the Tatare River captures the Waiho River downstream of Canavans Knob) is likely to progress relatively slowly at first and will be accompanied by an increase in aggradation within the active bed of the Waiho River where it presently flows through and beyond Rata Knoll This will occur as a portion of the flood flows approaching this critical reach is systematically bled off the Waiho River and spills into the Tatare River This situation may result in a reduction in flood carrying capacity in the reach where the Milton and Otherrsquos stopbank is located leading to overtopping during floods provisionally assessed in excess of an aep 10 (ie 10 year recurrence interval flow 1600 cumec)
7 The GEML hydraulic modeling results of July 2008 indicated that much of the stopbanking along the true right bank below SH 6 through to the Oxidation Ponds had been substantially compromised by river aggradation such that it would not contain a flood discharge of 1850 cumec with 1m of freeboard An analysis of the March 2011 CCSL survey indicates that the situation is now worse as a result of increases in mean bed levels that vary from 118m at CS 14 (airstrip) through to 055m at CS 18 (Oxidation Ponds) [note CS = cross section]
note The GEML hydraulic modeling study used a riverbed roughness of ldquonrdquo varyingbetween 0030 to 0040 (predominantly 0037) and arrived at those values by a combination ofreferencetoldquoRoughnessCharacteristicsofNZRivers(DMHicksandPDMason1991)site inspections aerial photography and a calibration model run They noted that their calibration run was approximate and largely based on anecdotal evidence which was not fully substantiated They tested their model by running it with roughness increased by 20 (ie predominantly 0044) and this gave rise to increases in flood level of between 006 and 022m It is the Authors experience that roughness values in the order of 005 to 006 are more realistic in rivers of this kind given that bed form resistance is almost certainly present under live bed conditions Live bed conditions will result in both the entrainment and transport of coarse sediment in the flow and as bed load the latter resulting in bed forms (undulations on the floor of the river bed formation translation destruction and reformation of gravel bars etc) It is anticipated that the onset of live bed conditions will occur over a significant proportion of the Waiho Riverbed when flows reach 450 to 500 cumec (Clausen Plew 2004) and will be well established with flows in excess of 1000 cumec In considering the output from these models it needs to be appreciated that replicating known flood profiles on the river in full flow with live bed conditions present and no real certainty of what the flood flow actually is at that time places real constraints on the models validity particularly as a predictive tool Notwithstanding that limitation of necessity some reliance needs to be placed on the output of such models to give guidance on the possible form of the flood profiles that could occur at different flood discharges However this must be tempered by the knowledge that rivers of this kind under live bed conditions can behave in unpredictable ways
26 27 Waiho RiveR optimal FutuRe management Waiho RiveR optimal FutuRe management
Chapter 6 revIew of the CatChment hydrology
chaptEr 7
CoMMentary on riVer ProteCtion Works
As has been noted earlier in this report a range of river protection works have been constructed on this river at various locations over an extended period of time In general they have been designed to either constrain the lateral migration of the river in order to try and mitigate against lateral erosion of natural banks and man made stopbanks and or to contain flood flows The erosion prevention structures include rock riprap stub groynes aligned at 900 to the natural bank or stopbank alignment or on curves at 90ordm to the tangent to the curve Typically these structures are some 15m in length and evenly spaced at about 6 times the length (Glacier Access Road and true left bank stopbank below the Backpackers) to 35 times their length (Backpackers to Canavans Knob stopbank) The WCRC stopbank on the true right bank downstream of SH 6 has heavy rock cladding on the riverside of the bank to provide protection against lateral scour The stopbanks are constructed in heavily compacted sandy gravels sourced from the river Typically they have batters 2H 1V and varying crest widths but typically 5 to 6 m As the river aggrades freeboards on the stopbanks reduce below their intended design requirements (WCRC stopbanks eg 1m) and adjustments are necessary to restore freeboard
In the reach upstream of SH 6 the Franz Josef Glacier access road presents a unique problem In this reach the river is confined by natural terraces and stub groynes (true right bank) and the access road and stub groynes on the true left bank As the river aggrades in this reach the access road needs to be raised to maintain freeboard Inevitably when the road is raised the result is further encroachment into an already confined reach At CS 12 for example the natural width before the access road was constructed is estimated to have been somewhere in the order of 280m With the construction of the road this width has reduced to approximately 250m and the presence of rock rip rap stub groynes has reduced the active river width to more like 230m in effect a width reduction of some 15 to 20 The SH 6 bridge waterway is similarly affected with the natural width reducing from about 250m to 145m a reduction in active width of 42 The SH 6 Bridge is at the downstream end of the WaihondashCallery River transfer reach and in effect at the head of the Waiho River alluvial fan The construction of river protection works (stopbanks rock rip rap stub groynes) at and downstream of the SH 6 Bridge has in effect constrained the river in such a manner that the natural apex sector angle of the alluvial fan has been systematically reduced from 90⁰ to about 30⁰ The consequences of these modifications to the natural river form and the associated landscape is that those parts of the alluvial fan comprising the forested and farmed land through to Docherty Creek on the true left bank and the Franz Josef Township on the true right bank including the farmed land downstream of the Township are no longer accessible by the river for the purposes of storing sands and gravels during an aggrading phase
The work of McSaveney and Davies (2000 2006) and McSaveney Davies and Clarkson (2003) suggests that the constraining of this steep braided bed load dominated river by river control structures has on balance and more likely than not significantly contributed to the aggradation that has and is now being observed on this river The Waiho River is not unique in that regard a similar situation is evident on the North Ashburton River in mid Canterbury In both cases the active bed is now elevated well above the natural ground levels outside
28 29 Waiho RiveR optimal FutuRe management Waiho RiveR optimal FutuRe management
Chapter 7 Commentary on rIver proteCtIon works
chaptEr 8
engineering issues
The steady increase in bed levels within the active bed of the Waiho River from its confluence with the Callery River through to beyond Rata Knoll has meant that bed levels are now higher than the natural groundline on the landward side of the stopbanks by some metres and this difference is increasing This trend must be expected to continue in the short to medium term (1 to 10 years) That assumption is made on the basis that sediment and water supply rates to the fan in that time span will remain more or less as they have been over the preceding 20 to 30 years The practice to date exercised by both NZTA and the WCRC is to periodically increase the height of the stopbank crest in order to maintain freeboards This practice does not address the problem of increasing mean bed levels as such it simply endeavours to preserve the design flood carrying capacity of the system being managed It should also be noted that it does not address the core issue of the river response to artificial constraint of the active braiding riverbed boundaries in a bed load dominated river
Stopbank failures occur from time to time in most river systems where they have been constructed This can be the result of overtopping either as a result of diminishing freeboard caused by local or more general aggradation within the constrained river system (the Waiho River situation) where inadequate provision has been made for super-elevational effects around bends with the river in high flood (or a combination of both of these effects) or through lateral bank erosion suffosion piping or seepage induced face instability or as a result of crest settlement resulting from strong ground motion (eg Waimakariri River stopbanks September 2010 and February 2011 earthquakes) Lateral bank erosion is more likely to occur on the falling limb of a flood hydrograph as water levels drop average velocities fall off and the bed load sediment transport capacity reduces
At some point during the recession gravel bars will begin to form in the bed and sinusoidal braided flow patterns re-emerge as a result Often when this happens strong flow concentrations can develop that impinge sharply on the stopbank riverside toe When that occurs riprap facing if present can be stripped stub groynes damaged or destroyed and or the stopbank proper eroded If river erosion is sufficiently intense at such locations and persists for long enough the stopbank may be breached With well constructed stopbanks (eg those composed of heavily compacted sandy gravels on good foundations with batters in the order of 2H 1V or flatter and crests of 4m plus) overtopping can be sustained for upwards of 2 hours before breaching occurs Typically failure occurs as a result of erosion at the landward toe which then headcuts through the embankment the higher the stopbank the more aggressive this action is Overtopping failure is likely to be catastrophic in nature whereas lateral bank failure less likely to be given that in the latter case lower water levels (falling stage) conditions are most likely present which tends to limit the outflows that will occur through the breach both in terms of size and duration
note the particular situation and failure consequences of stopbanks where the riverbed is elevated above the surrounding land as now occurs on the Waiho River is considered later in this report cf Sec 90]
In reviewing these comments in the context of the Waiho River stopbanks it is concluded that overtopping and or lateral bank erosion are the two situations which are most likely to cause stopbank failure and in some cases this could result in catastrophic failure The
the stopbanks In the Waiho River case these changes are occurring rapidly and although episodic nevertheless have persisted for some 20 to 30 years and should be expected to continue to persist into the short to medium term (1 to 10 years)
This disparity between natural ground levels on the outside of the stopbank with steadily increasing mean bed levels on the river side of the banks presents a number of engineering problems which need to be addressed
30 31 Waiho RiveR optimal FutuRe management Waiho RiveR optimal FutuRe management
Chapter 8 engIneerIng Issues
chaptEr 9
stoPbank Failure
Stopbank failure along the true left bank upstream of SH 6 would result in loss of the Glacier Access Road and flood damage to SH 6 the Motels Back Packers and any dwellings in its path down stream The southern approach and abutments to the SH 6 Bridge could be damaged in this scenario
Stopbank failure of the structure (s) between SH 6 and Canavans Knob could also affect SH 6 the Motels and Back Packers depending on where the failure occurs Of equal concern is that it might result in an avulsion of the Waiho River through to Dochertyrsquos Creek The double parallel stopbank system presently available in this reach notwithstanding the elevation of the riverbed now well above the natural groundline along SH 6 is a reasonable protection against such an outcome but only if freeboards are maintained and adequate protection against lateral bank erosion is maintained If such an avulsion were to occur there will be major difficulties to overcome to return the river to within the stopbanks Substantial erosion and deposition will almost certainly occur and SH 6 will be out of action until such time repairs can be affected
Overtopping and or lateral erosion of the Canavans Knob to Rata Knoll and the Milton and Otherrsquos stopbanks would result in breaching flows coursing through to Dochertyrsquos Creek damage to SH 6 and flooding through the Lower Waiho Special Rating District area As with the SH 6 bridge to Canavans Knob stopbanks the elevational difference between the riverbed and the surrounding ground outside the stopbank may give rise to an avulsion as well Again the consequences of such an outcome will be great and major difficulties (and cost) experienced in returning the river to its former course and trying to prevent a repeat
Overtopping and or lateral bank erosion on the true right bank below SH 6 will result in substantial damage to parts of the Franz Josef Township loss of the airstrip and almost certainly destruction of the oxidation ponds depending on the location nature and extent of the breaches The consequences of avulsion as described for breaches of the true left stopbank must also be considered here
Stopbank failure can also occur as a result of piping suffusion consolidated settlement of weak foundation material and slumping (ie aseismic failures) and or through the effects of crest settlement as a result of strong ground motions during earthquakes (ie seismic failures) Failure can be either catastrophic or non-catastrophic Catastrophic failures typically occur when a stopbank overtops and fails rapidly whereas non-catastrophic failures occur when these conditions are absent but the stopbank efficacy has never the less been compromised eg suffosion results in flood water leaking through the embankment during high flows where lateral bank erosion damages the stopbank of a flood recession without necessarily breaching the embankment and where crest settlement occurs during earthquakes when the river is not in flood
A more detailed description of these types of failure mechanisms is given in Appendix 1
materials used in their construction the manner in which they have been constructed and the foundations on which they have build suggest that piping failure is highly unlikely Suffosion if it occurs and that is considered reasonably likely with these types of stopbanks will be more of a nuisance that a direct threat to stopbank stability
Clearly in times of flood when high hydraulic gradients are present through the stopbanks because riverbed and hence flood levels are now raised well above the natural groundline outside and on the landward side of the stopbank seepage flow with or without suffosion being present is likely to be readily evident during floods and possible also post flood as shallow groundwater within the elevated riverbed falls Evidence of this phenomena presently exists eg adjacent to the motels on the true left side of the river downstream from the SH 6 bridge and possibly also between the parallel stopbank system extending down to Canavans Knob also on the true left bank of the river
32 33 Waiho RiveR optimal FutuRe management Waiho RiveR optimal FutuRe management
Chapter 9 stopbank faIlure
chaptEr 10
otHer aVulsion tHreats
Two other avulsion threats have been identified in this investigation the first through a low saddle area in the forest on the true right bank of the Waiho River located some 150 to 200m upstream of the SH6 bridge true right abutment and the second across the true right bank at or down stream of the Oxidation Ponds into the Tatare River as discussed earlier in this report
101 Franz Josef township overflow Corridor
The low saddle has an elevation of RL 1600 m (CCSL survey June 2011 Appendix 3) or so which is presently some 66m higher than the mean bed level at that location as extrapolated from the March 2011 mean bed levels calculated at CS 12 and CS 13 Using the calculated mean bed level differences between the June 2008 and March 2011 CCSL surveys on CS 12 and CS 13 an aggradation rate of between 07 and 10myear is derived for this reach adjacent to the low saddle area This has been calculated on the basis that 197m of aggradation occurred between the two surveys and that that change took place either between June 2008 and March 2011 (33 months) or more likely with reference to the OICL SH 6 bridge mean bed level records between March 2009 and March 2011 (24 months) On that basis if the sediment and water supplies to the reach between the WaihondashCallery River confluence and the SH 6 bridge remain more or less as they have over the past 20 to 30 years and the aggradation rates referred to above are reasonable reflections on likely future rates in this critical reach in the short to medium term (1 to 10 years) then overtopping through the low saddle into the Franz Josef Township via this potential overflow corridor may occur with in the next 6 to 10 years If it were allowed to persist an avulsion could conceivably occur (the consequences) for which would be materially worse than flooding and deposition from earlier overflows This scenario would result in the loss of SH 6 in the township Clearly if for any reason erosion rates were to increase significantly from those presently being experienced or any other reason resulting in an increase in the background aggradation rates in this reach used in this calculation then the situation being described could conceivably occur sooner that the 6 to 10 year time span estimated above The converse is also true A reduction in aggradation rates could prolong the initiation of overflows the prospect of degradation occurring which might effectively remove the threat while possible is not considered realistic given the history of aggradation that has been observed and the circumstances that would be necessary on the whole active fan surface to allow this to happen Although gravel extraction could be employed as a short term measure to alleviate the threat the cost of maintaining freeboards by these means on a more permanent basis is considered likely to be unsustainable in the short to medium term and an unrealistic expectation Compounding this approach would be what to do with the excavated material and the knowledge that it Is likely that any material excavated would within a very short time frame be replaced by the river from upstream
On that basis it is opined that the only realistic remedy for preventing this outcome assuming Franz Josef township is to remain in its present location in the foreseeable future would be to construct a suitably robust structure across this potential overflow corridor This would require a significant disturbance to the native forest at that location In coming to this conclusion the caveats that apply from the McSaveney and Davies (2000) and McSaveney Davies and Clarkeson (2003) work are acknowledged and are likely to apply to this suggested
34 35 Waiho RiveR optimal FutuRe management Waiho RiveR optimal FutuRe management
Chapter 10 other avulsIon threats
chaptEr 11
Future ManageMent oPtions
In considering the assessment made here the following options present themselves
1 Do nothing or
2 Status quo or
3 Acceptance of avulsion to the Tartare River or
4 Boundary relaxation
111 the do nothing option
The do nothing option will inevitably lead to overtopping during a flood or floods of any stopbank where freeboards have been eliminated through ongoing bed aggradation That option clearly is not likely to be tenable for NZTA (SH 6 and SH 6 bridge threat) nor the Department of Conservation (Glacier Access Road) and accordingly it is anticipated that these Agencies will continue to raise the stopbanks the Glacier Access Road and the SH 6 Bridge and its approaches in order to preserve these routes If the stopbanks under the management of the WCRC are not similarly adjusted to maintain freeboard then stopbank failure with widespread flooding of the Waiho River Flats the land between the Waiho River and Docherty Creek and parts of Franz Josef and its environs will ultimately occur relatively soon (within 10 years) The area(s) affected in this way will be determined on the basis of where overtopping (or lateral erosion) first occurs This option on the basis of the present evidence indicates strongly that an avulsion into the Tartare River from CS 16 to CS 21 is highly probable in the short to medium term
112 the status Quo option
The status quo option is most probably the one likely to be favoured in the short term both by NZTA Department of Conservation and the WCRC Special Ratings Districts although with respect to the latter the ongoing affordability of that option is something that needs to be addressed This entails continuing to upgrade stopbanks and associated river protection measures to maintain freeboard It is opined that for both options and the do nothing option serious consideration should be given to abandoning rock rip rap spur groynes at least in the reach upstream of SH 6 in favour of rock rip rap cladding in order to preserve as far as practicable the waterway area that can be utilised in order to minimise the active braid in this reach This will entail founding the cladding as the WCRC has done at depth in the bed to minimise the likelihood of scour damage at the toe in major floods An assessment needs to be made of what this depth ought to be having regard to accepted analytical methodologies local knowledge and experience It is accepted that this is not likely to be a long term solution for all parties given that affordability and growth of the hazard will occur as stopbank heights are systematically raised and the elevational difference between the floodplain and the constrained aggrading riverbed gets progressively larger
113 acceptance of avulsion to the tartare river
Regardless of whether the do nothing or status quo options are chosen in the medium to long term if not sooner without human intervention by way of the construction of a
response However on balance it is likely that the works that confine the river already are implicated and what is being proposed will not materially alter what has already occurred and is persisting
102 tatare overflow Corridor
As has previously been described the aggradation which has occurred in the Waiho River active braided riverbed downstream of CS 16 of the CCSL surveys has raised mean bed levels to and possibly higher than the natural banks of the rivers true right berms from the Oxidation ponds through to the Waiho Loop Cross falls are evident on cross sections through this reach which fall towards the true right bank eg CS 16 00055 CS 19 00057 Further to that the land falls in a direct line from the Waiho River true right bank some 49m over a distance of 3130m into the bed of the Tatare at the point where the Tatare begins its cut through the Waiho Loop A similar situation exists from CS 21 where a fall of 10m occurs over a distance of some 890m The fall between these points is estimated at 00105 (CS 23 to Tatare) and 00156 (CS 16) By way of example if we assume a break out occurs around CS 20 into the Tatare a fall of 36 m over 2350m is available overland (s = 0015) If the initial overflow width is in the order of 300m and the hydraulic roughness is set at 008 05m average overflow depth gives a spill discharge in the order of 145 cumec at 10m overflow depth for the same width the overflow discharge becomes 460 cumec Average velocities for the 05m depth will be about 1ms and for the 10m overflow depth 15ms One must expect higher velocities than this because there will be areas where existing swales occur and depths are greater Greater depth results in higher velocities Surface scour will take place where velocities get above 15 ms and headcutting back from the Tatare true left bank must be anticipated as overflows begin spilling into that watercourse If this situation is allowed to occur ie no intervention (stopbanks) take place then over time as this situation is repeated the headward migration of channel erosion back towards the Waiho River from the Tartare River will ultimately lead to either partial or more likely complete capture of the Waiho River by the Tartare River When that happens the present Waiho River course around the south western end of the Waiho Loop will be abandoned although it may still carry flow for a period following capture until full capture is complete At this point very substantial volumes of gravel will have been eroded from the area between the two rivers along the avulsion path and headward erosion will progress upstream in the Waiho Riverbed as the new channel develops Just how fast this process will be and what alignment across the area between the Tatare and Waiho River it takes and where it cuts headwards in the Waiho River is problematic at this point What is certain is that it will have a profound affect on both rivers and quite possibly lead to either the elimination of Lake Pratt or alternatively its growth Aggradation will also occur in the Tartare River However to what extent and how far upstream that progresses has not been assessed at this time Following on from that significant changes in the bed of the Waiho River below the Waiho Loop will be inevitable and just what those will be what their magnitude is and where they are likely to be located has not been assessed at this time
36 37 Waiho RiveR optimal FutuRe management Waiho RiveR optimal FutuRe management
Chapter 11 future management optIons
chaptEr 12
ConClusions
Reflecting on the original brief the following comments are made based on the findings of this investigation accepting that this amounts simply to the Authors view and should not be interpreted as reflecting that of the WCRC NZTA Department of Conservation or any other interested or affected party
1 Keeping the river within its banks is considered a realistic option in the short (1-5 yrs) but inevitably it will have cost and structural stability and hazard growth implications which must be addressed Unless it involves interventions to avert an avulsion of the Waiho River into the Tartare River then capture of the Waiho River by the Tatare now seems inevitable in the short to medium term (1 to 10 yrs) This will almost certainly require within the next 5 to 10 years the construction of a short stopbank on the true right bank of the Waiho River upstream of the SH 6 bridge to prevent overflows from the Waiho River into the Franz Josef township via a low saddle area between the township and the Waiho River If there is an increase in sediment supply which is greater than that observed over the last 20 to 30 years or so then this timeframe will shorten Conversely an easing of supply may well slow aggradation rates in this reach effectively delaying this outcome The likelihood of a degradation cycle occurring and persisting such that it eliminates this risk is not considered realistic in the medium term (10 to 50 years) unless an avulsion into the Tartare River occurs which ultimately lowers the bed levels in this reach to sufficiently remove the threat
2 It hardly needs saying but the management of this river now in the interests of minimising risk to life and property is an extraordinarily complex and difficult exercise Inevitably there must be losers The prospect of an avulsion by the Waiho River into the Tatare looks increasingly probable if not imminent If steps are taken to prevent it the aggressive aggradation now evident over the whole fan surface within the present manmade boundary constraints from the WaihondashCallery River confluence to below the Waiho Loop can be expected to persist if not worsen It is doubtful that maintaining the status quo option indefinitely is in fact possible The costs are likely to be unsustainable for all or some of the parties involved and ultimately the river might anyway have the final say regardless of the best efforts of those charged with maintaining the flood protection systems In light of this it is opined that the way forward may be to maintain the status quo in the short term and carefully evaluate the consequences of an avulsion in order to minimise hazard (to people land and other property ecosystems and community well being) in preparation for an avulsion in the manner described herein
3 The notion that there is a slug of gravel within the Waiho riverbed between the WaihondashCallery River confluence through to and beyond the Waiho Loop that could be encouraged to move on is a misconception and misplaced The aggradation that has occurred on this surface is the result of wholly natural alluvial fan processes and is operating on a scale well beyond effective human intervention management There is good reason to conclude that past and continuing intervention in the form of active river boundary constraints has and still is influencing to an unspecified degree the gradational trends and outcomes now clearly evident
By way of example in order to restore channel capacity and avert an avulsion to the Tartare might require the excavation of gravel deposits off the bed of the river over the reach extending from the SH 6 bridge though to say the downstream end of Miltons and Otherrsquos stop bank a distance of some 5 to 55 km If this channel were constructed 400m wide and 15 m deep we would need to excavate some 3000000 bulk cubic meters of sand and gravel at a cost probably in the order of $10M to $15M That poses three important questions could
stopbank to prevent overflows to the Tatare in times of flood and in the expectation that water and sediment inputs to the fan and hence presently observed aggradation rates are maintained much as they have in the last 20 to 30 years an avulsion to the Tatare looks more certain than any time in the past 10 to 20 years That said is community acceptance of this option tenable In order to determine that a good deal more needs to be learned about how such a situation might progress what consequences could arise and to endeavour to determine realistic bounds on such effects if that is possible The work undertaken to date does not allow that and this must be attended to before this approach could be pursued as a deliberate management option notwithstanding the likelihood of it occurring regardless for the reasons outlined above In effect this would become a medium to long term strategy working in conjunction with the status quo option in the short term with the latter wholly or partially abandoned once the avulsion option is operative
114 boundary relaxation
The boundary relaxation option is not new This option was considered by the WCRC NZTA Westland District Council working party in 2000 [Evaluation of Options for the Management of the Waiho River Aggradation Threats RJ Hall et al (2000)] In effect what it requires is a deliberate action(s) to allow the river to re-occupy part of its natural alluvial fan surface presently unavailable as a consequence of the present boundary constraints along the true left bank from upstream of SH 6 through to the Waiho Loop and downstream If implemented this would require the relocation of a number of dwellings the relocation of SH 6 on the south side of the river the relocation or demolition of the Motel on the south bank and the Backpackers and the abandonment of extensive farmland between the Waiho River and Dochertyrsquos Creek
38 39 Waiho RiveR optimal FutuRe management Waiho RiveR optimal FutuRe management
Chapter 12 ConClusIons
chaptEr 13
aCknoWledgeMents
The Author wishes to acknowledge the assistance and insights provided by staff of the WCRC provided in the course of this investigation in particular the Chief Executive Chris Ingle and Messerrsquos Michael Meehan and Wayne Moen Acknowledgment is also extended to the staff of the Department of Conservation (Franz Josef ) NZTA Opus International Consulting Ltd (Greymouth) for their comments and making available photographic and survey information relevant to this engagement to the staff of the Westland District Council for their comments and to Drrsquos TRH Davies and M McSaveney for their comments and use of material from their 2002 5th International Gravel Bed River Symposium paper Further to that the Author wishes to acknowledge the survey work undertaken by Chris Coll Survey Ltd on this river and the willingness of Chris and Jan Coll and their staff in providing access to and comment on the various surveys of the river undertaken by themselves and others over the years without which this report would have been seriously limited Appreciation is also expressed to Kathy Walters of NIWA for assistance in providing hydrological information from their hydrometric sites at Hokitika Greymouth and Whataroa
RJ HallMIPENZ (Civil Geotechnical) CPEng Int PE (NZ)
RJ Hall Civil amp Associates Ltd
February 2012
resource consent under the Resource Management Act be obtained to execute and maintain work of that kind and scale where would the money come from to do it and where would the spoil go Further to that given the current aggradation rates and giving cognizance to the fact that it is impractical to get the river down to a narrow enough width to promote throughput to the extent that it will not aggrade the present annual aggradation rates would probably fill the channel in less than 2 years at which point one would have to start all over again As has been noted earlier in order to develop a self-sustaining channel one would need to replicate something akin to that presently available in the Callery Gorge That would require a deeper narrower channel heavily rock armoured well beyond anything presently being used and founded at least 5 to 6 m beneath the bed if not more It is opined that the costs of constructing and maintaining such a channel would be well beyond the reach of the Franz Josef community the WCRCrsquos Special Rating Districts NZTA and the Department of Conservation even if cumulatively they favoured the concept The only realistic alternative to a human intervention approach in the manner described above would be to allow the Waiho River to be captured by the Tatare which in time may well provide the relief sought However in saying that there will be unavoidable consequences if and when that situation arises and the riverbed deflation process that is likely to arise on the Waiho River alluvial fan as a consequence may not necessarily be confined to the present braided river bed That is an attendant risk that must be faced
40 41 Waiho RiveR optimal FutuRe management Waiho RiveR optimal FutuRe management
Chapter 13 aCknowledgements
appEndix 1
stoPbank breaCH MeCHanisMs
Piping failure arises where stopbanks have either been constructed in sands and silts or have been built over deposits comprising those types of soils Water seeping through the sand and silts when the river is in flood can erode out fines from the point where the seepage flows exit the embankment and or its foundation As this happens a pipe develops from the outside exit point and systematically erodes in a headward direction back through the embankment or foundation As the pipe develops (lengthens) the soil thickness along the seepage path through which the seepage is occurring upstream from the inward progressing pipe shortens and the hydraulic gradient driving the seepage steepens so the seepage flow increases This results in a steadily increasing (accelerating) flow and at some point the embankment collapses locally (slumps) allowing flows to overtop through the local reduction in crest level and breaching rapidly progresses from there Failure by this means is catastrophic
Suffosion occurs only in coarse grained cohesionless soils such as sandy gravels where seepage flows passing through the embankment and or its foundation under flood systematically erode out the fines leaving a residual coarse grained skeletal soil Failure of a stopbank and or its foundation under these conditions is unlikely to be catastrophic Typically it occurs as steady seepage flows coursing out of the lower third of the outside batter or at the batter toe itself and in that case quiet often as boils that emerge some distance out from the toe proper These outflows can be disturbing to witness but do not necessarily pose an immediate risk although localised sloughing of topsoil and grass cover on the outside batter may occur
Instability of the embankment outer batter capable of causing failure of the embankment proper (deep seated circular failure surfaces) require either poor foundation strength or over steep poorly compacted embankments constructed in weak materials where well established pheratic surfaces have developed through the embankment during a flood These types of failures should they occur will almost certainly be catastrophic Well constructed stopbanks on good foundations and constructed with batters 2H1V or flatter are not likely to fail in this manner because they have both adequate strength to resist such failure and the high compacted soil densities present result in moderate to low soil permeabilities which it turn impede the development of a full pheratic surfaces ie there is insufficient time during a flood for a full pheratic surface to develop In situations where an embankment has experienced prolonged high antecedent rainfall conditions prior to a flood and water content in the embankment is high as a consequence as this water draining through the core a pheratic surface may form but the stopbank design and construction described above normally provides a satisfactory safeguard against this type of failure
Strong ground motions during major earthquakes can result in crest settlement with or without liquefaction being present in stopbanks constructed in well compacted sandy gravels Under these conditions longitudinal cracks can appear in the crest running sub-parallel with the longitudinal direction of the crest For example for a typical stopbank well constructed on good foundations say of 3m height that experiences a M 8 earthquake with peak ground accelerations of say 05 longitudinal cracks of 100 to 200 mm width may appear and settlements of up to 15 of the stopbank height plus foundation depth could occur If we allow a foundation depth of say 2m then the crest settlement could be expected to be in the order of 75 to 100mm It should be apparent that damage of this kind does not
42 43 Waiho RiveR optimal FutuRe management Waiho RiveR optimal FutuRe management
appendIx 1 stopbank breaCh meChanIsms
appEndix 2
CHris Coll surVey ltd MarCH 2011 riVer bed surVey Plans
lead to catastrophic failure unless the dam remains in a damaged state for a period of time after the earthquake unrepaired and a flood event subsequently occurs capable of causing full or partial failure
44 45 Waiho RiveR optimal FutuRe management Waiho RiveR optimal FutuRe management
appendIx 2 ChrIs Coll survey ltd marCh 2011 rIver bed survey plans appendIx 2 ChrIs Coll survey ltd marCh 2011 rIver bed survey plans
46 47 Waiho RiveR optimal FutuRe management Waiho RiveR optimal FutuRe management
appendIx 2 ChrIs Coll survey ltd marCh 2011 rIver bed survey plans appendIx 2 ChrIs Coll survey ltd marCh 2011 rIver bed survey plans
48 49 Waiho RiveR optimal FutuRe management Waiho RiveR optimal FutuRe management
appendIx 2 ChrIs Coll survey ltd marCh 2011 rIver bed survey plans appendIx 2 ChrIs Coll survey ltd marCh 2011 rIver bed survey plans
50 51 Waiho RiveR optimal FutuRe management Waiho RiveR optimal FutuRe management
appendIx 2 ChrIs Coll survey ltd marCh 2011 rIver bed survey plans appendIx 2 ChrIs Coll survey ltd marCh 2011 rIver bed survey plans
52 53 Waiho RiveR optimal FutuRe management Waiho RiveR optimal FutuRe management
appendIx 2 ChrIs Coll survey ltd marCh 2011 rIver bed survey plans appendIx 2 ChrIs Coll survey ltd marCh 2011 rIver bed survey plans
54 55 Waiho RiveR optimal FutuRe management Waiho RiveR optimal FutuRe management
appendIx 2 ChrIs Coll survey ltd marCh 2011 rIver bed survey plans appendIx 2 ChrIs Coll survey ltd marCh 2011 rIver bed survey plans
56 57 Waiho RiveR optimal FutuRe management Waiho RiveR optimal FutuRe management
appendIx 2 ChrIs Coll survey ltd marCh 2011 rIver bed survey plans appendIx 2 ChrIs Coll survey ltd marCh 2011 rIver bed survey plans
58 59 Waiho RiveR optimal FutuRe management Waiho RiveR optimal FutuRe management
appendIx 2 ChrIs Coll survey ltd marCh 2011 rIver bed survey plans
appEndix 3
CHris Coll surVey ltd June 2011 WaiHo busH bloCk
60 61 Waiho RiveR optimal FutuRe management Waiho RiveR optimal FutuRe management
appendIx 3 ChrIs Coll survey ltd June 2011 waIho bush bloCk appendIx 3 ChrIs Coll survey ltd June 2011 waIho bush bloCk
62 63 Waiho RiveR optimal FutuRe management Waiho RiveR optimal FutuRe management
appendIx 3 ChrIs Coll survey ltd June 2011 waIho bush bloCk
appEndix 4
reFerenCes
1 Influence of Channel Width on Bed Load Transport Capacity MA Carson and GA Griffith ASCE Journal of Hydraulic Engineering Vol 113 No 12 Dec 1987 (pp 1489 -1509)
2 Dam Break Flood Hazard from the Callery River Westland New Zealand TR Davies and BK Scott Journal of Hydrology (NZ) 36 (1) 1-13 (1997)
3 Natural Hazards Assessment for the Township of Franz Josef and its Environs MJ McSaveney TRH Davies IGNS Client Report 44714B10 (July 1998)
4 Peer Review of the Institute of Geological and Nuclear Sciences Ltd Report No 44714B10 (July 1998) Natural Hazards Assessment for the Township of Franz Josef and its Environs RJ Hall RJ Hall Civil amp Environmental Consulting Ltd (August 1998)
5 Evaluation of Options for the Management of the Waiho River Aggradation Threats RJ Hall et al (2000)6 Anthropogenic Fanhead Aggradation Waiho River Westland New Zealand TR Davies MJ McSaveney
Proceedings 5th International Gravel-bed Rivers Symposium Christchurch and Franz Josef (2000)7 The Transit New Zealand Waiho Workshop HL Rouse TJ Day TRH Davies Proceedings 5th International
Gravel-bed Rivers Symposium Christchurch and Franz Josef (2000)8 Landslide-dambreak Floods at Franz Josef Glacier Township Westland New Zealand a Risk Assessment TR Davies
Journal of Hydrology (NZ) Vol 41 No 1 (2002) 9 Anthropogenic Aggradation of the Waiho River Westland New Zealand TR Davies MJ McSaveney PJ
Clarkeson Earth Surfaces Processes and Landforms 28 209-218 (2003)10 How High are Bed Moving Flows in New Zealand Rivers B Clausen D Plew Journal of Hydrology (NZ) Vol 43 No
1 (2004)11 Geomorphic Constraints on the Management of Bed-load Dominated Rivers TR Davies MJ McSaveney Journal
of Hydrology (NZ) 45 (2) 69-88 (2006) 12 Geology of the Aoraki Area 1 250000 Geological Map 15 SC Cox DJA Barrell compilers IGNS (2007)13 West Coast Regional Council Waiho River Flood Protection Scheme Design Flood Levels Good Earth Matters Ltd
(2008)14 Preparing For Climate Change A Guide for Local Government in New Zealand Ministry for the Environment (2008)15 Waiho River Bed Surveys June 2008 and March 2011 Chris Coll Surveying Ltd (2011)16 Topographical Survey of the Waiho Bush Block Chris Coll Surveying Ltd (2011)17 Mean Bed Level Survey Record Waiho River SH 6 Bridge February 1997 ndash May 2011 Opus International Consultants
Ltd 18 WCRC Asset Management Plans for the Franz Josef Special Rating Area the Lower Waiho Rating District (December
2010)19 Video of Callery Fly Over 2011 Opus International Consultants Ltd (2011)20 Oblique Stills Callery Fly Over 2011 Department of Conservation Franz Josef (2011)21 WCRC Staff Aerial Inspection ndash Callery 6 September 2011 W Moen WCRC (7 September 2011)22 Planning for a Safer Franz Josef ndash Waiau Community Westland District Considering Rupture of the Alpine Fault
RM Langridge amp JG Beban GNS Science Consultancy Report 2011217 (September 2011)23 Callery River Landslide Dam Rapid Assessment of Dam Failure Consequences for West Coast Regional Council R
Measures M Duncan NIWA (September 2011)24 NIWA Flood Annual Flood Record and Annual Means Site 89301 Whataroa River at SH 6 1985 ndash 2011 NIWA (2011)25 Report on West Coast Weather Event 27 amp 28 December 2010 West Coast Regional Council report (2011)
64 65 Waiho RiveR optimal FutuRe management Waiho RiveR optimal FutuRe management
appendIx 4 referenCes
appEndix 5
tables
Cros
s se
ctio
n
thal
weg
dis
tanc
e ( m
)
Mbl
Jan-
02 (
rl m
)
Mbl
Jun-
08 (
rl m
)
Mbl
Mar
-11
( rl
m )
Chan
ge M
bl Ja
n 02
- Ju
ne 0
8 ( r
l m
)
Chan
ge M
bl Ju
ne 0
8 - M
ar
2011
( r
l m
)
rate
Cha
nge
Mbl
Jan
02 -
June
08
( m
yr )
rate
Cha
nge
Mbl
June
08
- M
ar 2
011
( m
yr
)
rati
o M
bl C
hang
e pe
r yr
2008
- 20
11 to
200
2 - 2
011
Chan
ge in
Vol
ume
( m
3 ) 20
02 -
2008
Chan
ge in
Vol
ume
( m
3 ) 20
02 -
2011
10 0 15305 15855 16039 551 184 0816 0689 08
11 209 15484 15572 157785 088 207 0131 0775 59 103269 68536
12 417 15308 15328 154969 020 169 0030 0632 212 21893 81442
13 821 15053 15043 15139 -010 097 -0015 0363 00 4656 129254
14 1113 14594 14656 14754 062 098 0092 0369 40 18638 70075
15 1377 14354 14387 14463 033 076 0049 0284 58 36017 68155
16 1795 13934 13963 14017 029 055 0043 0205 48 79237 159891
17 2268 13428 13452 13515 024 063 0035 0237 68 115310 261502
18 2740 12947 12918 12971 -029 053 -0043 0197 -45 -3499 247856
19 3158 12449 12484 12522 034 038 0051 0143 28 -54 147467
20 3923 11626 11678 11703 051 026 0076 0097 13 156610 134985
21 4618 10901 10932 10949 031 017 0045 0065 14 224717 123676
22 5418 10101 10104 10100 003 -005 0004 -0017 -40 613958 -560100
23 6114 9343 9504 9397 161 -108 0239 -0403 00 635880 -761619
2006631 171120
TABle 1 Waiho River at Franz Josef Mean Bed Level and Volumetric Changes Summary January 2002 ndash June 2008 and June 2008 ndash March 2011 River Bed Surveys
66 67 Waiho RiveR optimal FutuRe management Waiho RiveR optimal FutuRe management
appendIx 5 tables
recurrence interval t
(yrs)
Qpk(eV 1)
(cumec)
Qpk + 10(cumec)
Qpk + 15(cumec)
23 1230 1350 1400
5 1550 1700 1800
10 1640 1800 1900
20 1730 1900 2000
50 1820 2000 2100
100 1910 2100 2200
note Waiho River estimates derived from an EV 1 analysis of Whataroa River at SH 6 which were scaled by the area factor [A waiho A whataroa]⁰⁸
TABle 2 Flood Frequency Estimates for the Waiho River based on the Whataroa River at SH 6
appEndix 6
Figures
68 69 Waiho RiveR optimal FutuRe management Waiho RiveR optimal FutuRe management
appendIx 5 tables
appEndix 7
glossary oF terMs
active gully erosion Erosion that is presently occurring on the sides and floor of a gully during rainstorms which results in an expansion of the gully (viz depth width) and delivers sediment downstream into the main river system of which it is an integral part
aggradation The process whereby sands and gravels accumulate in a riverbed causing the bed level to riseaggrading Phase A term used to describe a period when aggradation is occurring in a river or on an active
alluvial fanalluvial Fan The fan shaped surface built up by a river over extended time where it exits in a confined reach
typically where a river emerges from a hill catchmentannual exceedence Probability The probability that an event (rainstorm flood) of a specific size will occur on
average in any one year (the mathematical reciprocal of the return period or recurrence interval for that event)
annual series Maxima A table comprising the highest flow recorded at a hydrometric site for each year of record and is used for determining the flood frequency characteristics of that site
antecedent rainfall That rainfall that occurs prior to the onset of a rainstorm and which pre-soaks the soil assisting in the development of runoff from the storm when it occurs
anthropogenic Something which has occurred or will occur as a result of human activity or influenceappurtenant structures A structure that is integrally required for the satisfactory performance of another
structure eg rock riprap stub groynes to provide protection to the riverside toe and batter of a stopbankaverage Water depth The water depth averaged over a cross section for a particular flowavulsion The sudden change in direction of a river that occurs as a result of a break out usually occurring during
a flood so that the river abandons its original course in favour of the new alignmentbedload dominated river A river in whose form has been sculptured by the erosion storage and transport of
gravel as bedloadbenchmark level The level referenced to a particular survey datum that is set on a permanent reference point
(bench mark) for survey purposesboils The localised appearance of water and fine soil particles such as sands and silts that occur where
concentrated seepage flows emerge at groundlinebraided river The description for a wide generally steep gravel bed river that has a multitude of interlacing
channelsCalibration run The running of an hydraulic model using selected known flows and water profiles in order to
determine what surface roughnessrsquos are required to obtain realistic model performanceCatchment Processes The physical processes operating within a catchment which influence the rate of runoff
and hence river flow during rainstormsChannel gradient The average slope of a channel reach measured along the flow path of the riverCross Fall The gradient that occurs on the bed of a river that runs at right angles to the primary down valley
gradient of the riverbedCrest settlement The lowering of the crest level of a stopbank caused by either settlement in the stopbank
foundation where weak materials are present or as a result of internal erosion of the stopbank or where liquefaction has occurred or through slumping caused by erosion of the stopbank or lateral spreading of the stopbank foundation as a result of earthquake action
Current Morphological status The present state that a river is in given that the rivers form tends to change over time in response to climatic and geological influences which can affect sediment supply catchment runoff and hence river flows channel gradient and sea level
dam break surges The waves of water and debris that move rapidly downstream from a debris dam when it fails
debris dams Obstructions that occur in confined river reaches from time to time and typically comprise rock regolith vegetation etc which obstruct the flow of water and cause it to dam
debris Flow A fluvial phenomena that can occur in steep channels usually as a result of intense rainfall on an already wet catchment the debris flow manifests as a slug or series of slugs of water and sediment travelling
DoCheRtY CReeK
1km 1mi
FRanZ JoSeF toWnShip
Canvans Knob
Franz Josef Stopbanks
Canavans Knob Stopbank
Rubbish Dump Stopbank
milton amp others Stopbank
State highway
State highway
Bridge
Sewerage ponds
nZta
WCRC
hokitika airport authority
Department of Conservation
Westland District Council
tartare gorge
Waiho loop
Rata Knoll
WAIHO RIVER
CalleRY RiveR
70 71 Waiho RiveR optimal FutuRe management Waiho RiveR optimal FutuRe management
appendIx 7 glossary of terms appendIx 7 glossary of terms
rapidly downstream as a dense slurry which may have incorporated within it woody debris such as tree trunks and branches
debris Flow activity The occurrence of debris flowsdebris traps Places within a catchments river system where sediment tends to accumulatedegradation The opposite process to aggradation whereby sands and gravels are eroded out of the riverbed
and the riverbed fallsdeflation of the bed The steady reduction in elevation of an eroding surface (river bed) over time under the
influence of surface erosion processesdesign Flood levels The maximum water level relative to a prescribed design datum set at a particular location
on a river required to contain the design flood carrying capacity of the river control systemdetritus The products of erosion that is delivered into a river system form the slopes where it has been generated
by weathering and erosion processesdistal end of an alluvial Fan The furthest end of an alluvial fan from the fan head and typically the lowest
elevation on the fan surface provided the fan has not been truncated by erosion by the river or by wave action on a lake or the sea
episodic Events that occur irregularly in timeFalling limb of a Hydrograph That part of the flood hydrograph after the peak where the flood recession
occursFlood Carrying Capacity An estimate of the peak flow in m3 per second that a river control system (can contain
without exceeding its freeboard where a river has stopbanks it is the flow contained within the stopbanks whilst maintaining the design freeboard
Flood Frequency estimates A statistical process for estimating the recurrence interval of various flood discharges for a particular hydrometric site using the annual maxima series for that site
Flood Peak The maximum flow reached by a river in flood measured in m3 per secondFlood Plain The surface over which a river can spread in times of flood once it overtops its natural banks Flood Volume The total volume of water delivered by a river in flood over the duration of the flood and measured
in m3 Fluvial Characteristics The characteristics of a river which describe the storage transport and reworking of river
sediments by the rivers flowsgeomorphic Constraints Physical factors such a rate of uplift hardness of basement rock present sea level
which limit for example the generation of sediment supply and gradient of a river and hence influence the form of a river
glacial internal drainage systems Subsurface watercourses located in and beneath a glacier that convey water from the surface and sides of a glacier into through and beneath a glacier and discharge to the valley floor at the glacier terminal face
glacier retreat The process whereby the terminal face of the glacier is located progressively up the valley as the glacier ice volume is reduced by ablation
Headcut The formation of an erosion cusp in a channel that results in a localised step in a channel bedHeadward erosion The erosion that generates and maintains the headward movement of the erosion cusp
(headcut)Hydraulic Characteristics The flow characteristics of a river system such as flow depth water velocity channel
surface roughness and channel slope (gradient)Hydraulic gradient The slope on a flowing water surfaceHydrometric site A water level measuring site which continuously measures and records water depth at the site
at specific time intervals used for establishing flow records over the full range from low to high flow landslide dam A dam that forms in a confined reach of a river as a result of landslide occurring and partially
blocking the valley through which the river is flowinglateral bank erosion The processes whereby a river erodes its banks generally used with reference to the
erosion of stopbanks when a river moves side ways in a flood eroding the stopbank in the process on the riverside of the stopbank
liquefaction The sudden loss of strength of an unconsolidated or poorly consolidated saturated fine sand soil induced by violent earthquake shaking
lithologies A geological term used for describing rock typeslive bed Conditions The condition that may occur in a riverbed in flood when the deposits which form the
riverbed and banks begin to mobilise and become entrained in the flow and move downstreamMass Movement The downslope movement of regolith and other erosion products in bulk eg slab avalanches
landslides debris flows
Mean bed level The average level of a riverbed across a particular cross section at a particular time estimated from a surveyed cross section at a particular time
Micro scale Modeling The development and running of a small scale physical replica of a particular physical feature such as an active alluvial fan in a laboratory situation
Morphologically active alluvial Fan An alluvial fan that is either aggrading or degrading under its present sediment and water supply and under the influence of local morphological constraints
natural Hazards Any atmospheric or earth or water related occurrence (in the Waiho River context including earthquake erosion landslip Subsidence sedimentation wind drought or flooding) the actions of which adversely affects or may affect human life property or other aspects of the environment
overtopping The term used to describe the situation where floodwaters in a river in flood begin to spill over the rivers banks or stopbanks whichever is relevant to the particular situation being considered
Permeability A term used to describe and quantify that property of a soil that permits water to flow through the pores of the soil under a hydraulic gradient
Pheratic surface The curvilinear water surface within the soils of a stopbank or dam through which water is seeping marking the boundary between saturated and un-saturated soils
Predictive tool A procedure such as a hydraulic model that is developed in order to try and determine how a particular physical situation might develop over time under specified inputs (eg water bedload supply)
Prograding The episodic growth of an alluvial fan surface which causes the distal end of the fan to extend downstream away from the fan head
recession That period during a flood when the river has passed its peak and water levels and hence flow rates are dropping
recurrence interval A statistical term used to describe the relative size of an event (synonymous with the term average return period) eg a particular rainfall depth or flood flow A 1 in 100 year flood has a recurrence interval of 100 years on average It does not mean that an hundred year flood will not occur again for 100 years if an event of that size has just been experienced
regolith The accumulation of soil material on a hill slope as a result of the weathering of the hill slope over time Typically regolith includes clay and sand size particles rock fragments and soil
regolith avalanches The localised movement of regolith rapidly off a hill slope onto the valley floor or riverbed in the form of an avalanche
residence time The time that elapses for example between bed load sediments accumulating at a particular location and subsequently being eroded out
revegetation The decolonization with new vegetation on areas such as slopes denuded of vegetation by landslides
river bed roughness A hydraulic term which reflects the relative roughness of the surface of a riverbed or its berms that is used in hydraulic computations
river Cross sections A survey of ground levels extending across a river from its true left bank to its true right bank aligned more or less at right angles to the rivers flow in times of flood
river reach A description for a particular stretch of a riverriver training and Protection Works Structures erected by humans in an attempt to mitigate against riverbank
erosion and channel migration during floodsrelaxation Removing the boundary constrains on a stopbanked river to allow the river to reassert its natural
form on the floodplain unimpeded by man made flood containment structuresrock rip rap A term used to describe the coarse hard rock that is placed against a surface that may be eroded
by river flows in order to mitigate against such erosion sediment sources Those parts of a river catchment that supply sediment to the river as sediment supplysediment supply The sediment that passes through a river system typically of an episodic nature ie the rate of
supply varying over time typically in response to climatic conditions and river flowseismic induced Mass Movement Landslide activity caused by seismic activityshallow slab avalanches Landslides that typically occur on steep valley sides where the basement rock is close
to the surface (eg within 1 to 2 metres of the surface)sinusoidal braided Flow PatternsTheldquoSrdquoshapedchannelinducedflowpatternsobservedinbraidedriversspecial rating district A Rating District established for the construction and ongoing repair and maintenance
of a river control scheme the rating district is administered by the West Coast Regional Councilsplinter Faults Fault lines that extend out at an angle from a main fault linespur groynes Short groynes that are constructed at the toe of a natural river bank or stopbank that project out
into the riverbed designed to ease high flow velocities of the natural bank or stopbank toe in order to lessen the risk of lateral erosion by the river in flood
72 73 Waiho RiveR optimal FutuRe management Waiho RiveR optimal FutuRe management
appendIx 7 glossary of terms
stopbank A structure erected on a rivers floodplain typically sub-parallel to the rivers flow in times of flood to contain flood flows up to the design standard of the flood protection scheme to prevent them from spilling onto the floodplain
sub-alpine vegetation Typically shrubby bushes grasses and stunted trees that grow above the bush line but below the sparsely vegetated alpine area of a mountain range
sub ndash Parallel More or less parallelsuper-elevation effect The local elevation of water levels around the outside of a bend in a river caused by
centrifugal forces generated by the water moving around the river bendswale The remnant of a river channel on a riversrsquo floodplain that has been etched by river flows in the past and
has subsequently been abandoned by the normal flow of the river but can activate when rivers overtop their natural banks and flow onto the flood plain they may also convey surface runoff from local rainstorms from time to time
temporal supply Mechanism A process that generates sediment supply to the river system and is time dependent
thalweg The centreline path the active riverbed takes as it flows down plainthreshold Flood event A flood event of sufficient size that it overtops a rivers confining banks natural or man
made transfer reach That part of a mountain catchment located in the foothill area upstream of the head (or apex)
of an alluvial fan generally a gorge or narrow confined reach with little opportunity for coarse sediment storage coarse sediments tend to flush through these reaches during floods rather than accumulate as they might on the fan surface proper
two dimensional Hydraulic Model A computer model that incorporates a digital terrain model to provide the basis for determining water depths and velocities over that surface for a particular design flood flow
Wasting out The eroding out of deposits over time
74 Waiho RiveR optimal FutuRe management
388 Main South Road PO Box 66 Greymouth
phone +64 3 768 0466
email infowcrcgovtnz
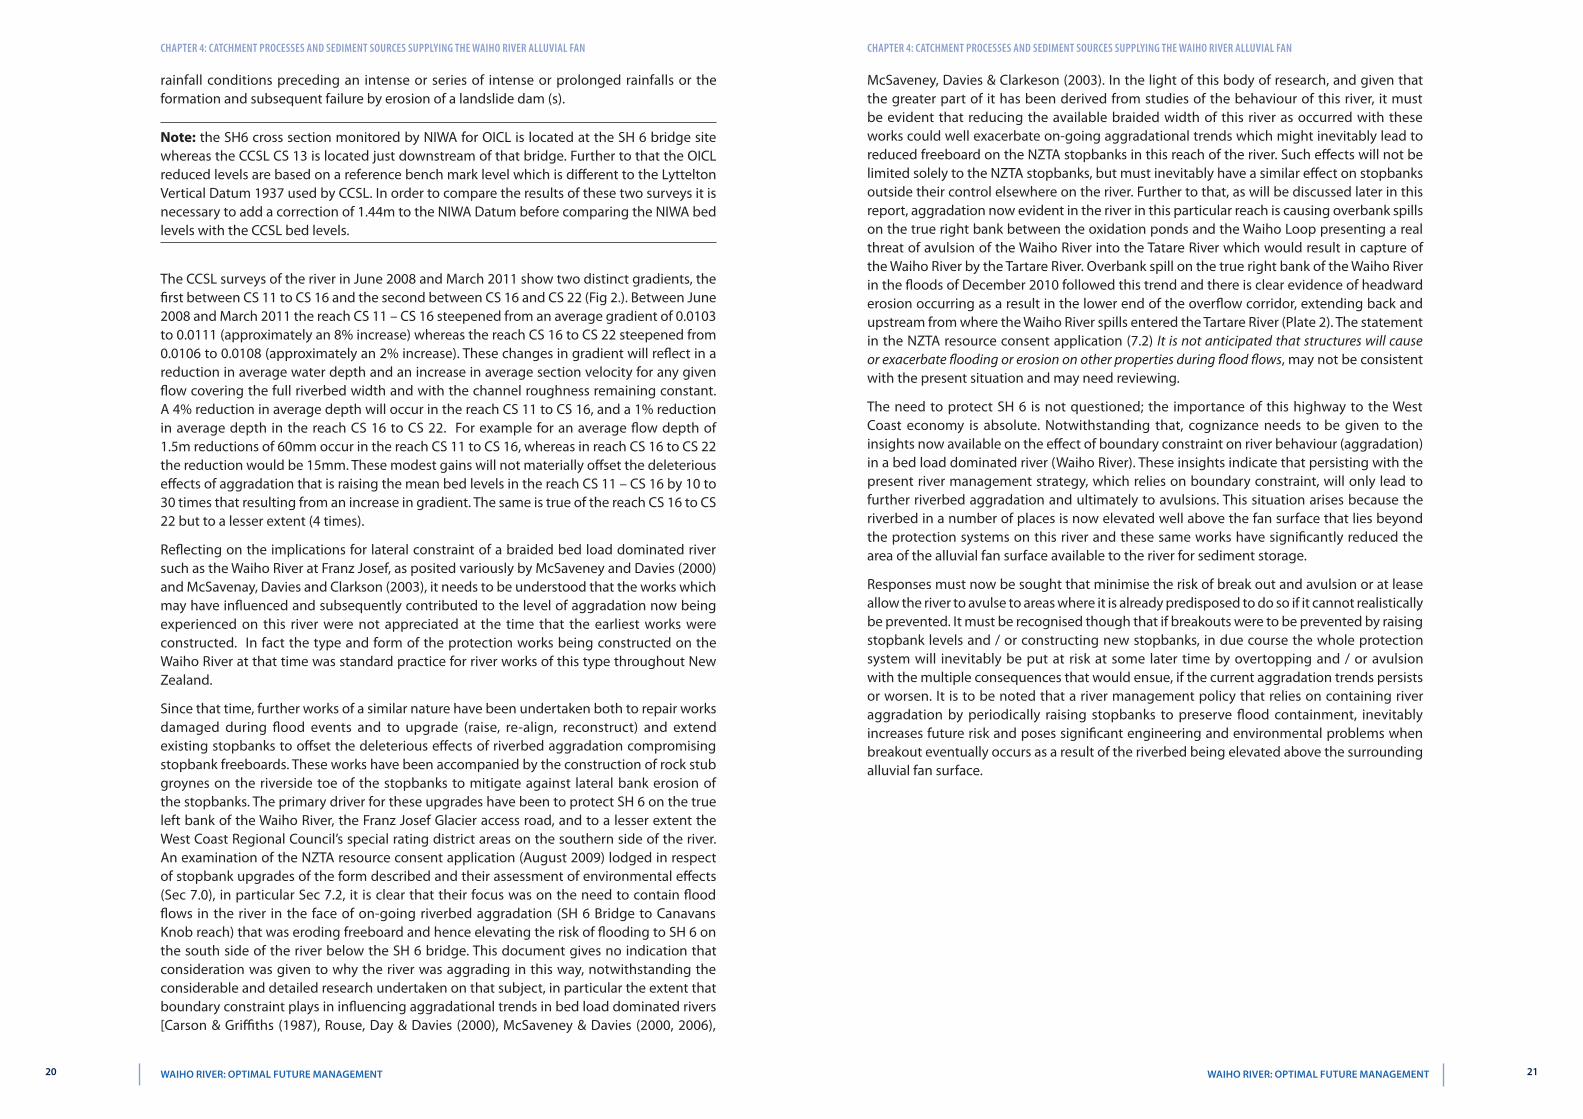
Chapter 4 CatChment proCesses and sedIment sourCes supplyIng the waIho rIver alluvIal fan Chapter 4 CatChment proCesses and sedIment sourCes supplyIng the waIho rIver alluvIal fan
McSaveney Davies amp Clarkeson (2003) In the light of this body of research and given that the greater part of it has been derived from studies of the behaviour of this river it must be evident that reducing the available braided width of this river as occurred with these works could well exacerbate on-going aggradational trends which might inevitably lead to reduced freeboard on the NZTA stopbanks in this reach of the river Such effects will not be limited solely to the NZTA stopbanks but must inevitably have a similar effect on stopbanks outside their control elsewhere on the river Further to that as will be discussed later in this report aggradation now evident in the river in this particular reach is causing overbank spills on the true right bank between the oxidation ponds and the Waiho Loop presenting a real threat of avulsion of the Waiho River into the Tatare River which would result in capture of the Waiho River by the Tartare River Overbank spill on the true right bank of the Waiho River in the floods of December 2010 followed this trend and there is clear evidence of headward erosion occurring as a result in the lower end of the overflow corridor extending back and upstream from where the Waiho River spills entered the Tartare River (Plate 2) The statement in the NZTA resource consent application (72) It is not anticipated that structures will cause or exacerbate flooding or erosion on other properties during flood flows may not be consistent with the present situation and may need reviewing
The need to protect SH 6 is not questioned the importance of this highway to the West Coast economy is absolute Notwithstanding that cognizance needs to be given to the insights now available on the effect of boundary constraint on river behaviour (aggradation) in a bed load dominated river (Waiho River) These insights indicate that persisting with the present river management strategy which relies on boundary constraint will only lead to further riverbed aggradation and ultimately to avulsions This situation arises because the riverbed in a number of places is now elevated well above the fan surface that lies beyond the protection systems on this river and these same works have significantly reduced the area of the alluvial fan surface available to the river for sediment storage
Responses must now be sought that minimise the risk of break out and avulsion or at lease allow the river to avulse to areas where it is already predisposed to do so if it cannot realistically be prevented It must be recognised though that if breakouts were to be prevented by raising stopbank levels and or constructing new stopbanks in due course the whole protection system will inevitably be put at risk at some later time by overtopping and or avulsion with the multiple consequences that would ensue if the current aggradation trends persists or worsen It is to be noted that a river management policy that relies on containing river aggradation by periodically raising stopbanks to preserve flood containment inevitably increases future risk and poses significant engineering and environmental problems when breakout eventually occurs as a result of the riverbed being elevated above the surrounding alluvial fan surface
rainfall conditions preceding an intense or series of intense or prolonged rainfalls or the formation and subsequent failure by erosion of a landslide dam (s)
note the SH6 cross section monitored by NIWA for OICL is located at the SH 6 bridge site whereas the CCSL CS 13 is located just downstream of that bridge Further to that the OICL reduced levels are based on a reference bench mark level which is different to the Lyttelton Vertical Datum 1937 used by CCSL In order to compare the results of these two surveys it is necessary to add a correction of 144m to the NIWA Datum before comparing the NIWA bed levels with the CCSL bed levels
The CCSL surveys of the river in June 2008 and March 2011 show two distinct gradients the first between CS 11 to CS 16 and the second between CS 16 and CS 22 (Fig 2) Between June 2008 and March 2011 the reach CS 11 ndash CS 16 steepened from an average gradient of 00103 to 00111 (approximately an 8 increase) whereas the reach CS 16 to CS 22 steepened from 00106 to 00108 (approximately an 2 increase) These changes in gradient will reflect in a reduction in average water depth and an increase in average section velocity for any given flow covering the full riverbed width and with the channel roughness remaining constant A 4 reduction in average depth will occur in the reach CS 11 to CS 16 and a 1 reduction in average depth in the reach CS 16 to CS 22 For example for an average flow depth of 15m reductions of 60mm occur in the reach CS 11 to CS 16 whereas in reach CS 16 to CS 22 the reduction would be 15mm These modest gains will not materially offset the deleterious effects of aggradation that is raising the mean bed levels in the reach CS 11 ndash CS 16 by 10 to 30 times that resulting from an increase in gradient The same is true of the reach CS 16 to CS 22 but to a lesser extent (4 times)
Reflecting on the implications for lateral constraint of a braided bed load dominated river such as the Waiho River at Franz Josef as posited variously by McSaveney and Davies (2000) and McSavenay Davies and Clarkson (2003) it needs to be understood that the works which may have influenced and subsequently contributed to the level of aggradation now being experienced on this river were not appreciated at the time that the earliest works were constructed In fact the type and form of the protection works being constructed on the Waiho River at that time was standard practice for river works of this type throughout New Zealand
Since that time further works of a similar nature have been undertaken both to repair works damaged during flood events and to upgrade (raise re-align reconstruct) and extend existing stopbanks to offset the deleterious effects of riverbed aggradation compromising stopbank freeboards These works have been accompanied by the construction of rock stub groynes on the riverside toe of the stopbanks to mitigate against lateral bank erosion of the stopbanks The primary driver for these upgrades have been to protect SH 6 on the true left bank of the Waiho River the Franz Josef Glacier access road and to a lesser extent the West Coast Regional Councilrsquos special rating district areas on the southern side of the river An examination of the NZTA resource consent application (August 2009) lodged in respect of stopbank upgrades of the form described and their assessment of environmental effects (Sec 70) in particular Sec 72 it is clear that their focus was on the need to contain flood flows in the river in the face of on-going riverbed aggradation (SH 6 Bridge to Canavans Knob reach) that was eroding freeboard and hence elevating the risk of flooding to SH 6 on the south side of the river below the SH 6 bridge This document gives no indication that consideration was given to why the river was aggrading in this way notwithstanding the considerable and detailed research undertaken on that subject in particular the extent that boundary constraint plays in influencing aggradational trends in bed load dominated rivers [Carson amp Griffiths (1987) Rouse Day amp Davies (2000) McSaveney amp Davies (2000 2006)
20 21 Waiho RiveR optimal FutuRe management Waiho RiveR optimal FutuRe management
Chapter 4 CatChment proCesses and sedIment sourCes supplyIng the waIho rIver alluvIal fan
chaptEr 5
Present Condition oF tHe WaiHo riVer
The GEML (2002) report cites an estimate made by CCSL of nett aggradation in the river system between cross section 10 (WaihondashCallery River confluence) and cross section 23 (just downstream of the Waiho Loop) of 1700000 m3 between the Jan 2002 and June 2008 surveys A similar exercise undertaken by RJ Hall of RJ Hall and Associates Ltd (RJHAL) based on the June 2008 and March 2011 surveys indicate that a further 170000 bulk m3 has accumulated in this reach (Table 1) More significantly though if the assessment is made from CS 10 to CS 21 ie from the WaihondashCallery River confluence to the upstream end of the Waiho Loop the picture is quiet different Between the 2002 and 2008 surveys it is estimated that some 076 bulk m3 of material was stored on the fan between CS 10 and CS 21 (average annual accumulation rate 118000 m3 yr) and between 2008 and 2011 1490000 bulk m3 (average annual accumulation rate of 540000 m3 yr) An examination of OPUS International Consulting Ltd (OICL) mean bed level record at CS 3 (ie at the SH 6 Bridge) shown on Fig 2 indicates that the bulk of this change may in fact have occurred between March 2009 and March 2011 Of significance some 47 of this aggradation occurred between CS 17 (lower end of the Franz Josef stopbank true right bank where SH6 turns north east away from the river) and CS 21 (a short distance upstream from where the river turns and begins its approach to the gap between Rata Knoll and the Waiho Loop) Fig 4 also shows the changes in volume stored per unit length of riverbed between 1993 and 1999 (Fig 6 of McSaveney amp Davies [2000])
1000000
800000
600000
400000
200000
00000
-200000
-400000
-600000
-800000
-1000000
-120000010000 2000 3000 4000 5000 6000 7000
thalweg Distance From CS 10 ( m )
volu
me
chan
ge
( m3
) K
m a
lon
g t
hal
weg
Column AB
Column Y
Column O
Fig 4 Waiho River at Franz Josef CS 10 to CS 23 Volumetric Rate of Change along the Thalweg Jan 2002 to June 2008 and June 2008 to March 2011 surveys including TRH Davies Data 1993 to 1999
A comparison between the changes that took place between 1993 and 1999 and the changes that have occurred now ie 2008 to 2011 show similar trends although it is noted that there are some clear differences apparent Upstream of the SH 6 bridge there has been significant increase in the rate of aggradation in recent times The 400m reach extending immediately downstream from the bridge remains more or less unchanged but below that point in the reach through to Rata Knoll the situation has changed significantly Whereas in the period 1993 to 1999 there was net degradation evident in the reach between the
22 23 Waiho RiveR optimal FutuRe management Waiho RiveR optimal FutuRe management
Chapter 5 present CondItIon of the waIho rIver Chapter 5 present CondItIon of the waIho rIver
Fig 5B Waiho River at Franz Josef CS 18 Corridor Plots based on the January 2002 June 2008 and March 2011 River Surveys
0 20 40 60 80 100 120
128
126
124
122
mea
n B
ed l
evel
( m
)
Row 9
Row 22
Row 39
elapsed time from Jan 2002 ( months )
Fig 5C Waiho River at Franz Josef CS 19 Corridor Plots based on the January 2002 June 2008 and March 2011 River Surveys
0 20 40 60 80 100 120
120
115
110
mea
n B
ed l
evel
( m
) Row 10
Row 23Row 40
elapsed time from Jan 2002 ( months )
Fig 5D Waiho River at Franz Josef CS 20 Corridor Plots based on the January 2002 June 2008 and March 2011 River Surveys
In considering these results ie 700000 m3 fan aggradation (January 2002 - June 2008) and then 1500000 m3 fan aggradation (June 2008 ndash March 2011) between CS 10 and CS 21 and the fact that aggradation is now well advanced between Canavans Knob and the Waiho Loop and is evidently extending downstream from the Waiho Loop with mean bed levels now close to at or above the natural ground level on the true right bank at and downstream of the Oxidation Ponds through to the Waiho Loop the following preliminary conclusions are drawn
1 Mean bed levels on the true right bank of the active braided bed of the Waiho River between the Oxidation Ponds (CS 19) and the Waiho Loop (CS 20) are such that the bed levels is at or marginally higher than the berm area on that side of the river Further to that a more detailed examination of CS 19 to CS 20 show a pronounced cross fall over the riverbed in this reach extending from the true left bank towards the true right bank an effect that has been present and maintained from the 2002 riverbed surveys through to the 2011 survey These trends presently predispose the river to overflow its true right bank in this reach during floods
2 Overflows from the Waiho River in the vicinity and down stream of the Oxidation Ponds through to the Waiho Loop on the true right bank must be anticipated in flood events at least as low as annual exceedence probability of 20 (1 in 5 yr recurrence interval) noting that overflows towards the Tatare River occurred in this area in the December 2010 flood
Oxidation Ponds and the Waiho Loop that trend has now completely reversed Aggradation in this reach is now occurring to varying degrees at rates per unit thalweg length two to three times that of the period 1993 ndash 1999 with aggradation now evident extending over the full length of the river from the WaihondashCallery River confluence through to just downstream of the Waiho Loop
The changes that occurred between the 1993 ndash 1999 period and the 2008 ndash 2011 period indicate that the alluvial fan is now aggraded over its length from the WaihondashCallery River confluence to at least immediately below the Waiho Loop This means that the Waiho River alluvial fan is now prograding within the artificial boundary constraints present on the true left bank through to and downstream of the Waiho Loop and on the true right bank from the SH 6 bridge through to the Oxidation Ponds
An analysis of mean bed levels in the reach extending from CS 16 to CS 21 shows a pronounced cross fall on the river extending from the true left bank towards the true right bank (Fig 5A to 5D inclusive) This analysis has been made by splitting each of the cross sections used in the analysis into three equal length sections and calculating mean bed levels for each of these sub ndash section widths Further to that CS 17 CS 19 and CS 20 have been corrected for skew by rotating each of these cross sections in a clockwise direction eg 63ordm (CS 17) 111ordm (CS 19)and 101ordm (CS 20) and then adjusting the sub section mean bed levels to reflect the effects of the rotations This step was taken in order that the modified cross section was orientated approximately normal (ie at right angles) to the rivers overall flood flow direction What these plots clearly show is the true left subndashwidth sections being elevated above both the central and true right subndashwidth sections this clearly indicates the presence of the cross fall and its persistence from the January 2002 through to the March 2011 surveys This situation will have the effect of predisposing the river to move towards the true right bank and overflow in the reach between CS 19 (Oxidation Ponds) and CS 20 (upstream side of Waiho Loop) and contribute to the risk of avulsion of the Waiho River into the Tartare River whilst these trends prevail
0 20 40 60 80 100 120
140
135
130
mea
n B
ed l
evel
( m
)
Row 7
Row 20
Row 37
elapsed time from Jan 2002 ( months )
Fig 5A Waiho River at Franz Josef CS 17 Corridor Plots based on the January 2002 June 2008 and March 2011 River Surveys
0 20 40 60 80 100 120
140
135
130
125
mea
n B
ed l
evel
( m
)
Row 20
Row 8
Row 38
elapsed time from Jan 2002 ( months )24 25 Waiho RiveR optimal FutuRe management Waiho RiveR optimal FutuRe management
Chapter 5 present CondItIon of the waIho rIver
chaptEr 6
reVieW oF tHe CatCHMent Hydrology
A review of the catchment hydrology has been undertaken using the NIWA record from the Whataroa River hydrometric site at SH 6 (1985 ndash 2011) catchment area 445 Km2 The Waiho River at SH 6 has a catchment in the order of 170 Km2 An EV1 (Gumbel) analysis was carried out on the Whataroa River using the annual series maxima for that river and from the flood frequency estimates for the Waiho River flood estimated on the basis of the ratio of the catchment area of the Waiho River to that of the Whataroa River raised to the power of 08 The Whataroa River catchment was chosen because of its proximity to the Callery River they have a common boundary both are clad in a combination of forest and subalpine vegetation similar lithologies and lie on the western side of the Main Divide Estimates have also been made to take into account projected climate change effects through to 2040 using the MFE (2006) procedure An increase in temperature ranging between 14ordmC and 19ordmC was used (cf Table 2 MFE) and a 24 hr to 48 hr storm duration rainfall percentage increase of 75 ordmC to 80 ordmC (cf Table 7 MFE) which suggests storm rainfall increases of between 10 and 15 These percentages have then been applied directly to the EV1 flood frequency estimates derived from the Whataroa River at SH 6 to provide an indication of possible future changes in flood frequency values
The results of this assessment are set out in Table 2
recurrence interval t
(yrs)
Qpk(eV 1)
(cumec)
Qpk + 10(cumec)
Qpk + 15(cumec)
23 1230 1350 1400
5 1550 1700 1800
10 1640 1800 1900
20 1730 1900 2000
50 1820 2000 2100
100 1910 2100 2200
note Waiho River estimates derived from an EV 1 analysis of Whataroa River at SH 6 which were scaled by the area factor [A waiho A whataroa]⁰⁸
TABle 2 Flood Frequency Estimates Waiho River at SH 6
3 That progradation of the fan below Canavans Knob through to and beyond the Waiho Loop will persist if the sediment supply rates to the fan observed since 2002 persist
4 The present flood capacity of the Milton and Otherrsquos stopbank is provisionally assessed as marginal in a flow of 1850 cumec (aep 5 ie 1 in 20 year recurrence interval) based on GEML hydraulic modeling (n = 0037) adjusted for increases in mean bed level since that work was completed (see further note below)
5 Given points 1 And 2 above the prospect of an avulsion progressively developing into the Tatare River over the true right bank at and downstream of the Oxidation Ponds is now a very real prospect
6 An avulsion into the Tartare River system by the Waiho River (ie the Tatare River captures the Waiho River downstream of Canavans Knob) is likely to progress relatively slowly at first and will be accompanied by an increase in aggradation within the active bed of the Waiho River where it presently flows through and beyond Rata Knoll This will occur as a portion of the flood flows approaching this critical reach is systematically bled off the Waiho River and spills into the Tatare River This situation may result in a reduction in flood carrying capacity in the reach where the Milton and Otherrsquos stopbank is located leading to overtopping during floods provisionally assessed in excess of an aep 10 (ie 10 year recurrence interval flow 1600 cumec)
7 The GEML hydraulic modeling results of July 2008 indicated that much of the stopbanking along the true right bank below SH 6 through to the Oxidation Ponds had been substantially compromised by river aggradation such that it would not contain a flood discharge of 1850 cumec with 1m of freeboard An analysis of the March 2011 CCSL survey indicates that the situation is now worse as a result of increases in mean bed levels that vary from 118m at CS 14 (airstrip) through to 055m at CS 18 (Oxidation Ponds) [note CS = cross section]
note The GEML hydraulic modeling study used a riverbed roughness of ldquonrdquo varyingbetween 0030 to 0040 (predominantly 0037) and arrived at those values by a combination ofreferencetoldquoRoughnessCharacteristicsofNZRivers(DMHicksandPDMason1991)site inspections aerial photography and a calibration model run They noted that their calibration run was approximate and largely based on anecdotal evidence which was not fully substantiated They tested their model by running it with roughness increased by 20 (ie predominantly 0044) and this gave rise to increases in flood level of between 006 and 022m It is the Authors experience that roughness values in the order of 005 to 006 are more realistic in rivers of this kind given that bed form resistance is almost certainly present under live bed conditions Live bed conditions will result in both the entrainment and transport of coarse sediment in the flow and as bed load the latter resulting in bed forms (undulations on the floor of the river bed formation translation destruction and reformation of gravel bars etc) It is anticipated that the onset of live bed conditions will occur over a significant proportion of the Waiho Riverbed when flows reach 450 to 500 cumec (Clausen Plew 2004) and will be well established with flows in excess of 1000 cumec In considering the output from these models it needs to be appreciated that replicating known flood profiles on the river in full flow with live bed conditions present and no real certainty of what the flood flow actually is at that time places real constraints on the models validity particularly as a predictive tool Notwithstanding that limitation of necessity some reliance needs to be placed on the output of such models to give guidance on the possible form of the flood profiles that could occur at different flood discharges However this must be tempered by the knowledge that rivers of this kind under live bed conditions can behave in unpredictable ways
26 27 Waiho RiveR optimal FutuRe management Waiho RiveR optimal FutuRe management
Chapter 6 revIew of the CatChment hydrology
chaptEr 7
CoMMentary on riVer ProteCtion Works
As has been noted earlier in this report a range of river protection works have been constructed on this river at various locations over an extended period of time In general they have been designed to either constrain the lateral migration of the river in order to try and mitigate against lateral erosion of natural banks and man made stopbanks and or to contain flood flows The erosion prevention structures include rock riprap stub groynes aligned at 900 to the natural bank or stopbank alignment or on curves at 90ordm to the tangent to the curve Typically these structures are some 15m in length and evenly spaced at about 6 times the length (Glacier Access Road and true left bank stopbank below the Backpackers) to 35 times their length (Backpackers to Canavans Knob stopbank) The WCRC stopbank on the true right bank downstream of SH 6 has heavy rock cladding on the riverside of the bank to provide protection against lateral scour The stopbanks are constructed in heavily compacted sandy gravels sourced from the river Typically they have batters 2H 1V and varying crest widths but typically 5 to 6 m As the river aggrades freeboards on the stopbanks reduce below their intended design requirements (WCRC stopbanks eg 1m) and adjustments are necessary to restore freeboard
In the reach upstream of SH 6 the Franz Josef Glacier access road presents a unique problem In this reach the river is confined by natural terraces and stub groynes (true right bank) and the access road and stub groynes on the true left bank As the river aggrades in this reach the access road needs to be raised to maintain freeboard Inevitably when the road is raised the result is further encroachment into an already confined reach At CS 12 for example the natural width before the access road was constructed is estimated to have been somewhere in the order of 280m With the construction of the road this width has reduced to approximately 250m and the presence of rock rip rap stub groynes has reduced the active river width to more like 230m in effect a width reduction of some 15 to 20 The SH 6 bridge waterway is similarly affected with the natural width reducing from about 250m to 145m a reduction in active width of 42 The SH 6 Bridge is at the downstream end of the WaihondashCallery River transfer reach and in effect at the head of the Waiho River alluvial fan The construction of river protection works (stopbanks rock rip rap stub groynes) at and downstream of the SH 6 Bridge has in effect constrained the river in such a manner that the natural apex sector angle of the alluvial fan has been systematically reduced from 90⁰ to about 30⁰ The consequences of these modifications to the natural river form and the associated landscape is that those parts of the alluvial fan comprising the forested and farmed land through to Docherty Creek on the true left bank and the Franz Josef Township on the true right bank including the farmed land downstream of the Township are no longer accessible by the river for the purposes of storing sands and gravels during an aggrading phase
The work of McSaveney and Davies (2000 2006) and McSaveney Davies and Clarkson (2003) suggests that the constraining of this steep braided bed load dominated river by river control structures has on balance and more likely than not significantly contributed to the aggradation that has and is now being observed on this river The Waiho River is not unique in that regard a similar situation is evident on the North Ashburton River in mid Canterbury In both cases the active bed is now elevated well above the natural ground levels outside
28 29 Waiho RiveR optimal FutuRe management Waiho RiveR optimal FutuRe management
Chapter 7 Commentary on rIver proteCtIon works
chaptEr 8
engineering issues
The steady increase in bed levels within the active bed of the Waiho River from its confluence with the Callery River through to beyond Rata Knoll has meant that bed levels are now higher than the natural groundline on the landward side of the stopbanks by some metres and this difference is increasing This trend must be expected to continue in the short to medium term (1 to 10 years) That assumption is made on the basis that sediment and water supply rates to the fan in that time span will remain more or less as they have been over the preceding 20 to 30 years The practice to date exercised by both NZTA and the WCRC is to periodically increase the height of the stopbank crest in order to maintain freeboards This practice does not address the problem of increasing mean bed levels as such it simply endeavours to preserve the design flood carrying capacity of the system being managed It should also be noted that it does not address the core issue of the river response to artificial constraint of the active braiding riverbed boundaries in a bed load dominated river
Stopbank failures occur from time to time in most river systems where they have been constructed This can be the result of overtopping either as a result of diminishing freeboard caused by local or more general aggradation within the constrained river system (the Waiho River situation) where inadequate provision has been made for super-elevational effects around bends with the river in high flood (or a combination of both of these effects) or through lateral bank erosion suffosion piping or seepage induced face instability or as a result of crest settlement resulting from strong ground motion (eg Waimakariri River stopbanks September 2010 and February 2011 earthquakes) Lateral bank erosion is more likely to occur on the falling limb of a flood hydrograph as water levels drop average velocities fall off and the bed load sediment transport capacity reduces
At some point during the recession gravel bars will begin to form in the bed and sinusoidal braided flow patterns re-emerge as a result Often when this happens strong flow concentrations can develop that impinge sharply on the stopbank riverside toe When that occurs riprap facing if present can be stripped stub groynes damaged or destroyed and or the stopbank proper eroded If river erosion is sufficiently intense at such locations and persists for long enough the stopbank may be breached With well constructed stopbanks (eg those composed of heavily compacted sandy gravels on good foundations with batters in the order of 2H 1V or flatter and crests of 4m plus) overtopping can be sustained for upwards of 2 hours before breaching occurs Typically failure occurs as a result of erosion at the landward toe which then headcuts through the embankment the higher the stopbank the more aggressive this action is Overtopping failure is likely to be catastrophic in nature whereas lateral bank failure less likely to be given that in the latter case lower water levels (falling stage) conditions are most likely present which tends to limit the outflows that will occur through the breach both in terms of size and duration
note the particular situation and failure consequences of stopbanks where the riverbed is elevated above the surrounding land as now occurs on the Waiho River is considered later in this report cf Sec 90]
In reviewing these comments in the context of the Waiho River stopbanks it is concluded that overtopping and or lateral bank erosion are the two situations which are most likely to cause stopbank failure and in some cases this could result in catastrophic failure The
the stopbanks In the Waiho River case these changes are occurring rapidly and although episodic nevertheless have persisted for some 20 to 30 years and should be expected to continue to persist into the short to medium term (1 to 10 years)
This disparity between natural ground levels on the outside of the stopbank with steadily increasing mean bed levels on the river side of the banks presents a number of engineering problems which need to be addressed
30 31 Waiho RiveR optimal FutuRe management Waiho RiveR optimal FutuRe management
Chapter 8 engIneerIng Issues
chaptEr 9
stoPbank Failure
Stopbank failure along the true left bank upstream of SH 6 would result in loss of the Glacier Access Road and flood damage to SH 6 the Motels Back Packers and any dwellings in its path down stream The southern approach and abutments to the SH 6 Bridge could be damaged in this scenario
Stopbank failure of the structure (s) between SH 6 and Canavans Knob could also affect SH 6 the Motels and Back Packers depending on where the failure occurs Of equal concern is that it might result in an avulsion of the Waiho River through to Dochertyrsquos Creek The double parallel stopbank system presently available in this reach notwithstanding the elevation of the riverbed now well above the natural groundline along SH 6 is a reasonable protection against such an outcome but only if freeboards are maintained and adequate protection against lateral bank erosion is maintained If such an avulsion were to occur there will be major difficulties to overcome to return the river to within the stopbanks Substantial erosion and deposition will almost certainly occur and SH 6 will be out of action until such time repairs can be affected
Overtopping and or lateral erosion of the Canavans Knob to Rata Knoll and the Milton and Otherrsquos stopbanks would result in breaching flows coursing through to Dochertyrsquos Creek damage to SH 6 and flooding through the Lower Waiho Special Rating District area As with the SH 6 bridge to Canavans Knob stopbanks the elevational difference between the riverbed and the surrounding ground outside the stopbank may give rise to an avulsion as well Again the consequences of such an outcome will be great and major difficulties (and cost) experienced in returning the river to its former course and trying to prevent a repeat
Overtopping and or lateral bank erosion on the true right bank below SH 6 will result in substantial damage to parts of the Franz Josef Township loss of the airstrip and almost certainly destruction of the oxidation ponds depending on the location nature and extent of the breaches The consequences of avulsion as described for breaches of the true left stopbank must also be considered here
Stopbank failure can also occur as a result of piping suffusion consolidated settlement of weak foundation material and slumping (ie aseismic failures) and or through the effects of crest settlement as a result of strong ground motions during earthquakes (ie seismic failures) Failure can be either catastrophic or non-catastrophic Catastrophic failures typically occur when a stopbank overtops and fails rapidly whereas non-catastrophic failures occur when these conditions are absent but the stopbank efficacy has never the less been compromised eg suffosion results in flood water leaking through the embankment during high flows where lateral bank erosion damages the stopbank of a flood recession without necessarily breaching the embankment and where crest settlement occurs during earthquakes when the river is not in flood
A more detailed description of these types of failure mechanisms is given in Appendix 1
materials used in their construction the manner in which they have been constructed and the foundations on which they have build suggest that piping failure is highly unlikely Suffosion if it occurs and that is considered reasonably likely with these types of stopbanks will be more of a nuisance that a direct threat to stopbank stability
Clearly in times of flood when high hydraulic gradients are present through the stopbanks because riverbed and hence flood levels are now raised well above the natural groundline outside and on the landward side of the stopbank seepage flow with or without suffosion being present is likely to be readily evident during floods and possible also post flood as shallow groundwater within the elevated riverbed falls Evidence of this phenomena presently exists eg adjacent to the motels on the true left side of the river downstream from the SH 6 bridge and possibly also between the parallel stopbank system extending down to Canavans Knob also on the true left bank of the river
32 33 Waiho RiveR optimal FutuRe management Waiho RiveR optimal FutuRe management
Chapter 9 stopbank faIlure
chaptEr 10
otHer aVulsion tHreats
Two other avulsion threats have been identified in this investigation the first through a low saddle area in the forest on the true right bank of the Waiho River located some 150 to 200m upstream of the SH6 bridge true right abutment and the second across the true right bank at or down stream of the Oxidation Ponds into the Tatare River as discussed earlier in this report
101 Franz Josef township overflow Corridor
The low saddle has an elevation of RL 1600 m (CCSL survey June 2011 Appendix 3) or so which is presently some 66m higher than the mean bed level at that location as extrapolated from the March 2011 mean bed levels calculated at CS 12 and CS 13 Using the calculated mean bed level differences between the June 2008 and March 2011 CCSL surveys on CS 12 and CS 13 an aggradation rate of between 07 and 10myear is derived for this reach adjacent to the low saddle area This has been calculated on the basis that 197m of aggradation occurred between the two surveys and that that change took place either between June 2008 and March 2011 (33 months) or more likely with reference to the OICL SH 6 bridge mean bed level records between March 2009 and March 2011 (24 months) On that basis if the sediment and water supplies to the reach between the WaihondashCallery River confluence and the SH 6 bridge remain more or less as they have over the past 20 to 30 years and the aggradation rates referred to above are reasonable reflections on likely future rates in this critical reach in the short to medium term (1 to 10 years) then overtopping through the low saddle into the Franz Josef Township via this potential overflow corridor may occur with in the next 6 to 10 years If it were allowed to persist an avulsion could conceivably occur (the consequences) for which would be materially worse than flooding and deposition from earlier overflows This scenario would result in the loss of SH 6 in the township Clearly if for any reason erosion rates were to increase significantly from those presently being experienced or any other reason resulting in an increase in the background aggradation rates in this reach used in this calculation then the situation being described could conceivably occur sooner that the 6 to 10 year time span estimated above The converse is also true A reduction in aggradation rates could prolong the initiation of overflows the prospect of degradation occurring which might effectively remove the threat while possible is not considered realistic given the history of aggradation that has been observed and the circumstances that would be necessary on the whole active fan surface to allow this to happen Although gravel extraction could be employed as a short term measure to alleviate the threat the cost of maintaining freeboards by these means on a more permanent basis is considered likely to be unsustainable in the short to medium term and an unrealistic expectation Compounding this approach would be what to do with the excavated material and the knowledge that it Is likely that any material excavated would within a very short time frame be replaced by the river from upstream
On that basis it is opined that the only realistic remedy for preventing this outcome assuming Franz Josef township is to remain in its present location in the foreseeable future would be to construct a suitably robust structure across this potential overflow corridor This would require a significant disturbance to the native forest at that location In coming to this conclusion the caveats that apply from the McSaveney and Davies (2000) and McSaveney Davies and Clarkeson (2003) work are acknowledged and are likely to apply to this suggested
34 35 Waiho RiveR optimal FutuRe management Waiho RiveR optimal FutuRe management
Chapter 10 other avulsIon threats
chaptEr 11
Future ManageMent oPtions
In considering the assessment made here the following options present themselves
1 Do nothing or
2 Status quo or
3 Acceptance of avulsion to the Tartare River or
4 Boundary relaxation
111 the do nothing option
The do nothing option will inevitably lead to overtopping during a flood or floods of any stopbank where freeboards have been eliminated through ongoing bed aggradation That option clearly is not likely to be tenable for NZTA (SH 6 and SH 6 bridge threat) nor the Department of Conservation (Glacier Access Road) and accordingly it is anticipated that these Agencies will continue to raise the stopbanks the Glacier Access Road and the SH 6 Bridge and its approaches in order to preserve these routes If the stopbanks under the management of the WCRC are not similarly adjusted to maintain freeboard then stopbank failure with widespread flooding of the Waiho River Flats the land between the Waiho River and Docherty Creek and parts of Franz Josef and its environs will ultimately occur relatively soon (within 10 years) The area(s) affected in this way will be determined on the basis of where overtopping (or lateral erosion) first occurs This option on the basis of the present evidence indicates strongly that an avulsion into the Tartare River from CS 16 to CS 21 is highly probable in the short to medium term
112 the status Quo option
The status quo option is most probably the one likely to be favoured in the short term both by NZTA Department of Conservation and the WCRC Special Ratings Districts although with respect to the latter the ongoing affordability of that option is something that needs to be addressed This entails continuing to upgrade stopbanks and associated river protection measures to maintain freeboard It is opined that for both options and the do nothing option serious consideration should be given to abandoning rock rip rap spur groynes at least in the reach upstream of SH 6 in favour of rock rip rap cladding in order to preserve as far as practicable the waterway area that can be utilised in order to minimise the active braid in this reach This will entail founding the cladding as the WCRC has done at depth in the bed to minimise the likelihood of scour damage at the toe in major floods An assessment needs to be made of what this depth ought to be having regard to accepted analytical methodologies local knowledge and experience It is accepted that this is not likely to be a long term solution for all parties given that affordability and growth of the hazard will occur as stopbank heights are systematically raised and the elevational difference between the floodplain and the constrained aggrading riverbed gets progressively larger
113 acceptance of avulsion to the tartare river
Regardless of whether the do nothing or status quo options are chosen in the medium to long term if not sooner without human intervention by way of the construction of a
response However on balance it is likely that the works that confine the river already are implicated and what is being proposed will not materially alter what has already occurred and is persisting
102 tatare overflow Corridor
As has previously been described the aggradation which has occurred in the Waiho River active braided riverbed downstream of CS 16 of the CCSL surveys has raised mean bed levels to and possibly higher than the natural banks of the rivers true right berms from the Oxidation ponds through to the Waiho Loop Cross falls are evident on cross sections through this reach which fall towards the true right bank eg CS 16 00055 CS 19 00057 Further to that the land falls in a direct line from the Waiho River true right bank some 49m over a distance of 3130m into the bed of the Tatare at the point where the Tatare begins its cut through the Waiho Loop A similar situation exists from CS 21 where a fall of 10m occurs over a distance of some 890m The fall between these points is estimated at 00105 (CS 23 to Tatare) and 00156 (CS 16) By way of example if we assume a break out occurs around CS 20 into the Tatare a fall of 36 m over 2350m is available overland (s = 0015) If the initial overflow width is in the order of 300m and the hydraulic roughness is set at 008 05m average overflow depth gives a spill discharge in the order of 145 cumec at 10m overflow depth for the same width the overflow discharge becomes 460 cumec Average velocities for the 05m depth will be about 1ms and for the 10m overflow depth 15ms One must expect higher velocities than this because there will be areas where existing swales occur and depths are greater Greater depth results in higher velocities Surface scour will take place where velocities get above 15 ms and headcutting back from the Tatare true left bank must be anticipated as overflows begin spilling into that watercourse If this situation is allowed to occur ie no intervention (stopbanks) take place then over time as this situation is repeated the headward migration of channel erosion back towards the Waiho River from the Tartare River will ultimately lead to either partial or more likely complete capture of the Waiho River by the Tartare River When that happens the present Waiho River course around the south western end of the Waiho Loop will be abandoned although it may still carry flow for a period following capture until full capture is complete At this point very substantial volumes of gravel will have been eroded from the area between the two rivers along the avulsion path and headward erosion will progress upstream in the Waiho Riverbed as the new channel develops Just how fast this process will be and what alignment across the area between the Tatare and Waiho River it takes and where it cuts headwards in the Waiho River is problematic at this point What is certain is that it will have a profound affect on both rivers and quite possibly lead to either the elimination of Lake Pratt or alternatively its growth Aggradation will also occur in the Tartare River However to what extent and how far upstream that progresses has not been assessed at this time Following on from that significant changes in the bed of the Waiho River below the Waiho Loop will be inevitable and just what those will be what their magnitude is and where they are likely to be located has not been assessed at this time
36 37 Waiho RiveR optimal FutuRe management Waiho RiveR optimal FutuRe management
Chapter 11 future management optIons
chaptEr 12
ConClusions
Reflecting on the original brief the following comments are made based on the findings of this investigation accepting that this amounts simply to the Authors view and should not be interpreted as reflecting that of the WCRC NZTA Department of Conservation or any other interested or affected party
1 Keeping the river within its banks is considered a realistic option in the short (1-5 yrs) but inevitably it will have cost and structural stability and hazard growth implications which must be addressed Unless it involves interventions to avert an avulsion of the Waiho River into the Tartare River then capture of the Waiho River by the Tatare now seems inevitable in the short to medium term (1 to 10 yrs) This will almost certainly require within the next 5 to 10 years the construction of a short stopbank on the true right bank of the Waiho River upstream of the SH 6 bridge to prevent overflows from the Waiho River into the Franz Josef township via a low saddle area between the township and the Waiho River If there is an increase in sediment supply which is greater than that observed over the last 20 to 30 years or so then this timeframe will shorten Conversely an easing of supply may well slow aggradation rates in this reach effectively delaying this outcome The likelihood of a degradation cycle occurring and persisting such that it eliminates this risk is not considered realistic in the medium term (10 to 50 years) unless an avulsion into the Tartare River occurs which ultimately lowers the bed levels in this reach to sufficiently remove the threat
2 It hardly needs saying but the management of this river now in the interests of minimising risk to life and property is an extraordinarily complex and difficult exercise Inevitably there must be losers The prospect of an avulsion by the Waiho River into the Tatare looks increasingly probable if not imminent If steps are taken to prevent it the aggressive aggradation now evident over the whole fan surface within the present manmade boundary constraints from the WaihondashCallery River confluence to below the Waiho Loop can be expected to persist if not worsen It is doubtful that maintaining the status quo option indefinitely is in fact possible The costs are likely to be unsustainable for all or some of the parties involved and ultimately the river might anyway have the final say regardless of the best efforts of those charged with maintaining the flood protection systems In light of this it is opined that the way forward may be to maintain the status quo in the short term and carefully evaluate the consequences of an avulsion in order to minimise hazard (to people land and other property ecosystems and community well being) in preparation for an avulsion in the manner described herein
3 The notion that there is a slug of gravel within the Waiho riverbed between the WaihondashCallery River confluence through to and beyond the Waiho Loop that could be encouraged to move on is a misconception and misplaced The aggradation that has occurred on this surface is the result of wholly natural alluvial fan processes and is operating on a scale well beyond effective human intervention management There is good reason to conclude that past and continuing intervention in the form of active river boundary constraints has and still is influencing to an unspecified degree the gradational trends and outcomes now clearly evident
By way of example in order to restore channel capacity and avert an avulsion to the Tartare might require the excavation of gravel deposits off the bed of the river over the reach extending from the SH 6 bridge though to say the downstream end of Miltons and Otherrsquos stop bank a distance of some 5 to 55 km If this channel were constructed 400m wide and 15 m deep we would need to excavate some 3000000 bulk cubic meters of sand and gravel at a cost probably in the order of $10M to $15M That poses three important questions could
stopbank to prevent overflows to the Tatare in times of flood and in the expectation that water and sediment inputs to the fan and hence presently observed aggradation rates are maintained much as they have in the last 20 to 30 years an avulsion to the Tatare looks more certain than any time in the past 10 to 20 years That said is community acceptance of this option tenable In order to determine that a good deal more needs to be learned about how such a situation might progress what consequences could arise and to endeavour to determine realistic bounds on such effects if that is possible The work undertaken to date does not allow that and this must be attended to before this approach could be pursued as a deliberate management option notwithstanding the likelihood of it occurring regardless for the reasons outlined above In effect this would become a medium to long term strategy working in conjunction with the status quo option in the short term with the latter wholly or partially abandoned once the avulsion option is operative
114 boundary relaxation
The boundary relaxation option is not new This option was considered by the WCRC NZTA Westland District Council working party in 2000 [Evaluation of Options for the Management of the Waiho River Aggradation Threats RJ Hall et al (2000)] In effect what it requires is a deliberate action(s) to allow the river to re-occupy part of its natural alluvial fan surface presently unavailable as a consequence of the present boundary constraints along the true left bank from upstream of SH 6 through to the Waiho Loop and downstream If implemented this would require the relocation of a number of dwellings the relocation of SH 6 on the south side of the river the relocation or demolition of the Motel on the south bank and the Backpackers and the abandonment of extensive farmland between the Waiho River and Dochertyrsquos Creek
38 39 Waiho RiveR optimal FutuRe management Waiho RiveR optimal FutuRe management
Chapter 12 ConClusIons
chaptEr 13
aCknoWledgeMents
The Author wishes to acknowledge the assistance and insights provided by staff of the WCRC provided in the course of this investigation in particular the Chief Executive Chris Ingle and Messerrsquos Michael Meehan and Wayne Moen Acknowledgment is also extended to the staff of the Department of Conservation (Franz Josef ) NZTA Opus International Consulting Ltd (Greymouth) for their comments and making available photographic and survey information relevant to this engagement to the staff of the Westland District Council for their comments and to Drrsquos TRH Davies and M McSaveney for their comments and use of material from their 2002 5th International Gravel Bed River Symposium paper Further to that the Author wishes to acknowledge the survey work undertaken by Chris Coll Survey Ltd on this river and the willingness of Chris and Jan Coll and their staff in providing access to and comment on the various surveys of the river undertaken by themselves and others over the years without which this report would have been seriously limited Appreciation is also expressed to Kathy Walters of NIWA for assistance in providing hydrological information from their hydrometric sites at Hokitika Greymouth and Whataroa
RJ HallMIPENZ (Civil Geotechnical) CPEng Int PE (NZ)
RJ Hall Civil amp Associates Ltd
February 2012
resource consent under the Resource Management Act be obtained to execute and maintain work of that kind and scale where would the money come from to do it and where would the spoil go Further to that given the current aggradation rates and giving cognizance to the fact that it is impractical to get the river down to a narrow enough width to promote throughput to the extent that it will not aggrade the present annual aggradation rates would probably fill the channel in less than 2 years at which point one would have to start all over again As has been noted earlier in order to develop a self-sustaining channel one would need to replicate something akin to that presently available in the Callery Gorge That would require a deeper narrower channel heavily rock armoured well beyond anything presently being used and founded at least 5 to 6 m beneath the bed if not more It is opined that the costs of constructing and maintaining such a channel would be well beyond the reach of the Franz Josef community the WCRCrsquos Special Rating Districts NZTA and the Department of Conservation even if cumulatively they favoured the concept The only realistic alternative to a human intervention approach in the manner described above would be to allow the Waiho River to be captured by the Tatare which in time may well provide the relief sought However in saying that there will be unavoidable consequences if and when that situation arises and the riverbed deflation process that is likely to arise on the Waiho River alluvial fan as a consequence may not necessarily be confined to the present braided river bed That is an attendant risk that must be faced
40 41 Waiho RiveR optimal FutuRe management Waiho RiveR optimal FutuRe management
Chapter 13 aCknowledgements
appEndix 1
stoPbank breaCH MeCHanisMs
Piping failure arises where stopbanks have either been constructed in sands and silts or have been built over deposits comprising those types of soils Water seeping through the sand and silts when the river is in flood can erode out fines from the point where the seepage flows exit the embankment and or its foundation As this happens a pipe develops from the outside exit point and systematically erodes in a headward direction back through the embankment or foundation As the pipe develops (lengthens) the soil thickness along the seepage path through which the seepage is occurring upstream from the inward progressing pipe shortens and the hydraulic gradient driving the seepage steepens so the seepage flow increases This results in a steadily increasing (accelerating) flow and at some point the embankment collapses locally (slumps) allowing flows to overtop through the local reduction in crest level and breaching rapidly progresses from there Failure by this means is catastrophic
Suffosion occurs only in coarse grained cohesionless soils such as sandy gravels where seepage flows passing through the embankment and or its foundation under flood systematically erode out the fines leaving a residual coarse grained skeletal soil Failure of a stopbank and or its foundation under these conditions is unlikely to be catastrophic Typically it occurs as steady seepage flows coursing out of the lower third of the outside batter or at the batter toe itself and in that case quiet often as boils that emerge some distance out from the toe proper These outflows can be disturbing to witness but do not necessarily pose an immediate risk although localised sloughing of topsoil and grass cover on the outside batter may occur
Instability of the embankment outer batter capable of causing failure of the embankment proper (deep seated circular failure surfaces) require either poor foundation strength or over steep poorly compacted embankments constructed in weak materials where well established pheratic surfaces have developed through the embankment during a flood These types of failures should they occur will almost certainly be catastrophic Well constructed stopbanks on good foundations and constructed with batters 2H1V or flatter are not likely to fail in this manner because they have both adequate strength to resist such failure and the high compacted soil densities present result in moderate to low soil permeabilities which it turn impede the development of a full pheratic surfaces ie there is insufficient time during a flood for a full pheratic surface to develop In situations where an embankment has experienced prolonged high antecedent rainfall conditions prior to a flood and water content in the embankment is high as a consequence as this water draining through the core a pheratic surface may form but the stopbank design and construction described above normally provides a satisfactory safeguard against this type of failure
Strong ground motions during major earthquakes can result in crest settlement with or without liquefaction being present in stopbanks constructed in well compacted sandy gravels Under these conditions longitudinal cracks can appear in the crest running sub-parallel with the longitudinal direction of the crest For example for a typical stopbank well constructed on good foundations say of 3m height that experiences a M 8 earthquake with peak ground accelerations of say 05 longitudinal cracks of 100 to 200 mm width may appear and settlements of up to 15 of the stopbank height plus foundation depth could occur If we allow a foundation depth of say 2m then the crest settlement could be expected to be in the order of 75 to 100mm It should be apparent that damage of this kind does not
42 43 Waiho RiveR optimal FutuRe management Waiho RiveR optimal FutuRe management
appendIx 1 stopbank breaCh meChanIsms
appEndix 2
CHris Coll surVey ltd MarCH 2011 riVer bed surVey Plans
lead to catastrophic failure unless the dam remains in a damaged state for a period of time after the earthquake unrepaired and a flood event subsequently occurs capable of causing full or partial failure
44 45 Waiho RiveR optimal FutuRe management Waiho RiveR optimal FutuRe management
appendIx 2 ChrIs Coll survey ltd marCh 2011 rIver bed survey plans appendIx 2 ChrIs Coll survey ltd marCh 2011 rIver bed survey plans
46 47 Waiho RiveR optimal FutuRe management Waiho RiveR optimal FutuRe management
appendIx 2 ChrIs Coll survey ltd marCh 2011 rIver bed survey plans appendIx 2 ChrIs Coll survey ltd marCh 2011 rIver bed survey plans
48 49 Waiho RiveR optimal FutuRe management Waiho RiveR optimal FutuRe management
appendIx 2 ChrIs Coll survey ltd marCh 2011 rIver bed survey plans appendIx 2 ChrIs Coll survey ltd marCh 2011 rIver bed survey plans
50 51 Waiho RiveR optimal FutuRe management Waiho RiveR optimal FutuRe management
appendIx 2 ChrIs Coll survey ltd marCh 2011 rIver bed survey plans appendIx 2 ChrIs Coll survey ltd marCh 2011 rIver bed survey plans
52 53 Waiho RiveR optimal FutuRe management Waiho RiveR optimal FutuRe management
appendIx 2 ChrIs Coll survey ltd marCh 2011 rIver bed survey plans appendIx 2 ChrIs Coll survey ltd marCh 2011 rIver bed survey plans
54 55 Waiho RiveR optimal FutuRe management Waiho RiveR optimal FutuRe management
appendIx 2 ChrIs Coll survey ltd marCh 2011 rIver bed survey plans appendIx 2 ChrIs Coll survey ltd marCh 2011 rIver bed survey plans
56 57 Waiho RiveR optimal FutuRe management Waiho RiveR optimal FutuRe management
appendIx 2 ChrIs Coll survey ltd marCh 2011 rIver bed survey plans appendIx 2 ChrIs Coll survey ltd marCh 2011 rIver bed survey plans
58 59 Waiho RiveR optimal FutuRe management Waiho RiveR optimal FutuRe management
appendIx 2 ChrIs Coll survey ltd marCh 2011 rIver bed survey plans
appEndix 3
CHris Coll surVey ltd June 2011 WaiHo busH bloCk
60 61 Waiho RiveR optimal FutuRe management Waiho RiveR optimal FutuRe management
appendIx 3 ChrIs Coll survey ltd June 2011 waIho bush bloCk appendIx 3 ChrIs Coll survey ltd June 2011 waIho bush bloCk
62 63 Waiho RiveR optimal FutuRe management Waiho RiveR optimal FutuRe management
appendIx 3 ChrIs Coll survey ltd June 2011 waIho bush bloCk
appEndix 4
reFerenCes
1 Influence of Channel Width on Bed Load Transport Capacity MA Carson and GA Griffith ASCE Journal of Hydraulic Engineering Vol 113 No 12 Dec 1987 (pp 1489 -1509)
2 Dam Break Flood Hazard from the Callery River Westland New Zealand TR Davies and BK Scott Journal of Hydrology (NZ) 36 (1) 1-13 (1997)
3 Natural Hazards Assessment for the Township of Franz Josef and its Environs MJ McSaveney TRH Davies IGNS Client Report 44714B10 (July 1998)
4 Peer Review of the Institute of Geological and Nuclear Sciences Ltd Report No 44714B10 (July 1998) Natural Hazards Assessment for the Township of Franz Josef and its Environs RJ Hall RJ Hall Civil amp Environmental Consulting Ltd (August 1998)
5 Evaluation of Options for the Management of the Waiho River Aggradation Threats RJ Hall et al (2000)6 Anthropogenic Fanhead Aggradation Waiho River Westland New Zealand TR Davies MJ McSaveney
Proceedings 5th International Gravel-bed Rivers Symposium Christchurch and Franz Josef (2000)7 The Transit New Zealand Waiho Workshop HL Rouse TJ Day TRH Davies Proceedings 5th International
Gravel-bed Rivers Symposium Christchurch and Franz Josef (2000)8 Landslide-dambreak Floods at Franz Josef Glacier Township Westland New Zealand a Risk Assessment TR Davies
Journal of Hydrology (NZ) Vol 41 No 1 (2002) 9 Anthropogenic Aggradation of the Waiho River Westland New Zealand TR Davies MJ McSaveney PJ
Clarkeson Earth Surfaces Processes and Landforms 28 209-218 (2003)10 How High are Bed Moving Flows in New Zealand Rivers B Clausen D Plew Journal of Hydrology (NZ) Vol 43 No
1 (2004)11 Geomorphic Constraints on the Management of Bed-load Dominated Rivers TR Davies MJ McSaveney Journal
of Hydrology (NZ) 45 (2) 69-88 (2006) 12 Geology of the Aoraki Area 1 250000 Geological Map 15 SC Cox DJA Barrell compilers IGNS (2007)13 West Coast Regional Council Waiho River Flood Protection Scheme Design Flood Levels Good Earth Matters Ltd
(2008)14 Preparing For Climate Change A Guide for Local Government in New Zealand Ministry for the Environment (2008)15 Waiho River Bed Surveys June 2008 and March 2011 Chris Coll Surveying Ltd (2011)16 Topographical Survey of the Waiho Bush Block Chris Coll Surveying Ltd (2011)17 Mean Bed Level Survey Record Waiho River SH 6 Bridge February 1997 ndash May 2011 Opus International Consultants
Ltd 18 WCRC Asset Management Plans for the Franz Josef Special Rating Area the Lower Waiho Rating District (December
2010)19 Video of Callery Fly Over 2011 Opus International Consultants Ltd (2011)20 Oblique Stills Callery Fly Over 2011 Department of Conservation Franz Josef (2011)21 WCRC Staff Aerial Inspection ndash Callery 6 September 2011 W Moen WCRC (7 September 2011)22 Planning for a Safer Franz Josef ndash Waiau Community Westland District Considering Rupture of the Alpine Fault
RM Langridge amp JG Beban GNS Science Consultancy Report 2011217 (September 2011)23 Callery River Landslide Dam Rapid Assessment of Dam Failure Consequences for West Coast Regional Council R
Measures M Duncan NIWA (September 2011)24 NIWA Flood Annual Flood Record and Annual Means Site 89301 Whataroa River at SH 6 1985 ndash 2011 NIWA (2011)25 Report on West Coast Weather Event 27 amp 28 December 2010 West Coast Regional Council report (2011)
64 65 Waiho RiveR optimal FutuRe management Waiho RiveR optimal FutuRe management
appendIx 4 referenCes
appEndix 5
tables
Cros
s se
ctio
n
thal
weg
dis
tanc
e ( m
)
Mbl
Jan-
02 (
rl m
)
Mbl
Jun-
08 (
rl m
)
Mbl
Mar
-11
( rl
m )
Chan
ge M
bl Ja
n 02
- Ju
ne 0
8 ( r
l m
)
Chan
ge M
bl Ju
ne 0
8 - M
ar
2011
( r
l m
)
rate
Cha
nge
Mbl
Jan
02 -
June
08
( m
yr )
rate
Cha
nge
Mbl
June
08
- M
ar 2
011
( m
yr
)
rati
o M
bl C
hang
e pe
r yr
2008
- 20
11 to
200
2 - 2
011
Chan
ge in
Vol
ume
( m
3 ) 20
02 -
2008
Chan
ge in
Vol
ume
( m
3 ) 20
02 -
2011
10 0 15305 15855 16039 551 184 0816 0689 08
11 209 15484 15572 157785 088 207 0131 0775 59 103269 68536
12 417 15308 15328 154969 020 169 0030 0632 212 21893 81442
13 821 15053 15043 15139 -010 097 -0015 0363 00 4656 129254
14 1113 14594 14656 14754 062 098 0092 0369 40 18638 70075
15 1377 14354 14387 14463 033 076 0049 0284 58 36017 68155
16 1795 13934 13963 14017 029 055 0043 0205 48 79237 159891
17 2268 13428 13452 13515 024 063 0035 0237 68 115310 261502
18 2740 12947 12918 12971 -029 053 -0043 0197 -45 -3499 247856
19 3158 12449 12484 12522 034 038 0051 0143 28 -54 147467
20 3923 11626 11678 11703 051 026 0076 0097 13 156610 134985
21 4618 10901 10932 10949 031 017 0045 0065 14 224717 123676
22 5418 10101 10104 10100 003 -005 0004 -0017 -40 613958 -560100
23 6114 9343 9504 9397 161 -108 0239 -0403 00 635880 -761619
2006631 171120
TABle 1 Waiho River at Franz Josef Mean Bed Level and Volumetric Changes Summary January 2002 ndash June 2008 and June 2008 ndash March 2011 River Bed Surveys
66 67 Waiho RiveR optimal FutuRe management Waiho RiveR optimal FutuRe management
appendIx 5 tables
recurrence interval t
(yrs)
Qpk(eV 1)
(cumec)
Qpk + 10(cumec)
Qpk + 15(cumec)
23 1230 1350 1400
5 1550 1700 1800
10 1640 1800 1900
20 1730 1900 2000
50 1820 2000 2100
100 1910 2100 2200
note Waiho River estimates derived from an EV 1 analysis of Whataroa River at SH 6 which were scaled by the area factor [A waiho A whataroa]⁰⁸
TABle 2 Flood Frequency Estimates for the Waiho River based on the Whataroa River at SH 6
appEndix 6
Figures
68 69 Waiho RiveR optimal FutuRe management Waiho RiveR optimal FutuRe management
appendIx 5 tables
appEndix 7
glossary oF terMs
active gully erosion Erosion that is presently occurring on the sides and floor of a gully during rainstorms which results in an expansion of the gully (viz depth width) and delivers sediment downstream into the main river system of which it is an integral part
aggradation The process whereby sands and gravels accumulate in a riverbed causing the bed level to riseaggrading Phase A term used to describe a period when aggradation is occurring in a river or on an active
alluvial fanalluvial Fan The fan shaped surface built up by a river over extended time where it exits in a confined reach
typically where a river emerges from a hill catchmentannual exceedence Probability The probability that an event (rainstorm flood) of a specific size will occur on
average in any one year (the mathematical reciprocal of the return period or recurrence interval for that event)
annual series Maxima A table comprising the highest flow recorded at a hydrometric site for each year of record and is used for determining the flood frequency characteristics of that site
antecedent rainfall That rainfall that occurs prior to the onset of a rainstorm and which pre-soaks the soil assisting in the development of runoff from the storm when it occurs
anthropogenic Something which has occurred or will occur as a result of human activity or influenceappurtenant structures A structure that is integrally required for the satisfactory performance of another
structure eg rock riprap stub groynes to provide protection to the riverside toe and batter of a stopbankaverage Water depth The water depth averaged over a cross section for a particular flowavulsion The sudden change in direction of a river that occurs as a result of a break out usually occurring during
a flood so that the river abandons its original course in favour of the new alignmentbedload dominated river A river in whose form has been sculptured by the erosion storage and transport of
gravel as bedloadbenchmark level The level referenced to a particular survey datum that is set on a permanent reference point
(bench mark) for survey purposesboils The localised appearance of water and fine soil particles such as sands and silts that occur where
concentrated seepage flows emerge at groundlinebraided river The description for a wide generally steep gravel bed river that has a multitude of interlacing
channelsCalibration run The running of an hydraulic model using selected known flows and water profiles in order to
determine what surface roughnessrsquos are required to obtain realistic model performanceCatchment Processes The physical processes operating within a catchment which influence the rate of runoff
and hence river flow during rainstormsChannel gradient The average slope of a channel reach measured along the flow path of the riverCross Fall The gradient that occurs on the bed of a river that runs at right angles to the primary down valley
gradient of the riverbedCrest settlement The lowering of the crest level of a stopbank caused by either settlement in the stopbank
foundation where weak materials are present or as a result of internal erosion of the stopbank or where liquefaction has occurred or through slumping caused by erosion of the stopbank or lateral spreading of the stopbank foundation as a result of earthquake action
Current Morphological status The present state that a river is in given that the rivers form tends to change over time in response to climatic and geological influences which can affect sediment supply catchment runoff and hence river flows channel gradient and sea level
dam break surges The waves of water and debris that move rapidly downstream from a debris dam when it fails
debris dams Obstructions that occur in confined river reaches from time to time and typically comprise rock regolith vegetation etc which obstruct the flow of water and cause it to dam
debris Flow A fluvial phenomena that can occur in steep channels usually as a result of intense rainfall on an already wet catchment the debris flow manifests as a slug or series of slugs of water and sediment travelling
DoCheRtY CReeK
1km 1mi
FRanZ JoSeF toWnShip
Canvans Knob
Franz Josef Stopbanks
Canavans Knob Stopbank
Rubbish Dump Stopbank
milton amp others Stopbank
State highway
State highway
Bridge
Sewerage ponds
nZta
WCRC
hokitika airport authority
Department of Conservation
Westland District Council
tartare gorge
Waiho loop
Rata Knoll
WAIHO RIVER
CalleRY RiveR
70 71 Waiho RiveR optimal FutuRe management Waiho RiveR optimal FutuRe management
appendIx 7 glossary of terms appendIx 7 glossary of terms
rapidly downstream as a dense slurry which may have incorporated within it woody debris such as tree trunks and branches
debris Flow activity The occurrence of debris flowsdebris traps Places within a catchments river system where sediment tends to accumulatedegradation The opposite process to aggradation whereby sands and gravels are eroded out of the riverbed
and the riverbed fallsdeflation of the bed The steady reduction in elevation of an eroding surface (river bed) over time under the
influence of surface erosion processesdesign Flood levels The maximum water level relative to a prescribed design datum set at a particular location
on a river required to contain the design flood carrying capacity of the river control systemdetritus The products of erosion that is delivered into a river system form the slopes where it has been generated
by weathering and erosion processesdistal end of an alluvial Fan The furthest end of an alluvial fan from the fan head and typically the lowest
elevation on the fan surface provided the fan has not been truncated by erosion by the river or by wave action on a lake or the sea
episodic Events that occur irregularly in timeFalling limb of a Hydrograph That part of the flood hydrograph after the peak where the flood recession
occursFlood Carrying Capacity An estimate of the peak flow in m3 per second that a river control system (can contain
without exceeding its freeboard where a river has stopbanks it is the flow contained within the stopbanks whilst maintaining the design freeboard
Flood Frequency estimates A statistical process for estimating the recurrence interval of various flood discharges for a particular hydrometric site using the annual maxima series for that site
Flood Peak The maximum flow reached by a river in flood measured in m3 per secondFlood Plain The surface over which a river can spread in times of flood once it overtops its natural banks Flood Volume The total volume of water delivered by a river in flood over the duration of the flood and measured
in m3 Fluvial Characteristics The characteristics of a river which describe the storage transport and reworking of river
sediments by the rivers flowsgeomorphic Constraints Physical factors such a rate of uplift hardness of basement rock present sea level
which limit for example the generation of sediment supply and gradient of a river and hence influence the form of a river
glacial internal drainage systems Subsurface watercourses located in and beneath a glacier that convey water from the surface and sides of a glacier into through and beneath a glacier and discharge to the valley floor at the glacier terminal face
glacier retreat The process whereby the terminal face of the glacier is located progressively up the valley as the glacier ice volume is reduced by ablation
Headcut The formation of an erosion cusp in a channel that results in a localised step in a channel bedHeadward erosion The erosion that generates and maintains the headward movement of the erosion cusp
(headcut)Hydraulic Characteristics The flow characteristics of a river system such as flow depth water velocity channel
surface roughness and channel slope (gradient)Hydraulic gradient The slope on a flowing water surfaceHydrometric site A water level measuring site which continuously measures and records water depth at the site
at specific time intervals used for establishing flow records over the full range from low to high flow landslide dam A dam that forms in a confined reach of a river as a result of landslide occurring and partially
blocking the valley through which the river is flowinglateral bank erosion The processes whereby a river erodes its banks generally used with reference to the
erosion of stopbanks when a river moves side ways in a flood eroding the stopbank in the process on the riverside of the stopbank
liquefaction The sudden loss of strength of an unconsolidated or poorly consolidated saturated fine sand soil induced by violent earthquake shaking
lithologies A geological term used for describing rock typeslive bed Conditions The condition that may occur in a riverbed in flood when the deposits which form the
riverbed and banks begin to mobilise and become entrained in the flow and move downstreamMass Movement The downslope movement of regolith and other erosion products in bulk eg slab avalanches
landslides debris flows
Mean bed level The average level of a riverbed across a particular cross section at a particular time estimated from a surveyed cross section at a particular time
Micro scale Modeling The development and running of a small scale physical replica of a particular physical feature such as an active alluvial fan in a laboratory situation
Morphologically active alluvial Fan An alluvial fan that is either aggrading or degrading under its present sediment and water supply and under the influence of local morphological constraints
natural Hazards Any atmospheric or earth or water related occurrence (in the Waiho River context including earthquake erosion landslip Subsidence sedimentation wind drought or flooding) the actions of which adversely affects or may affect human life property or other aspects of the environment
overtopping The term used to describe the situation where floodwaters in a river in flood begin to spill over the rivers banks or stopbanks whichever is relevant to the particular situation being considered
Permeability A term used to describe and quantify that property of a soil that permits water to flow through the pores of the soil under a hydraulic gradient
Pheratic surface The curvilinear water surface within the soils of a stopbank or dam through which water is seeping marking the boundary between saturated and un-saturated soils
Predictive tool A procedure such as a hydraulic model that is developed in order to try and determine how a particular physical situation might develop over time under specified inputs (eg water bedload supply)
Prograding The episodic growth of an alluvial fan surface which causes the distal end of the fan to extend downstream away from the fan head
recession That period during a flood when the river has passed its peak and water levels and hence flow rates are dropping
recurrence interval A statistical term used to describe the relative size of an event (synonymous with the term average return period) eg a particular rainfall depth or flood flow A 1 in 100 year flood has a recurrence interval of 100 years on average It does not mean that an hundred year flood will not occur again for 100 years if an event of that size has just been experienced
regolith The accumulation of soil material on a hill slope as a result of the weathering of the hill slope over time Typically regolith includes clay and sand size particles rock fragments and soil
regolith avalanches The localised movement of regolith rapidly off a hill slope onto the valley floor or riverbed in the form of an avalanche
residence time The time that elapses for example between bed load sediments accumulating at a particular location and subsequently being eroded out
revegetation The decolonization with new vegetation on areas such as slopes denuded of vegetation by landslides
river bed roughness A hydraulic term which reflects the relative roughness of the surface of a riverbed or its berms that is used in hydraulic computations
river Cross sections A survey of ground levels extending across a river from its true left bank to its true right bank aligned more or less at right angles to the rivers flow in times of flood
river reach A description for a particular stretch of a riverriver training and Protection Works Structures erected by humans in an attempt to mitigate against riverbank
erosion and channel migration during floodsrelaxation Removing the boundary constrains on a stopbanked river to allow the river to reassert its natural
form on the floodplain unimpeded by man made flood containment structuresrock rip rap A term used to describe the coarse hard rock that is placed against a surface that may be eroded
by river flows in order to mitigate against such erosion sediment sources Those parts of a river catchment that supply sediment to the river as sediment supplysediment supply The sediment that passes through a river system typically of an episodic nature ie the rate of
supply varying over time typically in response to climatic conditions and river flowseismic induced Mass Movement Landslide activity caused by seismic activityshallow slab avalanches Landslides that typically occur on steep valley sides where the basement rock is close
to the surface (eg within 1 to 2 metres of the surface)sinusoidal braided Flow PatternsTheldquoSrdquoshapedchannelinducedflowpatternsobservedinbraidedriversspecial rating district A Rating District established for the construction and ongoing repair and maintenance
of a river control scheme the rating district is administered by the West Coast Regional Councilsplinter Faults Fault lines that extend out at an angle from a main fault linespur groynes Short groynes that are constructed at the toe of a natural river bank or stopbank that project out
into the riverbed designed to ease high flow velocities of the natural bank or stopbank toe in order to lessen the risk of lateral erosion by the river in flood
72 73 Waiho RiveR optimal FutuRe management Waiho RiveR optimal FutuRe management
appendIx 7 glossary of terms
stopbank A structure erected on a rivers floodplain typically sub-parallel to the rivers flow in times of flood to contain flood flows up to the design standard of the flood protection scheme to prevent them from spilling onto the floodplain
sub-alpine vegetation Typically shrubby bushes grasses and stunted trees that grow above the bush line but below the sparsely vegetated alpine area of a mountain range
sub ndash Parallel More or less parallelsuper-elevation effect The local elevation of water levels around the outside of a bend in a river caused by
centrifugal forces generated by the water moving around the river bendswale The remnant of a river channel on a riversrsquo floodplain that has been etched by river flows in the past and
has subsequently been abandoned by the normal flow of the river but can activate when rivers overtop their natural banks and flow onto the flood plain they may also convey surface runoff from local rainstorms from time to time
temporal supply Mechanism A process that generates sediment supply to the river system and is time dependent
thalweg The centreline path the active riverbed takes as it flows down plainthreshold Flood event A flood event of sufficient size that it overtops a rivers confining banks natural or man
made transfer reach That part of a mountain catchment located in the foothill area upstream of the head (or apex)
of an alluvial fan generally a gorge or narrow confined reach with little opportunity for coarse sediment storage coarse sediments tend to flush through these reaches during floods rather than accumulate as they might on the fan surface proper
two dimensional Hydraulic Model A computer model that incorporates a digital terrain model to provide the basis for determining water depths and velocities over that surface for a particular design flood flow
Wasting out The eroding out of deposits over time
74 Waiho RiveR optimal FutuRe management
388 Main South Road PO Box 66 Greymouth
phone +64 3 768 0466
email infowcrcgovtnz
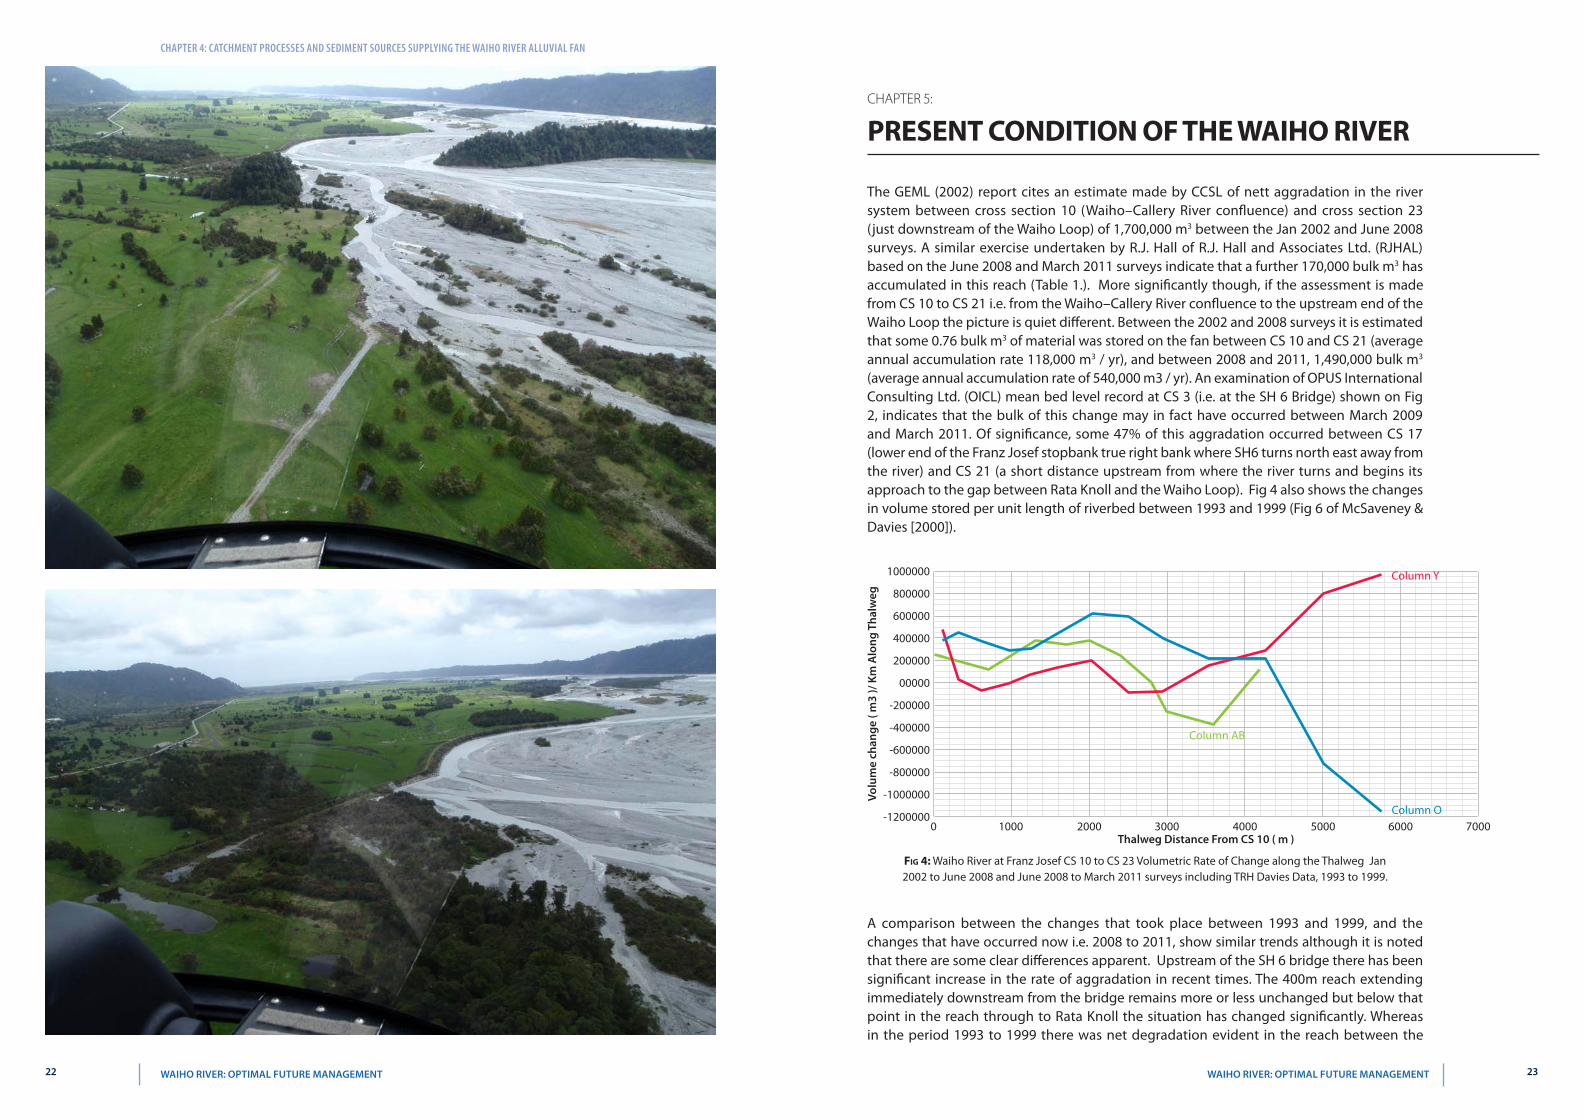
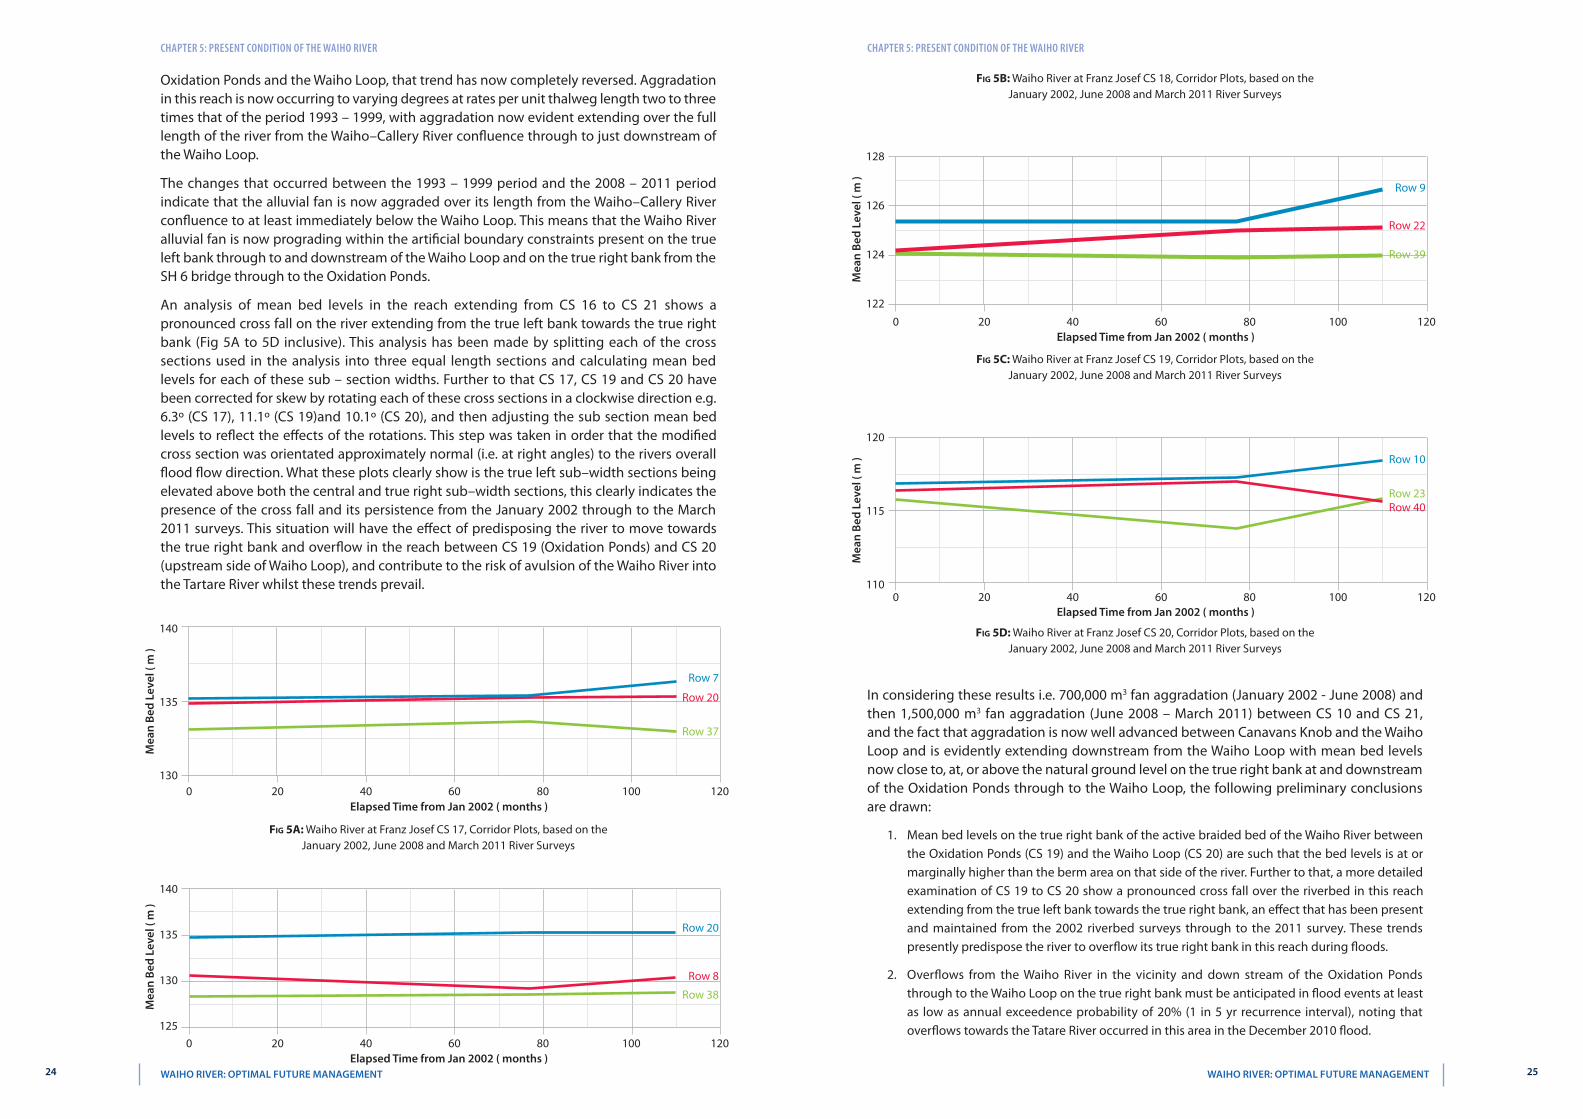
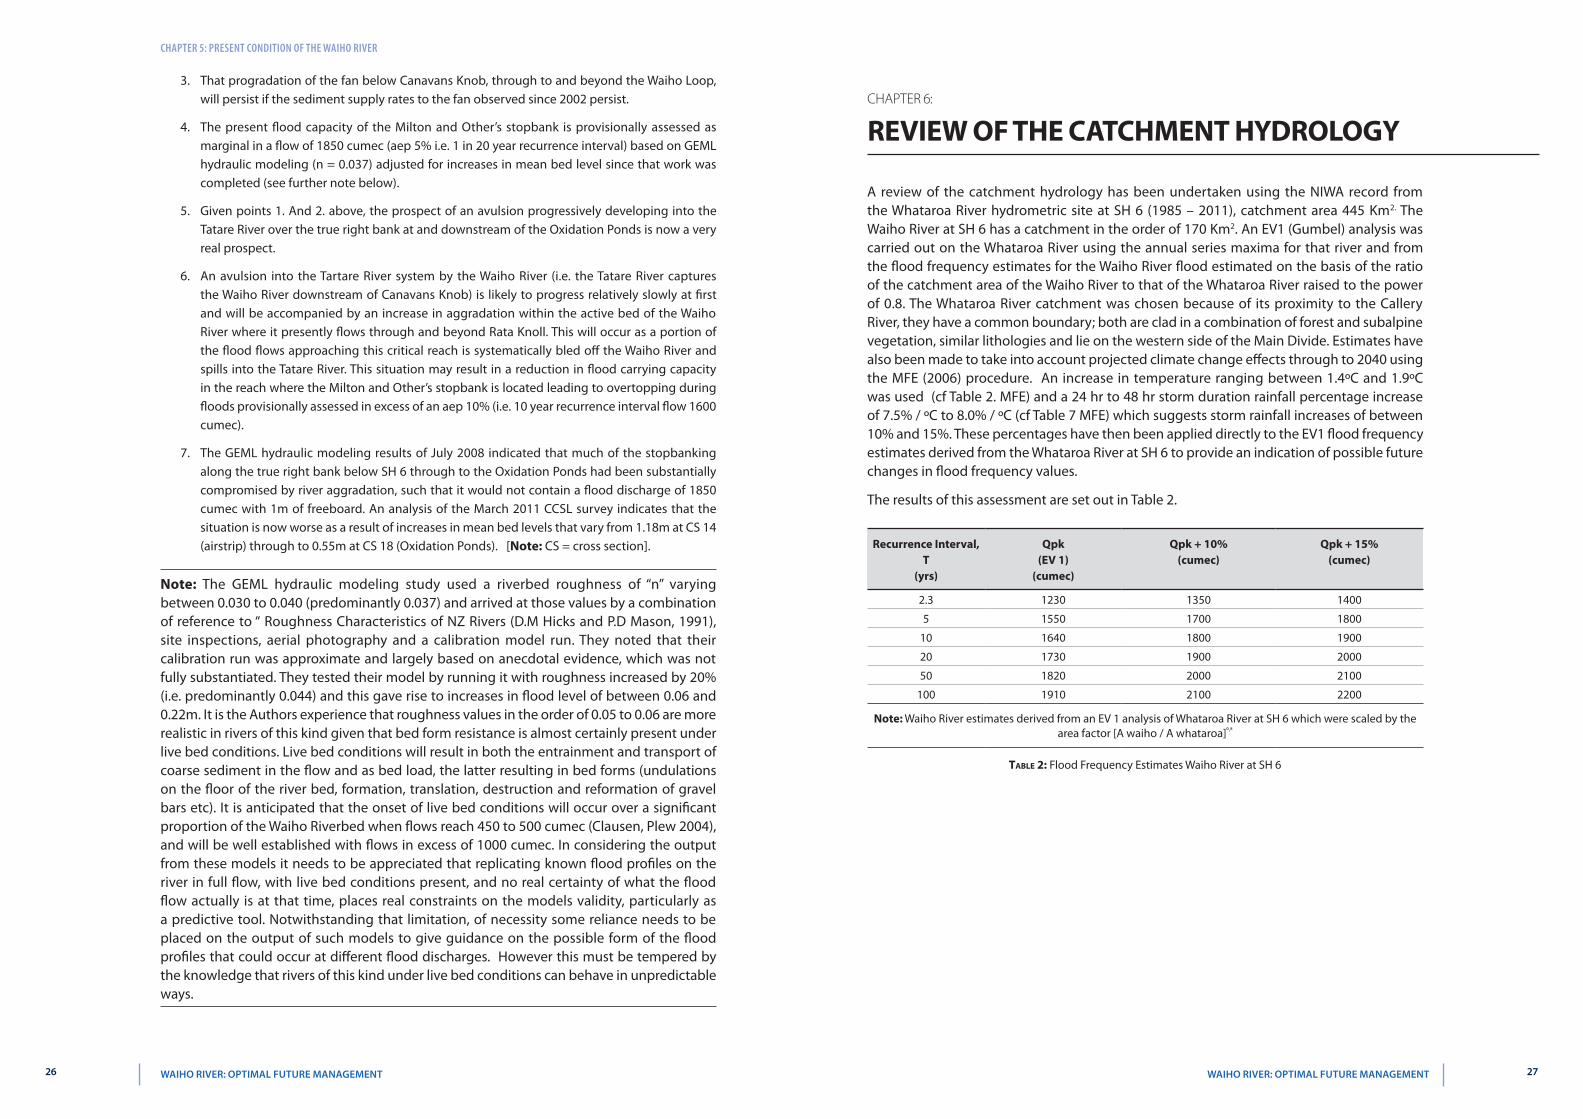
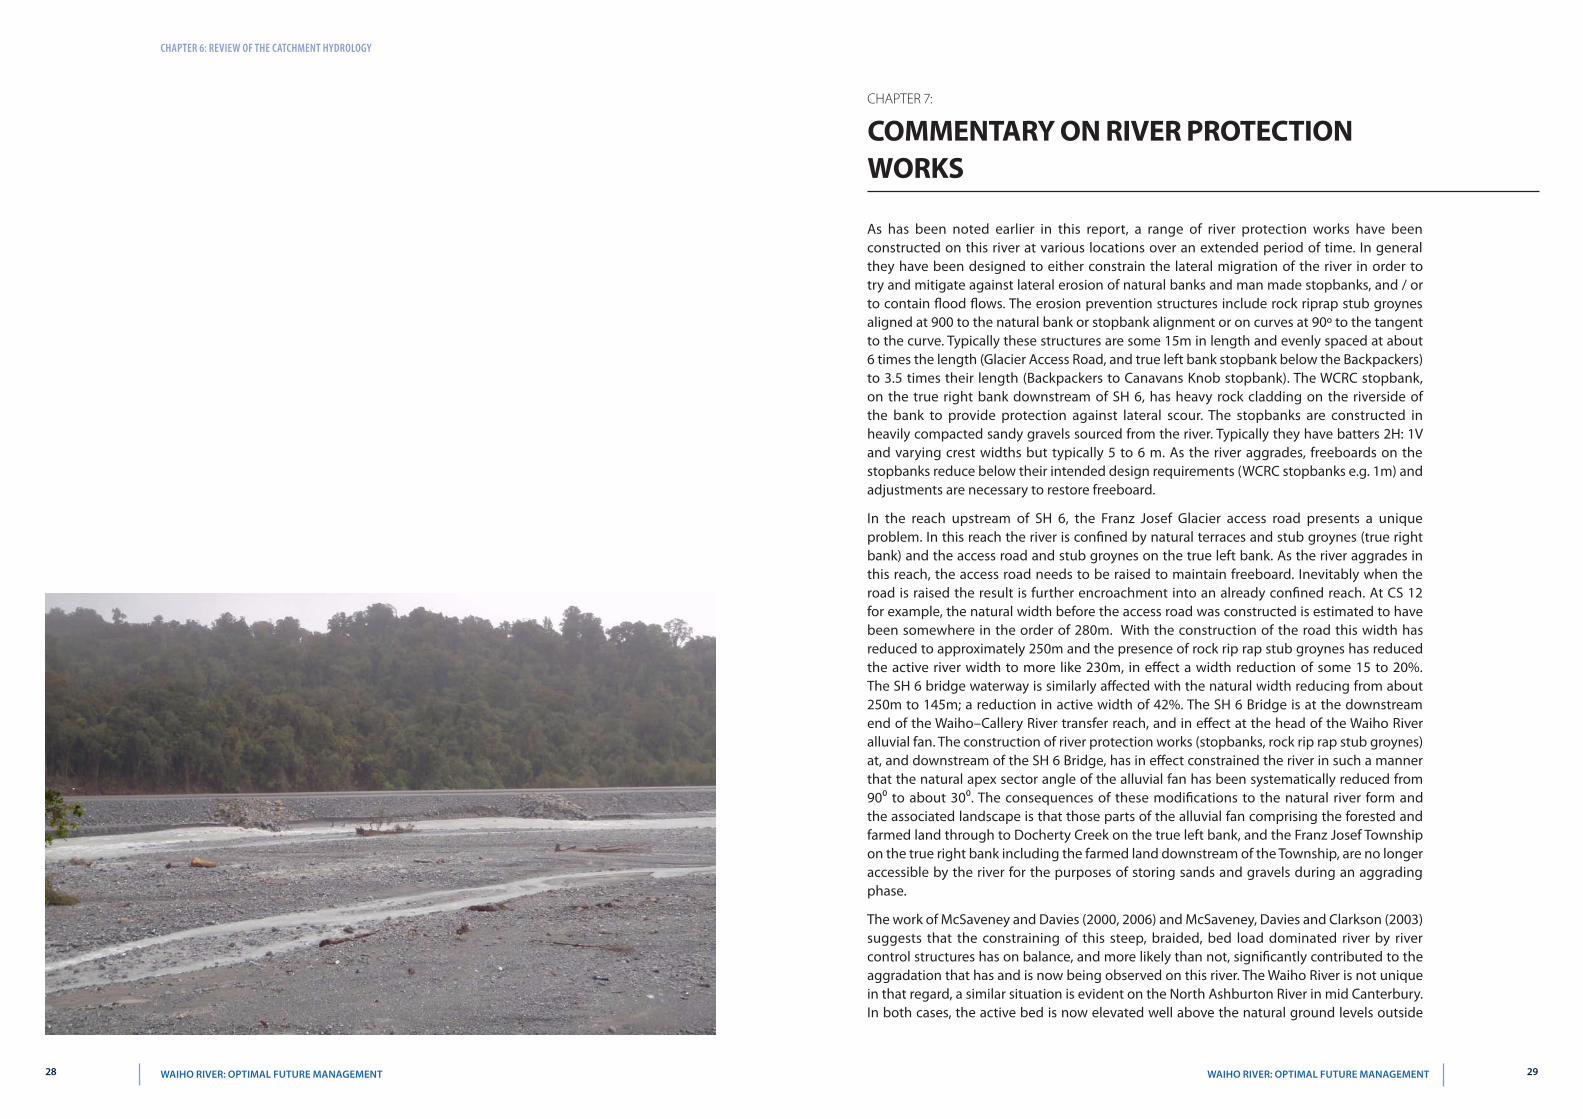
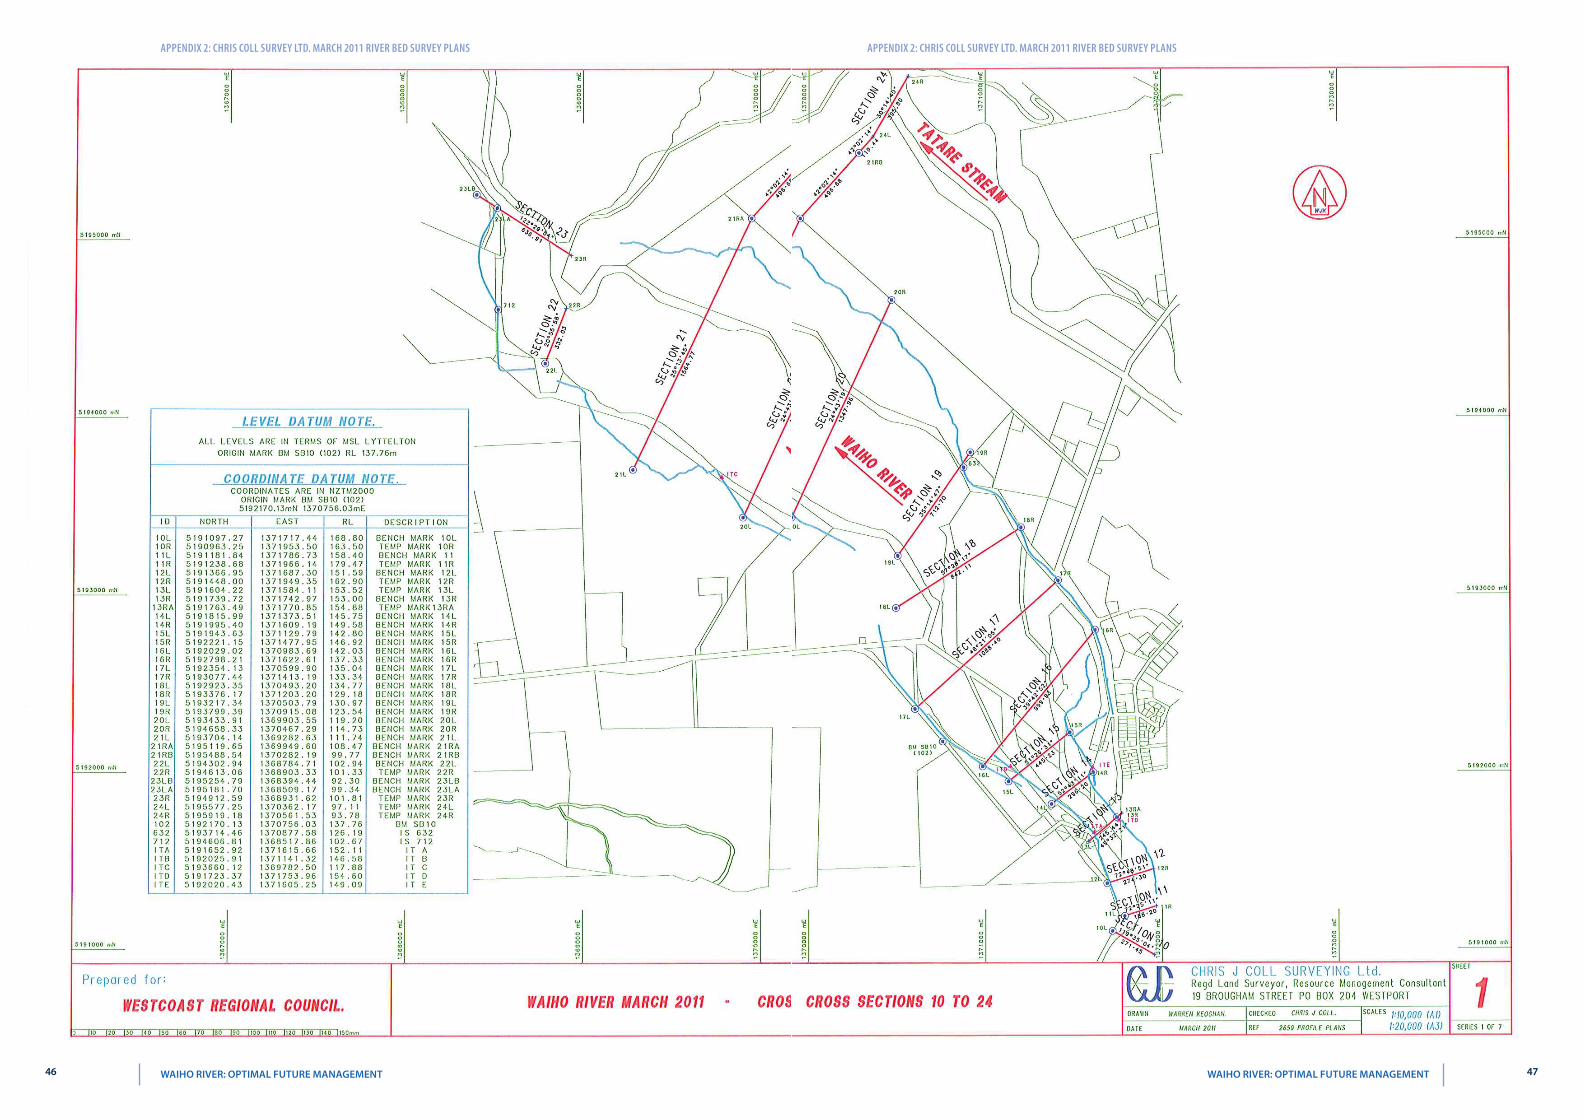
appendIx 2 ChrIs Coll survey ltd marCh 2011 rIver bed survey plans appendIx 2 ChrIs Coll survey ltd marCh 2011 rIver bed survey plans
46 47 Waiho RiveR optimal FutuRe management Waiho RiveR optimal FutuRe management
appendIx 2 ChrIs Coll survey ltd marCh 2011 rIver bed survey plans appendIx 2 ChrIs Coll survey ltd marCh 2011 rIver bed survey plans
48 49 Waiho RiveR optimal FutuRe management Waiho RiveR optimal FutuRe management
appendIx 2 ChrIs Coll survey ltd marCh 2011 rIver bed survey plans appendIx 2 ChrIs Coll survey ltd marCh 2011 rIver bed survey plans
50 51 Waiho RiveR optimal FutuRe management Waiho RiveR optimal FutuRe management
appendIx 2 ChrIs Coll survey ltd marCh 2011 rIver bed survey plans appendIx 2 ChrIs Coll survey ltd marCh 2011 rIver bed survey plans
52 53 Waiho RiveR optimal FutuRe management Waiho RiveR optimal FutuRe management
appendIx 2 ChrIs Coll survey ltd marCh 2011 rIver bed survey plans appendIx 2 ChrIs Coll survey ltd marCh 2011 rIver bed survey plans
54 55 Waiho RiveR optimal FutuRe management Waiho RiveR optimal FutuRe management
appendIx 2 ChrIs Coll survey ltd marCh 2011 rIver bed survey plans appendIx 2 ChrIs Coll survey ltd marCh 2011 rIver bed survey plans
56 57 Waiho RiveR optimal FutuRe management Waiho RiveR optimal FutuRe management
appendIx 2 ChrIs Coll survey ltd marCh 2011 rIver bed survey plans appendIx 2 ChrIs Coll survey ltd marCh 2011 rIver bed survey plans
58 59 Waiho RiveR optimal FutuRe management Waiho RiveR optimal FutuRe management
appendIx 2 ChrIs Coll survey ltd marCh 2011 rIver bed survey plans
appEndix 3
CHris Coll surVey ltd June 2011 WaiHo busH bloCk
60 61 Waiho RiveR optimal FutuRe management Waiho RiveR optimal FutuRe management
appendIx 3 ChrIs Coll survey ltd June 2011 waIho bush bloCk appendIx 3 ChrIs Coll survey ltd June 2011 waIho bush bloCk
62 63 Waiho RiveR optimal FutuRe management Waiho RiveR optimal FutuRe management
appendIx 3 ChrIs Coll survey ltd June 2011 waIho bush bloCk
appEndix 4
reFerenCes
1 Influence of Channel Width on Bed Load Transport Capacity MA Carson and GA Griffith ASCE Journal of Hydraulic Engineering Vol 113 No 12 Dec 1987 (pp 1489 -1509)
2 Dam Break Flood Hazard from the Callery River Westland New Zealand TR Davies and BK Scott Journal of Hydrology (NZ) 36 (1) 1-13 (1997)
3 Natural Hazards Assessment for the Township of Franz Josef and its Environs MJ McSaveney TRH Davies IGNS Client Report 44714B10 (July 1998)
4 Peer Review of the Institute of Geological and Nuclear Sciences Ltd Report No 44714B10 (July 1998) Natural Hazards Assessment for the Township of Franz Josef and its Environs RJ Hall RJ Hall Civil amp Environmental Consulting Ltd (August 1998)
5 Evaluation of Options for the Management of the Waiho River Aggradation Threats RJ Hall et al (2000)6 Anthropogenic Fanhead Aggradation Waiho River Westland New Zealand TR Davies MJ McSaveney
Proceedings 5th International Gravel-bed Rivers Symposium Christchurch and Franz Josef (2000)7 The Transit New Zealand Waiho Workshop HL Rouse TJ Day TRH Davies Proceedings 5th International
Gravel-bed Rivers Symposium Christchurch and Franz Josef (2000)8 Landslide-dambreak Floods at Franz Josef Glacier Township Westland New Zealand a Risk Assessment TR Davies
Journal of Hydrology (NZ) Vol 41 No 1 (2002) 9 Anthropogenic Aggradation of the Waiho River Westland New Zealand TR Davies MJ McSaveney PJ
Clarkeson Earth Surfaces Processes and Landforms 28 209-218 (2003)10 How High are Bed Moving Flows in New Zealand Rivers B Clausen D Plew Journal of Hydrology (NZ) Vol 43 No
1 (2004)11 Geomorphic Constraints on the Management of Bed-load Dominated Rivers TR Davies MJ McSaveney Journal
of Hydrology (NZ) 45 (2) 69-88 (2006) 12 Geology of the Aoraki Area 1 250000 Geological Map 15 SC Cox DJA Barrell compilers IGNS (2007)13 West Coast Regional Council Waiho River Flood Protection Scheme Design Flood Levels Good Earth Matters Ltd
(2008)14 Preparing For Climate Change A Guide for Local Government in New Zealand Ministry for the Environment (2008)15 Waiho River Bed Surveys June 2008 and March 2011 Chris Coll Surveying Ltd (2011)16 Topographical Survey of the Waiho Bush Block Chris Coll Surveying Ltd (2011)17 Mean Bed Level Survey Record Waiho River SH 6 Bridge February 1997 ndash May 2011 Opus International Consultants
Ltd 18 WCRC Asset Management Plans for the Franz Josef Special Rating Area the Lower Waiho Rating District (December
2010)19 Video of Callery Fly Over 2011 Opus International Consultants Ltd (2011)20 Oblique Stills Callery Fly Over 2011 Department of Conservation Franz Josef (2011)21 WCRC Staff Aerial Inspection ndash Callery 6 September 2011 W Moen WCRC (7 September 2011)22 Planning for a Safer Franz Josef ndash Waiau Community Westland District Considering Rupture of the Alpine Fault
RM Langridge amp JG Beban GNS Science Consultancy Report 2011217 (September 2011)23 Callery River Landslide Dam Rapid Assessment of Dam Failure Consequences for West Coast Regional Council R
Measures M Duncan NIWA (September 2011)24 NIWA Flood Annual Flood Record and Annual Means Site 89301 Whataroa River at SH 6 1985 ndash 2011 NIWA (2011)25 Report on West Coast Weather Event 27 amp 28 December 2010 West Coast Regional Council report (2011)
64 65 Waiho RiveR optimal FutuRe management Waiho RiveR optimal FutuRe management
appendIx 4 referenCes
appEndix 5
tables
Cros
s se
ctio
n
thal
weg
dis
tanc
e ( m
)
Mbl
Jan-
02 (
rl m
)
Mbl
Jun-
08 (
rl m
)
Mbl
Mar
-11
( rl
m )
Chan
ge M
bl Ja
n 02
- Ju
ne 0
8 ( r
l m
)
Chan
ge M
bl Ju
ne 0
8 - M
ar
2011
( r
l m
)
rate
Cha
nge
Mbl
Jan
02 -
June
08
( m
yr )
rate
Cha
nge
Mbl
June
08
- M
ar 2
011
( m
yr
)
rati
o M
bl C
hang
e pe
r yr
2008
- 20
11 to
200
2 - 2
011
Chan
ge in
Vol
ume
( m
3 ) 20
02 -
2008
Chan
ge in
Vol
ume
( m
3 ) 20
02 -
2011
10 0 15305 15855 16039 551 184 0816 0689 08
11 209 15484 15572 157785 088 207 0131 0775 59 103269 68536
12 417 15308 15328 154969 020 169 0030 0632 212 21893 81442
13 821 15053 15043 15139 -010 097 -0015 0363 00 4656 129254
14 1113 14594 14656 14754 062 098 0092 0369 40 18638 70075
15 1377 14354 14387 14463 033 076 0049 0284 58 36017 68155
16 1795 13934 13963 14017 029 055 0043 0205 48 79237 159891
17 2268 13428 13452 13515 024 063 0035 0237 68 115310 261502
18 2740 12947 12918 12971 -029 053 -0043 0197 -45 -3499 247856
19 3158 12449 12484 12522 034 038 0051 0143 28 -54 147467
20 3923 11626 11678 11703 051 026 0076 0097 13 156610 134985
21 4618 10901 10932 10949 031 017 0045 0065 14 224717 123676
22 5418 10101 10104 10100 003 -005 0004 -0017 -40 613958 -560100
23 6114 9343 9504 9397 161 -108 0239 -0403 00 635880 -761619
2006631 171120
TABle 1 Waiho River at Franz Josef Mean Bed Level and Volumetric Changes Summary January 2002 ndash June 2008 and June 2008 ndash March 2011 River Bed Surveys
66 67 Waiho RiveR optimal FutuRe management Waiho RiveR optimal FutuRe management
appendIx 5 tables
recurrence interval t
(yrs)
Qpk(eV 1)
(cumec)
Qpk + 10(cumec)
Qpk + 15(cumec)
23 1230 1350 1400
5 1550 1700 1800
10 1640 1800 1900
20 1730 1900 2000
50 1820 2000 2100
100 1910 2100 2200
note Waiho River estimates derived from an EV 1 analysis of Whataroa River at SH 6 which were scaled by the area factor [A waiho A whataroa]⁰⁸
TABle 2 Flood Frequency Estimates for the Waiho River based on the Whataroa River at SH 6
appEndix 6
Figures
68 69 Waiho RiveR optimal FutuRe management Waiho RiveR optimal FutuRe management
appendIx 5 tables
appEndix 7
glossary oF terMs
active gully erosion Erosion that is presently occurring on the sides and floor of a gully during rainstorms which results in an expansion of the gully (viz depth width) and delivers sediment downstream into the main river system of which it is an integral part
aggradation The process whereby sands and gravels accumulate in a riverbed causing the bed level to riseaggrading Phase A term used to describe a period when aggradation is occurring in a river or on an active
alluvial fanalluvial Fan The fan shaped surface built up by a river over extended time where it exits in a confined reach
typically where a river emerges from a hill catchmentannual exceedence Probability The probability that an event (rainstorm flood) of a specific size will occur on
average in any one year (the mathematical reciprocal of the return period or recurrence interval for that event)
annual series Maxima A table comprising the highest flow recorded at a hydrometric site for each year of record and is used for determining the flood frequency characteristics of that site
antecedent rainfall That rainfall that occurs prior to the onset of a rainstorm and which pre-soaks the soil assisting in the development of runoff from the storm when it occurs
anthropogenic Something which has occurred or will occur as a result of human activity or influenceappurtenant structures A structure that is integrally required for the satisfactory performance of another
structure eg rock riprap stub groynes to provide protection to the riverside toe and batter of a stopbankaverage Water depth The water depth averaged over a cross section for a particular flowavulsion The sudden change in direction of a river that occurs as a result of a break out usually occurring during
a flood so that the river abandons its original course in favour of the new alignmentbedload dominated river A river in whose form has been sculptured by the erosion storage and transport of
gravel as bedloadbenchmark level The level referenced to a particular survey datum that is set on a permanent reference point
(bench mark) for survey purposesboils The localised appearance of water and fine soil particles such as sands and silts that occur where
concentrated seepage flows emerge at groundlinebraided river The description for a wide generally steep gravel bed river that has a multitude of interlacing
channelsCalibration run The running of an hydraulic model using selected known flows and water profiles in order to
determine what surface roughnessrsquos are required to obtain realistic model performanceCatchment Processes The physical processes operating within a catchment which influence the rate of runoff
and hence river flow during rainstormsChannel gradient The average slope of a channel reach measured along the flow path of the riverCross Fall The gradient that occurs on the bed of a river that runs at right angles to the primary down valley
gradient of the riverbedCrest settlement The lowering of the crest level of a stopbank caused by either settlement in the stopbank
foundation where weak materials are present or as a result of internal erosion of the stopbank or where liquefaction has occurred or through slumping caused by erosion of the stopbank or lateral spreading of the stopbank foundation as a result of earthquake action
Current Morphological status The present state that a river is in given that the rivers form tends to change over time in response to climatic and geological influences which can affect sediment supply catchment runoff and hence river flows channel gradient and sea level
dam break surges The waves of water and debris that move rapidly downstream from a debris dam when it fails
debris dams Obstructions that occur in confined river reaches from time to time and typically comprise rock regolith vegetation etc which obstruct the flow of water and cause it to dam
debris Flow A fluvial phenomena that can occur in steep channels usually as a result of intense rainfall on an already wet catchment the debris flow manifests as a slug or series of slugs of water and sediment travelling
DoCheRtY CReeK
1km 1mi
FRanZ JoSeF toWnShip
Canvans Knob
Franz Josef Stopbanks
Canavans Knob Stopbank
Rubbish Dump Stopbank
milton amp others Stopbank
State highway
State highway
Bridge
Sewerage ponds
nZta
WCRC
hokitika airport authority
Department of Conservation
Westland District Council
tartare gorge
Waiho loop
Rata Knoll
WAIHO RIVER
CalleRY RiveR
70 71 Waiho RiveR optimal FutuRe management Waiho RiveR optimal FutuRe management
appendIx 7 glossary of terms appendIx 7 glossary of terms
rapidly downstream as a dense slurry which may have incorporated within it woody debris such as tree trunks and branches
debris Flow activity The occurrence of debris flowsdebris traps Places within a catchments river system where sediment tends to accumulatedegradation The opposite process to aggradation whereby sands and gravels are eroded out of the riverbed
and the riverbed fallsdeflation of the bed The steady reduction in elevation of an eroding surface (river bed) over time under the
influence of surface erosion processesdesign Flood levels The maximum water level relative to a prescribed design datum set at a particular location
on a river required to contain the design flood carrying capacity of the river control systemdetritus The products of erosion that is delivered into a river system form the slopes where it has been generated
by weathering and erosion processesdistal end of an alluvial Fan The furthest end of an alluvial fan from the fan head and typically the lowest
elevation on the fan surface provided the fan has not been truncated by erosion by the river or by wave action on a lake or the sea
episodic Events that occur irregularly in timeFalling limb of a Hydrograph That part of the flood hydrograph after the peak where the flood recession
occursFlood Carrying Capacity An estimate of the peak flow in m3 per second that a river control system (can contain
without exceeding its freeboard where a river has stopbanks it is the flow contained within the stopbanks whilst maintaining the design freeboard
Flood Frequency estimates A statistical process for estimating the recurrence interval of various flood discharges for a particular hydrometric site using the annual maxima series for that site
Flood Peak The maximum flow reached by a river in flood measured in m3 per secondFlood Plain The surface over which a river can spread in times of flood once it overtops its natural banks Flood Volume The total volume of water delivered by a river in flood over the duration of the flood and measured
in m3 Fluvial Characteristics The characteristics of a river which describe the storage transport and reworking of river
sediments by the rivers flowsgeomorphic Constraints Physical factors such a rate of uplift hardness of basement rock present sea level
which limit for example the generation of sediment supply and gradient of a river and hence influence the form of a river
glacial internal drainage systems Subsurface watercourses located in and beneath a glacier that convey water from the surface and sides of a glacier into through and beneath a glacier and discharge to the valley floor at the glacier terminal face
glacier retreat The process whereby the terminal face of the glacier is located progressively up the valley as the glacier ice volume is reduced by ablation
Headcut The formation of an erosion cusp in a channel that results in a localised step in a channel bedHeadward erosion The erosion that generates and maintains the headward movement of the erosion cusp
(headcut)Hydraulic Characteristics The flow characteristics of a river system such as flow depth water velocity channel
surface roughness and channel slope (gradient)Hydraulic gradient The slope on a flowing water surfaceHydrometric site A water level measuring site which continuously measures and records water depth at the site
at specific time intervals used for establishing flow records over the full range from low to high flow landslide dam A dam that forms in a confined reach of a river as a result of landslide occurring and partially
blocking the valley through which the river is flowinglateral bank erosion The processes whereby a river erodes its banks generally used with reference to the
erosion of stopbanks when a river moves side ways in a flood eroding the stopbank in the process on the riverside of the stopbank
liquefaction The sudden loss of strength of an unconsolidated or poorly consolidated saturated fine sand soil induced by violent earthquake shaking
lithologies A geological term used for describing rock typeslive bed Conditions The condition that may occur in a riverbed in flood when the deposits which form the
riverbed and banks begin to mobilise and become entrained in the flow and move downstreamMass Movement The downslope movement of regolith and other erosion products in bulk eg slab avalanches
landslides debris flows
Mean bed level The average level of a riverbed across a particular cross section at a particular time estimated from a surveyed cross section at a particular time
Micro scale Modeling The development and running of a small scale physical replica of a particular physical feature such as an active alluvial fan in a laboratory situation
Morphologically active alluvial Fan An alluvial fan that is either aggrading or degrading under its present sediment and water supply and under the influence of local morphological constraints
natural Hazards Any atmospheric or earth or water related occurrence (in the Waiho River context including earthquake erosion landslip Subsidence sedimentation wind drought or flooding) the actions of which adversely affects or may affect human life property or other aspects of the environment
overtopping The term used to describe the situation where floodwaters in a river in flood begin to spill over the rivers banks or stopbanks whichever is relevant to the particular situation being considered
Permeability A term used to describe and quantify that property of a soil that permits water to flow through the pores of the soil under a hydraulic gradient
Pheratic surface The curvilinear water surface within the soils of a stopbank or dam through which water is seeping marking the boundary between saturated and un-saturated soils
Predictive tool A procedure such as a hydraulic model that is developed in order to try and determine how a particular physical situation might develop over time under specified inputs (eg water bedload supply)
Prograding The episodic growth of an alluvial fan surface which causes the distal end of the fan to extend downstream away from the fan head
recession That period during a flood when the river has passed its peak and water levels and hence flow rates are dropping
recurrence interval A statistical term used to describe the relative size of an event (synonymous with the term average return period) eg a particular rainfall depth or flood flow A 1 in 100 year flood has a recurrence interval of 100 years on average It does not mean that an hundred year flood will not occur again for 100 years if an event of that size has just been experienced
regolith The accumulation of soil material on a hill slope as a result of the weathering of the hill slope over time Typically regolith includes clay and sand size particles rock fragments and soil
regolith avalanches The localised movement of regolith rapidly off a hill slope onto the valley floor or riverbed in the form of an avalanche
residence time The time that elapses for example between bed load sediments accumulating at a particular location and subsequently being eroded out
revegetation The decolonization with new vegetation on areas such as slopes denuded of vegetation by landslides
river bed roughness A hydraulic term which reflects the relative roughness of the surface of a riverbed or its berms that is used in hydraulic computations
river Cross sections A survey of ground levels extending across a river from its true left bank to its true right bank aligned more or less at right angles to the rivers flow in times of flood
river reach A description for a particular stretch of a riverriver training and Protection Works Structures erected by humans in an attempt to mitigate against riverbank
erosion and channel migration during floodsrelaxation Removing the boundary constrains on a stopbanked river to allow the river to reassert its natural
form on the floodplain unimpeded by man made flood containment structuresrock rip rap A term used to describe the coarse hard rock that is placed against a surface that may be eroded
by river flows in order to mitigate against such erosion sediment sources Those parts of a river catchment that supply sediment to the river as sediment supplysediment supply The sediment that passes through a river system typically of an episodic nature ie the rate of
supply varying over time typically in response to climatic conditions and river flowseismic induced Mass Movement Landslide activity caused by seismic activityshallow slab avalanches Landslides that typically occur on steep valley sides where the basement rock is close
to the surface (eg within 1 to 2 metres of the surface)sinusoidal braided Flow PatternsTheldquoSrdquoshapedchannelinducedflowpatternsobservedinbraidedriversspecial rating district A Rating District established for the construction and ongoing repair and maintenance
of a river control scheme the rating district is administered by the West Coast Regional Councilsplinter Faults Fault lines that extend out at an angle from a main fault linespur groynes Short groynes that are constructed at the toe of a natural river bank or stopbank that project out
into the riverbed designed to ease high flow velocities of the natural bank or stopbank toe in order to lessen the risk of lateral erosion by the river in flood
72 73 Waiho RiveR optimal FutuRe management Waiho RiveR optimal FutuRe management
appendIx 7 glossary of terms
stopbank A structure erected on a rivers floodplain typically sub-parallel to the rivers flow in times of flood to contain flood flows up to the design standard of the flood protection scheme to prevent them from spilling onto the floodplain
sub-alpine vegetation Typically shrubby bushes grasses and stunted trees that grow above the bush line but below the sparsely vegetated alpine area of a mountain range
sub ndash Parallel More or less parallelsuper-elevation effect The local elevation of water levels around the outside of a bend in a river caused by
centrifugal forces generated by the water moving around the river bendswale The remnant of a river channel on a riversrsquo floodplain that has been etched by river flows in the past and
has subsequently been abandoned by the normal flow of the river but can activate when rivers overtop their natural banks and flow onto the flood plain they may also convey surface runoff from local rainstorms from time to time
temporal supply Mechanism A process that generates sediment supply to the river system and is time dependent
thalweg The centreline path the active riverbed takes as it flows down plainthreshold Flood event A flood event of sufficient size that it overtops a rivers confining banks natural or man
made transfer reach That part of a mountain catchment located in the foothill area upstream of the head (or apex)
of an alluvial fan generally a gorge or narrow confined reach with little opportunity for coarse sediment storage coarse sediments tend to flush through these reaches during floods rather than accumulate as they might on the fan surface proper
two dimensional Hydraulic Model A computer model that incorporates a digital terrain model to provide the basis for determining water depths and velocities over that surface for a particular design flood flow
Wasting out The eroding out of deposits over time
74 Waiho RiveR optimal FutuRe management
388 Main South Road PO Box 66 Greymouth
phone +64 3 768 0466
email infowcrcgovtnz
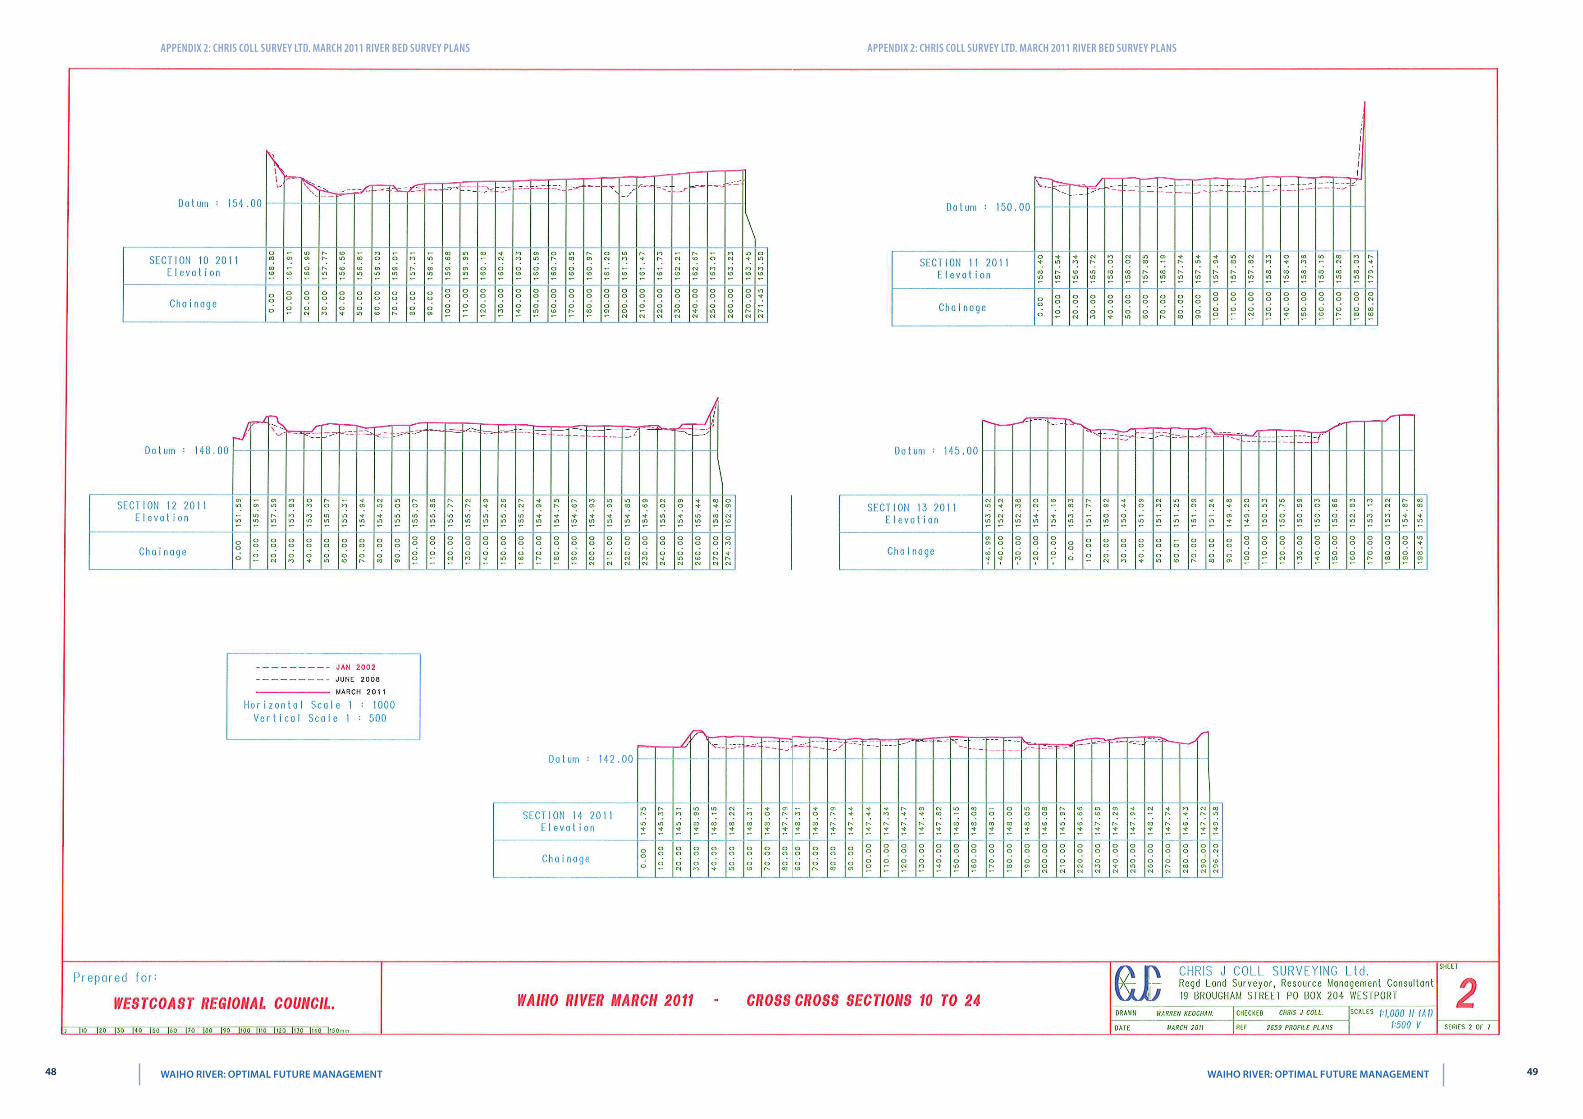
appendIx 2 ChrIs Coll survey ltd marCh 2011 rIver bed survey plans appendIx 2 ChrIs Coll survey ltd marCh 2011 rIver bed survey plans
48 49 Waiho RiveR optimal FutuRe management Waiho RiveR optimal FutuRe management
appendIx 2 ChrIs Coll survey ltd marCh 2011 rIver bed survey plans appendIx 2 ChrIs Coll survey ltd marCh 2011 rIver bed survey plans
50 51 Waiho RiveR optimal FutuRe management Waiho RiveR optimal FutuRe management
appendIx 2 ChrIs Coll survey ltd marCh 2011 rIver bed survey plans appendIx 2 ChrIs Coll survey ltd marCh 2011 rIver bed survey plans
52 53 Waiho RiveR optimal FutuRe management Waiho RiveR optimal FutuRe management
appendIx 2 ChrIs Coll survey ltd marCh 2011 rIver bed survey plans appendIx 2 ChrIs Coll survey ltd marCh 2011 rIver bed survey plans
54 55 Waiho RiveR optimal FutuRe management Waiho RiveR optimal FutuRe management
appendIx 2 ChrIs Coll survey ltd marCh 2011 rIver bed survey plans appendIx 2 ChrIs Coll survey ltd marCh 2011 rIver bed survey plans
56 57 Waiho RiveR optimal FutuRe management Waiho RiveR optimal FutuRe management
appendIx 2 ChrIs Coll survey ltd marCh 2011 rIver bed survey plans appendIx 2 ChrIs Coll survey ltd marCh 2011 rIver bed survey plans
58 59 Waiho RiveR optimal FutuRe management Waiho RiveR optimal FutuRe management
appendIx 2 ChrIs Coll survey ltd marCh 2011 rIver bed survey plans
appEndix 3
CHris Coll surVey ltd June 2011 WaiHo busH bloCk
60 61 Waiho RiveR optimal FutuRe management Waiho RiveR optimal FutuRe management
appendIx 3 ChrIs Coll survey ltd June 2011 waIho bush bloCk appendIx 3 ChrIs Coll survey ltd June 2011 waIho bush bloCk
62 63 Waiho RiveR optimal FutuRe management Waiho RiveR optimal FutuRe management
appendIx 3 ChrIs Coll survey ltd June 2011 waIho bush bloCk
appEndix 4
reFerenCes
1 Influence of Channel Width on Bed Load Transport Capacity MA Carson and GA Griffith ASCE Journal of Hydraulic Engineering Vol 113 No 12 Dec 1987 (pp 1489 -1509)
2 Dam Break Flood Hazard from the Callery River Westland New Zealand TR Davies and BK Scott Journal of Hydrology (NZ) 36 (1) 1-13 (1997)
3 Natural Hazards Assessment for the Township of Franz Josef and its Environs MJ McSaveney TRH Davies IGNS Client Report 44714B10 (July 1998)
4 Peer Review of the Institute of Geological and Nuclear Sciences Ltd Report No 44714B10 (July 1998) Natural Hazards Assessment for the Township of Franz Josef and its Environs RJ Hall RJ Hall Civil amp Environmental Consulting Ltd (August 1998)
5 Evaluation of Options for the Management of the Waiho River Aggradation Threats RJ Hall et al (2000)6 Anthropogenic Fanhead Aggradation Waiho River Westland New Zealand TR Davies MJ McSaveney
Proceedings 5th International Gravel-bed Rivers Symposium Christchurch and Franz Josef (2000)7 The Transit New Zealand Waiho Workshop HL Rouse TJ Day TRH Davies Proceedings 5th International
Gravel-bed Rivers Symposium Christchurch and Franz Josef (2000)8 Landslide-dambreak Floods at Franz Josef Glacier Township Westland New Zealand a Risk Assessment TR Davies
Journal of Hydrology (NZ) Vol 41 No 1 (2002) 9 Anthropogenic Aggradation of the Waiho River Westland New Zealand TR Davies MJ McSaveney PJ
Clarkeson Earth Surfaces Processes and Landforms 28 209-218 (2003)10 How High are Bed Moving Flows in New Zealand Rivers B Clausen D Plew Journal of Hydrology (NZ) Vol 43 No
1 (2004)11 Geomorphic Constraints on the Management of Bed-load Dominated Rivers TR Davies MJ McSaveney Journal
of Hydrology (NZ) 45 (2) 69-88 (2006) 12 Geology of the Aoraki Area 1 250000 Geological Map 15 SC Cox DJA Barrell compilers IGNS (2007)13 West Coast Regional Council Waiho River Flood Protection Scheme Design Flood Levels Good Earth Matters Ltd
(2008)14 Preparing For Climate Change A Guide for Local Government in New Zealand Ministry for the Environment (2008)15 Waiho River Bed Surveys June 2008 and March 2011 Chris Coll Surveying Ltd (2011)16 Topographical Survey of the Waiho Bush Block Chris Coll Surveying Ltd (2011)17 Mean Bed Level Survey Record Waiho River SH 6 Bridge February 1997 ndash May 2011 Opus International Consultants
Ltd 18 WCRC Asset Management Plans for the Franz Josef Special Rating Area the Lower Waiho Rating District (December
2010)19 Video of Callery Fly Over 2011 Opus International Consultants Ltd (2011)20 Oblique Stills Callery Fly Over 2011 Department of Conservation Franz Josef (2011)21 WCRC Staff Aerial Inspection ndash Callery 6 September 2011 W Moen WCRC (7 September 2011)22 Planning for a Safer Franz Josef ndash Waiau Community Westland District Considering Rupture of the Alpine Fault
RM Langridge amp JG Beban GNS Science Consultancy Report 2011217 (September 2011)23 Callery River Landslide Dam Rapid Assessment of Dam Failure Consequences for West Coast Regional Council R
Measures M Duncan NIWA (September 2011)24 NIWA Flood Annual Flood Record and Annual Means Site 89301 Whataroa River at SH 6 1985 ndash 2011 NIWA (2011)25 Report on West Coast Weather Event 27 amp 28 December 2010 West Coast Regional Council report (2011)
64 65 Waiho RiveR optimal FutuRe management Waiho RiveR optimal FutuRe management
appendIx 4 referenCes
appEndix 5
tables
Cros
s se
ctio
n
thal
weg
dis
tanc
e ( m
)
Mbl
Jan-
02 (
rl m
)
Mbl
Jun-
08 (
rl m
)
Mbl
Mar
-11
( rl
m )
Chan
ge M
bl Ja
n 02
- Ju
ne 0
8 ( r
l m
)
Chan
ge M
bl Ju
ne 0
8 - M
ar
2011
( r
l m
)
rate
Cha
nge
Mbl
Jan
02 -
June
08
( m
yr )
rate
Cha
nge
Mbl
June
08
- M
ar 2
011
( m
yr
)
rati
o M
bl C
hang
e pe
r yr
2008
- 20
11 to
200
2 - 2
011
Chan
ge in
Vol
ume
( m
3 ) 20
02 -
2008
Chan
ge in
Vol
ume
( m
3 ) 20
02 -
2011
10 0 15305 15855 16039 551 184 0816 0689 08
11 209 15484 15572 157785 088 207 0131 0775 59 103269 68536
12 417 15308 15328 154969 020 169 0030 0632 212 21893 81442
13 821 15053 15043 15139 -010 097 -0015 0363 00 4656 129254
14 1113 14594 14656 14754 062 098 0092 0369 40 18638 70075
15 1377 14354 14387 14463 033 076 0049 0284 58 36017 68155
16 1795 13934 13963 14017 029 055 0043 0205 48 79237 159891
17 2268 13428 13452 13515 024 063 0035 0237 68 115310 261502
18 2740 12947 12918 12971 -029 053 -0043 0197 -45 -3499 247856
19 3158 12449 12484 12522 034 038 0051 0143 28 -54 147467
20 3923 11626 11678 11703 051 026 0076 0097 13 156610 134985
21 4618 10901 10932 10949 031 017 0045 0065 14 224717 123676
22 5418 10101 10104 10100 003 -005 0004 -0017 -40 613958 -560100
23 6114 9343 9504 9397 161 -108 0239 -0403 00 635880 -761619
2006631 171120
TABle 1 Waiho River at Franz Josef Mean Bed Level and Volumetric Changes Summary January 2002 ndash June 2008 and June 2008 ndash March 2011 River Bed Surveys
66 67 Waiho RiveR optimal FutuRe management Waiho RiveR optimal FutuRe management
appendIx 5 tables
recurrence interval t
(yrs)
Qpk(eV 1)
(cumec)
Qpk + 10(cumec)
Qpk + 15(cumec)
23 1230 1350 1400
5 1550 1700 1800
10 1640 1800 1900
20 1730 1900 2000
50 1820 2000 2100
100 1910 2100 2200
note Waiho River estimates derived from an EV 1 analysis of Whataroa River at SH 6 which were scaled by the area factor [A waiho A whataroa]⁰⁸
TABle 2 Flood Frequency Estimates for the Waiho River based on the Whataroa River at SH 6
appEndix 6
Figures
68 69 Waiho RiveR optimal FutuRe management Waiho RiveR optimal FutuRe management
appendIx 5 tables
appEndix 7
glossary oF terMs
active gully erosion Erosion that is presently occurring on the sides and floor of a gully during rainstorms which results in an expansion of the gully (viz depth width) and delivers sediment downstream into the main river system of which it is an integral part
aggradation The process whereby sands and gravels accumulate in a riverbed causing the bed level to riseaggrading Phase A term used to describe a period when aggradation is occurring in a river or on an active
alluvial fanalluvial Fan The fan shaped surface built up by a river over extended time where it exits in a confined reach
typically where a river emerges from a hill catchmentannual exceedence Probability The probability that an event (rainstorm flood) of a specific size will occur on
average in any one year (the mathematical reciprocal of the return period or recurrence interval for that event)
annual series Maxima A table comprising the highest flow recorded at a hydrometric site for each year of record and is used for determining the flood frequency characteristics of that site
antecedent rainfall That rainfall that occurs prior to the onset of a rainstorm and which pre-soaks the soil assisting in the development of runoff from the storm when it occurs
anthropogenic Something which has occurred or will occur as a result of human activity or influenceappurtenant structures A structure that is integrally required for the satisfactory performance of another
structure eg rock riprap stub groynes to provide protection to the riverside toe and batter of a stopbankaverage Water depth The water depth averaged over a cross section for a particular flowavulsion The sudden change in direction of a river that occurs as a result of a break out usually occurring during
a flood so that the river abandons its original course in favour of the new alignmentbedload dominated river A river in whose form has been sculptured by the erosion storage and transport of
gravel as bedloadbenchmark level The level referenced to a particular survey datum that is set on a permanent reference point
(bench mark) for survey purposesboils The localised appearance of water and fine soil particles such as sands and silts that occur where
concentrated seepage flows emerge at groundlinebraided river The description for a wide generally steep gravel bed river that has a multitude of interlacing
channelsCalibration run The running of an hydraulic model using selected known flows and water profiles in order to
determine what surface roughnessrsquos are required to obtain realistic model performanceCatchment Processes The physical processes operating within a catchment which influence the rate of runoff
and hence river flow during rainstormsChannel gradient The average slope of a channel reach measured along the flow path of the riverCross Fall The gradient that occurs on the bed of a river that runs at right angles to the primary down valley
gradient of the riverbedCrest settlement The lowering of the crest level of a stopbank caused by either settlement in the stopbank
foundation where weak materials are present or as a result of internal erosion of the stopbank or where liquefaction has occurred or through slumping caused by erosion of the stopbank or lateral spreading of the stopbank foundation as a result of earthquake action
Current Morphological status The present state that a river is in given that the rivers form tends to change over time in response to climatic and geological influences which can affect sediment supply catchment runoff and hence river flows channel gradient and sea level
dam break surges The waves of water and debris that move rapidly downstream from a debris dam when it fails
debris dams Obstructions that occur in confined river reaches from time to time and typically comprise rock regolith vegetation etc which obstruct the flow of water and cause it to dam
debris Flow A fluvial phenomena that can occur in steep channels usually as a result of intense rainfall on an already wet catchment the debris flow manifests as a slug or series of slugs of water and sediment travelling
DoCheRtY CReeK
1km 1mi
FRanZ JoSeF toWnShip
Canvans Knob
Franz Josef Stopbanks
Canavans Knob Stopbank
Rubbish Dump Stopbank
milton amp others Stopbank
State highway
State highway
Bridge
Sewerage ponds
nZta
WCRC
hokitika airport authority
Department of Conservation
Westland District Council
tartare gorge
Waiho loop
Rata Knoll
WAIHO RIVER
CalleRY RiveR
70 71 Waiho RiveR optimal FutuRe management Waiho RiveR optimal FutuRe management
appendIx 7 glossary of terms appendIx 7 glossary of terms
rapidly downstream as a dense slurry which may have incorporated within it woody debris such as tree trunks and branches
debris Flow activity The occurrence of debris flowsdebris traps Places within a catchments river system where sediment tends to accumulatedegradation The opposite process to aggradation whereby sands and gravels are eroded out of the riverbed
and the riverbed fallsdeflation of the bed The steady reduction in elevation of an eroding surface (river bed) over time under the
influence of surface erosion processesdesign Flood levels The maximum water level relative to a prescribed design datum set at a particular location
on a river required to contain the design flood carrying capacity of the river control systemdetritus The products of erosion that is delivered into a river system form the slopes where it has been generated
by weathering and erosion processesdistal end of an alluvial Fan The furthest end of an alluvial fan from the fan head and typically the lowest
elevation on the fan surface provided the fan has not been truncated by erosion by the river or by wave action on a lake or the sea
episodic Events that occur irregularly in timeFalling limb of a Hydrograph That part of the flood hydrograph after the peak where the flood recession
occursFlood Carrying Capacity An estimate of the peak flow in m3 per second that a river control system (can contain
without exceeding its freeboard where a river has stopbanks it is the flow contained within the stopbanks whilst maintaining the design freeboard
Flood Frequency estimates A statistical process for estimating the recurrence interval of various flood discharges for a particular hydrometric site using the annual maxima series for that site
Flood Peak The maximum flow reached by a river in flood measured in m3 per secondFlood Plain The surface over which a river can spread in times of flood once it overtops its natural banks Flood Volume The total volume of water delivered by a river in flood over the duration of the flood and measured
in m3 Fluvial Characteristics The characteristics of a river which describe the storage transport and reworking of river
sediments by the rivers flowsgeomorphic Constraints Physical factors such a rate of uplift hardness of basement rock present sea level
which limit for example the generation of sediment supply and gradient of a river and hence influence the form of a river
glacial internal drainage systems Subsurface watercourses located in and beneath a glacier that convey water from the surface and sides of a glacier into through and beneath a glacier and discharge to the valley floor at the glacier terminal face
glacier retreat The process whereby the terminal face of the glacier is located progressively up the valley as the glacier ice volume is reduced by ablation
Headcut The formation of an erosion cusp in a channel that results in a localised step in a channel bedHeadward erosion The erosion that generates and maintains the headward movement of the erosion cusp
(headcut)Hydraulic Characteristics The flow characteristics of a river system such as flow depth water velocity channel
surface roughness and channel slope (gradient)Hydraulic gradient The slope on a flowing water surfaceHydrometric site A water level measuring site which continuously measures and records water depth at the site
at specific time intervals used for establishing flow records over the full range from low to high flow landslide dam A dam that forms in a confined reach of a river as a result of landslide occurring and partially
blocking the valley through which the river is flowinglateral bank erosion The processes whereby a river erodes its banks generally used with reference to the
erosion of stopbanks when a river moves side ways in a flood eroding the stopbank in the process on the riverside of the stopbank
liquefaction The sudden loss of strength of an unconsolidated or poorly consolidated saturated fine sand soil induced by violent earthquake shaking
lithologies A geological term used for describing rock typeslive bed Conditions The condition that may occur in a riverbed in flood when the deposits which form the
riverbed and banks begin to mobilise and become entrained in the flow and move downstreamMass Movement The downslope movement of regolith and other erosion products in bulk eg slab avalanches
landslides debris flows
Mean bed level The average level of a riverbed across a particular cross section at a particular time estimated from a surveyed cross section at a particular time
Micro scale Modeling The development and running of a small scale physical replica of a particular physical feature such as an active alluvial fan in a laboratory situation
Morphologically active alluvial Fan An alluvial fan that is either aggrading or degrading under its present sediment and water supply and under the influence of local morphological constraints
natural Hazards Any atmospheric or earth or water related occurrence (in the Waiho River context including earthquake erosion landslip Subsidence sedimentation wind drought or flooding) the actions of which adversely affects or may affect human life property or other aspects of the environment
overtopping The term used to describe the situation where floodwaters in a river in flood begin to spill over the rivers banks or stopbanks whichever is relevant to the particular situation being considered
Permeability A term used to describe and quantify that property of a soil that permits water to flow through the pores of the soil under a hydraulic gradient
Pheratic surface The curvilinear water surface within the soils of a stopbank or dam through which water is seeping marking the boundary between saturated and un-saturated soils
Predictive tool A procedure such as a hydraulic model that is developed in order to try and determine how a particular physical situation might develop over time under specified inputs (eg water bedload supply)
Prograding The episodic growth of an alluvial fan surface which causes the distal end of the fan to extend downstream away from the fan head
recession That period during a flood when the river has passed its peak and water levels and hence flow rates are dropping
recurrence interval A statistical term used to describe the relative size of an event (synonymous with the term average return period) eg a particular rainfall depth or flood flow A 1 in 100 year flood has a recurrence interval of 100 years on average It does not mean that an hundred year flood will not occur again for 100 years if an event of that size has just been experienced
regolith The accumulation of soil material on a hill slope as a result of the weathering of the hill slope over time Typically regolith includes clay and sand size particles rock fragments and soil
regolith avalanches The localised movement of regolith rapidly off a hill slope onto the valley floor or riverbed in the form of an avalanche
residence time The time that elapses for example between bed load sediments accumulating at a particular location and subsequently being eroded out
revegetation The decolonization with new vegetation on areas such as slopes denuded of vegetation by landslides
river bed roughness A hydraulic term which reflects the relative roughness of the surface of a riverbed or its berms that is used in hydraulic computations
river Cross sections A survey of ground levels extending across a river from its true left bank to its true right bank aligned more or less at right angles to the rivers flow in times of flood
river reach A description for a particular stretch of a riverriver training and Protection Works Structures erected by humans in an attempt to mitigate against riverbank
erosion and channel migration during floodsrelaxation Removing the boundary constrains on a stopbanked river to allow the river to reassert its natural
form on the floodplain unimpeded by man made flood containment structuresrock rip rap A term used to describe the coarse hard rock that is placed against a surface that may be eroded
by river flows in order to mitigate against such erosion sediment sources Those parts of a river catchment that supply sediment to the river as sediment supplysediment supply The sediment that passes through a river system typically of an episodic nature ie the rate of
supply varying over time typically in response to climatic conditions and river flowseismic induced Mass Movement Landslide activity caused by seismic activityshallow slab avalanches Landslides that typically occur on steep valley sides where the basement rock is close
to the surface (eg within 1 to 2 metres of the surface)sinusoidal braided Flow PatternsTheldquoSrdquoshapedchannelinducedflowpatternsobservedinbraidedriversspecial rating district A Rating District established for the construction and ongoing repair and maintenance
of a river control scheme the rating district is administered by the West Coast Regional Councilsplinter Faults Fault lines that extend out at an angle from a main fault linespur groynes Short groynes that are constructed at the toe of a natural river bank or stopbank that project out
into the riverbed designed to ease high flow velocities of the natural bank or stopbank toe in order to lessen the risk of lateral erosion by the river in flood
72 73 Waiho RiveR optimal FutuRe management Waiho RiveR optimal FutuRe management
appendIx 7 glossary of terms
stopbank A structure erected on a rivers floodplain typically sub-parallel to the rivers flow in times of flood to contain flood flows up to the design standard of the flood protection scheme to prevent them from spilling onto the floodplain
sub-alpine vegetation Typically shrubby bushes grasses and stunted trees that grow above the bush line but below the sparsely vegetated alpine area of a mountain range
sub ndash Parallel More or less parallelsuper-elevation effect The local elevation of water levels around the outside of a bend in a river caused by
centrifugal forces generated by the water moving around the river bendswale The remnant of a river channel on a riversrsquo floodplain that has been etched by river flows in the past and
has subsequently been abandoned by the normal flow of the river but can activate when rivers overtop their natural banks and flow onto the flood plain they may also convey surface runoff from local rainstorms from time to time
temporal supply Mechanism A process that generates sediment supply to the river system and is time dependent
thalweg The centreline path the active riverbed takes as it flows down plainthreshold Flood event A flood event of sufficient size that it overtops a rivers confining banks natural or man
made transfer reach That part of a mountain catchment located in the foothill area upstream of the head (or apex)
of an alluvial fan generally a gorge or narrow confined reach with little opportunity for coarse sediment storage coarse sediments tend to flush through these reaches during floods rather than accumulate as they might on the fan surface proper
two dimensional Hydraulic Model A computer model that incorporates a digital terrain model to provide the basis for determining water depths and velocities over that surface for a particular design flood flow
Wasting out The eroding out of deposits over time
74 Waiho RiveR optimal FutuRe management
388 Main South Road PO Box 66 Greymouth
phone +64 3 768 0466
email infowcrcgovtnz
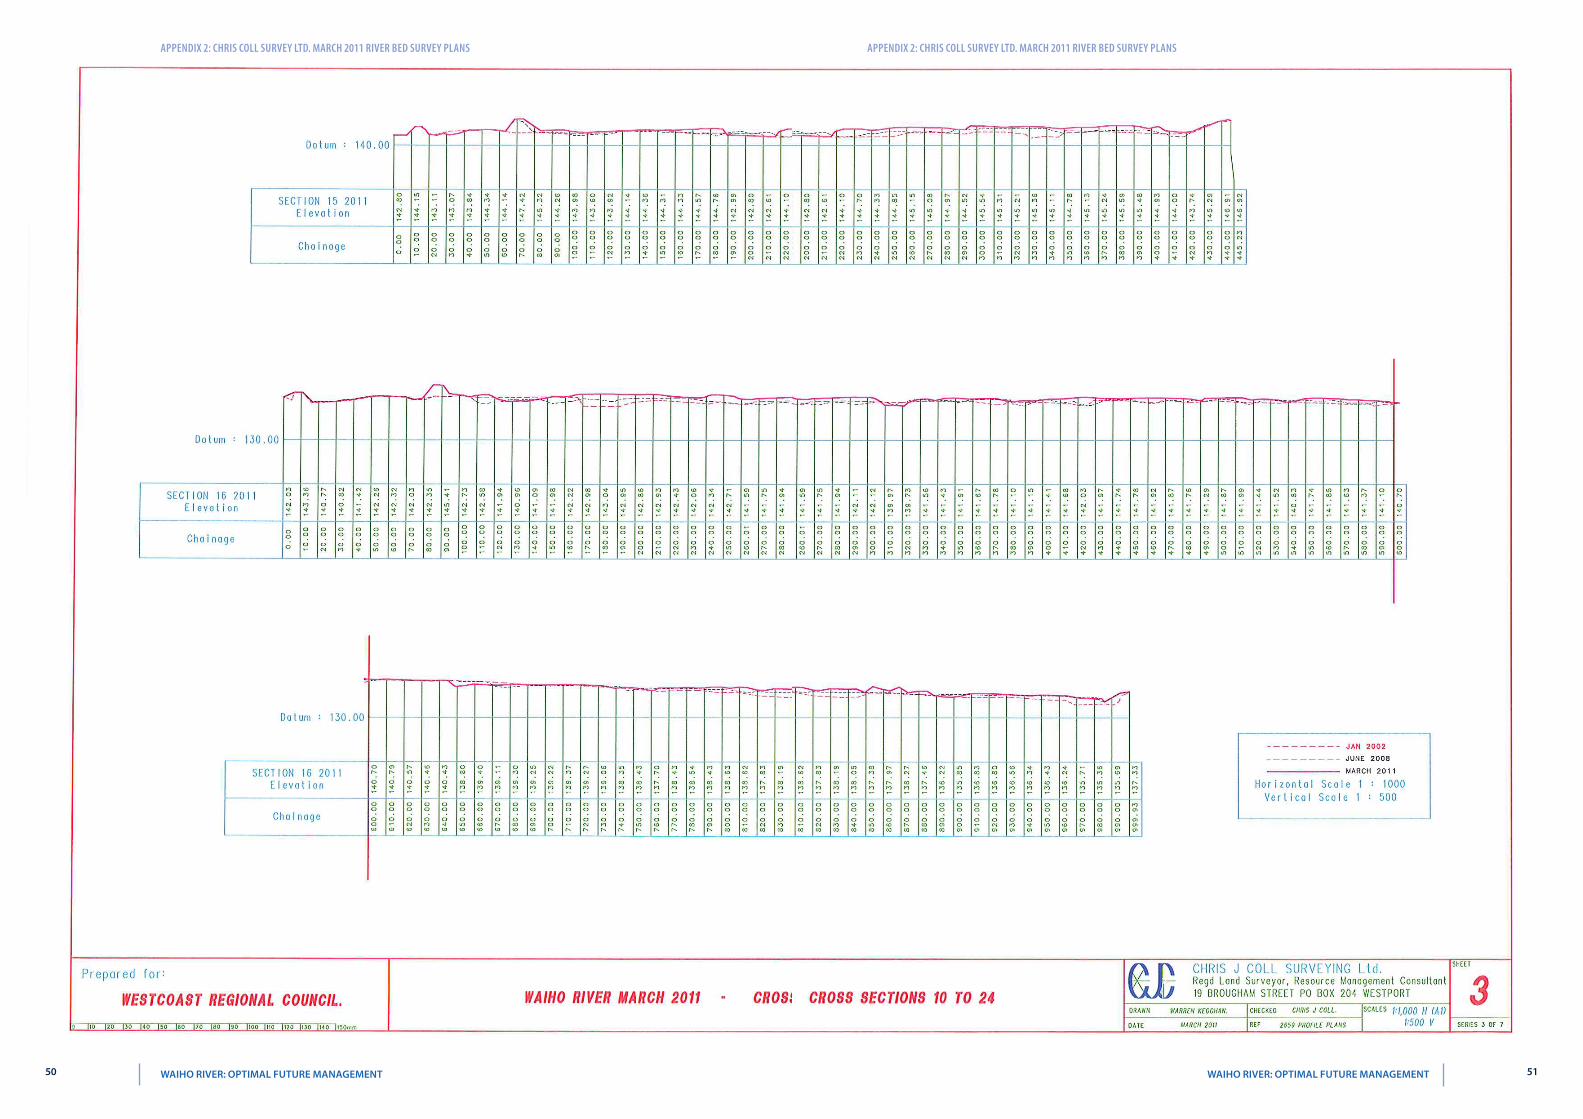
appendIx 2 ChrIs Coll survey ltd marCh 2011 rIver bed survey plans appendIx 2 ChrIs Coll survey ltd marCh 2011 rIver bed survey plans
50 51 Waiho RiveR optimal FutuRe management Waiho RiveR optimal FutuRe management
appendIx 2 ChrIs Coll survey ltd marCh 2011 rIver bed survey plans appendIx 2 ChrIs Coll survey ltd marCh 2011 rIver bed survey plans
52 53 Waiho RiveR optimal FutuRe management Waiho RiveR optimal FutuRe management
appendIx 2 ChrIs Coll survey ltd marCh 2011 rIver bed survey plans appendIx 2 ChrIs Coll survey ltd marCh 2011 rIver bed survey plans
54 55 Waiho RiveR optimal FutuRe management Waiho RiveR optimal FutuRe management
appendIx 2 ChrIs Coll survey ltd marCh 2011 rIver bed survey plans appendIx 2 ChrIs Coll survey ltd marCh 2011 rIver bed survey plans
56 57 Waiho RiveR optimal FutuRe management Waiho RiveR optimal FutuRe management
appendIx 2 ChrIs Coll survey ltd marCh 2011 rIver bed survey plans appendIx 2 ChrIs Coll survey ltd marCh 2011 rIver bed survey plans
58 59 Waiho RiveR optimal FutuRe management Waiho RiveR optimal FutuRe management
appendIx 2 ChrIs Coll survey ltd marCh 2011 rIver bed survey plans
appEndix 3
CHris Coll surVey ltd June 2011 WaiHo busH bloCk
60 61 Waiho RiveR optimal FutuRe management Waiho RiveR optimal FutuRe management
appendIx 3 ChrIs Coll survey ltd June 2011 waIho bush bloCk appendIx 3 ChrIs Coll survey ltd June 2011 waIho bush bloCk
62 63 Waiho RiveR optimal FutuRe management Waiho RiveR optimal FutuRe management
appendIx 3 ChrIs Coll survey ltd June 2011 waIho bush bloCk
appEndix 4
reFerenCes
1 Influence of Channel Width on Bed Load Transport Capacity MA Carson and GA Griffith ASCE Journal of Hydraulic Engineering Vol 113 No 12 Dec 1987 (pp 1489 -1509)
2 Dam Break Flood Hazard from the Callery River Westland New Zealand TR Davies and BK Scott Journal of Hydrology (NZ) 36 (1) 1-13 (1997)
3 Natural Hazards Assessment for the Township of Franz Josef and its Environs MJ McSaveney TRH Davies IGNS Client Report 44714B10 (July 1998)
4 Peer Review of the Institute of Geological and Nuclear Sciences Ltd Report No 44714B10 (July 1998) Natural Hazards Assessment for the Township of Franz Josef and its Environs RJ Hall RJ Hall Civil amp Environmental Consulting Ltd (August 1998)
5 Evaluation of Options for the Management of the Waiho River Aggradation Threats RJ Hall et al (2000)6 Anthropogenic Fanhead Aggradation Waiho River Westland New Zealand TR Davies MJ McSaveney
Proceedings 5th International Gravel-bed Rivers Symposium Christchurch and Franz Josef (2000)7 The Transit New Zealand Waiho Workshop HL Rouse TJ Day TRH Davies Proceedings 5th International
Gravel-bed Rivers Symposium Christchurch and Franz Josef (2000)8 Landslide-dambreak Floods at Franz Josef Glacier Township Westland New Zealand a Risk Assessment TR Davies
Journal of Hydrology (NZ) Vol 41 No 1 (2002) 9 Anthropogenic Aggradation of the Waiho River Westland New Zealand TR Davies MJ McSaveney PJ
Clarkeson Earth Surfaces Processes and Landforms 28 209-218 (2003)10 How High are Bed Moving Flows in New Zealand Rivers B Clausen D Plew Journal of Hydrology (NZ) Vol 43 No
1 (2004)11 Geomorphic Constraints on the Management of Bed-load Dominated Rivers TR Davies MJ McSaveney Journal
of Hydrology (NZ) 45 (2) 69-88 (2006) 12 Geology of the Aoraki Area 1 250000 Geological Map 15 SC Cox DJA Barrell compilers IGNS (2007)13 West Coast Regional Council Waiho River Flood Protection Scheme Design Flood Levels Good Earth Matters Ltd
(2008)14 Preparing For Climate Change A Guide for Local Government in New Zealand Ministry for the Environment (2008)15 Waiho River Bed Surveys June 2008 and March 2011 Chris Coll Surveying Ltd (2011)16 Topographical Survey of the Waiho Bush Block Chris Coll Surveying Ltd (2011)17 Mean Bed Level Survey Record Waiho River SH 6 Bridge February 1997 ndash May 2011 Opus International Consultants
Ltd 18 WCRC Asset Management Plans for the Franz Josef Special Rating Area the Lower Waiho Rating District (December
2010)19 Video of Callery Fly Over 2011 Opus International Consultants Ltd (2011)20 Oblique Stills Callery Fly Over 2011 Department of Conservation Franz Josef (2011)21 WCRC Staff Aerial Inspection ndash Callery 6 September 2011 W Moen WCRC (7 September 2011)22 Planning for a Safer Franz Josef ndash Waiau Community Westland District Considering Rupture of the Alpine Fault
RM Langridge amp JG Beban GNS Science Consultancy Report 2011217 (September 2011)23 Callery River Landslide Dam Rapid Assessment of Dam Failure Consequences for West Coast Regional Council R
Measures M Duncan NIWA (September 2011)24 NIWA Flood Annual Flood Record and Annual Means Site 89301 Whataroa River at SH 6 1985 ndash 2011 NIWA (2011)25 Report on West Coast Weather Event 27 amp 28 December 2010 West Coast Regional Council report (2011)
64 65 Waiho RiveR optimal FutuRe management Waiho RiveR optimal FutuRe management
appendIx 4 referenCes
appEndix 5
tables
Cros
s se
ctio
n
thal
weg
dis
tanc
e ( m
)
Mbl
Jan-
02 (
rl m
)
Mbl
Jun-
08 (
rl m
)
Mbl
Mar
-11
( rl
m )
Chan
ge M
bl Ja
n 02
- Ju
ne 0
8 ( r
l m
)
Chan
ge M
bl Ju
ne 0
8 - M
ar
2011
( r
l m
)
rate
Cha
nge
Mbl
Jan
02 -
June
08
( m
yr )
rate
Cha
nge
Mbl
June
08
- M
ar 2
011
( m
yr
)
rati
o M
bl C
hang
e pe
r yr
2008
- 20
11 to
200
2 - 2
011
Chan
ge in
Vol
ume
( m
3 ) 20
02 -
2008
Chan
ge in
Vol
ume
( m
3 ) 20
02 -
2011
10 0 15305 15855 16039 551 184 0816 0689 08
11 209 15484 15572 157785 088 207 0131 0775 59 103269 68536
12 417 15308 15328 154969 020 169 0030 0632 212 21893 81442
13 821 15053 15043 15139 -010 097 -0015 0363 00 4656 129254
14 1113 14594 14656 14754 062 098 0092 0369 40 18638 70075
15 1377 14354 14387 14463 033 076 0049 0284 58 36017 68155
16 1795 13934 13963 14017 029 055 0043 0205 48 79237 159891
17 2268 13428 13452 13515 024 063 0035 0237 68 115310 261502
18 2740 12947 12918 12971 -029 053 -0043 0197 -45 -3499 247856
19 3158 12449 12484 12522 034 038 0051 0143 28 -54 147467
20 3923 11626 11678 11703 051 026 0076 0097 13 156610 134985
21 4618 10901 10932 10949 031 017 0045 0065 14 224717 123676
22 5418 10101 10104 10100 003 -005 0004 -0017 -40 613958 -560100
23 6114 9343 9504 9397 161 -108 0239 -0403 00 635880 -761619
2006631 171120
TABle 1 Waiho River at Franz Josef Mean Bed Level and Volumetric Changes Summary January 2002 ndash June 2008 and June 2008 ndash March 2011 River Bed Surveys
66 67 Waiho RiveR optimal FutuRe management Waiho RiveR optimal FutuRe management
appendIx 5 tables
recurrence interval t
(yrs)
Qpk(eV 1)
(cumec)
Qpk + 10(cumec)
Qpk + 15(cumec)
23 1230 1350 1400
5 1550 1700 1800
10 1640 1800 1900
20 1730 1900 2000
50 1820 2000 2100
100 1910 2100 2200
note Waiho River estimates derived from an EV 1 analysis of Whataroa River at SH 6 which were scaled by the area factor [A waiho A whataroa]⁰⁸
TABle 2 Flood Frequency Estimates for the Waiho River based on the Whataroa River at SH 6
appEndix 6
Figures
68 69 Waiho RiveR optimal FutuRe management Waiho RiveR optimal FutuRe management
appendIx 5 tables
appEndix 7
glossary oF terMs
active gully erosion Erosion that is presently occurring on the sides and floor of a gully during rainstorms which results in an expansion of the gully (viz depth width) and delivers sediment downstream into the main river system of which it is an integral part
aggradation The process whereby sands and gravels accumulate in a riverbed causing the bed level to riseaggrading Phase A term used to describe a period when aggradation is occurring in a river or on an active
alluvial fanalluvial Fan The fan shaped surface built up by a river over extended time where it exits in a confined reach
typically where a river emerges from a hill catchmentannual exceedence Probability The probability that an event (rainstorm flood) of a specific size will occur on
average in any one year (the mathematical reciprocal of the return period or recurrence interval for that event)
annual series Maxima A table comprising the highest flow recorded at a hydrometric site for each year of record and is used for determining the flood frequency characteristics of that site
antecedent rainfall That rainfall that occurs prior to the onset of a rainstorm and which pre-soaks the soil assisting in the development of runoff from the storm when it occurs
anthropogenic Something which has occurred or will occur as a result of human activity or influenceappurtenant structures A structure that is integrally required for the satisfactory performance of another
structure eg rock riprap stub groynes to provide protection to the riverside toe and batter of a stopbankaverage Water depth The water depth averaged over a cross section for a particular flowavulsion The sudden change in direction of a river that occurs as a result of a break out usually occurring during
a flood so that the river abandons its original course in favour of the new alignmentbedload dominated river A river in whose form has been sculptured by the erosion storage and transport of
gravel as bedloadbenchmark level The level referenced to a particular survey datum that is set on a permanent reference point
(bench mark) for survey purposesboils The localised appearance of water and fine soil particles such as sands and silts that occur where
concentrated seepage flows emerge at groundlinebraided river The description for a wide generally steep gravel bed river that has a multitude of interlacing
channelsCalibration run The running of an hydraulic model using selected known flows and water profiles in order to
determine what surface roughnessrsquos are required to obtain realistic model performanceCatchment Processes The physical processes operating within a catchment which influence the rate of runoff
and hence river flow during rainstormsChannel gradient The average slope of a channel reach measured along the flow path of the riverCross Fall The gradient that occurs on the bed of a river that runs at right angles to the primary down valley
gradient of the riverbedCrest settlement The lowering of the crest level of a stopbank caused by either settlement in the stopbank
foundation where weak materials are present or as a result of internal erosion of the stopbank or where liquefaction has occurred or through slumping caused by erosion of the stopbank or lateral spreading of the stopbank foundation as a result of earthquake action
Current Morphological status The present state that a river is in given that the rivers form tends to change over time in response to climatic and geological influences which can affect sediment supply catchment runoff and hence river flows channel gradient and sea level
dam break surges The waves of water and debris that move rapidly downstream from a debris dam when it fails
debris dams Obstructions that occur in confined river reaches from time to time and typically comprise rock regolith vegetation etc which obstruct the flow of water and cause it to dam
debris Flow A fluvial phenomena that can occur in steep channels usually as a result of intense rainfall on an already wet catchment the debris flow manifests as a slug or series of slugs of water and sediment travelling
DoCheRtY CReeK
1km 1mi
FRanZ JoSeF toWnShip
Canvans Knob
Franz Josef Stopbanks
Canavans Knob Stopbank
Rubbish Dump Stopbank
milton amp others Stopbank
State highway
State highway
Bridge
Sewerage ponds
nZta
WCRC
hokitika airport authority
Department of Conservation
Westland District Council
tartare gorge
Waiho loop
Rata Knoll
WAIHO RIVER
CalleRY RiveR
70 71 Waiho RiveR optimal FutuRe management Waiho RiveR optimal FutuRe management
appendIx 7 glossary of terms appendIx 7 glossary of terms
rapidly downstream as a dense slurry which may have incorporated within it woody debris such as tree trunks and branches
debris Flow activity The occurrence of debris flowsdebris traps Places within a catchments river system where sediment tends to accumulatedegradation The opposite process to aggradation whereby sands and gravels are eroded out of the riverbed
and the riverbed fallsdeflation of the bed The steady reduction in elevation of an eroding surface (river bed) over time under the
influence of surface erosion processesdesign Flood levels The maximum water level relative to a prescribed design datum set at a particular location
on a river required to contain the design flood carrying capacity of the river control systemdetritus The products of erosion that is delivered into a river system form the slopes where it has been generated
by weathering and erosion processesdistal end of an alluvial Fan The furthest end of an alluvial fan from the fan head and typically the lowest
elevation on the fan surface provided the fan has not been truncated by erosion by the river or by wave action on a lake or the sea
episodic Events that occur irregularly in timeFalling limb of a Hydrograph That part of the flood hydrograph after the peak where the flood recession
occursFlood Carrying Capacity An estimate of the peak flow in m3 per second that a river control system (can contain
without exceeding its freeboard where a river has stopbanks it is the flow contained within the stopbanks whilst maintaining the design freeboard
Flood Frequency estimates A statistical process for estimating the recurrence interval of various flood discharges for a particular hydrometric site using the annual maxima series for that site
Flood Peak The maximum flow reached by a river in flood measured in m3 per secondFlood Plain The surface over which a river can spread in times of flood once it overtops its natural banks Flood Volume The total volume of water delivered by a river in flood over the duration of the flood and measured
in m3 Fluvial Characteristics The characteristics of a river which describe the storage transport and reworking of river
sediments by the rivers flowsgeomorphic Constraints Physical factors such a rate of uplift hardness of basement rock present sea level
which limit for example the generation of sediment supply and gradient of a river and hence influence the form of a river
glacial internal drainage systems Subsurface watercourses located in and beneath a glacier that convey water from the surface and sides of a glacier into through and beneath a glacier and discharge to the valley floor at the glacier terminal face
glacier retreat The process whereby the terminal face of the glacier is located progressively up the valley as the glacier ice volume is reduced by ablation
Headcut The formation of an erosion cusp in a channel that results in a localised step in a channel bedHeadward erosion The erosion that generates and maintains the headward movement of the erosion cusp
(headcut)Hydraulic Characteristics The flow characteristics of a river system such as flow depth water velocity channel
surface roughness and channel slope (gradient)Hydraulic gradient The slope on a flowing water surfaceHydrometric site A water level measuring site which continuously measures and records water depth at the site
at specific time intervals used for establishing flow records over the full range from low to high flow landslide dam A dam that forms in a confined reach of a river as a result of landslide occurring and partially
blocking the valley through which the river is flowinglateral bank erosion The processes whereby a river erodes its banks generally used with reference to the
erosion of stopbanks when a river moves side ways in a flood eroding the stopbank in the process on the riverside of the stopbank
liquefaction The sudden loss of strength of an unconsolidated or poorly consolidated saturated fine sand soil induced by violent earthquake shaking
lithologies A geological term used for describing rock typeslive bed Conditions The condition that may occur in a riverbed in flood when the deposits which form the
riverbed and banks begin to mobilise and become entrained in the flow and move downstreamMass Movement The downslope movement of regolith and other erosion products in bulk eg slab avalanches
landslides debris flows
Mean bed level The average level of a riverbed across a particular cross section at a particular time estimated from a surveyed cross section at a particular time
Micro scale Modeling The development and running of a small scale physical replica of a particular physical feature such as an active alluvial fan in a laboratory situation
Morphologically active alluvial Fan An alluvial fan that is either aggrading or degrading under its present sediment and water supply and under the influence of local morphological constraints
natural Hazards Any atmospheric or earth or water related occurrence (in the Waiho River context including earthquake erosion landslip Subsidence sedimentation wind drought or flooding) the actions of which adversely affects or may affect human life property or other aspects of the environment
overtopping The term used to describe the situation where floodwaters in a river in flood begin to spill over the rivers banks or stopbanks whichever is relevant to the particular situation being considered
Permeability A term used to describe and quantify that property of a soil that permits water to flow through the pores of the soil under a hydraulic gradient
Pheratic surface The curvilinear water surface within the soils of a stopbank or dam through which water is seeping marking the boundary between saturated and un-saturated soils
Predictive tool A procedure such as a hydraulic model that is developed in order to try and determine how a particular physical situation might develop over time under specified inputs (eg water bedload supply)
Prograding The episodic growth of an alluvial fan surface which causes the distal end of the fan to extend downstream away from the fan head
recession That period during a flood when the river has passed its peak and water levels and hence flow rates are dropping
recurrence interval A statistical term used to describe the relative size of an event (synonymous with the term average return period) eg a particular rainfall depth or flood flow A 1 in 100 year flood has a recurrence interval of 100 years on average It does not mean that an hundred year flood will not occur again for 100 years if an event of that size has just been experienced
regolith The accumulation of soil material on a hill slope as a result of the weathering of the hill slope over time Typically regolith includes clay and sand size particles rock fragments and soil
regolith avalanches The localised movement of regolith rapidly off a hill slope onto the valley floor or riverbed in the form of an avalanche
residence time The time that elapses for example between bed load sediments accumulating at a particular location and subsequently being eroded out
revegetation The decolonization with new vegetation on areas such as slopes denuded of vegetation by landslides
river bed roughness A hydraulic term which reflects the relative roughness of the surface of a riverbed or its berms that is used in hydraulic computations
river Cross sections A survey of ground levels extending across a river from its true left bank to its true right bank aligned more or less at right angles to the rivers flow in times of flood
river reach A description for a particular stretch of a riverriver training and Protection Works Structures erected by humans in an attempt to mitigate against riverbank
erosion and channel migration during floodsrelaxation Removing the boundary constrains on a stopbanked river to allow the river to reassert its natural
form on the floodplain unimpeded by man made flood containment structuresrock rip rap A term used to describe the coarse hard rock that is placed against a surface that may be eroded
by river flows in order to mitigate against such erosion sediment sources Those parts of a river catchment that supply sediment to the river as sediment supplysediment supply The sediment that passes through a river system typically of an episodic nature ie the rate of
supply varying over time typically in response to climatic conditions and river flowseismic induced Mass Movement Landslide activity caused by seismic activityshallow slab avalanches Landslides that typically occur on steep valley sides where the basement rock is close
to the surface (eg within 1 to 2 metres of the surface)sinusoidal braided Flow PatternsTheldquoSrdquoshapedchannelinducedflowpatternsobservedinbraidedriversspecial rating district A Rating District established for the construction and ongoing repair and maintenance
of a river control scheme the rating district is administered by the West Coast Regional Councilsplinter Faults Fault lines that extend out at an angle from a main fault linespur groynes Short groynes that are constructed at the toe of a natural river bank or stopbank that project out
into the riverbed designed to ease high flow velocities of the natural bank or stopbank toe in order to lessen the risk of lateral erosion by the river in flood
72 73 Waiho RiveR optimal FutuRe management Waiho RiveR optimal FutuRe management
appendIx 7 glossary of terms
stopbank A structure erected on a rivers floodplain typically sub-parallel to the rivers flow in times of flood to contain flood flows up to the design standard of the flood protection scheme to prevent them from spilling onto the floodplain
sub-alpine vegetation Typically shrubby bushes grasses and stunted trees that grow above the bush line but below the sparsely vegetated alpine area of a mountain range
sub ndash Parallel More or less parallelsuper-elevation effect The local elevation of water levels around the outside of a bend in a river caused by
centrifugal forces generated by the water moving around the river bendswale The remnant of a river channel on a riversrsquo floodplain that has been etched by river flows in the past and
has subsequently been abandoned by the normal flow of the river but can activate when rivers overtop their natural banks and flow onto the flood plain they may also convey surface runoff from local rainstorms from time to time
temporal supply Mechanism A process that generates sediment supply to the river system and is time dependent
thalweg The centreline path the active riverbed takes as it flows down plainthreshold Flood event A flood event of sufficient size that it overtops a rivers confining banks natural or man
made transfer reach That part of a mountain catchment located in the foothill area upstream of the head (or apex)
of an alluvial fan generally a gorge or narrow confined reach with little opportunity for coarse sediment storage coarse sediments tend to flush through these reaches during floods rather than accumulate as they might on the fan surface proper
two dimensional Hydraulic Model A computer model that incorporates a digital terrain model to provide the basis for determining water depths and velocities over that surface for a particular design flood flow
Wasting out The eroding out of deposits over time
74 Waiho RiveR optimal FutuRe management
388 Main South Road PO Box 66 Greymouth
phone +64 3 768 0466
email infowcrcgovtnz
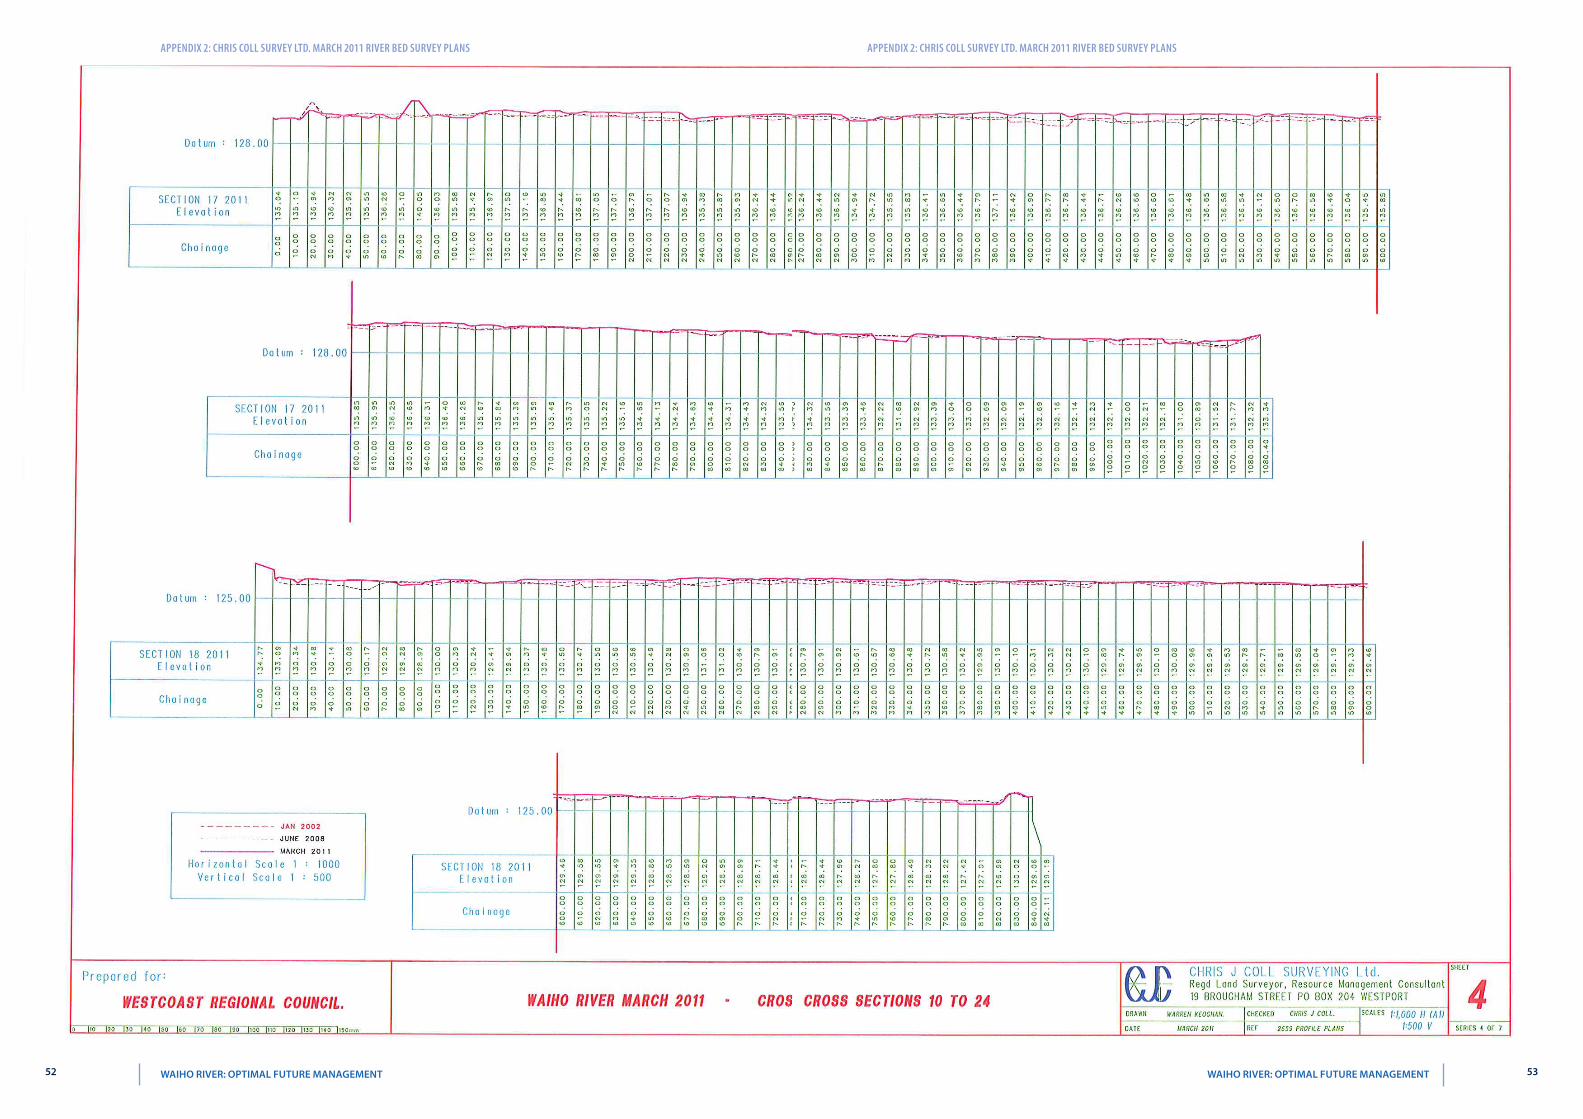
appendIx 2 ChrIs Coll survey ltd marCh 2011 rIver bed survey plans appendIx 2 ChrIs Coll survey ltd marCh 2011 rIver bed survey plans
52 53 Waiho RiveR optimal FutuRe management Waiho RiveR optimal FutuRe management
appendIx 2 ChrIs Coll survey ltd marCh 2011 rIver bed survey plans appendIx 2 ChrIs Coll survey ltd marCh 2011 rIver bed survey plans
54 55 Waiho RiveR optimal FutuRe management Waiho RiveR optimal FutuRe management
appendIx 2 ChrIs Coll survey ltd marCh 2011 rIver bed survey plans appendIx 2 ChrIs Coll survey ltd marCh 2011 rIver bed survey plans
56 57 Waiho RiveR optimal FutuRe management Waiho RiveR optimal FutuRe management
appendIx 2 ChrIs Coll survey ltd marCh 2011 rIver bed survey plans appendIx 2 ChrIs Coll survey ltd marCh 2011 rIver bed survey plans
58 59 Waiho RiveR optimal FutuRe management Waiho RiveR optimal FutuRe management
appendIx 2 ChrIs Coll survey ltd marCh 2011 rIver bed survey plans
appEndix 3
CHris Coll surVey ltd June 2011 WaiHo busH bloCk
60 61 Waiho RiveR optimal FutuRe management Waiho RiveR optimal FutuRe management
appendIx 3 ChrIs Coll survey ltd June 2011 waIho bush bloCk appendIx 3 ChrIs Coll survey ltd June 2011 waIho bush bloCk
62 63 Waiho RiveR optimal FutuRe management Waiho RiveR optimal FutuRe management
appendIx 3 ChrIs Coll survey ltd June 2011 waIho bush bloCk
appEndix 4
reFerenCes
1 Influence of Channel Width on Bed Load Transport Capacity MA Carson and GA Griffith ASCE Journal of Hydraulic Engineering Vol 113 No 12 Dec 1987 (pp 1489 -1509)
2 Dam Break Flood Hazard from the Callery River Westland New Zealand TR Davies and BK Scott Journal of Hydrology (NZ) 36 (1) 1-13 (1997)
3 Natural Hazards Assessment for the Township of Franz Josef and its Environs MJ McSaveney TRH Davies IGNS Client Report 44714B10 (July 1998)
4 Peer Review of the Institute of Geological and Nuclear Sciences Ltd Report No 44714B10 (July 1998) Natural Hazards Assessment for the Township of Franz Josef and its Environs RJ Hall RJ Hall Civil amp Environmental Consulting Ltd (August 1998)
5 Evaluation of Options for the Management of the Waiho River Aggradation Threats RJ Hall et al (2000)6 Anthropogenic Fanhead Aggradation Waiho River Westland New Zealand TR Davies MJ McSaveney
Proceedings 5th International Gravel-bed Rivers Symposium Christchurch and Franz Josef (2000)7 The Transit New Zealand Waiho Workshop HL Rouse TJ Day TRH Davies Proceedings 5th International
Gravel-bed Rivers Symposium Christchurch and Franz Josef (2000)8 Landslide-dambreak Floods at Franz Josef Glacier Township Westland New Zealand a Risk Assessment TR Davies
Journal of Hydrology (NZ) Vol 41 No 1 (2002) 9 Anthropogenic Aggradation of the Waiho River Westland New Zealand TR Davies MJ McSaveney PJ
Clarkeson Earth Surfaces Processes and Landforms 28 209-218 (2003)10 How High are Bed Moving Flows in New Zealand Rivers B Clausen D Plew Journal of Hydrology (NZ) Vol 43 No
1 (2004)11 Geomorphic Constraints on the Management of Bed-load Dominated Rivers TR Davies MJ McSaveney Journal
of Hydrology (NZ) 45 (2) 69-88 (2006) 12 Geology of the Aoraki Area 1 250000 Geological Map 15 SC Cox DJA Barrell compilers IGNS (2007)13 West Coast Regional Council Waiho River Flood Protection Scheme Design Flood Levels Good Earth Matters Ltd
(2008)14 Preparing For Climate Change A Guide for Local Government in New Zealand Ministry for the Environment (2008)15 Waiho River Bed Surveys June 2008 and March 2011 Chris Coll Surveying Ltd (2011)16 Topographical Survey of the Waiho Bush Block Chris Coll Surveying Ltd (2011)17 Mean Bed Level Survey Record Waiho River SH 6 Bridge February 1997 ndash May 2011 Opus International Consultants
Ltd 18 WCRC Asset Management Plans for the Franz Josef Special Rating Area the Lower Waiho Rating District (December
2010)19 Video of Callery Fly Over 2011 Opus International Consultants Ltd (2011)20 Oblique Stills Callery Fly Over 2011 Department of Conservation Franz Josef (2011)21 WCRC Staff Aerial Inspection ndash Callery 6 September 2011 W Moen WCRC (7 September 2011)22 Planning for a Safer Franz Josef ndash Waiau Community Westland District Considering Rupture of the Alpine Fault
RM Langridge amp JG Beban GNS Science Consultancy Report 2011217 (September 2011)23 Callery River Landslide Dam Rapid Assessment of Dam Failure Consequences for West Coast Regional Council R
Measures M Duncan NIWA (September 2011)24 NIWA Flood Annual Flood Record and Annual Means Site 89301 Whataroa River at SH 6 1985 ndash 2011 NIWA (2011)25 Report on West Coast Weather Event 27 amp 28 December 2010 West Coast Regional Council report (2011)
64 65 Waiho RiveR optimal FutuRe management Waiho RiveR optimal FutuRe management
appendIx 4 referenCes
appEndix 5
tables
Cros
s se
ctio
n
thal
weg
dis
tanc
e ( m
)
Mbl
Jan-
02 (
rl m
)
Mbl
Jun-
08 (
rl m
)
Mbl
Mar
-11
( rl
m )
Chan
ge M
bl Ja
n 02
- Ju
ne 0
8 ( r
l m
)
Chan
ge M
bl Ju
ne 0
8 - M
ar
2011
( r
l m
)
rate
Cha
nge
Mbl
Jan
02 -
June
08
( m
yr )
rate
Cha
nge
Mbl
June
08
- M
ar 2
011
( m
yr
)
rati
o M
bl C
hang
e pe
r yr
2008
- 20
11 to
200
2 - 2
011
Chan
ge in
Vol
ume
( m
3 ) 20
02 -
2008
Chan
ge in
Vol
ume
( m
3 ) 20
02 -
2011
10 0 15305 15855 16039 551 184 0816 0689 08
11 209 15484 15572 157785 088 207 0131 0775 59 103269 68536
12 417 15308 15328 154969 020 169 0030 0632 212 21893 81442
13 821 15053 15043 15139 -010 097 -0015 0363 00 4656 129254
14 1113 14594 14656 14754 062 098 0092 0369 40 18638 70075
15 1377 14354 14387 14463 033 076 0049 0284 58 36017 68155
16 1795 13934 13963 14017 029 055 0043 0205 48 79237 159891
17 2268 13428 13452 13515 024 063 0035 0237 68 115310 261502
18 2740 12947 12918 12971 -029 053 -0043 0197 -45 -3499 247856
19 3158 12449 12484 12522 034 038 0051 0143 28 -54 147467
20 3923 11626 11678 11703 051 026 0076 0097 13 156610 134985
21 4618 10901 10932 10949 031 017 0045 0065 14 224717 123676
22 5418 10101 10104 10100 003 -005 0004 -0017 -40 613958 -560100
23 6114 9343 9504 9397 161 -108 0239 -0403 00 635880 -761619
2006631 171120
TABle 1 Waiho River at Franz Josef Mean Bed Level and Volumetric Changes Summary January 2002 ndash June 2008 and June 2008 ndash March 2011 River Bed Surveys
66 67 Waiho RiveR optimal FutuRe management Waiho RiveR optimal FutuRe management
appendIx 5 tables
recurrence interval t
(yrs)
Qpk(eV 1)
(cumec)
Qpk + 10(cumec)
Qpk + 15(cumec)
23 1230 1350 1400
5 1550 1700 1800
10 1640 1800 1900
20 1730 1900 2000
50 1820 2000 2100
100 1910 2100 2200
note Waiho River estimates derived from an EV 1 analysis of Whataroa River at SH 6 which were scaled by the area factor [A waiho A whataroa]⁰⁸
TABle 2 Flood Frequency Estimates for the Waiho River based on the Whataroa River at SH 6
appEndix 6
Figures
68 69 Waiho RiveR optimal FutuRe management Waiho RiveR optimal FutuRe management
appendIx 5 tables
appEndix 7
glossary oF terMs
active gully erosion Erosion that is presently occurring on the sides and floor of a gully during rainstorms which results in an expansion of the gully (viz depth width) and delivers sediment downstream into the main river system of which it is an integral part
aggradation The process whereby sands and gravels accumulate in a riverbed causing the bed level to riseaggrading Phase A term used to describe a period when aggradation is occurring in a river or on an active
alluvial fanalluvial Fan The fan shaped surface built up by a river over extended time where it exits in a confined reach
typically where a river emerges from a hill catchmentannual exceedence Probability The probability that an event (rainstorm flood) of a specific size will occur on
average in any one year (the mathematical reciprocal of the return period or recurrence interval for that event)
annual series Maxima A table comprising the highest flow recorded at a hydrometric site for each year of record and is used for determining the flood frequency characteristics of that site
antecedent rainfall That rainfall that occurs prior to the onset of a rainstorm and which pre-soaks the soil assisting in the development of runoff from the storm when it occurs
anthropogenic Something which has occurred or will occur as a result of human activity or influenceappurtenant structures A structure that is integrally required for the satisfactory performance of another
structure eg rock riprap stub groynes to provide protection to the riverside toe and batter of a stopbankaverage Water depth The water depth averaged over a cross section for a particular flowavulsion The sudden change in direction of a river that occurs as a result of a break out usually occurring during
a flood so that the river abandons its original course in favour of the new alignmentbedload dominated river A river in whose form has been sculptured by the erosion storage and transport of
gravel as bedloadbenchmark level The level referenced to a particular survey datum that is set on a permanent reference point
(bench mark) for survey purposesboils The localised appearance of water and fine soil particles such as sands and silts that occur where
concentrated seepage flows emerge at groundlinebraided river The description for a wide generally steep gravel bed river that has a multitude of interlacing
channelsCalibration run The running of an hydraulic model using selected known flows and water profiles in order to
determine what surface roughnessrsquos are required to obtain realistic model performanceCatchment Processes The physical processes operating within a catchment which influence the rate of runoff
and hence river flow during rainstormsChannel gradient The average slope of a channel reach measured along the flow path of the riverCross Fall The gradient that occurs on the bed of a river that runs at right angles to the primary down valley
gradient of the riverbedCrest settlement The lowering of the crest level of a stopbank caused by either settlement in the stopbank
foundation where weak materials are present or as a result of internal erosion of the stopbank or where liquefaction has occurred or through slumping caused by erosion of the stopbank or lateral spreading of the stopbank foundation as a result of earthquake action
Current Morphological status The present state that a river is in given that the rivers form tends to change over time in response to climatic and geological influences which can affect sediment supply catchment runoff and hence river flows channel gradient and sea level
dam break surges The waves of water and debris that move rapidly downstream from a debris dam when it fails
debris dams Obstructions that occur in confined river reaches from time to time and typically comprise rock regolith vegetation etc which obstruct the flow of water and cause it to dam
debris Flow A fluvial phenomena that can occur in steep channels usually as a result of intense rainfall on an already wet catchment the debris flow manifests as a slug or series of slugs of water and sediment travelling
DoCheRtY CReeK
1km 1mi
FRanZ JoSeF toWnShip
Canvans Knob
Franz Josef Stopbanks
Canavans Knob Stopbank
Rubbish Dump Stopbank
milton amp others Stopbank
State highway
State highway
Bridge
Sewerage ponds
nZta
WCRC
hokitika airport authority
Department of Conservation
Westland District Council
tartare gorge
Waiho loop
Rata Knoll
WAIHO RIVER
CalleRY RiveR
70 71 Waiho RiveR optimal FutuRe management Waiho RiveR optimal FutuRe management
appendIx 7 glossary of terms appendIx 7 glossary of terms
rapidly downstream as a dense slurry which may have incorporated within it woody debris such as tree trunks and branches
debris Flow activity The occurrence of debris flowsdebris traps Places within a catchments river system where sediment tends to accumulatedegradation The opposite process to aggradation whereby sands and gravels are eroded out of the riverbed
and the riverbed fallsdeflation of the bed The steady reduction in elevation of an eroding surface (river bed) over time under the
influence of surface erosion processesdesign Flood levels The maximum water level relative to a prescribed design datum set at a particular location
on a river required to contain the design flood carrying capacity of the river control systemdetritus The products of erosion that is delivered into a river system form the slopes where it has been generated
by weathering and erosion processesdistal end of an alluvial Fan The furthest end of an alluvial fan from the fan head and typically the lowest
elevation on the fan surface provided the fan has not been truncated by erosion by the river or by wave action on a lake or the sea
episodic Events that occur irregularly in timeFalling limb of a Hydrograph That part of the flood hydrograph after the peak where the flood recession
occursFlood Carrying Capacity An estimate of the peak flow in m3 per second that a river control system (can contain
without exceeding its freeboard where a river has stopbanks it is the flow contained within the stopbanks whilst maintaining the design freeboard
Flood Frequency estimates A statistical process for estimating the recurrence interval of various flood discharges for a particular hydrometric site using the annual maxima series for that site
Flood Peak The maximum flow reached by a river in flood measured in m3 per secondFlood Plain The surface over which a river can spread in times of flood once it overtops its natural banks Flood Volume The total volume of water delivered by a river in flood over the duration of the flood and measured
in m3 Fluvial Characteristics The characteristics of a river which describe the storage transport and reworking of river
sediments by the rivers flowsgeomorphic Constraints Physical factors such a rate of uplift hardness of basement rock present sea level
which limit for example the generation of sediment supply and gradient of a river and hence influence the form of a river
glacial internal drainage systems Subsurface watercourses located in and beneath a glacier that convey water from the surface and sides of a glacier into through and beneath a glacier and discharge to the valley floor at the glacier terminal face
glacier retreat The process whereby the terminal face of the glacier is located progressively up the valley as the glacier ice volume is reduced by ablation
Headcut The formation of an erosion cusp in a channel that results in a localised step in a channel bedHeadward erosion The erosion that generates and maintains the headward movement of the erosion cusp
(headcut)Hydraulic Characteristics The flow characteristics of a river system such as flow depth water velocity channel
surface roughness and channel slope (gradient)Hydraulic gradient The slope on a flowing water surfaceHydrometric site A water level measuring site which continuously measures and records water depth at the site
at specific time intervals used for establishing flow records over the full range from low to high flow landslide dam A dam that forms in a confined reach of a river as a result of landslide occurring and partially
blocking the valley through which the river is flowinglateral bank erosion The processes whereby a river erodes its banks generally used with reference to the
erosion of stopbanks when a river moves side ways in a flood eroding the stopbank in the process on the riverside of the stopbank
liquefaction The sudden loss of strength of an unconsolidated or poorly consolidated saturated fine sand soil induced by violent earthquake shaking
lithologies A geological term used for describing rock typeslive bed Conditions The condition that may occur in a riverbed in flood when the deposits which form the
riverbed and banks begin to mobilise and become entrained in the flow and move downstreamMass Movement The downslope movement of regolith and other erosion products in bulk eg slab avalanches
landslides debris flows
Mean bed level The average level of a riverbed across a particular cross section at a particular time estimated from a surveyed cross section at a particular time
Micro scale Modeling The development and running of a small scale physical replica of a particular physical feature such as an active alluvial fan in a laboratory situation
Morphologically active alluvial Fan An alluvial fan that is either aggrading or degrading under its present sediment and water supply and under the influence of local morphological constraints
natural Hazards Any atmospheric or earth or water related occurrence (in the Waiho River context including earthquake erosion landslip Subsidence sedimentation wind drought or flooding) the actions of which adversely affects or may affect human life property or other aspects of the environment
overtopping The term used to describe the situation where floodwaters in a river in flood begin to spill over the rivers banks or stopbanks whichever is relevant to the particular situation being considered
Permeability A term used to describe and quantify that property of a soil that permits water to flow through the pores of the soil under a hydraulic gradient
Pheratic surface The curvilinear water surface within the soils of a stopbank or dam through which water is seeping marking the boundary between saturated and un-saturated soils
Predictive tool A procedure such as a hydraulic model that is developed in order to try and determine how a particular physical situation might develop over time under specified inputs (eg water bedload supply)
Prograding The episodic growth of an alluvial fan surface which causes the distal end of the fan to extend downstream away from the fan head
recession That period during a flood when the river has passed its peak and water levels and hence flow rates are dropping
recurrence interval A statistical term used to describe the relative size of an event (synonymous with the term average return period) eg a particular rainfall depth or flood flow A 1 in 100 year flood has a recurrence interval of 100 years on average It does not mean that an hundred year flood will not occur again for 100 years if an event of that size has just been experienced
regolith The accumulation of soil material on a hill slope as a result of the weathering of the hill slope over time Typically regolith includes clay and sand size particles rock fragments and soil
regolith avalanches The localised movement of regolith rapidly off a hill slope onto the valley floor or riverbed in the form of an avalanche
residence time The time that elapses for example between bed load sediments accumulating at a particular location and subsequently being eroded out
revegetation The decolonization with new vegetation on areas such as slopes denuded of vegetation by landslides
river bed roughness A hydraulic term which reflects the relative roughness of the surface of a riverbed or its berms that is used in hydraulic computations
river Cross sections A survey of ground levels extending across a river from its true left bank to its true right bank aligned more or less at right angles to the rivers flow in times of flood
river reach A description for a particular stretch of a riverriver training and Protection Works Structures erected by humans in an attempt to mitigate against riverbank
erosion and channel migration during floodsrelaxation Removing the boundary constrains on a stopbanked river to allow the river to reassert its natural
form on the floodplain unimpeded by man made flood containment structuresrock rip rap A term used to describe the coarse hard rock that is placed against a surface that may be eroded
by river flows in order to mitigate against such erosion sediment sources Those parts of a river catchment that supply sediment to the river as sediment supplysediment supply The sediment that passes through a river system typically of an episodic nature ie the rate of
supply varying over time typically in response to climatic conditions and river flowseismic induced Mass Movement Landslide activity caused by seismic activityshallow slab avalanches Landslides that typically occur on steep valley sides where the basement rock is close
to the surface (eg within 1 to 2 metres of the surface)sinusoidal braided Flow PatternsTheldquoSrdquoshapedchannelinducedflowpatternsobservedinbraidedriversspecial rating district A Rating District established for the construction and ongoing repair and maintenance
of a river control scheme the rating district is administered by the West Coast Regional Councilsplinter Faults Fault lines that extend out at an angle from a main fault linespur groynes Short groynes that are constructed at the toe of a natural river bank or stopbank that project out
into the riverbed designed to ease high flow velocities of the natural bank or stopbank toe in order to lessen the risk of lateral erosion by the river in flood
72 73 Waiho RiveR optimal FutuRe management Waiho RiveR optimal FutuRe management
appendIx 7 glossary of terms
stopbank A structure erected on a rivers floodplain typically sub-parallel to the rivers flow in times of flood to contain flood flows up to the design standard of the flood protection scheme to prevent them from spilling onto the floodplain
sub-alpine vegetation Typically shrubby bushes grasses and stunted trees that grow above the bush line but below the sparsely vegetated alpine area of a mountain range
sub ndash Parallel More or less parallelsuper-elevation effect The local elevation of water levels around the outside of a bend in a river caused by
centrifugal forces generated by the water moving around the river bendswale The remnant of a river channel on a riversrsquo floodplain that has been etched by river flows in the past and
has subsequently been abandoned by the normal flow of the river but can activate when rivers overtop their natural banks and flow onto the flood plain they may also convey surface runoff from local rainstorms from time to time
temporal supply Mechanism A process that generates sediment supply to the river system and is time dependent
thalweg The centreline path the active riverbed takes as it flows down plainthreshold Flood event A flood event of sufficient size that it overtops a rivers confining banks natural or man
made transfer reach That part of a mountain catchment located in the foothill area upstream of the head (or apex)
of an alluvial fan generally a gorge or narrow confined reach with little opportunity for coarse sediment storage coarse sediments tend to flush through these reaches during floods rather than accumulate as they might on the fan surface proper
two dimensional Hydraulic Model A computer model that incorporates a digital terrain model to provide the basis for determining water depths and velocities over that surface for a particular design flood flow
Wasting out The eroding out of deposits over time
74 Waiho RiveR optimal FutuRe management
388 Main South Road PO Box 66 Greymouth
phone +64 3 768 0466
email infowcrcgovtnz
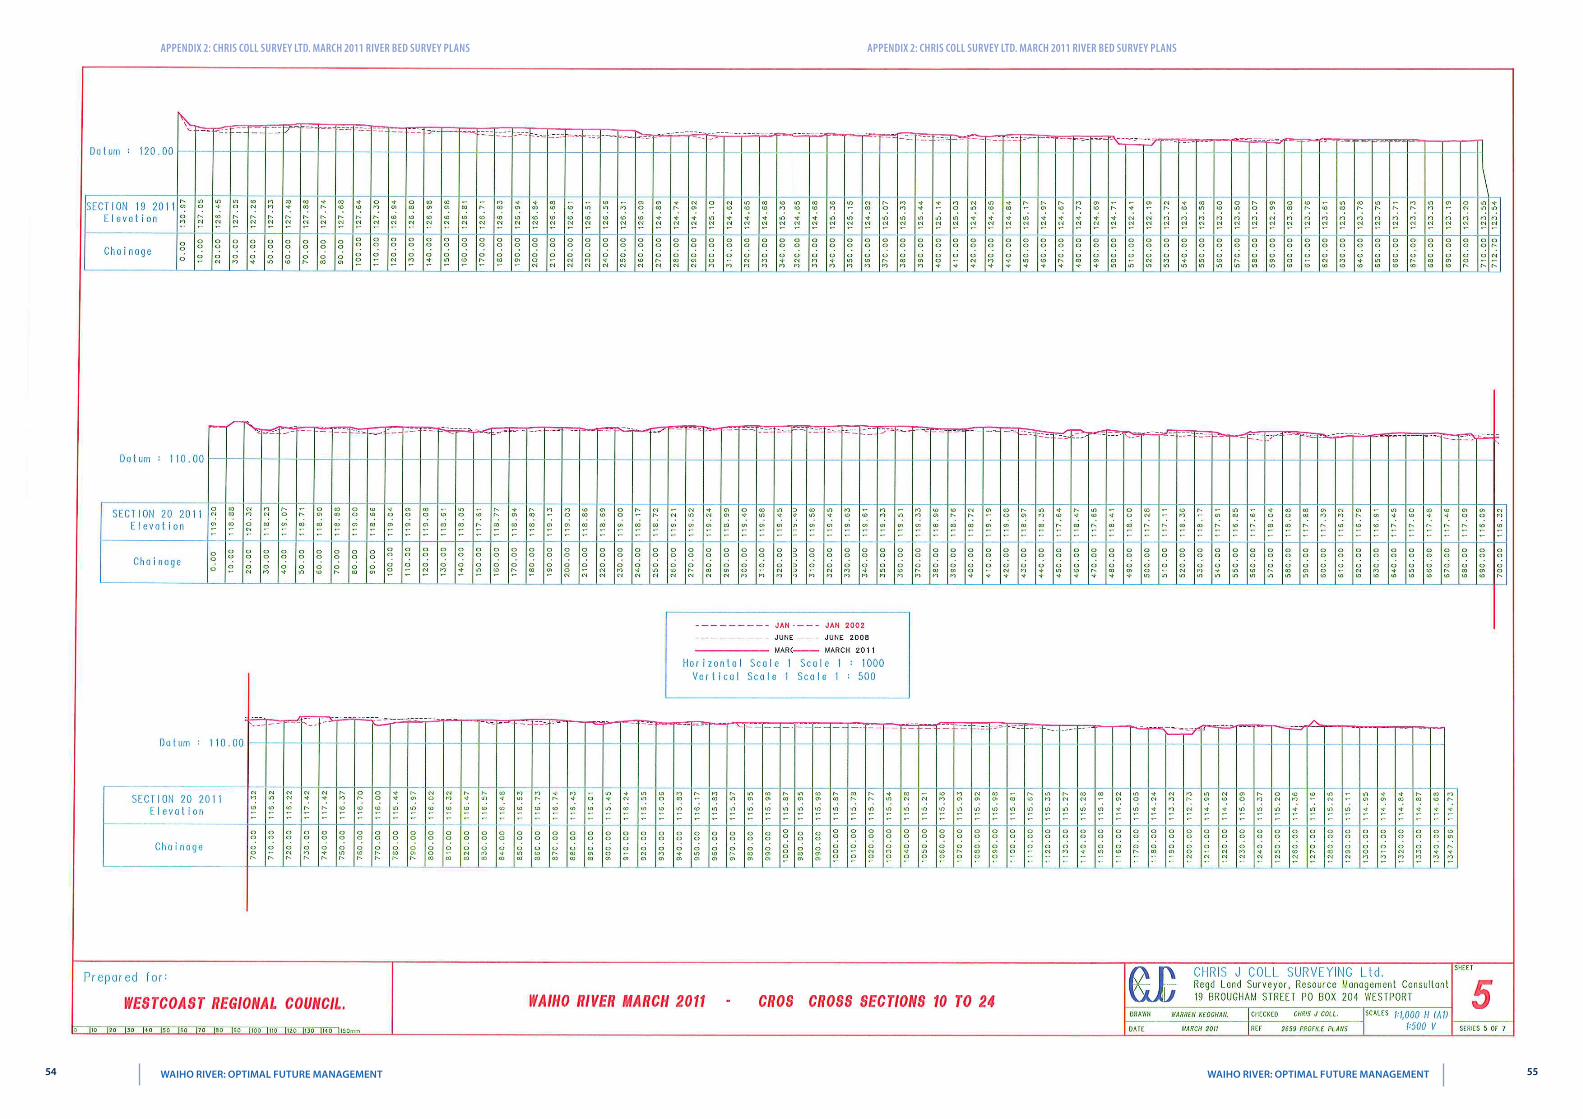
appendIx 2 ChrIs Coll survey ltd marCh 2011 rIver bed survey plans appendIx 2 ChrIs Coll survey ltd marCh 2011 rIver bed survey plans
54 55 Waiho RiveR optimal FutuRe management Waiho RiveR optimal FutuRe management
appendIx 2 ChrIs Coll survey ltd marCh 2011 rIver bed survey plans appendIx 2 ChrIs Coll survey ltd marCh 2011 rIver bed survey plans
56 57 Waiho RiveR optimal FutuRe management Waiho RiveR optimal FutuRe management
appendIx 2 ChrIs Coll survey ltd marCh 2011 rIver bed survey plans appendIx 2 ChrIs Coll survey ltd marCh 2011 rIver bed survey plans
58 59 Waiho RiveR optimal FutuRe management Waiho RiveR optimal FutuRe management
appendIx 2 ChrIs Coll survey ltd marCh 2011 rIver bed survey plans
appEndix 3
CHris Coll surVey ltd June 2011 WaiHo busH bloCk
60 61 Waiho RiveR optimal FutuRe management Waiho RiveR optimal FutuRe management
appendIx 3 ChrIs Coll survey ltd June 2011 waIho bush bloCk appendIx 3 ChrIs Coll survey ltd June 2011 waIho bush bloCk
62 63 Waiho RiveR optimal FutuRe management Waiho RiveR optimal FutuRe management
appendIx 3 ChrIs Coll survey ltd June 2011 waIho bush bloCk
appEndix 4
reFerenCes
1 Influence of Channel Width on Bed Load Transport Capacity MA Carson and GA Griffith ASCE Journal of Hydraulic Engineering Vol 113 No 12 Dec 1987 (pp 1489 -1509)
2 Dam Break Flood Hazard from the Callery River Westland New Zealand TR Davies and BK Scott Journal of Hydrology (NZ) 36 (1) 1-13 (1997)
3 Natural Hazards Assessment for the Township of Franz Josef and its Environs MJ McSaveney TRH Davies IGNS Client Report 44714B10 (July 1998)
4 Peer Review of the Institute of Geological and Nuclear Sciences Ltd Report No 44714B10 (July 1998) Natural Hazards Assessment for the Township of Franz Josef and its Environs RJ Hall RJ Hall Civil amp Environmental Consulting Ltd (August 1998)
5 Evaluation of Options for the Management of the Waiho River Aggradation Threats RJ Hall et al (2000)6 Anthropogenic Fanhead Aggradation Waiho River Westland New Zealand TR Davies MJ McSaveney
Proceedings 5th International Gravel-bed Rivers Symposium Christchurch and Franz Josef (2000)7 The Transit New Zealand Waiho Workshop HL Rouse TJ Day TRH Davies Proceedings 5th International
Gravel-bed Rivers Symposium Christchurch and Franz Josef (2000)8 Landslide-dambreak Floods at Franz Josef Glacier Township Westland New Zealand a Risk Assessment TR Davies
Journal of Hydrology (NZ) Vol 41 No 1 (2002) 9 Anthropogenic Aggradation of the Waiho River Westland New Zealand TR Davies MJ McSaveney PJ
Clarkeson Earth Surfaces Processes and Landforms 28 209-218 (2003)10 How High are Bed Moving Flows in New Zealand Rivers B Clausen D Plew Journal of Hydrology (NZ) Vol 43 No
1 (2004)11 Geomorphic Constraints on the Management of Bed-load Dominated Rivers TR Davies MJ McSaveney Journal
of Hydrology (NZ) 45 (2) 69-88 (2006) 12 Geology of the Aoraki Area 1 250000 Geological Map 15 SC Cox DJA Barrell compilers IGNS (2007)13 West Coast Regional Council Waiho River Flood Protection Scheme Design Flood Levels Good Earth Matters Ltd
(2008)14 Preparing For Climate Change A Guide for Local Government in New Zealand Ministry for the Environment (2008)15 Waiho River Bed Surveys June 2008 and March 2011 Chris Coll Surveying Ltd (2011)16 Topographical Survey of the Waiho Bush Block Chris Coll Surveying Ltd (2011)17 Mean Bed Level Survey Record Waiho River SH 6 Bridge February 1997 ndash May 2011 Opus International Consultants
Ltd 18 WCRC Asset Management Plans for the Franz Josef Special Rating Area the Lower Waiho Rating District (December
2010)19 Video of Callery Fly Over 2011 Opus International Consultants Ltd (2011)20 Oblique Stills Callery Fly Over 2011 Department of Conservation Franz Josef (2011)21 WCRC Staff Aerial Inspection ndash Callery 6 September 2011 W Moen WCRC (7 September 2011)22 Planning for a Safer Franz Josef ndash Waiau Community Westland District Considering Rupture of the Alpine Fault
RM Langridge amp JG Beban GNS Science Consultancy Report 2011217 (September 2011)23 Callery River Landslide Dam Rapid Assessment of Dam Failure Consequences for West Coast Regional Council R
Measures M Duncan NIWA (September 2011)24 NIWA Flood Annual Flood Record and Annual Means Site 89301 Whataroa River at SH 6 1985 ndash 2011 NIWA (2011)25 Report on West Coast Weather Event 27 amp 28 December 2010 West Coast Regional Council report (2011)
64 65 Waiho RiveR optimal FutuRe management Waiho RiveR optimal FutuRe management
appendIx 4 referenCes
appEndix 5
tables
Cros
s se
ctio
n
thal
weg
dis
tanc
e ( m
)
Mbl
Jan-
02 (
rl m
)
Mbl
Jun-
08 (
rl m
)
Mbl
Mar
-11
( rl
m )
Chan
ge M
bl Ja
n 02
- Ju
ne 0
8 ( r
l m
)
Chan
ge M
bl Ju
ne 0
8 - M
ar
2011
( r
l m
)
rate
Cha
nge
Mbl
Jan
02 -
June
08
( m
yr )
rate
Cha
nge
Mbl
June
08
- M
ar 2
011
( m
yr
)
rati
o M
bl C
hang
e pe
r yr
2008
- 20
11 to
200
2 - 2
011
Chan
ge in
Vol
ume
( m
3 ) 20
02 -
2008
Chan
ge in
Vol
ume
( m
3 ) 20
02 -
2011
10 0 15305 15855 16039 551 184 0816 0689 08
11 209 15484 15572 157785 088 207 0131 0775 59 103269 68536
12 417 15308 15328 154969 020 169 0030 0632 212 21893 81442
13 821 15053 15043 15139 -010 097 -0015 0363 00 4656 129254
14 1113 14594 14656 14754 062 098 0092 0369 40 18638 70075
15 1377 14354 14387 14463 033 076 0049 0284 58 36017 68155
16 1795 13934 13963 14017 029 055 0043 0205 48 79237 159891
17 2268 13428 13452 13515 024 063 0035 0237 68 115310 261502
18 2740 12947 12918 12971 -029 053 -0043 0197 -45 -3499 247856
19 3158 12449 12484 12522 034 038 0051 0143 28 -54 147467
20 3923 11626 11678 11703 051 026 0076 0097 13 156610 134985
21 4618 10901 10932 10949 031 017 0045 0065 14 224717 123676
22 5418 10101 10104 10100 003 -005 0004 -0017 -40 613958 -560100
23 6114 9343 9504 9397 161 -108 0239 -0403 00 635880 -761619
2006631 171120
TABle 1 Waiho River at Franz Josef Mean Bed Level and Volumetric Changes Summary January 2002 ndash June 2008 and June 2008 ndash March 2011 River Bed Surveys
66 67 Waiho RiveR optimal FutuRe management Waiho RiveR optimal FutuRe management
appendIx 5 tables
recurrence interval t
(yrs)
Qpk(eV 1)
(cumec)
Qpk + 10(cumec)
Qpk + 15(cumec)
23 1230 1350 1400
5 1550 1700 1800
10 1640 1800 1900
20 1730 1900 2000
50 1820 2000 2100
100 1910 2100 2200
note Waiho River estimates derived from an EV 1 analysis of Whataroa River at SH 6 which were scaled by the area factor [A waiho A whataroa]⁰⁸
TABle 2 Flood Frequency Estimates for the Waiho River based on the Whataroa River at SH 6
appEndix 6
Figures
68 69 Waiho RiveR optimal FutuRe management Waiho RiveR optimal FutuRe management
appendIx 5 tables
appEndix 7
glossary oF terMs
active gully erosion Erosion that is presently occurring on the sides and floor of a gully during rainstorms which results in an expansion of the gully (viz depth width) and delivers sediment downstream into the main river system of which it is an integral part
aggradation The process whereby sands and gravels accumulate in a riverbed causing the bed level to riseaggrading Phase A term used to describe a period when aggradation is occurring in a river or on an active
alluvial fanalluvial Fan The fan shaped surface built up by a river over extended time where it exits in a confined reach
typically where a river emerges from a hill catchmentannual exceedence Probability The probability that an event (rainstorm flood) of a specific size will occur on
average in any one year (the mathematical reciprocal of the return period or recurrence interval for that event)
annual series Maxima A table comprising the highest flow recorded at a hydrometric site for each year of record and is used for determining the flood frequency characteristics of that site
antecedent rainfall That rainfall that occurs prior to the onset of a rainstorm and which pre-soaks the soil assisting in the development of runoff from the storm when it occurs
anthropogenic Something which has occurred or will occur as a result of human activity or influenceappurtenant structures A structure that is integrally required for the satisfactory performance of another
structure eg rock riprap stub groynes to provide protection to the riverside toe and batter of a stopbankaverage Water depth The water depth averaged over a cross section for a particular flowavulsion The sudden change in direction of a river that occurs as a result of a break out usually occurring during
a flood so that the river abandons its original course in favour of the new alignmentbedload dominated river A river in whose form has been sculptured by the erosion storage and transport of
gravel as bedloadbenchmark level The level referenced to a particular survey datum that is set on a permanent reference point
(bench mark) for survey purposesboils The localised appearance of water and fine soil particles such as sands and silts that occur where
concentrated seepage flows emerge at groundlinebraided river The description for a wide generally steep gravel bed river that has a multitude of interlacing
channelsCalibration run The running of an hydraulic model using selected known flows and water profiles in order to
determine what surface roughnessrsquos are required to obtain realistic model performanceCatchment Processes The physical processes operating within a catchment which influence the rate of runoff
and hence river flow during rainstormsChannel gradient The average slope of a channel reach measured along the flow path of the riverCross Fall The gradient that occurs on the bed of a river that runs at right angles to the primary down valley
gradient of the riverbedCrest settlement The lowering of the crest level of a stopbank caused by either settlement in the stopbank
foundation where weak materials are present or as a result of internal erosion of the stopbank or where liquefaction has occurred or through slumping caused by erosion of the stopbank or lateral spreading of the stopbank foundation as a result of earthquake action
Current Morphological status The present state that a river is in given that the rivers form tends to change over time in response to climatic and geological influences which can affect sediment supply catchment runoff and hence river flows channel gradient and sea level
dam break surges The waves of water and debris that move rapidly downstream from a debris dam when it fails
debris dams Obstructions that occur in confined river reaches from time to time and typically comprise rock regolith vegetation etc which obstruct the flow of water and cause it to dam
debris Flow A fluvial phenomena that can occur in steep channels usually as a result of intense rainfall on an already wet catchment the debris flow manifests as a slug or series of slugs of water and sediment travelling
DoCheRtY CReeK
1km 1mi
FRanZ JoSeF toWnShip
Canvans Knob
Franz Josef Stopbanks
Canavans Knob Stopbank
Rubbish Dump Stopbank
milton amp others Stopbank
State highway
State highway
Bridge
Sewerage ponds
nZta
WCRC
hokitika airport authority
Department of Conservation
Westland District Council
tartare gorge
Waiho loop
Rata Knoll
WAIHO RIVER
CalleRY RiveR
70 71 Waiho RiveR optimal FutuRe management Waiho RiveR optimal FutuRe management
appendIx 7 glossary of terms appendIx 7 glossary of terms
rapidly downstream as a dense slurry which may have incorporated within it woody debris such as tree trunks and branches
debris Flow activity The occurrence of debris flowsdebris traps Places within a catchments river system where sediment tends to accumulatedegradation The opposite process to aggradation whereby sands and gravels are eroded out of the riverbed
and the riverbed fallsdeflation of the bed The steady reduction in elevation of an eroding surface (river bed) over time under the
influence of surface erosion processesdesign Flood levels The maximum water level relative to a prescribed design datum set at a particular location
on a river required to contain the design flood carrying capacity of the river control systemdetritus The products of erosion that is delivered into a river system form the slopes where it has been generated
by weathering and erosion processesdistal end of an alluvial Fan The furthest end of an alluvial fan from the fan head and typically the lowest
elevation on the fan surface provided the fan has not been truncated by erosion by the river or by wave action on a lake or the sea
episodic Events that occur irregularly in timeFalling limb of a Hydrograph That part of the flood hydrograph after the peak where the flood recession
occursFlood Carrying Capacity An estimate of the peak flow in m3 per second that a river control system (can contain
without exceeding its freeboard where a river has stopbanks it is the flow contained within the stopbanks whilst maintaining the design freeboard
Flood Frequency estimates A statistical process for estimating the recurrence interval of various flood discharges for a particular hydrometric site using the annual maxima series for that site
Flood Peak The maximum flow reached by a river in flood measured in m3 per secondFlood Plain The surface over which a river can spread in times of flood once it overtops its natural banks Flood Volume The total volume of water delivered by a river in flood over the duration of the flood and measured
in m3 Fluvial Characteristics The characteristics of a river which describe the storage transport and reworking of river
sediments by the rivers flowsgeomorphic Constraints Physical factors such a rate of uplift hardness of basement rock present sea level
which limit for example the generation of sediment supply and gradient of a river and hence influence the form of a river
glacial internal drainage systems Subsurface watercourses located in and beneath a glacier that convey water from the surface and sides of a glacier into through and beneath a glacier and discharge to the valley floor at the glacier terminal face
glacier retreat The process whereby the terminal face of the glacier is located progressively up the valley as the glacier ice volume is reduced by ablation
Headcut The formation of an erosion cusp in a channel that results in a localised step in a channel bedHeadward erosion The erosion that generates and maintains the headward movement of the erosion cusp
(headcut)Hydraulic Characteristics The flow characteristics of a river system such as flow depth water velocity channel
surface roughness and channel slope (gradient)Hydraulic gradient The slope on a flowing water surfaceHydrometric site A water level measuring site which continuously measures and records water depth at the site
at specific time intervals used for establishing flow records over the full range from low to high flow landslide dam A dam that forms in a confined reach of a river as a result of landslide occurring and partially
blocking the valley through which the river is flowinglateral bank erosion The processes whereby a river erodes its banks generally used with reference to the
erosion of stopbanks when a river moves side ways in a flood eroding the stopbank in the process on the riverside of the stopbank
liquefaction The sudden loss of strength of an unconsolidated or poorly consolidated saturated fine sand soil induced by violent earthquake shaking
lithologies A geological term used for describing rock typeslive bed Conditions The condition that may occur in a riverbed in flood when the deposits which form the
riverbed and banks begin to mobilise and become entrained in the flow and move downstreamMass Movement The downslope movement of regolith and other erosion products in bulk eg slab avalanches
landslides debris flows
Mean bed level The average level of a riverbed across a particular cross section at a particular time estimated from a surveyed cross section at a particular time
Micro scale Modeling The development and running of a small scale physical replica of a particular physical feature such as an active alluvial fan in a laboratory situation
Morphologically active alluvial Fan An alluvial fan that is either aggrading or degrading under its present sediment and water supply and under the influence of local morphological constraints
natural Hazards Any atmospheric or earth or water related occurrence (in the Waiho River context including earthquake erosion landslip Subsidence sedimentation wind drought or flooding) the actions of which adversely affects or may affect human life property or other aspects of the environment
overtopping The term used to describe the situation where floodwaters in a river in flood begin to spill over the rivers banks or stopbanks whichever is relevant to the particular situation being considered
Permeability A term used to describe and quantify that property of a soil that permits water to flow through the pores of the soil under a hydraulic gradient
Pheratic surface The curvilinear water surface within the soils of a stopbank or dam through which water is seeping marking the boundary between saturated and un-saturated soils
Predictive tool A procedure such as a hydraulic model that is developed in order to try and determine how a particular physical situation might develop over time under specified inputs (eg water bedload supply)
Prograding The episodic growth of an alluvial fan surface which causes the distal end of the fan to extend downstream away from the fan head
recession That period during a flood when the river has passed its peak and water levels and hence flow rates are dropping
recurrence interval A statistical term used to describe the relative size of an event (synonymous with the term average return period) eg a particular rainfall depth or flood flow A 1 in 100 year flood has a recurrence interval of 100 years on average It does not mean that an hundred year flood will not occur again for 100 years if an event of that size has just been experienced
regolith The accumulation of soil material on a hill slope as a result of the weathering of the hill slope over time Typically regolith includes clay and sand size particles rock fragments and soil
regolith avalanches The localised movement of regolith rapidly off a hill slope onto the valley floor or riverbed in the form of an avalanche
residence time The time that elapses for example between bed load sediments accumulating at a particular location and subsequently being eroded out
revegetation The decolonization with new vegetation on areas such as slopes denuded of vegetation by landslides
river bed roughness A hydraulic term which reflects the relative roughness of the surface of a riverbed or its berms that is used in hydraulic computations
river Cross sections A survey of ground levels extending across a river from its true left bank to its true right bank aligned more or less at right angles to the rivers flow in times of flood
river reach A description for a particular stretch of a riverriver training and Protection Works Structures erected by humans in an attempt to mitigate against riverbank
erosion and channel migration during floodsrelaxation Removing the boundary constrains on a stopbanked river to allow the river to reassert its natural
form on the floodplain unimpeded by man made flood containment structuresrock rip rap A term used to describe the coarse hard rock that is placed against a surface that may be eroded
by river flows in order to mitigate against such erosion sediment sources Those parts of a river catchment that supply sediment to the river as sediment supplysediment supply The sediment that passes through a river system typically of an episodic nature ie the rate of
supply varying over time typically in response to climatic conditions and river flowseismic induced Mass Movement Landslide activity caused by seismic activityshallow slab avalanches Landslides that typically occur on steep valley sides where the basement rock is close
to the surface (eg within 1 to 2 metres of the surface)sinusoidal braided Flow PatternsTheldquoSrdquoshapedchannelinducedflowpatternsobservedinbraidedriversspecial rating district A Rating District established for the construction and ongoing repair and maintenance
of a river control scheme the rating district is administered by the West Coast Regional Councilsplinter Faults Fault lines that extend out at an angle from a main fault linespur groynes Short groynes that are constructed at the toe of a natural river bank or stopbank that project out
into the riverbed designed to ease high flow velocities of the natural bank or stopbank toe in order to lessen the risk of lateral erosion by the river in flood
72 73 Waiho RiveR optimal FutuRe management Waiho RiveR optimal FutuRe management
appendIx 7 glossary of terms
stopbank A structure erected on a rivers floodplain typically sub-parallel to the rivers flow in times of flood to contain flood flows up to the design standard of the flood protection scheme to prevent them from spilling onto the floodplain
sub-alpine vegetation Typically shrubby bushes grasses and stunted trees that grow above the bush line but below the sparsely vegetated alpine area of a mountain range
sub ndash Parallel More or less parallelsuper-elevation effect The local elevation of water levels around the outside of a bend in a river caused by
centrifugal forces generated by the water moving around the river bendswale The remnant of a river channel on a riversrsquo floodplain that has been etched by river flows in the past and
has subsequently been abandoned by the normal flow of the river but can activate when rivers overtop their natural banks and flow onto the flood plain they may also convey surface runoff from local rainstorms from time to time
temporal supply Mechanism A process that generates sediment supply to the river system and is time dependent
thalweg The centreline path the active riverbed takes as it flows down plainthreshold Flood event A flood event of sufficient size that it overtops a rivers confining banks natural or man
made transfer reach That part of a mountain catchment located in the foothill area upstream of the head (or apex)
of an alluvial fan generally a gorge or narrow confined reach with little opportunity for coarse sediment storage coarse sediments tend to flush through these reaches during floods rather than accumulate as they might on the fan surface proper
two dimensional Hydraulic Model A computer model that incorporates a digital terrain model to provide the basis for determining water depths and velocities over that surface for a particular design flood flow
Wasting out The eroding out of deposits over time
74 Waiho RiveR optimal FutuRe management
388 Main South Road PO Box 66 Greymouth
phone +64 3 768 0466
email infowcrcgovtnz
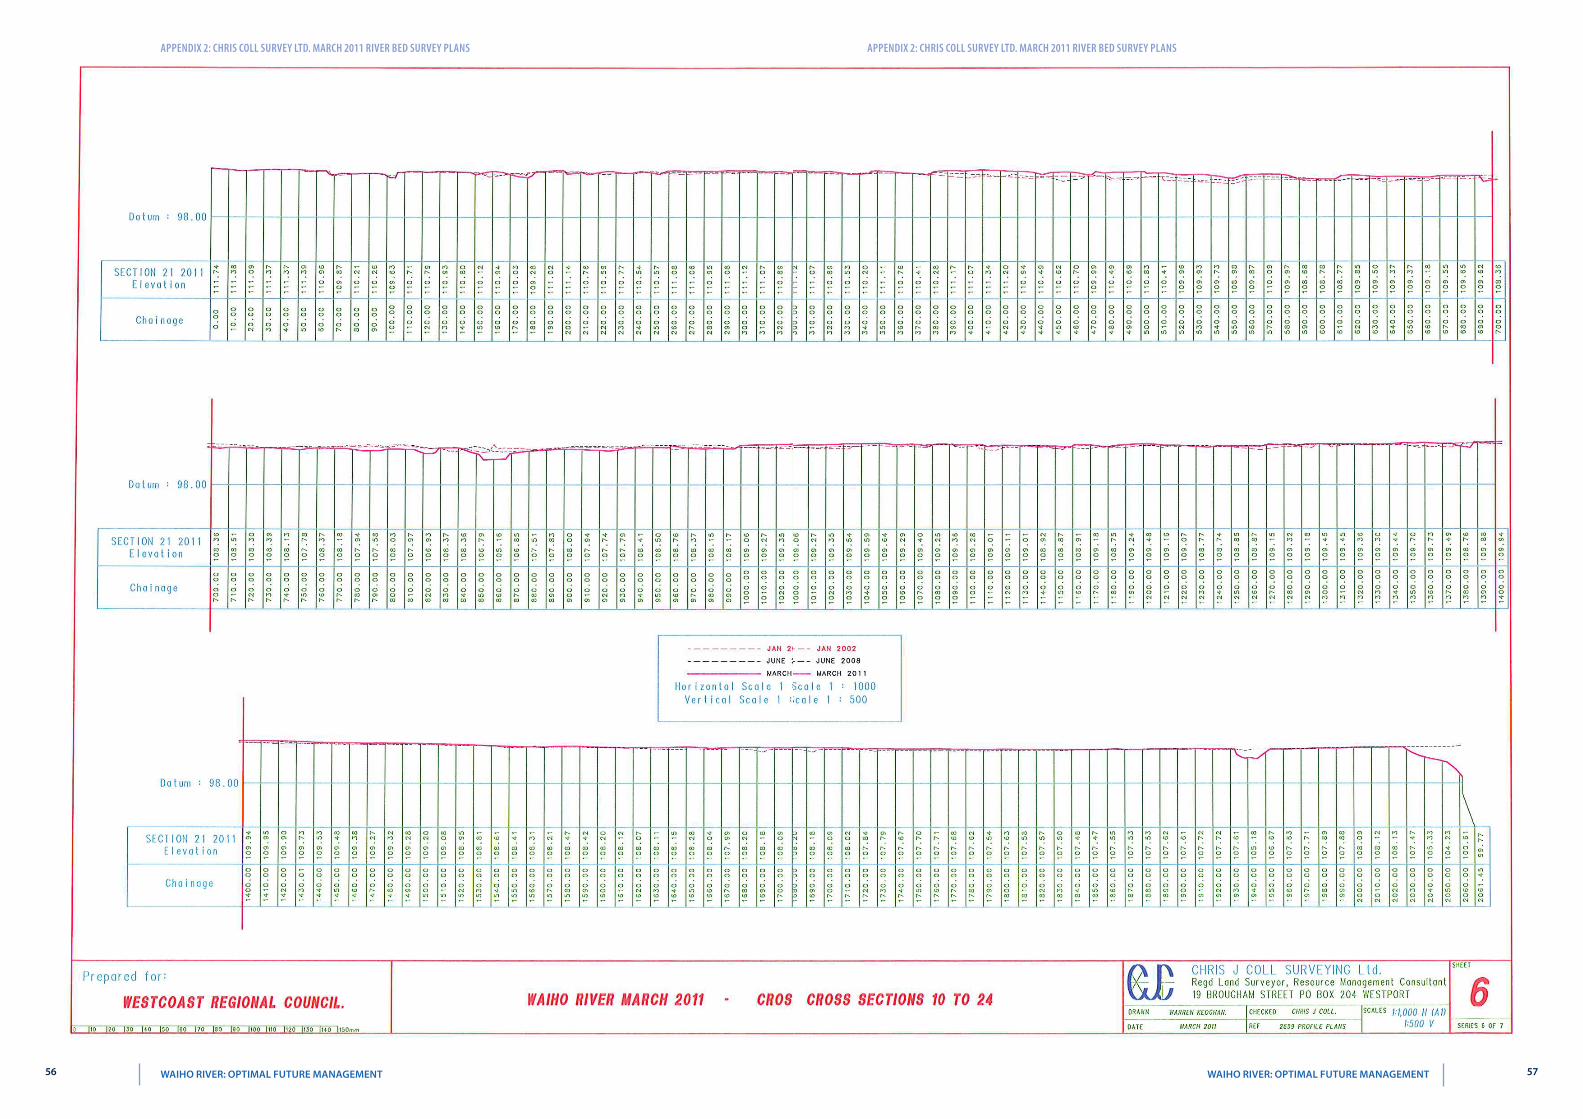
appendIx 2 ChrIs Coll survey ltd marCh 2011 rIver bed survey plans appendIx 2 ChrIs Coll survey ltd marCh 2011 rIver bed survey plans
56 57 Waiho RiveR optimal FutuRe management Waiho RiveR optimal FutuRe management
appendIx 2 ChrIs Coll survey ltd marCh 2011 rIver bed survey plans appendIx 2 ChrIs Coll survey ltd marCh 2011 rIver bed survey plans
58 59 Waiho RiveR optimal FutuRe management Waiho RiveR optimal FutuRe management
appendIx 2 ChrIs Coll survey ltd marCh 2011 rIver bed survey plans
appEndix 3
CHris Coll surVey ltd June 2011 WaiHo busH bloCk
60 61 Waiho RiveR optimal FutuRe management Waiho RiveR optimal FutuRe management
appendIx 3 ChrIs Coll survey ltd June 2011 waIho bush bloCk appendIx 3 ChrIs Coll survey ltd June 2011 waIho bush bloCk
62 63 Waiho RiveR optimal FutuRe management Waiho RiveR optimal FutuRe management
appendIx 3 ChrIs Coll survey ltd June 2011 waIho bush bloCk
appEndix 4
reFerenCes
1 Influence of Channel Width on Bed Load Transport Capacity MA Carson and GA Griffith ASCE Journal of Hydraulic Engineering Vol 113 No 12 Dec 1987 (pp 1489 -1509)
2 Dam Break Flood Hazard from the Callery River Westland New Zealand TR Davies and BK Scott Journal of Hydrology (NZ) 36 (1) 1-13 (1997)
3 Natural Hazards Assessment for the Township of Franz Josef and its Environs MJ McSaveney TRH Davies IGNS Client Report 44714B10 (July 1998)
4 Peer Review of the Institute of Geological and Nuclear Sciences Ltd Report No 44714B10 (July 1998) Natural Hazards Assessment for the Township of Franz Josef and its Environs RJ Hall RJ Hall Civil amp Environmental Consulting Ltd (August 1998)
5 Evaluation of Options for the Management of the Waiho River Aggradation Threats RJ Hall et al (2000)6 Anthropogenic Fanhead Aggradation Waiho River Westland New Zealand TR Davies MJ McSaveney
Proceedings 5th International Gravel-bed Rivers Symposium Christchurch and Franz Josef (2000)7 The Transit New Zealand Waiho Workshop HL Rouse TJ Day TRH Davies Proceedings 5th International
Gravel-bed Rivers Symposium Christchurch and Franz Josef (2000)8 Landslide-dambreak Floods at Franz Josef Glacier Township Westland New Zealand a Risk Assessment TR Davies
Journal of Hydrology (NZ) Vol 41 No 1 (2002) 9 Anthropogenic Aggradation of the Waiho River Westland New Zealand TR Davies MJ McSaveney PJ
Clarkeson Earth Surfaces Processes and Landforms 28 209-218 (2003)10 How High are Bed Moving Flows in New Zealand Rivers B Clausen D Plew Journal of Hydrology (NZ) Vol 43 No
1 (2004)11 Geomorphic Constraints on the Management of Bed-load Dominated Rivers TR Davies MJ McSaveney Journal
of Hydrology (NZ) 45 (2) 69-88 (2006) 12 Geology of the Aoraki Area 1 250000 Geological Map 15 SC Cox DJA Barrell compilers IGNS (2007)13 West Coast Regional Council Waiho River Flood Protection Scheme Design Flood Levels Good Earth Matters Ltd
(2008)14 Preparing For Climate Change A Guide for Local Government in New Zealand Ministry for the Environment (2008)15 Waiho River Bed Surveys June 2008 and March 2011 Chris Coll Surveying Ltd (2011)16 Topographical Survey of the Waiho Bush Block Chris Coll Surveying Ltd (2011)17 Mean Bed Level Survey Record Waiho River SH 6 Bridge February 1997 ndash May 2011 Opus International Consultants
Ltd 18 WCRC Asset Management Plans for the Franz Josef Special Rating Area the Lower Waiho Rating District (December
2010)19 Video of Callery Fly Over 2011 Opus International Consultants Ltd (2011)20 Oblique Stills Callery Fly Over 2011 Department of Conservation Franz Josef (2011)21 WCRC Staff Aerial Inspection ndash Callery 6 September 2011 W Moen WCRC (7 September 2011)22 Planning for a Safer Franz Josef ndash Waiau Community Westland District Considering Rupture of the Alpine Fault
RM Langridge amp JG Beban GNS Science Consultancy Report 2011217 (September 2011)23 Callery River Landslide Dam Rapid Assessment of Dam Failure Consequences for West Coast Regional Council R
Measures M Duncan NIWA (September 2011)24 NIWA Flood Annual Flood Record and Annual Means Site 89301 Whataroa River at SH 6 1985 ndash 2011 NIWA (2011)25 Report on West Coast Weather Event 27 amp 28 December 2010 West Coast Regional Council report (2011)
64 65 Waiho RiveR optimal FutuRe management Waiho RiveR optimal FutuRe management
appendIx 4 referenCes
appEndix 5
tables
Cros
s se
ctio
n
thal
weg
dis
tanc
e ( m
)
Mbl
Jan-
02 (
rl m
)
Mbl
Jun-
08 (
rl m
)
Mbl
Mar
-11
( rl
m )
Chan
ge M
bl Ja
n 02
- Ju
ne 0
8 ( r
l m
)
Chan
ge M
bl Ju
ne 0
8 - M
ar
2011
( r
l m
)
rate
Cha
nge
Mbl
Jan
02 -
June
08
( m
yr )
rate
Cha
nge
Mbl
June
08
- M
ar 2
011
( m
yr
)
rati
o M
bl C
hang
e pe
r yr
2008
- 20
11 to
200
2 - 2
011
Chan
ge in
Vol
ume
( m
3 ) 20
02 -
2008
Chan
ge in
Vol
ume
( m
3 ) 20
02 -
2011
10 0 15305 15855 16039 551 184 0816 0689 08
11 209 15484 15572 157785 088 207 0131 0775 59 103269 68536
12 417 15308 15328 154969 020 169 0030 0632 212 21893 81442
13 821 15053 15043 15139 -010 097 -0015 0363 00 4656 129254
14 1113 14594 14656 14754 062 098 0092 0369 40 18638 70075
15 1377 14354 14387 14463 033 076 0049 0284 58 36017 68155
16 1795 13934 13963 14017 029 055 0043 0205 48 79237 159891
17 2268 13428 13452 13515 024 063 0035 0237 68 115310 261502
18 2740 12947 12918 12971 -029 053 -0043 0197 -45 -3499 247856
19 3158 12449 12484 12522 034 038 0051 0143 28 -54 147467
20 3923 11626 11678 11703 051 026 0076 0097 13 156610 134985
21 4618 10901 10932 10949 031 017 0045 0065 14 224717 123676
22 5418 10101 10104 10100 003 -005 0004 -0017 -40 613958 -560100
23 6114 9343 9504 9397 161 -108 0239 -0403 00 635880 -761619
2006631 171120
TABle 1 Waiho River at Franz Josef Mean Bed Level and Volumetric Changes Summary January 2002 ndash June 2008 and June 2008 ndash March 2011 River Bed Surveys
66 67 Waiho RiveR optimal FutuRe management Waiho RiveR optimal FutuRe management
appendIx 5 tables
recurrence interval t
(yrs)
Qpk(eV 1)
(cumec)
Qpk + 10(cumec)
Qpk + 15(cumec)
23 1230 1350 1400
5 1550 1700 1800
10 1640 1800 1900
20 1730 1900 2000
50 1820 2000 2100
100 1910 2100 2200
note Waiho River estimates derived from an EV 1 analysis of Whataroa River at SH 6 which were scaled by the area factor [A waiho A whataroa]⁰⁸
TABle 2 Flood Frequency Estimates for the Waiho River based on the Whataroa River at SH 6
appEndix 6
Figures
68 69 Waiho RiveR optimal FutuRe management Waiho RiveR optimal FutuRe management
appendIx 5 tables
appEndix 7
glossary oF terMs
active gully erosion Erosion that is presently occurring on the sides and floor of a gully during rainstorms which results in an expansion of the gully (viz depth width) and delivers sediment downstream into the main river system of which it is an integral part
aggradation The process whereby sands and gravels accumulate in a riverbed causing the bed level to riseaggrading Phase A term used to describe a period when aggradation is occurring in a river or on an active
alluvial fanalluvial Fan The fan shaped surface built up by a river over extended time where it exits in a confined reach
typically where a river emerges from a hill catchmentannual exceedence Probability The probability that an event (rainstorm flood) of a specific size will occur on
average in any one year (the mathematical reciprocal of the return period or recurrence interval for that event)
annual series Maxima A table comprising the highest flow recorded at a hydrometric site for each year of record and is used for determining the flood frequency characteristics of that site
antecedent rainfall That rainfall that occurs prior to the onset of a rainstorm and which pre-soaks the soil assisting in the development of runoff from the storm when it occurs
anthropogenic Something which has occurred or will occur as a result of human activity or influenceappurtenant structures A structure that is integrally required for the satisfactory performance of another
structure eg rock riprap stub groynes to provide protection to the riverside toe and batter of a stopbankaverage Water depth The water depth averaged over a cross section for a particular flowavulsion The sudden change in direction of a river that occurs as a result of a break out usually occurring during
a flood so that the river abandons its original course in favour of the new alignmentbedload dominated river A river in whose form has been sculptured by the erosion storage and transport of
gravel as bedloadbenchmark level The level referenced to a particular survey datum that is set on a permanent reference point
(bench mark) for survey purposesboils The localised appearance of water and fine soil particles such as sands and silts that occur where
concentrated seepage flows emerge at groundlinebraided river The description for a wide generally steep gravel bed river that has a multitude of interlacing
channelsCalibration run The running of an hydraulic model using selected known flows and water profiles in order to
determine what surface roughnessrsquos are required to obtain realistic model performanceCatchment Processes The physical processes operating within a catchment which influence the rate of runoff
and hence river flow during rainstormsChannel gradient The average slope of a channel reach measured along the flow path of the riverCross Fall The gradient that occurs on the bed of a river that runs at right angles to the primary down valley
gradient of the riverbedCrest settlement The lowering of the crest level of a stopbank caused by either settlement in the stopbank
foundation where weak materials are present or as a result of internal erosion of the stopbank or where liquefaction has occurred or through slumping caused by erosion of the stopbank or lateral spreading of the stopbank foundation as a result of earthquake action
Current Morphological status The present state that a river is in given that the rivers form tends to change over time in response to climatic and geological influences which can affect sediment supply catchment runoff and hence river flows channel gradient and sea level
dam break surges The waves of water and debris that move rapidly downstream from a debris dam when it fails
debris dams Obstructions that occur in confined river reaches from time to time and typically comprise rock regolith vegetation etc which obstruct the flow of water and cause it to dam
debris Flow A fluvial phenomena that can occur in steep channels usually as a result of intense rainfall on an already wet catchment the debris flow manifests as a slug or series of slugs of water and sediment travelling
DoCheRtY CReeK
1km 1mi
FRanZ JoSeF toWnShip
Canvans Knob
Franz Josef Stopbanks
Canavans Knob Stopbank
Rubbish Dump Stopbank
milton amp others Stopbank
State highway
State highway
Bridge
Sewerage ponds
nZta
WCRC
hokitika airport authority
Department of Conservation
Westland District Council
tartare gorge
Waiho loop
Rata Knoll
WAIHO RIVER
CalleRY RiveR
70 71 Waiho RiveR optimal FutuRe management Waiho RiveR optimal FutuRe management
appendIx 7 glossary of terms appendIx 7 glossary of terms
rapidly downstream as a dense slurry which may have incorporated within it woody debris such as tree trunks and branches
debris Flow activity The occurrence of debris flowsdebris traps Places within a catchments river system where sediment tends to accumulatedegradation The opposite process to aggradation whereby sands and gravels are eroded out of the riverbed
and the riverbed fallsdeflation of the bed The steady reduction in elevation of an eroding surface (river bed) over time under the
influence of surface erosion processesdesign Flood levels The maximum water level relative to a prescribed design datum set at a particular location
on a river required to contain the design flood carrying capacity of the river control systemdetritus The products of erosion that is delivered into a river system form the slopes where it has been generated
by weathering and erosion processesdistal end of an alluvial Fan The furthest end of an alluvial fan from the fan head and typically the lowest
elevation on the fan surface provided the fan has not been truncated by erosion by the river or by wave action on a lake or the sea
episodic Events that occur irregularly in timeFalling limb of a Hydrograph That part of the flood hydrograph after the peak where the flood recession
occursFlood Carrying Capacity An estimate of the peak flow in m3 per second that a river control system (can contain
without exceeding its freeboard where a river has stopbanks it is the flow contained within the stopbanks whilst maintaining the design freeboard
Flood Frequency estimates A statistical process for estimating the recurrence interval of various flood discharges for a particular hydrometric site using the annual maxima series for that site
Flood Peak The maximum flow reached by a river in flood measured in m3 per secondFlood Plain The surface over which a river can spread in times of flood once it overtops its natural banks Flood Volume The total volume of water delivered by a river in flood over the duration of the flood and measured
in m3 Fluvial Characteristics The characteristics of a river which describe the storage transport and reworking of river
sediments by the rivers flowsgeomorphic Constraints Physical factors such a rate of uplift hardness of basement rock present sea level
which limit for example the generation of sediment supply and gradient of a river and hence influence the form of a river
glacial internal drainage systems Subsurface watercourses located in and beneath a glacier that convey water from the surface and sides of a glacier into through and beneath a glacier and discharge to the valley floor at the glacier terminal face
glacier retreat The process whereby the terminal face of the glacier is located progressively up the valley as the glacier ice volume is reduced by ablation
Headcut The formation of an erosion cusp in a channel that results in a localised step in a channel bedHeadward erosion The erosion that generates and maintains the headward movement of the erosion cusp
(headcut)Hydraulic Characteristics The flow characteristics of a river system such as flow depth water velocity channel
surface roughness and channel slope (gradient)Hydraulic gradient The slope on a flowing water surfaceHydrometric site A water level measuring site which continuously measures and records water depth at the site
at specific time intervals used for establishing flow records over the full range from low to high flow landslide dam A dam that forms in a confined reach of a river as a result of landslide occurring and partially
blocking the valley through which the river is flowinglateral bank erosion The processes whereby a river erodes its banks generally used with reference to the
erosion of stopbanks when a river moves side ways in a flood eroding the stopbank in the process on the riverside of the stopbank
liquefaction The sudden loss of strength of an unconsolidated or poorly consolidated saturated fine sand soil induced by violent earthquake shaking
lithologies A geological term used for describing rock typeslive bed Conditions The condition that may occur in a riverbed in flood when the deposits which form the
riverbed and banks begin to mobilise and become entrained in the flow and move downstreamMass Movement The downslope movement of regolith and other erosion products in bulk eg slab avalanches
landslides debris flows
Mean bed level The average level of a riverbed across a particular cross section at a particular time estimated from a surveyed cross section at a particular time
Micro scale Modeling The development and running of a small scale physical replica of a particular physical feature such as an active alluvial fan in a laboratory situation
Morphologically active alluvial Fan An alluvial fan that is either aggrading or degrading under its present sediment and water supply and under the influence of local morphological constraints
natural Hazards Any atmospheric or earth or water related occurrence (in the Waiho River context including earthquake erosion landslip Subsidence sedimentation wind drought or flooding) the actions of which adversely affects or may affect human life property or other aspects of the environment
overtopping The term used to describe the situation where floodwaters in a river in flood begin to spill over the rivers banks or stopbanks whichever is relevant to the particular situation being considered
Permeability A term used to describe and quantify that property of a soil that permits water to flow through the pores of the soil under a hydraulic gradient
Pheratic surface The curvilinear water surface within the soils of a stopbank or dam through which water is seeping marking the boundary between saturated and un-saturated soils
Predictive tool A procedure such as a hydraulic model that is developed in order to try and determine how a particular physical situation might develop over time under specified inputs (eg water bedload supply)
Prograding The episodic growth of an alluvial fan surface which causes the distal end of the fan to extend downstream away from the fan head
recession That period during a flood when the river has passed its peak and water levels and hence flow rates are dropping
recurrence interval A statistical term used to describe the relative size of an event (synonymous with the term average return period) eg a particular rainfall depth or flood flow A 1 in 100 year flood has a recurrence interval of 100 years on average It does not mean that an hundred year flood will not occur again for 100 years if an event of that size has just been experienced
regolith The accumulation of soil material on a hill slope as a result of the weathering of the hill slope over time Typically regolith includes clay and sand size particles rock fragments and soil
regolith avalanches The localised movement of regolith rapidly off a hill slope onto the valley floor or riverbed in the form of an avalanche
residence time The time that elapses for example between bed load sediments accumulating at a particular location and subsequently being eroded out
revegetation The decolonization with new vegetation on areas such as slopes denuded of vegetation by landslides
river bed roughness A hydraulic term which reflects the relative roughness of the surface of a riverbed or its berms that is used in hydraulic computations
river Cross sections A survey of ground levels extending across a river from its true left bank to its true right bank aligned more or less at right angles to the rivers flow in times of flood
river reach A description for a particular stretch of a riverriver training and Protection Works Structures erected by humans in an attempt to mitigate against riverbank
erosion and channel migration during floodsrelaxation Removing the boundary constrains on a stopbanked river to allow the river to reassert its natural
form on the floodplain unimpeded by man made flood containment structuresrock rip rap A term used to describe the coarse hard rock that is placed against a surface that may be eroded
by river flows in order to mitigate against such erosion sediment sources Those parts of a river catchment that supply sediment to the river as sediment supplysediment supply The sediment that passes through a river system typically of an episodic nature ie the rate of
supply varying over time typically in response to climatic conditions and river flowseismic induced Mass Movement Landslide activity caused by seismic activityshallow slab avalanches Landslides that typically occur on steep valley sides where the basement rock is close
to the surface (eg within 1 to 2 metres of the surface)sinusoidal braided Flow PatternsTheldquoSrdquoshapedchannelinducedflowpatternsobservedinbraidedriversspecial rating district A Rating District established for the construction and ongoing repair and maintenance
of a river control scheme the rating district is administered by the West Coast Regional Councilsplinter Faults Fault lines that extend out at an angle from a main fault linespur groynes Short groynes that are constructed at the toe of a natural river bank or stopbank that project out
into the riverbed designed to ease high flow velocities of the natural bank or stopbank toe in order to lessen the risk of lateral erosion by the river in flood
72 73 Waiho RiveR optimal FutuRe management Waiho RiveR optimal FutuRe management
appendIx 7 glossary of terms
stopbank A structure erected on a rivers floodplain typically sub-parallel to the rivers flow in times of flood to contain flood flows up to the design standard of the flood protection scheme to prevent them from spilling onto the floodplain
sub-alpine vegetation Typically shrubby bushes grasses and stunted trees that grow above the bush line but below the sparsely vegetated alpine area of a mountain range
sub ndash Parallel More or less parallelsuper-elevation effect The local elevation of water levels around the outside of a bend in a river caused by
centrifugal forces generated by the water moving around the river bendswale The remnant of a river channel on a riversrsquo floodplain that has been etched by river flows in the past and
has subsequently been abandoned by the normal flow of the river but can activate when rivers overtop their natural banks and flow onto the flood plain they may also convey surface runoff from local rainstorms from time to time
temporal supply Mechanism A process that generates sediment supply to the river system and is time dependent
thalweg The centreline path the active riverbed takes as it flows down plainthreshold Flood event A flood event of sufficient size that it overtops a rivers confining banks natural or man
made transfer reach That part of a mountain catchment located in the foothill area upstream of the head (or apex)
of an alluvial fan generally a gorge or narrow confined reach with little opportunity for coarse sediment storage coarse sediments tend to flush through these reaches during floods rather than accumulate as they might on the fan surface proper
two dimensional Hydraulic Model A computer model that incorporates a digital terrain model to provide the basis for determining water depths and velocities over that surface for a particular design flood flow
Wasting out The eroding out of deposits over time
74 Waiho RiveR optimal FutuRe management
388 Main South Road PO Box 66 Greymouth
phone +64 3 768 0466
email infowcrcgovtnz
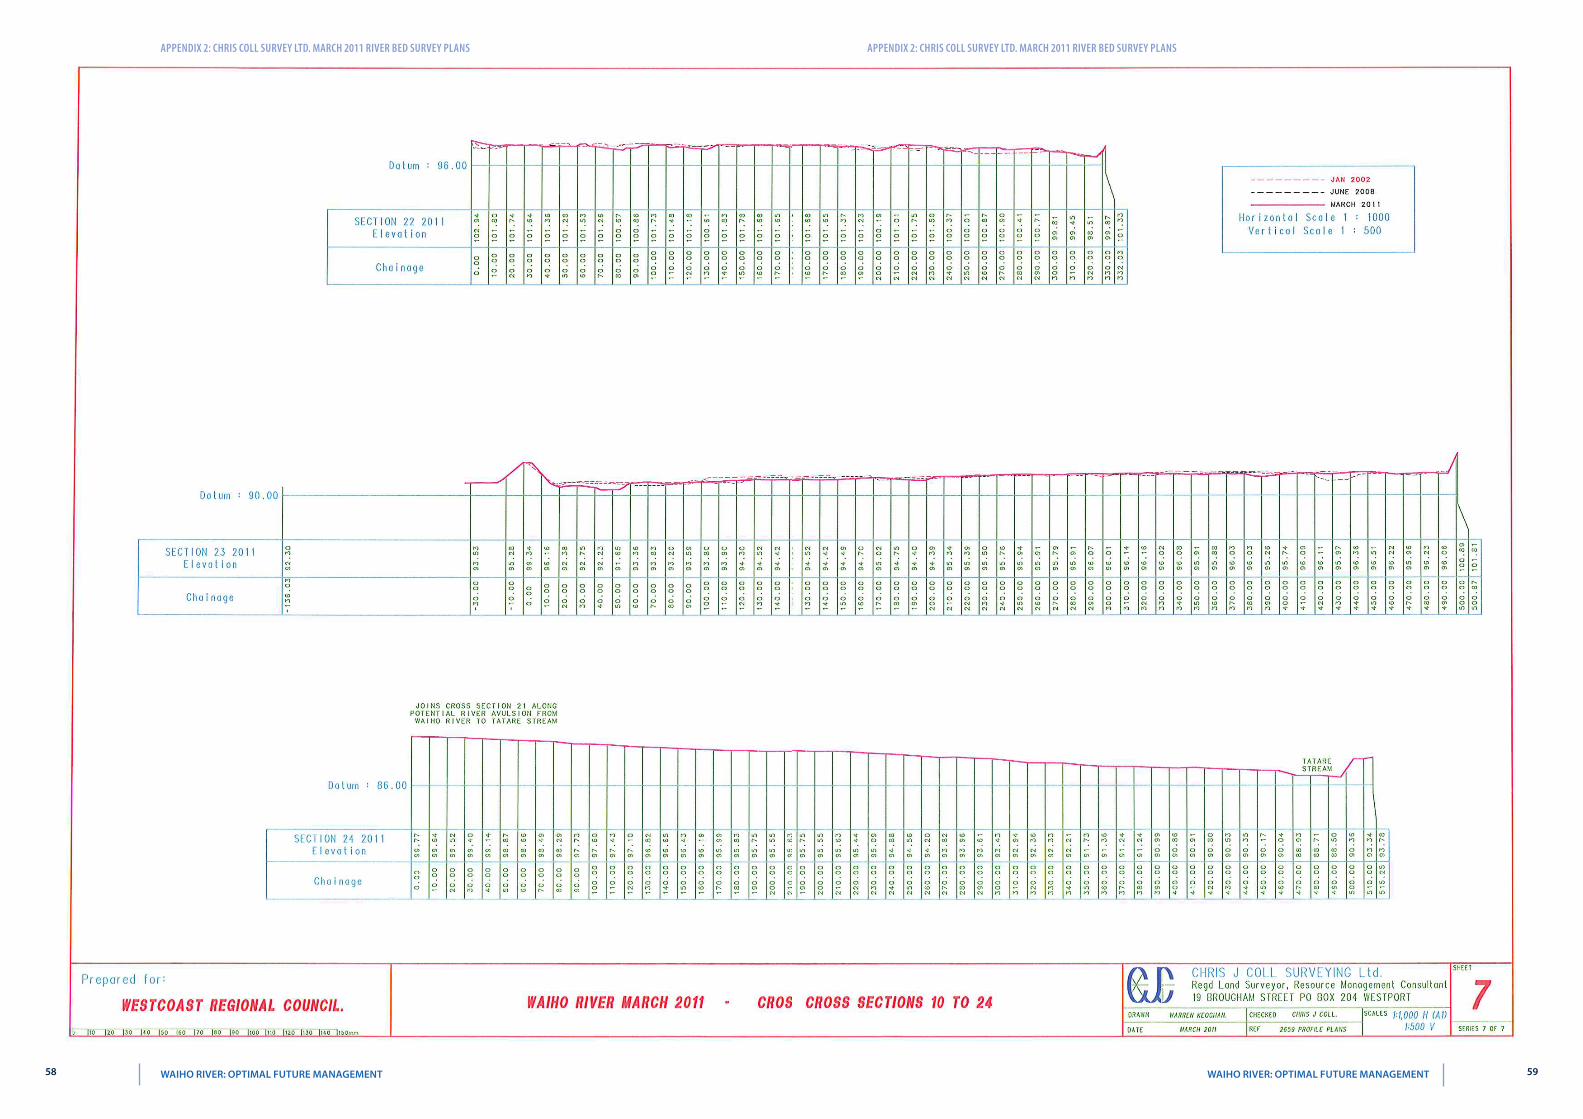
appendIx 2 ChrIs Coll survey ltd marCh 2011 rIver bed survey plans appendIx 2 ChrIs Coll survey ltd marCh 2011 rIver bed survey plans
58 59 Waiho RiveR optimal FutuRe management Waiho RiveR optimal FutuRe management
appendIx 2 ChrIs Coll survey ltd marCh 2011 rIver bed survey plans
appEndix 3
CHris Coll surVey ltd June 2011 WaiHo busH bloCk
60 61 Waiho RiveR optimal FutuRe management Waiho RiveR optimal FutuRe management
appendIx 3 ChrIs Coll survey ltd June 2011 waIho bush bloCk appendIx 3 ChrIs Coll survey ltd June 2011 waIho bush bloCk
62 63 Waiho RiveR optimal FutuRe management Waiho RiveR optimal FutuRe management
appendIx 3 ChrIs Coll survey ltd June 2011 waIho bush bloCk
appEndix 4
reFerenCes
1 Influence of Channel Width on Bed Load Transport Capacity MA Carson and GA Griffith ASCE Journal of Hydraulic Engineering Vol 113 No 12 Dec 1987 (pp 1489 -1509)
2 Dam Break Flood Hazard from the Callery River Westland New Zealand TR Davies and BK Scott Journal of Hydrology (NZ) 36 (1) 1-13 (1997)
3 Natural Hazards Assessment for the Township of Franz Josef and its Environs MJ McSaveney TRH Davies IGNS Client Report 44714B10 (July 1998)
4 Peer Review of the Institute of Geological and Nuclear Sciences Ltd Report No 44714B10 (July 1998) Natural Hazards Assessment for the Township of Franz Josef and its Environs RJ Hall RJ Hall Civil amp Environmental Consulting Ltd (August 1998)
5 Evaluation of Options for the Management of the Waiho River Aggradation Threats RJ Hall et al (2000)6 Anthropogenic Fanhead Aggradation Waiho River Westland New Zealand TR Davies MJ McSaveney
Proceedings 5th International Gravel-bed Rivers Symposium Christchurch and Franz Josef (2000)7 The Transit New Zealand Waiho Workshop HL Rouse TJ Day TRH Davies Proceedings 5th International
Gravel-bed Rivers Symposium Christchurch and Franz Josef (2000)8 Landslide-dambreak Floods at Franz Josef Glacier Township Westland New Zealand a Risk Assessment TR Davies
Journal of Hydrology (NZ) Vol 41 No 1 (2002) 9 Anthropogenic Aggradation of the Waiho River Westland New Zealand TR Davies MJ McSaveney PJ
Clarkeson Earth Surfaces Processes and Landforms 28 209-218 (2003)10 How High are Bed Moving Flows in New Zealand Rivers B Clausen D Plew Journal of Hydrology (NZ) Vol 43 No
1 (2004)11 Geomorphic Constraints on the Management of Bed-load Dominated Rivers TR Davies MJ McSaveney Journal
of Hydrology (NZ) 45 (2) 69-88 (2006) 12 Geology of the Aoraki Area 1 250000 Geological Map 15 SC Cox DJA Barrell compilers IGNS (2007)13 West Coast Regional Council Waiho River Flood Protection Scheme Design Flood Levels Good Earth Matters Ltd
(2008)14 Preparing For Climate Change A Guide for Local Government in New Zealand Ministry for the Environment (2008)15 Waiho River Bed Surveys June 2008 and March 2011 Chris Coll Surveying Ltd (2011)16 Topographical Survey of the Waiho Bush Block Chris Coll Surveying Ltd (2011)17 Mean Bed Level Survey Record Waiho River SH 6 Bridge February 1997 ndash May 2011 Opus International Consultants
Ltd 18 WCRC Asset Management Plans for the Franz Josef Special Rating Area the Lower Waiho Rating District (December
2010)19 Video of Callery Fly Over 2011 Opus International Consultants Ltd (2011)20 Oblique Stills Callery Fly Over 2011 Department of Conservation Franz Josef (2011)21 WCRC Staff Aerial Inspection ndash Callery 6 September 2011 W Moen WCRC (7 September 2011)22 Planning for a Safer Franz Josef ndash Waiau Community Westland District Considering Rupture of the Alpine Fault
RM Langridge amp JG Beban GNS Science Consultancy Report 2011217 (September 2011)23 Callery River Landslide Dam Rapid Assessment of Dam Failure Consequences for West Coast Regional Council R
Measures M Duncan NIWA (September 2011)24 NIWA Flood Annual Flood Record and Annual Means Site 89301 Whataroa River at SH 6 1985 ndash 2011 NIWA (2011)25 Report on West Coast Weather Event 27 amp 28 December 2010 West Coast Regional Council report (2011)
64 65 Waiho RiveR optimal FutuRe management Waiho RiveR optimal FutuRe management
appendIx 4 referenCes
appEndix 5
tables
Cros
s se
ctio
n
thal
weg
dis
tanc
e ( m
)
Mbl
Jan-
02 (
rl m
)
Mbl
Jun-
08 (
rl m
)
Mbl
Mar
-11
( rl
m )
Chan
ge M
bl Ja
n 02
- Ju
ne 0
8 ( r
l m
)
Chan
ge M
bl Ju
ne 0
8 - M
ar
2011
( r
l m
)
rate
Cha
nge
Mbl
Jan
02 -
June
08
( m
yr )
rate
Cha
nge
Mbl
June
08
- M
ar 2
011
( m
yr
)
rati
o M
bl C
hang
e pe
r yr
2008
- 20
11 to
200
2 - 2
011
Chan
ge in
Vol
ume
( m
3 ) 20
02 -
2008
Chan
ge in
Vol
ume
( m
3 ) 20
02 -
2011
10 0 15305 15855 16039 551 184 0816 0689 08
11 209 15484 15572 157785 088 207 0131 0775 59 103269 68536
12 417 15308 15328 154969 020 169 0030 0632 212 21893 81442
13 821 15053 15043 15139 -010 097 -0015 0363 00 4656 129254
14 1113 14594 14656 14754 062 098 0092 0369 40 18638 70075
15 1377 14354 14387 14463 033 076 0049 0284 58 36017 68155
16 1795 13934 13963 14017 029 055 0043 0205 48 79237 159891
17 2268 13428 13452 13515 024 063 0035 0237 68 115310 261502
18 2740 12947 12918 12971 -029 053 -0043 0197 -45 -3499 247856
19 3158 12449 12484 12522 034 038 0051 0143 28 -54 147467
20 3923 11626 11678 11703 051 026 0076 0097 13 156610 134985
21 4618 10901 10932 10949 031 017 0045 0065 14 224717 123676
22 5418 10101 10104 10100 003 -005 0004 -0017 -40 613958 -560100
23 6114 9343 9504 9397 161 -108 0239 -0403 00 635880 -761619
2006631 171120
TABle 1 Waiho River at Franz Josef Mean Bed Level and Volumetric Changes Summary January 2002 ndash June 2008 and June 2008 ndash March 2011 River Bed Surveys
66 67 Waiho RiveR optimal FutuRe management Waiho RiveR optimal FutuRe management
appendIx 5 tables
recurrence interval t
(yrs)
Qpk(eV 1)
(cumec)
Qpk + 10(cumec)
Qpk + 15(cumec)
23 1230 1350 1400
5 1550 1700 1800
10 1640 1800 1900
20 1730 1900 2000
50 1820 2000 2100
100 1910 2100 2200
note Waiho River estimates derived from an EV 1 analysis of Whataroa River at SH 6 which were scaled by the area factor [A waiho A whataroa]⁰⁸
TABle 2 Flood Frequency Estimates for the Waiho River based on the Whataroa River at SH 6
appEndix 6
Figures
68 69 Waiho RiveR optimal FutuRe management Waiho RiveR optimal FutuRe management
appendIx 5 tables
appEndix 7
glossary oF terMs
active gully erosion Erosion that is presently occurring on the sides and floor of a gully during rainstorms which results in an expansion of the gully (viz depth width) and delivers sediment downstream into the main river system of which it is an integral part
aggradation The process whereby sands and gravels accumulate in a riverbed causing the bed level to riseaggrading Phase A term used to describe a period when aggradation is occurring in a river or on an active
alluvial fanalluvial Fan The fan shaped surface built up by a river over extended time where it exits in a confined reach
typically where a river emerges from a hill catchmentannual exceedence Probability The probability that an event (rainstorm flood) of a specific size will occur on
average in any one year (the mathematical reciprocal of the return period or recurrence interval for that event)
annual series Maxima A table comprising the highest flow recorded at a hydrometric site for each year of record and is used for determining the flood frequency characteristics of that site
antecedent rainfall That rainfall that occurs prior to the onset of a rainstorm and which pre-soaks the soil assisting in the development of runoff from the storm when it occurs
anthropogenic Something which has occurred or will occur as a result of human activity or influenceappurtenant structures A structure that is integrally required for the satisfactory performance of another
structure eg rock riprap stub groynes to provide protection to the riverside toe and batter of a stopbankaverage Water depth The water depth averaged over a cross section for a particular flowavulsion The sudden change in direction of a river that occurs as a result of a break out usually occurring during
a flood so that the river abandons its original course in favour of the new alignmentbedload dominated river A river in whose form has been sculptured by the erosion storage and transport of
gravel as bedloadbenchmark level The level referenced to a particular survey datum that is set on a permanent reference point
(bench mark) for survey purposesboils The localised appearance of water and fine soil particles such as sands and silts that occur where
concentrated seepage flows emerge at groundlinebraided river The description for a wide generally steep gravel bed river that has a multitude of interlacing
channelsCalibration run The running of an hydraulic model using selected known flows and water profiles in order to
determine what surface roughnessrsquos are required to obtain realistic model performanceCatchment Processes The physical processes operating within a catchment which influence the rate of runoff
and hence river flow during rainstormsChannel gradient The average slope of a channel reach measured along the flow path of the riverCross Fall The gradient that occurs on the bed of a river that runs at right angles to the primary down valley
gradient of the riverbedCrest settlement The lowering of the crest level of a stopbank caused by either settlement in the stopbank
foundation where weak materials are present or as a result of internal erosion of the stopbank or where liquefaction has occurred or through slumping caused by erosion of the stopbank or lateral spreading of the stopbank foundation as a result of earthquake action
Current Morphological status The present state that a river is in given that the rivers form tends to change over time in response to climatic and geological influences which can affect sediment supply catchment runoff and hence river flows channel gradient and sea level
dam break surges The waves of water and debris that move rapidly downstream from a debris dam when it fails
debris dams Obstructions that occur in confined river reaches from time to time and typically comprise rock regolith vegetation etc which obstruct the flow of water and cause it to dam
debris Flow A fluvial phenomena that can occur in steep channels usually as a result of intense rainfall on an already wet catchment the debris flow manifests as a slug or series of slugs of water and sediment travelling
DoCheRtY CReeK
1km 1mi
FRanZ JoSeF toWnShip
Canvans Knob
Franz Josef Stopbanks
Canavans Knob Stopbank
Rubbish Dump Stopbank
milton amp others Stopbank
State highway
State highway
Bridge
Sewerage ponds
nZta
WCRC
hokitika airport authority
Department of Conservation
Westland District Council
tartare gorge
Waiho loop
Rata Knoll
WAIHO RIVER
CalleRY RiveR
70 71 Waiho RiveR optimal FutuRe management Waiho RiveR optimal FutuRe management
appendIx 7 glossary of terms appendIx 7 glossary of terms
rapidly downstream as a dense slurry which may have incorporated within it woody debris such as tree trunks and branches
debris Flow activity The occurrence of debris flowsdebris traps Places within a catchments river system where sediment tends to accumulatedegradation The opposite process to aggradation whereby sands and gravels are eroded out of the riverbed
and the riverbed fallsdeflation of the bed The steady reduction in elevation of an eroding surface (river bed) over time under the
influence of surface erosion processesdesign Flood levels The maximum water level relative to a prescribed design datum set at a particular location
on a river required to contain the design flood carrying capacity of the river control systemdetritus The products of erosion that is delivered into a river system form the slopes where it has been generated
by weathering and erosion processesdistal end of an alluvial Fan The furthest end of an alluvial fan from the fan head and typically the lowest
elevation on the fan surface provided the fan has not been truncated by erosion by the river or by wave action on a lake or the sea
episodic Events that occur irregularly in timeFalling limb of a Hydrograph That part of the flood hydrograph after the peak where the flood recession
occursFlood Carrying Capacity An estimate of the peak flow in m3 per second that a river control system (can contain
without exceeding its freeboard where a river has stopbanks it is the flow contained within the stopbanks whilst maintaining the design freeboard
Flood Frequency estimates A statistical process for estimating the recurrence interval of various flood discharges for a particular hydrometric site using the annual maxima series for that site
Flood Peak The maximum flow reached by a river in flood measured in m3 per secondFlood Plain The surface over which a river can spread in times of flood once it overtops its natural banks Flood Volume The total volume of water delivered by a river in flood over the duration of the flood and measured
in m3 Fluvial Characteristics The characteristics of a river which describe the storage transport and reworking of river
sediments by the rivers flowsgeomorphic Constraints Physical factors such a rate of uplift hardness of basement rock present sea level
which limit for example the generation of sediment supply and gradient of a river and hence influence the form of a river
glacial internal drainage systems Subsurface watercourses located in and beneath a glacier that convey water from the surface and sides of a glacier into through and beneath a glacier and discharge to the valley floor at the glacier terminal face
glacier retreat The process whereby the terminal face of the glacier is located progressively up the valley as the glacier ice volume is reduced by ablation
Headcut The formation of an erosion cusp in a channel that results in a localised step in a channel bedHeadward erosion The erosion that generates and maintains the headward movement of the erosion cusp
(headcut)Hydraulic Characteristics The flow characteristics of a river system such as flow depth water velocity channel
surface roughness and channel slope (gradient)Hydraulic gradient The slope on a flowing water surfaceHydrometric site A water level measuring site which continuously measures and records water depth at the site
at specific time intervals used for establishing flow records over the full range from low to high flow landslide dam A dam that forms in a confined reach of a river as a result of landslide occurring and partially
blocking the valley through which the river is flowinglateral bank erosion The processes whereby a river erodes its banks generally used with reference to the
erosion of stopbanks when a river moves side ways in a flood eroding the stopbank in the process on the riverside of the stopbank
liquefaction The sudden loss of strength of an unconsolidated or poorly consolidated saturated fine sand soil induced by violent earthquake shaking
lithologies A geological term used for describing rock typeslive bed Conditions The condition that may occur in a riverbed in flood when the deposits which form the
riverbed and banks begin to mobilise and become entrained in the flow and move downstreamMass Movement The downslope movement of regolith and other erosion products in bulk eg slab avalanches
landslides debris flows
Mean bed level The average level of a riverbed across a particular cross section at a particular time estimated from a surveyed cross section at a particular time
Micro scale Modeling The development and running of a small scale physical replica of a particular physical feature such as an active alluvial fan in a laboratory situation
Morphologically active alluvial Fan An alluvial fan that is either aggrading or degrading under its present sediment and water supply and under the influence of local morphological constraints
natural Hazards Any atmospheric or earth or water related occurrence (in the Waiho River context including earthquake erosion landslip Subsidence sedimentation wind drought or flooding) the actions of which adversely affects or may affect human life property or other aspects of the environment
overtopping The term used to describe the situation where floodwaters in a river in flood begin to spill over the rivers banks or stopbanks whichever is relevant to the particular situation being considered
Permeability A term used to describe and quantify that property of a soil that permits water to flow through the pores of the soil under a hydraulic gradient
Pheratic surface The curvilinear water surface within the soils of a stopbank or dam through which water is seeping marking the boundary between saturated and un-saturated soils
Predictive tool A procedure such as a hydraulic model that is developed in order to try and determine how a particular physical situation might develop over time under specified inputs (eg water bedload supply)
Prograding The episodic growth of an alluvial fan surface which causes the distal end of the fan to extend downstream away from the fan head
recession That period during a flood when the river has passed its peak and water levels and hence flow rates are dropping
recurrence interval A statistical term used to describe the relative size of an event (synonymous with the term average return period) eg a particular rainfall depth or flood flow A 1 in 100 year flood has a recurrence interval of 100 years on average It does not mean that an hundred year flood will not occur again for 100 years if an event of that size has just been experienced
regolith The accumulation of soil material on a hill slope as a result of the weathering of the hill slope over time Typically regolith includes clay and sand size particles rock fragments and soil
regolith avalanches The localised movement of regolith rapidly off a hill slope onto the valley floor or riverbed in the form of an avalanche
residence time The time that elapses for example between bed load sediments accumulating at a particular location and subsequently being eroded out
revegetation The decolonization with new vegetation on areas such as slopes denuded of vegetation by landslides
river bed roughness A hydraulic term which reflects the relative roughness of the surface of a riverbed or its berms that is used in hydraulic computations
river Cross sections A survey of ground levels extending across a river from its true left bank to its true right bank aligned more or less at right angles to the rivers flow in times of flood
river reach A description for a particular stretch of a riverriver training and Protection Works Structures erected by humans in an attempt to mitigate against riverbank
erosion and channel migration during floodsrelaxation Removing the boundary constrains on a stopbanked river to allow the river to reassert its natural
form on the floodplain unimpeded by man made flood containment structuresrock rip rap A term used to describe the coarse hard rock that is placed against a surface that may be eroded
by river flows in order to mitigate against such erosion sediment sources Those parts of a river catchment that supply sediment to the river as sediment supplysediment supply The sediment that passes through a river system typically of an episodic nature ie the rate of
supply varying over time typically in response to climatic conditions and river flowseismic induced Mass Movement Landslide activity caused by seismic activityshallow slab avalanches Landslides that typically occur on steep valley sides where the basement rock is close
to the surface (eg within 1 to 2 metres of the surface)sinusoidal braided Flow PatternsTheldquoSrdquoshapedchannelinducedflowpatternsobservedinbraidedriversspecial rating district A Rating District established for the construction and ongoing repair and maintenance
of a river control scheme the rating district is administered by the West Coast Regional Councilsplinter Faults Fault lines that extend out at an angle from a main fault linespur groynes Short groynes that are constructed at the toe of a natural river bank or stopbank that project out
into the riverbed designed to ease high flow velocities of the natural bank or stopbank toe in order to lessen the risk of lateral erosion by the river in flood
72 73 Waiho RiveR optimal FutuRe management Waiho RiveR optimal FutuRe management
appendIx 7 glossary of terms
stopbank A structure erected on a rivers floodplain typically sub-parallel to the rivers flow in times of flood to contain flood flows up to the design standard of the flood protection scheme to prevent them from spilling onto the floodplain
sub-alpine vegetation Typically shrubby bushes grasses and stunted trees that grow above the bush line but below the sparsely vegetated alpine area of a mountain range
sub ndash Parallel More or less parallelsuper-elevation effect The local elevation of water levels around the outside of a bend in a river caused by
centrifugal forces generated by the water moving around the river bendswale The remnant of a river channel on a riversrsquo floodplain that has been etched by river flows in the past and
has subsequently been abandoned by the normal flow of the river but can activate when rivers overtop their natural banks and flow onto the flood plain they may also convey surface runoff from local rainstorms from time to time
temporal supply Mechanism A process that generates sediment supply to the river system and is time dependent
thalweg The centreline path the active riverbed takes as it flows down plainthreshold Flood event A flood event of sufficient size that it overtops a rivers confining banks natural or man
made transfer reach That part of a mountain catchment located in the foothill area upstream of the head (or apex)
of an alluvial fan generally a gorge or narrow confined reach with little opportunity for coarse sediment storage coarse sediments tend to flush through these reaches during floods rather than accumulate as they might on the fan surface proper
two dimensional Hydraulic Model A computer model that incorporates a digital terrain model to provide the basis for determining water depths and velocities over that surface for a particular design flood flow
Wasting out The eroding out of deposits over time
74 Waiho RiveR optimal FutuRe management
388 Main South Road PO Box 66 Greymouth
phone +64 3 768 0466
email infowcrcgovtnz
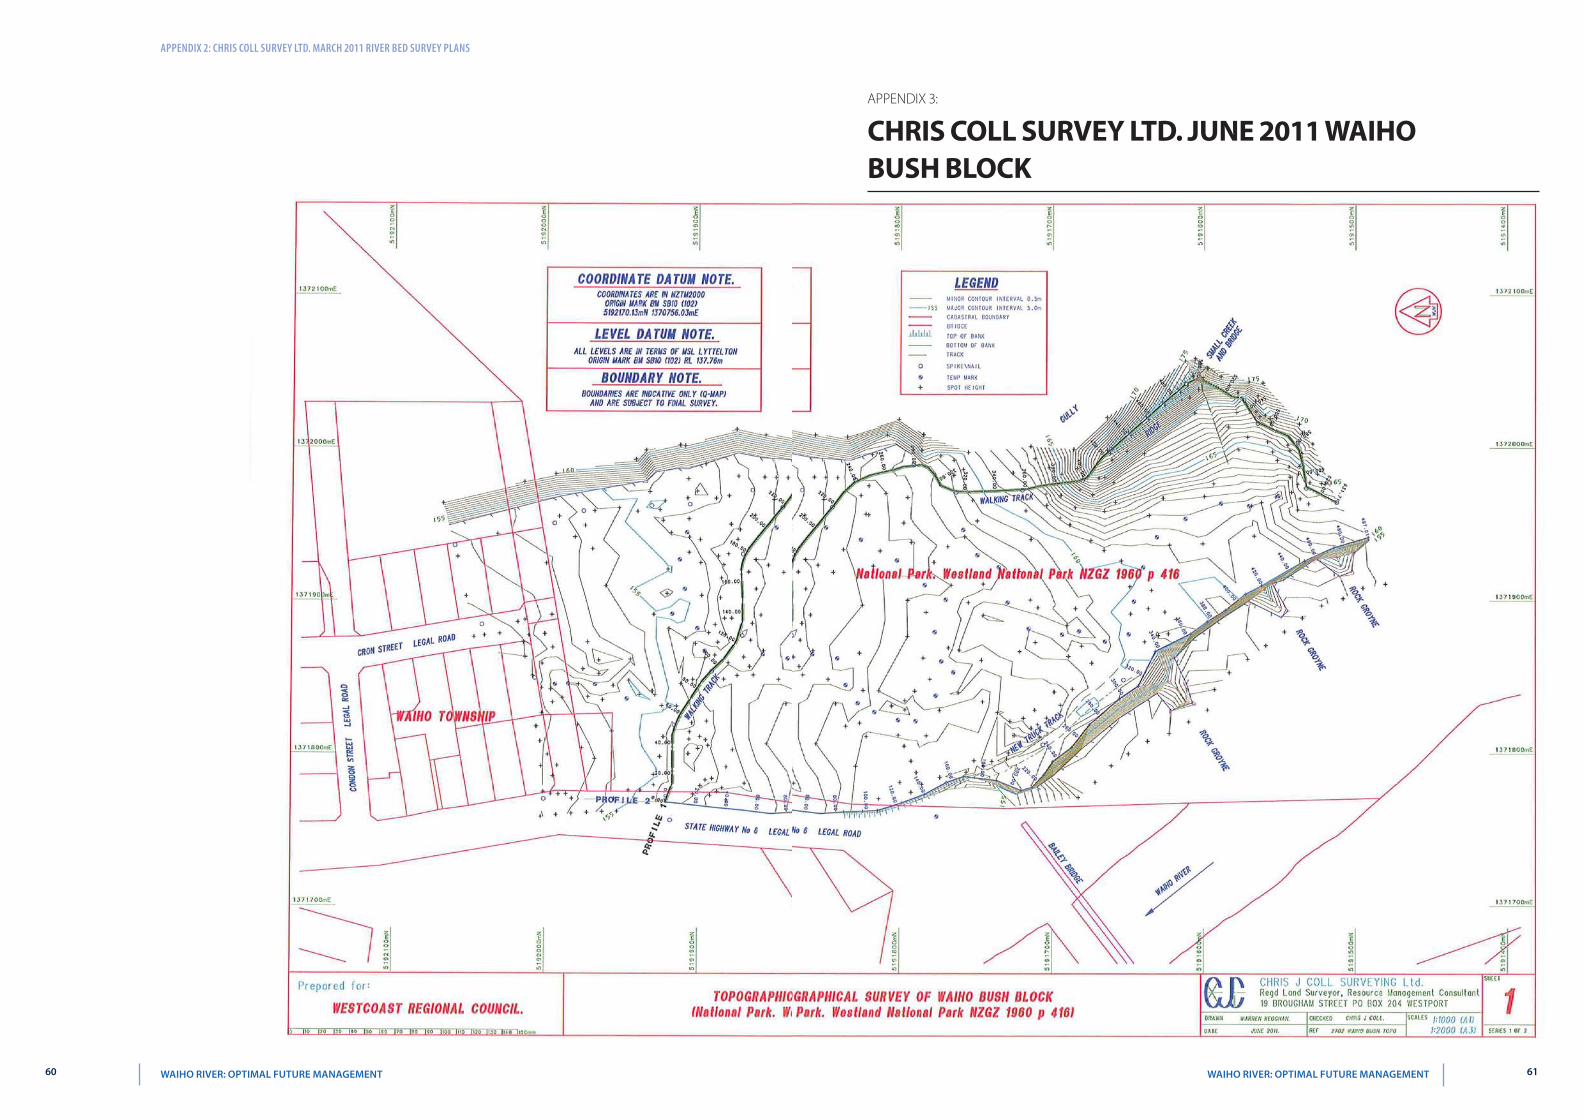
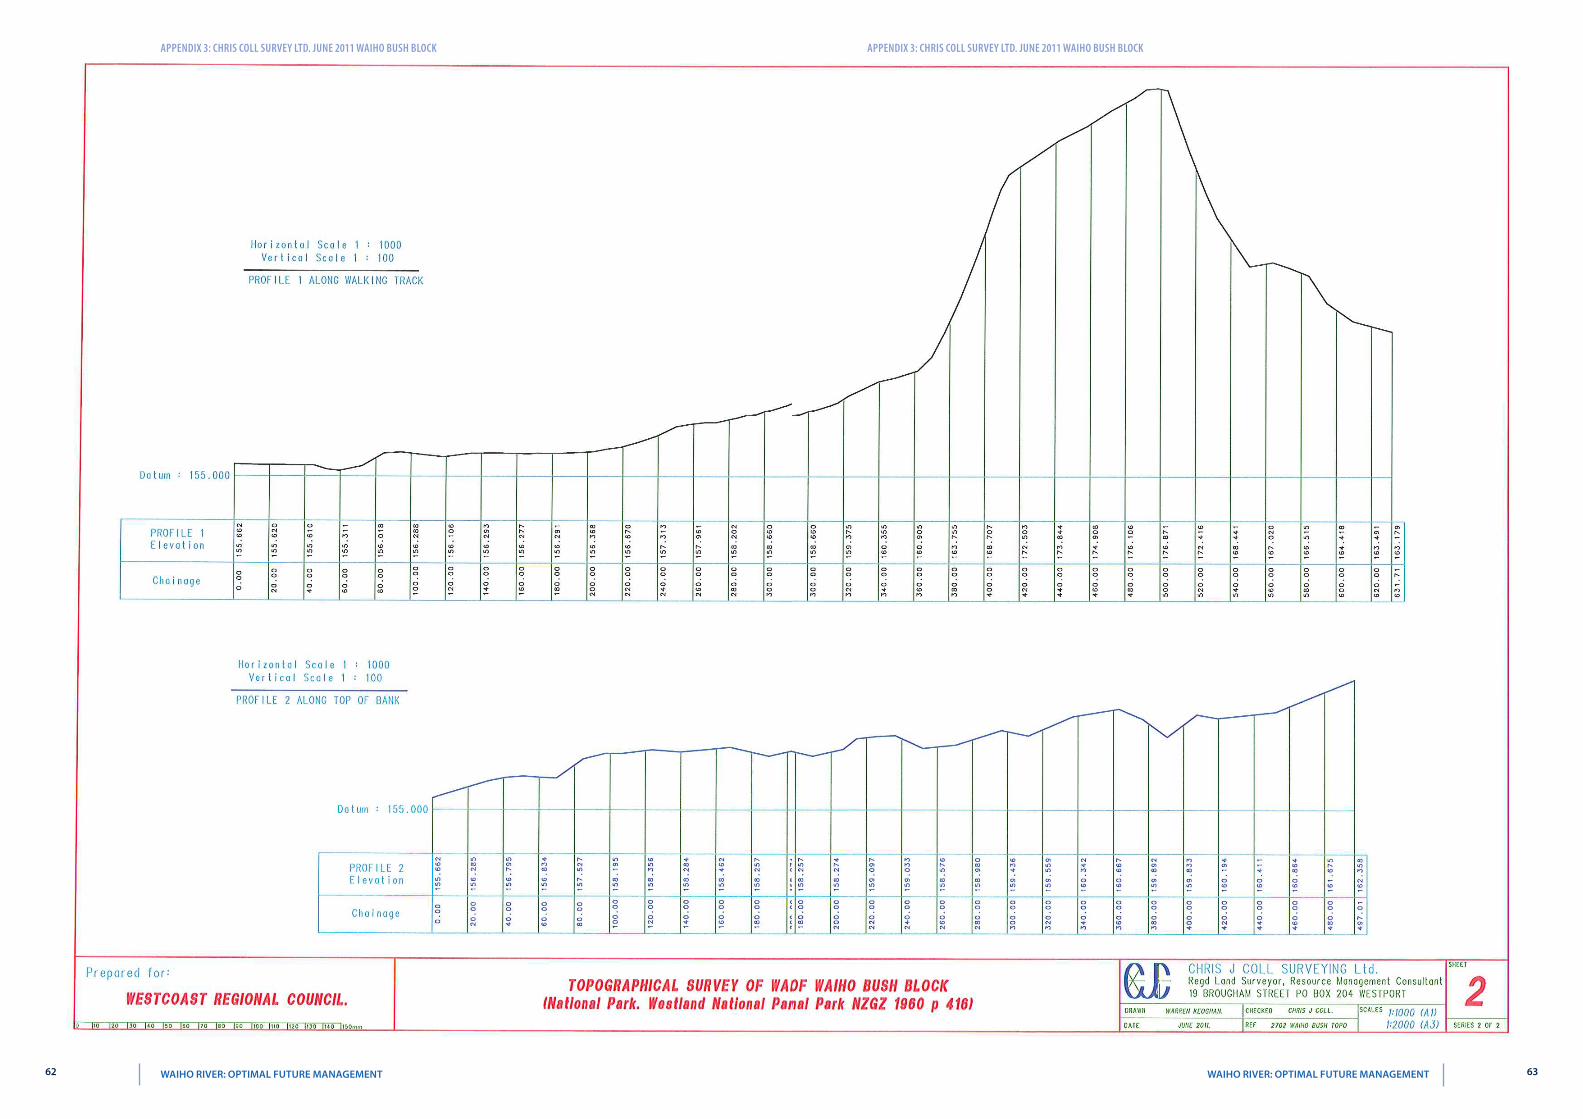
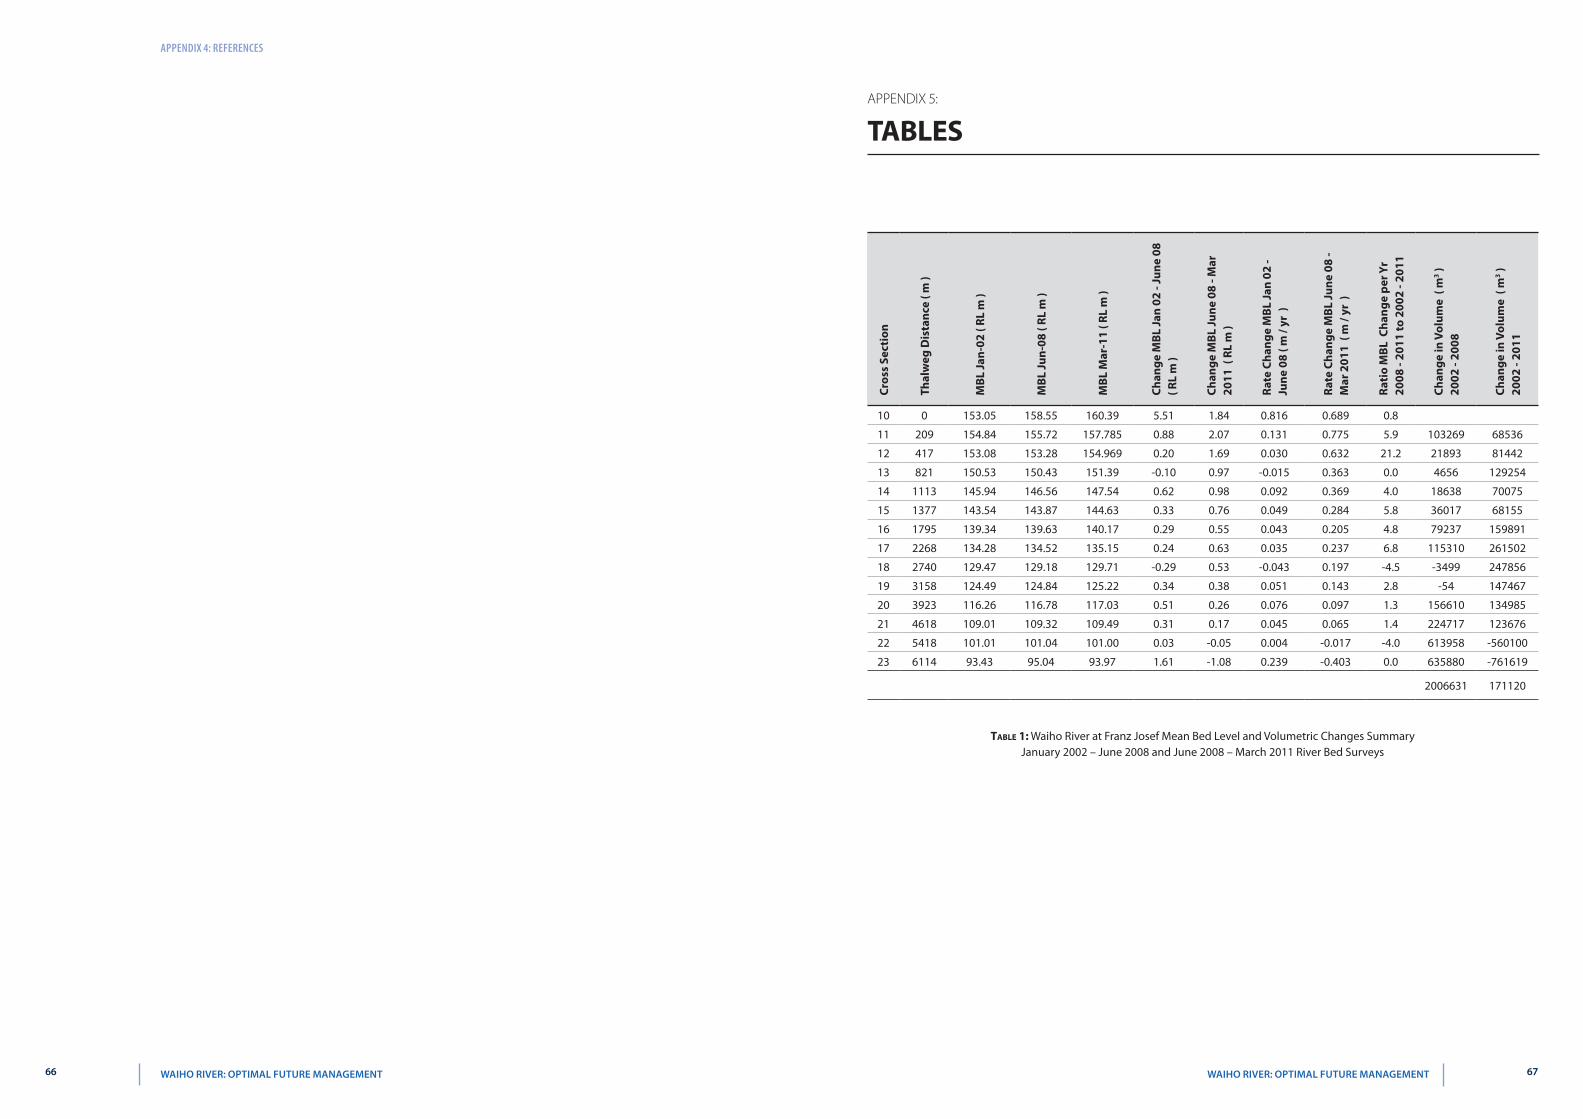
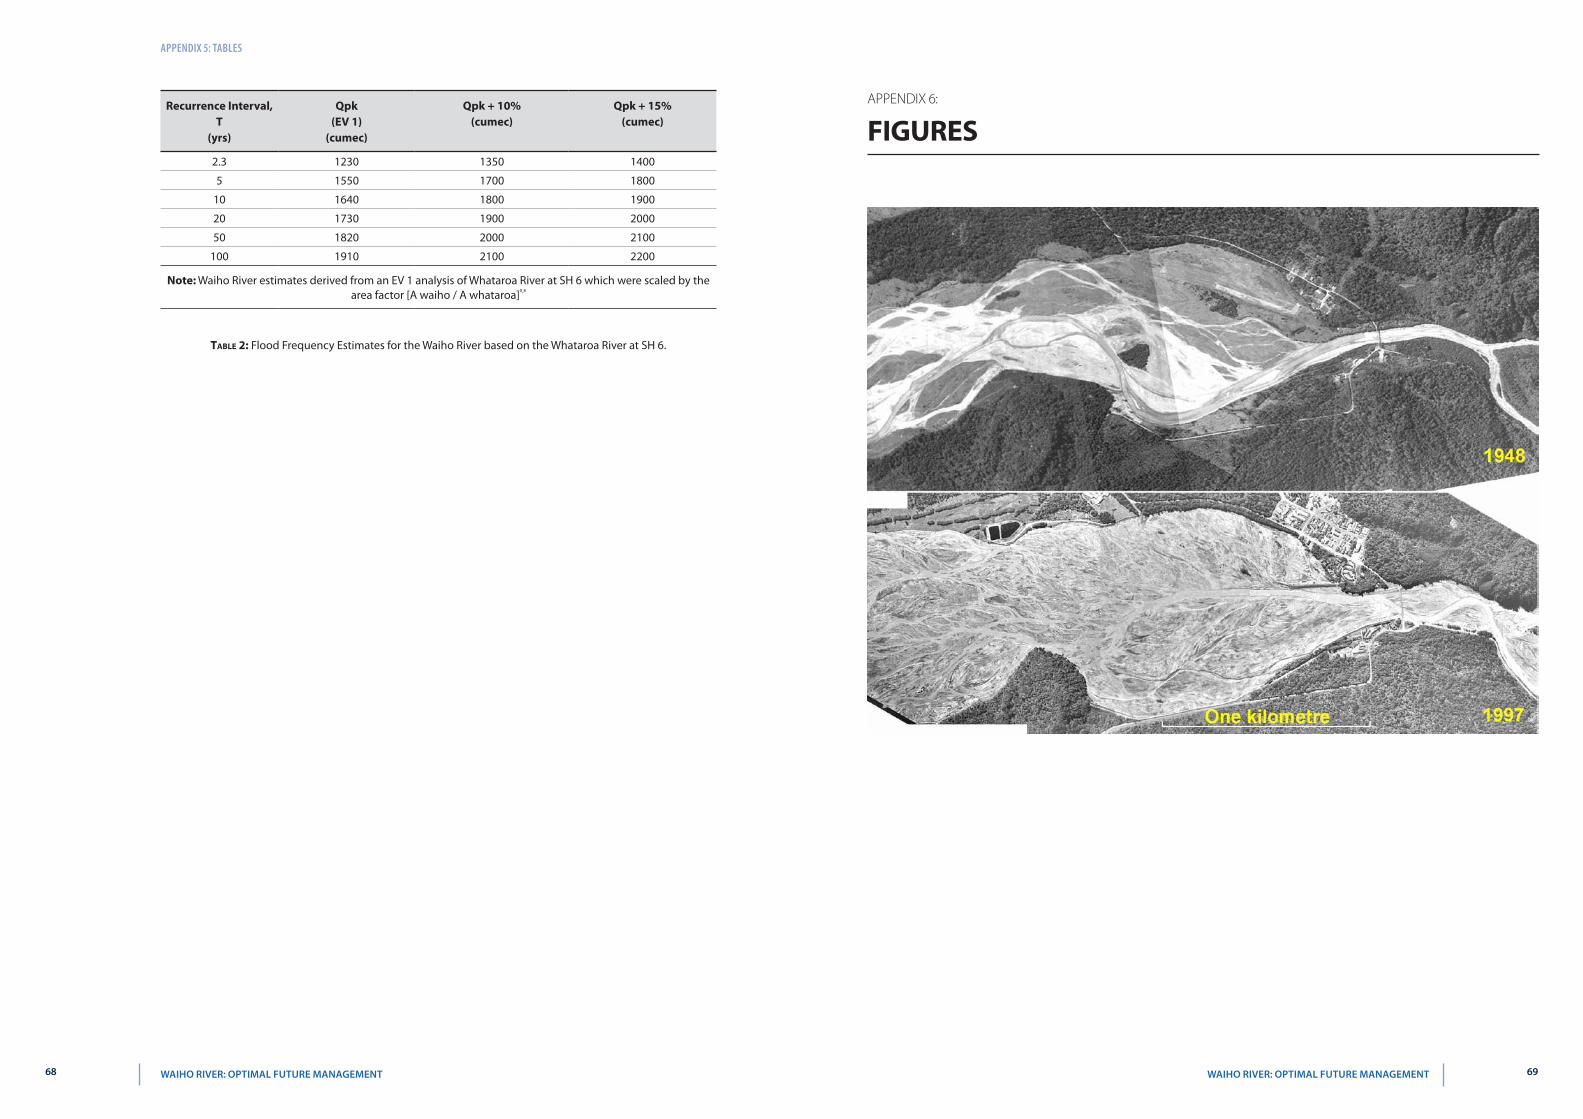
appendIx 5 tables
recurrence interval t
(yrs)
Qpk(eV 1)
(cumec)
Qpk + 10(cumec)
Qpk + 15(cumec)
23 1230 1350 1400
5 1550 1700 1800
10 1640 1800 1900
20 1730 1900 2000
50 1820 2000 2100
100 1910 2100 2200
note Waiho River estimates derived from an EV 1 analysis of Whataroa River at SH 6 which were scaled by the area factor [A waiho A whataroa]⁰⁸
TABle 2 Flood Frequency Estimates for the Waiho River based on the Whataroa River at SH 6
appEndix 6
Figures
68 69 Waiho RiveR optimal FutuRe management Waiho RiveR optimal FutuRe management
appendIx 5 tables
appEndix 7
glossary oF terMs
active gully erosion Erosion that is presently occurring on the sides and floor of a gully during rainstorms which results in an expansion of the gully (viz depth width) and delivers sediment downstream into the main river system of which it is an integral part
aggradation The process whereby sands and gravels accumulate in a riverbed causing the bed level to riseaggrading Phase A term used to describe a period when aggradation is occurring in a river or on an active
alluvial fanalluvial Fan The fan shaped surface built up by a river over extended time where it exits in a confined reach
typically where a river emerges from a hill catchmentannual exceedence Probability The probability that an event (rainstorm flood) of a specific size will occur on
average in any one year (the mathematical reciprocal of the return period or recurrence interval for that event)
annual series Maxima A table comprising the highest flow recorded at a hydrometric site for each year of record and is used for determining the flood frequency characteristics of that site
antecedent rainfall That rainfall that occurs prior to the onset of a rainstorm and which pre-soaks the soil assisting in the development of runoff from the storm when it occurs
anthropogenic Something which has occurred or will occur as a result of human activity or influenceappurtenant structures A structure that is integrally required for the satisfactory performance of another
structure eg rock riprap stub groynes to provide protection to the riverside toe and batter of a stopbankaverage Water depth The water depth averaged over a cross section for a particular flowavulsion The sudden change in direction of a river that occurs as a result of a break out usually occurring during
a flood so that the river abandons its original course in favour of the new alignmentbedload dominated river A river in whose form has been sculptured by the erosion storage and transport of
gravel as bedloadbenchmark level The level referenced to a particular survey datum that is set on a permanent reference point
(bench mark) for survey purposesboils The localised appearance of water and fine soil particles such as sands and silts that occur where
concentrated seepage flows emerge at groundlinebraided river The description for a wide generally steep gravel bed river that has a multitude of interlacing
channelsCalibration run The running of an hydraulic model using selected known flows and water profiles in order to
determine what surface roughnessrsquos are required to obtain realistic model performanceCatchment Processes The physical processes operating within a catchment which influence the rate of runoff
and hence river flow during rainstormsChannel gradient The average slope of a channel reach measured along the flow path of the riverCross Fall The gradient that occurs on the bed of a river that runs at right angles to the primary down valley
gradient of the riverbedCrest settlement The lowering of the crest level of a stopbank caused by either settlement in the stopbank
foundation where weak materials are present or as a result of internal erosion of the stopbank or where liquefaction has occurred or through slumping caused by erosion of the stopbank or lateral spreading of the stopbank foundation as a result of earthquake action
Current Morphological status The present state that a river is in given that the rivers form tends to change over time in response to climatic and geological influences which can affect sediment supply catchment runoff and hence river flows channel gradient and sea level
dam break surges The waves of water and debris that move rapidly downstream from a debris dam when it fails
debris dams Obstructions that occur in confined river reaches from time to time and typically comprise rock regolith vegetation etc which obstruct the flow of water and cause it to dam
debris Flow A fluvial phenomena that can occur in steep channels usually as a result of intense rainfall on an already wet catchment the debris flow manifests as a slug or series of slugs of water and sediment travelling
DoCheRtY CReeK
1km 1mi
FRanZ JoSeF toWnShip
Canvans Knob
Franz Josef Stopbanks
Canavans Knob Stopbank
Rubbish Dump Stopbank
milton amp others Stopbank
State highway
State highway
Bridge
Sewerage ponds
nZta
WCRC
hokitika airport authority
Department of Conservation
Westland District Council
tartare gorge
Waiho loop
Rata Knoll
WAIHO RIVER
CalleRY RiveR
70 71 Waiho RiveR optimal FutuRe management Waiho RiveR optimal FutuRe management
appendIx 7 glossary of terms appendIx 7 glossary of terms
rapidly downstream as a dense slurry which may have incorporated within it woody debris such as tree trunks and branches
debris Flow activity The occurrence of debris flowsdebris traps Places within a catchments river system where sediment tends to accumulatedegradation The opposite process to aggradation whereby sands and gravels are eroded out of the riverbed
and the riverbed fallsdeflation of the bed The steady reduction in elevation of an eroding surface (river bed) over time under the
influence of surface erosion processesdesign Flood levels The maximum water level relative to a prescribed design datum set at a particular location
on a river required to contain the design flood carrying capacity of the river control systemdetritus The products of erosion that is delivered into a river system form the slopes where it has been generated
by weathering and erosion processesdistal end of an alluvial Fan The furthest end of an alluvial fan from the fan head and typically the lowest
elevation on the fan surface provided the fan has not been truncated by erosion by the river or by wave action on a lake or the sea
episodic Events that occur irregularly in timeFalling limb of a Hydrograph That part of the flood hydrograph after the peak where the flood recession
occursFlood Carrying Capacity An estimate of the peak flow in m3 per second that a river control system (can contain
without exceeding its freeboard where a river has stopbanks it is the flow contained within the stopbanks whilst maintaining the design freeboard
Flood Frequency estimates A statistical process for estimating the recurrence interval of various flood discharges for a particular hydrometric site using the annual maxima series for that site
Flood Peak The maximum flow reached by a river in flood measured in m3 per secondFlood Plain The surface over which a river can spread in times of flood once it overtops its natural banks Flood Volume The total volume of water delivered by a river in flood over the duration of the flood and measured
in m3 Fluvial Characteristics The characteristics of a river which describe the storage transport and reworking of river
sediments by the rivers flowsgeomorphic Constraints Physical factors such a rate of uplift hardness of basement rock present sea level
which limit for example the generation of sediment supply and gradient of a river and hence influence the form of a river
glacial internal drainage systems Subsurface watercourses located in and beneath a glacier that convey water from the surface and sides of a glacier into through and beneath a glacier and discharge to the valley floor at the glacier terminal face
glacier retreat The process whereby the terminal face of the glacier is located progressively up the valley as the glacier ice volume is reduced by ablation
Headcut The formation of an erosion cusp in a channel that results in a localised step in a channel bedHeadward erosion The erosion that generates and maintains the headward movement of the erosion cusp
(headcut)Hydraulic Characteristics The flow characteristics of a river system such as flow depth water velocity channel
surface roughness and channel slope (gradient)Hydraulic gradient The slope on a flowing water surfaceHydrometric site A water level measuring site which continuously measures and records water depth at the site
at specific time intervals used for establishing flow records over the full range from low to high flow landslide dam A dam that forms in a confined reach of a river as a result of landslide occurring and partially
blocking the valley through which the river is flowinglateral bank erosion The processes whereby a river erodes its banks generally used with reference to the
erosion of stopbanks when a river moves side ways in a flood eroding the stopbank in the process on the riverside of the stopbank
liquefaction The sudden loss of strength of an unconsolidated or poorly consolidated saturated fine sand soil induced by violent earthquake shaking
lithologies A geological term used for describing rock typeslive bed Conditions The condition that may occur in a riverbed in flood when the deposits which form the
riverbed and banks begin to mobilise and become entrained in the flow and move downstreamMass Movement The downslope movement of regolith and other erosion products in bulk eg slab avalanches
landslides debris flows
Mean bed level The average level of a riverbed across a particular cross section at a particular time estimated from a surveyed cross section at a particular time
Micro scale Modeling The development and running of a small scale physical replica of a particular physical feature such as an active alluvial fan in a laboratory situation
Morphologically active alluvial Fan An alluvial fan that is either aggrading or degrading under its present sediment and water supply and under the influence of local morphological constraints
natural Hazards Any atmospheric or earth or water related occurrence (in the Waiho River context including earthquake erosion landslip Subsidence sedimentation wind drought or flooding) the actions of which adversely affects or may affect human life property or other aspects of the environment
overtopping The term used to describe the situation where floodwaters in a river in flood begin to spill over the rivers banks or stopbanks whichever is relevant to the particular situation being considered
Permeability A term used to describe and quantify that property of a soil that permits water to flow through the pores of the soil under a hydraulic gradient
Pheratic surface The curvilinear water surface within the soils of a stopbank or dam through which water is seeping marking the boundary between saturated and un-saturated soils
Predictive tool A procedure such as a hydraulic model that is developed in order to try and determine how a particular physical situation might develop over time under specified inputs (eg water bedload supply)
Prograding The episodic growth of an alluvial fan surface which causes the distal end of the fan to extend downstream away from the fan head
recession That period during a flood when the river has passed its peak and water levels and hence flow rates are dropping
recurrence interval A statistical term used to describe the relative size of an event (synonymous with the term average return period) eg a particular rainfall depth or flood flow A 1 in 100 year flood has a recurrence interval of 100 years on average It does not mean that an hundred year flood will not occur again for 100 years if an event of that size has just been experienced
regolith The accumulation of soil material on a hill slope as a result of the weathering of the hill slope over time Typically regolith includes clay and sand size particles rock fragments and soil
regolith avalanches The localised movement of regolith rapidly off a hill slope onto the valley floor or riverbed in the form of an avalanche
residence time The time that elapses for example between bed load sediments accumulating at a particular location and subsequently being eroded out
revegetation The decolonization with new vegetation on areas such as slopes denuded of vegetation by landslides
river bed roughness A hydraulic term which reflects the relative roughness of the surface of a riverbed or its berms that is used in hydraulic computations
river Cross sections A survey of ground levels extending across a river from its true left bank to its true right bank aligned more or less at right angles to the rivers flow in times of flood
river reach A description for a particular stretch of a riverriver training and Protection Works Structures erected by humans in an attempt to mitigate against riverbank
erosion and channel migration during floodsrelaxation Removing the boundary constrains on a stopbanked river to allow the river to reassert its natural
form on the floodplain unimpeded by man made flood containment structuresrock rip rap A term used to describe the coarse hard rock that is placed against a surface that may be eroded
by river flows in order to mitigate against such erosion sediment sources Those parts of a river catchment that supply sediment to the river as sediment supplysediment supply The sediment that passes through a river system typically of an episodic nature ie the rate of
supply varying over time typically in response to climatic conditions and river flowseismic induced Mass Movement Landslide activity caused by seismic activityshallow slab avalanches Landslides that typically occur on steep valley sides where the basement rock is close
to the surface (eg within 1 to 2 metres of the surface)sinusoidal braided Flow PatternsTheldquoSrdquoshapedchannelinducedflowpatternsobservedinbraidedriversspecial rating district A Rating District established for the construction and ongoing repair and maintenance
of a river control scheme the rating district is administered by the West Coast Regional Councilsplinter Faults Fault lines that extend out at an angle from a main fault linespur groynes Short groynes that are constructed at the toe of a natural river bank or stopbank that project out
into the riverbed designed to ease high flow velocities of the natural bank or stopbank toe in order to lessen the risk of lateral erosion by the river in flood
72 73 Waiho RiveR optimal FutuRe management Waiho RiveR optimal FutuRe management
appendIx 7 glossary of terms
stopbank A structure erected on a rivers floodplain typically sub-parallel to the rivers flow in times of flood to contain flood flows up to the design standard of the flood protection scheme to prevent them from spilling onto the floodplain
sub-alpine vegetation Typically shrubby bushes grasses and stunted trees that grow above the bush line but below the sparsely vegetated alpine area of a mountain range
sub ndash Parallel More or less parallelsuper-elevation effect The local elevation of water levels around the outside of a bend in a river caused by
centrifugal forces generated by the water moving around the river bendswale The remnant of a river channel on a riversrsquo floodplain that has been etched by river flows in the past and
has subsequently been abandoned by the normal flow of the river but can activate when rivers overtop their natural banks and flow onto the flood plain they may also convey surface runoff from local rainstorms from time to time
temporal supply Mechanism A process that generates sediment supply to the river system and is time dependent
thalweg The centreline path the active riverbed takes as it flows down plainthreshold Flood event A flood event of sufficient size that it overtops a rivers confining banks natural or man
made transfer reach That part of a mountain catchment located in the foothill area upstream of the head (or apex)
of an alluvial fan generally a gorge or narrow confined reach with little opportunity for coarse sediment storage coarse sediments tend to flush through these reaches during floods rather than accumulate as they might on the fan surface proper
two dimensional Hydraulic Model A computer model that incorporates a digital terrain model to provide the basis for determining water depths and velocities over that surface for a particular design flood flow
Wasting out The eroding out of deposits over time
74 Waiho RiveR optimal FutuRe management
388 Main South Road PO Box 66 Greymouth
phone +64 3 768 0466
email infowcrcgovtnz
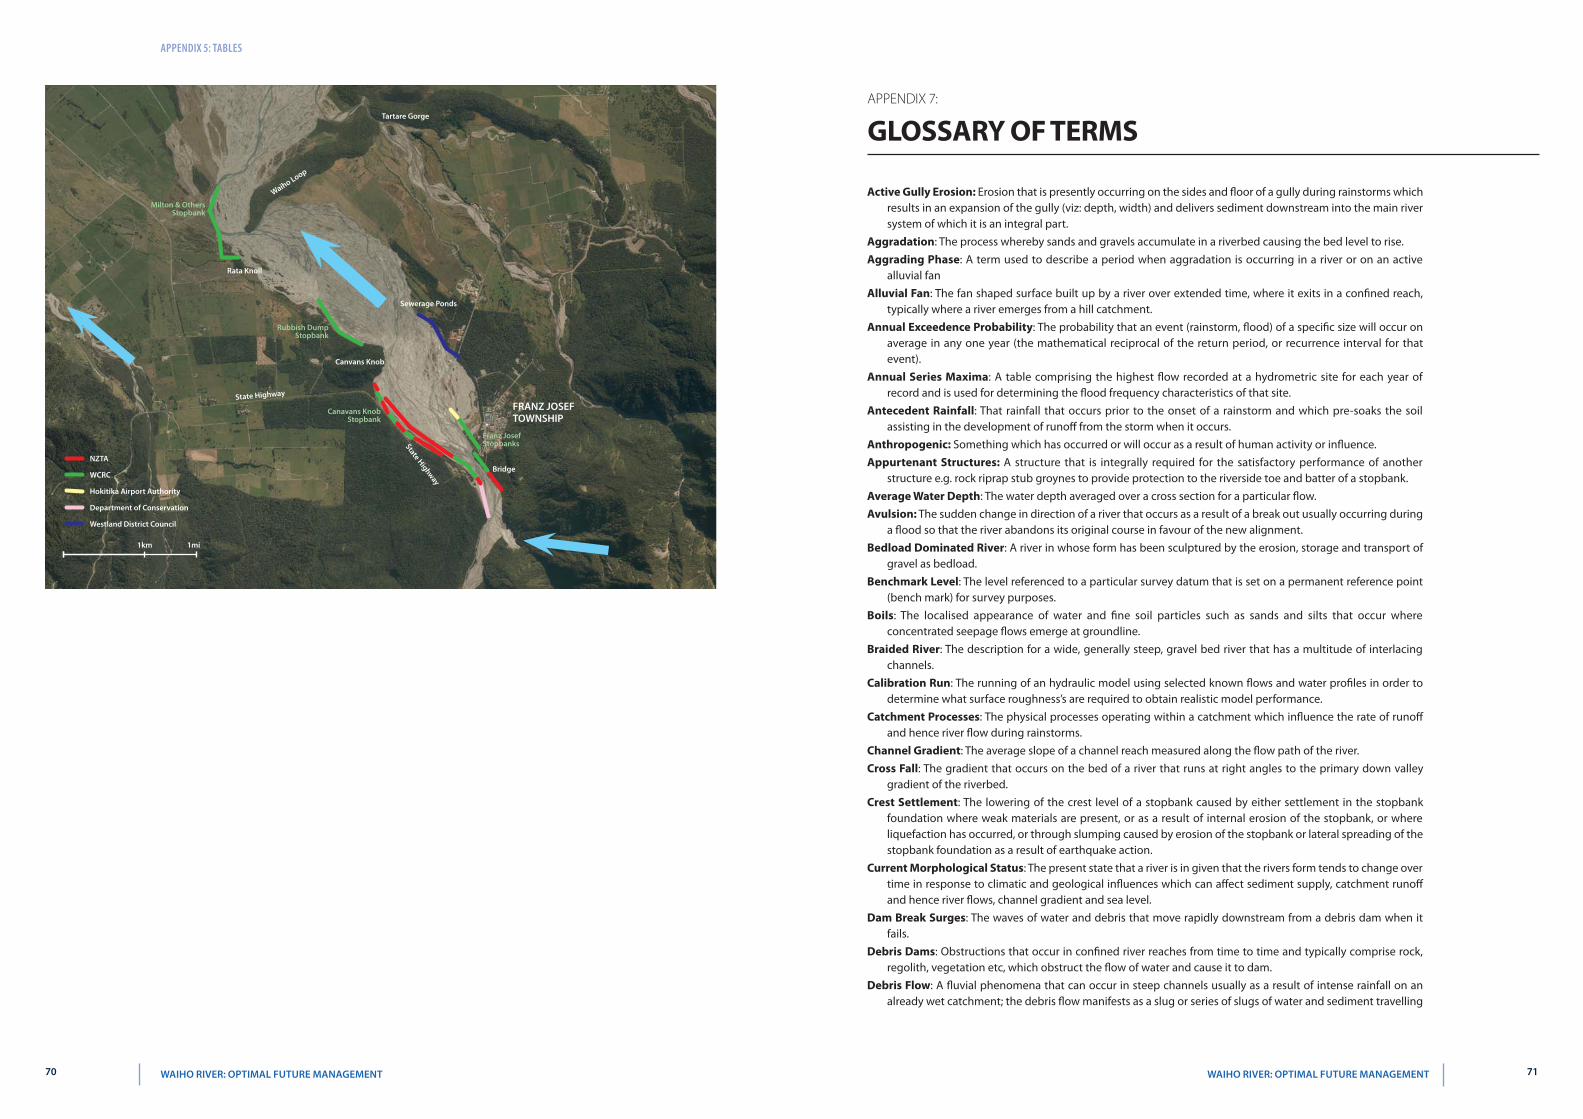
appendIx 5 tables
appEndix 7
glossary oF terMs
active gully erosion Erosion that is presently occurring on the sides and floor of a gully during rainstorms which results in an expansion of the gully (viz depth width) and delivers sediment downstream into the main river system of which it is an integral part
aggradation The process whereby sands and gravels accumulate in a riverbed causing the bed level to riseaggrading Phase A term used to describe a period when aggradation is occurring in a river or on an active
alluvial fanalluvial Fan The fan shaped surface built up by a river over extended time where it exits in a confined reach
typically where a river emerges from a hill catchmentannual exceedence Probability The probability that an event (rainstorm flood) of a specific size will occur on
average in any one year (the mathematical reciprocal of the return period or recurrence interval for that event)
annual series Maxima A table comprising the highest flow recorded at a hydrometric site for each year of record and is used for determining the flood frequency characteristics of that site
antecedent rainfall That rainfall that occurs prior to the onset of a rainstorm and which pre-soaks the soil assisting in the development of runoff from the storm when it occurs
anthropogenic Something which has occurred or will occur as a result of human activity or influenceappurtenant structures A structure that is integrally required for the satisfactory performance of another
structure eg rock riprap stub groynes to provide protection to the riverside toe and batter of a stopbankaverage Water depth The water depth averaged over a cross section for a particular flowavulsion The sudden change in direction of a river that occurs as a result of a break out usually occurring during
a flood so that the river abandons its original course in favour of the new alignmentbedload dominated river A river in whose form has been sculptured by the erosion storage and transport of
gravel as bedloadbenchmark level The level referenced to a particular survey datum that is set on a permanent reference point
(bench mark) for survey purposesboils The localised appearance of water and fine soil particles such as sands and silts that occur where
concentrated seepage flows emerge at groundlinebraided river The description for a wide generally steep gravel bed river that has a multitude of interlacing
channelsCalibration run The running of an hydraulic model using selected known flows and water profiles in order to
determine what surface roughnessrsquos are required to obtain realistic model performanceCatchment Processes The physical processes operating within a catchment which influence the rate of runoff
and hence river flow during rainstormsChannel gradient The average slope of a channel reach measured along the flow path of the riverCross Fall The gradient that occurs on the bed of a river that runs at right angles to the primary down valley
gradient of the riverbedCrest settlement The lowering of the crest level of a stopbank caused by either settlement in the stopbank
foundation where weak materials are present or as a result of internal erosion of the stopbank or where liquefaction has occurred or through slumping caused by erosion of the stopbank or lateral spreading of the stopbank foundation as a result of earthquake action
Current Morphological status The present state that a river is in given that the rivers form tends to change over time in response to climatic and geological influences which can affect sediment supply catchment runoff and hence river flows channel gradient and sea level
dam break surges The waves of water and debris that move rapidly downstream from a debris dam when it fails
debris dams Obstructions that occur in confined river reaches from time to time and typically comprise rock regolith vegetation etc which obstruct the flow of water and cause it to dam
debris Flow A fluvial phenomena that can occur in steep channels usually as a result of intense rainfall on an already wet catchment the debris flow manifests as a slug or series of slugs of water and sediment travelling
DoCheRtY CReeK
1km 1mi
FRanZ JoSeF toWnShip
Canvans Knob
Franz Josef Stopbanks
Canavans Knob Stopbank
Rubbish Dump Stopbank
milton amp others Stopbank
State highway
State highway
Bridge
Sewerage ponds
nZta
WCRC
hokitika airport authority
Department of Conservation
Westland District Council
tartare gorge
Waiho loop
Rata Knoll
WAIHO RIVER
CalleRY RiveR
70 71 Waiho RiveR optimal FutuRe management Waiho RiveR optimal FutuRe management
appendIx 7 glossary of terms appendIx 7 glossary of terms
rapidly downstream as a dense slurry which may have incorporated within it woody debris such as tree trunks and branches
debris Flow activity The occurrence of debris flowsdebris traps Places within a catchments river system where sediment tends to accumulatedegradation The opposite process to aggradation whereby sands and gravels are eroded out of the riverbed
and the riverbed fallsdeflation of the bed The steady reduction in elevation of an eroding surface (river bed) over time under the
influence of surface erosion processesdesign Flood levels The maximum water level relative to a prescribed design datum set at a particular location
on a river required to contain the design flood carrying capacity of the river control systemdetritus The products of erosion that is delivered into a river system form the slopes where it has been generated
by weathering and erosion processesdistal end of an alluvial Fan The furthest end of an alluvial fan from the fan head and typically the lowest
elevation on the fan surface provided the fan has not been truncated by erosion by the river or by wave action on a lake or the sea
episodic Events that occur irregularly in timeFalling limb of a Hydrograph That part of the flood hydrograph after the peak where the flood recession
occursFlood Carrying Capacity An estimate of the peak flow in m3 per second that a river control system (can contain
without exceeding its freeboard where a river has stopbanks it is the flow contained within the stopbanks whilst maintaining the design freeboard
Flood Frequency estimates A statistical process for estimating the recurrence interval of various flood discharges for a particular hydrometric site using the annual maxima series for that site
Flood Peak The maximum flow reached by a river in flood measured in m3 per secondFlood Plain The surface over which a river can spread in times of flood once it overtops its natural banks Flood Volume The total volume of water delivered by a river in flood over the duration of the flood and measured
in m3 Fluvial Characteristics The characteristics of a river which describe the storage transport and reworking of river
sediments by the rivers flowsgeomorphic Constraints Physical factors such a rate of uplift hardness of basement rock present sea level
which limit for example the generation of sediment supply and gradient of a river and hence influence the form of a river
glacial internal drainage systems Subsurface watercourses located in and beneath a glacier that convey water from the surface and sides of a glacier into through and beneath a glacier and discharge to the valley floor at the glacier terminal face
glacier retreat The process whereby the terminal face of the glacier is located progressively up the valley as the glacier ice volume is reduced by ablation
Headcut The formation of an erosion cusp in a channel that results in a localised step in a channel bedHeadward erosion The erosion that generates and maintains the headward movement of the erosion cusp
(headcut)Hydraulic Characteristics The flow characteristics of a river system such as flow depth water velocity channel
surface roughness and channel slope (gradient)Hydraulic gradient The slope on a flowing water surfaceHydrometric site A water level measuring site which continuously measures and records water depth at the site
at specific time intervals used for establishing flow records over the full range from low to high flow landslide dam A dam that forms in a confined reach of a river as a result of landslide occurring and partially
blocking the valley through which the river is flowinglateral bank erosion The processes whereby a river erodes its banks generally used with reference to the
erosion of stopbanks when a river moves side ways in a flood eroding the stopbank in the process on the riverside of the stopbank
liquefaction The sudden loss of strength of an unconsolidated or poorly consolidated saturated fine sand soil induced by violent earthquake shaking
lithologies A geological term used for describing rock typeslive bed Conditions The condition that may occur in a riverbed in flood when the deposits which form the
riverbed and banks begin to mobilise and become entrained in the flow and move downstreamMass Movement The downslope movement of regolith and other erosion products in bulk eg slab avalanches
landslides debris flows
Mean bed level The average level of a riverbed across a particular cross section at a particular time estimated from a surveyed cross section at a particular time
Micro scale Modeling The development and running of a small scale physical replica of a particular physical feature such as an active alluvial fan in a laboratory situation
Morphologically active alluvial Fan An alluvial fan that is either aggrading or degrading under its present sediment and water supply and under the influence of local morphological constraints
natural Hazards Any atmospheric or earth or water related occurrence (in the Waiho River context including earthquake erosion landslip Subsidence sedimentation wind drought or flooding) the actions of which adversely affects or may affect human life property or other aspects of the environment
overtopping The term used to describe the situation where floodwaters in a river in flood begin to spill over the rivers banks or stopbanks whichever is relevant to the particular situation being considered
Permeability A term used to describe and quantify that property of a soil that permits water to flow through the pores of the soil under a hydraulic gradient
Pheratic surface The curvilinear water surface within the soils of a stopbank or dam through which water is seeping marking the boundary between saturated and un-saturated soils
Predictive tool A procedure such as a hydraulic model that is developed in order to try and determine how a particular physical situation might develop over time under specified inputs (eg water bedload supply)
Prograding The episodic growth of an alluvial fan surface which causes the distal end of the fan to extend downstream away from the fan head
recession That period during a flood when the river has passed its peak and water levels and hence flow rates are dropping
recurrence interval A statistical term used to describe the relative size of an event (synonymous with the term average return period) eg a particular rainfall depth or flood flow A 1 in 100 year flood has a recurrence interval of 100 years on average It does not mean that an hundred year flood will not occur again for 100 years if an event of that size has just been experienced
regolith The accumulation of soil material on a hill slope as a result of the weathering of the hill slope over time Typically regolith includes clay and sand size particles rock fragments and soil
regolith avalanches The localised movement of regolith rapidly off a hill slope onto the valley floor or riverbed in the form of an avalanche
residence time The time that elapses for example between bed load sediments accumulating at a particular location and subsequently being eroded out
revegetation The decolonization with new vegetation on areas such as slopes denuded of vegetation by landslides
river bed roughness A hydraulic term which reflects the relative roughness of the surface of a riverbed or its berms that is used in hydraulic computations
river Cross sections A survey of ground levels extending across a river from its true left bank to its true right bank aligned more or less at right angles to the rivers flow in times of flood
river reach A description for a particular stretch of a riverriver training and Protection Works Structures erected by humans in an attempt to mitigate against riverbank
erosion and channel migration during floodsrelaxation Removing the boundary constrains on a stopbanked river to allow the river to reassert its natural
form on the floodplain unimpeded by man made flood containment structuresrock rip rap A term used to describe the coarse hard rock that is placed against a surface that may be eroded
by river flows in order to mitigate against such erosion sediment sources Those parts of a river catchment that supply sediment to the river as sediment supplysediment supply The sediment that passes through a river system typically of an episodic nature ie the rate of
supply varying over time typically in response to climatic conditions and river flowseismic induced Mass Movement Landslide activity caused by seismic activityshallow slab avalanches Landslides that typically occur on steep valley sides where the basement rock is close
to the surface (eg within 1 to 2 metres of the surface)sinusoidal braided Flow PatternsTheldquoSrdquoshapedchannelinducedflowpatternsobservedinbraidedriversspecial rating district A Rating District established for the construction and ongoing repair and maintenance
of a river control scheme the rating district is administered by the West Coast Regional Councilsplinter Faults Fault lines that extend out at an angle from a main fault linespur groynes Short groynes that are constructed at the toe of a natural river bank or stopbank that project out
into the riverbed designed to ease high flow velocities of the natural bank or stopbank toe in order to lessen the risk of lateral erosion by the river in flood
72 73 Waiho RiveR optimal FutuRe management Waiho RiveR optimal FutuRe management
appendIx 7 glossary of terms
stopbank A structure erected on a rivers floodplain typically sub-parallel to the rivers flow in times of flood to contain flood flows up to the design standard of the flood protection scheme to prevent them from spilling onto the floodplain
sub-alpine vegetation Typically shrubby bushes grasses and stunted trees that grow above the bush line but below the sparsely vegetated alpine area of a mountain range
sub ndash Parallel More or less parallelsuper-elevation effect The local elevation of water levels around the outside of a bend in a river caused by
centrifugal forces generated by the water moving around the river bendswale The remnant of a river channel on a riversrsquo floodplain that has been etched by river flows in the past and
has subsequently been abandoned by the normal flow of the river but can activate when rivers overtop their natural banks and flow onto the flood plain they may also convey surface runoff from local rainstorms from time to time
temporal supply Mechanism A process that generates sediment supply to the river system and is time dependent
thalweg The centreline path the active riverbed takes as it flows down plainthreshold Flood event A flood event of sufficient size that it overtops a rivers confining banks natural or man
made transfer reach That part of a mountain catchment located in the foothill area upstream of the head (or apex)
of an alluvial fan generally a gorge or narrow confined reach with little opportunity for coarse sediment storage coarse sediments tend to flush through these reaches during floods rather than accumulate as they might on the fan surface proper
two dimensional Hydraulic Model A computer model that incorporates a digital terrain model to provide the basis for determining water depths and velocities over that surface for a particular design flood flow
Wasting out The eroding out of deposits over time
74 Waiho RiveR optimal FutuRe management
388 Main South Road PO Box 66 Greymouth
phone +64 3 768 0466
email infowcrcgovtnz
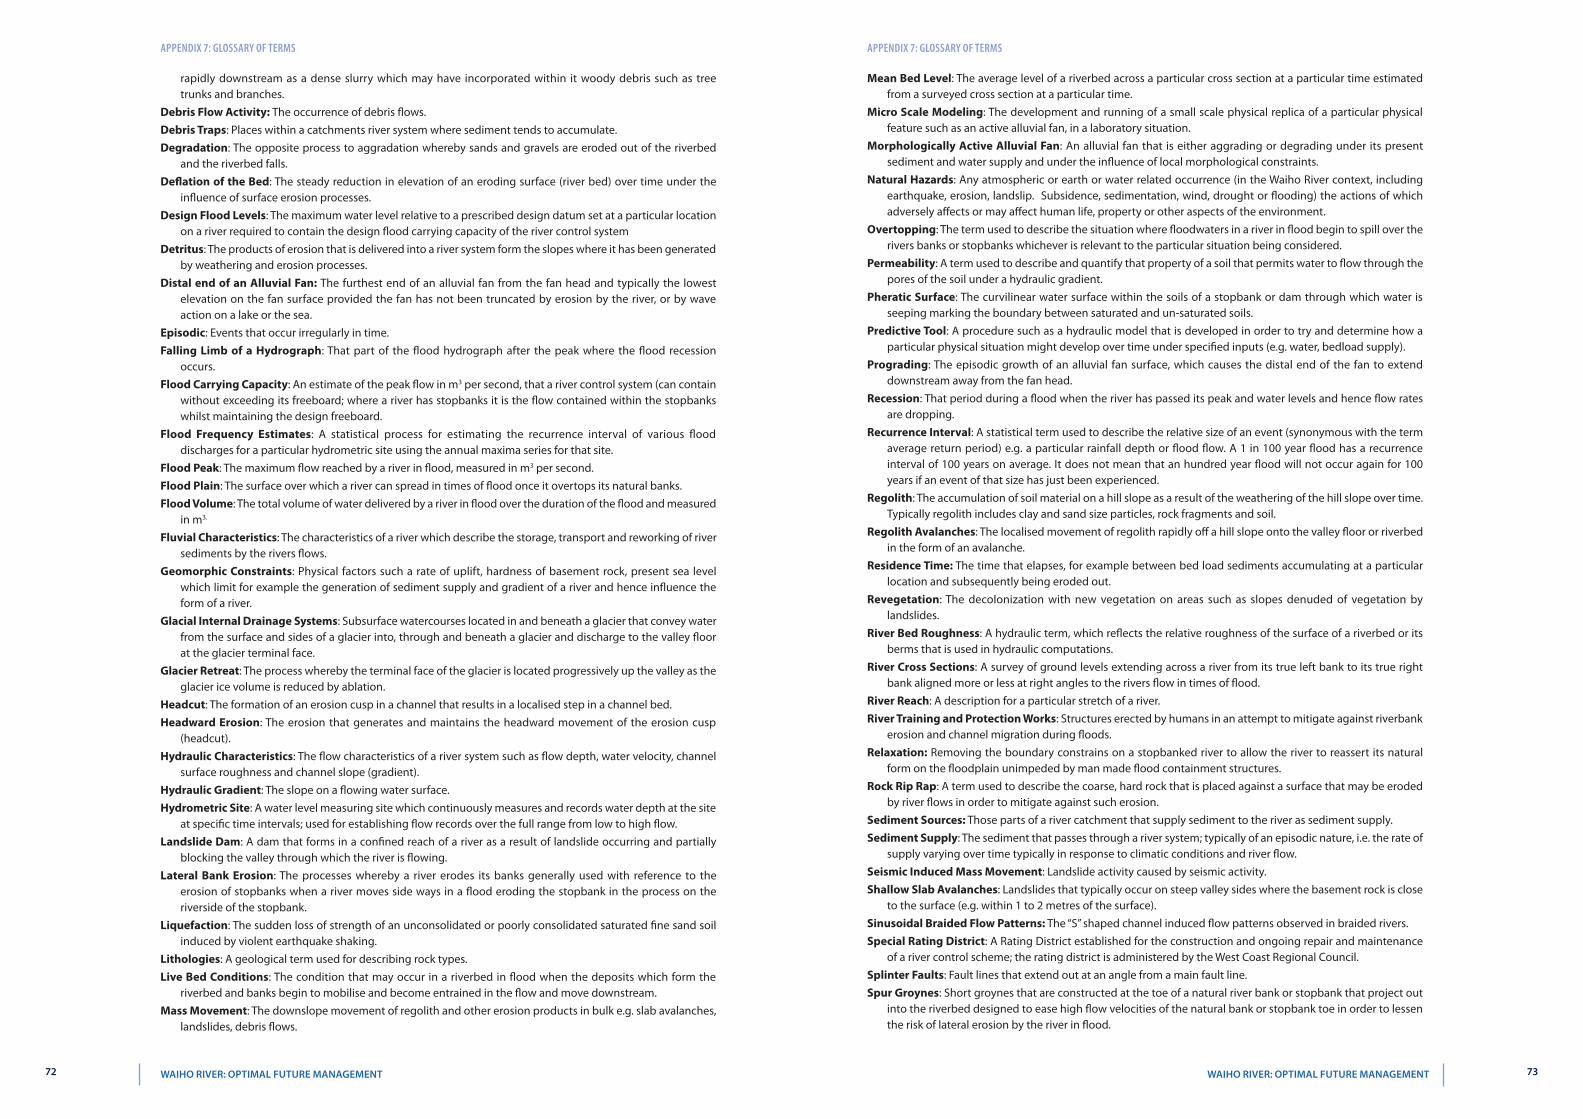

388 Main South Road PO Box 66 Greymouth
phone +64 3 768 0466
email infowcrcgovtnz


![Lignin Degradation and Humus Formation in Alluvial Soils … · Alluvial soils and submergedor nonsubmerged river and pondsediments containing alder, poplar, or willow ['4C-lignin]ligno-celluloses](https://img.pdfslide.us/doc/110x75/5f48f68f2edf3e38f20a5fd3/lignin-degradation-and-humus-formation-in-alluvial-soils-alluvial-soils-and-submergedor.jpg)