Embed Size (px)
Citation preview

WABERER’S INTERNATIONAL Nyrt. | October 2017
Waberer’s Investor Presentation
This presentation may contain forward-looking statements. Statements that are not historical facts, including statements
about our beliefs and expectations, are forward-looking statements. These statements are based on current plans,
estimates and projections, and therefore should not have undue reliance placed upon them. Forward-looking statements
speak only as of the date they are made, and we undertake no obligation to update publicly any of them in light of new
information or future events.
Forward-looking statements involve inherent risks and uncertainties. We caution you that a number of important factors
could cause actual results to differ materially from those contained in any forward-looking statement. Such factors are
described in, among other things, the prospectus dated 15 June 2017, which was approved for publication by the National
Bank of Hungary in its resolution No. H-KE-III-426/2017, dated 16 June 2017, and available on our website for investors at
http://www.waberers.com/en/investors.
Forward-looking statements
| 2
Agenda
| Waberer’s Highlights
| A Compelling Investment Proposition – Delivering Growth
| The European Leader in FTL Transportation
| Divisional Overview: International and Regional
| Consistent Top Line Growth with Stable Profit Generation
| Capital Market Overview
| Investment Case
| Appendix
| 3
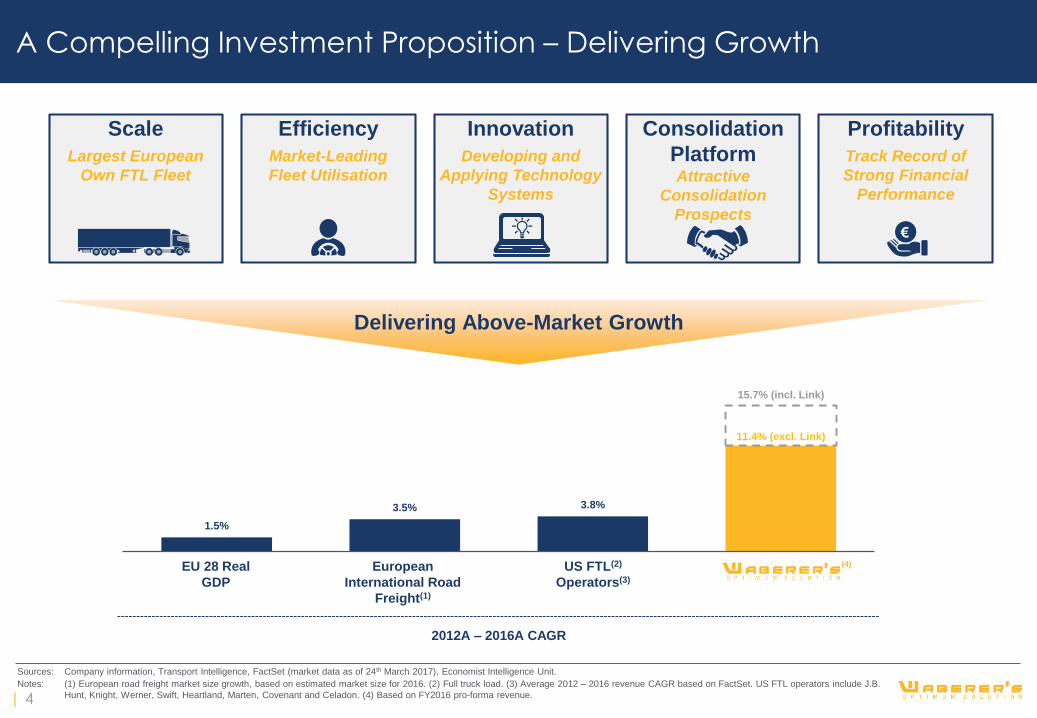
11.4% (excl. Link)
1.5%
3.5% 3.8%
15.7% (incl. Link)
A Compelling Investment Proposition – Delivering Growth
Sources: Company information, Transport Intelligence, FactSet (market data as of 24th March 2017), Economist Intelligence Unit.
Notes: (1) European road freight market size growth, based on estimated market size for 2016. (2) Full truck load. (3) Average 2012 – 2016 revenue CAGR based on FactSet. US FTL operators include J.B.
Hunt, Knight, Werner, Swift, Heartland, Marten, Covenant and Celadon. (4) Based on FY2016 pro-forma revenue.
Delivering Above-Market Growth
2012A – 2016A CAGR
European
International Road
Freight(1)
US FTL(2)
Operators(3)
(4)EU 28 Real
GDP
Scale
Largest European
Own FTL Fleet
Efficiency
Market-Leading
Fleet Utilisation
Profitability
Track Record of
Strong Financial
Performance
€
Consolidation
PlatformAttractive
Consolidation
Prospects
Innovation
Developing and
Applying Technology
Systems
| 4
2016A2000A
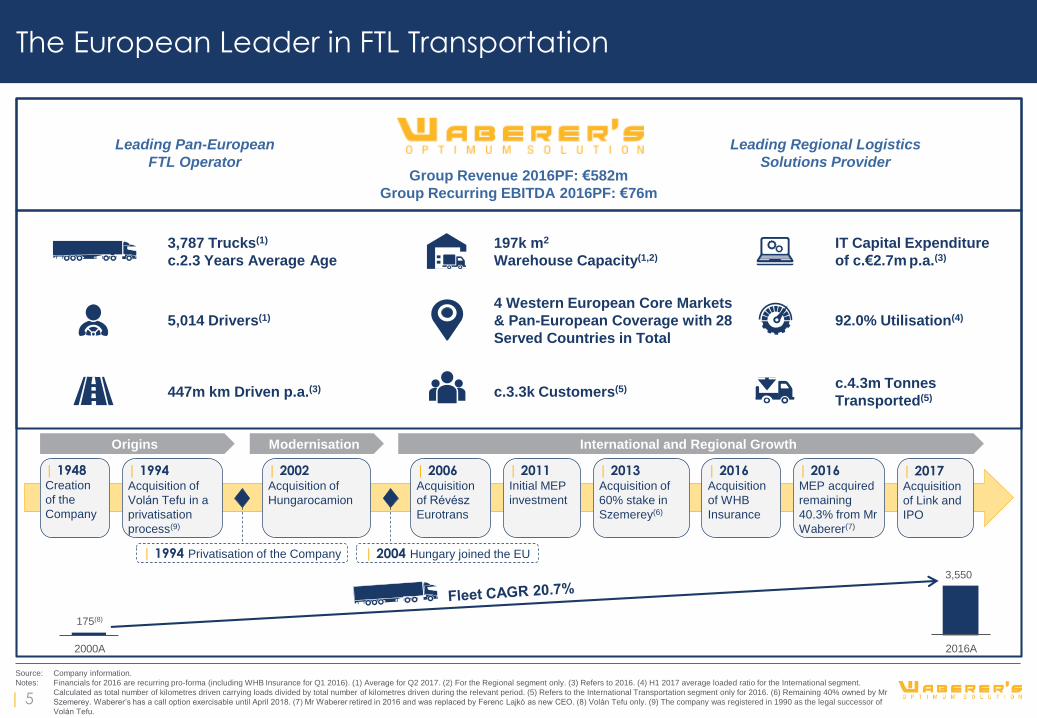
The European Leader in FTL Transportation
Leading Pan-European
FTL Operator
Leading Regional Logistics
Solutions Provider
175(8)
3,550
3,787 Trucks(1)
c.2.3 Years Average Age
5,014 Drivers(1)
447m km Driven p.a.(3)
197k m2
Warehouse Capacity(1,2)
4 Western European Core Markets
& Pan-European Coverage with 28
Served Countries in Total
c.3.3k Customers(5)
IT Capital Expenditure
of c.€2.7m p.a.(3)
92.0% Utilisation(4)
c.4.3m Tonnes
Transported(5)
Group Revenue 2016PF: €582m
Group Recurring EBITDA 2016PF: €76m
Source: Company information.
Notes: Financials for 2016 are recurring pro-forma (including WHB Insurance for Q1 2016). (1) Average for Q2 2017. (2) For the Regional segment only. (3) Refers to 2016. (4) H1 2017 average loaded ratio for the International segment.
Calculated as total number of kilometres driven carrying loads divided by total number of kilometres driven during the relevant period. (5) Refers to the International Transportation segment only for 2016. (6) Remaining 40% owned by Mr
Szemerey. Waberer’s has a call option exercisable until April 2018. (7) Mr Waberer retired in 2016 and was replaced by Ferenc Lajkó as new CEO. (8) Volán Tefu only. (9) The company was registered in 1990 as the legal successor of
Volán Tefu.
| 1948Creation
of the
Company
| 2011Initial MEP
investment
| 2013Acquisition of
60% stake in
Szemerey(6)
| 2016Acquisition
of WHB
Insurance
| 2016MEP acquired
remaining
40.3% from Mr
Waberer(7)
| 1994Acquisition of
Volán Tefu in a
privatisation
process(9)
| 2002Acquisition of
Hungarocamion
| 2006Acquisition
of Révész
Eurotrans
| 1994 Privatisation of the Company | 2004 Hungary joined the EU
Origins Modernisation International and Regional Growth
| 2017Acquisition
of Link and
IPO
| 5

Divisional Overview: International and Regional
International Regional
|Overview(1)
#1 own-fleet player in European FTL with
3,123(2) own trucks
Pan-European network and capacity
availability
Benchmark service offering at a competitive
price point
Fleet utilisation of 92.0%(3) as measured by
loaded ratio
|Overview(1)
#1 in road transport and logistics services in Hungary
Large dedicated domestic fleet of 844 own trucks(2)
and warehousing capacity of 197k m² (2) (dry and
refrigerated)
Full range of logistics capabilities across the
value chain
Regional transportation comprises FTL
transportation, LTL(4) distribution, container
transportation as well as warehousing
17%
17%
76%
77%
Revenue Split(5)
Group Revenue: €582m Group EBITDA: €76m (Margin: 13.1%)
Other
|Overview(1)
Comprising revenues and profits from third party
insurance
Acquisition of insurance business has internalised
insurance services, reducing exposure to further
premium increases
7%
6%
Revenue
€41m
EBITDA
€5m
Margin
11.9%
Own Fleet 80.5%
Revenue
€97m
EBITDA
€13m
Margin
13.4%
Revenue
€443m
EBITDA
€58m
Margin
13.2%
Freight Forwarding 19.5%
Source: Company information.
Notes: Financials are FY2016 recurring pro-forma (including WHB Insurance for Q1 2016) figures. (1) % contribution represents 2016 Revenue and EBITDA. (2) Q2 2017 average. (3) H1 2017 average.
(4) Less than truckload. (5) Freight forwarding also includes groupage and other revenue. | 6
11 14
16
2014A 2015A 2016PF
60 60 58
8 11 13
568 72
76
2014A 2015A 2016PF
International Regional Other
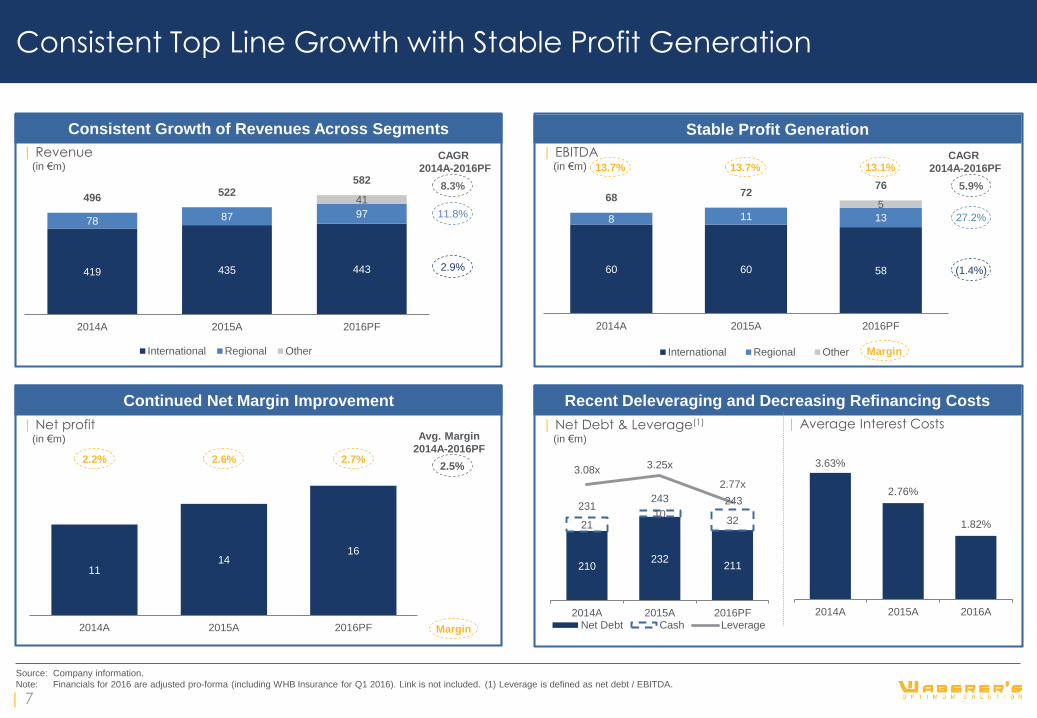
Consistent Top Line Growth with Stable Profit Generation
Source: Company information.
Note: Financials for 2016 are adjusted pro-forma (including WHB Insurance for Q1 2016). Link is not included. (1) Leverage is defined as net debt / EBITDA.
Stable Profit Generation
Recent Deleveraging and Decreasing Refinancing Costs
Consistent Growth of Revenues Across Segments
Continued Net Margin Improvement
| EBITDA(in €m)
| Net profit(in €m)
| Revenue(in €m)
| Net Debt & Leverage(1)
(in €m)
CAGR
2014A-2016PF
2.9%
11.8%
8.3%
(1.4%)
27.2%
5.9%
13.7% 13.7% 13.1%CAGR
2014A-2016PF
2.2% 2.6% 2.7%2.5%
Avg. Margin
2014A-2016PF
419 435 443
78 87 97
41496522
582
2014A 2015A 2016PF
International Regional Other Margin
Margin
| 7
210232
211
2110
32
231243 243
3.08x3.25x
2.77x
2014A 2015A 2016PFNet Debt Cash Leverage
3.63%
2.76%
1.82%
2014A 2015A 2016A
| Average Interest Costs
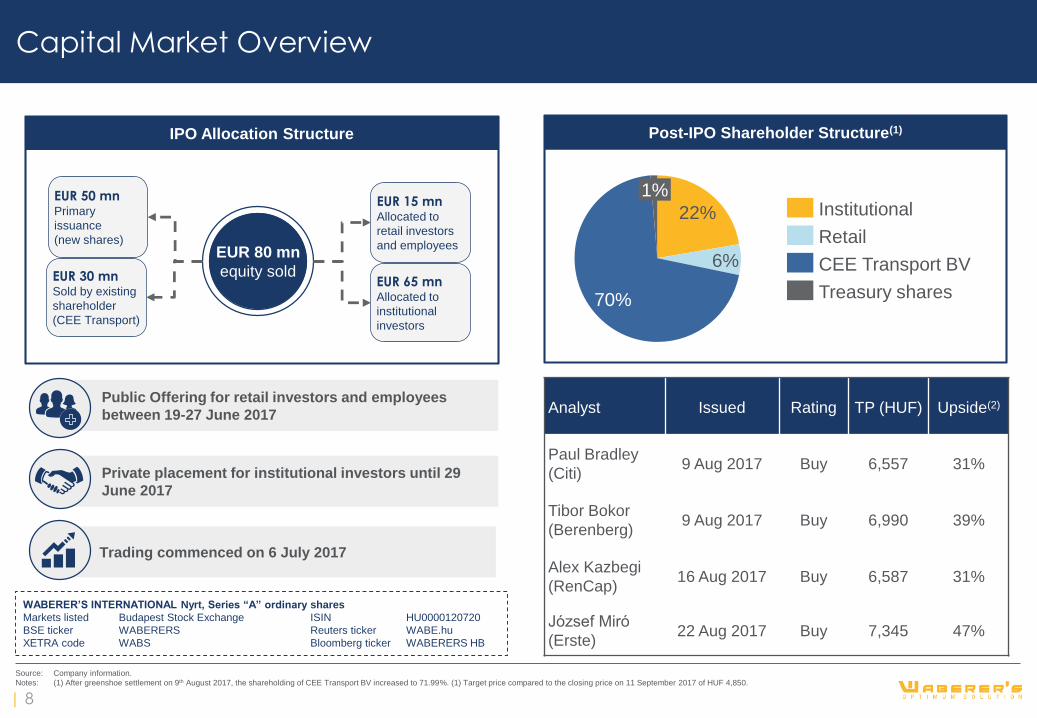
Trading commenced on 6 July 2017
Private placement for institutional investors until 29
June 2017
Public Offering for retail investors and employees
between 19-27 June 2017
Capital Market Overview
| 8
1%
70%
6%
22%
CEE Transport BV
Treasury shares
Retail
Institutional
Post-IPO Shareholder Structure(1)
Source: Company information.
Notes: (1) After greenshoe settlement on 9th August 2017, the shareholding of CEE Transport BV increased to 71.99%. (1) Target price compared to the closing price on 11 September 2017 of HUF 4,850.
IPO Allocation Structure
EUR 80 mn
equity soldEUR 30 mnSold by existing
shareholder
(CEE Transport)
EUR 50 mnPrimary
issuance
(new shares)
EUR 65 mnAllocated to
institutional
investors
EUR 15 mnAllocated to
retail investors
and employees
WABERER’S INTERNATIONAL Nyrt, Series “A” ordinary shares
Markets listed Budapest Stock Exchange ISIN HU0000120720
BSE ticker WABERERS Reuters ticker WABE.hu
XETRA code WABS Bloomberg ticker WABERERS HB
Analyst Issued Rating TP (HUF) Upside(2)
Paul Bradley
(Citi)9 Aug 2017 Buy 6,557 31%
Tibor Bokor
(Berenberg)9 Aug 2017 Buy 6,990 39%
Alex Kazbegi
(RenCap)16 Aug 2017 Buy 6,587 31%
József Miró
(Erste)22 Aug 2017 Buy 7,345 47%
Agenda
| Waberer’s Highlights
| Investment Case
| Established Market Leadership Secured by Significant Barriers to Entry
| Attractive Growth and Consolidation Prospects – European Market
| Attractive Growth and Consolidation Prospects – Regional Market
| Focused Strategy, Underpinned by a Compelling Value Proposition,
Driving Above-Market Growth
| Industry-Leading Operational Performance
| Resilient Business Model
| Appendix
| 9
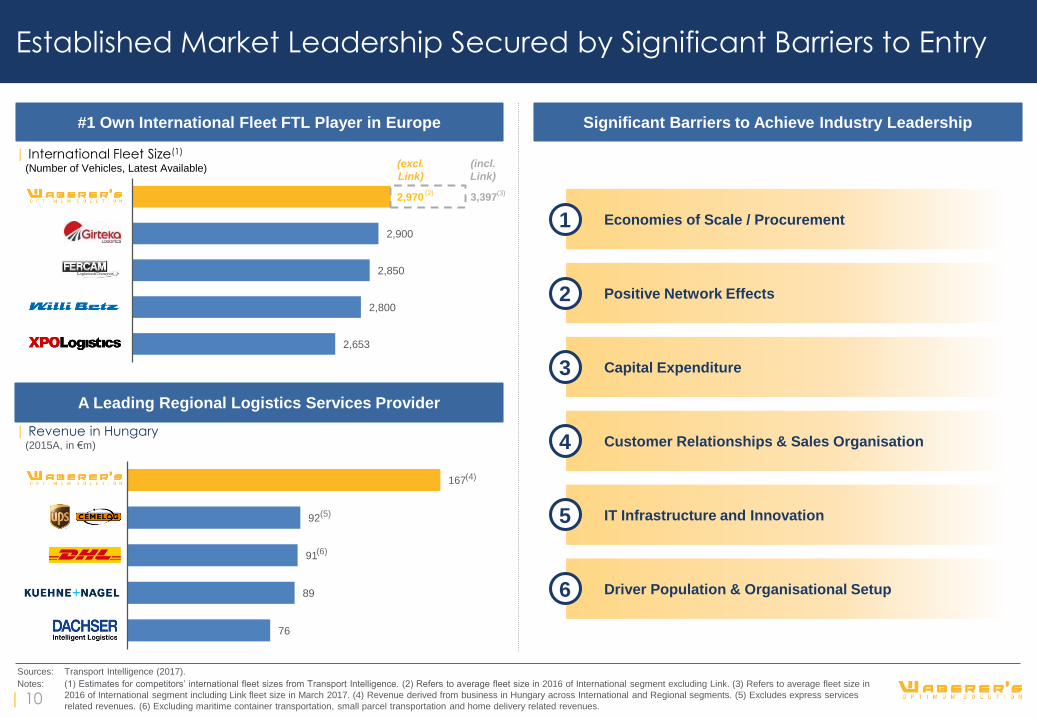
2,970
2,653
2,800
2,850
2,900
3,397
XPO Logistics
Wili Betz
Fercam
Girteka
Waberers
#1 Own International Fleet FTL Player in Europe
A Leading Regional Logistics Services Provider
Significant Barriers to Achieve Industry Leadership
| International Fleet Size(1)
(Number of Vehicles, Latest Available)
Economies of Scale / Procurement1
Positive Network Effects2
Capital Expenditure3
Customer Relationships & Sales Organisation4
IT Infrastructure and Innovation5
Driver Population & Organisational Setup6
Sources: Transport Intelligence (2017).
Notes: (1) Estimates for competitors’ international fleet sizes from Transport Intelligence. (2) Refers to average fleet size in 2016 of International segment excluding Link. (3) Refers to average fleet size in
2016 of International segment including Link fleet size in March 2017. (4) Revenue derived from business in Hungary across International and Regional segments. (5) Excludes express services
related revenues. (6) Excluding maritime container transportation, small parcel transportation and home delivery related revenues.
(2)
76
89
91
92
167
| Revenue in Hungary(2015A, in €m)
(4)
(5)
(6)
(excl.
Link)
(incl.
Link)
(3)
Established Market Leadership Secured by Significant Barriers to Entry
| 10
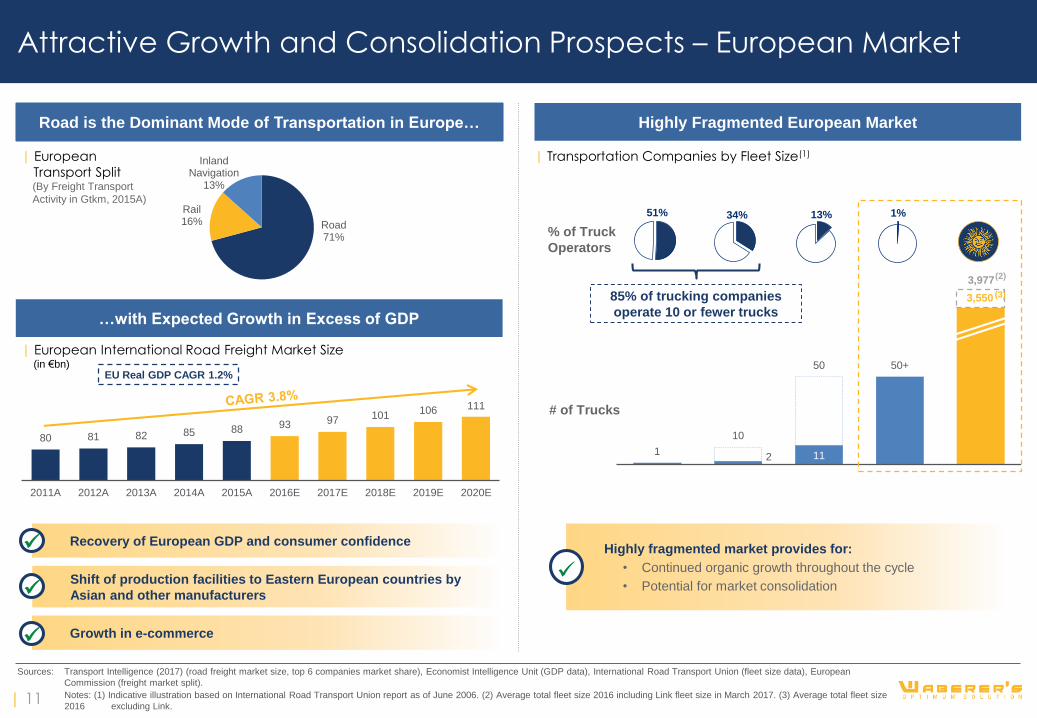
2 111
10
50 50+
3,977
3,550
80 81 82 85 88 93 97 101 106 111
2011A 2012A 2013A 2014A 2015A 2016E 2017E 2018E 2019E 2020E
Attractive Growth and Consolidation Prospects – European Market
Road is the Dominant Mode of Transportation in Europe…
…with Expected Growth in Excess of GDP
Highly Fragmented European Market
| European International Road Freight Market Size(in €bn)
Sources: Transport Intelligence (2017) (road freight market size, top 6 companies market share), Economist Intelligence Unit (GDP data), International Road Transport Union (fleet size data), European
Commission (freight market split).
Notes: (1) Indicative illustration based on International Road Transport Union report as of June 2006. (2) Average total fleet size 2016 including Link fleet size in March 2017. (3) Average total fleet size
2016 excluding Link.
Highly fragmented market provides for:
• Continued organic growth throughout the cycle
• Potential for market consolidation
| Transportation Companies by Fleet Size(1)
Growth in e-commerce
Recovery of European GDP and consumer confidence
EU Real GDP CAGR 1.2%
85% of trucking companies
operate 10 or fewer trucks
51% 34% 13% 1%
% of Truck
Operators
# of Trucks
(2)
| European
Transport Split(By Freight Transport
Activity in Gtkm, 2015A)
Road71%
Rail16%
Inland Navigation
13%
Shift of production facilities to Eastern European countries by
Asian and other manufacturers
(3)
| 11
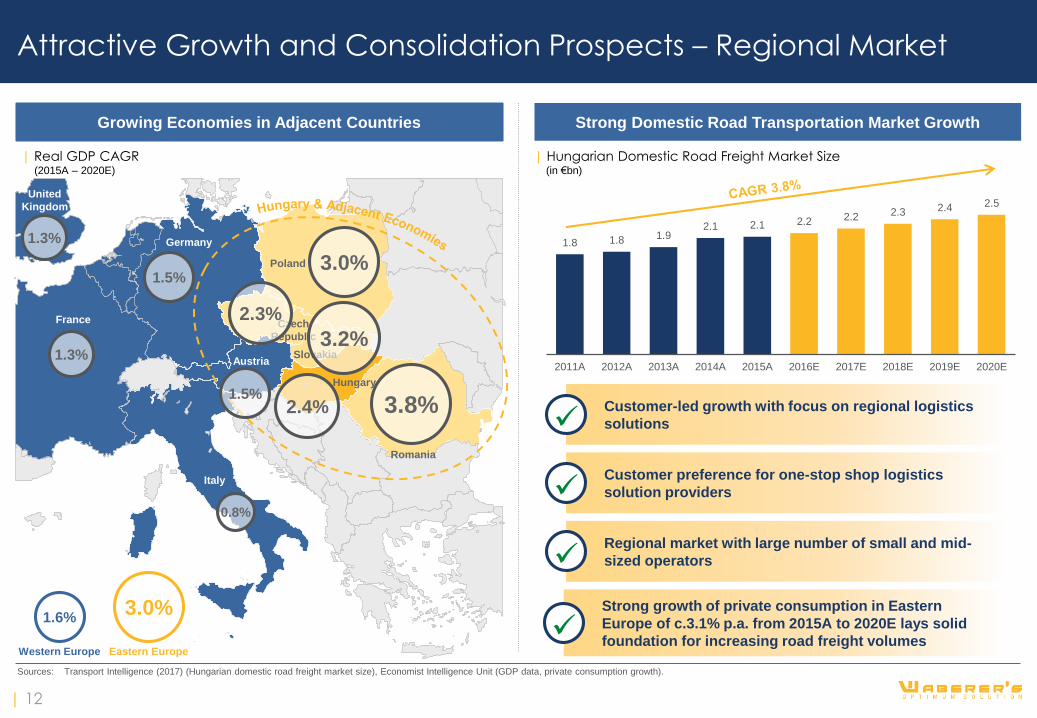
1.8 1.8 1.92.1 2.1 2.2 2.2 2.3 2.4 2.5
2011A 2012A 2013A 2014A 2015A 2016E 2017E 2018E 2019E 2020E
Attractive Growth and Consolidation Prospects – Regional Market
Growing Economies in Adjacent Countries Strong Domestic Road Transportation Market Growth
| Real GDP CAGR(2015A – 2020E)
Sources: Transport Intelligence (2017) (Hungarian domestic road freight market size), Economist Intelligence Unit (GDP data, private consumption growth).
Customer-led growth with focus on regional logistics
solutions
Customer preference for one-stop shop logistics
solution providers
Regional market with large number of small and mid-
sized operators
| Hungarian Domestic Road Freight Market Size(in €bn)
Hungary
2.4%
Italy
0.8%
Germany
1.5%
Austria
1.5%
Czech
Republic
2.3%
Slovakia3.2%
Poland 3.0%
3.8%
Romania
3.0%1.6%
Western Europe Eastern Europe
France
1.3%
Strong growth of private consumption in Eastern
Europe of c.3.1% p.a. from 2015A to 2020E lays solid
foundation for increasing road freight volumes
United
Kingdom
1.3%
| 12
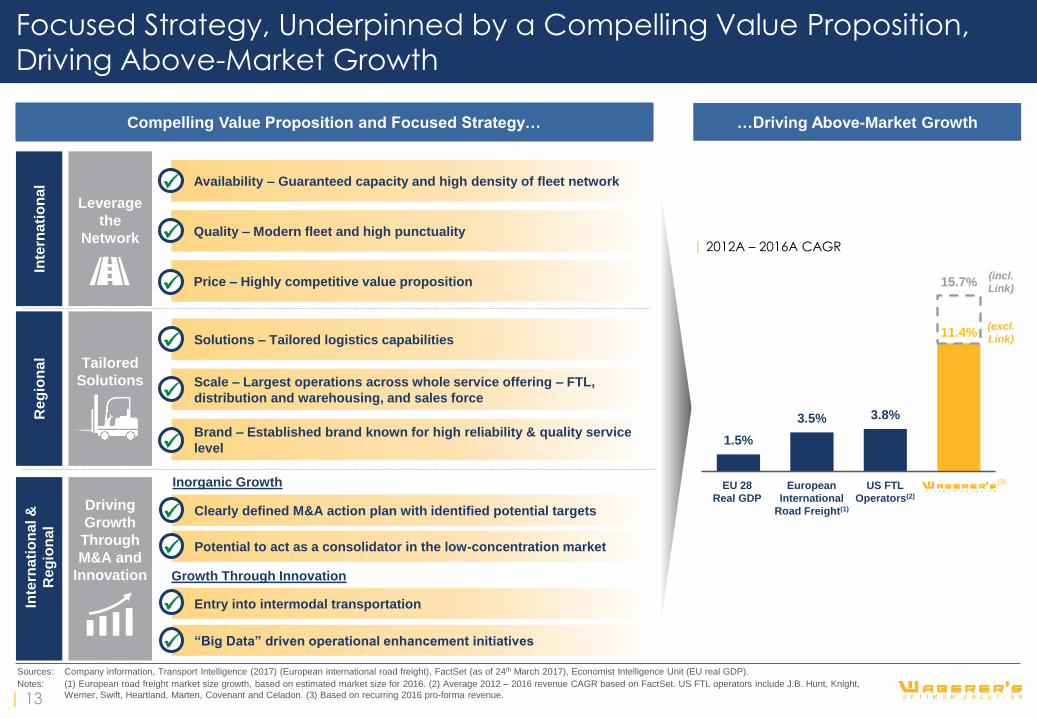
Focused Strategy, Underpinned by a Compelling Value Proposition,
Driving Above-Market Growth
Compelling Value Proposition and Focused Strategy… …Driving Above-Market Growth
Leverage
the
Network
Tailored
Solutions
Driving
Growth
Through
M&A and
Innovation
Solutions – Tailored logistics capabilities
Scale – Largest operations across whole service offering – FTL,
distribution and warehousing, and sales force
Brand – Established brand known for high reliability & quality service
level
11.4%
1.5%
3.5% 3.8%
15.7%
Clearly defined M&A action plan with identified potential targets
Potential to act as a consolidator in the low-concentration market
Entry into intermodal transportation
“Big Data” driven operational enhancement initiatives
Inorganic Growth
Growth Through Innovation
Sources: Company information, Transport Intelligence (2017) (European international road freight), FactSet (as of 24th March 2017), Economist Intelligence Unit (EU real GDP).
Notes: (1) European road freight market size growth, based on estimated market size for 2016. (2) Average 2012 – 2016 revenue CAGR based on FactSet. US FTL operators include J.B. Hunt, Knight,
Werner, Swift, Heartland, Marten, Covenant and Celadon. (3) Based on recurring 2016 pro-forma revenue.
| 2012A – 2016A CAGR
European
International
Road Freight(1)
US FTL
Operators(2)
(3)EU 28
Real GDP
Availability – Guaranteed capacity and high density of fleet network
Quality – Modern fleet and high punctuality
Price – Highly competitive value proposition
Inte
rna
tio
na
lR
eg
ion
al
Inte
rna
tio
na
l &
Re
gio
na
l
(excl.
Link)
(incl.
Link)
| 13
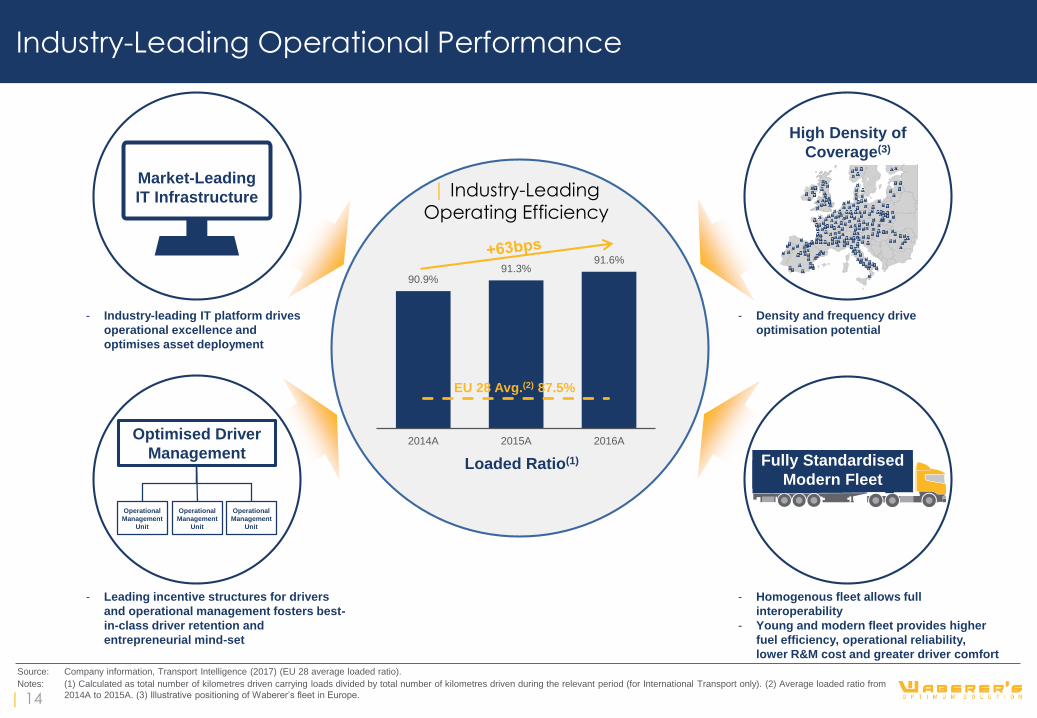
High Density of
Coverage(3)
Industry-Leading Operational Performance
| Industry-Leading Operating Efficiency
Loaded Ratio(1)
Source: Company information, Transport Intelligence (2017) (EU 28 average loaded ratio).
Notes: (1) Calculated as total number of kilometres driven carrying loads divided by total number of kilometres driven during the relevant period (for International Transport only). (2) Average loaded ratio from
2014A to 2015A. (3) Illustrative positioning of Waberer’s fleet in Europe.
90.9%91.3%
91.6%
2014A 2015A 2016A
EU 28 Avg.(2) 87.5%
- Industry-leading IT platform drives
operational excellence and
optimises asset deployment
- Leading incentive structures for drivers
and operational management fosters best-
in-class driver retention and
entrepreneurial mind-set
- Density and frequency drive
optimisation potential
- Homogenous fleet allows full
interoperability
- Young and modern fleet provides higher
fuel efficiency, operational reliability,
lower R&M cost and greater driver comfort
Fully Standardised
Modern Fleet
Optimised Driver
Management
Operational
Management
Unit
Operational
Management
Unit
Operational
Management
Unit
Market-Leading
IT Infrastructure
| 14
FMCG23%
Automotive16%
Electronics12%
Freight Forwarders
11%
Retail5%
Construction & Packaging
2%
Non-Classified31%
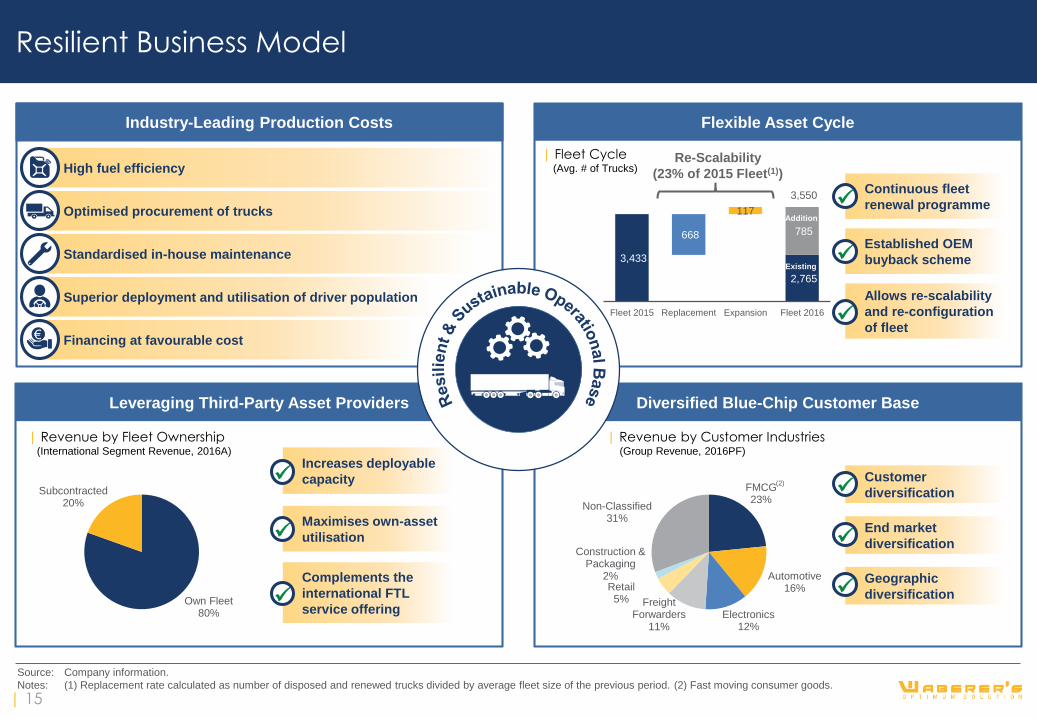
3,433
2,765
668 785
117
3,550
Fleet 2015 Replacement Expansion Fleet 2016
Continuous fleet
renewal programme
Established OEM
buyback scheme
Allows re-scalability
and re-configuration
of fleet
Resilient Business Model
Source: Company information.
Notes: (1) Replacement rate calculated as number of disposed and renewed trucks divided by average fleet size of the previous period. (2) Fast moving consumer goods.
Industry-Leading Production Costs
Leveraging Third-Party Asset Providers
Flexible Asset Cycle
Diversified Blue-Chip Customer Base
High fuel efficiency
Optimised procurement of trucks
Standardised in-house maintenance
| Revenue by Fleet Ownership(International Segment Revenue, 2016A)
Customer
diversification
End market
diversification
Geographic
diversification
| Fleet Cycle(Avg. # of Trucks)
Increases deployable
capacity
Maximises own-asset
utilisation
Complements the
international FTL
service offering
Re-Scalability
(23% of 2015 Fleet(1))
Addition
Existing
Superior deployment and utilisation of driver population
Financing at favourable cost
| Revenue by Customer Industries(Group Revenue, 2016PF)
(2)
Own Fleet80%
Subcontracted20%
€
| 15
Agenda
| Waberer’s Highlights
| Investment Case
| Appendix
| H1 2017 Results Highlights
| Diversified, Blue-Chip Customer Base
| Platform for Growth Through M&A
| Identified M&A Selection Criteria
| Polish Acquisition
| Industry Recognised and Highly Regarded Board of Directors
| Financial Statements
| 16
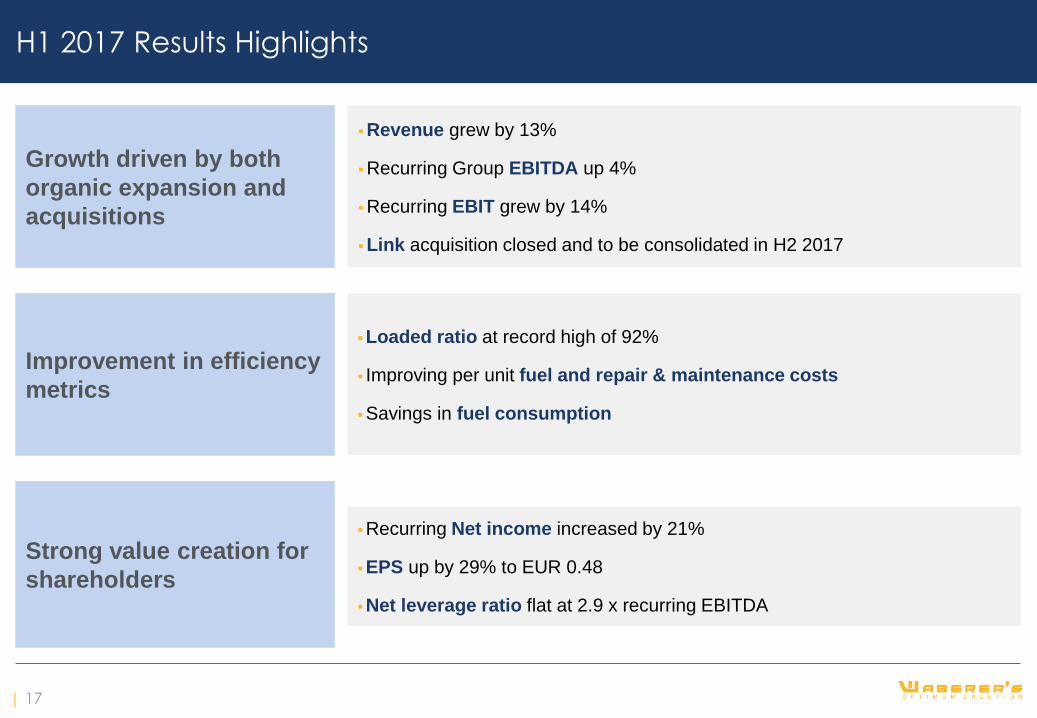
H1 2017 Results Highlights
Revenue grew by 13%
Recurring Group EBITDA up 4%
Recurring EBIT grew by 14%
Link acquisition closed and to be consolidated in H2 2017
Growth driven by both
organic expansion and
acquisitions
Strong value creation for
shareholders
Recurring Net income increased by 21%
EPS up by 29% to EUR 0.48
Net leverage ratio flat at 2.9 x recurring EBITDA
Improvement in efficiency
metrics
Loaded ratio at record high of 92%
Improving per unit fuel and repair & maintenance costs
Savings in fuel consumption
| 17
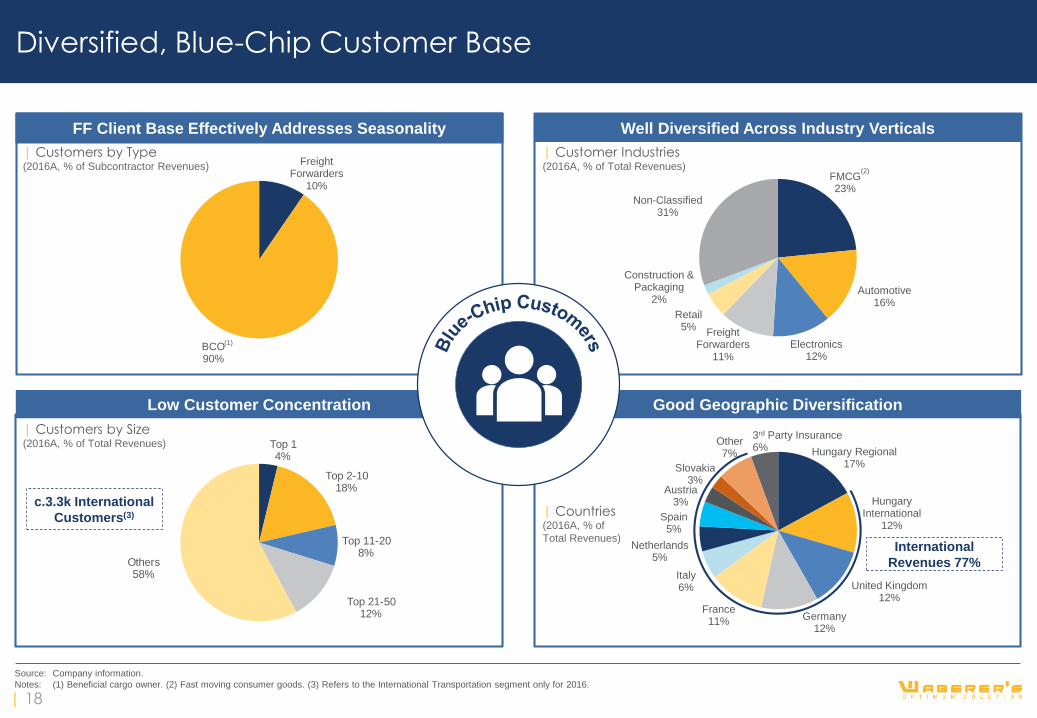
FMCG23%
Automotive16%
Electronics12%
Freight Forwarders
11%
Retail5%
Construction & Packaging
2%
Non-Classified31%
Freight Forwarders
10%
BCO90%
Hungary Regional17%
Hungary International
12%
United Kingdom12%
Germany12%
France11%
Italy6%
Netherlands5%
Spain5%
Austria3%
Slovakia3%
Other7%
3rd Party Insurance 6%
Diversified, Blue-Chip Customer Base
Source: Company information.
Notes: (1) Beneficial cargo owner. (2) Fast moving consumer goods. (3) Refers to the International Transportation segment only for 2016.
Top 14%
Top 2-1018%
Top 11-208%
Top 21-5012%
Others58%
Low Customer Concentration Good Geographic Diversification
| Customer Industries(2016A, % of Total Revenues)
| Customers by Size(2016A, % of Total Revenues)
| Countries(2016A, % of
Total Revenues)
| Customers by Type(2016A, % of Subcontractor Revenues)
(1)
FF Client Base Effectively Addresses Seasonality Well Diversified Across Industry Verticals
(2)
c.3.3k International
Customers(3)
International
Revenues 77%
| 18

Platform for Growth Through M&A
Source: Company information.
M&A Objectives
Extended geographical coverage to access new labour
and customer markets
Build incremental FTL scale
Expand customer base
Expand regional offering to new industry verticals and
value-added services
Applying industry-leading technology to harvest
synergies and extract value
Industry-leading operating platform
Committed to Inorganic Growth
| Successfully acquired and integrated several companies in the
past, both domestically and internationally
| Committed to act as a consolidator to capitalise on the potential
opportunities in the highly fragmented international and regional
markets
─ Team in place that continuously monitors the market for relevant
acquisition opportunities
| Several targets identified:
─ Structured approach to selection
─ Coherence with growth, margin and operational targets ensured
2002
Acquisition of Hungarocamion(1,200 trucks acquired)
2007
Acquisition of Révész Eurotrans
(424 trucks acquired)
2013
Acquisition of Szemerey
(465 trucks acquired)
2016
Acquisition of
WHB Insurance
CEO joined the group,
i.e. participating in
successful integration
of several targets
2017
Acquisition of Link
(427 trucks acquired)
| 19

English as
corporate language
English as
corporate language
Identified M&A Selection Criteria
Source: Company information.
| Size– Focus on mid-sized
operators
– Quality book
of business
– Scope for operational
improvement
– Economies of scale
Revenue:
>€50mEquity Value:
€30–50m
| Geography
– Expansion into
high-growth CEE
economies key priority
| Business Focus
– Operational focus on
standardised asset-based
operations
– Coherence with
existing strategy of
international segment
| Management
– Compatibility with Waberer’s
management, organisation and
location is key
– Ensure ease of integration and
subsequent operation
Strong FTL
expertise
Geographic
accessibility
FTL
1
2
3
4
CEE contract logistics
for standardised cargo
| Size
– Focus on small and
mid-sized
logistics providers
– Quality book
of business
Revenue:
€20–50mEquity Value:
Up to €50m
| Geography
– Regional expansion
– High-growth adjacent
countries
| Business Focus
– Expansion into new
industry verticals
– Operations focussed around
warehousing and
value-added services
| Management
– Compatibility with Waberer’s
management, organisation and
location is key
– Ensure ease of integration and
subsequent operation
Strong logistics
expertise
Geographic
accessibility
Warehousing
Value
Added
Services
Distribution
Electronics
Automotive
Fresh
Retail
1
2
3
4
Regional LogisticsInternational Transportation
FMCG
Fleet Size:
>300 Trucks
Number of Identified Potential Targets: c.20 – 25
Healthy diversification
of customer baseHealthy diversification
of customer base
PL SKCZ PL SISK
| 20
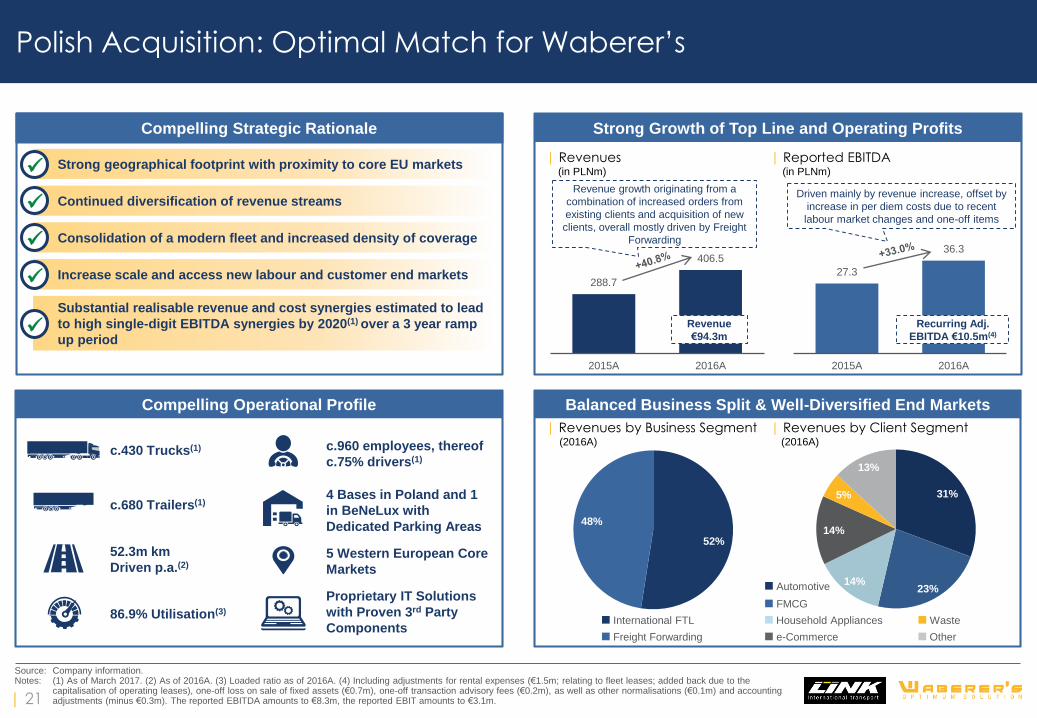
31%
23% 14%
14%
5%
13%
52%
48%
27.3
36.3
2015A 2016A
288.7
406.5
2015A 2016A
Source: Company information.Notes: (1) As of March 2017. (2) As of 2016A. (3) Loaded ratio as of 2016A. (4) Including adjustments for rental expenses (€1.5m; relating to fleet leases; added back due to the
capitalisation of operating leases), one-off loss on sale of fixed assets (€0.7m), one-off transaction advisory fees (€0.2m), as well as other normalisations (€0.1m) and accounting adjustments (minus €0.3m). The reported EBITDA amounts to €8.3m, the reported EBIT amounts to €3.1m.
| Revenues by Client Segment(2016A)
Automotive
FMCG
Othere-Commerce
Household Appliances Waste
| Revenues by Business Segment(2016A)
International FTL
Freight Forwarding
Balanced Business Split & Well-Diversified End Markets
Strong Growth of Top Line and Operating Profits
| Revenues(in PLNm)
| Reported EBITDA(in PLNm)
Revenue
€94.3m
Recurring Adj.
EBITDA €10.5m(4)
Driven mainly by revenue increase, offset by
increase in per diem costs due to recent
labour market changes and one-off items
Revenue growth originating from a
combination of increased orders from
existing clients and acquisition of new
clients, overall mostly driven by Freight
Forwarding
Polish Acquisition: Optimal Match for Waberer’s
Compelling Strategic Rationale
c.960 employees, thereof
c.75% drivers(1)
4 Bases in Poland and 1
in BeNeLux with
Dedicated Parking Areas
c.430 Trucks(1)
c.680 Trailers(1)
Proprietary IT Solutions
with Proven 3rd Party
Components
Compelling Operational Profile
52.3m km
Driven p.a.(2)
86.9% Utilisation(3)
5 Western European Core
Markets
Strong geographical footprint with proximity to core EU markets
Continued diversification of revenue streams
Consolidation of a modern fleet and increased density of coverage
Substantial realisable revenue and cost synergies estimated to lead
to high single-digit EBITDA synergies by 2020(1) over a 3 year ramp
up period
Increase scale and access new labour and customer end markets
| 21
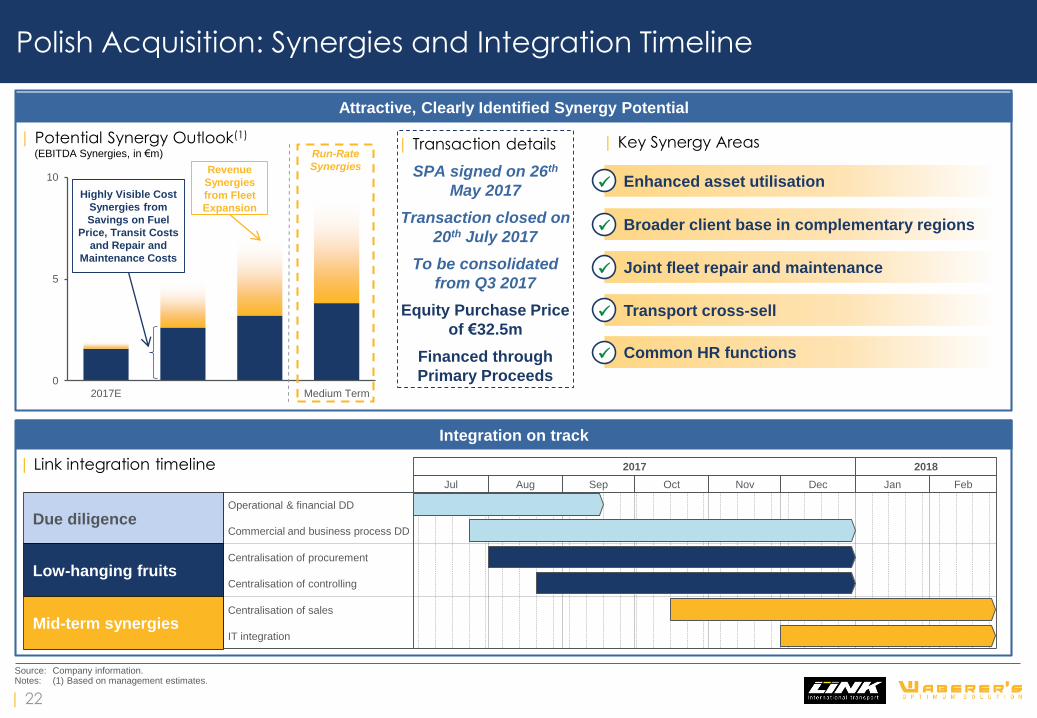
0
5
10
2017E Medium Term
Polish Acquisition: Synergies and Integration Timeline
Source: Company information.Notes: (1) Based on management estimates.
Attractive, Clearly Identified Synergy Potential
Integration on track
Broader client base in complementary regions
Joint fleet repair and maintenance
Common HR functions
Transport cross-sell
| Key Synergy Areas| Potential Synergy Outlook(1)
(EBITDA Synergies, in €m) Run-Rate
Synergies
Highly Visible Cost
Synergies from
Savings on Fuel
Price, Transit Costs
and Repair and
Maintenance Costs
Revenue
Synergies
from Fleet
Expansion
| Transaction details
SPA signed on 26th
May 2017
Transaction closed on
20th July 2017
To be consolidated
from Q3 2017
Equity Purchase Price
of €32.5m
Financed through
Primary Proceeds
Enhanced asset utilisation
2017 2018
Jul Aug Sep Oct Nov Dec Jan Feb
IT integration
Centralisation of procurement
Commercial and business process DD
Operational & financial DD
Centralisation of sales
Centralisation of controlling
Due diligence
Low-hanging fruits
Mid-term synergies
| 22
| Link integration timeline
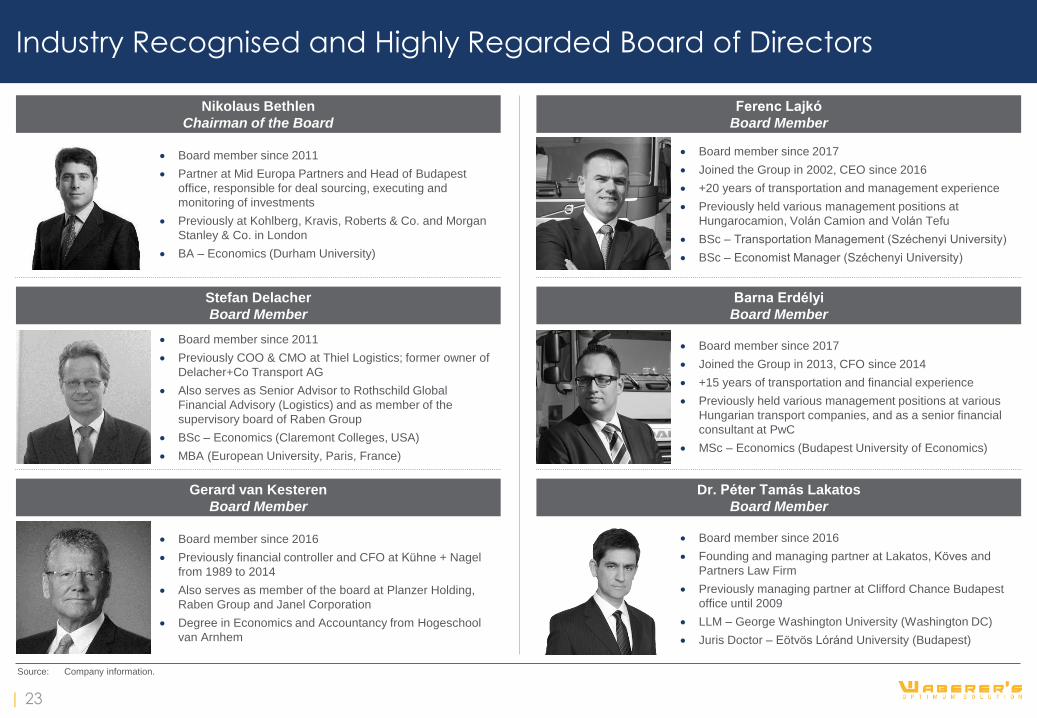
Board member since 2017
Joined the Group in 2002, CEO since 2016
+20 years of transportation and management experience
Previously held various management positions at
Hungarocamion, Volán Camion and Volán Tefu
BSc – Transportation Management (Széchenyi University)
BSc – Economist Manager (Széchenyi University)
Ferenc Lajkó
Board Member
Board member since 2017
Joined the Group in 2013, CFO since 2014
+15 years of transportation and financial experience
Previously held various management positions at various
Hungarian transport companies, and as a senior financial
consultant at PwC
MSc – Economics (Budapest University of Economics)
Barna Erdélyi
Board Member
Board member since 2011
Previously COO & CMO at Thiel Logistics; former owner of
Delacher+Co Transport AG
Also serves as Senior Advisor to Rothschild Global
Financial Advisory (Logistics) and as member of the
supervisory board of Raben Group
BSc – Economics (Claremont Colleges, USA)
MBA (European University, Paris, France)
Stefan Delacher
Board Member
Board member since 2016
Previously financial controller and CFO at Kühne + Nagel
from 1989 to 2014
Also serves as member of the board at Planzer Holding,
Raben Group and Janel Corporation
Degree in Economics and Accountancy from Hogeschool
van Arnhem
Source: Company information.
Industry Recognised and Highly Regarded Board of Directors
Gerard van Kesteren
Board Member
Board member since 2011
Partner at Mid Europa Partners and Head of Budapest
office, responsible for deal sourcing, executing and
monitoring of investments
Previously at Kohlberg, Kravis, Roberts & Co. and Morgan
Stanley & Co. in London
BA – Economics (Durham University)
Nikolaus Bethlen
Chairman of the Board
Board member since 2016
Founding and managing partner at Lakatos, Köves and
Partners Law Firm
Previously managing partner at Clifford Chance Budapest
office until 2009
LLM – George Washington University (Washington DC)
Juris Doctor – Eötvös Lóránd University (Budapest)
Dr. Péter Tamás Lakatos
Board Member
| 23
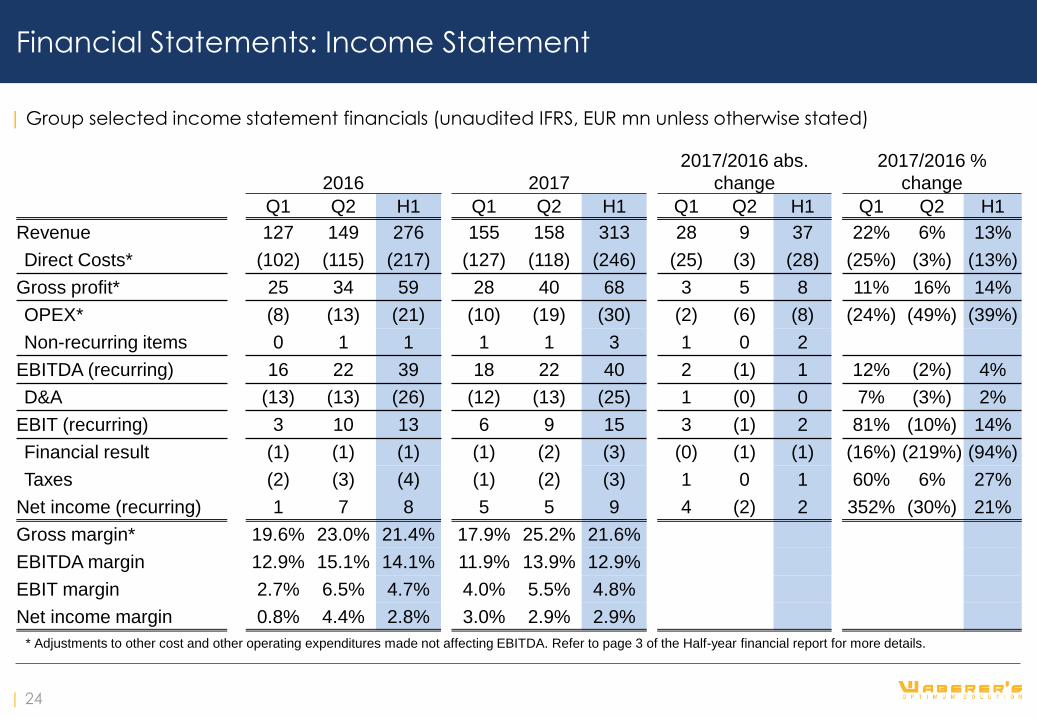
Financial Statements: Income Statement
| Group selected income statement financials (unaudited IFRS, EUR mn unless otherwise stated)
2016 2017
2017/2016 abs.
change
2017/2016 %
change
Q1 Q2 H1 Q1 Q2 H1 Q1 Q2 H1 Q1 Q2 H1
Revenue 127 149 276 155 158 313 28 9 37 22% 6% 13%
Direct Costs* (102) (115) (217) (127) (118) (246) (25) (3) (28) (25%) (3%) (13%)
Gross profit* 25 34 59 28 40 68 3 5 8 11% 16% 14%
OPEX* (8) (13) (21) (10) (19) (30) (2) (6) (8) (24%) (49%) (39%)
Non-recurring items 0 1 1 1 1 3 1 0 2
EBITDA (recurring) 16 22 39 18 22 40 2 (1) 1 12% (2%) 4%
D&A (13) (13) (26) (12) (13) (25) 1 (0) 0 7% (3%) 2%
EBIT (recurring) 3 10 13 6 9 15 3 (1) 2 81% (10%) 14%
Financial result (1) (1) (1) (1) (2) (3) (0) (1) (1) (16%) (219%) (94%)
Taxes (2) (3) (4) (1) (2) (3) 1 0 1 60% 6% 27%
Net income (recurring) 1 7 8 5 5 9 4 (2) 2 352% (30%) 21%
Gross margin* 19.6% 23.0% 21.4% 17.9% 25.2% 21.6%
EBITDA margin 12.9% 15.1% 14.1% 11.9% 13.9% 12.9%
EBIT margin 2.7% 6.5% 4.7% 4.0% 5.5% 4.8%
Net income margin 0.8% 4.4% 2.8% 3.0% 2.9% 2.9%
* Adjustments to other cost and other operating expenditures made not affecting EBITDA. Refer to page 3 of the Half-year financial report for more details.
| 24
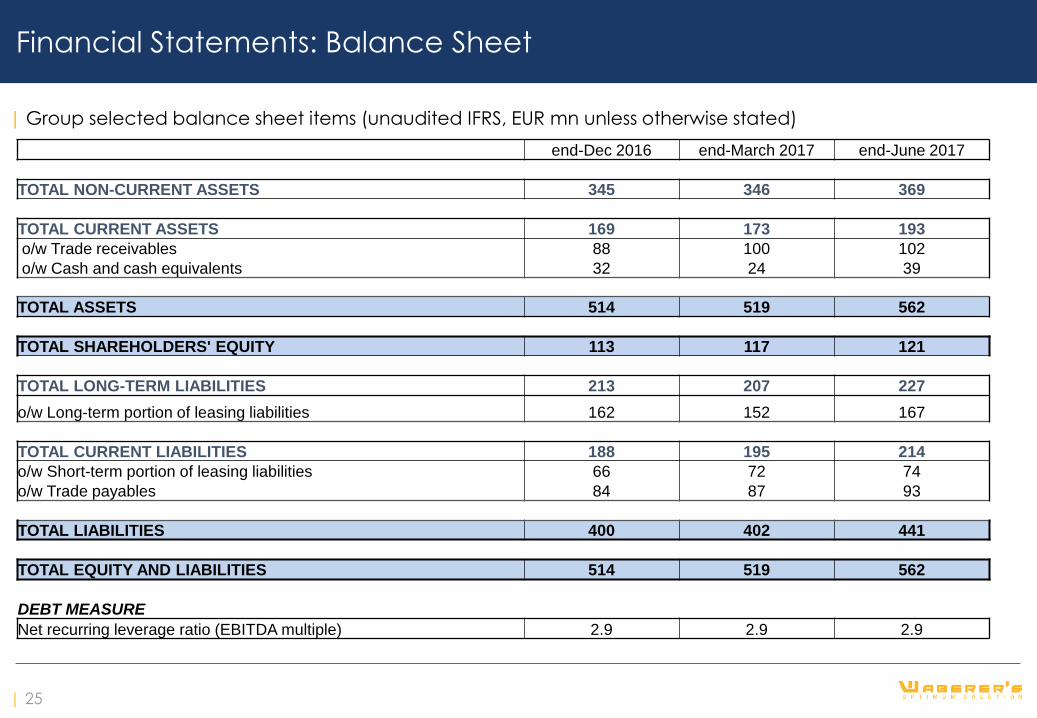
Financial Statements: Balance Sheet
| Group selected balance sheet items (unaudited IFRS, EUR mn unless otherwise stated)
end-Dec 2016 end-March 2017 end-June 2017
TOTAL NON-CURRENT ASSETS 345 346 369
TOTAL CURRENT ASSETS 169 173 193
o/w Trade receivables 88 100 102
o/w Cash and cash equivalents 32 24 39
TOTAL ASSETS 514 519 562
TOTAL SHAREHOLDERS' EQUITY 113 117 121
TOTAL LONG-TERM LIABILITIES 213 207 227
o/w Long-term portion of leasing liabilities 162 152 167
TOTAL CURRENT LIABILITIES 188 195 214
o/w Short-term portion of leasing liabilities 66 72 74
o/w Trade payables 84 87 93
TOTAL LIABILITIES 400 402 441
TOTAL EQUITY AND LIABILITIES 514 519 562
DEBT MEASURE
Net recurring leverage ratio (EBITDA multiple) 2.9 2.9 2.9
| 25
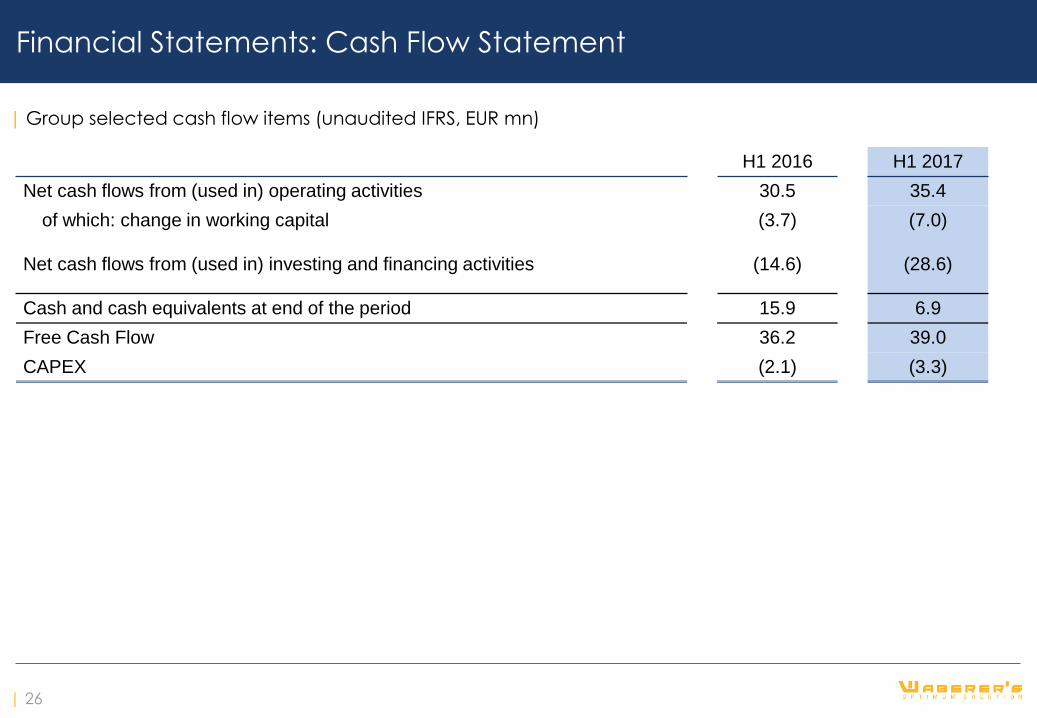
Financial Statements: Cash Flow Statement
| Group selected cash flow items (unaudited IFRS, EUR mn)
H1 2016 H1 2017
Net cash flows from (used in) operating activities 30.5 35.4
of which: change in working capital (3.7) (7.0)
Net cash flows from (used in) investing and financing activities (14.6) (28.6)
Cash and cash equivalents at end of the period 15.9 6.9
Free Cash Flow 36.2 39.0
CAPEX (2.1) (3.3)
| 26
WABERER’S INTERNATIONAL Nyrt.
H-1239 Budapest, Nagykőrösi út 351.
Tel: +36 1 421 6300
E-mail: [email protected]


![INTRODUCTION 1 - AC Transit · [13] Consolidated Budget (in US$ thousands) Budget Period Ending June 30 2013A 2014A 2015A 2016B 2017E 2018E 2019E 2020E 2021E Line Revenue 1 Operating](https://img.pdfslide.us/doc/110x75/5e015cde4742db518308cf27/introduction-1-ac-13-consolidated-budget-in-us-thousands-budget-period-ending.jpg)