Embed Size (px)
Citation preview
1
Waarom rijden we niet allemaal elektrisch?Why don’t we all ride electric buses?Erik Lenz 05.10.2016 VOC Arnhem
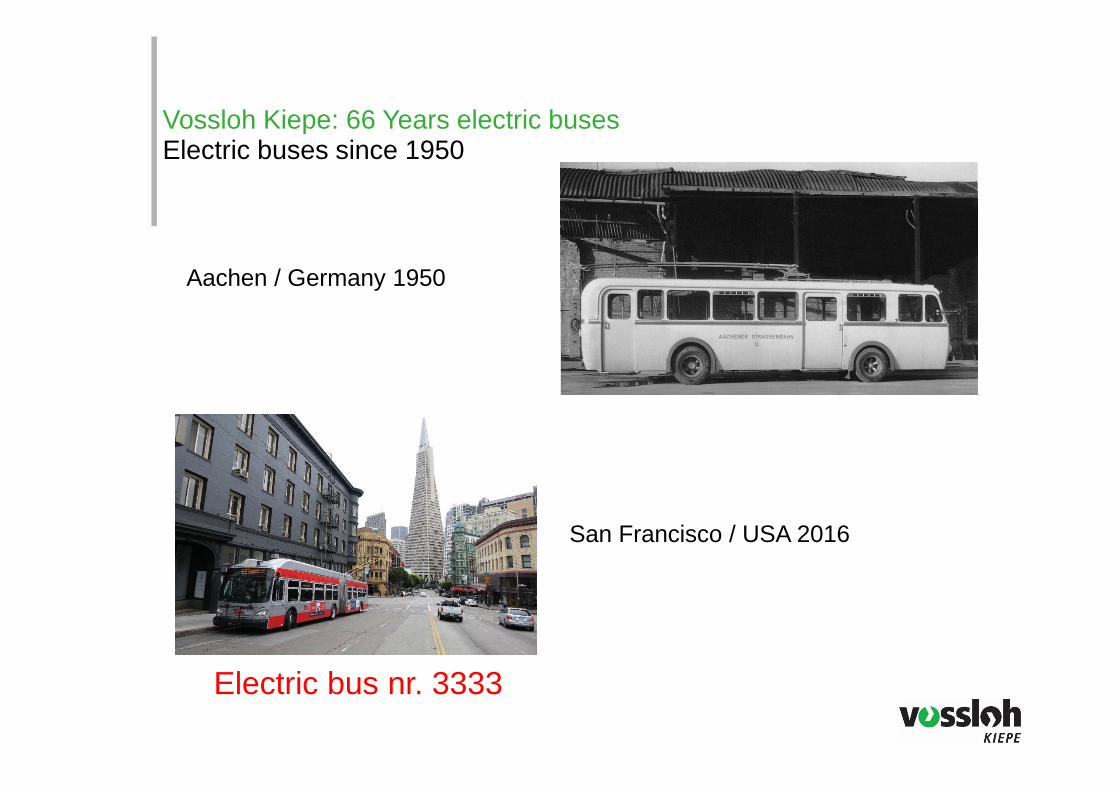
Vossloh Kiepe: 66 Years electric busesElectric buses since 1950
Electric bus nr. 3333
Aachen / Germany 1950
San Francisco / USA 2016
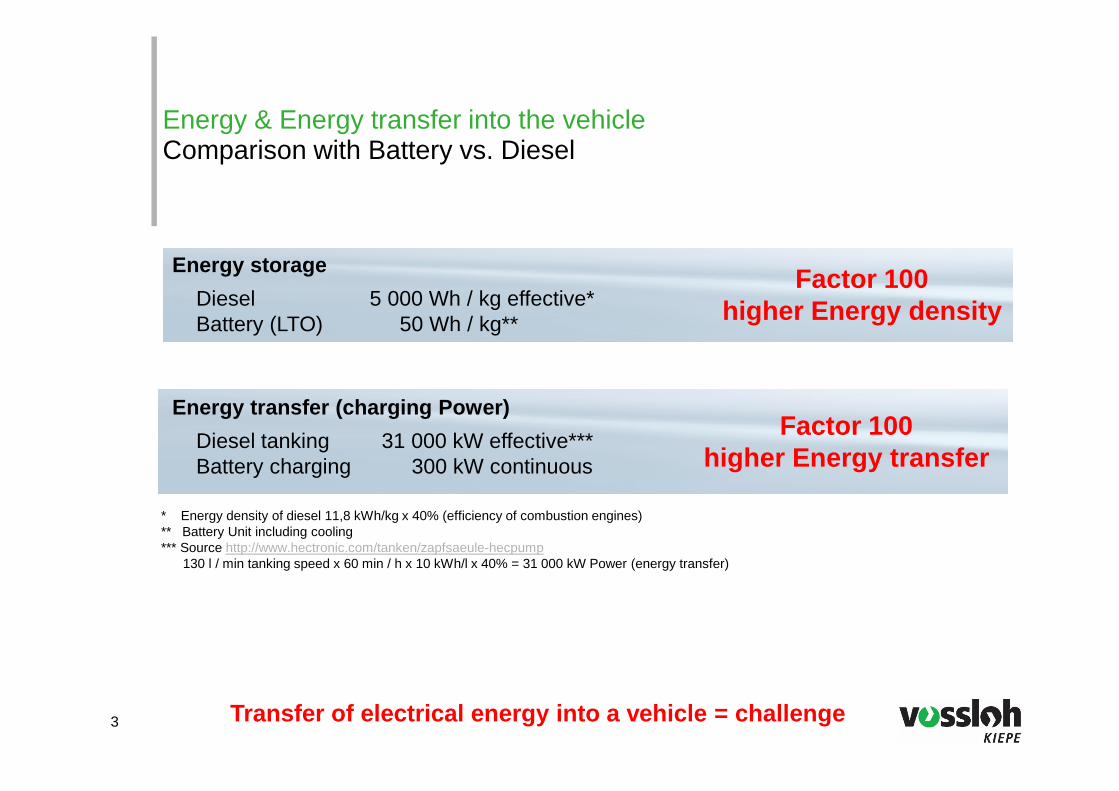
Energy & Energy transfer into the vehicleComparison with Battery vs. Diesel
Energy storage
Diesel 5 000 Wh / kg effective*Battery (LTO) 50 Wh / kg**
Factor 100 higher Energy density
Energy transfer (charging Power)
Diesel tanking 31 000 kW effective***Battery charging 300 kW continuous
Factor 100higher Energy transfer
* Energy density of diesel 11,8 kWh/kg x 40% (efficiency of combustion engines)** Battery Unit including cooling*** Source http://www.hectronic.com/tanken/zapfsaeule-hecpump
130 l / min tanking speed x 60 min / h x 10 kWh/l x 40% = 31 000 kW Power (energy transfer)
3 Transfer of electrical energy into a vehicle = chal lenge
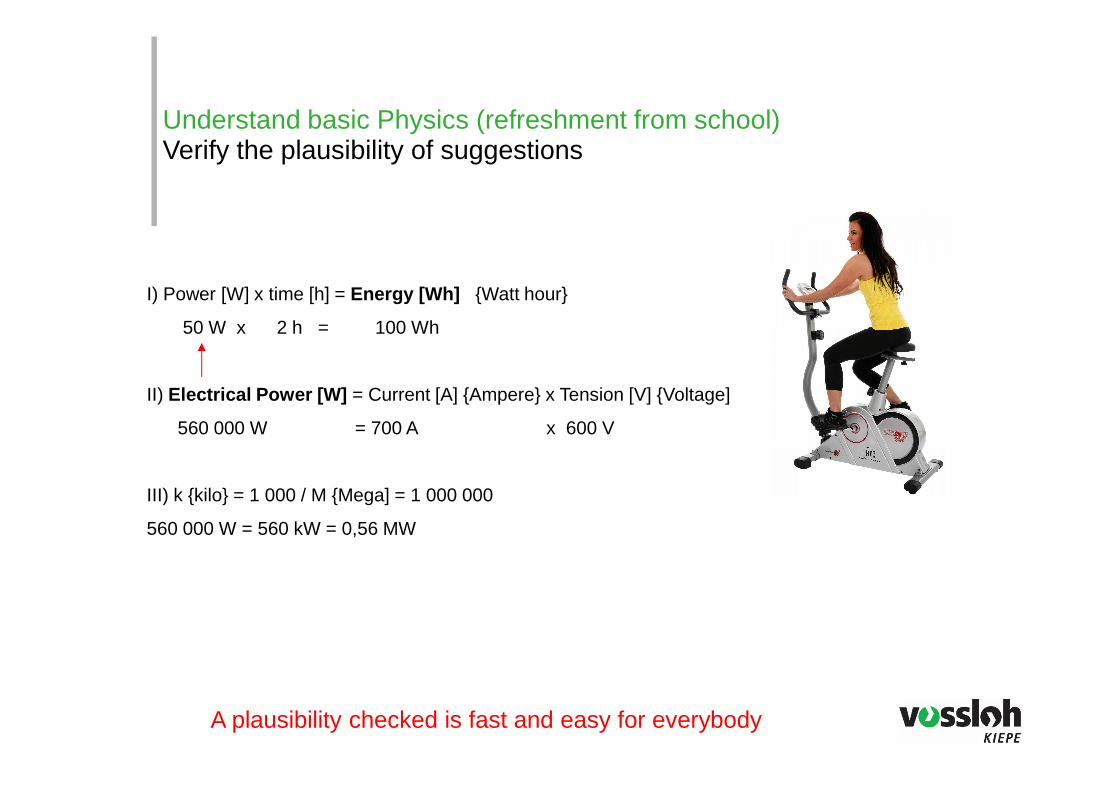
Understand basic Physics (refreshment from school)Verify the plausibility of suggestions
I) Power [W] x time [h] = Energy [Wh] {Watt hour}
50 W x 2 h = 100 Wh
II) Electrical Power [W] = Current [A] {Ampere} x Tension [V] {Voltage]
560 000 W = 700 A x 600 V
III) k {kilo} = 1 000 / M {Mega] = 1 000 000
560 000 W = 560 kW = 0,56 MW
A plausibility checked is fast and easy for everybody
Understand basic Physics (refreshment from school)Verify the plausibility of concepts
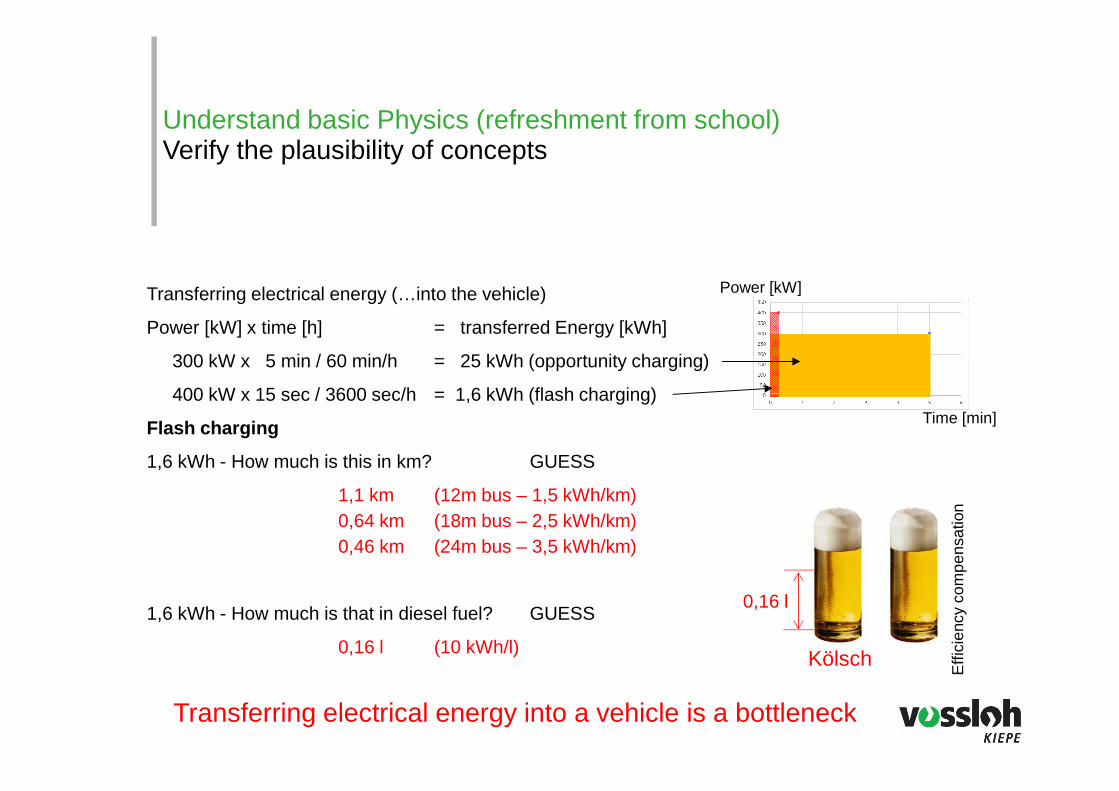
Transferring electrical energy (…into the vehicle)
Power [kW] x time [h] = transferred Energy [kWh]
300 kW x 5 min / 60 min/h = 25 kWh (opportunity charging)
400 kW x 15 sec / 3600 sec/h = 1,6 kWh (flash charging)
Flash charging
1,6 kWh - How much is this in km? GUESS
1,1 km (12m bus – 1,5 kWh/km) 0,64 km (18m bus – 2,5 kWh/km)0,46 km (24m bus – 3,5 kWh/km)
1,6 kWh - How much is that in diesel fuel? GUESS
0,16 l (10 kWh/l)Kölsch
0,16 l
Transferring electrical energy into a vehicle is a bottleneck
Power [kW]
Time [min]
Effi
cien
cy c
ompe
nsat
ion
Charging electrical energy Defining the limits by 3 parameters
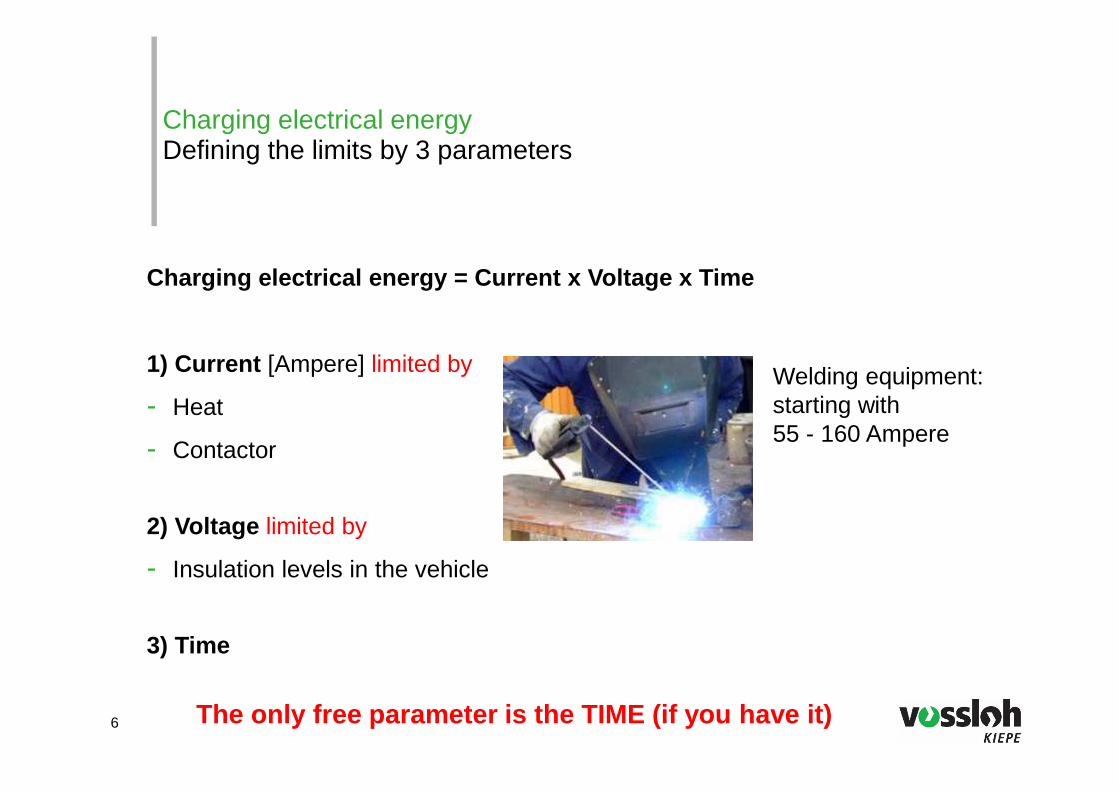
Charging electrical energy = Current x Voltage x Ti me
1) Current [Ampere] limited by
- Heat
- Contactor
2) Voltage limited by
- Insulation levels in the vehicle
3) Time
6
Welding equipment: starting with 55 - 160 Ampere
The only free parameter is the TIME (if you have it )
Energy
18 hrs Time [h]
Power[MW]
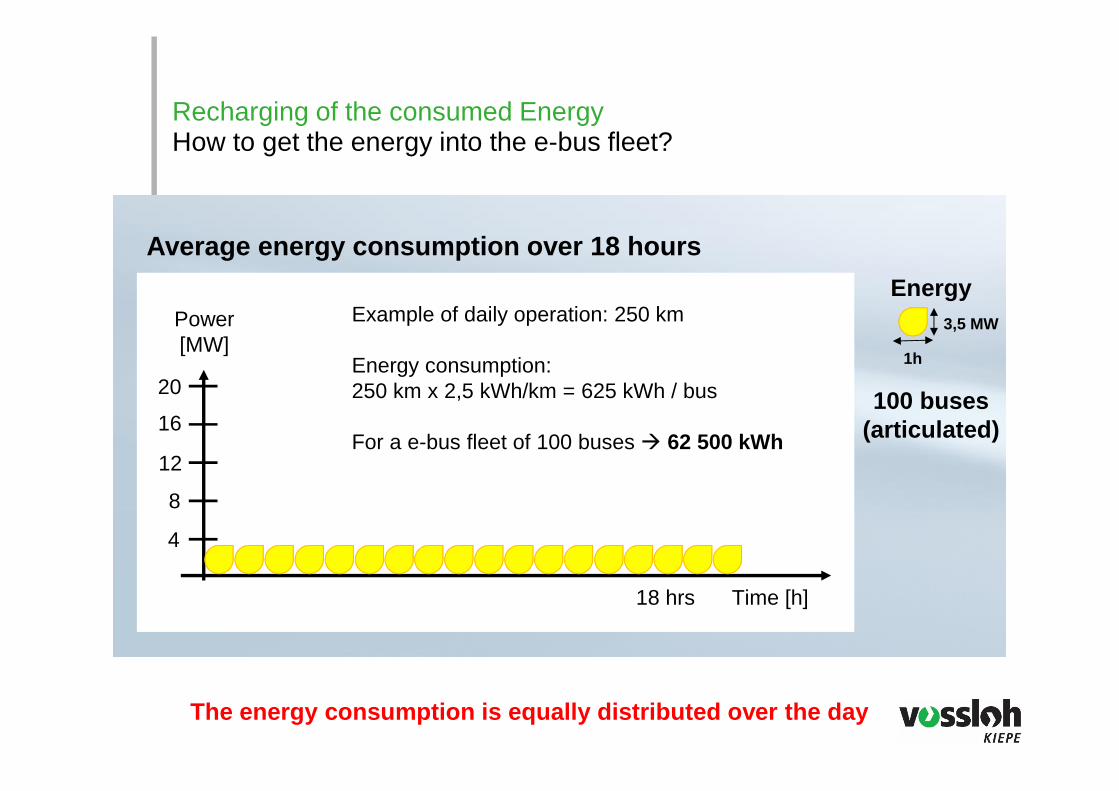
Average energy consumption over 18 hours
100 buses(articulated)
Example of daily operation: 250 km
Energy consumption:250 km x 2,5 kWh/km = 625 kWh / bus
For a e-bus fleet of 100 buses � 62 500 kWh
20
16
12
8
4
The energy consumption is equally distributed over the day
Recharging of the consumed Energy How to get the energy into the e-bus fleet?
1h
3,5 MW
3 hrs Time [h]
P[MW]
4
12
20
16
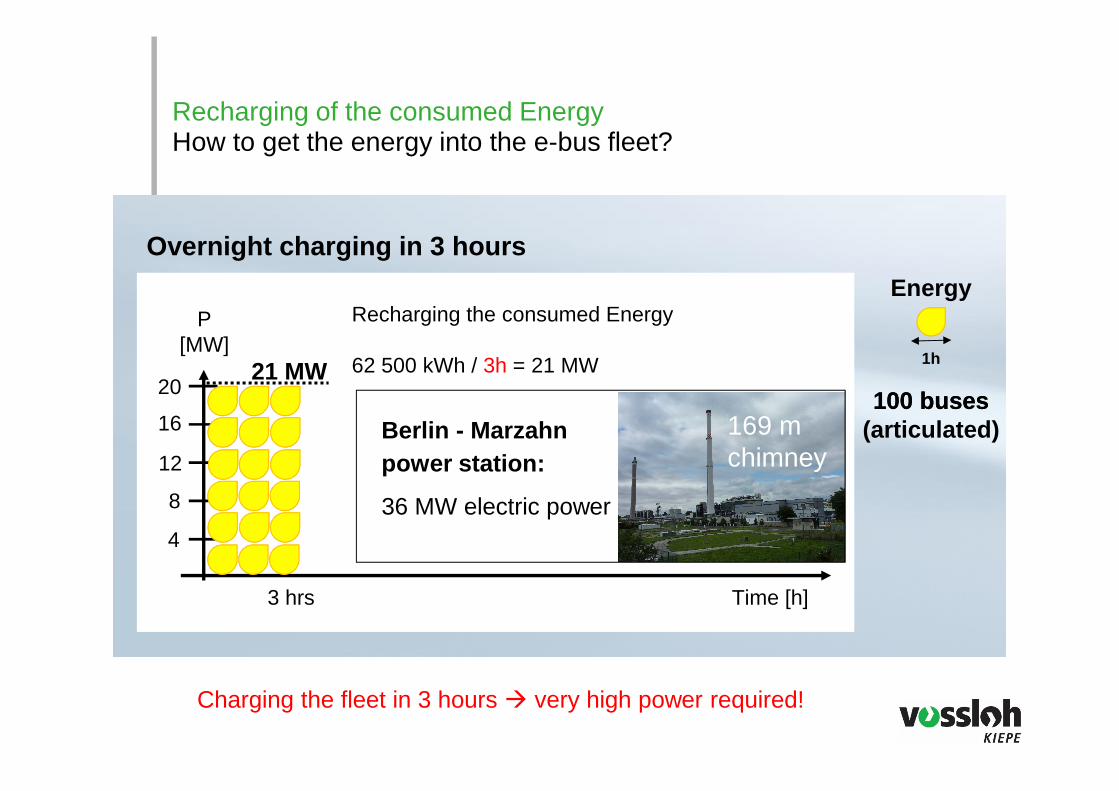
Overnight charging in 3 hours
Energy
1h
100 buses
Recharging the consumed Energy
62 500 kWh / 3h = 21 MW
8
21 MW100 buses
(articulated)
Charging the fleet in 3 hours � very high power required!
Recharging of the consumed Energy How to get the energy into the e-bus fleet?
Berlin - Marzahnpower station:
36 MW electric power
169 m chimney
optimized Time [h]
P[MW]
4
12
20
16
Energy
1h
8
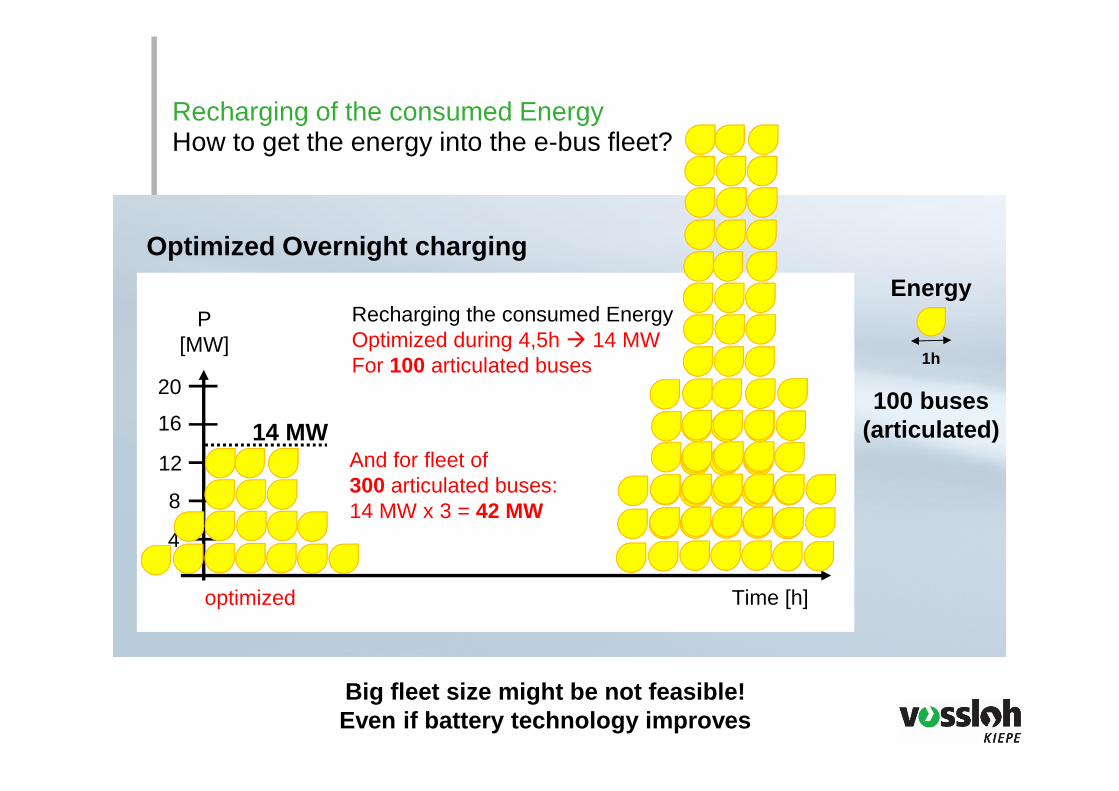
Big fleet size might be not feasible! Even if battery technology improves
14 MW100 buses
(articulated)And for fleet of300 articulated buses:14 MW x 3 = 42 MW
Recharging of the consumed Energy How to get the energy into the e-bus fleet?
Optimized Overnight charging
Recharging the consumed EnergyOptimized during 4,5h � 14 MW For 100 articulated buses
9 hrs Time [h]
P[MW]
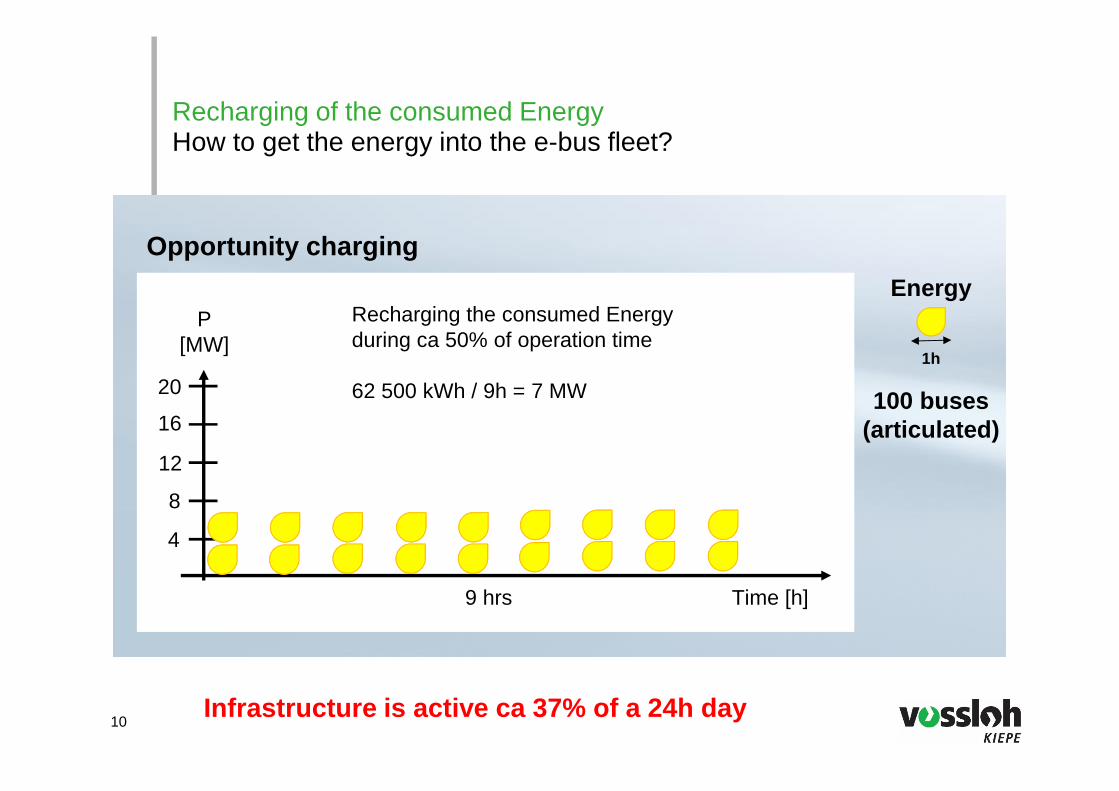
Opportunity charging
Energy
1h
4
8
12
16
20
Infrastructure is active ca 37% of a 24h day10
Recharging the consumed Energyduring ca 50% of operation time
62 500 kWh / 9h = 7 MW 100 buses(articulated)
Recharging of the consumed Energy How to get the energy into the e-bus fleet?
18 hrs Time [h]
P[MW]
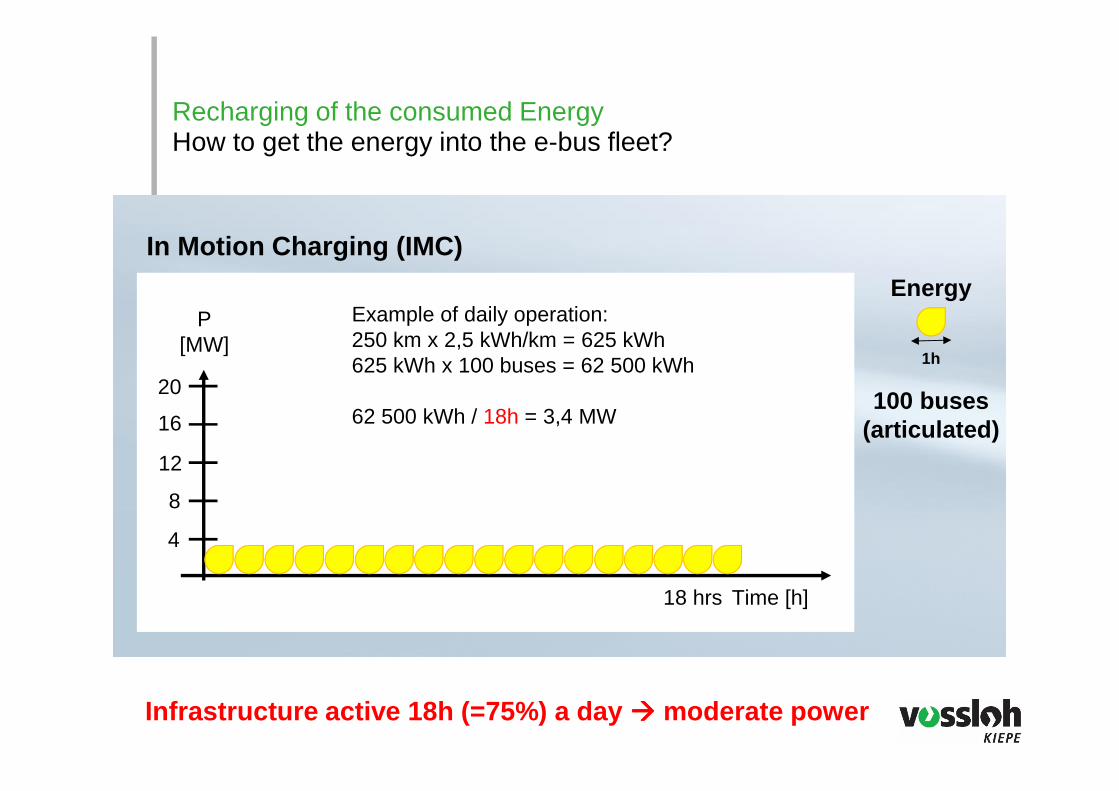
In Motion Charging (IMC)
Energy
1h
Example of daily operation: 250 km x 2,5 kWh/km = 625 kWh625 kWh x 100 buses = 62 500 kWh
62 500 kWh / 18h = 3,4 MW20
16
12
8
4
Infrastructure active 18h (=75%) a day ���� moderate power
100 buses(articulated)
Recharging of the consumed Energy How to get the energy into the e-bus fleet?
P[MW]
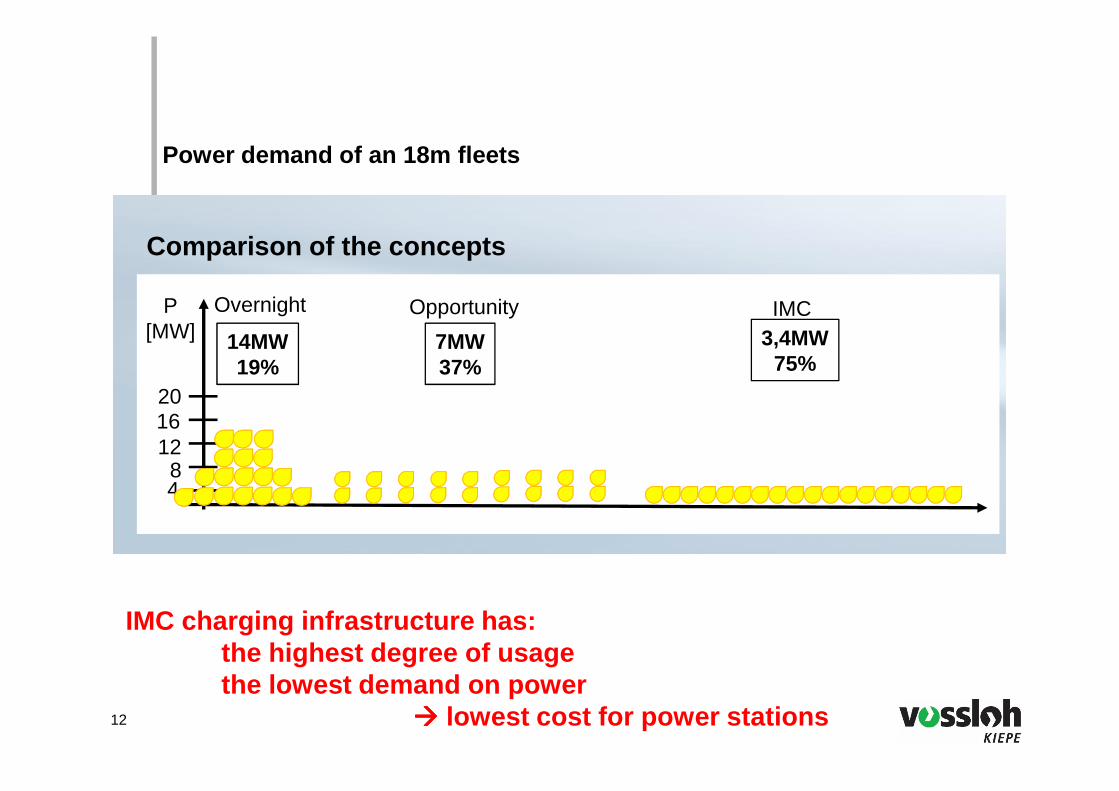
Comparison of the concepts
201612
84
Power demand of an 18m fleets
IMC charging infrastructure has:the highest degree of usagethe lowest demand on power
���� lowest cost for power stations
14MW19%
7MW37%
3,4MW75%
Overnight Opportunity IMC
12
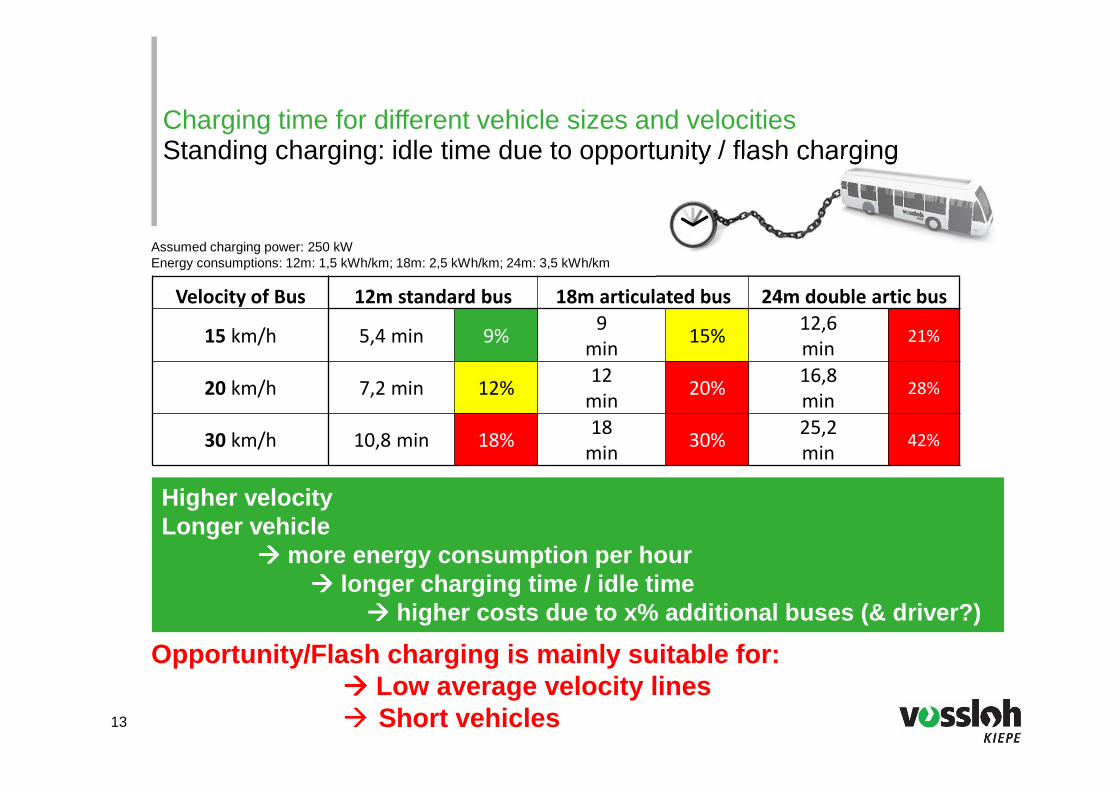
Charging time for different vehicle sizes and velocitiesStanding charging: idle time due to opportunity / flash charging
Velocity of Bus 12m standard bus 18m articulated bus 24m double artic bus
15 km/h 5,4 min 9%9
min15%
12,6
min21%
20 km/h 7,2 min 12%12
min20%
16,8
min28%
30 km/h 10,8 min 18%18
min30%
25,2
min42%
Assumed charging power: 250 kWEnergy consumptions: 12m: 1,5 kWh/km; 18m: 2,5 kWh/km; 24m: 3,5 kWh/km
Higher velocity Longer vehicle
���� more energy consumption per hour ���� longer charging time / idle time
���� higher costs due to x% additional buses (& driver?)
Opportunity/Flash charging is mainly suitable for: ���� Low average velocity lines� Short vehicles13
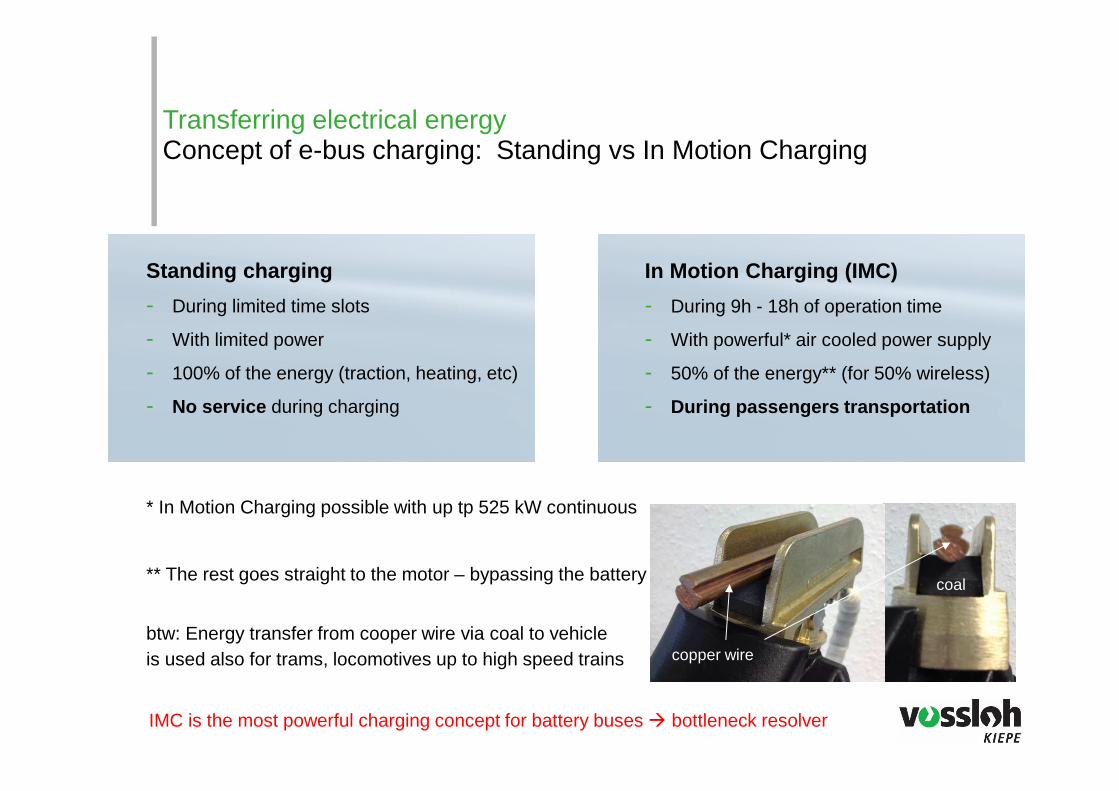
In Motion Charging (IMC)
- During 9h - 18h of operation time
- With powerful* air cooled power supply
- 50% of the energy** (for 50% wireless)
- During passengers transportation
Transferring electrical energy Concept of e-bus charging: Standing vs In Motion Charging
Standing charging
- During limited time slots
- With limited power
- 100% of the energy (traction, heating, etc)
- No service during charging
* In Motion Charging possible with up tp 525 kW continuous
** The rest goes straight to the motor – bypassing the battery
btw: Energy transfer from cooper wire via coal to vehicleis used also for trams, locomotives up to high speed trains copper wire
coal
IMC is the most powerful charging concept for battery buses � bottleneck resolver
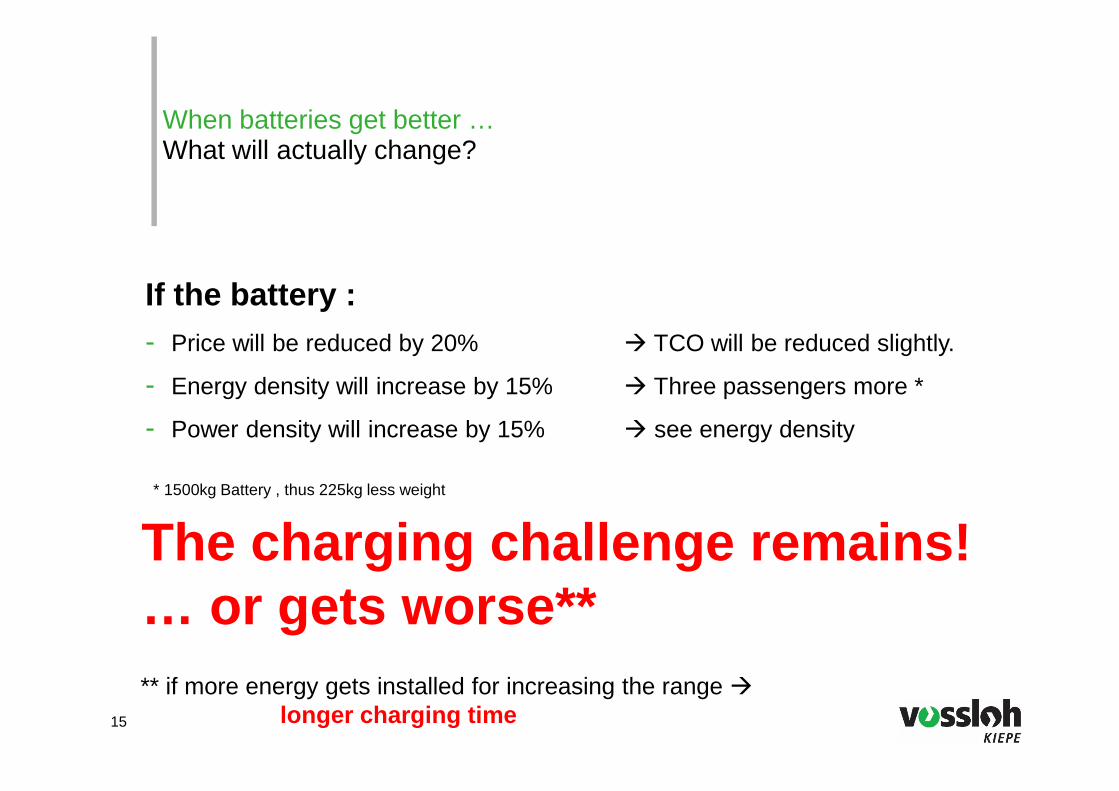
When batteries get better …What will actually change?
15
If the battery :- Price will be reduced by 20% � TCO will be reduced slightly.
- Energy density will increase by 15% � Three passengers more *
- Power density will increase by 15% � see energy density
* 1500kg Battery , thus 225kg less weight
The charging challenge remains!… or gets worse**** if more energy gets installed for increasing the range �
longer charging time
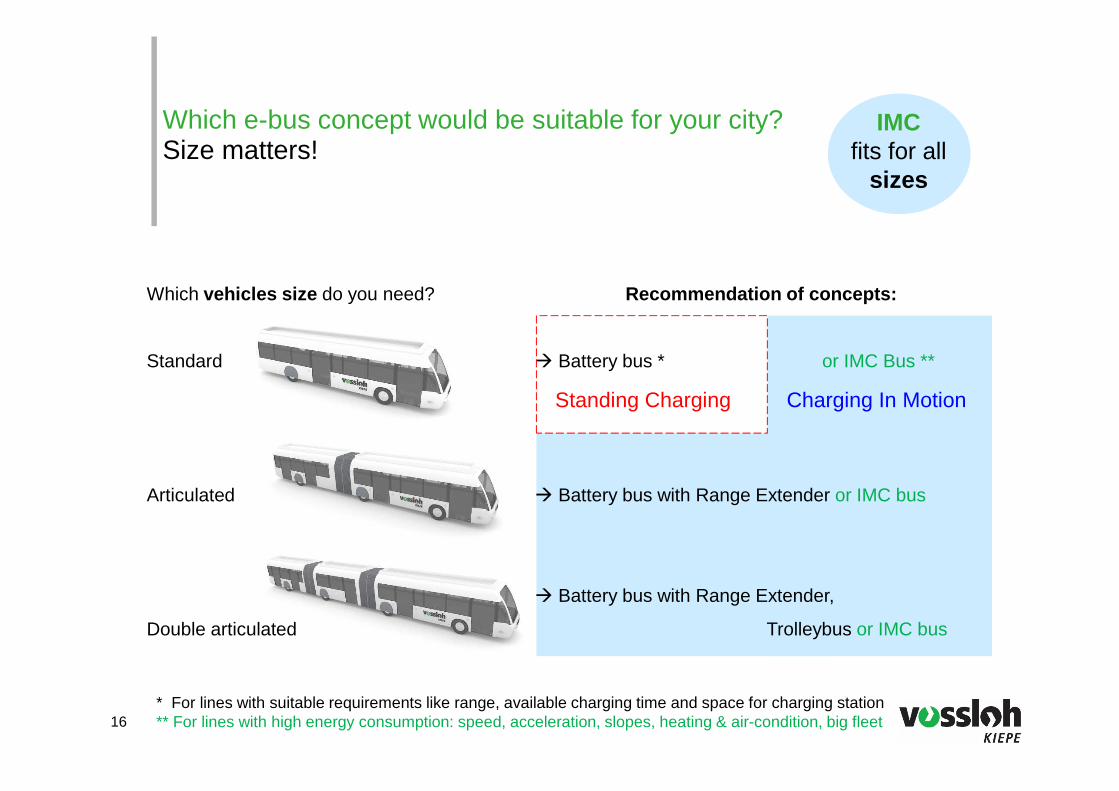
Which vehicles size do you need? Recommendation of concepts:
Standard � Battery bus * or IMC Bus **
Articulated � Battery bus with Range Extender or IMC bus
� Battery bus with Range Extender,
Double articulated Trolleybus or IMC bus
Which e-bus concept would be suitable for your city?Size matters!
* For lines with suitable requirements like range, available charging time and space for charging station** For lines with high energy consumption: speed, acceleration, slopes, heating & air-condition, big fleet
Standing Charging Charging In Motion
16
IMCfits for all
sizes
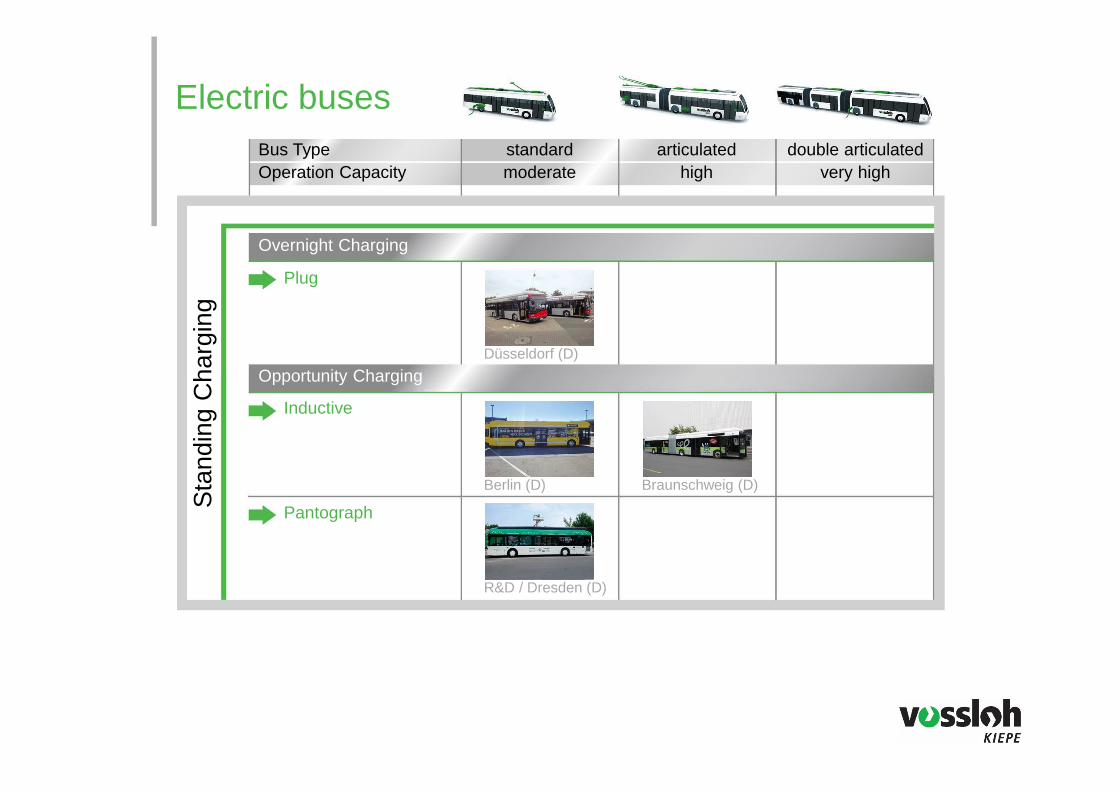
Electric busesstandardmoderate
articulatedhigh
double articulatedvery high
Bus TypeOperation Capacity
Sta
ndin
g C
harg
ing
Plug
Overnight Charging
Düsseldorf (D)
Berlin (D)
R&D / Dresden (D)
Inductive
Pantograph
Braunschweig (D)
Opportunity Charging
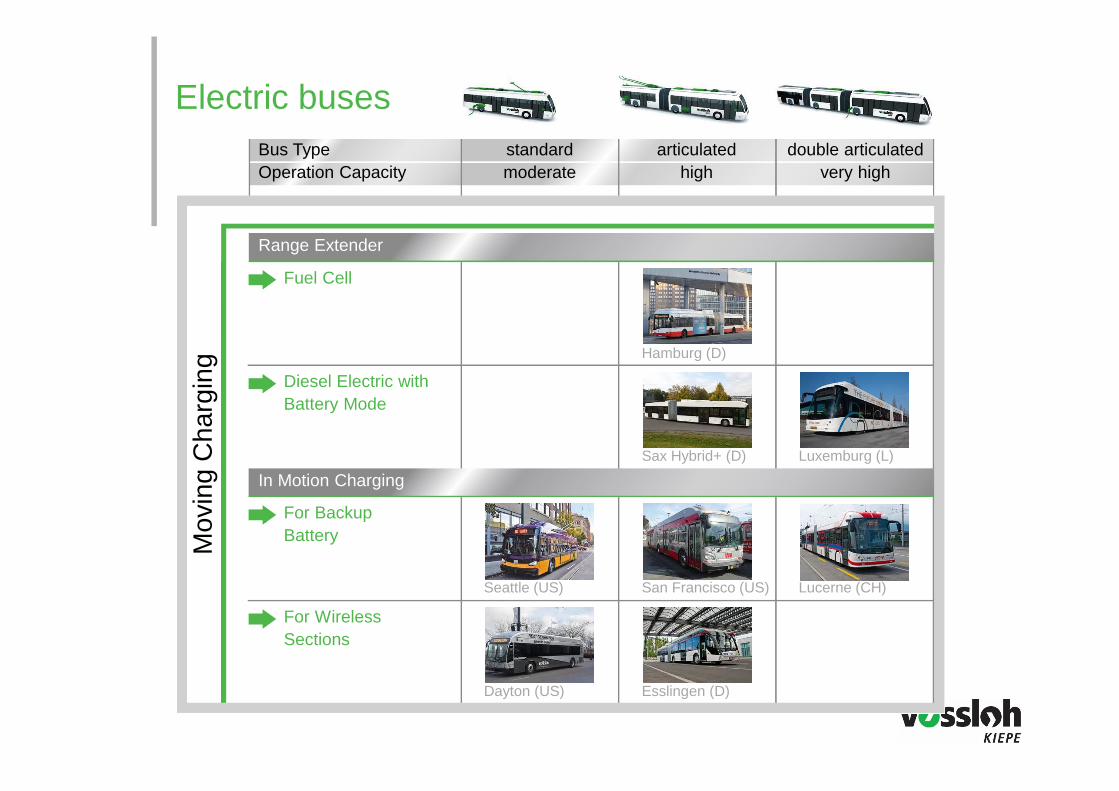
standard moderate
articulatedhigh
double articulatedvery high
Bus TypeOperation Capacity
Mov
ing
Cha
rgin
g
Fuel Cell
Range Extender
Seattle (US)
Diesel Electric withBattery Mode
For Backup Battery
Sax Hybrid+ (D)
For Wireless Sections
Hamburg (D)
Luxemburg (L)
San Francisco (US) Lucerne (CH)
Dayton (US) Esslingen (D)
In Motion Charging
Electric buses
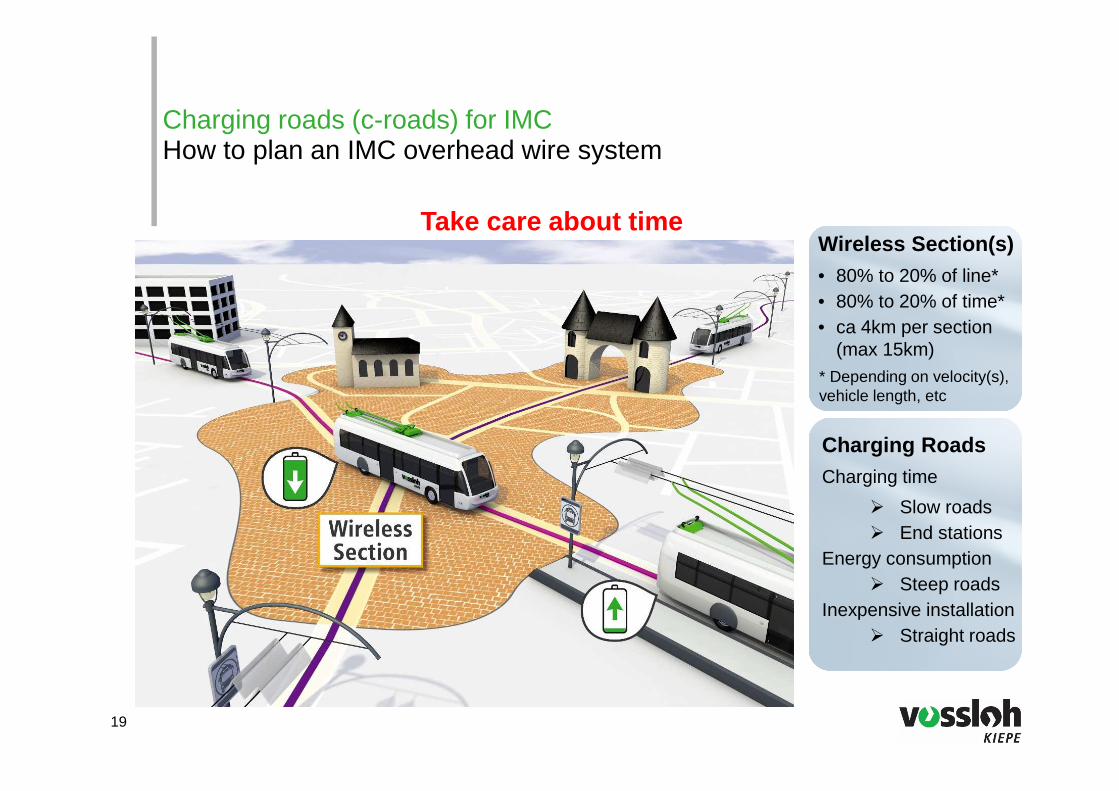
Charging roads (c-roads) for IMCHow to plan an IMC overhead wire system
Take care about timeWireless Section(s)• 80% to 20% of line*• 80% to 20% of time*• ca 4km per section
(max 15km)
19
Charging RoadsCharging time
� Slow roads� End stations
Energy consumption� Steep roads
Inexpensive installation� Straight roads
* Depending on velocity(s), vehicle length, etc
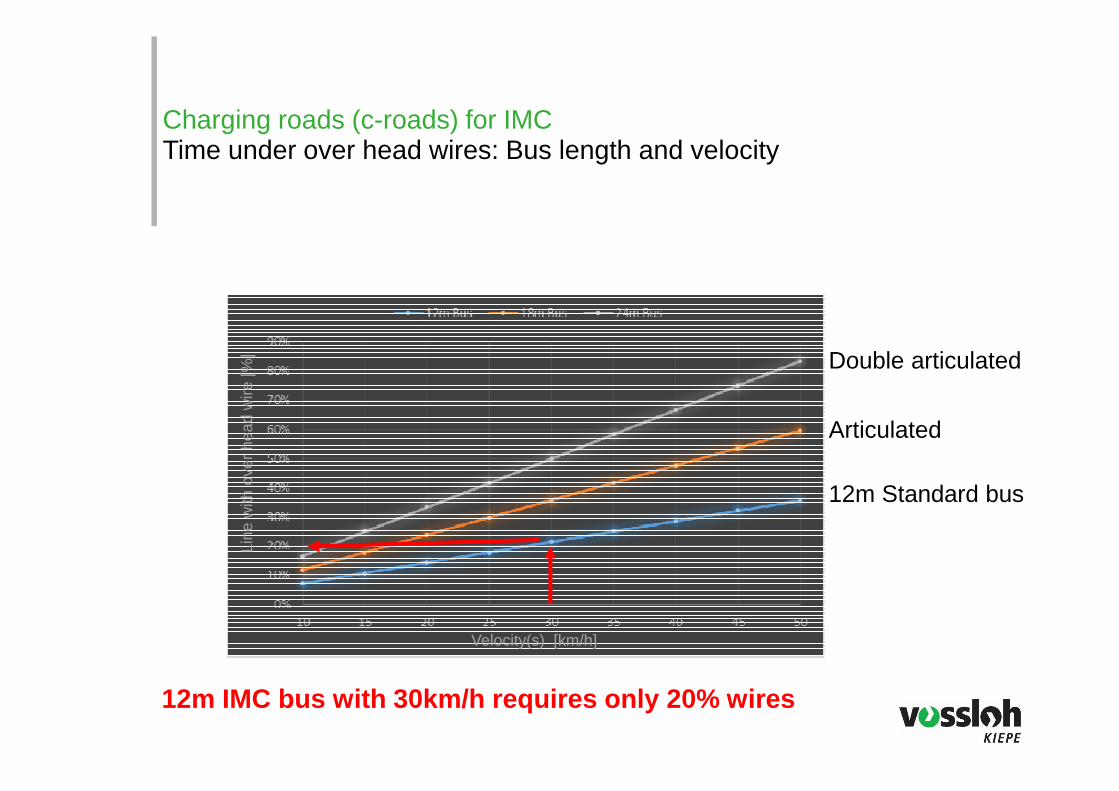
Charging roads (c-roads) for IMCTime under over head wires: Bus length and velocity
Velocity(s) [km/h]
Line
with
over
head
wire
[%] Double articulated
Articulated
12m Standard bus
12m IMC bus with 30km/h requires only 20% wires
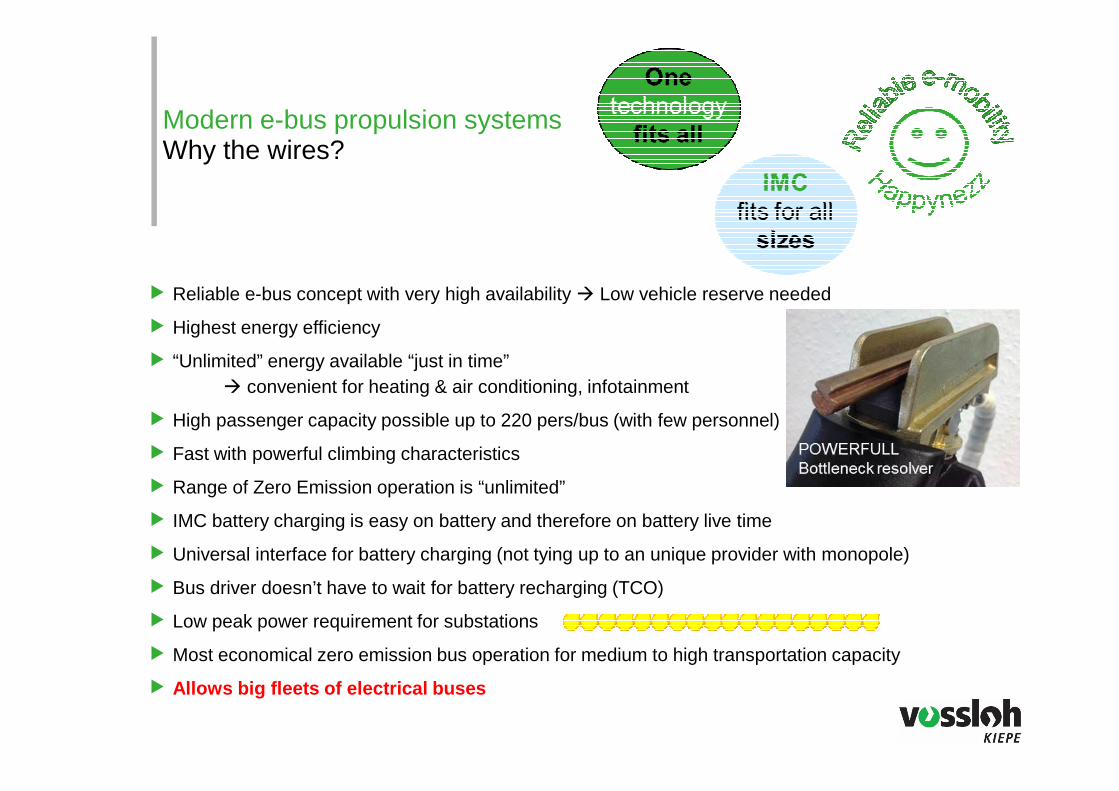
Modern e-bus propulsion systems Why the wires?
� Reliable e-bus concept with very high availability � Low vehicle reserve needed
� Highest energy efficiency
� “Unlimited” energy available “just in time” � convenient for heating & air conditioning, infotainment
� High passenger capacity possible up to 220 pers/bus (with few personnel)
� Fast with powerful climbing characteristics
� Range of Zero Emission operation is “unlimited”
� IMC battery charging is easy on battery and therefore on battery live time
� Universal interface for battery charging (not tying up to an unique provider with monopole)
� Bus driver doesn’t have to wait for battery recharging (TCO)
� Low peak power requirement for substations
� Most economical zero emission bus operation for medium to high transportation capacity
� Allows big fleets of electrical buses
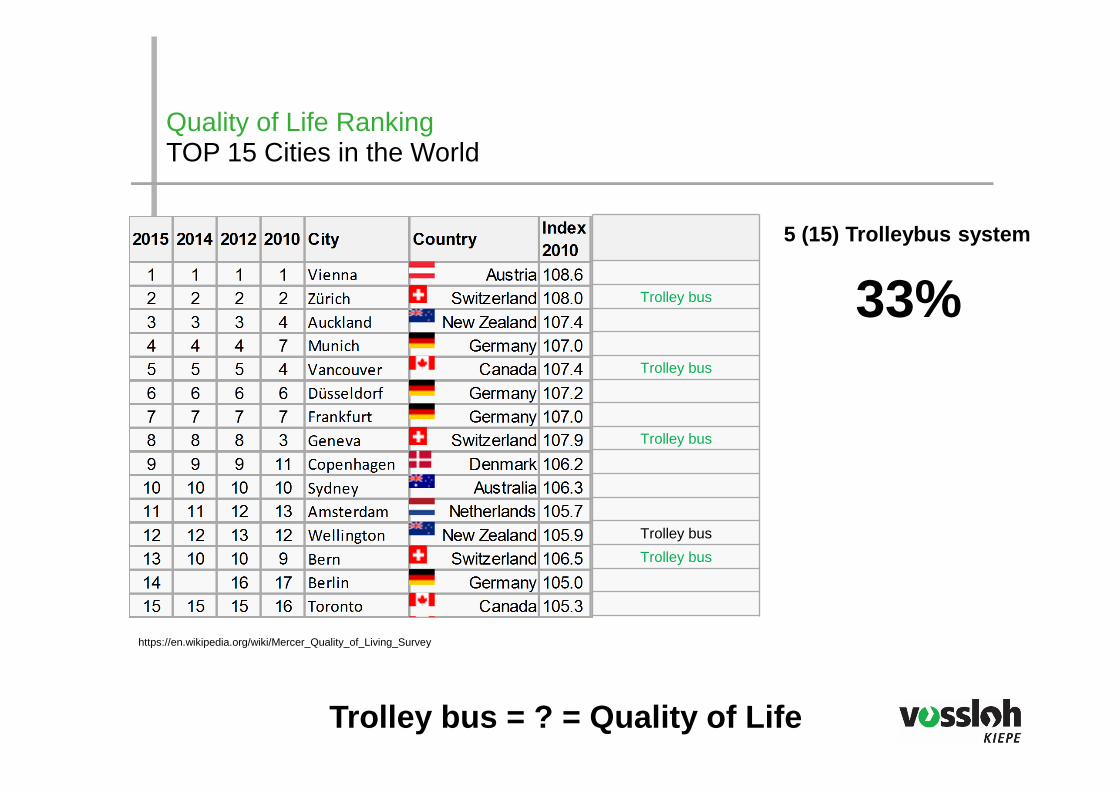
Trolley bus = ? = Quality of Life
https://en.wikipedia.org/wiki/Mercer_Quality_of_Living_Survey
Trolley bus
Trolley bus
Trolley bus
Trolley bus
Trolley bus
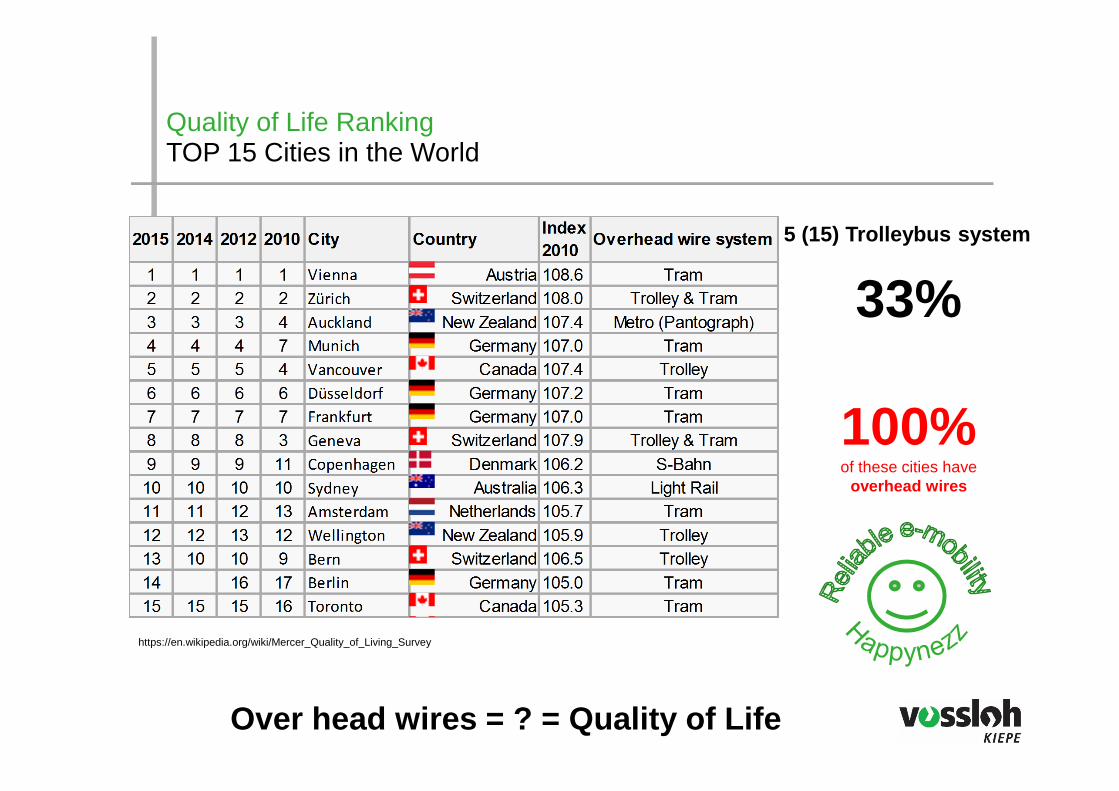
5 (15) Trolleybus system
33%
Quality of Life RankingTOP 15 Cities in the World
5 (15) Trolleybus system
33%
100%of these cities have
overhead wires
Over head wires = ? = Quality of Life
https://en.wikipedia.org/wiki/Mercer_Quality_of_Living_Survey
Quality of Life RankingTOP 15 Cities in the World
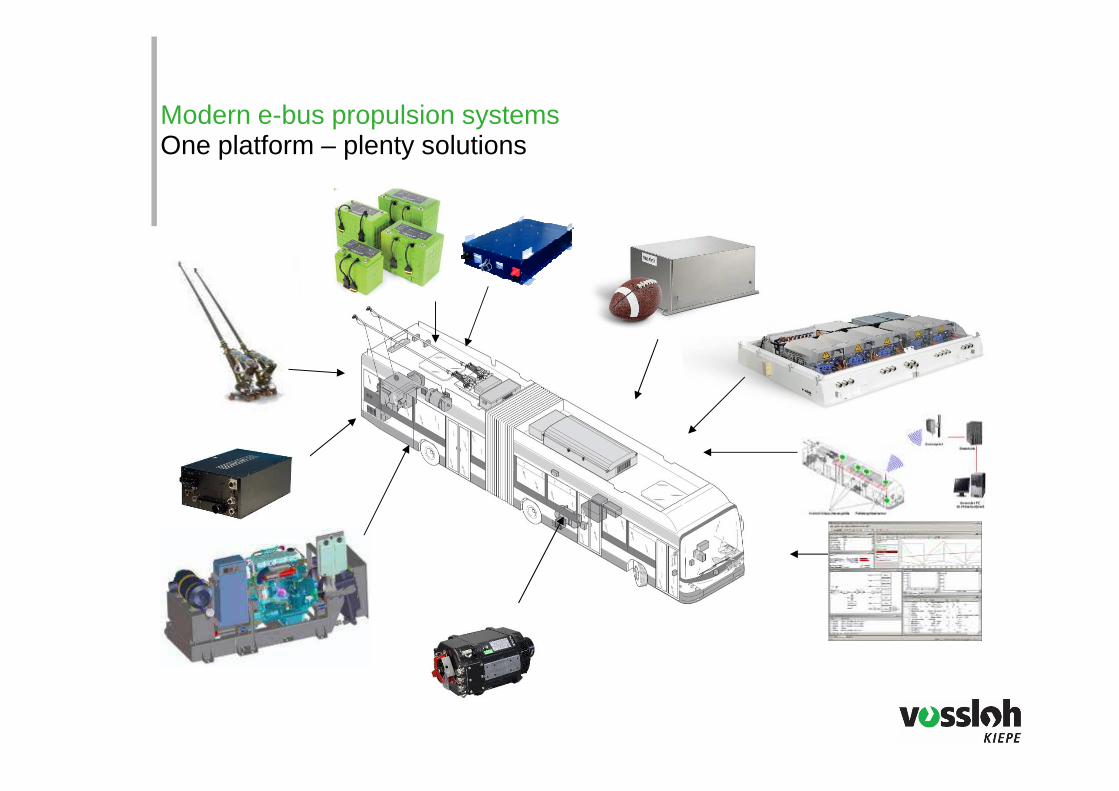
Modern e-bus propulsion systems One platform – plenty solutions
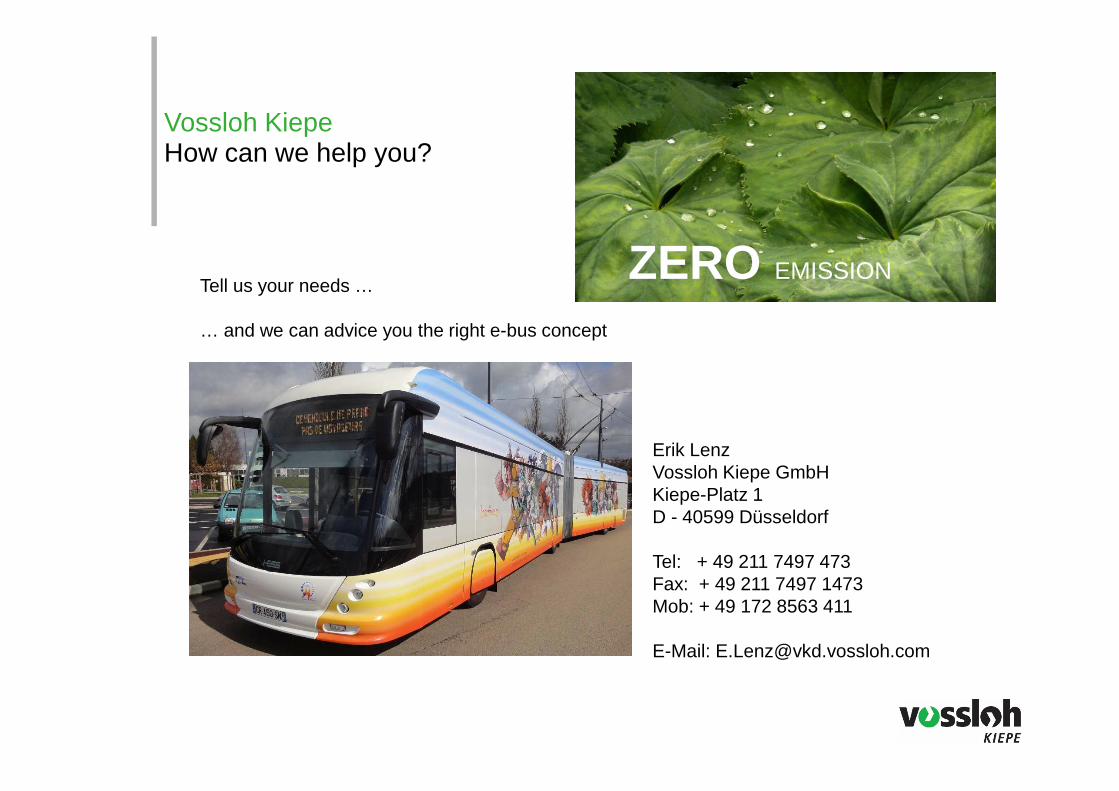
Vossloh Kiepe How can we help you?
ZERO EMISSION
Erik LenzVossloh Kiepe GmbHKiepe-Platz 1D - 40599 Düsseldorf
Tel: + 49 211 7497 473Fax: + 49 211 7497 1473Mob: + 49 172 8563 411
E-Mail: [email protected]
Tell us your needs …
… and we can advice you the right e-bus concept
Disclaimer
The presentation contains forward-looking statements that are based on current estimates and assumptions made by the management of VOSSLOH to the best of its knowledge. Such forward-looking statements are subject to risks and uncertainties, the non-occurrence or occurrence of which could cause a material difference in future results including changes in political, business, economic and competitive conditions, regulatory reforms, effects of future judicial decisions, foreign exchange rate fluctuations and the availability of financing. Neither VOSSLOH nor any of its affiliates, advisors or representatives shall have any liability whatsoever (in negligence or otherwise) for any loss arising from any use of this presentation or its content or otherwise arising in connection with this document. VOSSLOH does not undertake any responsibility to update the forward-looking statements contained in this presentation.
The information provided in this presentation does not represent an offer or invitation for the purchase of the stock of VOSSLOH AG or other companies, nor should it be considered as a call to purchase or otherwise trade stocks directly or indirectly.


![BUS BUS BUS BUS BUS BUS - Greater Anglia...London Liverpool Street to Hertford East, Stansted Airport and Cambridge Saturday 3rd December 2016 BUS BUS BUS BUS BUS BUS]]]] ]]]] ]]]]](https://img.pdfslide.us/doc/110x75/5e6fa285aaf29f59f73bda17/bus-bus-bus-bus-bus-bus-greater-anglia-london-liverpool-street-to-hertford.jpg)


![BUS BUS BUS BUS BUS BUS BUS BUS BUS · Sunday 15 May 2016 Liverpool Street to Colchester, Ipswich, Norwich and branches BUS BUS BUS BUS BUS BUS BUS BUS BUS] 1 1 1 1 1 1 1 1 1 1 1](https://img.pdfslide.us/doc/110x75/5fab4ce2477d2d3adf21016a/bus-bus-bus-bus-bus-bus-bus-bus-sunday-15-may-2016-liverpool-street-to-colchester.jpg)