Embed Size (px)
Citation preview

EFFECTS OF STORM AND COMBINED
SEWER DISCHARGES IN THE CITY OF EDMONTON ON WATER QUALITY IN THE NORTH SASKATCHEWAN RIVER
Prepared by: Patricia Mitchell Surface Water Assessment Branch Technical Services and Monitoring Division Water Resources Services Alberta Environmental Protection July 1994 REPORT.PAM W9403


EXECUTIVE SUMMARY Alberta Environmental Protection (AEP) and the City of Edmonton have been concerned about the effects of storm and combined sewer discharges on water quality in the North Saskatchewan River for a number of years. Investigations into this concern began in the mid-1980's, when Planning Division of AEP concluded that water quality in the river was the most important issue related to the North Saskatchewan River Basin Planning Program. Although literature sources suggest that storm and combined sewer discharges can be major sources of pollution to receiving streams, it was not known how Edmonton's urban runoff affected the river. River water quality during a storm event was monitored in 1987, but storm and combined sewer discharges were not sampled. Since then, the City of Edmonton has monitored a number of these discharges, and in 1991, Alberta Environmental Protection and the City of Edmonton launched a joint study to sample storm and combined sewer discharges at the same time that river water quality downstream was sampled. The purposes of the study were 1) to determine the proportions of various substances contributed by storm and combined sewer discharges during a rainstorm, as compared to other sources, 2) to calibrate the event model MULTI for future use in predicting effects of specific storm events or pollutant spills on river water quality, 3) to determine the impact of storm events on river water quality downstream as far as the border with Saskatchewan, particularly with reference to the Prairie Provinces Water Board objectives. It must be emphasized that monitoring one storm event can only be a beginning toward accomplishing these purposes, and additional storm event studies would be required to verify the model calibration and impacts in the river. A storm event was successfully monitored in September 1991. Consultants for the City of Edmonton sampled four major storm sewers and one major combined sewer, staff of the Gold Bar Wastewater Treatment Plant sampled the final effluent and secondary bypass, and staff of the E.L.Smith and Rossdale Water Treatment Plant sampled raw water intakes. Also sampled were the final effluent from the Capital Region Sewage Treatment Plant and effluents from seven industries in the Edmonton and Fort Saskatchewan area. Staff of AEP sampled the river at three locations: at Rossdale, below the city but above the Capital Region STP outfall, and at Vinca Bridge, 45 km downstream of the E.L.Smith plant. As well, automatic samplers were located at Pakan, about 100 km below the city, and at the border with Saskatchewan, to sample the storm-affected water as it passed these locations. Concentrations of various substances in storm sewer effluent were very high, particularly from the large sewer called Quesnell. For example, counts of fecal coliform bacteria in samples from Quesnell ranged up to 450,000 per 100 mL during the September 1991 event. Fecal coliform levels were even higher in samples from Rat Creek, a large combined sewer. Of all the sources, the combined sewers contributed the greatest proportion of fecal coliform bacteria to the river. The storm sewers contributed the greatest proportion of total suspended solids, and the final effluent from Gold Bar WTP contributed the highest proportion of nutrients. The highest proportion of total organic carbon and sodium was from water that entered the city from upstream (background). Mass loads of various substances contributed by monitored sources were added up and compared to the mass in the river measured at Vinca Bridge. These loads were very similar for
ii
sodium. For non-conservative substances, the effluent loads were reduced to account for instream processing, and the differences between loads measured in effluents and the load in the river was less than 10% for fecal coliforms, total phosphorus, total kjeldahl nitrogen and total organic carbon. The majority of sources were accounted for in sampling the event. The water quality of the river as it entered the city during the 1991 storm was excellent, with low concentrations of most substances. Storm sewer discharges affected the river at Rossdale, but the water treatment plant intake and two automatic sampler intakes were affected differently. Concentrations of substances at this site were higher than at the background sampling site, E.L.Smith, and exceeded Alberta Ambient Surface Water Quality Interim Guidelines for total suspended solids and for fecal coliforms for use as a raw water supply. Data from Vinca Bridge included effects from all of the sources sampled during the storm event, and after some degree of mixing. Concentrations at this site increased during the passage of the storm-affected water. Levels of various substances were generally lower than those in samples collected at Capital Region, but were higher than at Rossdale. Counts of fecal coliform bacteria exceeded Alberta Ambient Surface Water Quality Interim Guidelines for direct and indirect contact recreation and irrigation of vegetable crops. Samples collected at Pakan and the border as the storm-affected water travelled downstream of Vinca indicated that concentrations of various substances had declined through dispersion and in-river processing, so that the effect of the stormwater passage was barely discernible. However, for larger storms that occurred during the summer of 1991, greater effects in these downstream locations were seen. Historical data collected by Environment Canada for the Prairie Provinces Water Board (PPWB) at the border were examined to determine whether storm events in Edmonton could be related to recent excursions of PPWB water quality objectives. The substances of concern are fecal coliforms, lead, copper and zinc. For an eight-year period during open water, median concentrations of fecal coliforms, lead and zinc (as well as TSS) were significantly higher for storm-affected river samples than for non-storm affected samples. The relationship for other variables, namely copper and phosphorus, was not significant. Although it appears that rainstorms in the urban area influence water quality at the border, the actual sources of high values for substances of concern is not clear and would require further investigation. A preliminary calibration of the event model MULTI was attained with the September 1991 storm event data for fecal coliform bacteria, total kjeldahl nitrogen, total phosphorus, total organic carbon and sodium at the Vinca Bridge sampling site. Total suspended solids was also run, but there was no correlation between predicted and observed data. This study provides a first step in assessing effects of storm and combined sewer discharges on water quality in the North Saskatchewan River. Results generally confirmed conclusions from other studies conducted by Alberta Environmental Protection and the City of Edmonton that these discharges are a significant source of pollutants to the river during wet weather.

iii
ACKNOWLEDGEMENTS These studies were conducted by staff of the former Environmental Quality Monitoring Branch, Environmental Assessment Division, now Surface Water Assessment Branch and Surface Water Monitoring Branch, Technical Services and Monitoring Division. Preparation for and sampling of the storm event required effort far beyond normal sampling duties, and the sampling crew, including Doreen LeClair, Brian Jackson, David Allan, John Willis, Treva Mailer, Mike Bilyk, Morna Hussey, Chris Ware, Don Jones, Trina Hoffarth, Barb Bodie and Dave Trew did an outstanding job. John Campbell of Planning Division assisted in the laboratory. Staff of the City of Edmonton's Rossdale Water Treatment Plant (Kay Simpson and John Paran) and the Gold Bar Wastewater Treatment Plant (Larry Chyzyk and Lanny Chudyk) are also to be commended for their excellent work in obtaining samples. Also providing samples and excellent cooperation were staff of the Capital Region Sewage Treatment Plant, AltaSteel, Celanese, Esso Chemical, Esso Refinery, Geon Canada, Petro-Canada, and Sherritt-Gordon. Samples were analyzed by staff of Norwest Labs (Erv Callin, Randy Newman and Pami Randhawa) and by staff of the Provincial Laboratory of Public Health (Charles Davidson and Edie Ashton) who were willing to accept samples very early on a Sunday morning. Staff of the Alberta Environmental Centre provided analysis of quality assurance samples (Fred Dieken and Richard Coleman), as well as excellent advice. Hydrological information, including river cross sections and establishment of staff gauges, was provided by Ken Wegner, Rick Pickering, Elliot Kerr, and Andy DeBoer of the former Hydrology and Survey branches of Alberta Environmental Protection (now Surface Water Assessment and Surface Water Monitoring branches, respectively). Data for the storm and combined sewers were provided by the City of Edmonton, Drainage Branch (Charles Labatiuk and Jeff Marsh) and their consultant, I. D. Engineering (Clive Bright). Environment Canada meteorological information was provided by Elliot Kerr of Surface Water Assessment Branch, Alberta Environmental Protection. Bridgette Halbig provided excellent assistance in preparing data, graphs and tables, and formatting the manuscript. Doug Thrussell of the Alberta Environmental Protection drafting pool provided several figures. The report was reviewed by Ron Bothe, John Campbell, Jackie Shaw, Al Sosiak, K. Chinniah and Dave Trew of Alberta Environmental Protection, and G. Brown, A. Davies, J. Hodgson, C. Labatiuk, J. Marsh, D. Rector, K. Sawatzky and C. Ward of the City of Edmonton. C. Bright of I.D.Engineering Ltd. also reviewed the report.

iv
TABLE OF CONTENTS EXECUTIVE SUMMARY ................................................................................................................................ i ACKNOWLEDGEMENTS .............................................................................................................................iii LIST OF TABLES .............................................................................................................................................v LIST OF FIGURES ..........................................................................................................................................vi 1.0 INTRODUCTION .............................................................................................................................. 1 1.1 THE NEW STUDY .............................................................................................................................. 3 1.2 PHYSICAL CHARACTERISTICS .................................................................................................... 4 2.0 METHODS.......................................................................................................................................... 7 2.1 DATA COLLECTION......................................................................................................................... 7 2.1.1 Site Locations for the September 1991 Storm Event ............................................................. 7 2.1.2 General Description of Storm Event Sampling..................................................................... 11 2.1.3 Daily Composite Samples...................................................................................................... 12 2.2 SAMPLE PREPARATION AND ANALYSIS ................................................................................. 12 2.3 QUALITY ASSURANCE .................................................................................................................. 14 2.4 DATA ANALYSIS ............................................................................................................................. 15 2.4.1 Quality Assurance.................................................................................................................. 15 2.4.2 Effluent Characterization and Loading ................................................................................. 15 2.4.3 River Monitoring ................................................................................................................... 17 2.4.4 Modelling ............................................................................................................................... 17 2.4.5 Analysis of Long-term Data Potentially Affected by Storm Events .................................... 19 3.0 RESULTS AND DISCUSSION ....................................................................................................... 21 3.1 DESCRIPTION OF THE SEPTEMBER 1991 STORM EVENT..................................................... 21 3.2 STORM AND COMBINED SEWER DISCHARGES TO THE NORTH SASKATCHEWAN RIVER................................................................................ 22 3.3 TRIBUTARIES ................................................................................................................................... 28 3.4 LOADING ESTIMATES TO THE RIVER DURING THE SEPTEMBER 1991 STORM EVENT ............................................................................................... 29 3.5 WATER QUALITY OF THE NORTH SASKATCHEWAN RIVER DURING THE SEPTEMBER 1991 STORM EVENT ........................................................ 33 3.5.1 River Monitoring Sites........................................................................................................... 33 3.5.2 Background Water Quality.................................................................................................... 33 3.5.3 Rossdale ................................................................................................................................. 34 3.5.4 Capital Region ....................................................................................................................... 37 3.5.5 Vinca Bridge .......................................................................................................................... 38 3.5.6 Pakan and Border................................................................................................................... 41 3.6 EFFECT OF OTHER SUMMER STORMS ON WATER QUALITY DOWNSTREAM OF EDMONTON............................................................... 43 3.7 MODELLING OF THE SEPTEMBER 1991 STORM EVENT....................................................... 48 SUMMARY AND CONCLUSIONS............................................................................................................. 53 LITERATURE CITED .................................................................................................................................. 56 APPENDICES .................................................................................................................................. 59 A. Quality assurance data B. Effluent and river data C. Capital Region transect diagram

v
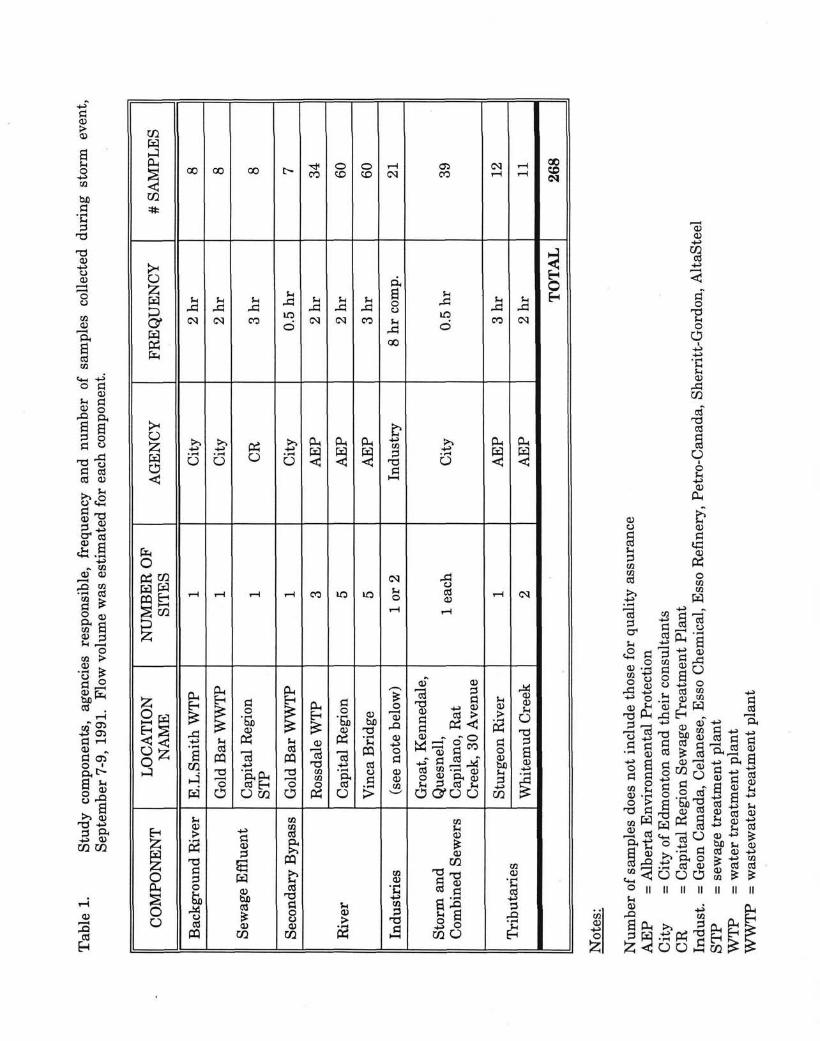
LIST OF TABLES Table 1. Study components, agencies responsible, frequency and number of samples collected during storm event, September 7-9, 1991 ................................. 8 Table 2. Variables analyzed during storm event studies in North Saskatchewan River 1990-1991.................................................................................. 13 Table 3. Ranges of concentrations in City of Edmonton storm and combined sewer discharges sampled 1987-1991 and from other studies................................... 24 Table 4. Estimate of mass loading of seven variables to the North Saskatchewan River during the September 1991 storm event and percentage of total load ............................................................................................... 30 Table 5. Total suspended solids (TSS), sodium, chloride and total phosphorus (TP) concentrations (mg/L) measured in Devon daily composite samples and at E.L.Smith during the storm.............................................. 33 Table 6. Median and range in concentrations of water quality variables at seven locations in the North Saskatchewan River during September 7-8, 1991 storm event ............................................................................... 35 Table 7. Effects of rain in Edmonton on water quality in the North Saskatchewan River at the Saskatchewan border, open-water period 1976-1992 ........................................................................................................ 46 Table 8. Results of Spearman's rank correlation test for MULTI runs .................................... 50

vi
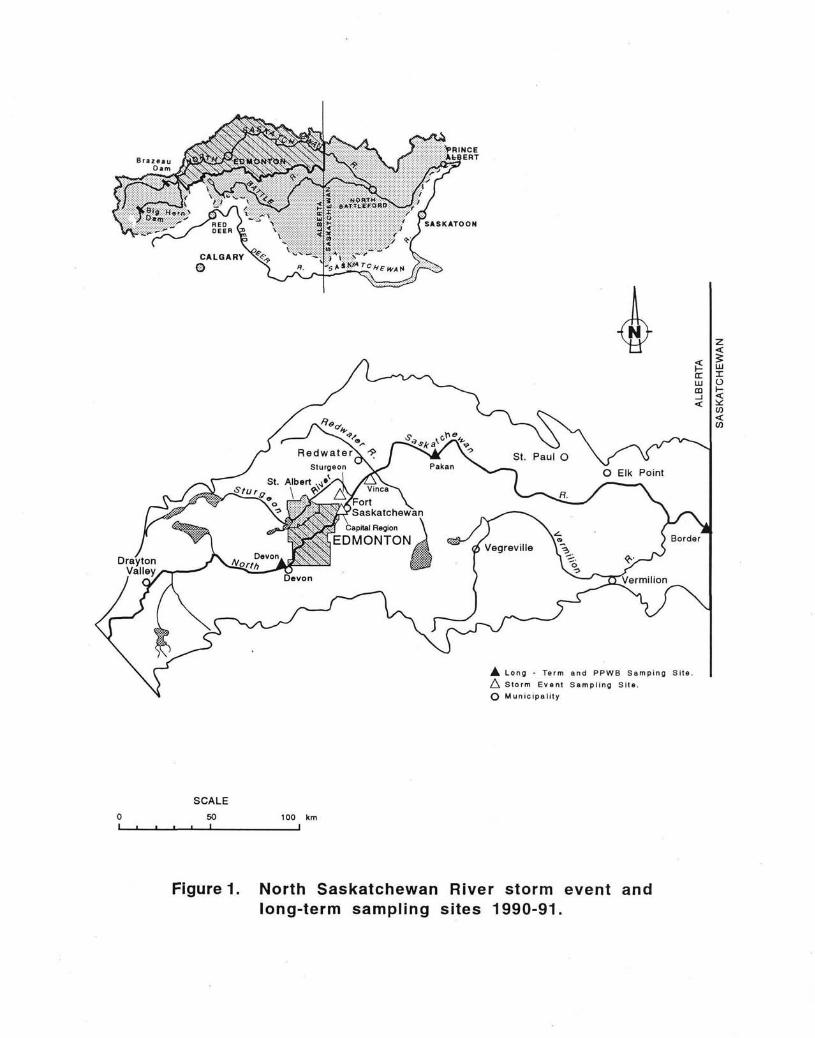
LIST OF FIGURES Figure 1. North Saskatchewan River storm event and long-term sampling sites 1990-91................................................................................................................. 5 Figure 2. Map of Edmonton and North Saskatchewan River showing sampling locations and major features ........................................................................ 9 Figure 3. Flow volume of the North Saskatchewan River at Edmonton and Capital Region, September 7-8, 1991.................................................................. 21 Figure 4a. Flow and concentration of three variables in discharges from storm and combined sewers monitored during September 7-8, 1991 storm event ......................................................................................................... 25 Figure 4b. Concentration of six variables in discharges from storm and combined sewers monitored during September 7-8, 1991 storm event..................... 26 Figure 5. Flow and concentration of total phosphorus and fecal coliforms in stormwater discharges from Quesnell storm sewer during four separate storms in summer 1987-1992 ............................................................... 27 Figure 6. Proportion of total loads of seven water quality constituents from various sources to the North Saskatchewan River during rain, September 7-8, 1991........................................................................................... 31 Figure 7. Concentrations of three variables in the North Saskatchewan River at Rossdale during the storm event, September 7-8, 1991............................... 36 Figure 8. Flow-weighted mean concentrations of six variables measured in the North Saskatchewan River at Vinca Bridge, September 1991 ............................ 39 Figure 9. Concentration contours for four variables measured in the North Saskatchewan River at Vinca Bridge, September 8-9, 1991 ..................................... 40 Figure 10. Concentrations of sodium and total phosphorus measured in samples from Pakan and the Border, September 9-16, 1991 ..................................... 42 Figure 11. Concentrations of suspended solids, lead, copper and total phosphorus in the North Saskatchewan River at three locations, June 1991..................................................................................................................... 44 Figure 12. Average daily discharge in the North Saskatchewan River at Edmonton and the Saskatchewan border, June 1991 ................................................. 45 Figure 13. Modelled and observed concentrations of three variables in the North Saskatchewan River at Vinca Bridge, 1991..................................................... 49 Figure 14. Predicted concentrations of total organic carbon, total phosphorus and fecal coliform bacteria in the North Saskatchewan River at Capital Region during storm event September 7-8, 1991 ............................ 52

Effects of Storm and Combined Sewer Discharges in the City of Edmonton on Water Quality in the North Saskatchewan River 1.0 INTRODUCTION The water quality of the North Saskatchewan River has been an issue for decades. There is a general perception among members of the public that the river is polluted. In 1970, a University of Alberta student conducted surveys to determine how the public, civil servants and members of an environmental group perceive water quality in the North Saskatchewan River (Watson 1972). About 95% of the general public interviewed thought that the river was polluted, although only 55% thought the river was more polluted downstream of the city than upstream. The concept of "polluted" was rather vague in the minds of people interviewed, but they suggested that it looked dirty and smelled bad at times. People's perceptions have probably not changed dramatically since then; they generally assume that if municipal and industrial effluents are entering the river, it must be polluted. The effluents that people focus on are the effluents from sewage treatment plants and industries, rather than storm and combined sewer discharges. Even in Watson's thesis, which discusses various effluents entering the river, there was no mention of the storm and combined sewers as a source of pollutants to the river. It is well documented in the scientific literature that urban runoff contains substances that could adversely affect water quality in a receiving river (e.g., Colston and Tafuri 1975, Cordery 1976, Pitt and Field 1977, Field and Pitt 1990, Norman 1991). These pollutants include suspended solids, metals, phosphorus, nitrogen, organics and coliform bacteria. Storm sewers drain rainwater and snow melt from residential, commercial and industrial land, and this urban runoff may contain high concentrations of suspended solids and metals. Urban runoff could also contain anything that is put into the street or down storm drains, such as motor oil, pesticides, and other wastes from residential activities. Coliform bacteria counts may be high, resulting primarily from animal wastes or interconnections between residential storm drains and sanitary drains. Combined sewers convey domestic sewage toward the sewage treatment plant during dry weather, but in wet weather, high flows may exceed the capacity of the sewer, and the excess overflows to the river. Thus, combined sewer overflows are raw sewage mixed with stormwater. This effluent has high counts of coliform bacteria and high levels of biochemical oxygen demand (BOD) and nutrients. Combined sewers are common in older sections of many North American cities, including Edmonton. Alberta Environment conducted some of the earliest work on stormwater runoff quality in Edmonton. In 1973, a few samples of stormwater were collected during snowmelt and summer rains; concentrations of BOD, suspended solids, metals and nutrients were high (Alberta Environment 1973). A general study of the water quality in the Edmonton area was conducted in 1982-83 by Alberta Environment (Anderson et al. 1986), but it did not specifically address impacts of urban runoff. It was acknowledged, however, that storm and combined sewers were likely important sources of pollution. The City of Edmonton has been aware for many years that urban runoff could have an impact on water quality in the river. They have conducted various sampling programs on sewers and creeks within the city. In the late 1970s, consultants for the City estimated pollutant loadings
2
from the storm and combined sewers (McLaren 1980). They suggested that treated effluent from the wastewater treatment plant contributed the greatest pollutant load on an annual basis, but during wet weather, storm sewers contributed a higher load of suspended solids and BOD, and combined sewer discharges contributed a higher load of coliform bacteria. Much of the emphasis in studies conducted by the City has been on causes of taste and odour in drinking water. Raw water is withdrawn from the river at two locations, one upstream of nearly all stormwater outfalls (there are none within city limits), and one within the city below 85 storm outfalls that discharge directly to the river. In 1982, the Potable Water Quality Task Force (composed of city and provincial officials) concluded that there were insufficient data on the river and the stormwater discharges to determine their effect on river water quality upstream of the water treatment plants (City of Edmonton 1982). A number of storm sewers were sampled by the City during 1980-84 (City of Edmonton 1985a,b); again, the water quality of these discharges was relatively poor, and all but two of the seven outfalls monitored indicated fecal sources even though none were combined sewers and most drained residential areas. In 1985, the City produced a report that summarized previous work on river water quality relative to wastewater management in Edmonton (Ahmad 1985). Its purpose was to determine whether water quality in the North Saskatchewan River was a problem, and to assess sources of pollution, impacts of various discharges from Edmonton and possible mitigation strategies. It concluded, as in previous reports, that concentrations of coliform bacteria, phosphorus and nitrogen were of major concern and that treated effluent from the Gold Bar Wastewater Treatment Plant has the most severe impact on river water quality during dry weather, but the combined and storm sewers have the greatest impact during wet weather. For total coliforms, however, the combined and storm sewers contributed more than half of the total annual load entering the river from city effluents (1983 estimates). In the autumn of 1985, the Edmonton City Council agreed to fund a joint study with Alberta Environment to examine the quality of Edmonton's raw and finished water supply and the City's treatment technology. One of the conclusions of the study was that the water quality of the North Saskatchewan River is good as it arrives in Edmonton, but is adversely affected by discharges from the storm sewers by the time it arrives at the Rossdale Water Treatment Plant intake. In particular, the raw water at Rossdale is affected by high bacterial counts and occasional high levels of turbidity, phenolics and trace organics, chloride, and certain heavy metals. Although the water from upstream is affected adversely by agricultural runoff at times, urban runoff poses a much greater risk of contamination of the water supply (Steve E. Hrudey & Associates 1986). The recommendation of this and other studies was to move the Rossdale intake upstream to the E.L.Smith location, but the City Council wished to know the health risk to users of Rossdale water at its present intake location. In 1992, the Council commissioned another study to look into the matter. The report produced by the City's consultants indicated that effluent from storm sewer outfalls presents an ongoing challenge to the Rossdale Water Treatment Plant in terms of chemical and biological hazards, and the authors recommended that the intake be relocated (Toxcon Consulting Ltd. 1992). Also in 1985, the North Saskatchewan River Basin planning program was initiated by

3
Planning Division of Alberta Environment. The most important issue identified within the basin was water quality in the river, particularly with respect to discharges from the Edmonton-Fort Saskatchewan area. As a result, much of the focus of information-gathering for the basin plan was related to obtaining water quality data and development of models that would be appropriate to predict future water quality under various development scenarios. Early in this process, it was realized that more information was needed about the impact of storm and combined sewer discharges from Edmonton. One of the models developed for the river was MULTI, an event model that could predict concentrations and mixing patterns of pollutants downstream to the Saskatchewan border after a storm event in the city. The model was set up initially with data supplied by the City of Edmonton, but Planning Division's consultants (HydroQual and Gore and Storrie) stated that additional data would be necessary to properly calibrate the model. To meet data needs for model calibration, and also to determine relative impacts of various Edmonton area effluents, Alberta Environment launched an urban runoff impact study in 1987. Rather than looking only at effluents, this study focused on water quality of the river during a storm event. It was conducted by the former Water Quality Control Branch (now Surface Water Assessment Branch) and a consultant with Planning Division; staff of the City of Edmonton provided assistance. Results of this study are summarized in Shaw et al.(1994). Although the data obtained during this study were excellent, few storm and combined sewer discharges were monitored, so that the data set had limited use for model calibration. Additionally, it was only one storm. Each storm is different, and data for a range of storms were required. In 1990, the City of Edmonton began a program to monitor discharges from storm and combined sewers; monitoring is ongoing, as required by the City's approval to operate a wastewater collection and treatment system under Alberta Environmental Protection's legislation. As well, Alberta Environmental Protection (AEP), in conjunction with the City, began studies to determine whether there is a correlation between rainfall events and increases in certain substances in the river. One part of this work was detailed monitoring of one storm event, which occurred in 1991. Sewage treatment plant and industrial effluents, background concentrations in the river, and storm and combined sewer discharges were sampled so that mass loads from all major sources could be compared with the total mass in the river below the urban area to obtain the portion added by urban runoff and combined sewer overflows. Additional samples were collected from the raw water intake at the Rossdale Water Treatment Plant to assess the influence of storm sewers on water quality in the river at that point. There are very few, if any, examples in the literature of studies that monitor both effluents and receiving water simultaneously during a storm event on a large river. There were two important reasons for this concerted effort. Firstly, there are always inherent errors in water quality sampling, and there are more during storm events because water quality of the effluents and the river is highly variable at that time. As well, only the six largest storm and combined sewers could be sampled, but there are 239 outfalls within the city. Thus, it was hoped that the river sampling could help verify the storm and combined sewer input estimates by mass balancing. Secondly, the data were to be used to calibrate the MULTI model. Effluent data were needed as inputs, and river sampling data were needed to obtain a calibration.

4
The objectives for the 1991 study were: 1. To determine the proportion of various nutrients, metals and other substances
contributed by storm and combined sewers during a rainstorm in the Edmonton-Fort Saskatchewan area, as compared to upstream conditions, treated and bypassed sewage effluent and industrial discharges.
2. To calibrate the event model MULTI for future use in predicting effects on river water
quality of specific storm events or pollutant spills and effluent load reductions as a result of mitigation efforts for these sources.
3. To determine the impact of storm events on water quality in the river downstream of
Edmonton as far as the border with Saskatchewan, particularly with reference to the Prairie Provinces Water Board (PPWB) water quality objectives.
A storm event was successfully sampled in September 1991; there were obvious impacts in the river from discharges from the storm and combined sewers, and bypassed and treated effluents from the sewage treatment plants. These effects included greatly increased fecal coliform counts, and higher concentrations of nutrients and other substances in the river downstream of the urban area. The results of the 1991 study, and additional information collected between 1987 and 1992 are summarized and interpreted in this report. It must be emphasized that the data presented here represent scoping level information only, and the detailed storm event monitored may or may not be typical of storms that occur through the summer in Edmonton. In addition, this information pertains to summer rains storms only, and cannot be extrapolated to spring snow melt impacts. For these reasons, the report is intended as preliminary information on relative contributions of discharges that affect water quality in the North Saskatchewan River. It is not intended to recommend directions for mitigation of impacts. 1.1 PHYSICAL CHARACTERISTICS The North Saskatchewan River cuts across the central part of Alberta, joins the South Saskatchewan River in Saskatchewan and then the Nelson River on its way to Hudson Bay. The city of Edmonton (population about 800,000) is located approximately mid-way on the river's traverse of Alberta. The geology, climate, hydrology and other physical characteristics of the river and its basin are described in Shaw et al.(1994). The drainage basin of the North Saskatchewan River within Alberta has an area of about 57,100 km2. A map of the basin showing major features and general locations used in the study is presented in Figure 1. The study area includes the portion of the river between Devon, just upstream of Edmonton, to the Saskatchewan border. Through this section, the geology, the hydrogeology and the materials that make up the channel bed are relatively uniform. The drainage

6
basin in this section lies largely in the Aspen-Parkland ecoregion. Three small rivers enter the North Saskatchewan River through this stretch, as well as a number of creeks. The river usually has two flood peaks in the Edmonton area during the open-water period. The first tends to occur in April to early May, and results from snowmelt runoff originating in the lower portion of the basin. Mountain snowmelt and summer rains in the higher elevations of the basin in June or July increase flows in the river again, often producing the highest flows of the year. The mean annual flow for the river at Edmonton is 213 m3/s.

7
2.0 METHODS 2.1 DATA COLLECTION Data collection programs for storm event impact assessment are complex and difficult to execute. One of the inherent problems in stormwater runoff impact assessments is the inability to predict when the event will occur, and therefore when to sample. Another problem is the bank to bank variability in the receiving water, at least in large rivers. A third problem is the need to continue sampling for an extended period; for the 1991 storm, it was throughout the night. For sampling the North Saskatchewan River, this latter requirement meant there were safety considerations for sampling personnel. Also needed was a sampling strategy that would allow sampling to begin as quickly as possible once a suitable rainstorm started. To cope with all of these difficulties, a great deal of planning and coordination was required, as well as dedicated and well-trained staff. The sampling program was conducted jointly by Alberta Environmental Protection and the City of Edmonton, and both groups used the same laboratories and field facilities. 2.1.1 Site Locations for the 1991 Storm Event Table 1 lists the different components, sampling frequency, groups responsible for sampling and the number of samples collected for each component during the 1991 study. Figure 2 provides a diagram of locations of sampling points and inputs on the river for the Edmonton-Fort Saskatchewan area. The following describes these locations, reasons for sampling and other details of the program. The location name used is in boldface type. 1. Background concentrations in the river were measured by collecting 24-hour composite
samples at Devon (Figure 1). Additional background samples were collected by sampling the raw water intake at the E.L.Smith Water Treatment Plant every two hours. This location is upstream of nearly all storm sewers and all combined sewers, and the intake offered a convenient way to obtain samples. Staff of the E.L.Smith plant were provided with sets of sampling bottles beforehand, and they agreed to begin collecting samples when they were notified.
2. The storm and combined sewer discharges and precipitation gauges were monitored by staff or consultants (I.D. Engineering, Ltd.) for the City of Edmonton, and methods are reported in IDE(1992). Storm and combined sewers were chosen to be representative of sections of the river and land use types, and also to drain a large portion of the total urban runoff/combined sewer overflow (CSO) entering the river. Four storm sewers sampled in 1991 (30 Ave., Quesnell, Kennedale and Groat) drain over 75% of the discharge volume from the separated sewer area. The large combined sewer called Rat Creek drains 70 to 90% of the total flow from the combined sewer area (UMA 1993, Drainage Branch 1993). An additional combined sewer, Capilano, was monitored but the data were discarded because it was thought that the effluent sampled was local runoff rather than combined sewer overflow (IDE 1992). Sewer monitoring included estimates of flow, recorded as water depth with ultrasonic multirangers or as depth and velocity at 5 or 15 minute intervals, depending on the sewer, and converted to flow with Manning's equations for flow in pipes. Samples were collected at about 30


10
minute intervals over the course of the storm for the same chemical variables monitored in the river.
3. There are a few tributaries that enter the river in the study reach, but most have very
small flow volumes relative to the mainstem. There was a particular concern about Whitemud Creek, because it drains agricultural and urban land outside of the city limits, and it has one large and several small storm sewers draining to it. During the 1991 event, the creek itself was sampled and flow estimated just below the confluence of Blackmud and Whitemud creeks, and also at 45th Avenue below a large storm sewer draining the Duggan-Petrolia area. It was not sampled near its confluence with the North Saskatchewan River because the river backs up into the creek for a considerable distance (depending on river flow). The Sturgeon River was also sampled during the 1991 storm event (at three-hour intervals), because one of the North Saskatchewan River sampling locations was downstream of the confluence with the Sturgeon River. Other tributaries were not sampled.
4. Staff at the Rossdale Water Treatment Plant sampled at two hour intervals from their
raw water intake line during the course of the storm event. In addition, staff of Alberta Environmental Protection installed automatic samplers on the right and left banks of the river. The purpose was to obtain river samples below 85 storm sewers, but above any of the combined sewers. It had been arranged with the Rossdale WTP that their offshore intake would be used during the storm event, but that was not possible at the time, so the raw water was withdrawn from the intake at the left bank. Thus, the left bank automatic sampler intake and the water treatment plant intake were fairly close to each other.
5. Staff of the Gold Bar WasteWater Treatment Plant sampled the final effluent and
recorded discharge every two hours for the duration of the event. The secondary bypass was sampled every 30 minutes during the event, and discharge was recorded. A secondary bypass occurs when the volume of sanitary wastewater and storm water entering the plant becomes too large for the secondary process to treat effectively. The excess primary treated wastewater is discharged to the river.
6. In 1990, a sampling station was established upstream of the Capital Region Sewage
Treatment Plant effluent and the river cross section was surveyed for depth and flow volume. To meet safety and efficiency requirements for sampling, Alberta Environmental Protection staff used an in-river intake system with hoses from five river locations to a pump and manifold housed in a walk-in trailer on shore (see diagram in Appendix C). Much effort was spent designing and manufacturing the system, and then it was installed with the assistance of divers. In 1991, the intake system was re-established after the winter, tested and then used during storm event sampling. However, it was determined later that the piping system in the river had moved downstream, so that only a portion of the distance across the river was sampled. As a result, the data obtained from this site were not used quantitatively to assess effects of the storm on river water quality.

11
7. The final effluent from the Capital Region Sewage Treatment Plant was sampled every three hours during the storm, and flow was measured continuously.
8. Industrial effluents were sampled during the storm event. Industries were very
cooperative in participating in the study; staff of each industrial plant collected 8-hour composite samples during the storm and provided flow volumes for the period. Of the nine industries asked to participate, seven provided samples: B.F.Goodrich (now Geon Canada), Celanese, Esso Petroleum (now Imperial Products), Esso Chemicals (now Imperial Chemicals), Petro-Canada, Sherritt-Gordon Mines, and Stelco (now AltaSteel). Dow Chemical and Shell Canada (Refinery and Styrene plants) were not discharging when they were notified to begin sampling.
9. Another sampling site was established at Highway 38 Bridge (Vinca Bridge) to
determine the impact on the river of industrial discharges as well as a storm in Edmonton. Distances across the river for five sampling sites were measured, and each site was marked with paint on the catwalk under the bridge so that it was easily identified. The river cross section at the bridge was surveyed to determine river volumes, flow and area of each of the five sections across the river. Samples were collected every three hours by lowering a sampling device from the catwalk. The sampler was a 4 L polycarbonate bottle in a weighted stainless steel holder which could be lowered through the water column to produce a vertically integrated sample.
10. To determine impacts of a storm in the city on river water quality further downstream,
two automatic samplers were set up to collect samples after the storm-affected water had passed the Vinca sampling station. One sampler was at Pakan or Victoria Settlement, downstream of Highway 855 bridge and 139 km downstream of the E.L.Smith plant; sampling frequency was every 4 hours for 4 days. The other was at the Border, 356 km downstream of the E.L.Smith plant; samples were collected every 8 hours for 8 days. Only substances that would remain stable during storage could be monitored with these samplers.
2.1.2 General Description of Storm Event Sampling Sample bottles and equipment were set up well in advance, and laboratories were prepared to accept samples on short notice and on weekends if necessary. A list of staff available was prepared for each weekend; if sufficient people were available, they were on "storm watch". The decision to monitor a particular storm was made rather arbitrarily. Ideally, there would have been several days of dry weather beforehand so that pollutants would build up on streets and other runoff areas, and the storm would be relatively large and brief (greater than 15 mm over a few hours). As well, the storm should fall relatively uniformly over the city. It was desirable to have low flows in the river so that the greatest impact could be observed. High river flows would dilute urban runoff entering it, and high concentrations of suspended solids may have masked certain substances of concern. Consequently, the storm watch period began after the normal high river flows of July decreased to levels below about 400 m3/s. Once a storm was called, staff were to mobilize as quickly as possible to their
12
designated posts. A storm was called initially on August 11, 1991 at 0130 hr, but rainfall coverage over the city was uneven and showers were short and spotty. The City's consultants, I.D.Engineering (IDE), had numerous logistical and equipment problems in attempting to sample the storm and combined sewers. For these reasons, the sampling was terminated at 0630 hr and river samples discarded. IDE was able to combine the outfall samples obtained and have them analyzed as composites. This mobilization of staff provided an excellent dry run, and allowed unforseen problems to be solved, particularly with timing and coordination. Another storm was called at 2130 hr September 7 and sampling began at Capital Region and E.L.Smith at 2330 hr. All sampling of the event except for the automatic samplers downstream of the city was completed at 1250 hr September 9. Samples were either filtered and preserved on site at the water treatment plants and river sites, or brought back to the AEP facility in Edmonton (McIntyre Centre) for filtering and preservation. 2.1.3 Daily Composite Samples In late May-early June 1991, ISCO automatic samplers were established 1) above Devon Bridge on the right bank to provide background data, 2) on the left bank at Capital Region, upstream of the sewage treatment plant outfall, 3) at the old ferry site at Pakan (Victoria Settlement), on the left bank, downstream of Highway 855 bridge, 4) at the border, on the left bank at the Highway 17 bridge (Lloydminster Ferry). Remote electronic water quality monitoring units (Hydrolab datasondes) were also put in the river at these locations to determine whether such variables as dissolved oxygen, conductivity, pH or temperature might be affected by the passage of stormwater from the city. The ISCO automatic sampler collected daily composite water chemistry samples composed of aliquots collected every four hours. Samples in the automatic sampler were picked up weekly; only substances that would remain stable in the samples during this storage period were analyzed. During the storm event in early September, the Pakan and border automatic samplers were reprogrammed to collect samples every 4 or 8 hours, and the Capital Region sampler was used elsewhere. The Devon sampler and datasondes continued operation through this period. The equipment was removed from the river in mid-September, 1991. 2.2 SAMPLE PREPARATION AND ANALYSIS It was decided that initial investigations into the impact of urban runoff on water quality of the North Saskatchewan River should focus on easily measured substances known to be a concern in the river. These include certain metals, fecal coliform bacteria, organic matter and nutrients (Table 2). In addition, it was important to include several conservative substances so that input mass could be compared with the in-river mass of substances that were not subject to instream processing. Sodium and chloride were chosen because the historical data showed the greatest difference in concentration between samples collected above and below the city. Table 2 also lists variables analyzed in the daily composite samples collected during the summers of 1990 and 1991, and analyzed by Alberta Environmental Centre. The laboratories analyzing samples for the storm event included Norwest Labs


14
(water chemistry), the Provincial Laboratory of Public Health (fecal coliform bacteria) and the Alberta Environmental Centre (quality assurance splits). All three laboratories had agreed beforehand to accept samples on very short notice and at any time of the day or night; the event sampled began at about 2200 hr on a Saturday. During the storm event, the Alberta Environmental Protection facility called McIntyre Centre was used as a base for coordination and sample preparation. Samples were either filtered and preserved there, or at the Rossdale Water Treatment Plant, the Capital Region transect site or the Vinca transect site. Samples were preserved or filtered within 6 hours of sampling, or else maintained at 4oC until they could be processed. Microbiological samples were kept cool and delivered to the lab within about 12 hours of collection. 2.3 QUALITY ASSURANCE An extensive quality assurance program was incorporated into the sampling design. Quality assurance provides an indication that the data meet defined quality standards with a stated level of confidence; included in the quality assurance program are quality control, the procedures used to produce quality data, and quality assessment, the methods to evaluate data quality (Taylor 1990). In 1989, a round robin to assess commercial laboratory performance was conducted by the Environmental Quality Monitoring Branch. Ten laboratories participated and six were judged acceptable. In May 1990, one of the six, Norwest Laboratories, was selected to analyze samples for the project, but a suitable storm event did not occur that summer. An additional performance test was given to Norwest in June 1991; United States Environmental Protection Agency (USEPA) performance evaluation materials were provided to the lab to assess accuracy, as well as triplicate samples from the North Saskatchewan River to assess precision. Several of their results for metals and total organic carbon were outside acceptance or warning limits for the true values provided for the USEPA materials. These problems were pointed out to Norwest, and they agreed to investigate and correct whatever was necessary. Quality assurance procedures for the storm event included: 1. Preparation of sample bottles. Because a large number of samples would be collected
over a short period of time, it was deemed essential to prepare as much as possible in advance and to ensure there would be no mix-up in labelling. Bottles were pre-rinsed with distilled water, labelled, sorted and given a Norwest work order number to facilitate laboratory handling.
2. Protection of samples. Sensitive samples such as those for analysis of fecal coliforms
and BOD were kept cool and delivered to the laboratory within prescribed time limits. Other samples were kept cool and processed or preserved within 24 hours.
3. Field and prep laboratory record keeping. Record sheets for each sampling location
were prepared in advance. The time of sample collection, preparation and submission

15
to the labs, as well as comments about the samples, were recorded in progress. 4. Blanks. At each location, distilled deionized water was poured through the filtering
apparatus or prepared on site, preserved and submitted as a blind sample. 5. Splits. Set of samples collected at each location included one or more splits (two
identical portions of individual samples), which were submitted simultaneously to Norwest and Alberta Environmental Centre (AEC) to indicate accuracy problems. Bacteriological samples were split between the Provincial Laboratory of Public Health and Alberta Environmental Centre. About 10% of samples collected included a split.
6. Triplicates. About 10% of samples were split three ways; one was labelled as usual, the
other two splits were labelled differently and submitted to Norwest as a blind check on precision.
Discrepancies, precision problems and other concerns with some of the data provided by Norwest after the storm event sampling warranted further testing of the samples. Accordingly, in January 1992, a selection of 28 samples was retrieved from storage at Norwest, split, re-labelled and submitted again to Norwest and also to AEC. Included in the new submission were three blind samples made up of USEPA test materials, and a blank. Only preserved or stable variables could be re-analyzed. The results suggested that Norwest had contamination problems in certain nutrient and metals analyses (F.Dieken, AEC, pers. comm., March 1992). In consequence, all samples for total phosphorus and total kjeldahl nitrogen were re-analyzed by AEC, and Norwest agreed to reanalyze the metals samples. As a check on storage losses or changes over the period between analyses, the results of the original QA samples submitted to AEC were compared to results from re-analyzed samples. 2.4 DATA ANALYSIS 2.4.1 Quality Assurance Precision was estimated for triplicate samples analyzed by Norwest Labs and the Provincial Laboratory of Public Health by calculating a relative standard deviation (RSD = 100 (s/x)); relative standard deviations greater than 25% were considered unacceptable for this study. Accuracy was estimated during test runs by having Norwest Labs analyze USEPA test materials with known true values. Measured concentrations outside warning limits were considered unacceptable. For splits between AEC and Norwest, Norwest data that varied more than 25% were considered unacceptable. A summary of quality assurance results is provided in Appendix A. 2.4.2 Effluent Characterization and Loading Data provided by the City of Edmonton (IDE 1992, IDE 1993) and from studies conducted by Alberta Environmental Protection were used to characterize discharges from several storm events in the city.

16
The total mass of substance in various effluents was calculated for the duration of the September 7-8, 1991 storm period for seven constituents (TP, TKN, TOC, BOD, TSS, Na, fecal coliform bacteria). These variables were chosen because they fell within acceptable QA criteria. In addition, all had levels above the analytical detection limit in the river, so that a mass balance could be prepared. A 12-hour period was chosen to cover the duration of the storm, because each effluent differed with respect to timing and duration of discharge and time of travel in the river to the sampling point. During this 12-hour period, which began at 2200 hr September 7, 1991, storm and combined sewers discharged as little as three hours, whereas other discharges, such as the treated effluent from Gold Bar, were continuous. The constituent mass in the river at Vinca Bridge was also estimated for 12 hours so the total mass from effluents could be compared with the total mass in the river. Mass loads in the storm and combined sewers were calculated by summing the product of measured or extrapolated concentrations and flow volumes provided by the City of Edmonton (IDE 1992). The entire load provided by IDE (1992) was not always used because the estimate included base flow in the sewer outside of the storm period. Rating curves for the 30th Ave. storm sewer and the Rat Creek combined sewer were revised in 1993, so that it was necessary to calculate new mass loads from these sources. Storm and combined sewers not monitored by the city were extrapolated from monitored sewers to six drainage areas in the city as follows: 1. Areas west of the river and south of Quesnell basin, and east of the river south of
Riverbend and west of Whitemud Creek. 2. All of the areas discharging to Whitemud Creek. 3. The areas west of the river between the Quesnell and Groat basins, and the Belgravia
area east of the river. 4. All of the combined sewer area not discharging to Rat Creek. 5. All of the storm system discharging to Mill Creek. 6. All of the storm drainage areas east of 50th Street. Areas draining to stormwater lakes were not included in the estimates. For each of the five stormwater drainage areas, IDE extrapolated pollutant loads by determining the average basin pollutant yield for Quesnell, Groat and Kennedale storm sewers and multiplying by the drainage area and rainfall depth. The 30th Ave. sewer data were not used because only a composite sample was collected at this site. The estimated load from Area 4, the non-monitored combined sewer area, was pro-rated from Rat Creek because data from the monitored southside combined sewer, Capilano, were considered to be unrepresentative of combined sewer effluent and were not used; Capilano was included in Area 4 (IDE 1992). Concentrations and flows used for the continuous discharges were those covering the 12-hour period after the first sample was collected (i.e., 2300 hr Sept. 7, 1991 for Gold Bar treated effluent). For the industrial effluents, a total load for a 12-hour period was estimated from the 8-hour composite samples collected during the storm.

17
2.4.3 River Monitoring Several assumptions were made in setting up the monitoring program to assess impacts from a rainstorm in the city of Edmonton. Because the background water could be sampled only during the storm, not before it, it was necessary to assume that the chemistry of the sample water collected as it entered the city was relatively unchanging over time. The time of travel through the city is 16 hours at average flow, which meant that river water sampled downstream of the city during the storm had passed the E.L.Smith plant nearly a day before plant staff could begin to sample it. To determine the implications of this, data for several substances from the daily composite sample at Devon for September 6, 7 and 8 were compared with those collected at E.L.Smith plant on the days of the storm monitoring, September 7 and 8. Not all substances could be compared, because either they were not analyzed in the composite samples (e.g., fecal coliforms) or were analyzed in a different way (e.g. metals). The background concentration for TSS and other substances used in modelling and mass balance calculations were either values measured at Devon the day before the event, or else the earliest values only from the sampling at E.L.Smith. Another assumption was that the input of substances via creeks, atmospheric deposition and groundwater discharges between the city and the monitoring sites was negligible. Discharge data for several tributaries draining to the North Saskatchewan River were examined to determine their response to the passage of the storm. To check the possible magnitude of input from rain and dust falling directly onto the river, a coefficient for loading of TP (Mitchell 1985) was applied to the surface area of the river between the centre of the city and Vinca. It was estimated that about 0.3 kg TP would fall over a 12 hr period, which is negligible compared to loading from other sources. Although other variables were not quantified, it is assumed that their mass input would also be negligible. No information on groundwater discharges to the river during the storm event was available. The in-river mass loads at the Vinca Bridge sampling site were estimated by multiplying concentration at each of the five sampling points across the river by the discharge at that point and time, and summing the five mass loads, to yield a total mass for each time the river was sampled. The total mass of each constituent for a 12-hour period was estimated by averaging mass loads for the period 0830 hr September 8 through 0030 hr September 9, and reducing this total load to a 12-hour mass load. This was necessary because the storm-affected water appeared to take longer than 12 hours to pass the Vinca monitoring site. Data from the daily composite samples at the two sites (Pakan and border) downstream of the urban area were compared to precipitation data at the Municipal and International airports, with an appropriate shift in time to compensate for the time of travel of the river to the sampling site. Daily average precipitation (averaged for the two airports) was compared with daily data from the ISCO samplers and the datasonde monitoring units. 2.4.4 Modelling The event model MULTI was developed by consultants for Planning Division of Alberta Environmental Protection specifically to predict effects of Edmonton storms on water

18
quality in the North Saskatchewan River. It models the transport, dispersion and decay of solutes discharged into a river from single or multiple time-varying point sources. The model will estimate concentration profiles across the river at specific downstream locations to assess effects of urban runoff or spills. The model requires that river hydraulics, dispersion coefficients and locations of point sources and outputs be specified, and then concentrations and flows over time for each point source are entered. The model output includes two-dimensional contour plots of the concentration passing a fixed point on the river, and one-dimensional plots of concentration averaged across the river vs. time. Observed data can also be plotted to compare with predicted concentrations(HydroQual/Gore and Storrie 1988). Six variables analyzed in samples collected at Vinca were deemed suitable for model calibration (Fecal coliform bacteria, TP, TKN, TOC, Na and TSS). Other variables were below analytical detection limits in some samples (e.g., cyanide, several metals), did not show concentration differences above and below the urban area (e.g., specific conductance) or were analytically suspect. The September 1991 storm data for each source were entered as concentrations and flows at hourly intervals through the discharge period. Storm/combined sewer data collected every half hour were integrated to provide an hourly concentration and flow for each sewer and effluent. For storm and combined sewers not monitored by the City, the total loads for each of the six unmonitored areas estimated by IDE (1992) were broken into hourly loads by pro-rating flows and concentrations according to those of the nearest monitored sewer. These were entered into the model corresponding to the appropriate distance downstream of E.L.Smith, the zero distance for modelling purposes. For fecal coliform bacteria from unmonitored areas, for which IDE did not provide loads, counts used were an average of flow-weighted mean values from Quesnell, Groat and Kennedale storm sewers or Rat Creek combined sewer. In late 1993, the City provided revised flow estimates for the 30 Ave. storm sewer and the Rat Creek combined sewer, which necessitated rerunning the model for all variables. Industrial effluents, which were sampled as a composite sample over eight hours, were assumed to have a constant concentration and flow over the eight hours, but hourly flows provided by the industries were used when available. For the sewage treatment plant effluent, measured flow and concentration were used for the time period during the storm. It was necessary to extrapolate one day before and one day after the storm for these continuous effluents so that steady state or background conditions could be portrayed without the effect of the storm event. For Gold Bar, measured flows were available for the periods before and after the storm; concentrations were extrapolated from data collected on other dates. For Capital Region, flows and concentrations outside of the storm event monitoring period were extrapolated from data for other time periods. Only a single value for the river background concentration can be entered into the model, although samples were collected at E.L.Smith every two hours during the storm. There were also limited data from the daily composite sample at Devon, collected the day before the storm event occurred. The Devon data were used where possible; otherwise an average value for the earliest samples collected at E.L.Smith was used for background concentrations. Transverse dispersion coefficients used were those in Van Der Vinne (1992) and
19
longitudinal dispersion coefficients in Van Der Vinne (1991b). Leopold-Maddock hydraulic equations developed for the North Saskatchewan River (Ray and Dykema 1991) were used; these coefficients are entered as a constant for each of three reaches in the study area. River discharge rates for each reach were entered as hourly average flows from the Water Survey of Canada hydrometric station in Edmonton and shifted by time of travel. Flows determined from staff gauge readings at Capital Region during the storm event were used to determine additional inflow below the Edmonton hydrometric station. Process rate coefficients were added to the input deck of the model for non-conservative substances (those subject to transformation, assimilation or die-off in the river), including total phosphorus, total kjeldahl nitrogen, total organic carbon, and fecal coliforms. Rate coefficients from Bowie et al. (1985) were used initially, and then adjusted to obtain the best match between predicted and observed data. For observed data, the five measured concentrations per sampling time at the two transects were used directly for the two-dimensional contour plots. For the one-dimensional plots, only one concentration per sampling time can be used. To calculate an average concentration across the river, the observed concentrations were flow-weighted based on the surveyed river transect and river discharge per sampling time. The total load was divided by the total flow, to obtain one concentration for the river at the time of sampling. The model was run initially with sodium, because concentrations predicted by the model are a result of a simple mass balance and the validity of assumptions used in the model could be explored. This variable was chosen because of its analytical precision and its fairly large historical concentration difference between samples collected above and below the urban area. Concentrations predicted by the model at the Vinca Bridge sampling site were compared with observed data, primarily for the one-dimensional predictions, so that time of travel between predicted and observed data could be compared. Runs were also made with the Leopold-Maddock coefficients adjusted slightly for one reach (Fort Saskatchewan to Vinca) so that the time of peak concentrations in the observed and predicted data sets matched. For each modelled variable, Spearman's rank correlation test was used to determine the significance of the match between predicted and observed data. The non-parametric test was used because the data were not normally distributed. The model was also run for the Capital Region sampling site, even though observed data were not suitable for comparing with predicted data. The predicted data provide insight into concentrations expected in the river immediately downstream of the city after a storm event. 2.4.5 Analysis of Long-term Data Potentially Affected by Storm Events To evaluate the effect of storm events in the city of Edmonton on water quality at the border, monthly data collected for the Prairie Provinces Water Board (PPWB) by Environment Canada for April - October, 1985 - 1992 at Highway 17 (station 00AL05EF0003) were compared with rain events that occurred in the city 5 to 7 days before the water quality sample was collected. Rain events selected were those in excess of 5 mm over one to three days, as measured at the

20
Municipal and International airports. In addition, dry periods were also compared to border water quality; dry periods included those with less than 1 mm rain in the city 5 to 7 days before the water quality sample was collected. Excluded from the analysis were data that may have been affected by rain events of 1 to 5 mm during this period, or data that may have been affected by large rainstorms within five days of sample collection. The flow rate in the river was considered in evaluating these data. Variables of concern were fecal coliforms, copper, zinc, and lead, which occasionally exceed Prairie Provinces Water Board objectives; also tested were total suspended solids, total phosphorus and dissolved phosphorus. The non-parametric Mann-Whitney test was used to compare storm affected and non-storm affected data because variances of the two populations were dissimilar. An attempt was made to relate concentrations in samples collected monthly at Devon (Alberta Environmental Protection's Long-term River Network station) to those at the border 6 to 8 days later to determine background water quality. However, the time of travel back calculation revealed that none of the samples collected at Devon for this eight-year period could be compared with border data.


22
is reasonable given that only three storm sewers were monitored and the river flow data used were hourly. Water level was also read from a staff gauge at Capital Region during the storm event. The hydrograph produced from these readings is very similar to that at the Edmonton station, but flows appeared to be about 10% too high, based on readings after the storm flood had passed the Capital staff gauge, compared to flows at the Edmonton gauge. Estimated flow rates from the staff gauge readings were reduced by this amount, and the adjusted hydrograph is shown in Figure 3. The estimated volume of water added to the river by storm and combined sewers downstream of the Edmonton gauge is about 160,000 m3, which spread out over the hydrograph at Capital Region. The peak flow at the Edmonton gauge (290 m3/s) occurred at midnight and at 0330 hr at Capital Region, about a 4-hour time of travel for the flood wave. Constituent time of travel between these points is estimated at slightly over 8 hours. 3.2 STORM AND COMBINED SEWER DISCHARGES TO THE NORTH SASKATCHEWAN RIVER The water quality of urban runoff depends on numerous factors that are different for each rainfall event. These include drainage basin characteristics such as land use and slope, the amount of substances accumulated on land surfaces, the length of the dry period before the event, time of year, and pattern and amount of rainfall during the storm. As a result of complex interactions between these and other factors, characterization or prediction of water quality for a particular sewer is generally not possible, even for large versus small storms. For example, a long period of dry weather followed by a short intense rainfall may produce higher pollutant loads than a much larger storm following relatively rainy weather. Large storms tend to remove pollutants readily and from distant parts of the sub-watershed, but they also contribute a large volume of water for dilution. Very small storms may mobilize only a small percentage of pollutants on land surfaces, but little water is available for dilution. According to Pitt and Field (1977) the worst-case storm lies somewhere between these extreme storm volumes. Their worst-case storm was 6.4 mm rainfall over a storm duration of one hour, for a city of 100,000 people in the United States. There is also great variability during the course of an individual storm. Many studies suggest that concentrations are highest at the beginning of the storm; this characteristic of urban runoff is known as "first flush", and results from the initial washoff of loosely bound and easily transported materials from impervious surfaces (Whipple et al. 1983; Waste Management Group 1992). Edmonton's complex stormwater drainage system carries runoff from snowmelt and rainstorms to 217 storm sewer and 22 combined sewer outfalls located along the banks of the North Saskatchewan River and several tributaries. In many of the areas developed in recent years, stormwater drainage first enters storage lakes, which then release water slowly to the river or a creek. Most of the storm sewers drain relatively small subbasins; about 77% of the land area serviced by the separated sewer system discharges via 18 major outfalls (Ahmad 1985). Recent estimates suggest that 75% of the annual flow volume from storm sewers is discharged from only four major outfalls (30th Ave., Quesnell, Kennedale and Groat - see Figure 2) (UMA 1993). The combined sewers are located in the older central core of the city. The largest combined sewer, Rat Creek, drains about one third of the total combined sewer area, but conveys 70 to 90% of the combined sewer overflow to the river (IDE 1992, UMA 1993). The total city area drained by the storm and combined system is just over 28,000 ha. excluding the area draining to the lakes; of this, the combined sewer area is 6300 ha. The ratio of runoff to rainfall (mm/mm) for the storm sewers ranged between 0.04 and 0.49 and averaged 0.22 for the storms monitored by IDE in 1991 and

23
1992. As would be expected, large storms had higher runoff to rainfall ratios than small storms. About 4 mm of rain is required to produce a discharge at Groat storm sewer, and about 2 mm to produce an overflow at Rat Creek, but this will vary with time of day and other factors (IDE 1993). The water quality of several storm and combined sewer discharges in the city has been monitored occasionally since 1987; five discharges have been monitored regularly since 1991. Most of the sampling has been conducted by combining samples over the course of the storm event to produce one composite sample, but a few sewers during several events have been sampled as time series, or "pollutographs", in which flow is estimated continuously or as discrete measurements, and chemistry samples are collected periodically. Except for occasional single samples, the list of substances analyzed in these sewer discharges is very short and limited to inorganic or conventional variables (primarily TSS, BOD, TP, TKN, NH3-N); many other chemicals, some of which could be a concern in the river, were not analyzed. The storm sewers that have been sampled as time series include Groat, Quesnell, Kennedale, 30th Ave. and Duggan-Petrolia. The combined sewers include Rat Creek and recently, Highlands and Capilano. These sewers drain large areas of the city, and are generally representative of major land use types. Table 3 presents ranges of concentrations of selected constituents analyzed in stormwater samples from these sewers. Also presented are concentration ranges from the literature for sewers monitored elsewhere. Of the Edmonton storm sewers, Quesnell tends to have higher concentrations of various substances than any of the others monitored. It drains mixed residential and industrial land on the north side of the city; much of the area was developed many years ago. The large combined sewer called Rat Creek discharges very high concentrations of nutrients, BOD and bacteria that are typical of dilute untreated domestic sewage. Concentrations measured in Edmonton urban runoff are in line with those from other studies, particularly the Ontario study (see Table 3). The storm monitored in September 1991 was neither the largest nor smallest of those monitored in the city since 1987, and concentrations generally fall within the range of the others. All of the storm sewers monitored during this storm discharged the highest concentrations of substances and flow at the beginning of the storm (Figure 4a and b), whereas Rat Creek was more variable. Because the highest concentration of most substances occurred in the first sample, it is not known whether this was the peak concentration for the event in the particular sewer. If the first sample was collected after the peak concentration had occurred, the total load for that substance may have been underestimated slightly. Other storms sampled in these sewers showed less first flush effect (Figure 5). For example, on July 30, 1987 the Quesnell sewer began to flow within 1/2 hour of the beginning of the rain (3 mm rainfall in the first hour), but on August 20, 1987 did not begin to discharge until 4 hours after the rain began (1.5 mm of rain over this period). On July 30, concentrations of fecal coliform bacteria peaked with peak discharge, about an hour and a half after the sewer began to flow, whereas total phosphorus (TP), nickel and total kjeldahl nitrogen (TKN) concentrations peaked both before and after the peak discharge. On

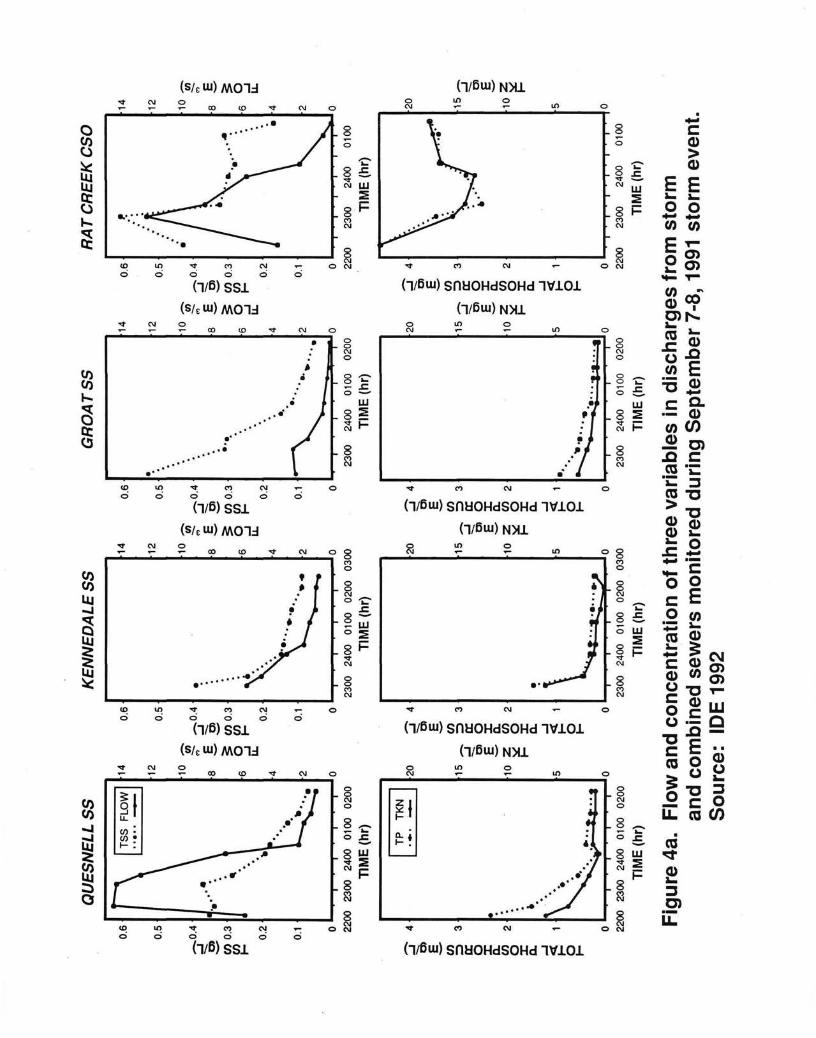

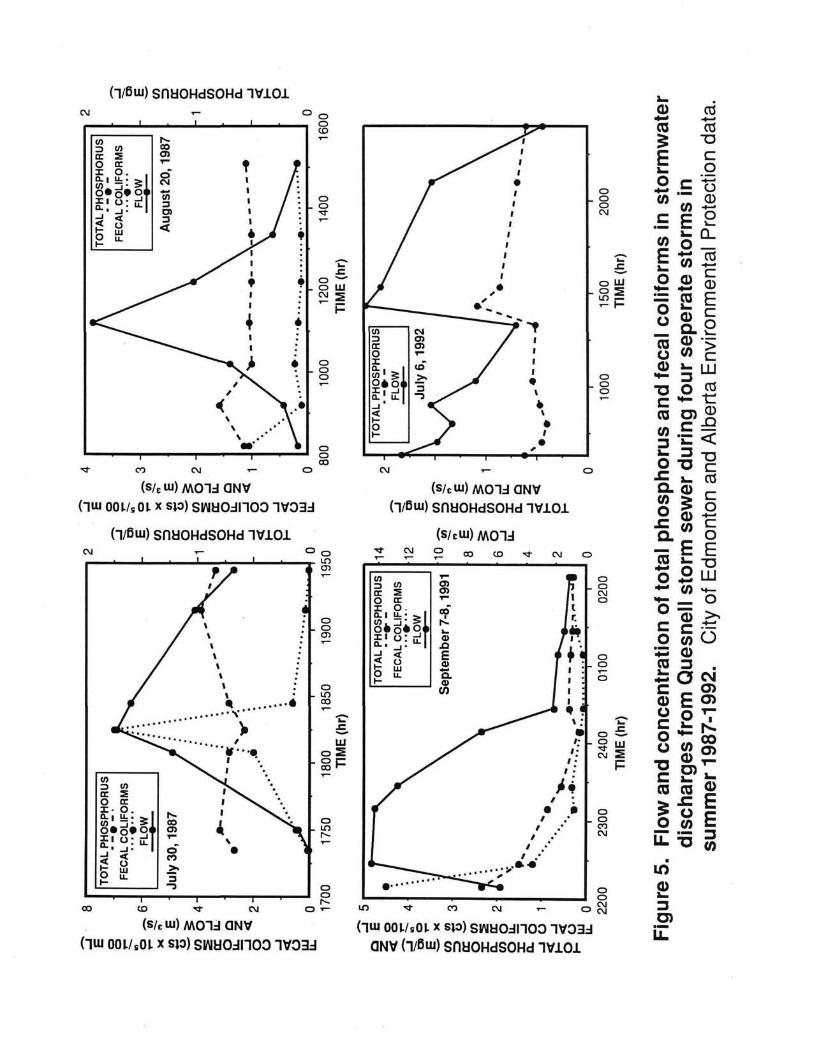

28
August 20, 1987 concentrations of most substances peaked within about an hour and a half after discharge began, although total suspended solids (TSS) and associated substances peaked with the peak in flow, about three hours after the sewer began to discharge. Fecal coliforms were highest in the first sample. One might expect that fecal coliforms present in the system from cross connections would be discharged at a relatively constant rate, so that densities in the effluent would be inversely proportional to the volume of flow. This appears to be true for two of the three storms with fecal coliform data shown in Figure 5, but washoff from the urban landscape is likely a major source as well. On September 7-8, 1991 levels of total phosphorus and fecal coliforms, as well as most other substances, were highest in the first sample at 2215 hr, even though flow did not peak until 2245 hr. This event showed the clearest example of first flush, perhaps because the rainfall was most intense at the beginning of the event. During an event sampled by IDE on July 6, 1992, total phosphorus levels tended to increase and then decline with flow. Rainfall was intermittent over an 18 hr period, and ranged between 10 and 24 mm across the city. It was estimated that 60 kg of total phosphorus was generated from the Quesnell sewer during the course of the event; in comparison, the short rainfall of September 7-8, 1991 (7 mm) was estimated to generate 107 kg of TP from the Quesnell sewer. The lower amount of loading from the July 6 event compared to the Sept. 8 event was true for other variables and sewers as well, except for total suspended solids. It was estimated that the TSS load from Quesnell was slightly higher for the July 6 event, for unknown reasons. Concentrations of substances monitored in the storm and combined sewer discharges are quite high relative to concentrations in the river. For example, the median concentration of total phosphorus in the river downstream from the city is 0.112 mg/L (Mitchell 1994), whereas in the events sampled by time series, concentrations ranged from 0.170 mg/L to 2.34 mg/L in the storm sewer discharges and 2.50 mg/L to 4.99 mg/L in the combined sewer discharges. Metals concentrations also tended to be elevated relative to those in the river. Counts of fecal coliform bacteria were particularly high; in the storm sewers they ranged up to 700,000 per 100 mL and in the combined sewer 6,200,000 per 100 mL, whereas background concentrations in the river (at the E.L.Smith WTP) were less than 80 per 100 mL during the storm event sampling. High concentrations of various pollutants in these effluents do not necessarily mean there would be an impact on the river, however. More important is the load to the river (concentration times discharge) and the resulting concentration after mixing and dilution. 3.3 TRIBUTARIES In conducting the storm event monitoring program, it was assumed that tributary input of substances between the city and the monitoring sites was negligible. Although several creeks and rivers enter the North Saskatchewan River between Edmonton and the border, the amount of rainfall was so small and the previous period had been so dry that there was very little runoff outside of the city. Daily average flow for the entire month of September 1991 indicated zero flow for Waskatenau Creek, Pointe-aux-Pins Creek and the Vermilion River, and only 0.001 m3/s for the Redwater River. Namepi Creek near Radway increased from 0.001 m3/s to 0.002 m3/s during the passage of the storm, and White Earth Creek near Smoky Lake increased from 0.005 m3/s to 0.011 m3/s (Water Survey of Canada 1991). Two tributaries were sampled during the 1991 storm event, but flow measurements for both Whitemud Creek and Sturgeon River were problematic. There had been insufficient flow in
29
the Whitemud Creek during the months before the storm event to develop an accurate rating curve, and it appeared flows were underestimated and therefore loading estimates would also be underestimated. For example, the total load of TP for a 10 hour period calculated for Whitemud Creek at 45 Ave. was less than 1 kg, whereas IDE (1992) estimated that 30 kg of TP would be generated by an area of urban watershed that drained to Whitemud Creek. As a result, estimates of unmeasured area runoff and loading provided by IDE (1992) were used for modelling and mass balance calculations, rather than measured loads. The water quality at the two Whitemud Creek sites was very different. For example, conductivity averaged 788 uS/cm upstream (confluence of Whitemud and Blackmud creeks, 23 Ave.), but only 280 uS/cm at 45th Avenue site, suggesting that the creek water sampled at the downstream location had a different source than that upstream. Fecal coliform counts at the two sites were also very different. In the first sample at the upstream sampling site counts were 260 per 100 mL, and levels declined with each successive sample. In contrast, counts from the 45 Ave. site ranged between 4300 and 38,000 per 100 mL. These levels exceed the Alberta Ambient Surface Water Quality Interim Guidelines for indirect contact recreation (1000 counts per 100 mL); indirect contact use may occur at this site as it is in a city park. It appears that the downstream site was heavily influenced by the large (2.1 m diameter) Duggan-Petrolia storm sewer, which was a short distance upstream of the sampling site. Concentrations of other constituents at the 45th Avenue site were similar to those in storm sewer effluent, although the storm sewer was not sampled during the event. The Sturgeon River was also sampled during the September 1991 storm event, but there was a problem with the water level recorder and only estimated flows could be used. Concentrations of most constituents were low, although there were occasional high values for several metals. Fecal coliform bacteria ranged from 20 to 110 counts per 100 mL, which may be considered background concentrations for streams in developed areas of the province (based on samples collected from various streams by Surface Water Assessment Branch). 3.4 LOADING ESTIMATES TO THE RIVER DURING THE 1991 STORM Mass loading estimates provide strong evidence that the Edmonton area has a major impact on water quality in the river, particularly during wet weather. Mass loading during the storm event was estimated for seven variables; results are summarized in Table 4 and Figure 6. Both the storm and combined sewer estimates include data extrapolated from unmonitored areas. For the combined sewers, the monitored sewer Rat Creek comprised 90% of the total load; for the storm sewers, the monitored portion of the total load ranged from 53% for TSS to 69% for sodium. The proportion of the total load derived from each source was fairly different for each constituent. The storm sewers were the largest source of total suspended solids and the combined sewers and the secondary bypass were the largest sources of fecal coliforms. Although one might expect that the Gold Bar secondary bypass would be a major contributor of pollutants to the river, this particular storm was relatively brief, and as a result the load was small. For larger storms, the secondary bypass would contribute a much greater


32
proportion of various substances compared to the final effluent load, particularly if primary treatment is bypassed. For example, a large secondary bypass that occurred in 1988 discharged 180,000 m3 of wastewater (City of Edmonton data); if the BOD concentration measured in the secondary bypass in September 1991 is applied to this discharge volume, the resulting load from the secondary bypass would be six times higher, whereas the loading from the final effluent would remain approximately the same. For the September 1991 storm, the secondary bypass loads were generally smaller than those from Rat Creek, but it is not known how this would compare for a larger storm. The final effluent from Gold Bar contributed the highest amount of total kjeldahl nitrogen and total phosphorus during the storm. In dry weather, the sewage treatment plant effluents would contribute 50 to 85% of nutrients and BOD added to the river as it passes through the Edmonton-Fort Saskatchewan area (Campbell 1990). On an annual basis, the Gold Bar effluent contributes the greatest amount of nitrogen, phosphorus, and BOD to the river of any of these sources (UMA 1993). Upstream sources contributed the highest loads of sodium and total organic carbon during the September 1991 storm. Industrial effluents contributed relatively minor amounts of these substances. Proportions of the total load contributed by point sources are fairly similar to those measured during a storm event in August 1987 at the downstream edge of the city (Mitchell 1994) and to relative loadings documented in UMA(1993). On the sampling date in August 1987, however, the background concentration of total suspended solids was considerably higher than during the September 1991 event, so that concentrations of substances that tend to adsorb to sediment particles were also higher. Of the total amount of substances measured in effluents and the river as it enters Edmonton, the portion contributed by various urban area discharges averaged 75%; this percentage ranged from 48% for total organic carbon to 100% for fecal coliforms. The largest sources were the storm sewers, the combined sewers and the Gold Bar final effluent. Mass loads from individual sources were added up ("TOTAL" in Table 4) and compared with mass loads measured in the river at Vinca ("Measured At Vinca"). Sodium was used to check the mass balance because it behaves conservatively in the river, and a summation of source loads should equal the load measured in the river if all sources had been accounted for. It appears that this is true for sodium; the percent difference between the total load by summation and that measured in the river is only 3%. The percent difference for TSS is also fairly low, especially as this variable is difficult to sample accurately because of its high variability in the effluents and river. For the remaining substances, including nutrients, fecal coliforms and organic carbon, the total mass measured at Vinca was smaller than the sum of the source estimates would indicate, suggesting a loss as the substance mass travelled down the river. Concentration of these substances declined over time as a result of biological uptake, adsorption to sediments, or, for bacteria, die off. A first-order decay rate was applied to the mass loads for the non-conservative substances (by running the model), and results are shown in the table as "Total With Decay". A percentage difference between measured and decayed mass was calculated; this difference was 10% or less for these constituents, also indicating that the majority of sources were accounted for during the sampling program.
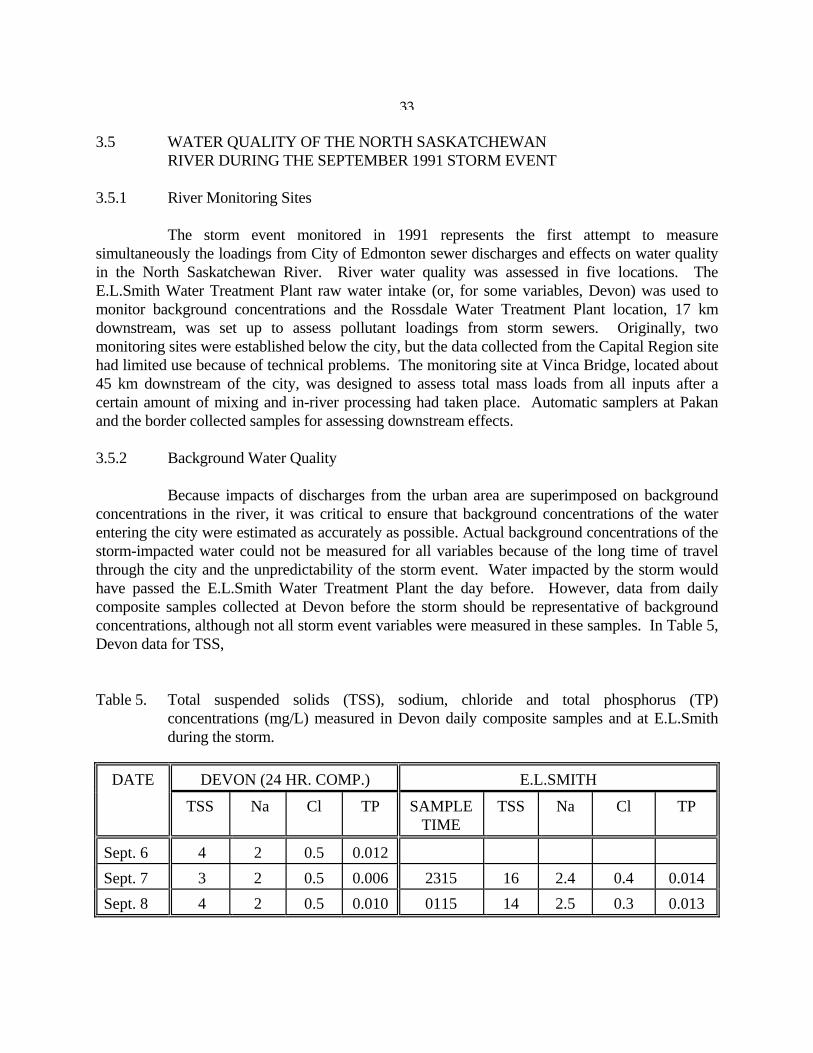
33
3.5 WATER QUALITY OF THE NORTH SASKATCHEWAN RIVER DURING THE SEPTEMBER 1991 STORM EVENT 3.5.1 River Monitoring Sites The storm event monitored in 1991 represents the first attempt to measure simultaneously the loadings from City of Edmonton sewer discharges and effects on water quality in the North Saskatchewan River. River water quality was assessed in five locations. The E.L.Smith Water Treatment Plant raw water intake (or, for some variables, Devon) was used to monitor background concentrations and the Rossdale Water Treatment Plant location, 17 km downstream, was set up to assess pollutant loadings from storm sewers. Originally, two monitoring sites were established below the city, but the data collected from the Capital Region site had limited use because of technical problems. The monitoring site at Vinca Bridge, located about 45 km downstream of the city, was designed to assess total mass loads from all inputs after a certain amount of mixing and in-river processing had taken place. Automatic samplers at Pakan and the border collected samples for assessing downstream effects. 3.5.2 Background Water Quality Because impacts of discharges from the urban area are superimposed on background concentrations in the river, it was critical to ensure that background concentrations of the water entering the city were estimated as accurately as possible. Actual background concentrations of the storm-impacted water could not be measured for all variables because of the long time of travel through the city and the unpredictability of the storm event. Water impacted by the storm would have passed the E.L.Smith Water Treatment Plant the day before. However, data from daily composite samples collected at Devon before the storm should be representative of background concentrations, although not all storm event variables were measured in these samples. In Table 5, Devon data for TSS, Table 5. Total suspended solids (TSS), sodium, chloride and total phosphorus (TP)
concentrations (mg/L) measured in Devon daily composite samples and at E.L.Smith during the storm.
DATE DEVON (24 HR. COMP.) E.L.SMITH
TSS Na Cl TP SAMPLE TIME
TSS Na Cl TP
Sept. 6 4 2 0.5 0.012 Sept. 7 3 2 0.5 0.006 2315 16 2.4 0.4 0.014 Sept. 8 4 2 0.5 0.010 0115 14 2.5 0.3 0.013

34
Na, Cl and TP are compared to data from E.L.Smith collected during the storm. Concentrations of TSS at E.L.Smith and Devon (shifted for time of travel) were fairly different, perhaps because the locations of the two intakes were different with respect to the channel cross section. Sodium and total phosphorus concentrations were reasonably similar. Concentrations measured at E.L.Smith over the period of the storm vary considerably, but this is not considered a problem because concentrations in storm-impacted water were several times higher than any background concentration measured.
The results of monitoring the river at the E.L.Smith water treatment plant indicate no apparent effects of the storm on upstream water quality, probably because there was little runoff outside of the city. Table 6 shows average concentrations of substances measured in the samples collected from the raw water intake. These concentrations are typical of water collected upstream of the urban area when suspended solids concentrations are low. All substance concentrations observed at E.L.Smith are well below applicable Canadian Water Quality Guidelines. 3.5.3 Rossdale A secondary objective of the study was to determine pollutant loads from storm sewers above the Rossdale Water Treatment Plant, and it was thought that mass loads in the river could be calculated from data collected from samplers on either side of the river and from the raw water intake in the centre of the river. However, it was necessary for water treatment plant personnel to use the side-channel intake on the left bank during the storm, so the data collected at the Rossdale site could not be used for this purpose. However, the data may be used to indicate how stormwater affects the raw water withdrawn by the plant when the side intake is used during wet weather. Table 6 presents medians and ranges in concentrations for the first 12 hours of sampling at the left bank raw water intake within the plant, and from the automatic samplers located on right and left banks near the plant. Concentrations for all variables tended to be higher at Rossdale than at E.L.Smith, and levels of several substances were higher in the raw water intake and the left bank automatic sampler than in samples from the right bank sampler. The latter difference is probably related to timing of impact of various stormwater plumes relative to the location of the intake, and timing of sample collection. Figure 7 shows concentrations of several substances measured over time at Rossdale. The first set of samples collected at Rossdale was affected by stormwater discharges, and concentrations continued to be elevated for about 6-8 hours. The highest concentration of most substances occurred during the period of greatest flow in the storm sewers, from 2345 hr to about 0345 hr, but the timing of peaks for different substances and intakes varied somewhat. These effects relate to the distance major discharges travelled before impacting samples at Rossdale. Based on results of dye dispersion work completed for the City of Edmonton (HydroQual 1987), bank discharges remain close to the bank as they travel downstream. It is likely that the high concentrations observed in the Rossdale intake (e.g., total phosphorus) and left bank sampler were derived from the large storm sewers upstream, particularly Quesnell and Groat. The travel time from the Quesnell sewer to Rossdale is about three hours and from Groat about 1 hour (at the 250-270 m3/s that occurred during the storm), but Van Der Vinne (1991a) suggested that flow along this bank would


37
require about 30% longer than the average travel time for that section of the river. Both sewers were flowing well at 2230 hr. Thus, flow from the Quesnell sewer could have contributed to the 0345 peak in fecal coliforms at the intake, but it is likely that peaks of other constituents such as TP at 0145 hr were derived from sewers closer to the intake, such as Groat and McKinnon. It is interesting that there was such a difference between the intake samples and the samples from the left bank sampler; the latter tended to have highest concentrations in the first sample at 2345 hrs on Sept. 7. Although both intakes were located in the same general area, the left bank automatic sampler intake was located upstream of the water treatment plant intake and about 4-5 m offshore. The automatic sampler intake was well into the current, whereas the water treatment plant intake is located at the bank, where presumably the current is slower. It appears that stormwater plumes affected the two intakes differently. The water treatment plant intake was also affected by discharges at 1345 hr, about 15 hr after the peak storm runoff. The source of this increase is unknown, but it is likely fairly close to the intake because there was no indication of similar increases in samples from the automatic samplers, suggesting that the plume was fairly discrete. There were increases in TSS, TKN, TP, metals and fecal coliforms, but levels of other substances, including BOD and sodium, did not increase in the 1345 hr sample from the water treatment plant intake. It would not be possible to ascertain precisely which sewers are affecting the intake most at a given time without using dye, because there would be a cumulative effect as plumes from upstream sewers pass into plumes from those downstream. However, it is evident that the water treatment plant intake near shore is affected by urban runoff. Discharges from sewers on the south (right) bank, such as the large 30 Ave. sewer or Whitemud Creek, would not affect left bank intakes at Rossdale, but their discharges briefly increased concentrations in samples from the right bank. Total suspended solids levels in several samples from the Rossdale intake increased sufficiently over background concentrations at Devon to exceed the Alberta Ambient Surface Water Quality Interim Guidelines for TSS (guideline is "not to be increased by more than 10 mg/L over background") during the passage of the storm; such increased levels of suspended solids may be attributed directly to the storm sewer discharges. At all three Rossdale sampling sites during the passage of storm-affected water, fecal coliform counts exceeded the Alberta Ambient Surface Water Quality Interim (ASWQI) Guideline for a raw water supply and indirect contact recreation (guideline is "90% of samples should have a fecal coliform count of less than 1000 organisms per 100 mL). Metals concentrations tended to be elevated somewhat during the passage of the storm; many of the metals in the North Saskatchewan River are correlated to levels of suspended solids (Shaw et al. 1994). 3.5.4 Capital Region Although the Capital Region site was successfully sampled during the storm, a survey of the transect intakes after the storm event indicated that the intake pipes had moved some distance downstream. As a result, the transect was biased toward the left or north bank, missing about 40% of the distance across the river, including the major portion of the plume from the Gold Bar treated effluent. Data collected at this site were not used for mass balance estimates and modelling, but are suitable for a qualitative assessment.

38
For most variables, the highest concentrations measured in the river during the storm event were observed at this site. Fecal coliform bacteria counts were very high; all samples contained counts greater than 200 per 100 mL, and the set of samples collected over the 24-hour period exceeded Alberta ASWQI Guidelines for direct and indirect contact recreation. The Rat Creek combined sewer overflow was the largest source of these bacteria; it contributed over half of the bacteria in the river at that point. The total suspended solids concentration was very high in samples collected from the site closest to the left bank of the river, probably resulting from bank erosion as well as storm sewer discharges. Further details are provided in the modelling section (3.7). 3.5.5 Vinca Bridge Sampling at the Vinca Bridge site provided a data set that represented inputs from storm sewers, combined sewers, treated effluents from Gold Bar and Capital Region, the Gold Bar secondary bypass, the Sturgeon River and industries. Samples were collected at this transect every three hours, so that the duration of sampling was extended to cover the storm effects as the plume spread out through dispersion. Medians and ranges in concentrations during the period of storm passage are presented in Table 6. Concentrations of many variables were lower than observed at Capital Region, but higher than at Rossdale. The geometric mean of fecal coliform counts in the samples collected at this site during the period of storm passage (0830 Sept. 8 to 0030 Sept. 9) was 2310 per 100 mL; this exceeds the Alberta ASWQI guideline of 200 counts per 100 mL for direct contact recreation and irrigation of vegetable crops, and the guideline of 1000 counts per 100 mL for indirect contact recreation and use as a potable water supply. Figure 8 presents flow-weighted mean concentrations of six variables at Vinca. For most variables, the peak concentration occurred at 1830 hr on September 8, about 20 hours after the storm began in Edmonton. A back calculation of time of travel would put the peak originating from the downstream edge of the city. This estimate can only be rough at best, because dispersion and differential flow velocities across the river channel are not considered. It is obvious, however, that effluents from storm and combined sewer discharges and other sources during the storm event increased concentrations of various substances in the river at Vinca even for this small storm. Figure 9 presents measured concentrations across the river over time for four of the variables shown in Figure 8. These two-dimensional plots portray isopleths or contours based on samples collected at the five transect sites. Total suspended solids concentrations were highest in the centre of the river, whereas for the other variables, concentrations were highest along the right bank. Total suspended solids may settle out in the lower velocities along the banks, which should result in lower concentrations, but this may be offset somewhat by resuspension. The predicted load of TSS based on mass balance estimates is about 17% higher than the measured load, suggesting some settling had occurred; measurement error for this highly variable substance may have accounted for this discrepancy, however. For TKN, the high concentration on the right bank is likely derived from sewage treatment plant inputs (53% of the total TKN load added to the river upstream of Vinca was estimated to be derived from treated and bypassed municipal effluents). For fecal coliforms, the mass loading from the city was somewhat greater on the left bank than the right, mainly because of very high loads from Rat Creek CSO. It appears, however, that


41
considerable mixing has occurred by the time the river reaches Vinca, because the highest FC concentrations were in the centre and on the right bank. Metals data for the storm event were not used quantitatively because of analytical problems. Other studies indicate levels of lead, zinc and nickel increase in the river water and sediments between Devon and Vinca (Anderson et al. 1986; Shaw et al. 1994). The highest concentrations of lead in the river water below the urban area tend to occur on the left bank, likely from storm sewer discharges. For nickel, the highest concentrations tend to occur on the right side of the river, and are probably derived from industrial effluents in the Fort Saskatchewan area, although there are elevated concentrations in storm and combined sewer discharges as well. Zinc concentrations are strongly correlated to suspended solids levels, and therefore sources are both natural (when TSS is high) and anthropogenic (from storm and combined sewer discharges as well as municipal and industrial effluents). 3.5.6 Pakan and Border Samples were collected every four hours after the storm event at Pakan (downstream of Highway 855 bridge) and at the border with Saskatchewan for variables that would remain stable during storage. The storm appeared to have peaked at Pakan at 1600 hrs on September 9, about 41 hours after storm/combined sewer discharges peaked in Edmonton. This is very close to the predicted time of travel between these points (about 44 hr from Rat Creek CSO). Sodium and total phosphorus concentrations at Pakan show effects of the storm most clearly, although peak concentrations are not appreciably higher than concentrations before and after it (Figure 10). The small size of the storm, dispersion and the masking effect of diurnal variation of flows from the two sewage treatment plants and industries all tend to diminish the magnitude of the peak, as well as the 4-hour spacing of sample collection at Pakan. Medians and ranges in concentrations of substances analyzed during the storm event are presented in Table 6. Concentrations are generally lower or similar to those at Vinca, except for TOC (for unknown reasons). A fecal coliform sample was not collected during the time the stormwater would have passed the automatic sampler, but it is likely fecal coliform counts would have declined considerably between the Edmonton area and Pakan due to die off. Samples collected later in the monitoring period indicated background levels. The water affected by the storm in Edmonton should have arrived at the border 120 hours (5 days) after the event in Edmonton, or very late on September 12. Sampling began 65 hours after discharges from the storm and combined sewers peaked, and continued for 7 days. Although the highest concentrations of sodium and total phosphorus occurred in the sample collected at the predicted peak time, the increase over concentrations in other samples was very small, probably within measurement error (Figure 10). In addition, sodium levels may have been affected by discharges from Canadian Salt Co. Ltd. at Lindbergh, although concentrations after complete mixing should increase by no more than 0.05 mg/L as a result of these discharges (based on data for September 1991 provided by Water Quality Branch, Standards and Approvals Division). Medians and ranges of concentrations analyzed in samples collected at the border are presented in Table 6. Note that although most variables are lower in concentration than those at Pakan, a few, like sodium, are slightly higher.
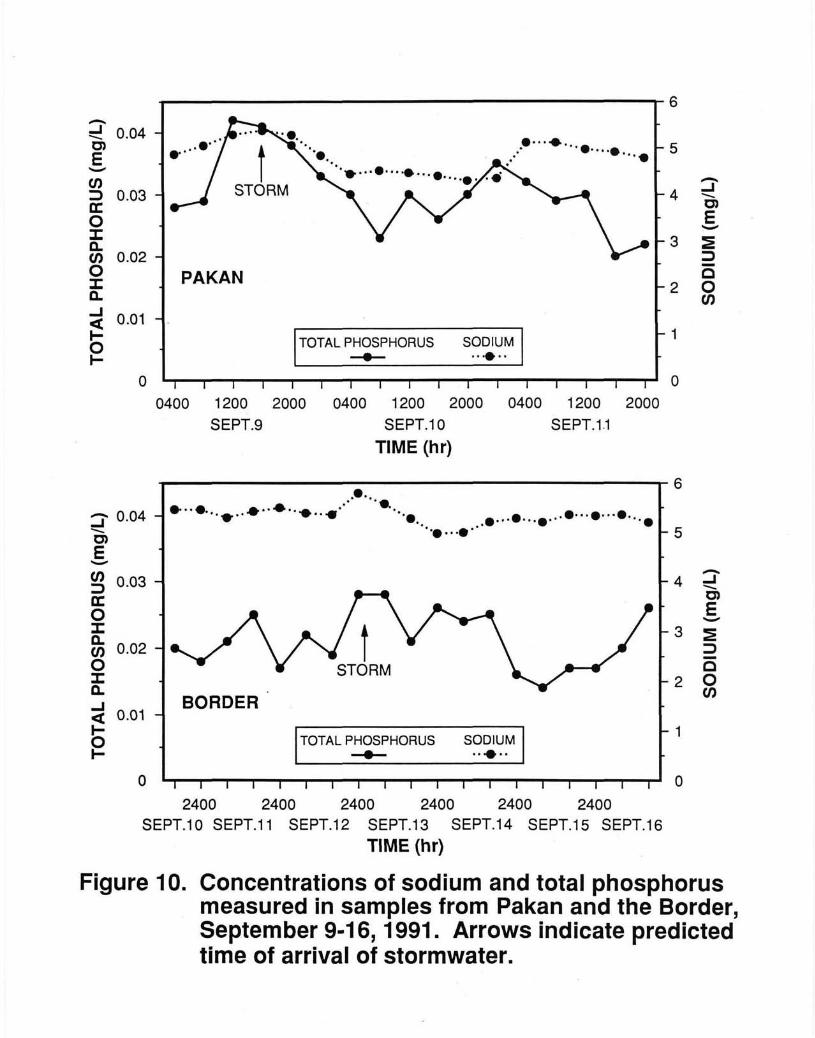

43
3.6 EFFECT OF OTHER SUMMER STORMS ON WATER QUALITY DOWNSTREAM OF EDMONTON Two approaches were used to obtain additional information on the effects of summer storms on water quality in the river. During the summer of 1991, automatic samplers collected daily water quality data at Devon, Capital Region, Pakan and the border. The purpose of these installations was to obtain data to compare with rainfall in the Edmonton area, to determine whether certain variables change as storm-affected water passes. In addition, there were monthly chemistry data available from the long-term PPWB monitoring station at the border, which were also compared to rainfall in the Edmonton area for an eight-year period of time. An example of how urban stormwater affects water quality downstream of the city is shown in Figure 11, for a storm that occurred on June 7 and 8, 1991. Rainfall at the two Edmonton weather stations averaged 14.4 mm on June 7 and 26.7 mm on June 8. River time of travel from Edmonton to Pakan is about two days, and to the border five days from Edmonton. Also included in the graphs are data from Devon, upstream of the city, to indicate the quality of the river water as it enters the urban area. Note that suspended solids and other variables increased at Devon on June 10-11, after the June 7-8 storm in Edmonton. This increase was likely the effects of runoff from the upstream watershed or changes in flow as a result of releases from the dams upstream (Figure 12). Below the city, the most noticeable effect is higher concentrations at the downstream sites compared to Devon, so that there is a combined effect of urban runoff and runoff upstream of the city (and probably runoff from agricultural areas below the city). For most constituents, e.g., total phosphorus and copper at Pakan, there were peaks in concentrations on June 9 and 12, and at the border on June 12 and 15. The first peak corresponds to the travel time between Edmonton and the downstream locations for the June 7-8 storm, and the second peak to increased concentrations from upstream of the city, as observed at Devon. Note that the second peak is higher for these two variables and probably includes urban discharges as well as runoff from the watershed below the urban area. For lead, for which the largest source may be storm sewer discharges, the first peak was highest. Metals concentrations were very variable; although metals are often correlated with suspended solids, correlations between TSS and copper or TSS and lead in these samples were not significant, perhaps because many metals values were at or below the analytical detection limit. Total phosphorus levels were highly correlated with TSS at Devon and Pakan (r2 = 0.94 and 0.92, respectively, n=30). One might expect less correlation below the city, because about 90% of the phosphorus in the final effluent from the sewage treatment plants is in the dissolved form, and phosphorus in the river during non-storm conditions is derived largely from these effluents. When background levels of suspended solids are high, loadings of phosphorus in sewage treatment plant effluents are masked. A comparison of dissolved phosphorus rather than total phosphorus concentrations above and below the urban area would provide a better estimate of urban impacts for this variable. The total increase in river flow from storm and combined sewer discharges alone can be appreciable; during the September 7-8, 1991 monitored storm (rainfall about 7 mm), it was estimated that flow in the river increased by about 23 m3/s for a few hours. This increase was not apparent in daily flows at the border hydrographic station three or four days later. The potential volume of water from storm and combined sewer discharges during


47
phosphorus and flow rate. A similar analysis for fecal coliforms and nutrients was completed for the period 1976 - 1984 (Shaw et al. 1994); these results for selected variables are also included in Table 7. For all of these variables except dissolved phosphorus, the storm-affected water quality averages and medians are higher than those not affected by storms in the city. Flow in the river was generally higher for the storm-affected data, and the difference between the two sets of data is highly significant. The higher flows are a result of runoff from storms that affected the city and perhaps elsewhere in the watershed (upstream and downstream of the city) as well as several events that occurred at the time of year that flows in the river were high from mountain runoff and releases from the upstream reservoirs (June-July). Fecal coliform bacteria counts in the river were significantly higher after periods of rain in the city; there were no PPWB excursions for the data collected after dry weather in Edmonton (maximum 70 counts per 100 mL), whereas for the storm-affected data, there were four excursions out of 14 samples (PPWB objective is 100 counts per 100 mL). Thus it would appear that storm events are largely responsible for excursions at the border. However, the die-off rate for these bacteria is relatively high when water temperatures are high. A die-off rate for fecal coliforms was determined empirically during modelling of the September 1991 storm event. This die-off rate (0.08 per hour) would decrease the fecal bacterial population that originates in the urban area to nearly nil before it reaches the border. However, many factors can affect bacterial populations and this rate may not be valid for other storm events or for downstream reaches. Agricultural runoff from the watershed near the border is a possible source for increased bacterial counts in the river. Flow data for the Vermilion River were examined to determine whether there was increased discharge at the time that excursions of the PPWB objectives for FC occurred. For the excursions that occurred in summer (July 1990, June 1991 and July 1992) flows in the Vermilion River were less than 1 m3/s, and showed no indication that the storms affecting Edmonton also affected areas further east. There may be unknown sources of fecal coliforms in downstream reaches, such as the bottom sediments of the river, which could sporadically contribute fecal coliforms, particularly during high flows. Further studies will be required to determine sources of fecal coliforms contributing to PPWB excursions at the border. For copper, the PPWB objective of 0.004 mg/L was exceeded four times for the storm affected data, and three times for the non-affected data. The difference between storm affected and non-storm affected data was not significant. Canadian Salt Co. Ltd. effluent contains fairly high levels of copper, but dilution in the river would result in negligible increases in concentration. Excursions do not always coincide with high TSS levels. Further investigation is needed to determine sources of copper in the river. For lead and zinc, there were no excursions for the non-affected data but one and two excursions respectively for the storm affected data. For these two metals, the storm and non-storm data were significantly different, suggesting storm events in the city are responsible for many of the excursions at the border. As with other variables exceeding objectives, however, further investigation is needed, especially as these excursions coincided with concentrations of total suspended solids over 100 mg/L. Total and dissolved phosphorus are not significantly different between storm and non-storm data. Total phosphorus is correlated to total suspended solids at the border (r2 = 0.87, n=19,
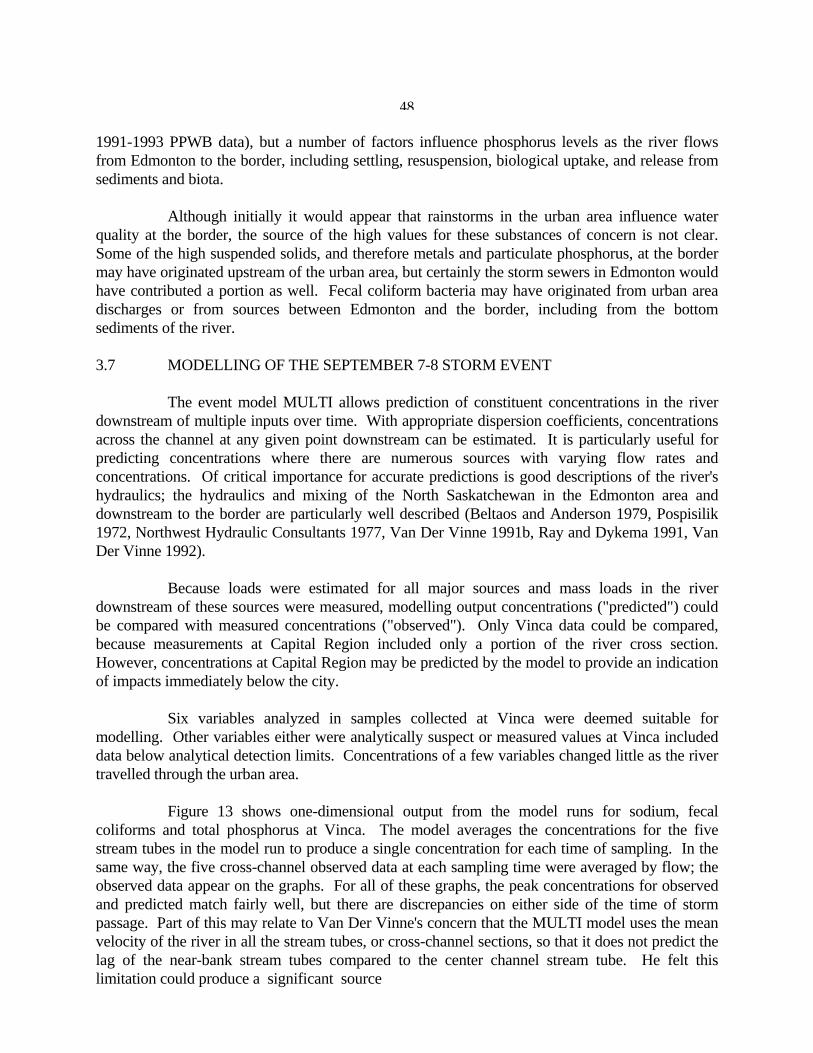
48
1991-1993 PPWB data), but a number of factors influence phosphorus levels as the river flows from Edmonton to the border, including settling, resuspension, biological uptake, and release from sediments and biota. Although initially it would appear that rainstorms in the urban area influence water quality at the border, the source of the high values for these substances of concern is not clear. Some of the high suspended solids, and therefore metals and particulate phosphorus, at the border may have originated upstream of the urban area, but certainly the storm sewers in Edmonton would have contributed a portion as well. Fecal coliform bacteria may have originated from urban area discharges or from sources between Edmonton and the border, including from the bottom sediments of the river. 3.7 MODELLING OF THE SEPTEMBER 7-8 STORM EVENT The event model MULTI allows prediction of constituent concentrations in the river downstream of multiple inputs over time. With appropriate dispersion coefficients, concentrations across the channel at any given point downstream can be estimated. It is particularly useful for predicting concentrations where there are numerous sources with varying flow rates and concentrations. Of critical importance for accurate predictions is good descriptions of the river's hydraulics; the hydraulics and mixing of the North Saskatchewan in the Edmonton area and downstream to the border are particularly well described (Beltaos and Anderson 1979, Pospisilik 1972, Northwest Hydraulic Consultants 1977, Van Der Vinne 1991b, Ray and Dykema 1991, Van Der Vinne 1992). Because loads were estimated for all major sources and mass loads in the river downstream of these sources were measured, modelling output concentrations ("predicted") could be compared with measured concentrations ("observed"). Only Vinca data could be compared, because measurements at Capital Region included only a portion of the river cross section. However, concentrations at Capital Region may be predicted by the model to provide an indication of impacts immediately below the city. Six variables analyzed in samples collected at Vinca were deemed suitable for modelling. Other variables either were analytically suspect or measured values at Vinca included data below analytical detection limits. Concentrations of a few variables changed little as the river travelled through the urban area. Figure 13 shows one-dimensional output from the model runs for sodium, fecal coliforms and total phosphorus at Vinca. The model averages the concentrations for the five stream tubes in the model run to produce a single concentration for each time of sampling. In the same way, the five cross-channel observed data at each sampling time were averaged by flow; the observed data appear on the graphs. For all of these graphs, the peak concentrations for observed and predicted match fairly well, but there are discrepancies on either side of the time of storm passage. Part of this may relate to Van Der Vinne's concern that the MULTI model uses the mean velocity of the river in all the stream tubes, or cross-channel sections, so that it does not predict the lag of the near-bank stream tubes compared to the center channel stream tube. He felt this limitation could produce a significant source
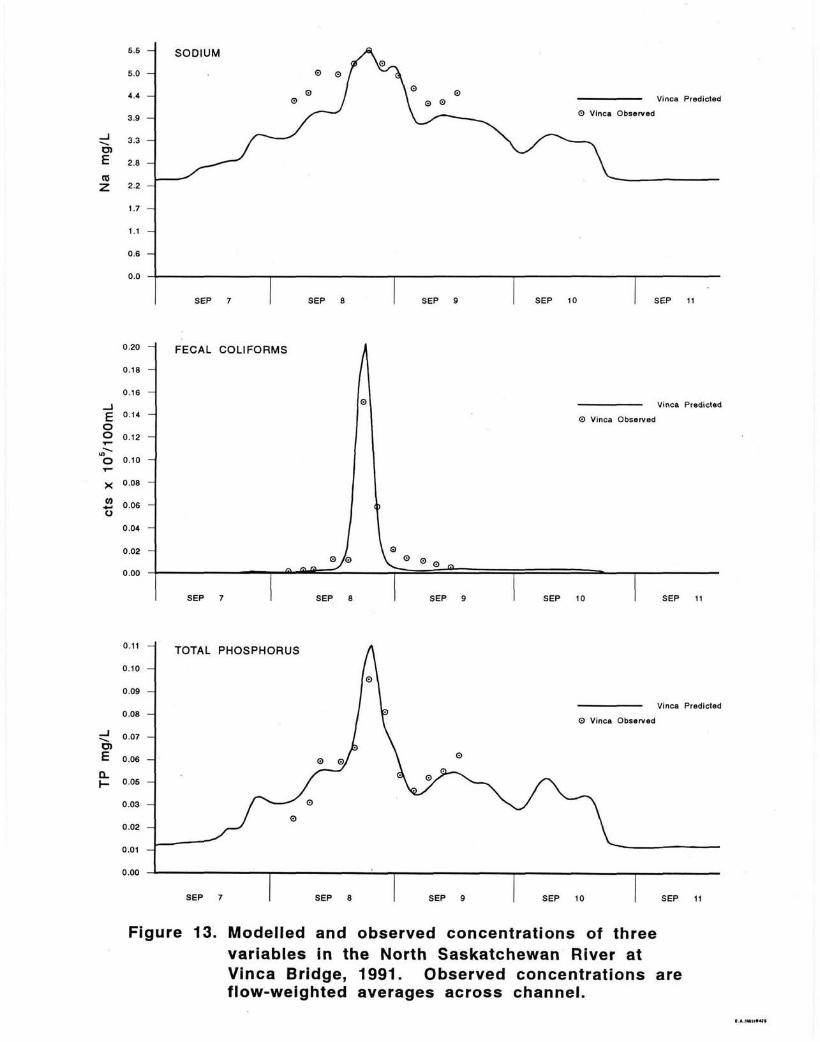

50
of error when concentration distributions from multiple effluents are superimposed (Van Der Vinne 1992). Another source of error may be the estimated (rather than measured) flows and concentrations for the sewage treatment plant and industrial effluents before and after the monitored period of the storm. Rate coefficients for die-off of fecal coliforms (0.08/hr) and uptake or settling of total phosphorus (0.8/day) were included in the model predictions shown in Figure 13. Fecal coliform disappearance rates reported in Bowie et al. (1985) range from 0.005/hr to 1.1/hr, with most summer rates similar to the 0.08/hr determined for the North Saskatchewan River storm event. The storm event coefficient for total phosphorus seems fairly high, although specific loss rates for total phosphorus are not reported in Bowie et al. (1985); they report a wide range of rates for transformation of various forms of phosphorus. The main phosphorus transformation processes in the North Saskatchewan River are likely uptake by plants and sedimentation (including sediment uptake). Rate coefficients were also used for modelling total organic carbon and total kjeldahl nitrogen; both were 0.4/day. Specific rates for these variables were not reported in Bowie et al. (1985); the rate derived empirically for the storm event is higher than reported rates for transformation of various forms of carbon and nitrogen (for example the range in rates for transformation of ammonia-nitrogen to nitrate-nitrogen is 0.025/day to 0.2/day). Spearman's rank correlation test was used to determine the significance of the match between predicted concentrations for a specific time and observed data collected at that time. Table 8 shows variables modelled and results of these tests. Sodium, fecal coliforms, total kjeldahl nitrogen, total phosphorus and total organic carbon appear to be calibrated for this storm. There is no relationship between predicted and observed values for total suspended solids, probably because of the dynamic nature in the river of this variable. Because predicted and observed concentrations of sodium are significantly correlated, as are Table 8. Results of Spearman's rank correlation test for MULTI runs. The analysis compared
predicted and measured values for specific sampling times at Vinca. Number of samples = 12.
VARIABLE r SIGNIFICANCE
TSS 0.13 P>0.50
Na 0.80 P = <0.005
FC 0.82 P = <0.005
TKN 0.90 P = <0.001
TP 0.88 P = <0.001
TOC 0.71 P = <0.02
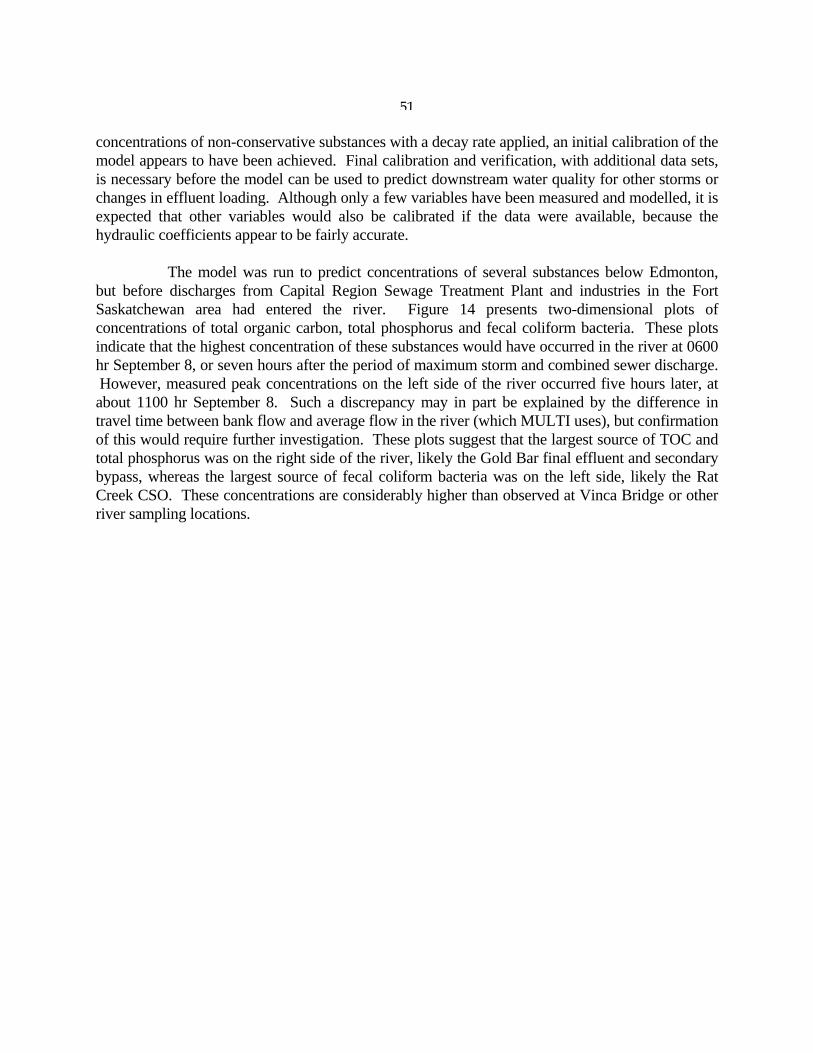
51
concentrations of non-conservative substances with a decay rate applied, an initial calibration of the model appears to have been achieved. Final calibration and verification, with additional data sets, is necessary before the model can be used to predict downstream water quality for other storms or changes in effluent loading. Although only a few variables have been measured and modelled, it is expected that other variables would also be calibrated if the data were available, because the hydraulic coefficients appear to be fairly accurate. The model was run to predict concentrations of several substances below Edmonton, but before discharges from Capital Region Sewage Treatment Plant and industries in the Fort Saskatchewan area had entered the river. Figure 14 presents two-dimensional plots of concentrations of total organic carbon, total phosphorus and fecal coliform bacteria. These plots indicate that the highest concentration of these substances would have occurred in the river at 0600 hr September 8, or seven hours after the period of maximum storm and combined sewer discharge. However, measured peak concentrations on the left side of the river occurred five hours later, at about 1100 hr September 8. Such a discrepancy may in part be explained by the difference in travel time between bank flow and average flow in the river (which MULTI uses), but confirmation of this would require further investigation. These plots suggest that the largest source of TOC and total phosphorus was on the right side of the river, likely the Gold Bar final effluent and secondary bypass, whereas the largest source of fecal coliform bacteria was on the left side, likely the Rat Creek CSO. These concentrations are considerably higher than observed at Vinca Bridge or other river sampling locations.
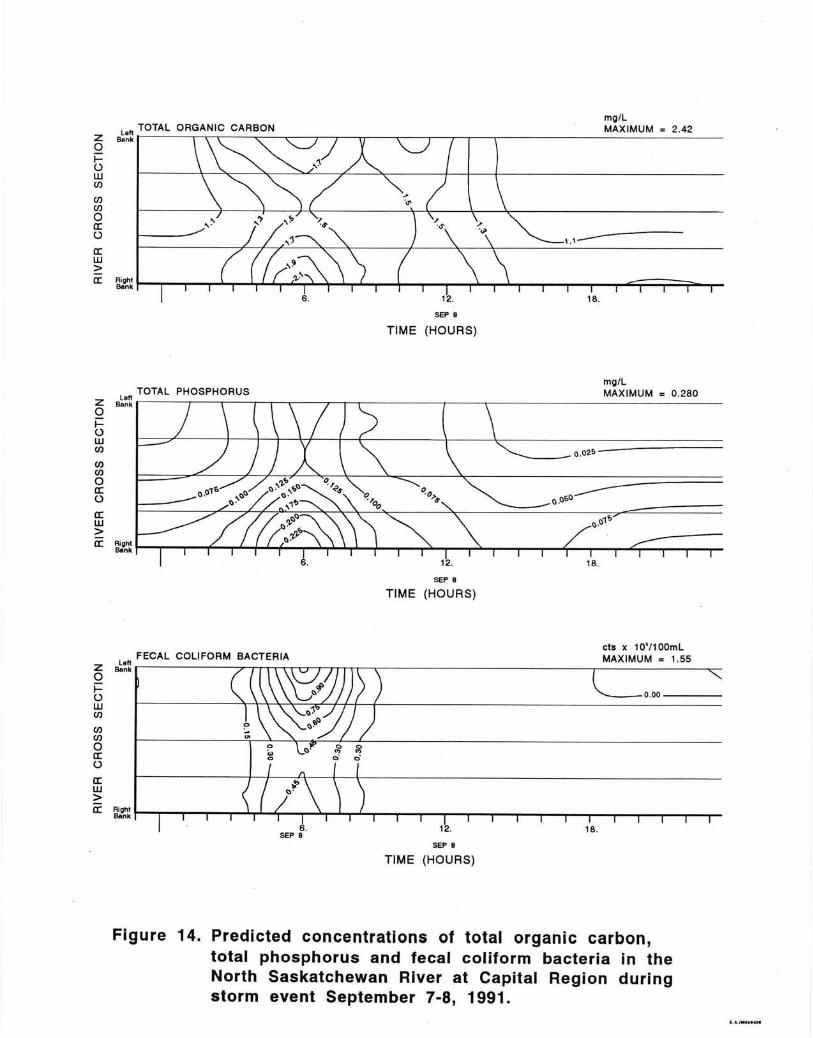
53
SUMMARY AND CONCLUSIONS The storm and combined sewers are an important source of pollutants to the North Saskatchewan River. Concentrations of various substances in discharges from storm sewers are very high compared to concentrations in the river, and are within the range reported for storm sewer discharges elsewhere. The combined sewers are of particular concern, because they discharge raw sewage mixed with stormwater. These discharges, as well as the secondary bypass at Gold Bar and storm sewer discharges, contain very high levels of fecal coliform bacteria, which may indicate the presence of human pathogenic bacteria. In addition, all of these discharges contain high concentrations of metals, suspended solids, organic material, and nutrients. Storm and combined sewer discharges vary considerably from storm to storm, in terms of flow rates and constituent loadings. Rainstorms in the city of Edmonton negatively impact water quality in the North Saskatchewan River. Even with the fairly small storm that occurred in September 1991, there were excursions of the Alberta Ambient Surface Water Quality Interim Guidelines at all of the sampling sites within and immediately below the city. Fecal coliform levels observed in the river at both Capital Region and Vinca would limit the use of the river for contact recreation and irrigation of vegetable crops. At the border, there are occasional exceedences of the PPWB objective for fecal coliforms and certain metals; urban storm-affected water passing the border site has significantly higher levels of fecal coliforms than water that is unaffected by storms. Empirically derived fecal coliform die-off rates for the North Saskatchewan River suggest that few of these bacteria would survive to reach the border. Yet at the time that excursions occurred, there was no evidence of higher tributary flows that may have contributed fecal coliforms to the river near the border. Thus, studies focused specifically on this problem would be required to determine sources of bacteria and other substances exceeding PPWB objectives. Sources of high concentrations of various substances in the river downstream of the urban area include: 1. Runoff from tributaries upstream of the city, which may dramatically increase
suspended solids, organic material and total metals. However, fecal coliform bacteria nearly always remain below 100 counts/100 mL at the Devon bridge long-term sampling site upstream of the city, During periods when non-point source runoff is not affecting the river, water quality upstream of the city is excellent.
2. Discharges from Gold Bar and Capital Region sewage treatment plants, ten industries
and discharges from the storm and combined sewers. During wet weather the storm and combined sewers and the secondary bypass at Gold Bar have the greatest impact on water quality in the river for the measured variables (TSS, Na, TP, TKN, TOC, BOD, fecal coliform bacteria); during dry weather, Gold Bar treated effluent has the greatest impact for these variables. The proportions of other chemicals and pollutants derived from these sources are unknown.
3. Runoff from tributaries downstream of the urban area, and possibly groundwater inputs.
Creeks and rivers between Edmonton and the border generally drain agricultural land, and during heavy runoff may contribute to excursions of fecal coliform or metals

54
guideline levels. Little is known about the volume and quality of tributary inputs or groundwater inflows.
Loadings estimated from monitoring storm and combined sewer discharges and other effluents were very similar to mass loads estimated by monitoring the river downstream of the urban area. Thus, it appears that the majority of sources were accounted for during the sampling program. For the September 1991 storm, the storm sewers contributed the greatest amount of total suspended solids (61% of the TSS in the river was from storm sewers); the combined sewers the greatest amount of fecal coliforms and BOD (FC 64%, BOD 32% of total amounts in river); the Gold Bar final effluent the highest loads of TKN and TP (TKN 40%, TP 34%); and upstream sources the highest loads of TOC and Na (TOC 47%, Na 41%). The event model MULTI has been calibrated with data from the 1991 storm event, and once additional data sets are obtained to verify the calibration, the model may be used to predict concentrations in the river after another storm event or a spill into the river. The calibrated model may also be used to predict the effects of reducing constituent loadings from various discharges. The study conducted during 1991 is relevant for immediate impacts only - those that could be observed as elevated concentrations of certain substances in the river water. But the impact of storm and combined sewer discharges (and other effluents), may be long-term as well as immediate. Long-term effects such as depletion of dissolved oxygen as a result of organic loading, metals adsorption and desorption on sediments and bioaccumulation of substances from storm/CSO effluents were outside the scope of this study. The storm event monitored in September 1991 provided an excellent data set to begin to elucidate the immediate effects of water quality impacts from the storm and combined sewers. Results generally confirmed conclusions from other City and Alberta Environmental Protection studies about the extent of impact and proportion of total pollutant load contributed by these effluents. This was the first attempt, however, to determine both loadings to the river and mass loads in the river so that a mass balance is achieved and sources are confirmed. This study points out the importance of a thorough quality assurance program for for any water quality study, particularly those that may lead to management decisions. Future sampling programs by AEP and the City of Edmonton should include quality assurance programs of a magnitude similar to that used in this study, so that data produced are credible and decisions made are reliable. The results of this study, as well as results of other studies conducted by Alberta Environmental Protection, the City of Edmonton, and major industries in the Edmonton-Fort Saskatchewan area, will provide direction for strategies to reduce pollutant loadings to the North Saskatchewan River. This may become more important in the future as downstream communities require additional sources of water for domestic supply. In addition, as more is learned about the fate and long-term effects of pollutants in river systems, as well as health risks to humans using the water, levels for water quality objectives and guidelines may become more stringent. These factors will in turn require that dischargers reduce pollutant loadings. These studies are a firm first step toward these ends.

55
56
LITERATURE CITED Ahmad, M. 1985. Wastewater management alternatives for improving the North Saskatchewan River water quality. Prep. for Edmonton Water and Sanitation, City of
Edmonton. Alberta Environment. 1973. Summary report on proposed storm sewer discharge into Whitemud Creek at 30th Avenue. Standards and Approvals Div., Edmonton. 25 p. + append. Anderson, A.M., R.S. Anderson, A.M. Akena, J.S. Livingstone, A. Masuda, P.A. Mitchell, T.B. Reynoldson, D.O. Trew and M. Vukadinovic. 1986. North Saskatchewan River
characterization of water quality in the vicinity of Edmonton (1982-1983). Part I. Environmental Quality Monitoring Branch, Environmental Assessment Division, Alberta Environment.
Beltaos, S. and M.D. Anderson. 1979. Mixing characteristics of the North Saskatchewan River below Edmonton. Part I. Transportation and Surface Water Engineering Div.,
Alberta Research Council, Edmonton. Report No. SWE-79/01. 50 p. Bowie, G.L, W.B.Mills, D.B.Porcella, C.L.Campbell, J.R.Pagenkopf, G.L.Rupp, K.M.Johnson,
P.W.Chan, S.A.Gherini. 1985. Rates, constants, and kinetics formulations in surface water quality modelling. EPA/600/3-85/040 2nd. Ed. Environmental Research Lab., Office of Research and Devel., USEPA, Athens, Georgia. 455 p.
Campbell, J.M. 1990. Temporal discharge variations in Gold Bar and Capital Region sewage treatment plants. (draft report) Planning Division, Alberta Environmental Protection.
Canadian Council of Resource and Environment Ministers (CCREM). 1987. Canadian Water Quality Guidelines. Prep. by Task Force on Water Quality, Ottawa.
City of Edmonton. 1982. Potable water quality. Volume I - Summary. Prep. by Potable Water Quality Task Force, Edmonton. 37 p. City of Edmonton. 1983. Annual water yields from the City of Edmonton, Alberta. 123 p. City of Edmonton. 1985a. Edmonton water and sanitation rainfall and sewer flow data acquisition system annual report. Drainage Upgrading Group. City of Edmonton. 1985b. Edmonton Water and Sanitation report on storm sewer discharges, summary of data for period 1980-1984. Prep. by Wastewater Treatment Branch,
Edmonton. City of Edmonton. 1993. Revised flow volumes from Rat Creek, unpublished data. Drainage Branch, Edmonton. Colston, N.V. and A.N. Tafuri. 1975. Urban land runoff considerations. Urbanization and water quality control. Am. Water Res. Ass., proc. no. 20, p.120-128. Cordery, I. 1976. Evaluation and improvement of quality characteristics of urban stormwater. Water Research Lab., U. of New South Wales, Aus., Rept. no. 147. Field, R. and R.E. Pitt. 1990. Urban storm-induced discharge impacts. Paper Prep. for Water Environment and Technology, Aug. 1990, p. 64-67. HydroQual Cons./Gore & Storrie Ltd. 1987. Mixing characteristics of the North Saskatchewan River upstream from Edmonton's Rossdale water treatment plant. report prep. as part of
study for the City of Edmonton. HydroQual Consultants/Gore and Storrie Ltd. 1988. Water quality event model - MULTI users manual. Prep. for Planning Division, Alberta Environment, Edmonton.
34 p.+App.

57
IDE. 1992. Report on the 1991 environmental monitoring program. Prep. for City of Edmonton by I.D. Engineering Company Ltd. Edmonton, 70 p.+ appen. IDE. 1993. Report on the 1992 environmental monitoring program. Prep. for City of Edmonton by I.D. Engineering Company Ltd., Edmonton, 101 p. + appen. MacKenzie, F.B. 1982. Annual water yields from the City of Edmonton, Alberta. Report of project funded by Alberta Res. Trust and Alberta Res. Council. 112 p. + appen. MacLaren Engineers Planners & Scientists Inc. 1980. Combined trunk sewer system relief and pollution abatement study. Prep. for the City of Edmonton, Water and Sanitation
Department. Mitchell, P. 1985. Preservation of water quality in Lake Wabamun. Water Quality Control Branch, Alberta Environment, Edmonton. Mitchell, P.A. 1994. Water quality of the North Saskatchewan River in Alberta - Overview. Surface Water Assessment Branch, Technical Services and Monitoring Division,
Alberta Environmental Protection, Edmonton. 36 p. Norman, C.G. 1991. Urban runoff effects on Ohio River water quality. Paper Prep. for Water Environment and Technology, June 1991. p. 44-46. Northwest Hydraulic Consultants. 1977. Analysis of surface water hydrology in the Edmonton Region. Prep. for Edmonton Regional Utilities Study, Alberta Environment,
Municipal Eng. Br., Edmonton. Pitt, R.E. and R. Field. 1977. Water quality effects from urban runoff. J. Am. Water Works Assn., Aug. 1977: 432-436. Pospisilik, J. 1972. Dispersion of dyes and pollutants in North Saskatchewan River. M.Sc. thesis, University of Alberta, Dept. of Civil Eng. Ray, C. and K. Dykema. 1991. Leopold-Maddock equations for North Saskatchewan River water quality study, Edmonton-Saskatchewan border. River Eng. Br., Alberta
Environmental Protection, Edmonton. Shaw, R. and J. Shaw. 1988. Water quality of the North Saskatchewan River: results of 1987 field and laboratory studies. Internal report prep. for Planning Div., Alberta
Environment, Edmonton, 139 p. Shaw, R.D., P.A. Mitchell and A.M. Anderson. 1994. Water quality of the North Saskatchewan River in Alberta. Surface Water Assessment Branch, Technical Services
& Monitoring Division, Alberta Environmental Protection, Edmonton. 252 p.+App. Steve Hrudey and Associates. 1986. A critical assessment of drinking water in Edmonton. Vol. 1 Overview. Prep. for City of Edmonton and Alberta Environment, Edmonton. Taylor, J.K. 1990. Statistical techniques for data analysis. Lewis Publishers, Inc., Chelsea, Michigan. 200 p. Toxcon Consulting Ltd. 1992. Rossdale water intake health risk assessment study. Prepared for City of Edmonton. UMA Engineering Ltd. 1993. Contaminant reduction study - combined sewer overflow and storm outfall, Phase 1 Prioritization. Prep. for Drainage Branch, City of Edmonton. Van Der Vinne, G. 1991a. Mixing characteristics of a spill pathway between Yellowhead Trail and the Rossdale Water Treatment Plant. Alberta Res. Council Report No. SWE-
91/03. Prep. for City of Edmonton Health Risk Assessment Study. Van Der Vinne, G. 1991b. Low flow, open water tracer dye studies on the North Saskatchewan River, Edmonton to Saskatchewan border. Alberta Research Council

58
Report No. SWE-91/02. Edmonton. Van Der Vinne, G. 1992. Transverse mixing coefficients in the North Saskatchewan River. Alberta Research Council report # SWE-92/01, Edmonton. Waste Management Group. 1992. Urban runoff quality control guidelines for the province of British Columbia. Prep. for Municipal Waste Branch, Environmental Protection
Division, B.C. Environment. 132 p. Water Survey of Canada. 1991. Surface water data, Alberta. Environment Canada, Inland Waters Directorate, Ottawa. Watson, D.J. 1972. Perception and management of water quality in the North Saskatchewan River at Edmonton, Alberta. M.Sc. thesis, University of Alberta, Dept. of Geography,
Edmonton. Weatherbe, D. and Z. Novak n.d. Water quality aspects of urban runoff. report, Water Resources Branch, Ontario Ministry of the Environment, 74 p. Whipple, W., N.S. Grigg, T. Grizzard, C. Randall, R. Shubinski and L.S. Tucker. 1983. Stormwater management in urbanizing areas. Prentice-Hall, Inc., Englewood Cliffs,
New Jersey. 234 p.
59
Appendix A. Quality Assurance A1. Relative standard deviation (%) for triplicates of river and effluent data
collected Sept. 7-9, 1991. A2. Comparison of results in samples split between Norwest Labs and Alberta
Environmental Centre. A3. Comparison of data analyzed in quality assurance split samples by Alberta
Environmental Centre, September 1991, and reanalyzed from stored samples, January 1992.
A4. Summary of quality assurance comparisons: precision, accuracy and comparison of AEC and Norwest data.

60
Appendix A. Quality assurance summary. The storm event monitoring program was conducted on September 7-9, 1991. Analysis of the 335 samples, except for fecal coliforms, was under contract to Norwest Labs. Alberta Environmental Protection submitted 28 sets of blind triplicates throughout the sampling period and one blank from each sampling location; these data are shown in Table A1. In addition, the Alberta Environmental Centre (AEC) received an additional split of these 28 samples, as well as 9 additional splits from the Capital Region and Vinca river monitoring sites (Table A2). Fecal coliform samples were sent to the Provincial Laboratory of Public Health, and AEC analyzed splits of these (Tables A1 and A2). Data were received from Norwest at the end of November, 1991. There appeared to be precision problems for about half of the variables tested, and many of the values were fairly different from those provided by AEC for the split samples. After re-examination of the data and re-analysis of some of the samples, a new set of data was received from Norwest in June, 1992, and AEC re-analyzed samples for total phosphorus and total kjeldahl nitrogen (Table A3). Precision is generally defined as the agreement among repeated analyses of a single sample of water, with analyses conducted under uniform conditions. For the September 1991 storm event data (Table A1), the precision includes deviations caused by sampling, sample handling and laboratory analysis. A relative standard deviation (coefficient of variation) of 25% was chosen arbitrarily to determine acceptability of the triplicate data; that is, precision is acceptable if the RSD was less than 25%. Precision ranged from excellent for sodium, chloride, BOD and ammonia-N to poor for several of the metals. Variables with very small analytical values near the detection limit, as occurred with most of the metals, would be expected to have higher relative standard deviations than variables at higher concentrations. Fecal coliform values were fairly imprecise, but they tend to be more variable than analytical values for other variables, and the precision obtained in the storm event samples was considered acceptable. The fecal coliform values, when logged, were very precise. Spiked samples to test for accuracy were not submitted during the storm event sampling, but split samples were sent to the Alberta Environmental Centre for analysis. It was expected that the values reported by the two laboratories would be very similar. However, there were fairly large discrepancies for some variables (Table A2), particularly metals and dissolved nutrients. There was also a large discrepancy for fecal coliforms, although the relationship between the two sets of fecal coliform data was very strong and nearly linear (r=0.97, P<0.001, n=26, Spearman's rank correlation). AEC fecal coliform counts were about 2.5 times higher than the counts determined by the Provincial Laboratory; because the data were consistently different between the two laboratories, it was thought that there was a difference in analytical technique, probably related to the type of media used (R. Coleman, pers. comm.). This does not limit the use of the data for mass balance or assessing the potential sources of fecal coliform bacteria to the river, but would perhaps affect an assessment of compliance with water quality objectives. Thus, the provincial laboratory results used in the storm event assessment were conservative.

61
Samples for total phosphorus and total kjeldahl nitrogen were re-analyzed by the Alberta Environmental Centre after several months of storage. The results obtained were compared with quality assurance splits analyzed by AEC immediately after the storm event, and listed in Table A3. Thus, the two sets of samples were originally split during the storm event monitoring; the September 1991 set was analyzed immediately by AEC, and the January 1992 set was originally submitted to Norwest and retrieved from their storage area and resubmitted to AEC. The samples originally submitted to AEC had not been retained. There was no significant difference in the data for total phosphorus (P>0.10, n=23, Wilcoxon paired sample test). For total kjeldahl nitrogen, there was a difference in the data between the two testing periods (P<0.05, n=23, Wilcoxon's paired sample test); for several values, the data analyzed in January tended to have slightly higher values than those of September. However, the overall average values for the two data sets were identical, and there was little difference in standard deviations for the two data sets. The difference in values was deemed unimportant and the reanalyzed data were used in mass balancing and modelling. A summary of quality assurance results is provided in Table A4. The column labelled "accuracy" is data from analysis of USEPA testing materials submitted to Norwest Labs in two submissions. Note that performance was fairly poor on certain substances (e.g., lead, copper), but comparisons with AEC were fairly good. Fecal coliforms were analyzed by the Provincial Laboratory; comparisons with AEC were poor for the reasons described above. In spite of problems with the accuracy and precision of the data, it may be concluded that at least half of the data are useful for this analysis, particularly as the study was a scoping exercise to determine general impacts of the storm and combined sewer discharges and to determine directions for future investigations.


Table A3. Comparison of data analyzed in quality assurance split samples by Alberta Environmental Centre, September 1991, and reanalyzed from stored samples, January 1992.
COLLECTION TIME
TOTAL PHOSPHORUS TOTAL KJELDAHL NITROGEN
SEPT. 1991 JAN. 1992 SEPT. 1991 JAN. 1992
E.L.Smith 0515 1315
0.009 0.008
0.010 0.010
0.08 0.08
0.060.05
Whitemud 0215 0.230 0.230 1.73 1.89
Rossdale 0345 Right 0145
0.033 0.011
0.030 0.005
0.22 0.08
0.250.08
Rossdale Left 0345 0.053 0.050 0.22 0.26
Gold Bar 0030 Secondary Bypass 0200
3.95 3.35
4.15 3.50
20.0 19.1
23.019.0
Gold Bar 0340 Final 0940
3.40 2.35
3.25 2.40
21.5 14.0
20.014.0
Capital Region 0140 Centre 0938 1734
0.025 0.030 0.035
0.018 0.084 0.026
0.15 0.45 0.15
0.190.460.17
Capital Region 0530 STP 1430
4.50 4.35
4.30 4.25
2.40 1.80
1.351.23
Sturgeon 1700 0.075 0.069 1.00 1.04
Vinca Bridge 0825 Centre 1825 0350
0.040 0.074 0.030
0.040 0.077 0.032
0.21 0.44 0.15
0.180.460.17
Pakan 10/09/91 11/09/91
0.027 0.021
0.024 0.016
0.15 0.14
0.160.17
Border 12/09/91 15/09/91
0.022 0.016
0.024 0.015
0.17 0.14
0.180.15

Table A4. Summary of quality assurance comparisons: precision, accuracy and comparison of AEC and Norwest data.
VARIABLE PRECISION ACCURACY AEC COMPARISON
WITHIN 25%
TOTAL NO.
WITHIN 95%
TOTAL NO.
WITHIN 25%
TOTAL NO.
Sodium 20 20 1 2 21 29
Chloride 19 21 2 3 9 28
Total Suspended Solids
16 21 n.a. 10 29
Total Phosphorus 16 21 3 3 9 29
Total Kjeldahl Nitrogen
17 21 3 3 12 29
Nitrite+Nitrate 17 21 2 2 5 28
Ammonia-N 17 19 2 2 15 28
Dissolved Phosphorus
15 21 n.a. 6 28
Chromium 1 21 1 3 7 29
Copper 6 21 1 3 16 29
Nickel 4 21 1 3 10 29
Zinc 10 21 1 3 9 29
Lead 16 21 0 3 23 29
Phenols 15 21 2 2 19 29
Fecal Coliforms 13 20 n.a. 3 26
TOC 16 21 1 2 n.a.
BOD 11 13 n.a. n.a.
Precision = number of samples within 25% RSD Accuracy = test samples within 95% conf. inverval of true value (n=number of tests) AEC Comparison = number of Norwest samples within 25% difference

Appendix B. Summary of data obtained during the September 1991 storm event and from 24-hour composite samplers, 1991.

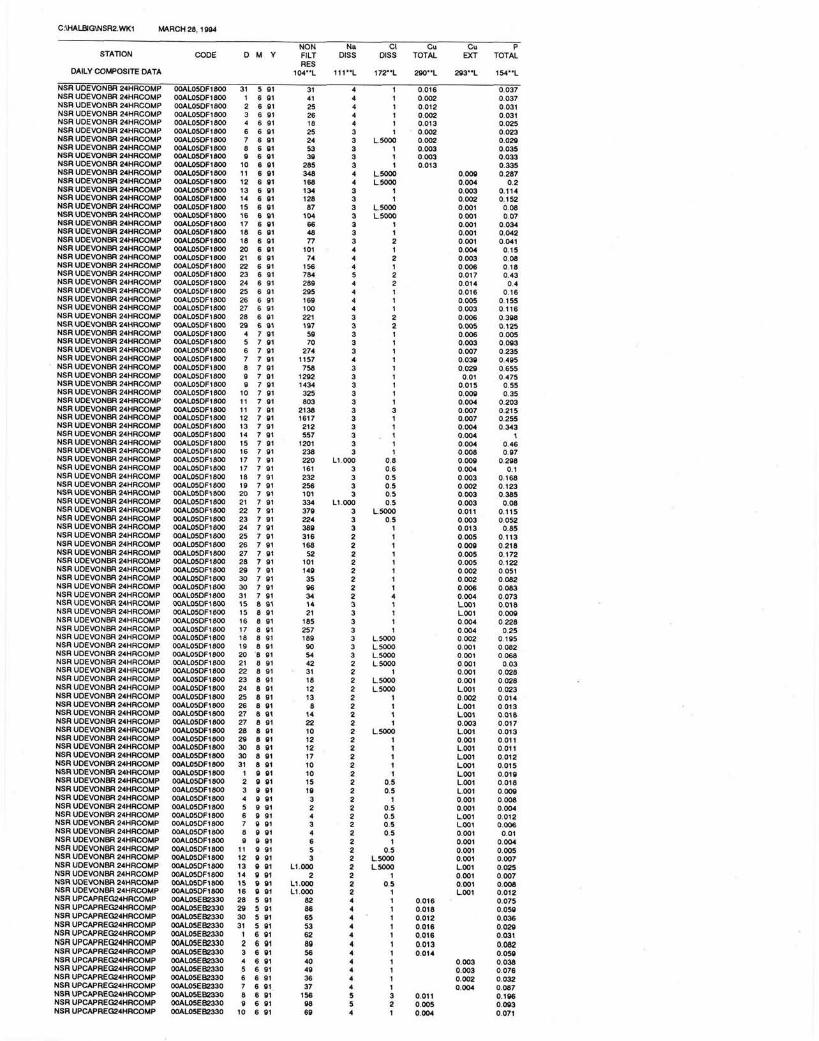


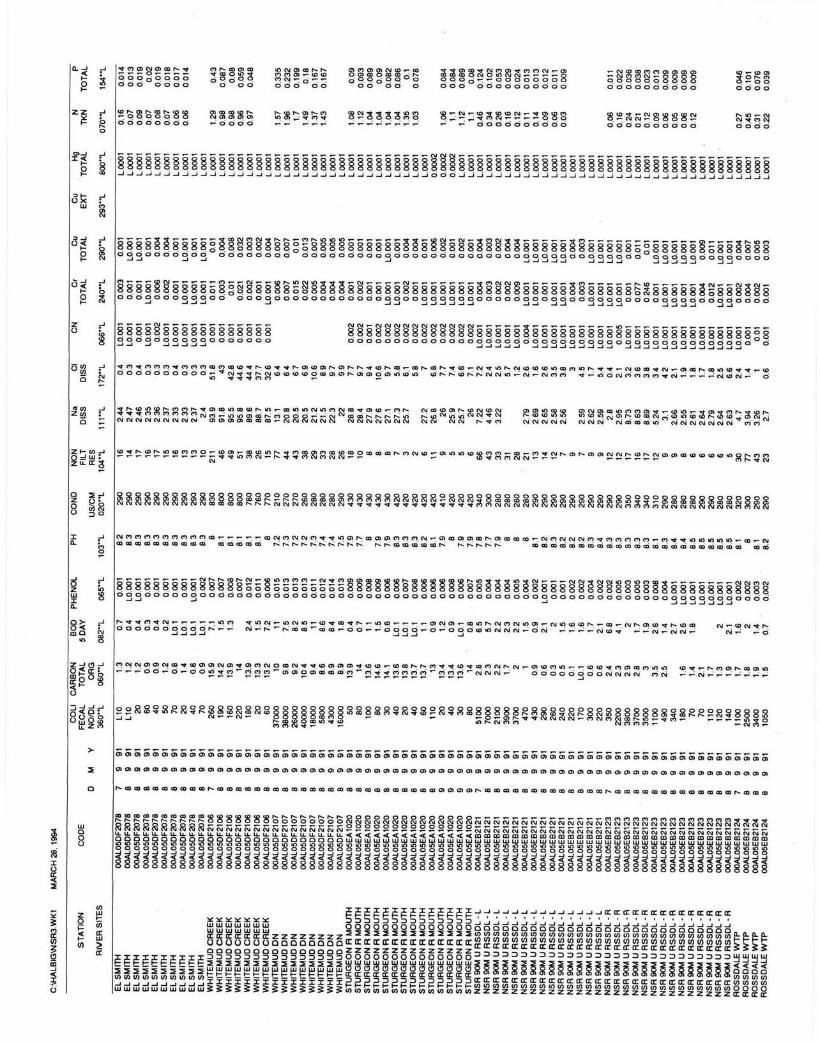


Appendix C. Diagram of sampling equipment at Capital Region.