Embed Size (px)
Citation preview
Korea Midland Power Co., Ltd.Management Presentation toStandard & Poor’s
November 14, 2002

2
AgendaAgenda
Executive summaryExecutive summary
KOMIPO overview
Key profit drivers and KOMIPO advantages
Assessment of deregulation and privatization
Robust financial profile

3
Issue Key objectives
Credit ratingObtain confidential long-term foreign currency issuer ratings for Korea Midland Power Co., Ltd from S&P
Establish a ratings platform for future fund-raising activities in the global debt market
Information Memorandum
Highlight KOMIPO’s exceptional creditworthiness through its: forward-looking management approach to changes in the industry leading market position due to its superior operating efficiency and cost control
strategy very strong cash flows resulting from the most competitive unit cost of generation; and strong financial discipline and sound debt protection measures
KOMIPO seeks to obtain confidential foreign currency issuer credit ratings from S&PKOMIPO seeks to obtain confidential foreign currency issuer credit ratings from S&P

4
Key highlights of KOMIPO’s business profile
KOMIPO represents the gencos on 10 of 14 deregulation committees
KOMIPO represents the gencos on 10 of 14 deregulation committees
Proximity to major end-user markets
Seoul and Jeju plants play key local roles
Proximity to major end-user markets
Seoul and Jeju plants play key local roles
Plants under construction will enhance KOMIPO’s competitiveness in 2005, 2006 and 2008
Plants under construction will enhance KOMIPO’s competitiveness in 2005, 2006 and 2008
Active fuel supply management
Active fuel supply management
Base and middle load plants among Korea’s most competitive
Base and middle load plants among Korea’s most competitive
Boryeong Thermal is Korea’s lowest unit cost thermal power plant
Overall efficiency will increase with new Boryeong CC
Boryeong Thermal is Korea’s lowest unit cost thermal power plant
Overall efficiency will increase with new Boryeong CC
Robustdemand for power
Quality of personnel
Strategicallysited
facilities
Attractivebase load/peak load
mix
Solid operatingefficiency
Competitive, low-cost
fuel supply
KOMIPO is distinguished by its operational competitiveness and structural advantages …
KOMIPO is distinguished by its operational competitiveness and structural advantages …

5
KOMIPO stands at the leading edge of Korea’s thermal generation sector as differences in credit quality become increasingly clear
KOMIPO stands at the leading edge of Korea’s thermal generation sector as differences in credit quality become increasingly clear
1 FFO = Net income + Depreciation and AmortizationIncludes capitalized interest
Key highlights of KOMIPO’s financial profile
Actual, 9 mths to Actual, 6 mths to Projected, full yearYear ended Dec 31, 2001 Jun 30, 2002 FY2002
Credit statistics
EBIT interest coverage (x) 2.8 3.8 5.0
EBITDA interest coverage (x) 4.9 6.1 7.1
FFO1/total debt (%) 34.2 47.0 59.4
Capex/capital (%) 3.4 5.7 9.6
EBIT return on capital (%) 8.0 12.5 17.3
EBITDA margin (%) 36.2 38.1 39.5
Debt/capital (%) 46.7 38.0 31.4
Debt/EBITDA (x) 3.4 1.9 1.3
… which are underscored by KOMIPO’s industry-leading financial performance… which are underscored by KOMIPO’s industry-leading financial performance

6
AgendaAgenda
Executive summary
KOMIPO overviewKOMIPO overview
Key profit drivers and KOMIPO advantages
Assessment of deregulation and privatization
Robust financial profile

7
Seocheon(400)
Boryeong CC(1,800)
Boryeong(3,000)
Incheon(1,150)
Incheon CC(450)
Seoul (387.5)
Seoul
Incheon
BukJeju(255)
Seoul ThermalOnly power plant located in Seoul City
Valuable contributor of heat and power
Strategic location
Incheon ThermalEnvironmentally-friendly
Incheon CCTo be completed by 2005Low variable unit cost
Boryeong ThermalNamed as world’s best coal power plant
Track record of lowest unit costs
Seocheon ThermalUses domestic anthracite coal
Strategic to local industry
Boryeong CCKorea’s largest LNG combined-cycle plant
Low variable unit costHigh utilization
Jeju ThermalCaptive demandRapid economic growthWill benefit from unbundling of transmission costs
Yangyang(1,000)
Yangyang Hydro•To be completed by 2006
•Korea’s largest pumped-storage power plant
Each of KOMIPO’s plants contribute valuable operational and strategic strengthsEach of KOMIPO’s plants contribute valuable operational and strategic strengths

8
15% 15%9%
1%
-2%
20% 21%12% 11%
6%
KOMIPO KOSEPCO KOWEPO KOSPO KEWESPO
2H2001 1H2002
36% 33% 29% 30% 30%38% 36% 33%
38%33%
KOMIPO KOSEPCO KOWEPO KOSPO KEWESPO
2H2001 1H2002EBITDA margin
Net income margin
2H2001 and 1H2002 genco margin comparison
KOMIPO is one of Korea’s strongest and most profitable generation companiesKOMIPO is one of Korea’s strongest and most profitable generation companies

9
KOMIPO is organized along two co-ordinating business divisionsKOMIPO is organized along two co-ordinating business divisions
KOMIPO’s organizational structure
President & CEO
Executive Auditor
Administration Division Engineering Division
Corporate Planning
Department
Administration Department
Business Department
Power Generation Department
Power Construction Department
Boryeong Thermal Power
Seoul Thermal Power
Incheon Thermal Power
Seocheon Thermal Power
Jeju Thermal Power
Yangyang Pumped Storage Power

10
Cost reduction
Implement eGen system to optimize facility operation and management
Preparation for electricity trading under TWBP
Strengthening internal capability
2001 - 04 2004 - 09 2009 and after
Securing competitive position
Optimize efficiency together with cost reduction
Improve overall organization and management system to enhance competitiveness
Global best practices
Raise overall capacities to global standards
Growing market share as new facilities are completed
Start privatization process for five gencos
Start privatization process for five gencos
Split transmissio
n companies
from KEPCO
Split transmissio
n companies
from KEPCO
Adopt full scale of retail contestability
Adopt full scale of retail contestability
Begin two way bidding pool system
Begin two way bidding pool system
KOMIPO is currently in the first phase of its medium-term business planKOMIPO is currently in the first phase of its medium-term business plan

11
18,337 18,856
13,407
16,71815,767
3,948
11,8088,588
25,151 24,355
1,548
8,433
25,215
19,885
22,804
KOMIPO KOSEPCO KOWEPO KOSPO KEWESPO
Base Peak
2001 net generationGWh
3,400 3,5653,066 3,000 2,900
3,593
2,000
4,280 4,6001,000
1,600 1,800
7,565 7,500
2,765
600
7,9467,993
7,165
KOMIPO KOSEPCO KOWEPO KOSPO KEWESPO
Base Peak Expansion
Installed capacity of gencos1
MW
1 Includes capacity under constructionNote: Base = all coal-fired (imported and domestic) plants, Peak = Oil, LNG and Hydro plants
KOMIPO’s share of peak load generation will increase as new competitive power plants under construction are completed, such as Boryeong CC and Incheon CC
KOMIPO enjoys an attractive slice of the base load marketKOMIPO enjoys an attractive slice of the base load market

12
1H02 sales revenue by power plant
9%
9%
67%
6% 4%5%
SeoulIncheonJ ejuSeocheonBoryeong combinedBoryeong
1H02 sales volume by power plant
Source: Company data, January to June 2002
6%
5%
81%
4%1%
3%
SeoulIncheonJ ejuSeocheonBoryeong combinedBoryeong
GWh KRW bn
The Boryeong power plant is KOMIPO’s flagship facility and major earnings driverThe Boryeong power plant is KOMIPO’s flagship facility and major earnings driver

13
Power projects under construction
Power projects under consideration
Yang Yang Pumped Water Power Project (1,000MW)
Incheon Combined Cycle Project (450MW)
Boryeong Thermal Power Project (1,000MW)
Unit Fuel Capacity Completion
#1~4 250MW/unit 2006
Unit Fuel Capacity Completion
#1 LNG 450MW/unit 2005
Unit Fuel Capacity Completion
#7,8 Bituminous coal 500MW/unit 2007
Boryeong Thermal Power Project (1,600MW)Unit Fuel Capacity Completion
#9,10 Bituminous coal 800MW/unit 2010
KOMIPO’s capacity will expand from 2005 onwardsKOMIPO’s capacity will expand from 2005 onwards

14
AgendaAgenda
Executive summary
KOMIPO overview
Key profit drivers and KOMIPO advantagesKey profit drivers and KOMIPO advantages
Assessment of deregulation and privatization
Robust financial profile

15
KOMIPO has demonstrated strong results with its “power up, cost down” approach
Increased power generation
Reduced operating expenses
Robustdemand for power
Quality of personnel
Strategicallysited
facilities
Attractivebase load/peak load
mix
Solid operatingefficiency
Competitive, low-cost fuel supply
Profitable generation is determined by a genco’s ability to increase utilization and reduce costs
Profitable generation is determined by a genco’s ability to increase utilization and reduce costs

16
Source: MOCIE, First Basic Plan for Demand and Supply of Electricity, 2002-2015, most probable plan
43 48 52 55 59 62 65 6851 55
76 79 77 7768
62
2001 2003 2005 2007 2009 2011 2013 2015
Peak load Capacity
15.1 13.716.8
21.325.3 24.9
18.9
13.7
0
5
10
15
20
25
30
2001 2003 2005 2007 2009 2011 2013 2015
Peak power demand and capacity projectionsGW
Reserve margin%
Robust demand
for power
The electricity industry is characterized by rapid demand growth and capacity growthThe electricity industry is characterized by rapid demand growth and capacity growth
Power demand is expected to grow rapidly at a rate of 3.3% p.a. from 2002-2010
Tight reserve margins of 15%
Planned capacity expansion of 23,813MW between 2002-2010
Tight reserve margins underline individual importance of all 6 power gencos to maintaining the stability of supply

17
Present installed capacity of gencosMW
1,000
450
450
6,393
6,993 6,993 6,993
7,943
8,443
500
2001 02E 03E 04E 05E 06E
Existing capacity Yang yang Inchon
KOMIPO forecast generation capacityMW
KOMIPO has started construction on an additional 1,000MW baseload thermal power plant in Boryeong and is considering another 1,600MW at the same site
Note: Base = all coal-fired (imported and domestic) plants, Peak = Oil, LNG and Hydro plantsSource: Company data
Robust demand
for power
3,565 3,000 3,400 3,066 2,900
2,0002,765
3,5934,280 4,600
5,565 5,765
6,9937,346 7,500
KO
SE
PC
O
KO
SP
O
KO
MIP
O
KO
WE
PO
KE
WE
SP
O
Base Peak
Construction underway will expand KOMIPO’s peak generation capacity in 2005 and 2006Construction underway will expand KOMIPO’s peak generation capacity in 2005 and 2006

18
Accumulated number of 1H2002 SMP merit order determination
Accumulated number of 1H2002 BLMP merit order determination
Source: KPX
After KHNP’s nuclear facilities, Boryeong is the country’s most efficient power plant
Attractive base load/
peak load mix
The flagship 3,000MW Boryeong Power Plant is Korea’s most competitive thermal generation facility
The flagship 3,000MW Boryeong Power Plant is Korea’s most competitive thermal generation facility

19
Attractive base load/ peak load
mix
Merit order as of October 2002
Source: KPX
# Plant name TypeIGP
(KRW/kWh) Owner
1 Tangjin Coal 12.21 KEWESPO
2 Boryeong #3-6 Coal 12.29 KOMIPO
3 Hadong Coal 12.45 KOSPO
4 Samchunpo #5,6 Coal 12.60 KOSEPCO
5 Taeahn Coal 12.99 KOWEPO
6 Boryeong #1,2 Coal 13.01 KOMIPO
7 Samchunpo #1,2 Coal 13.39 KOSEPCO
8 Samchunpo #3,4 Coal 13.43 KOSEPCO
9 Honam Coal 18.91 KEWESPO
10 Tonghae Domestic coal 37.90 KEWESPO
11 Boryeong CC LNG 42.47 KOMIPO
12 Ulsan #4-6 Heavy oil 44.47 KEWESPO
13 Seocheon Domestic coal 45.32 KOMIPO
14 Incheon CC LNG 45.52 KOSPO
15 Ulsan CC #2,3 LNG 45.89 KEWESPO
16 SeoIncheon CC LNG 47.56 KOWEPO
17 Youngnam Heavy oil 47.92 KOSPO
18 Ilsan CC #2 LNG 48.21 KEWESPO
19 Youngdong #2 Domestic coal 49.04 KOSPO
# Plant name TypeIGP
(KRW/kWh) Owner
20 Ulsan #1-3 Heavy oil 50.03 KEWESPO
21 Ilsan CC #1 LNG 51.03 KEWESPO
22 Yosu #1 Heavy oil 51.50 KOSEPCO
23 Youngdong #1 Domestic coal 51.96 KOSEPCO
24 NamJeju Heavy oil 52.85 KOSPO
25 Pyongtaek CC LNG 53.04 KOWEPO
26 Pundang CC #2 LNG 53.22 KOSEPCO
27 Pyongtaek Heavy oil 54.98 KOWEPO
28 Yosu #2 Heavy oil 55.26 KOSEPCO
29 Pundang CC #1 LNG 55.88 KOSEPCO
30 Jeju #2,3 Heavy oil 58.84 KOMIPO
31 Incheon #1,2 LNG 63.57 KOMIPO
32 Seoul #5 LNG 63.79 KOMIPO
33 Seoul #4 LNG 66.94 KOMIPO
34 Incheon #3,4 LNG 67.45 KOMIPO
35 NamJeju Heavy oil 77.69 KOSPO
36 Jeju #1 Heavy oil 77.92 KOMIPO
37 Jeju Light oil 85.89 KOMIPO
38 Hanlim CC Light oil 90.72 KOSPO
39 Jeju GT #3 Light oil 114.94 KOMIPO
Attractive base load/
peak load mix
KOMIPO enjoys good representation across base, middle and peak load segmentsKOMIPO enjoys good representation across base, middle and peak load segments

20
# Plant name Owner Type Unit # # of prices set Price (KRW/kWh)
Samchunpo KOSEPCO #3 14 16.4231 Boryeong KOMIPO #5 3 16.4632 Honam Honam #1 25 19.0933 Honam Honam #2 46 19.3034 Tonghae KEWESPO #2 9 38.1835 Ulsan KEWESPO #4 15 38.9136 Tonghae KEWESPO #1 55 39.7637 Yongnam KOSPO #2 54 40.6338 Ulsan KEWESPO #6 11 41.1439 Yongnam KOSPO #1 131 41.8240 Seocheon KOMIPO #2 51 44.9941 Ulsan KEWESPO #5 38 45.2942 Seocheon KOMIPO #1 8 45.6143 Boryeong CC KOMIPO #2 34 46.9244 Yongdong KOSEPCO #2 139 47.0045 Pyongtaek KOWEPO #3 66 48.7346 Boryeong CC KOMIPO #4 2 49.0547 Yosu KEWESPO #1 71 49.1448 Pyongtaek KOWEPO #1 101 49.5449 Yongdong KOSEPCO #1 169 49.9050 Inchon CC #1 39 50.35Total 4344 48.13
Source: KPX
1H 2002 SMP merit order
Attractive base load/
peak load mix
The Boryeong CC and Seocheon plants also have a solid position in the middle and peak load markets
The Boryeong CC and Seocheon plants also have a solid position in the middle and peak load markets
21
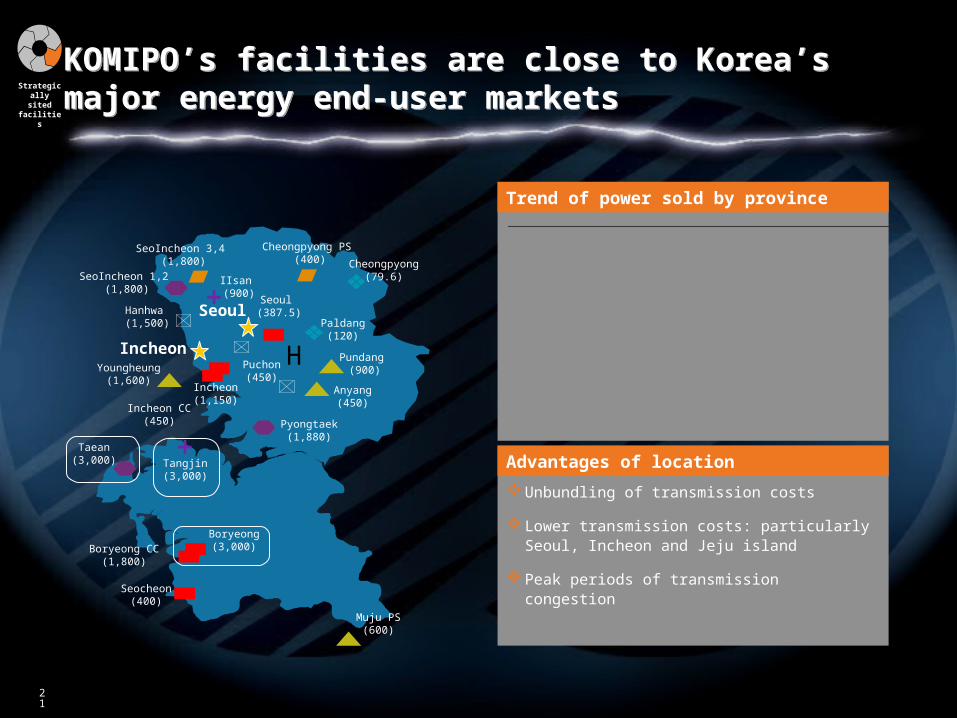
Unbundling of transmission costs
Lower transmission costs: particularly Seoul, Incheon and Jeju island
Peak periods of transmission congestion
Trend of power sold by province
Advantages of location
Cheongpyong(79.6)
Muju PS(600)
Seocheon(400)
Boryeong CC(1,800)
Boryeong(3,000)
Taean(3,000) Tangjin
(3,000)
Pyongtaek(1,880)
Pundang (900)
Cheongpyong PS (400)
Incheon(1,150)
Youngheung(1,600)
Puchon(450)
Incheon CC(450)
SeoIncheon 3,4 (1,800)
SeoIncheon 1,2 (1,800)
Hanhwa (1,500)
Anyang(450)
Seoul (387.5)
IIsan (900)
Seoul
Incheon HPaldang
(120)
Strategically sited facilities
KOMIPO’s facilities are close to Korea’s major energy end-user marketsKOMIPO’s facilities are close to Korea’s major energy end-user markets

22
27,874
30,821
34,21735,740 35,340
37,669
2001 02E 03E 04E 05E 06E
Power generation forecast
GWh
4952
5658
56 57
39 40 40 4038
40
2001 02E 03E 04E 05E 06E
Utilization rate Thermal efficiency
Utilization and thermal efficiency forecast%
Source: Company data
Decrease due to completion of Yang
Yang hydro and Incheon CC in 2005/6
Solid operating efficiency
Going forward, efficiency is expected to increase as the new Boryeong CC increases its generation
Going forward, efficiency is expected to increase as the new Boryeong CC increases its generation
* Note that Yangyang Hydro distorts utilization rate because of its size (1,000MW). Hydro power plants do not typically operate beyond a 10% utilization rate* ‘05E and ‘06E utilization rates exclude Yang Yang

23
e-Gen planning committee was formed in Jan. 2002
Task force teams have been formed
Responsibility for repair, maintenance management and improved procurement of raw materials
In the next step, KOMIPO will appoint a consulting firm
Setup of a 2-phase Employee Information System
Development of a “one-stop” generation maintenance management system
Establishment of an integrated management system
Full electronic purchasing
Core strategic objectivese-Gen master plan
The e-Gen management strategy will integrate and optimize all management systems in operation and maintenance of power plants, mobilization of materials and fuel, power trading, and financial affairs and accounting
Solid operating efficiency
KOMIPO’s e-Gen initiative will help to catalyze further improvements in efficiency while lowering costs
KOMIPO’s e-Gen initiative will help to catalyze further improvements in efficiency while lowering costs

24
KOMIPO LNG usage
280 280 360190
660
1,210 1,2701,380
1,570
1998 1999 2000 2001¹ 2002 2003 2004 2005 2006
Thousand tons
KOMIPO bituminous coal usage
7.318.00
8.66
6.24
8.42 8.118.59
8.26 8.45
1998 1999 2000 2001¹ 2002 2003 2004 2005 2006
1 April-December 2001
LNG consumption is expected to increase as Boryeong CC comes onstream
Competitive, low-cost fuel
supply
KOMIPO’s fuel requirements are expected to grow steadily as generation capacity increases
KOMIPO’s fuel requirements are expected to grow steadily as generation capacity increases
KOMIPO anthracite coal usage
1.000.87 0.81 0.85 0.88 0.85 0.82 0.80 0.78
1998 1999 2000 2001¹ 2002 2003 2004 2005 2006
Million tons Million tons
KOMIPO heavy oil/crude petroleum usage
203 185
270320
432 436 418 412 418
1998 1999 2000 2001¹ 2002 2003 2004 2005 2006
Thousand kL

25
Source: Company reports
Comparison of operating expenses (1H 2002)
% of sales
Competitive, low-cost fuel
supply
KOMIPO’s active fuel supply management provides a cost advantage over the other thermal gencos
KOMIPO’s active fuel supply management provides a cost advantage over the other thermal gencos
Bituminous coal. Fuel procurement strategy takes advantage of current market dynamics and the projected industry cycle to lock in fuel prices at low prices
Anthracite coal. Determined by the Korean government
Oil. Calculated as FOB (linked to the spot market price) + an additional bid cost, determined quarterly through a competitive contract
LNG. Procured from KOGAS through a long-term contract
KOMIPO minimizes fuel supply risk by diversifying suppliers, daily verifying inventory volume and imposing penalties on short supply

26
6,474
6,7326,765
6,839
6,920
KO
MIP
O
KO
SPO
KO
WEPO
KEW
ES
PO
KO
SEPC
O
Procurement cost per Gcal Jan-Jul 2002Bituminous coalKRW/Gcal
The fuel purchase price of each company depends on its purchasing techniques and experience. The keys to success are timing and volume
KOMIPO has a demonstrated competitive advantage in fuel supply management. In 2001, the company enjoyed the second-lowest unit cost of generation (KRW7,300/Gcal, versus KOWEPO’s KRW7,290/Gcal)
In 2002, KOMIPO has secured the lowest fuel purchase prices overall
For 2003, KOMIPO has already secured 1,320,000 metric tons of coal at low market prices
Competitive, low-cost fuel
supply
As a result, KOMIPO enjoys the lowest variable unit cost of generation among the thermal gencos
As a result, KOMIPO enjoys the lowest variable unit cost of generation among the thermal gencos

27
KEPCO experience. KOMIPO has a large proportion of former KEPCO specialists
Recognized leadership. KOMIPO represents the gencos on 10 committees out of a total of 14 committees, including the genco expense evaluation committee and transmission fee committee
Innovation. KOMIPO was the first genco to develop a settlement program for power trading
Location advantages. KOMIPO is highly sought after due to its plant locations
Management commitment. KOMIPO is focused on human resource development: by providing overseas
exposure or spot study opportunities to junior resources
KOMIPO subsidizes 50% of the total tuition for selected workers who go to business school
Attracting and retaining talent
Exceptional experience
KOMIPO will capitalize on its understanding of power market dynamics as it models power demand, supply and its own bidding strategy
Quality of personnel
KOMIPO’s experienced personnel are a key advantage as it forms its prepares for increased market deregulation
KOMIPO’s experienced personnel are a key advantage as it forms its prepares for increased market deregulation

28
Training
Internal External
Collective training
On-site training
Rotational training
Domestic
Abroad
Central Training Center Generation Training Center Specialist Training Agencies
Orientation Training
Personal Development
Training
Strategy/ Management
Training
Cultivation of Core Specialists
Working Level Specialist Training
New employees Senior
employees– New junior
managers– New mid-level
managers
Management strategy
Organizational culture
Understanding reform
Business management
Quality management
Manager course
Business management
Labor-management relations
Power exchange Financial
management Project
management
Senior management
General employees
Functional employees
Government employees
E-learning– Job– Language– Others
Quality of personnel
KOMIPO aims to cultivate its human resource competitiveness through its training system KOMIPO aims to cultivate its human resource competitiveness through its training system

29
KOMIPO hopes to further build upon its competitive advantages going forwardKOMIPO hopes to further build upon its competitive advantages going forward
•Strengthening management analyses for efficient resource allocation
•Strengthening management analyses for efficient resource allocation
•Managing new capacity construction
•Managing new capacity construction
•Focusing on negotiating lower prices
•Focusing on negotiating lower prices
•Leverage experienced personnel in TWBP preparation
•Leverage experienced personnel in TWBP preparation
Robustdemand for power
Quality of personnel
Strategicallysited
facilities
Attractivebase load/peak load
mix
Solid operatingefficiency
Competitive, low-cost fuel
supply
• Improved understanding of industry demand for TWBP
• Improved understanding of industry demand for TWBP
• Improving maintenance programs and shutdowns
• Improving maintenance programs and shutdowns

30
AgendaAgenda
Executive summary
KOMIPO overview
Key profit drivers and KOMIPO advantages
Assessment of deregulation and privatizationAssessment of deregulation and privatization
Robust financial profile

31
Wholesale market
Discos
Retail
Market regulation
Gencos
Phase I Phase II Phase III Phase IV
1999 2001 2004 2009
Preparation of Cost Based Pool (“CBP”)
Establishment of KPX Launch of CBP Preparation of Two-
way Bidding Pool (“TWBP”)
Launch of TWBP Vesting contracts
Separation of assets into Gencos
Separation of Gencos effective
First phase of Genco sales program
Second phase of Genco sales program
Establishment of separate distribution companies
Disco sales program Continuation of Disco sales program (if not completed in Phase III)
Implementation of new T&D tariff
Full fledged retail competition
Establishment of KOREC
Introduction of retail competition
Necessary legislation enacted
Note: KOREC: Korean Electricity Commission KPX: Korea Power ExchangeCBP: Cost Based PoolTWBP: Two-way Bidding Pool
The electricity industry restructuring plan will introduce competition in the power sector
The electricity industry restructuring plan will introduce competition in the power sector

32
Forecast and management of new capacity
Power industry growth projections are detailed in the First Basic Plan. KOMIPO makes its own plans/forecasts accordingly, which are reviewed every two years
The decision to construct new facilities at Incheon and Yang Yang was decided by KEPCO. In contrast, KOMIPO independently decided to build Boryeong #7 and #8, and #9 and #10 are under consideration
Prepare for Two-Way Bidding Pool
KOMIPO believes that the key to successful bidding is the ability to understand and forecast system demand under a competitive pool market
The Electricity Supply/Demand Comprehensive System is being adjusted for the TWBP
KOMIPO team members include members formerly from the KEPCO forecasting team
Expectations on vesting contracts
Prepare for large-scale contracts with customers in the next 3-5 years Vesting contracts will be enacted as a transition toward an open and stable
market. Volume and price of vesting contracts will be determined in 2003, and vesting contracts are expected to go into effect April 2004. Vesting contracts will initially account for about 95% of sales, then gradually decline as they are phased out by 2009
Key next steps
KOMIPO has begun to prepare for the next stage of industry deregulationKOMIPO has begun to prepare for the next stage of industry deregulation

33
AgendaAgenda
Executive summary
KOMIPO overview
Key profit drivers and KOMIPO advantages
Assessment of deregulation and privatization
Robust financial profile

34
KOMIPO base case financial projections (2002-2006)
Stable revenues Healthy margins Low gearing High liquidity
8.711.416.818.3
31.420
02F
2003
F
2004
F
2005
F
2006
F
35.134.83636.4
39.5
2002
F
2003
F
2004
F
2005
F
2006
F
0.31
0.79
0.47 0.500.37
2002
F
2003
F
2004
F
2005
F
2006
F
0.70
0.640.660.65
0.62
2002
F
2003
F
2004
F
2005
F
2006
F
Revenue growth%
1.98
1.571.79 1.82 1.85
2002
F
2003
F
2004
F
2005
F
2006
F
RevenueKRW tr
EBITDA margin%
EBITDAKRW tr
Total debt/capital%
DebtKRW tr
7.1
13.6 15.017.3
21.2
2002
F
2003
F
2004
F
2005
F
2006
F
EBITDA interest coveragex
13.8
1.7 1.8
N.A. 6.9
2002F
2003F
2004F
2005F
2006F
5.0
9.611.0
12.5 13.2
2002
F
2003
F
2004
F
2005
F
2006
F
EBIT interest coveragex
KOMIPO’s solid financials are expected to rapidly strengthen further over the near term
KOMIPO’s solid financials are expected to rapidly strengthen further over the near term

35
KOMIPO base case financial projections (2002-2006)
Key underlying assumptionsKey underlying assumptions
2002E 2003E 2004E 2005E 2006E
Inputs
Revenue growth 13.6% 1.7% 1.8% 6.9%
Fuel costs (% of revenues) 46.6% 51.2% 51.9% 52.0% 52.5%Personnel costs (% of revenues) 4.4% 3.4% 3.5% 3.6% 3.6%Retirement provisions(% of revenues)
0.4% 0.3% 0.3% 0.3% 0.3%
Depreciation (% of revenues) 11.8% 10.7% 9.4% 9.6% 13.1%Maintenance and repair(% of revenues)
5.0% 5.0% 4.5% 5.2% 4.6%
Interest expense (% of revenues) 2.8% 0.8% 0.5% 0.5% 0.5%Other expenses (% of revenues) 4.0% 3.2% 3.3% 3.5% 3.1%
Tax rate 29.70% 29.70% 29.70% 29.70% 29.70%

36
Debt/capital
Below 30% (currently 38%)1
EBITDA interest coverage
Above 10.0 x (currently 6.1x)1
Return on equity
Above 10.5% (currently 18.4%)1
Key financial targets
KOMIPO believes its business profile can support a conservative financial policyKOMIPO believes its business profile can support a conservative financial policy
1 As of June 30, 2002
37
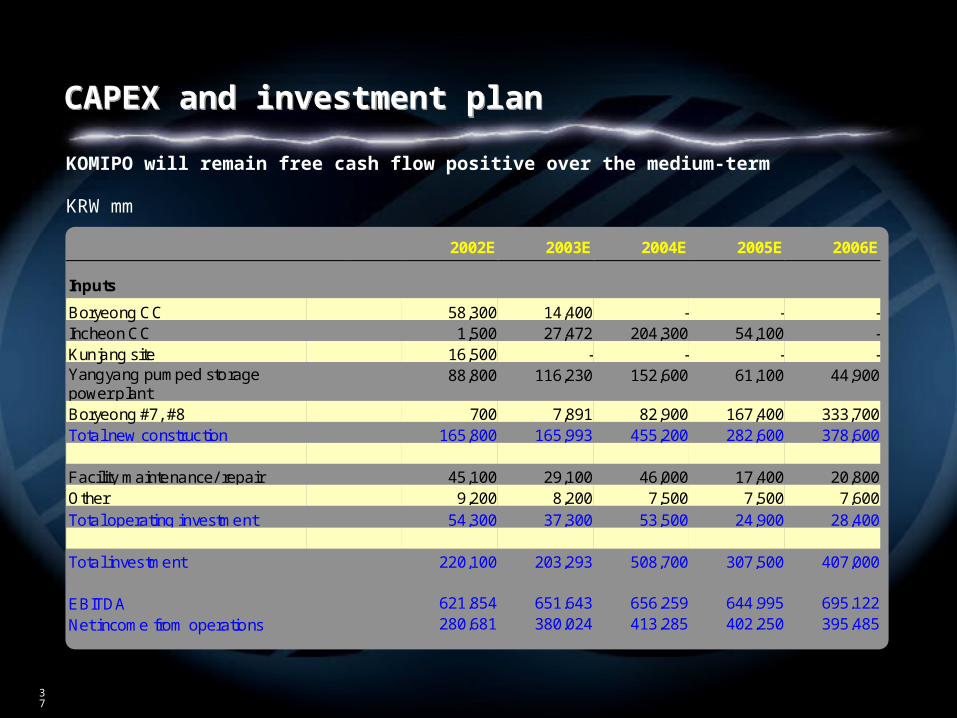
KRW mm
2002E 2003E 2004E 2005E 2006E
Inputs
Boryeong CC 58,300 14,400 - - -Incheon CC 1,500 27,472 204,300 54,100 -Kunjang site 16,500 - - - -Yangyang pumped storagepower plant
88,800 116,230 152,600 61,100 44,900
Boryeong #7, #8 700 7,891 82,900 167,400 333,700Total new construction 165,800 165,993 455,200 282,600 378,600
Facility maintenance/ repair 45,100 29,100 46,000 17,400 20,800Other 9,200 8,200 7,500 7,500 7,600Total operating investment 54,300 37,300 53,500 24,900 28,400
Total investment 220,100 203,293 508,700 307,500 407,000
EBITDA 621,854 651,643 656,259 644,995 695,122Net income from operations 280,681 380,024 413,285 402,250 395,485
CAPEX and investment planCAPEX and investment plan
KOMIPO will remain free cash flow positive over the medium-term

38
KRW mm
2002E 2003E 2004E 2005E 2006E
InputsTotal revenue 1,595,800 1,812,749 1,843,523 1,876,724 2,005,552EBITDA 621,854 651,643 656,259 644,995 695,122D&A 187,832 193,302 172,393 180,929 262,015EBIT 434,022 458,341 483,865 464,066 433,107Gross interest expense 87,644 47,964 43,881 37,210 32,801Income tax expense 118,581 160,550 174,602 169,941 167,083Net income from operations 280,681 380,024 413,285 402,250 395,485
Total debt 788,891 466,825 498,859 368,593 306,059Shareholders' equity 1,725,500 2,015,100 2,306,500 2,563,600 2,773,400Total capitalization 2,704,700 2,688,900 3,034,400 3,170,500 3,328,200
Credit statisticsEBIT Interest coverage 5.0 9.6 11.0 12.5 13.2EBITDA Interest coverage 7.1 13.6 15.0 17.3 21.2FFO / total debt 59.4% 122.8% 117.4% 158.2% 214.8%EBIT Return on capital 17.3% 18.0% 16.3% 14.4% 12.3%EBITDA margin 39.5% 36.4% 36.0% 34.8% 35.1%Debt/capital 31.4% 18.3% 16.8% 11.4% 8.7%
Key financial data and credit statisticsKey financial data and credit statistics

39
AAA
AA
A
Business and financial profiles of generation companies
Belowaverage
Average
Strong
Strong Average Below average
Financial profile
Business profile
TransAlta New Zealand Ltd. KHNP KEPCO
Singapore Power Ltd.
A
BB
AA
BBB
BBB
A
Chugoku Electric Power Co. Inc.
Manila Electric Co. National Power Corp.
Tenaga Nasional Berhad
Chubu Electric Power Co. Inc. Tokyo Electric Power Co. Inc. Taiwan Power Co.
SPI PowerNet Pty Ltd. Australian Gas Light Co. (The) Hongkong Electric Co. Ltd. CLP Power Hong Kong Ltd.
EGAT
Huaneng Power International Inc.
KOSPO KEWESPO KOWEPO
KOMIPO
KOMIPO believes that its financial profile, driven by strong operations, is a key differentiating factor
KOMIPO believes that its financial profile, driven by strong operations, is a key differentiating factor

40
Thank you
We thank S&P for taking the time to understand our financial and business profileWe thank S&P for taking the time to understand our financial and business profile