Embed Size (px)
Citation preview
What’s driving your regional economy?A brief analysis of the key local industry
clusters in Amber Valley
Cluster strengths in Amber Valley
Economic development hinges upon attracting, retaining and growing businesses, and soundeconomic strategy startswith identifying the industries thosebusinesses shouldcome from. TheONSStandard Industrial Classification (SIC), while a powerfulmeans of organising business data,looks at business activity through the lens of product and process. But in today’s connectedeconomy, it is not isolated product and process that matter, but the connections from supplyto demand. As Delgado et al. (2016) argue, “the agglomeration of related economic activity is acentral feature of economic geography”.1
Following a similarmethodology, Emsi’sUKcluster definitions help to capture those connectionswithin a local economy: we have grouped industries using data on their tendency to co-locate inthe sameareas; their relianceon similarworkforces; and their supply chain connections, in buyingand selling to one another. The result is 49 coherent clusters which offer rich insights into theforces driving local economic development. Those clusters are then put into two groups:
■ 35 tradable clusters are made up of industries which tend to focus in particular regions,because their products and services can be delivered at distance – manufacturing andcertain business and professional services make up much of this group.
■ 14 local clusters are composed of the industries which tend to be spread across all ar-eas, serving local residents in ways which can only be done where they live: retail, health,schools, restaurants.
More jobs in tradable clusters typically mean greater connection with the national and globaleconomy, and growth in tradable jobs tends to have positive ‘multiplier’ effects.2 Local clustersare often highly labour-intensive and score highly in terms of local job numbers, while tradableclusters tend to feature greater levels of pay and productivity. At 42.7 per cent, Amber Valley hasa relatively high share of employment in tradable clusters, at the 84th percentile among localauthorities (Figure 1).
Figure 2measures each cluster in terms of job numbers in 2016. Reflecting their labour-intensivenature, local clusters take a prominent role, accounting for 7 out of the top 10 highest employingclusters, and 76 per cent of jobs in that top 10. The highest employing cluster is food and bev-erage with 5,349 jobs (10.4 per cent of total employment), followed by education and childcarewith 4,548 jobs.
Jobs numbers can be misleading: these clusters employ many people in all communities. Loca-tionQuotients (LQ)provideaclearer signal onwhatdrives local economicgrowth. Bydividing thelocal job share of a cluster by the national average job share, LQs highlight relative specialismsin local economies. Typically, a Location Quotient above 1.2 is taken to indicate a significant
1 Classic references to agglomeration are Marshall (1920) and Krugman (1991). For the role of clusters in measuringagglomeration, see inter alia Ellison and Glaeser (1997), Porter (1998) or Delgado et al. (2014).2 See e.g. Moretti (2010) and Faggio and Overman (2014).
CLUSTER REPORT | NOVEMBER 2017 1
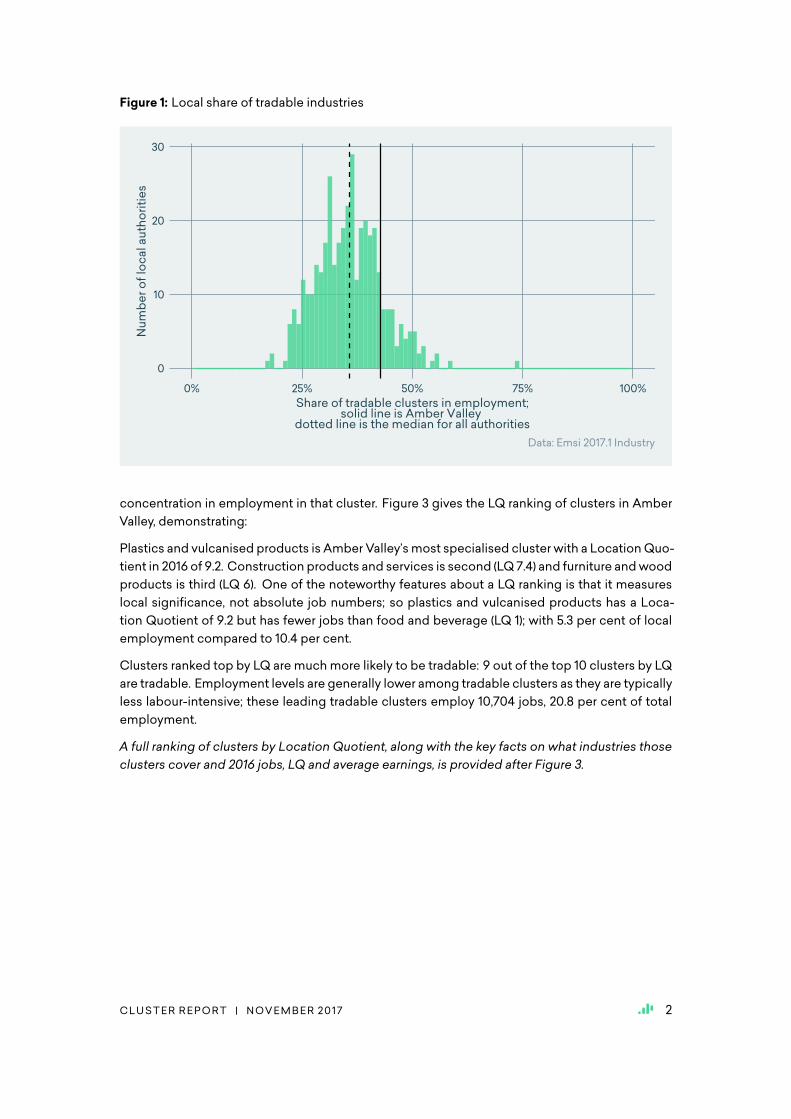
Figure 1: Local share of tradable industries
0
10
20
30
0% 25% 50% 75% 100%
Share of tradable clusters in employment;solid line is Amber Valley
dotted line is the median for all authorities
Nu
mb
er
of
loc
al a
uth
ori
tie
s
Data: Emsi 2017.1 Industry
concentration in employment in that cluster. Figure 3 gives the LQ ranking of clusters in AmberValley, demonstrating:
Plastics and vulcanised products is Amber Valley’smost specialised cluster with a LocationQuo-tient in 2016 of 9.2. Construction products and services is second (LQ 7.4) and furniture andwoodproducts is third (LQ 6). One of the noteworthy features about a LQ ranking is that it measureslocal significance, not absolute job numbers; so plastics and vulcanised products has a Loca-tion Quotient of 9.2 but has fewer jobs than food and beverage (LQ 1); with 5.3 per cent of localemployment compared to 10.4 per cent.
Clusters ranked top by LQ are muchmore likely to be tradable: 9 out of the top 10 clusters by LQare tradable. Employment levels are generally lower among tradable clusters as they are typicallyless labour-intensive; these leading tradable clusters employ 10,704 jobs, 20.8 per cent of totalemployment.
A full ranking of clusters by Location Quotient, along with the key facts on what industries thoseclusters cover and 2016 jobs, LQ and average earnings, is provided after Figure 3.
CLUSTER REPORT | NOVEMBER 2017 2
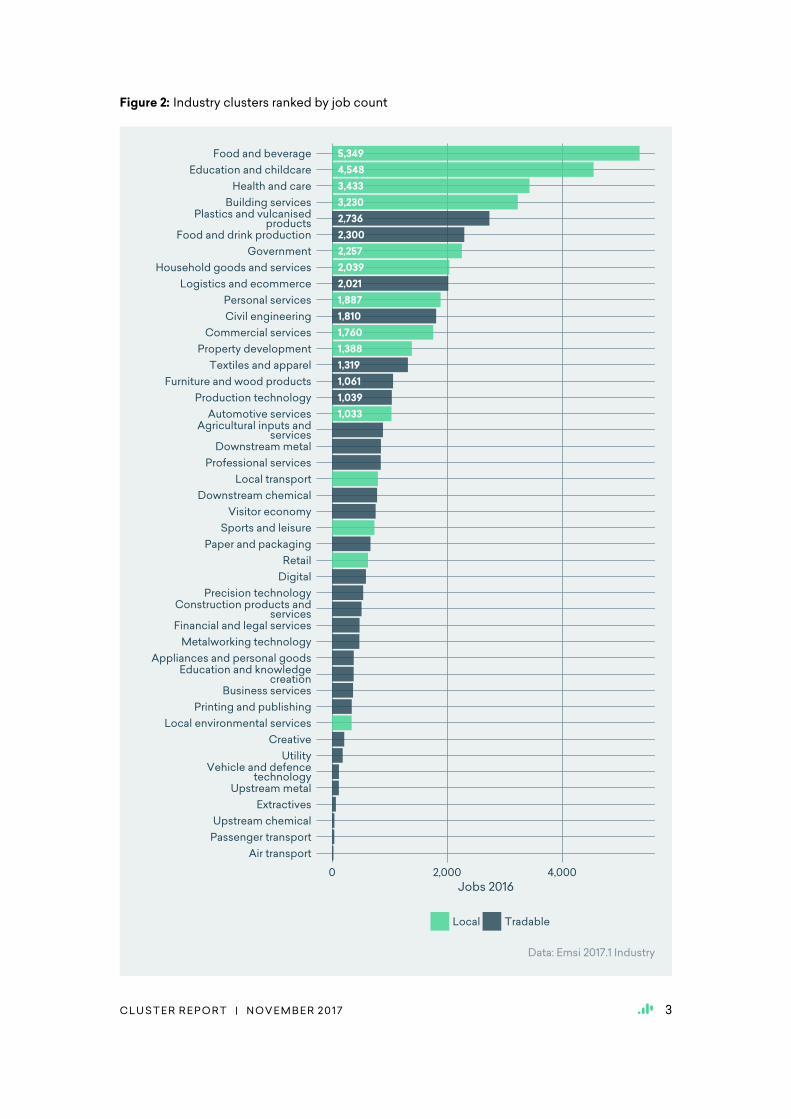
Figure 2: Industry clusters ranked by job count
2,736
1,061
1,319
2,300
3,230
2,021
1,810
1,039
4,548
2,257
2,039
1,033
5,349
1,388
1,887
3,433
1,760
Air transport
Passenger transport
Upstream chemical
Extractives
Upstream metal
Vehicle and defencetechnology
Utility
Creative
Local environmental services
Printing and publishing
Business services
Education and knowledgecreation
Appliances and personal goods
Metalworking technology
Financial and legal services
Construction products andservices
Precision technology
Digital
Retail
Paper and packaging
Sports and leisure
Visitor economy
Downstream chemical
Local transport
Professional services
Downstream metal
Agricultural inputs andservices
Automotive services
Production technology
Furniture and wood products
Textiles and apparel
Property development
Commercial services
Civil engineering
Personal services
Logistics and ecommerce
Household goods and services
Government
Food and drink production
Plastics and vulcanisedproducts
Building services
Health and care
Education and childcare
Food and beverage
0 2,000 4,000
Jobs 2016
Local Tradable
Data: Emsi 2017.1 Industry
CLUSTER REPORT | NOVEMBER 2017 3
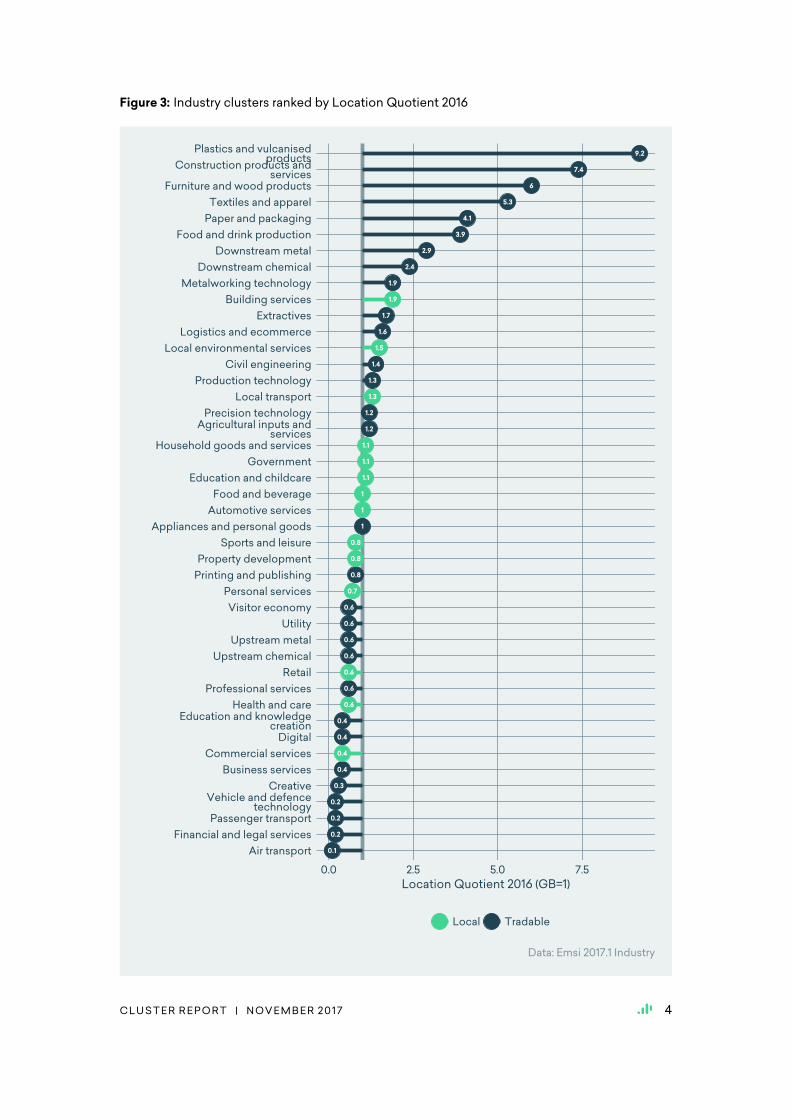
Figure 3: Industry clusters ranked by Location Quotient 2016
9.2
7.4
6
5.3
4.1
3.9
2.9
2.4
1.9
1.9
1.7
1.6
1.5
1.4
1.3
1.3
1.2
1.2
1.1
1.1
1.1
1
1
1
0.8
0.8
0.8
0.7
0.6
0.6
0.6
0.6
0.6
0.6
0.6
0.4
0.4
0.4
0.4
0.3
0.2
0.2
0.2
0.1Air transport
Financial and legal services
Passenger transport
Vehicle and defencetechnology
Creative
Business services
Commercial services
Digital
Education and knowledgecreation
Health and care
Professional services
Retail
Upstream chemical
Upstream metal
Utility
Visitor economy
Personal services
Printing and publishing
Property development
Sports and leisure
Appliances and personal goods
Automotive services
Food and beverage
Education and childcare
Government
Household goods and services
Agricultural inputs andservices
Precision technology
Local transport
Production technology
Civil engineering
Local environmental services
Logistics and ecommerce
Extractives
Building services
Metalworking technology
Downstream chemical
Downstream metal
Food and drink production
Paper and packaging
Textiles and apparel
Furniture and wood products
Construction products andservices
Plastics and vulcanisedproducts
0.0 2.5 5.0 7.5
Location Quotient 2016 (GB=1)
Local Tradable
Data: Emsi 2017.1 Industry
CLUSTER REPORT | NOVEMBER 2017 4
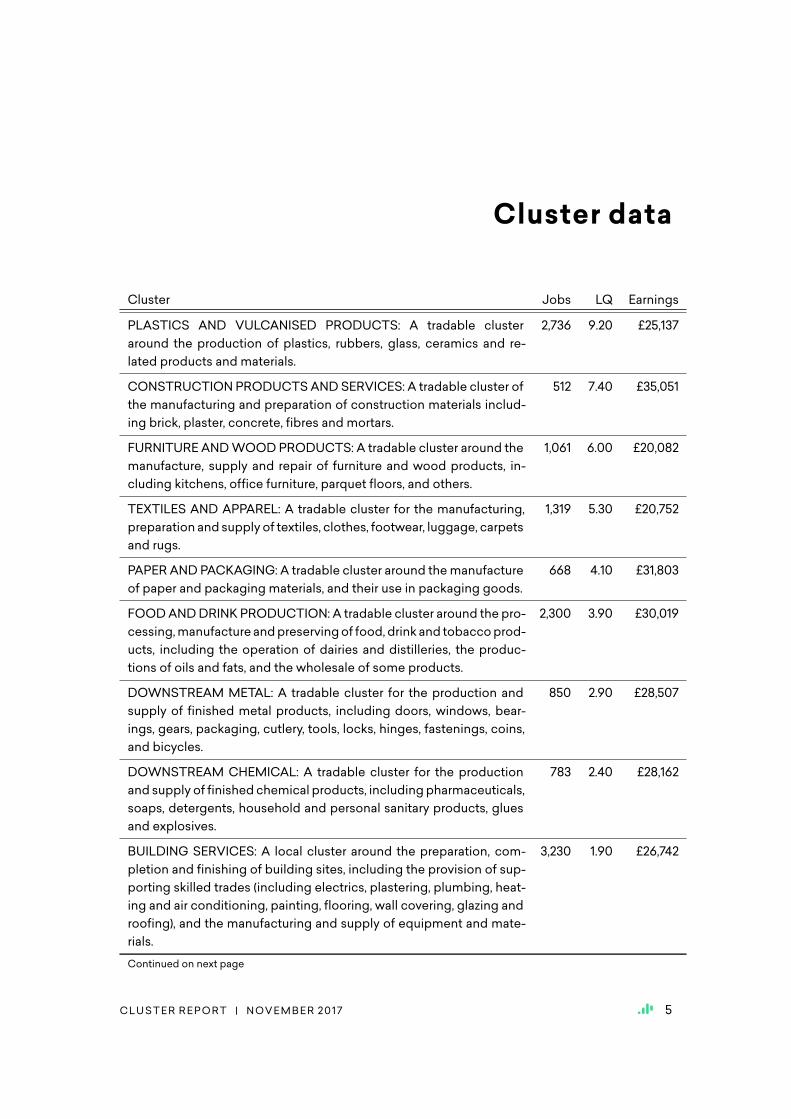
Cluster data
Cluster Jobs LQ Earnings
PLASTICS AND VULCANISED PRODUCTS: A tradable clusteraround the production of plastics, rubbers, glass, ceramics and re-lated products and materials.
2,736 9.20 £25,137
CONSTRUCTIONPRODUCTSANDSERVICES: A tradable cluster ofthe manufacturing and preparation of construction materials includ-ing brick, plaster, concrete, fibres and mortars.
512 7.40 £35,051
FURNITURE ANDWOODPRODUCTS: A tradable cluster around themanufacture, supply and repair of furniture and wood products, in-cluding kitchens, office furniture, parquet floors, and others.
1,061 6.00 £20,082
TEXTILES AND APPAREL: A tradable cluster for the manufacturing,preparation and supply of textiles, clothes, footwear, luggage, carpetsand rugs.
1,319 5.30 £20,752
PAPERANDPACKAGING: A tradable cluster around themanufactureof paper and packaging materials, and their use in packaging goods.
668 4.10 £31,803
FOODANDDRINKPRODUCTION: A tradable cluster around the pro-cessing,manufacture andpreservingof food, drink and tobaccoprod-ucts, including the operation of dairies and distilleries, the produc-tions of oils and fats, and the wholesale of some products.
2,300 3.90 £30,019
DOWNSTREAM METAL: A tradable cluster for the production andsupply of finished metal products, including doors, windows, bear-ings, gears, packaging, cutlery, tools, locks, hinges, fastenings, coins,and bicycles.
850 2.90 £28,507
DOWNSTREAM CHEMICAL: A tradable cluster for the productionand supply of finished chemical products, includingpharmaceuticals,soaps, detergents, household and personal sanitary products, gluesand explosives.
783 2.40 £28,162
BUILDING SERVICES: A local cluster around the preparation, com-pletion and finishing of building sites, including the provision of sup-porting skilled trades (including electrics, plastering, plumbing, heat-ing and air conditioning, painting, flooring, wall covering, glazing androofing), and the manufacturing and supply of equipment and mate-rials.
3,230 1.90 £26,742
Continued on next page
CLUSTER REPORT | NOVEMBER 2017 5
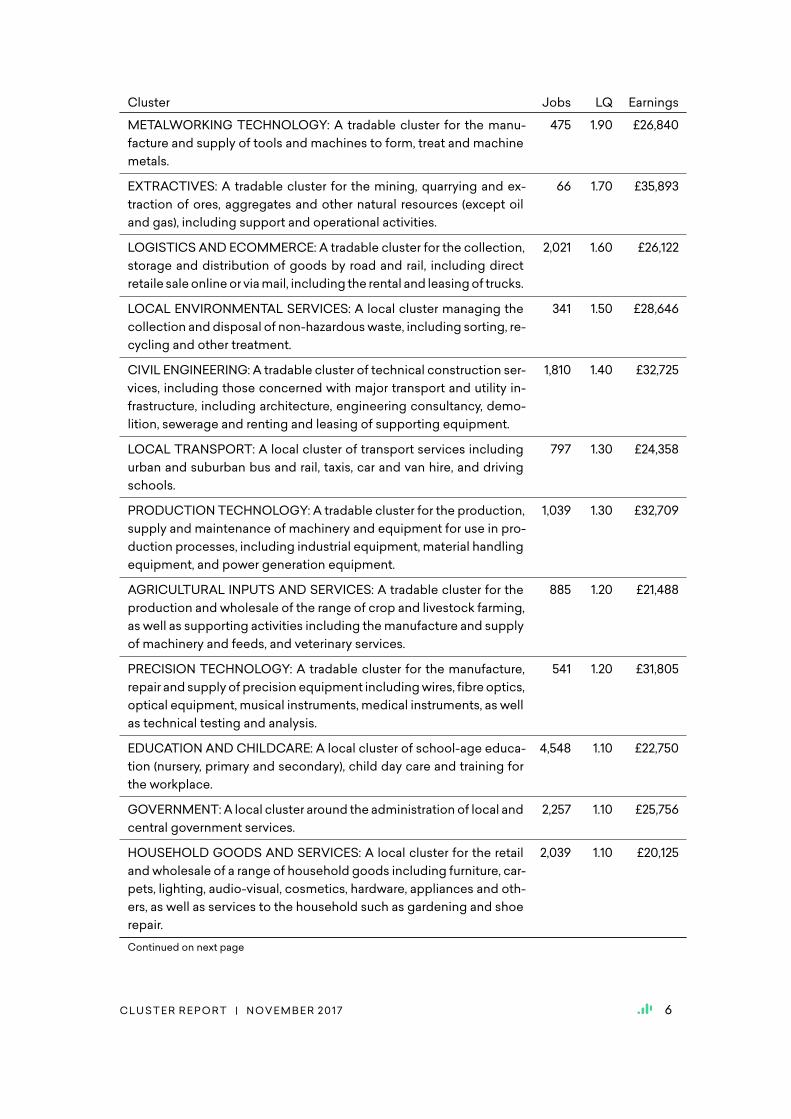
Cluster Jobs LQ Earnings
METALWORKING TECHNOLOGY: A tradable cluster for the manu-facture and supply of tools and machines to form, treat and machinemetals.
475 1.90 £26,840
EXTRACTIVES: A tradable cluster for the mining, quarrying and ex-traction of ores, aggregates and other natural resources (except oiland gas), including support and operational activities.
66 1.70 £35,893
LOGISTICS AND ECOMMERCE: A tradable cluster for the collection,storage and distribution of goods by road and rail, including directretaile saleonlineor viamail, including the rental and leasingof trucks.
2,021 1.60 £26,122
LOCAL ENVIRONMENTAL SERVICES: A local cluster managing thecollection anddisposal of non-hazardouswaste, including sorting, re-cycling and other treatment.
341 1.50 £28,646
CIVIL ENGINEERING: A tradable cluster of technical construction ser-vices, including those concerned with major transport and utility in-frastructure, including architecture, engineering consultancy, demo-lition, sewerage and renting and leasing of supporting equipment.
1,810 1.40 £32,725
LOCAL TRANSPORT: A local cluster of transport services includingurban and suburban bus and rail, taxis, car and van hire, and drivingschools.
797 1.30 £24,358
PRODUCTIONTECHNOLOGY: A tradable cluster for the production,supply and maintenance of machinery and equipment for use in pro-duction processes, including industrial equipment, material handlingequipment, and power generation equipment.
1,039 1.30 £32,709
AGRICULTURAL INPUTS AND SERVICES: A tradable cluster for theproduction and wholesale of the range of crop and livestock farming,as well as supporting activities including themanufacture and supplyof machinery and feeds, and veterinary services.
885 1.20 £21,488
PRECISION TECHNOLOGY: A tradable cluster for the manufacture,repair and supply of precision equipment includingwires, fibreoptics,optical equipment, musical instruments, medical instruments, as wellas technical testing and analysis.
541 1.20 £31,805
EDUCATION AND CHILDCARE: A local cluster of school-age educa-tion (nursery, primary and secondary), child day care and training forthe workplace.
4,548 1.10 £22,750
GOVERNMENT:A local cluster around the administration of local andcentral government services.
2,257 1.10 £25,756
HOUSEHOLD GOODS AND SERVICES: A local cluster for the retailandwholesale of a range of household goods including furniture, car-pets, lighting, audio-visual, cosmetics, hardware, appliances and oth-ers, as well as services to the household such as gardening and shoerepair.
2,039 1.10 £20,125
Continued on next page
CLUSTER REPORT | NOVEMBER 2017 6
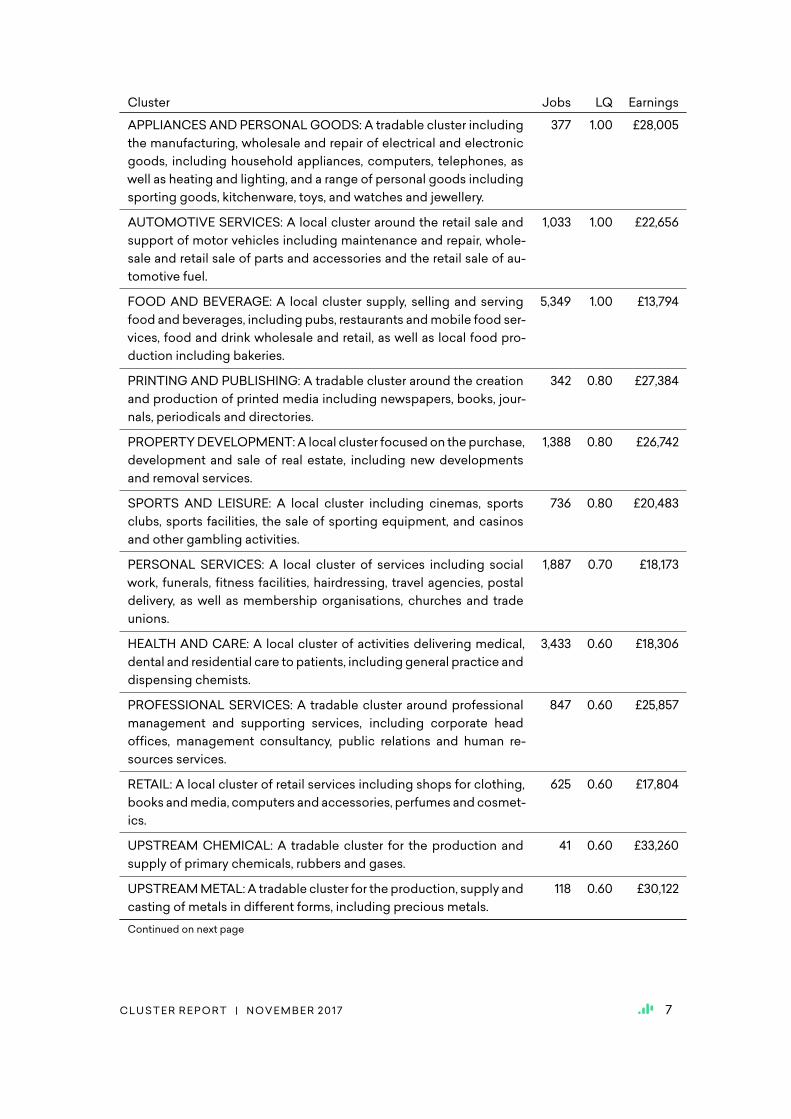
Cluster Jobs LQ Earnings
APPLIANCES ANDPERSONALGOODS: A tradable cluster includingthe manufacturing, wholesale and repair of electrical and electronicgoods, including household appliances, computers, telephones, aswell as heating and lighting, and a range of personal goods includingsporting goods, kitchenware, toys, and watches and jewellery.
377 1.00 £28,005
AUTOMOTIVE SERVICES: A local cluster around the retail sale andsupport of motor vehicles including maintenance and repair, whole-sale and retail sale of parts and accessories and the retail sale of au-tomotive fuel.
1,033 1.00 £22,656
FOOD AND BEVERAGE: A local cluster supply, selling and servingfood and beverages, including pubs, restaurants andmobile food ser-vices, food and drink wholesale and retail, as well as local food pro-duction including bakeries.
5,349 1.00 £13,794
PRINTING AND PUBLISHING: A tradable cluster around the creationand production of printed media including newspapers, books, jour-nals, periodicals and directories.
342 0.80 £27,384
PROPERTYDEVELOPMENT:A local cluster focusedon thepurchase,development and sale of real estate, including new developmentsand removal services.
1,388 0.80 £26,742
SPORTS AND LEISURE: A local cluster including cinemas, sportsclubs, sports facilities, the sale of sporting equipment, and casinosand other gambling activities.
736 0.80 £20,483
PERSONAL SERVICES: A local cluster of services including socialwork, funerals, fitness facilities, hairdressing, travel agencies, postaldelivery, as well as membership organisations, churches and tradeunions.
1,887 0.70 £18,173
HEALTH AND CARE: A local cluster of activities delivering medical,dental and residential care to patients, including general practice anddispensing chemists.
3,433 0.60 £18,306
PROFESSIONAL SERVICES: A tradable cluster around professionalmanagement and supporting services, including corporate headoffices, management consultancy, public relations and human re-sources services.
847 0.60 £25,857
RETAIL: A local cluster of retail services including shops for clothing,books andmedia, computers and accessories, perfumes andcosmet-ics.
625 0.60 £17,804
UPSTREAM CHEMICAL: A tradable cluster for the production andsupply of primary chemicals, rubbers and gases.
41 0.60 £33,260
UPSTREAMMETAL: A tradable cluster for the production, supply andcasting of metals in different forms, including precious metals.
118 0.60 £30,122
Continued on next page
CLUSTER REPORT | NOVEMBER 2017 7
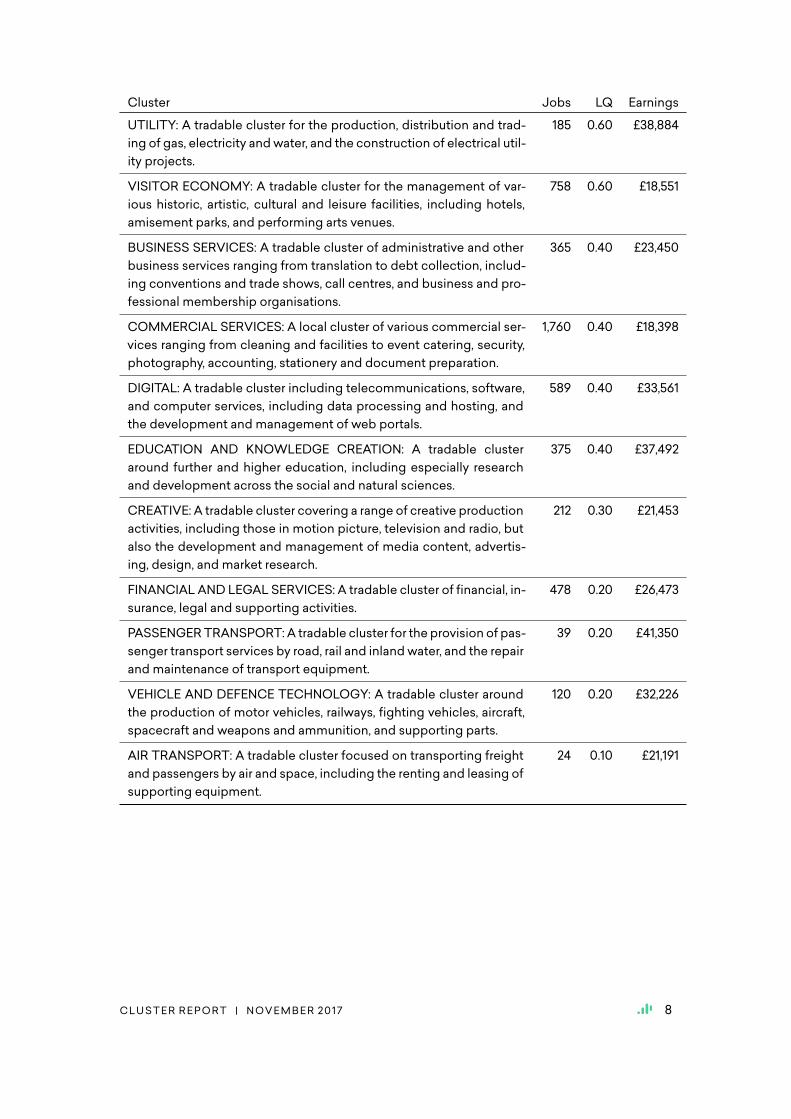
Cluster Jobs LQ Earnings
UTILITY: A tradable cluster for the production, distribution and trad-ing of gas, electricity andwater, and the construction of electrical util-ity projects.
185 0.60 £38,884
VISITOR ECONOMY: A tradable cluster for the management of var-ious historic, artistic, cultural and leisure facilities, including hotels,amisement parks, and performing arts venues.
758 0.60 £18,551
BUSINESS SERVICES: A tradable cluster of administrative and otherbusiness services ranging from translation to debt collection, includ-ing conventions and trade shows, call centres, and business and pro-fessional membership organisations.
365 0.40 £23,450
COMMERCIAL SERVICES: A local cluster of various commercial ser-vices ranging from cleaning and facilities to event catering, security,photography, accounting, stationery and document preparation.
1,760 0.40 £18,398
DIGITAL: A tradable cluster including telecommunications, software,and computer services, including data processing and hosting, andthe development and management of web portals.
589 0.40 £33,561
EDUCATION AND KNOWLEDGE CREATION: A tradable clusteraround further and higher education, including especially researchand development across the social and natural sciences.
375 0.40 £37,492
CREATIVE: A tradable cluster covering a range of creative productionactivities, including those in motion picture, television and radio, butalso the development and management of media content, advertis-ing, design, and market research.
212 0.30 £21,453
FINANCIAL AND LEGAL SERVICES: A tradable cluster of financial, in-surance, legal and supporting activities.
478 0.20 £26,473
PASSENGERTRANSPORT: A tradable cluster for the provision of pas-senger transport services by road, rail and inlandwater, and the repairand maintenance of transport equipment.
39 0.20 £41,350
VEHICLE AND DEFENCE TECHNOLOGY: A tradable cluster aroundthe production of motor vehicles, railways, fighting vehicles, aircraft,spacecraft and weapons and ammunition, and supporting parts.
120 0.20 £32,226
AIR TRANSPORT: A tradable cluster focused on transporting freightand passengers by air and space, including the renting and leasing ofsupporting equipment.
24 0.10 £21,191
CLUSTER REPORT | NOVEMBER 2017 8

Next steps
Identifying local and tradable industry clusters in your region by job count and LocationQuotientis a great place to begin building a solid growth strategy for your region. However, this insightis limited to indentifying only what the state of play is in your area, without reference to nationalgrowth. The key to taking the data to the next level is twofold.
Firstly, we can map your region’s clusters against national growth to establish which are yourstrengths, which present you with opportunities, and which can be deemed threats. We definethese as follows:
■ Strengths: clusters that are growing nationally, and inwhich your region has a comparativeadvantage over other areas of the country
■ Opportunities: clusters that are growing nationally, but which your region does not yetenjoy a comparative advantage, giving the potential for growth
■ Threats: clusters where your region enjoys a comparative advantage over other areas, butwhich are at risk because nationally they are set to decline over in the coming years
Secondly, once we have identified clusters as being of interest, we can then delve into them tolook at the data for its underlying industries, in order to seewhere theremight be opportunities todevelop the cluster further. For instance, in any cluster that is identified as a strength (i.e. one thathas a high LQ and is set to grow nationally), there will ordinarily be some underlying industriesthat have a much lower LQ than the cluster as a whole. This presents a huge opportunity toattract businesses from that industry to your region, on the basis that because your region enjoysa comparative advantage for the cluster as a whole, your region already has strong supply chainconnections and a similar workforce.
If you would like to find out more about how we can help you identify your region’s strengths,opportunities and threats, and howwe can then give you far more granular detail on each cluster,contact Will Cookson at [email protected]
CLUSTER REPORT | NOVEMBER 2017 9
Appendix: Emsi data
Emsi provides the most detailed and localised labour market intelligence available in the UK,which in turn creates a robust base upon which to create uniquely localised and detailed em-ployment projections. Emsi brings together different data sources to create a robust compositedataset that provides detailed labour market intelligence on hundreds of industries and occu-pations at the lowest geographic levels. By joining together these datasets, Emsi can provideunique insights into the relationship between industry trends and associated occupational re-quirements.
Emsi builds thedata from9different government data sources, eachdescribingdifferent aspectsof the labourmarket that in isolation only tell part of the story or contain inherentweaknesses, butwhenmodelled together provide amore holistic and robust view of the labourmarket. This com-bination – some 20million data points added each year – provides the platform for employmentforecasts tobecreated that describe locally-specific employment trends, andwhich are updatedannually as more up-to-date data is made available through the government sources.
Combining data from these sources creates something entirely unique, allowing gaps in individ-ual sources to be filled in, providing employment forecasts at a level of detail that makes labourmarket data useful to a broad range of local, regional, and national organisations. Linking thiswith skills and competency intelligence helps to understand shifts in training priorities associ-ated with a changing labour force.
Emsi data together delivers not only depth in terms of local detail, industry detail, and occupa-tional detail, but applications in a range of different directions, with data on demographics, age,educational attainment, competency, earnings and staffing patterns. All data are reported in cur-rent (SIC 2007 / SOC 2010) classifications.
Our data includes consistent series back to 2003 and projected forward to 2024 and are updatedannually. Wedeploy them through tools such asAnalyst to help economic strategists and FE andHE planners to investigate the current and projected labourmarket andCareer Coach to presenta micro view for young people considering different occupations in their future.
We also have it available as a general resource which we can use as a tool in our consulting work.While we have the knowledge and capability to tackle any of the leading labour market intelli-gence sources – such as those produced by theONS andUKCES – our own data’s power lies notonly in its granularity, but in its accessibility. Because of the work we do to process, prepare andvalidate our data, Emsi can answer complex labour market queries from our data in high volumeand at high speed.
CLUSTER REPORT | NOVEMBER 2017 10

Bibliography
Delgado,M., Porter,M. E., andStern, S. (2014). Clusters, convergence, andeconomicperformance.Research Policy, 43:1785–1799.
Delgado, M., Porter, M. E., and Stern, S. (2016). Defining clusters of related industries. Journal ofEconomic Geography, 16(1):1–38.
Ellison, G. and Glaeser, E. L. (1997). Geographic concentration in US manufacturing industries: Adartboard approach. Journal of Political Economy, 105:889–927.
Faggio, G. and Overman, H. (2014). The effect of public sector employment on local labour mar-kets. Journal of Urban Economics, 79:91–107.
Krugman, P. (1991). Increasing returns and economic geography. Journal of Political Economy,99:483–499.
Marshall, A. (1920). Principles of Economics. Macmillan, London.
Moretti, E. (2010). Local multipliers. American Economic Review: Papers and Proceedings, 100:1–7.
Porter, M. E. (1998). Clusters and competition: New agendas for companies, governments andinstitutions. In Porter, M. E., editor, On competition, pages 197–299. Harvard Business SchoolPress, Boston, MA.
CLUSTER REPORT | NOVEMBER 2017 11

For more information about how we can help you grow your local economy, contact Will Cookson, BDM for Economic Development:
Email: [email protected]: 07740 344 750
Suite 22, Basingstoke Innovation Centre, Norden House, Basing View, Basingstoke, RG21 4HG
www.economicmodelling.co.ukTwitter: @Emsi_UK