Embed Size (px)
Citation preview
Hosted by
W e l c o m eto IFR Press Conference
29 September 2016Frankfurt
Hosted by
How Robots protect the EU in Global Competition
Welcome and introduction
World Robotics 2016 -Results, Forecast, Trends
Robotics & Industrie 4.0
Get together and personal interviews
2 •
Hosted by
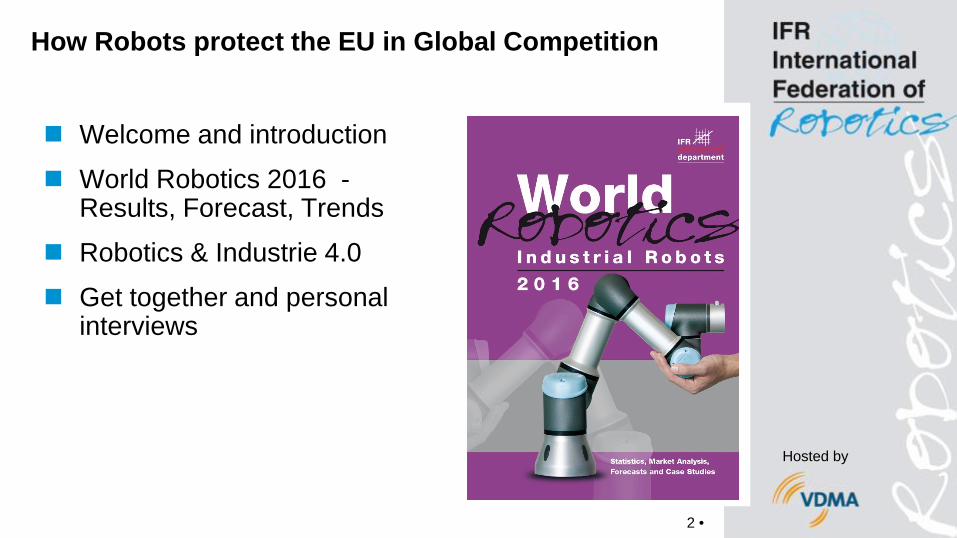
Joe GemmaIFR President
President and CEO,KUKA Robotics Corp, USA
Gudrun LitzenbergerIFR General Secretary, Frankfurt
Bild
: Rei
s G
mbH
& C
o. K
G M
asch
inen
fabr
ik
Professor Alexander VerlChairman IFR Research Committee
General Head of Institute Control Engineering of Machine Tools and Manufacturing Units University of Stuttgart, Germany
Speakers on the panel
Hosted by
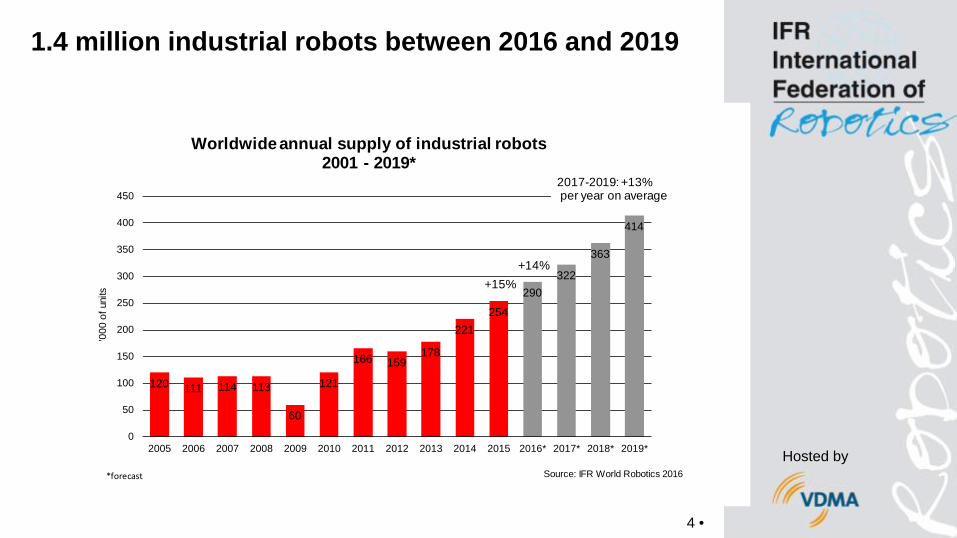
1.4 million industrial robots between 2016 and 2019
120 111 114 113
60
121
166 159178
221254
290322
363
414
0
50
100
150
200
250
300
350
400
450
2005 2006 2007 2008 2009 2010 2011 2012 2013 2014 2015 2016* 2017* 2018* 2019*
'000
of u
nits
Worldwide annual supply of industrial robots2001 - 2019*
*forecast
2017-2019: +13%per year on average
+14%+15%
Source: IFR World Robotics 2016
4 •
Hosted by
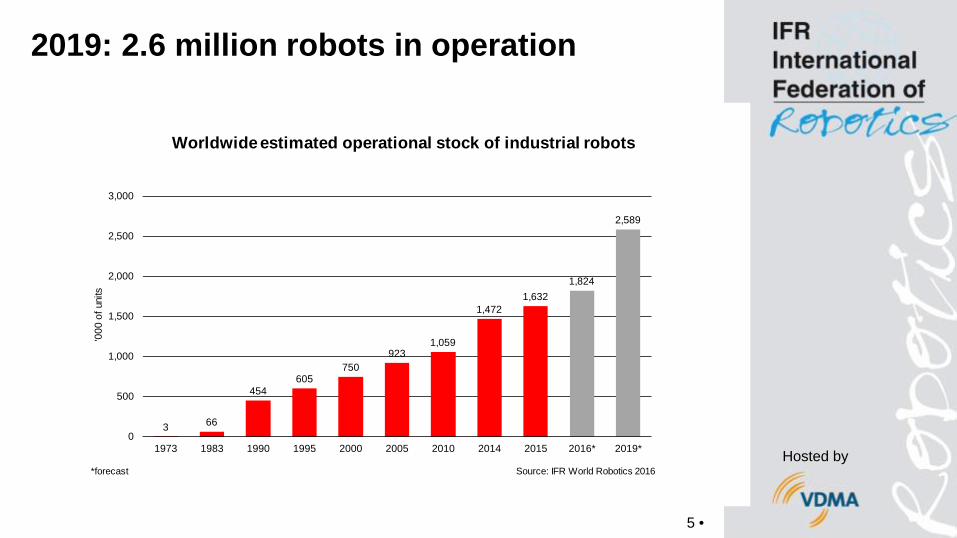
2019: 2.6 million robots in operation
3 66
454605
750923
1,059
1,4721,632
1,824
2,589
0
500
1,000
1,500
2,000
2,500
3,000
1973 1983 1990 1995 2000 2005 2010 2014 2015 2016* 2019*
'000
of u
nits
Worldwide estimated operational stock of industrial robots
*forecast Source: IFR World Robotics 2016
5 •
Hosted by
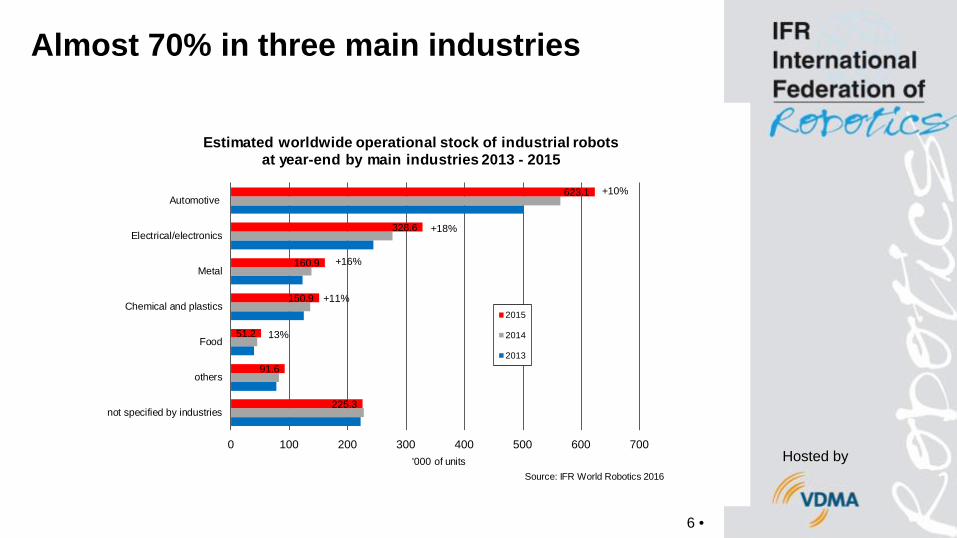
Almost 70% in three main industries
6 •
225.3
91.6
51.2
150.9
160.9
328.6
623.1
0 100 200 300 400 500 600 700
not specified by industries
others
Food
Chemical and plastics
Metal
Electrical/electronics
Automotive
'000 of units
Estimated worldwide operational stock of industrial robots at year-end by main industries 2013 - 2015
2015
2014
2013
Source: IFR World Robotics 2016
+10%
+18%
+16%
+11%
13%
Hosted by
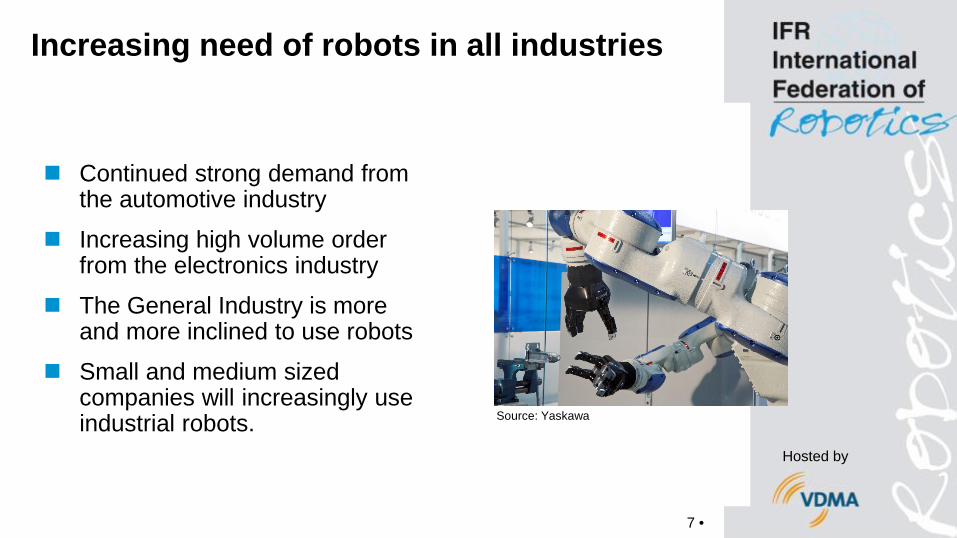
Increasing need of robots in all industries
Continued strong demand from the automotive industry
Increasing high volume order from the electronics industry
The General Industry is more and more inclined to use robots
Small and medium sized companies will increasingly use industrial robots.
7 •
Source: Yaskawa
Hosted by
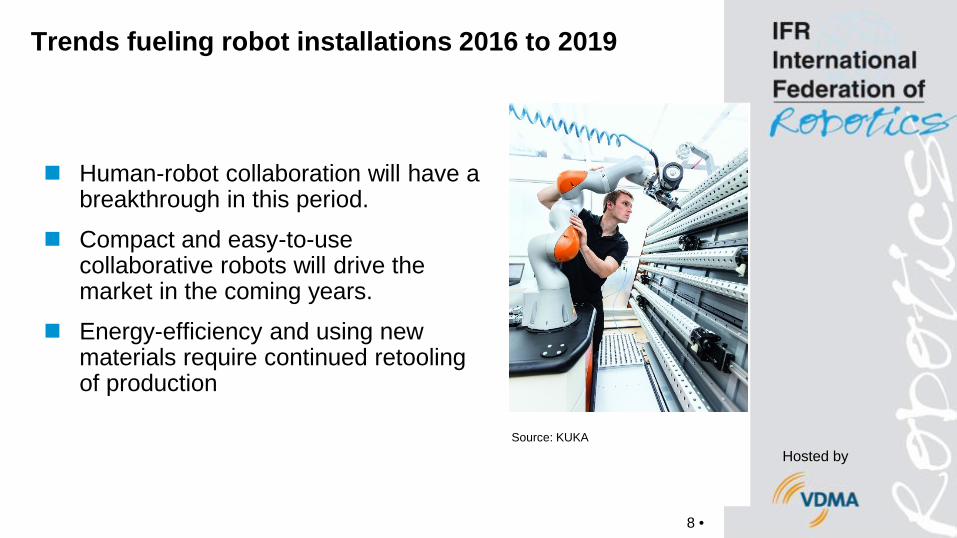
Trends fueling robot installations 2016 to 2019
Human-robot collaboration will have a breakthrough in this period.
Compact and easy-to-use collaborative robots will drive the market in the coming years.
Energy-efficiency and using new materials require continued retooling of production
8 •
Source: KUKA
Hosted by
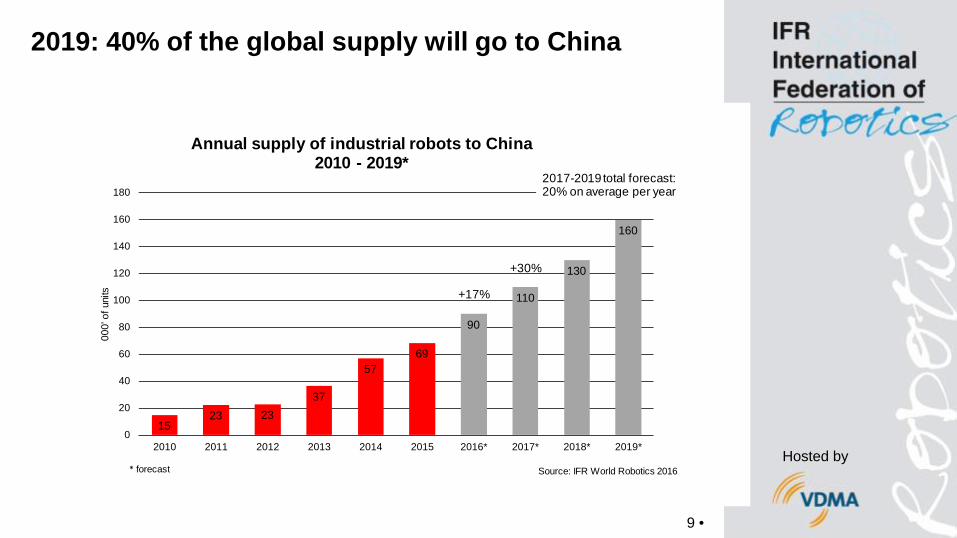
2019: 40% of the global supply will go to China
9 •
1523 23
37
5769
90
110
130
160
0
20
40
60
80
100
120
140
160
180
2010 2011 2012 2013 2014 2015 2016* 2017* 2018* 2019*
000'
of u
nits
Annual supply of industrial robots to China2010 - 2019*
* forecast
2017-2019 total forecast:20% on average per year
+17%
+30%
Source: IFR World Robotics 2016
Hosted by
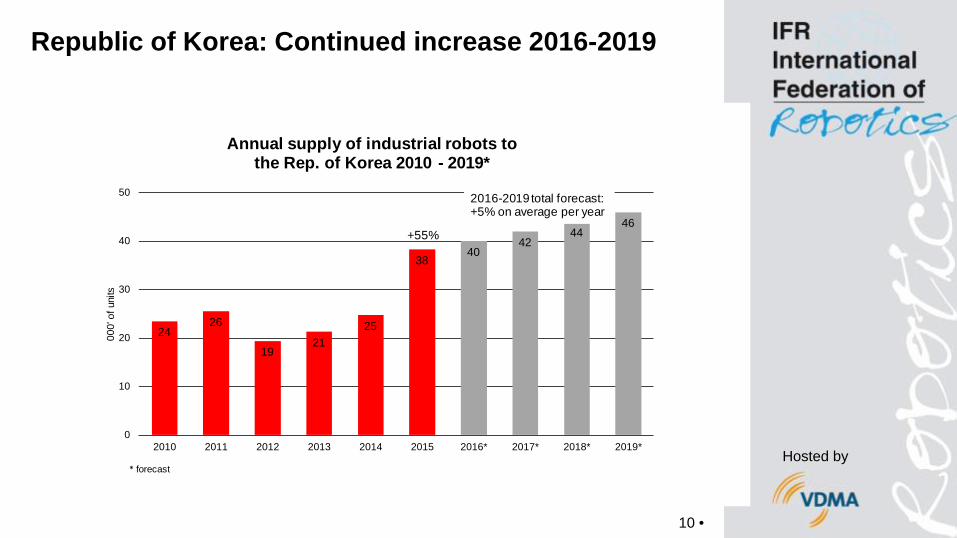
Republic of Korea: Continued increase 2016-2019
2426
1921
25
3840
4244
46
0
10
20
30
40
50
2010 2011 2012 2013 2014 2015 2016* 2017* 2018* 2019*
000'
of u
nits
Annual supply of industrial robots to the Rep. of Korea 2010 - 2019*
* forecast
2016-2019 total forecast:+5% on average per year
+55%
10 •
Hosted by
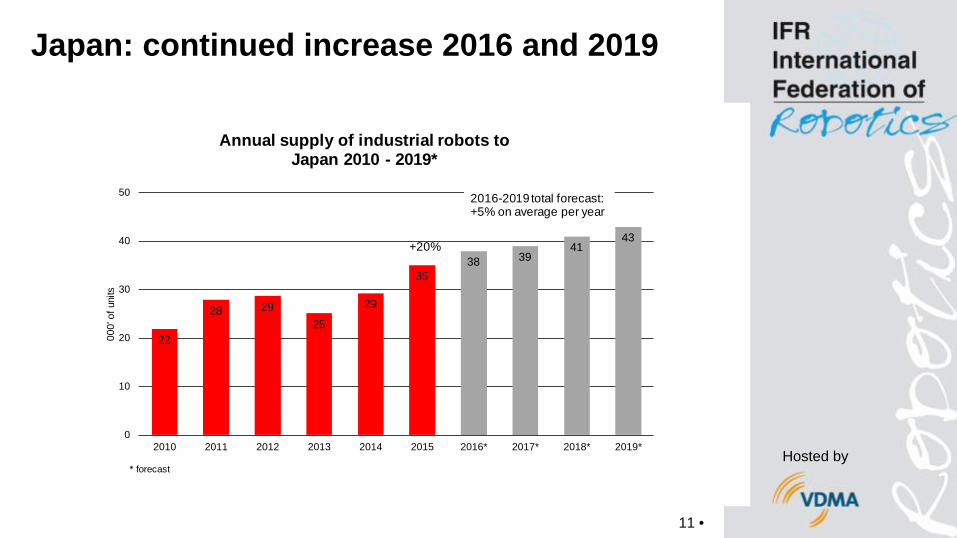
Japan: continued increase 2016 and 2019
22
28 2925
29
3538 39
4143
0
10
20
30
40
50
2010 2011 2012 2013 2014 2015 2016* 2017* 2018* 2019*
000'
of u
nits
Annual supply of industrial robots to Japan 2010 - 2019*
* forecast
2016-2019 total forecast:+5% on average per year
+20%
11 •
Hosted by
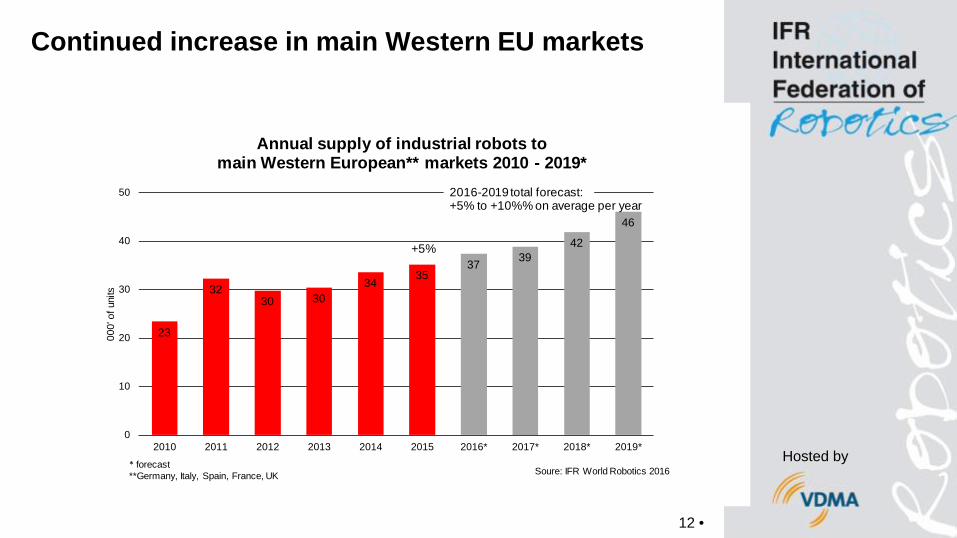
Continued increase in main Western EU markets
12 •
23
3230 30
3435
37 3942
46
0
10
20
30
40
50
2010 2011 2012 2013 2014 2015 2016* 2017* 2018* 2019*
000'
of u
nits
Annual supply of industrial robots to main Western European** markets 2010 - 2019*
* forecast**Germany, Italy, Spain, France, UK
2016-2019 total forecast:+5% to +10%% on average per year
+5%
Soure: IFR World Robotics 2016
Hosted by
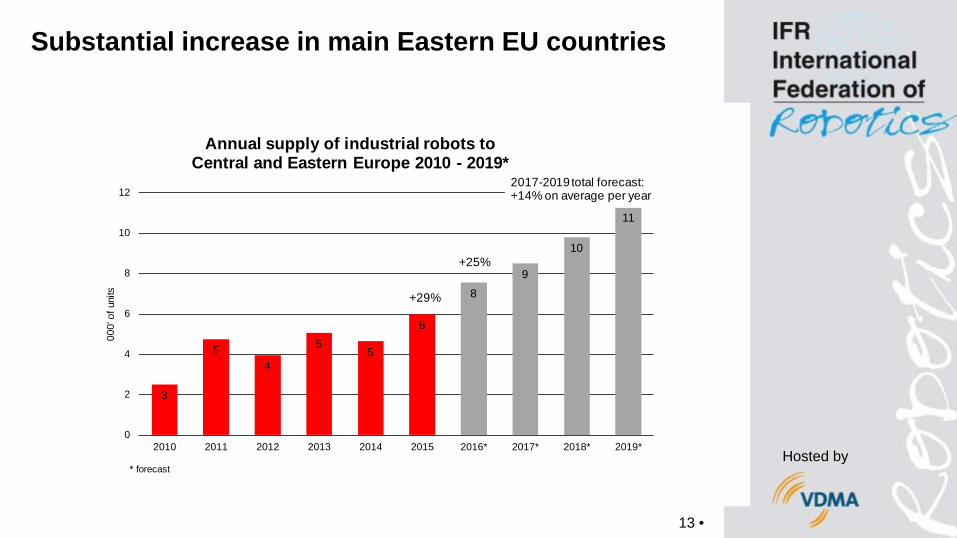
Substantial increase in main Eastern EU countries
3
54
55
6
8
9
10
11
0
2
4
6
8
10
12
2010 2011 2012 2013 2014 2015 2016* 2017* 2018* 2019*
000'
of u
nits
Annual supply of industrial robots to Central and Eastern Europe 2010 - 2019*
* forecast
2017-2019 total forecast:+14% on average per year
+25%
+29%
13 •
Hosted by
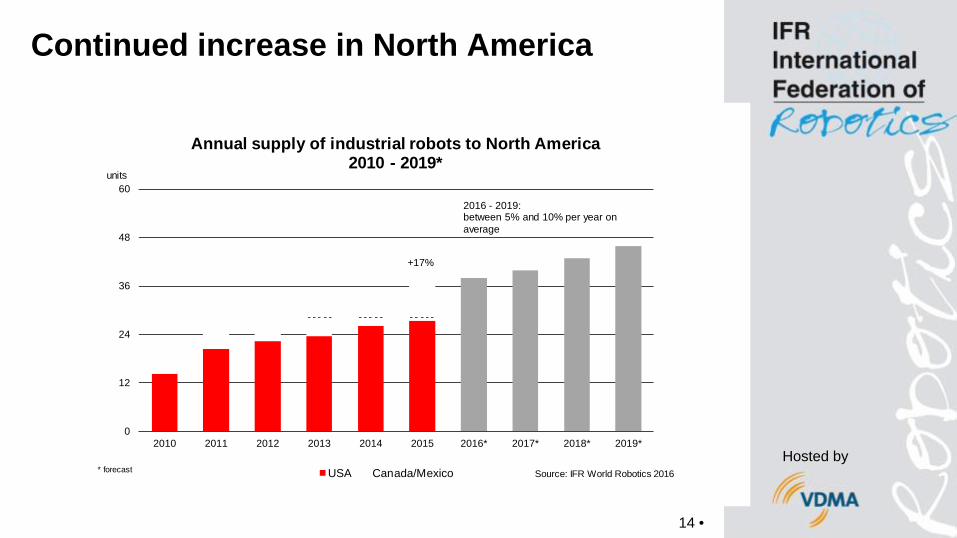
Continued increase in North America
14 •
0
12
24
36
48
60
2010 2011 2012 2013 2014 2015 2016* 2017* 2018* 2019*
units
Annual supply of industrial robots to North America2010 - 2019*
USA Canada/Mexico* forecast
2016 - 2019:between 5% and 10% per year on average
+17%
Source: IFR World Robotics 2016
Hosted by
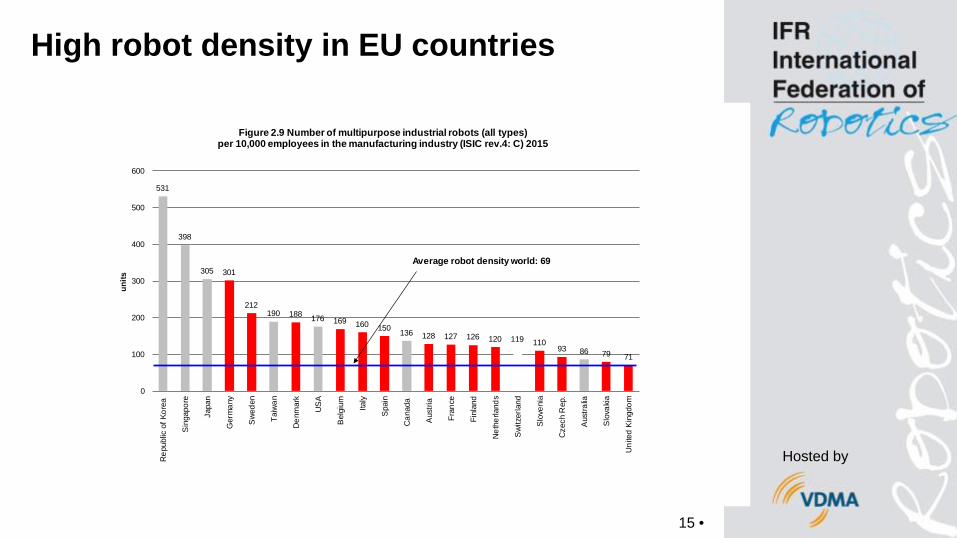
High robot density in EU countries
15 •
531
398
305 301
212190 188 176 169 160 150 136 128 127 126 120 119 110
93 86 79 71
0
100
200
300
400
500
600R
epub
lic o
f Kor
ea
Sin
gapo
re
Japa
n
Ger
man
y
Sw
eden
Taiw
an
Den
mar
k
US
A
Bel
gium Ita
ly
Spa
in
Can
ada
Aus
tria
Fran
ce
Finl
and
Net
herla
nds
Sw
itzer
land
Slo
veni
a
Cze
ch R
ep.
Aus
tralia
Slo
vaki
a
Uni
ted
Kin
gdom
units
Figure 2.9 Number of multipurpose industrial robots (all types) per 10,000 employees in the manufacturing industry (ISIC rev.4: C) 2015
Average robot density world: 69
Hosted by
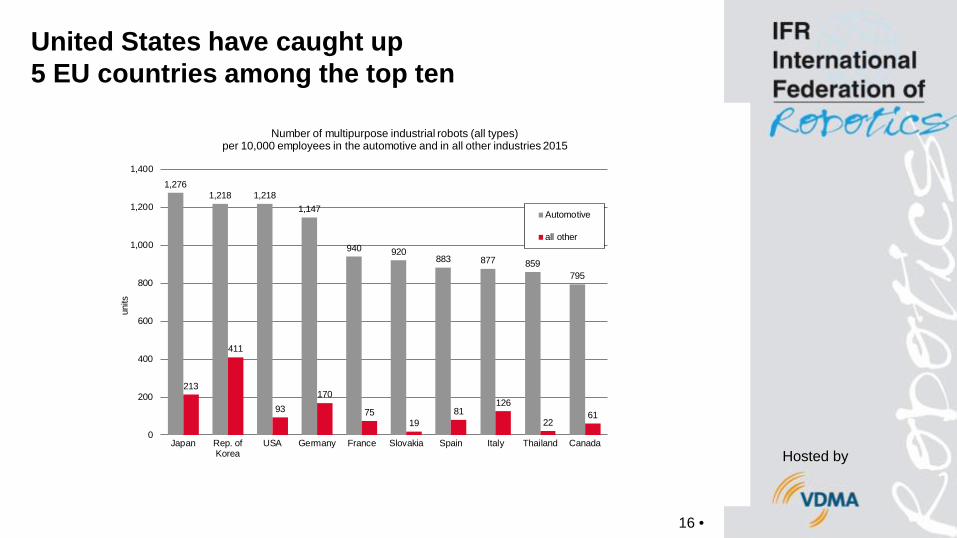
United States have caught up5 EU countries among the top ten
16 •
1,2761,218 1,218
1,147
940 920883 877 859
795
213
411
93170
7519
81126
2261
0
200
400
600
800
1,000
1,200
1,400
Japan Rep. ofKorea
USA Germany France Slovakia Spain Italy Thailand Canada
units
Number of multipurpose industrial robots (all types) per 10,000 employees in the automotive and in all other industries 2015
Automotive
all other
Hosted by
ZEW Study*: Automation has a positive net effect on labour demand in Europe.
Automation reduces production costs Reduced product costs reduce product prices Reduced product prices increase demand for products Increased product demand increases employment
17 •*Study of Mannheim Centre for European Economic Research (ZEW) and the University of Utrecht, 2016
Hosted by
Example automotive industry United States 2010-2015: 80,000 new industrial robots installed 230,000 more employees
Example automotive industry Germany 2010-2015: Operational stock increased by 3% on average per year
(+13,000 units) Increase of employees : +2.5% on average per year (+93,000
employees)
18 •*