Embed Size (px)
Citation preview

W d S i biliWaste management and Sustainability Transition - Outlooks in Japan
Keishiro Hara, Ph.D.Osaka University, Sustainability Design Center
(h @ d k j )([email protected])
July 12, 2010
Special Seminar, University of Tsukuba
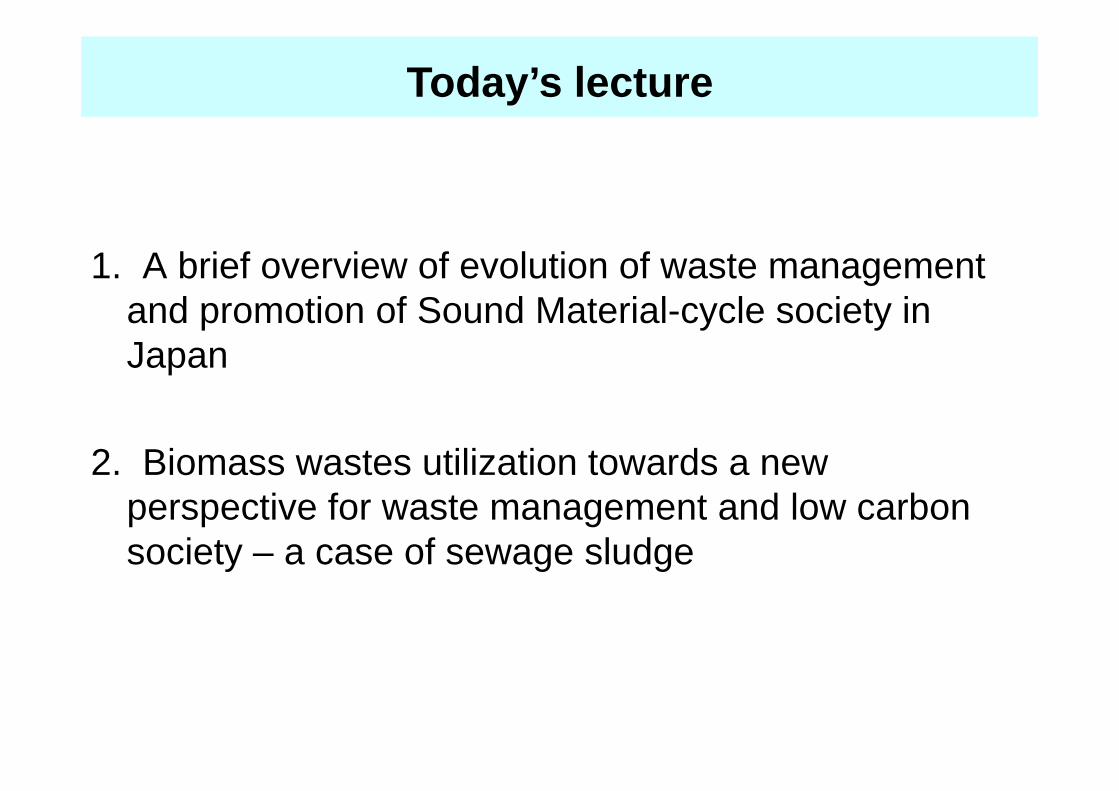
Today’s lecture
1. A brief overview of evolution of waste management and promotion of Sound Material cycle society inand promotion of Sound Material-cycle society in Japan
2. Biomass wastes utilization towards a new perspective for waste management and low carbon society – a case of sewage sludge
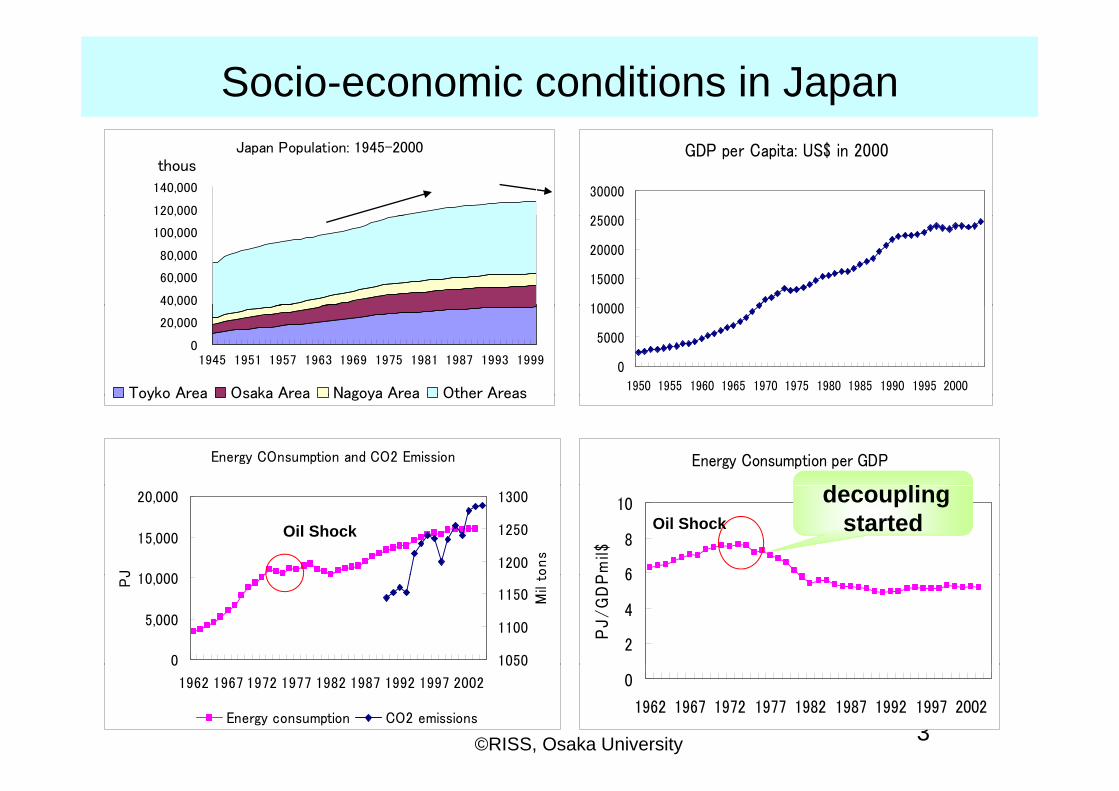
Socio-economic conditions in JapanJapan Population: 1945-2000
120,000
140,000
thousGDP per Capita: US$ in 2000
25000
30000
40,000
60,000
80,000
100,000
,
10000
15000
20000
25000
0
20,000
,
1945 1951 1957 1963 1969 1975 1981 1987 1993 1999
Toyko Area Osaka Area Nagoya Area Other Areas
0
5000
10000
1950 1955 1960 1965 1970 1975 1980 1985 1990 1995 2000Toyko Area Osaka Area Nagoya Area Other Areas
Energy Consumption per GDPEnergy COnsumption and CO2 Emission
d li
6
8
10
Pm
il$
10 000
15,000
20,000
J
1200
1250
1300
ons
Oil ShockOil Shock
decoupling started
2
4
6
PJ
/G
DP
0
5,000
10,000PJ
1050
1100
1150 Mil
t
3
0
1962 1967 1972 1977 1982 1987 1992 1997 2002
0
1962 1967 1972 1977 1982 1987 1992 1997 2002
1050
Energy consumption CO2 emissions
©RISS, Osaka University
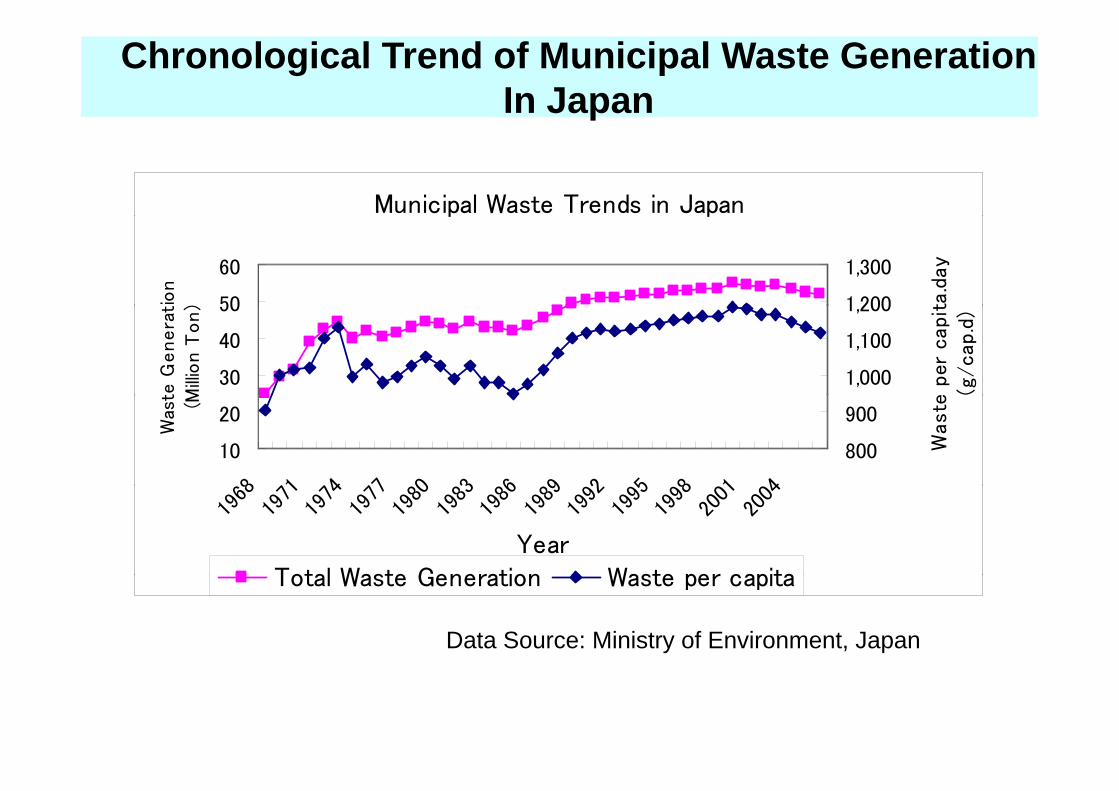
Chronological Trend of Municipal Waste Generation In Japan
Municipal Waste Trends in Japanp p
50
60
ion
) 1 200
1,300
ta.d
ay
30
40
50
te G
enera
tM
illio
n T
on)
1,000
1,100
1,200
e p
er
capit
(g/cap.d
)
10
20
68 71 74 77 80 83 86 89 92 95 98 01 04
Was
t (M
800
900
Was
te
1968
1971
1974
1977
1980
1983
1986
1989
1992
1995
1998
2001
2004
YearTotal Waste Generation Waste per capitaTotal Waste Generation Waste per capita
Data Source: Ministry of Environment, Japan
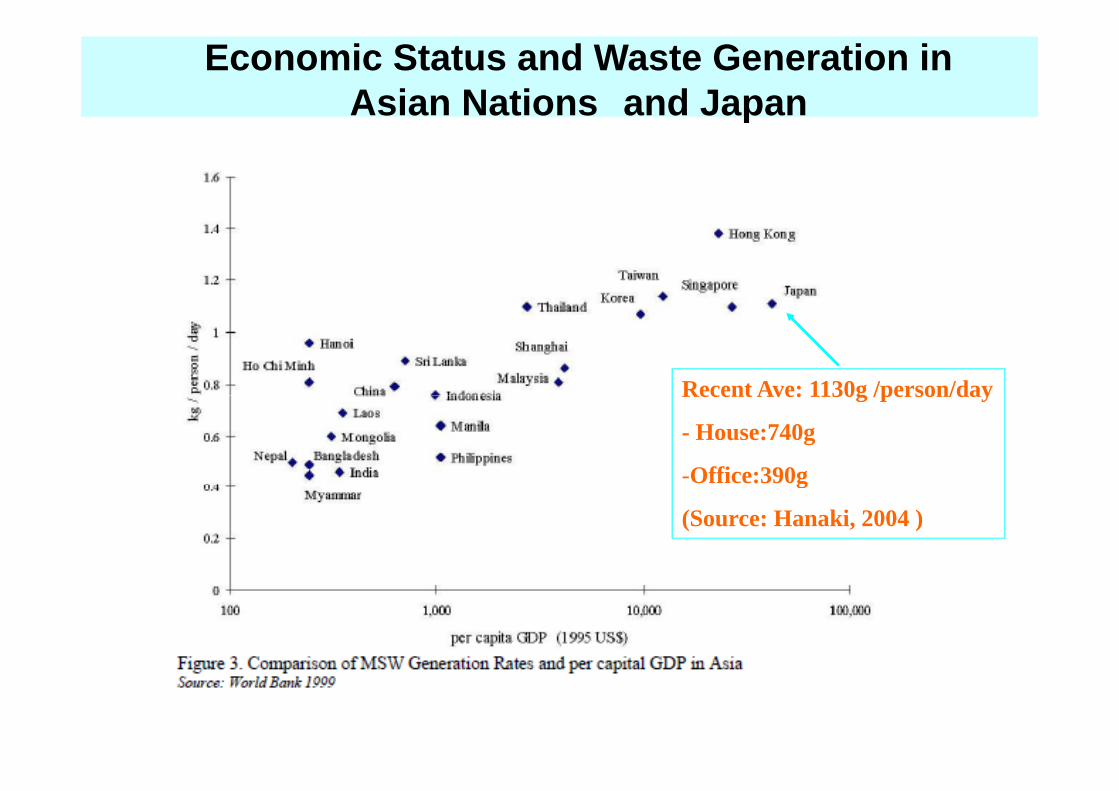
Economic Status and Waste Generation in Asian Nations and Japan
Recent Ave: 1130g /person/dayRecent Ave: 1130g /person/day
- House:740g
-Office:390gg
(Source: Hanaki, 2004 )
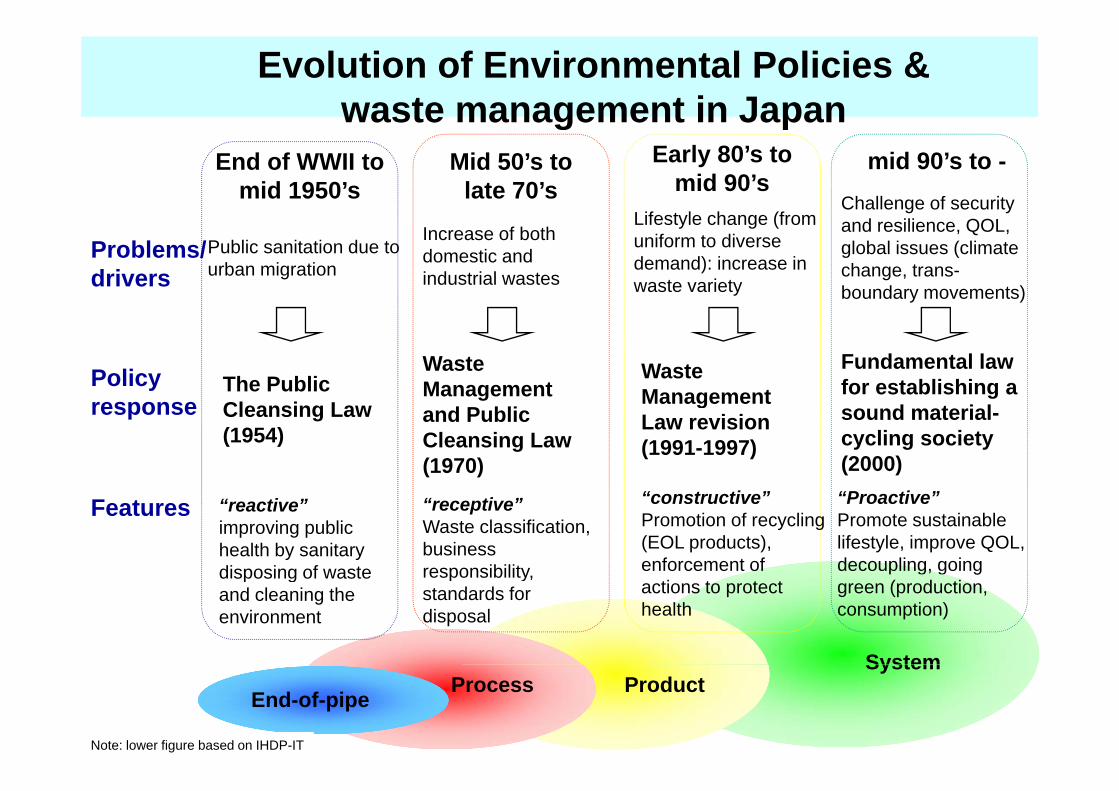
Evolution of Environmental Policies & waste management in Japang p
End of WWII to mid 1950’s
Mid 50’s to late 70’s
Early 80’s to mid 90’s
Lifestyle change (from
mid 90’s to -Challenge of security
Public sanitation due to urban migration
Problems/drivers
Increase of both domestic and industrial wastes
Lifestyle change (from uniform to diverse demand): increase in waste variety
and resilience, QOL, global issues (climate change, trans-boundary movements)
The Public Policy Waste Management
Waste Management
Fundamental law for establishing a
Cleansing Law (1954)
responseManagement and Public Cleansing Law (1970)
Management Law revision (1991-1997)
gsound material-cycling society (2000)
Features “reactive”improving public health by sanitary disposing of waste
“receptive”Waste classification, business responsibility
“constructive”Promotion of recycling (EOL products), enforcement of
“Proactive”Promote sustainable lifestyle, improve QOL, decoupling, going
System
disposing of waste and cleaning the environment
responsibility, standards for disposal
actions to protect health
green (production, consumption)
End-of-pipeProcess Product
System
Note: lower figure based on IHDP-IT
Reliance on Incinerators and Dioxin problemsType and number of incinerators
2000
2500
rato
rs
500
1000
1500um
ber o
f inc
iner
Types of Incineration facilities had changed
0
500
1974 1977 1980 1983 1986 1989 1992 1995 1998 2001 2004
Year
Nu facilities had changed.
Fixed batch Computed batch Semi Continuous Continuous
Dioxin emission trends1500
7500Q/y
ear)
5000
1500
1100690 555
3000
4500
6000
emis
sion
(g-T
E
Dioxin emission has 5000
1550 1350 1019 81271 64 62370
265 74 69 73
690 555 533
0
1500
19971998
19992000
20012002
20032004
2005
Dio
xin
e
reduced drastically.
7 8 9 0 1 2 3 4 5Year
Domestic waste incineration Industrial waste incineration
Data source: Ministry of Environment of Japan http://www.env.go.jp/doc/toukei/contents/index.html
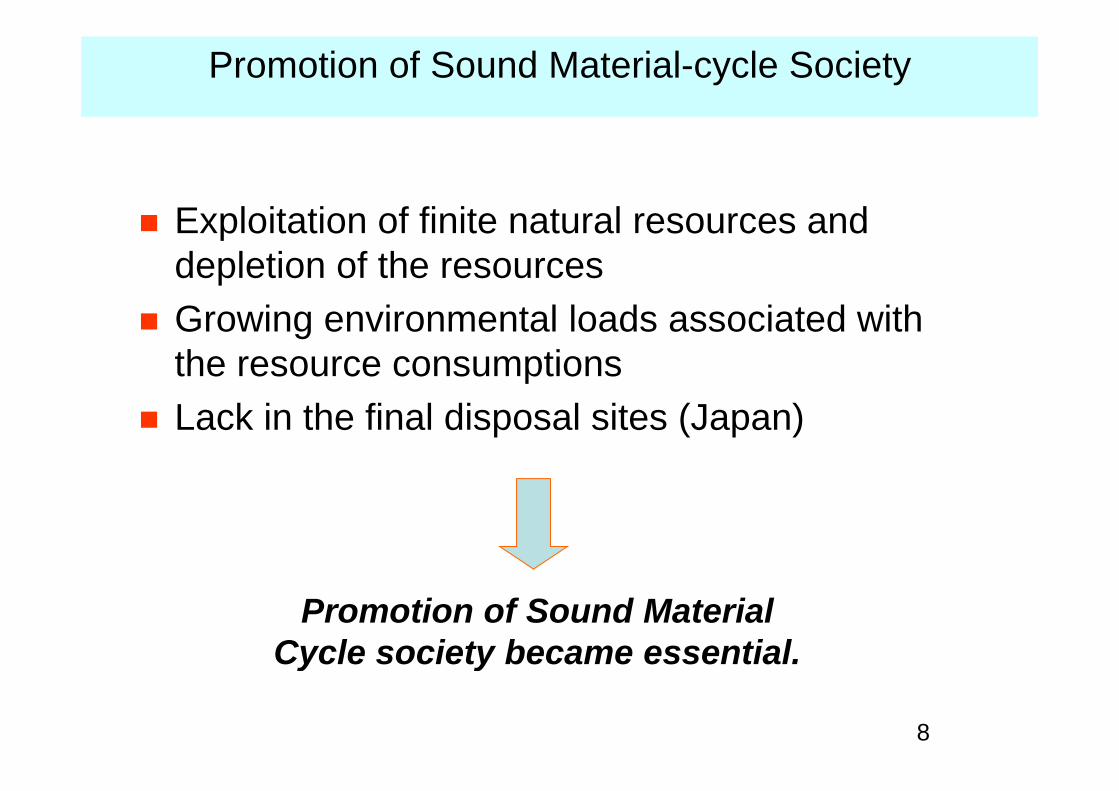
Promotion of Sound Material-cycle Society
Exploitation of finite natural resources and Exploitation of finite natural resources and depletion of the resources G i i t l l d i t d ith Growing environmental loads associated with the resource consumptions
Lack in the final disposal sites (Japan)
Promotion of Sound Material Cycle society became essential.
8
y y
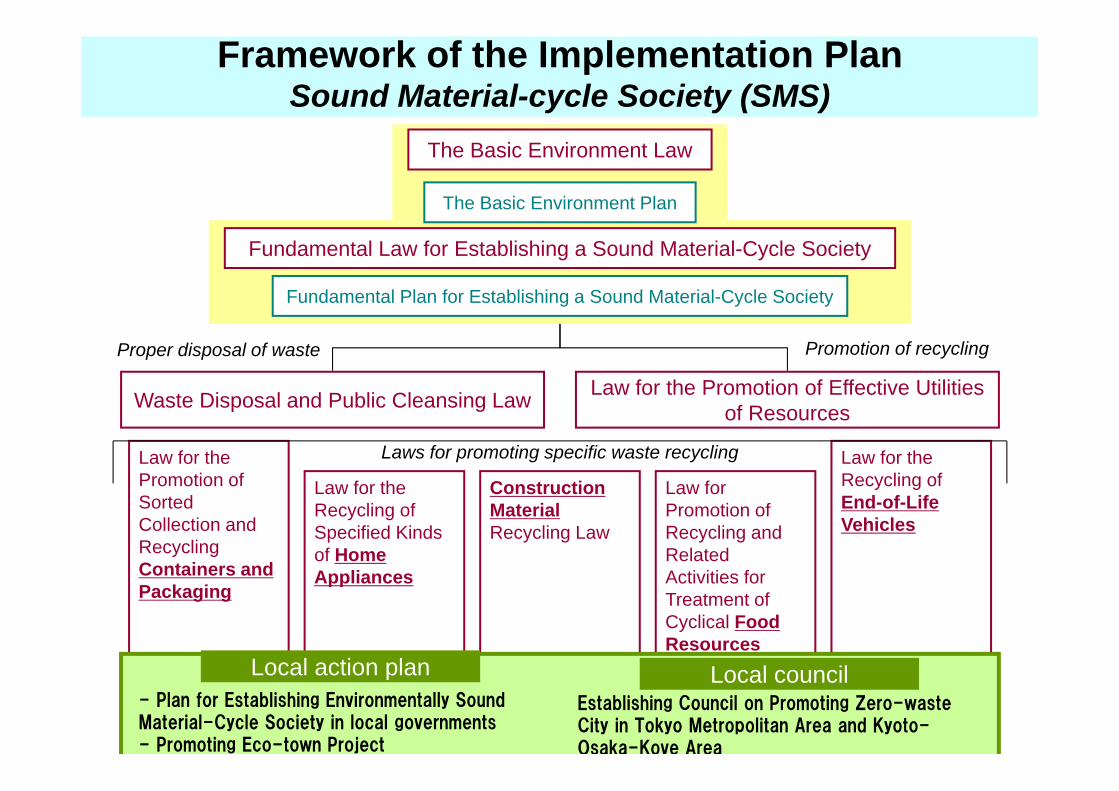
Framework of the Implementation PlanSound Material-cycle Society (SMS)
The Basic Environment Law
The Basic Environment Plan
Fundamental Law for Establishing a Sound Material-Cycle Society
Fundamental Plan for Establishing a Sound Material-Cycle Societyg y y
W t Di l d P bli Cl i L Law for the Promotion of Effective Utilities
Proper disposal of waste Promotion of recycling
Waste Disposal and Public Cleansing Law of Resources
Law for the Promotion of
Law for the Recycling ofLaw for the Law forConstruction
Laws for promoting specific waste recycling Promotion of Sorted Collection and Recycling Containers and
Recycling of End-of-Life Vehicles
Law for the Recycling of Specified Kinds of Home Appliances
Law for Promotion of Recycling and Related Activities for
Construction MaterialRecycling Law
Containers and Packaging
Appliances Activities for Treatment of Cyclical Food Resources
Local action planLaw Concerning the Promotion of Procurement of Eco-Friendly Goods and Services by the State and
Other EntitiesEstablishing Council on Promoting Zero-waste City in Tokyo Metropolitan Area and Kyoto-Osaka-Kove Area
Local action plan- Plan for Establishing Environmentally Sound Material-Cycle Society in local governments - Promoting Eco-town Project
Local council
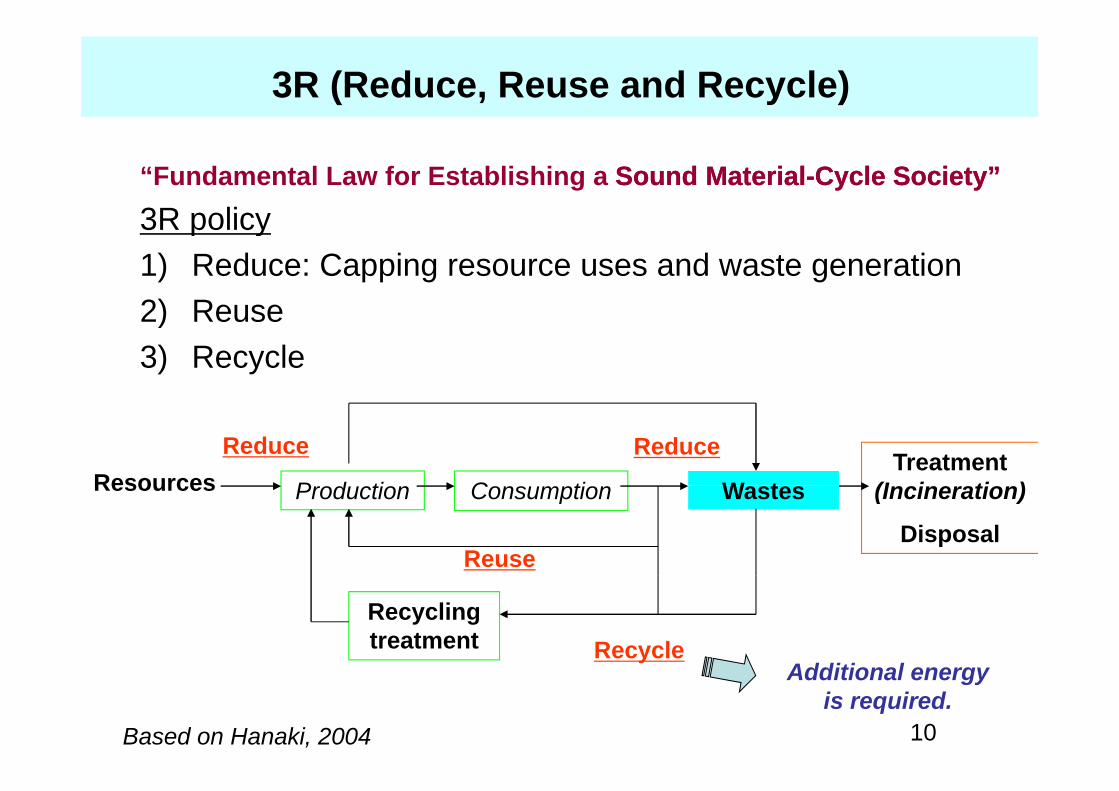
3R (Reduce, Reuse and Recycle)
“Fundamental Law for Establishing a Sound MaterialSound Material--Cycle Society”Cycle Society”3R policy3R policy1) Reduce: Capping resource uses and waste generation 2) Reuse2) Reuse3) Recycle
P d ti C ti W tResourcesReduce Treatment
(I i ti )
Reduce
Production Consumption Wastes Resources (Incineration)
DisposalReuse
Recycling treatment Recycle
Additi l
10Based on Hanaki, 2004
Additional energy is required.
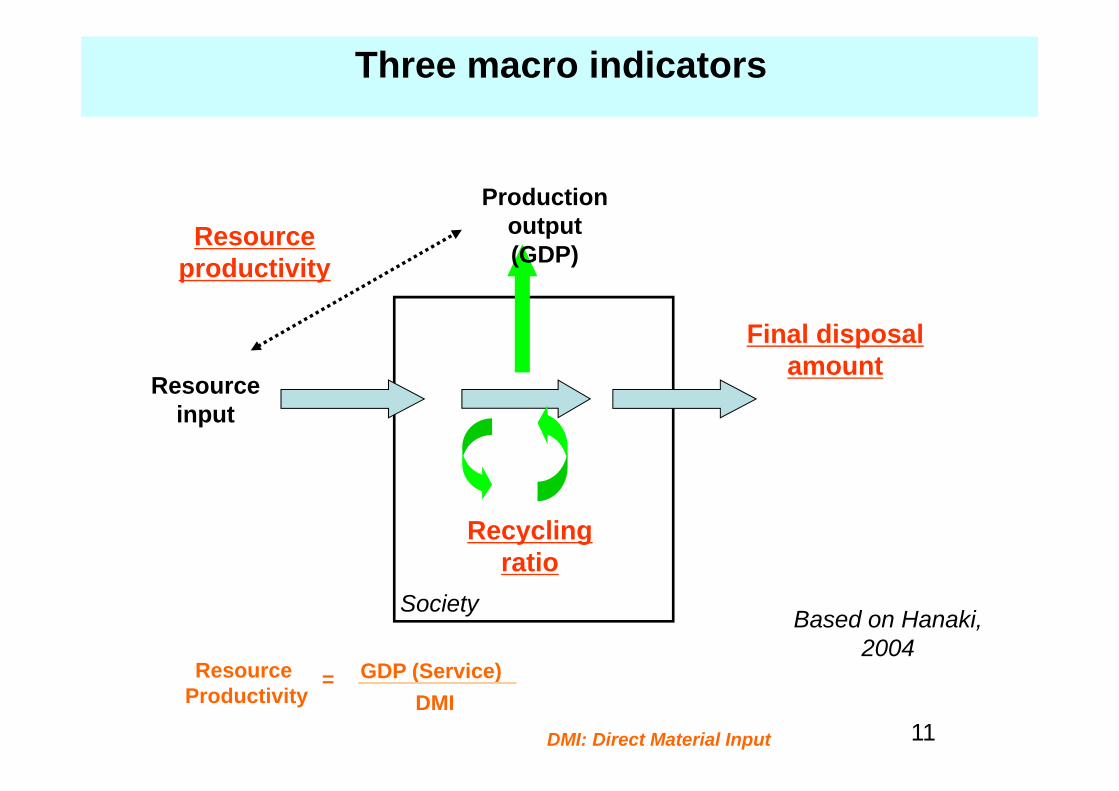
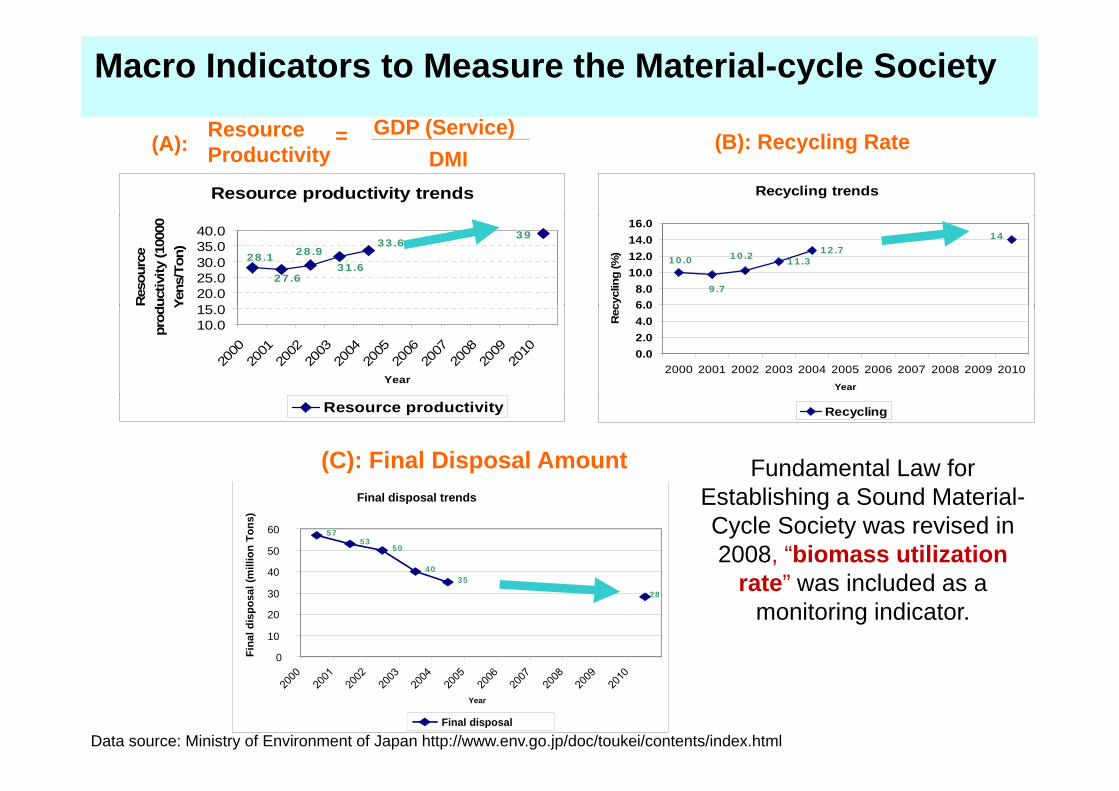
Three macro indicators
Production Resource
productivityoutput (GDP)
Final disposal amount
Resource input
Recycling ratio
Society Based on Hanaki, 2004
R GDP (S i )
11
Resource Productivity
GDP (Service)DMI
=
DMI: Direct Material Input
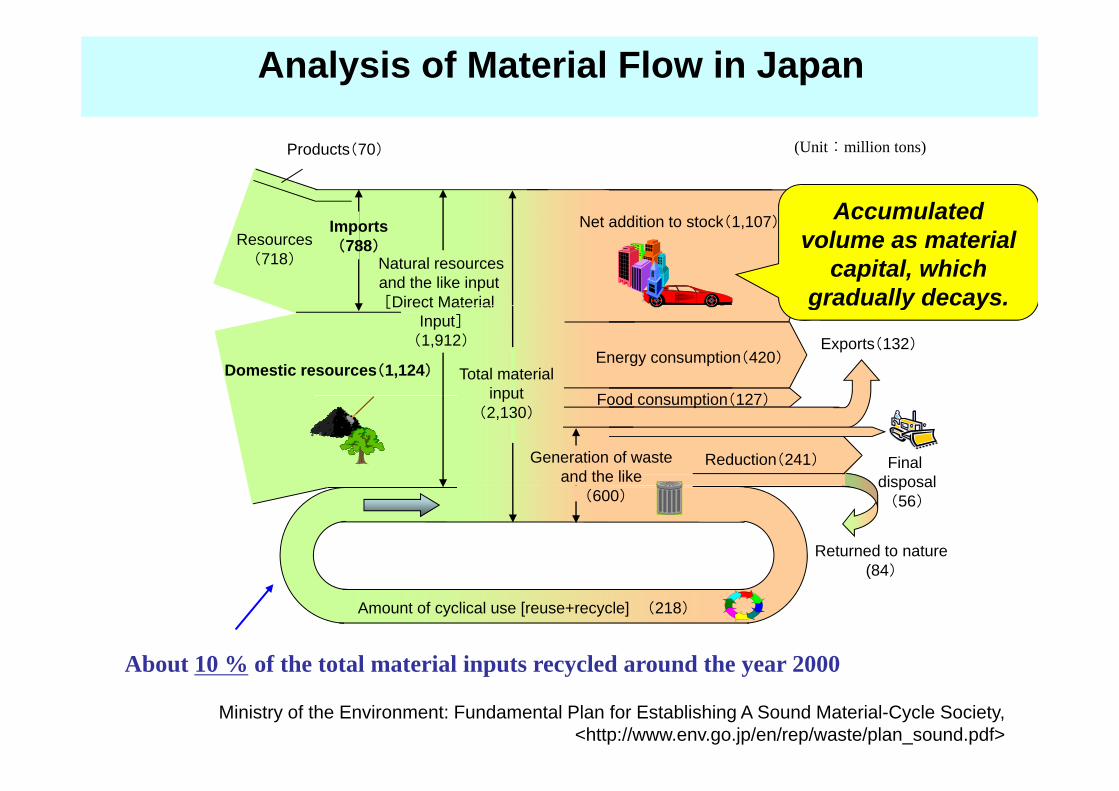
Analysis of Material Flow in Japan
(Unit:million tons)
N t dditi t t k(1 107)
Products(70)
AccumulatedNet addition to stock(1,107)Resources
(718) Natural resourcesand the like input [Direct Material
Imports(788)
Accumulated volume as material
capital, which gradually decays.
Domestic resources(1,124)
Exports(132)
[Direct Material Input]
(1,912)Energy consumption(420)
F d ti (127)
Total material input
g y y
Final disposal
Reduction(241)Generation of waste and the like
Food consumption(127)input(2,130)
Returned to nature(84)
disposal(56)(600)
(84)
Amount of cyclical use [reuse+recycle] (218)
About 10 % of the total material inputs recycled around the year 2000
Ministry of the Environment: Fundamental Plan for Establishing A Sound Material-Cycle Society,<http://www.env.go.jp/en/rep/waste/plan_sound.pdf>
About 10 % of the total material inputs recycled around the year 2000
Resource GDP (Service)
Macro Indicators to Measure the Material-cycle Society
Resource productivity trends
Resource Productivity
GDP (Service)DMI
=(A): (B): Recycling Rate
Recycling trends
33.6
31.628.9
39
27.6
28.1
15 020.025.030.035.040.0
Res
ourc
euc
tivity
(100
00Ye
ns/T
on)
11.312.7
14
10.2
9.7
10.0
6 08.0
10.012.014.016.0
cycl
ing
(%)
10.015.0
2000
2001
2002
2003
2004
2005
2006
2007
2008
2009
2010
Year
prod
Y
0.02.04.06.0
2000 2001 2002 2003 2004 2005 2006 2007 2008 2009 2010Year
Rec
Resource productivity
(C): Final Disposal Amount
Recycling
Fundamental Law for Final disposal trends
5753
50
4040
50
60
mill
ion
Tons
)
Establishing a Sound Material-Cycle Society was revised in 2008, “biomass utilization
t ” i l d d35
28
0
10
20
30
40
Fina
l dis
posa
l (m rate” was included as a
monitoring indicator.
Year
Final disposal
Data source: Ministry of Environment of Japan http://www.env.go.jp/doc/toukei/contents/index.html
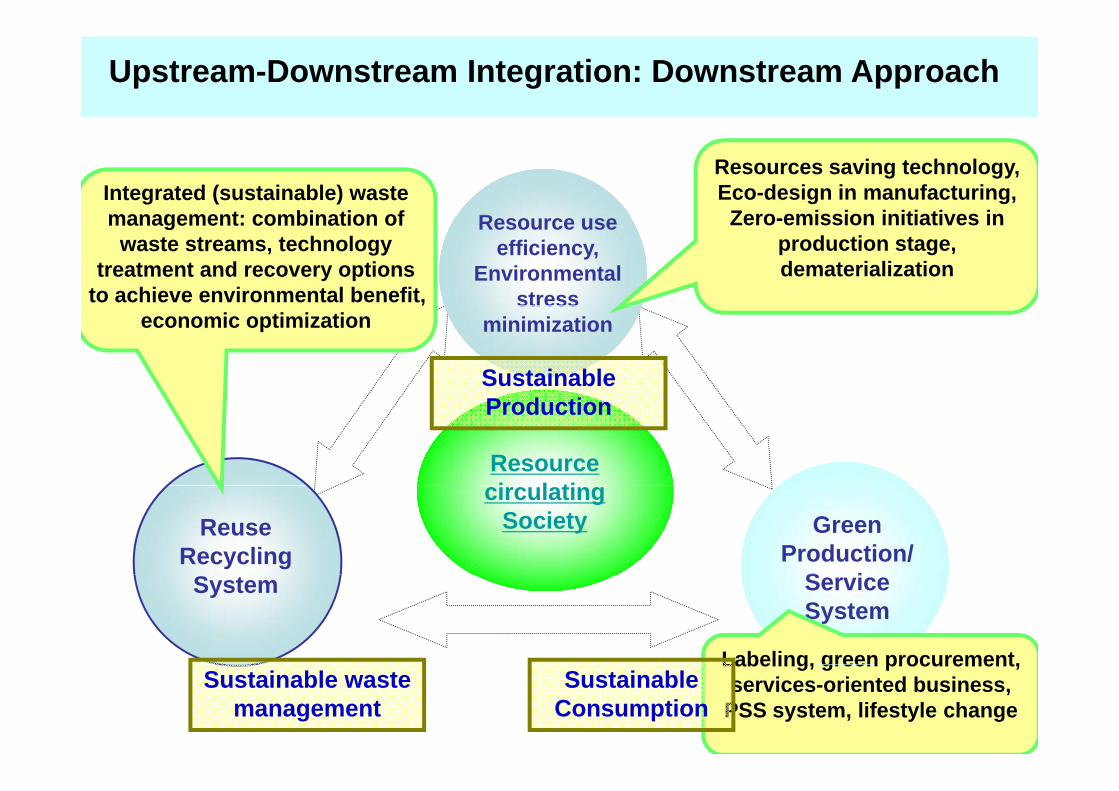
Upstream-Downstream Integration: Downstream Approach
R
Resources saving technology, Eco-design in manufacturing,
Zero emission initiatives inIntegrated (sustainable) waste management: combination of Resource use
efficiency,Environmental
stress
Zero-emission initiatives in production stage, dematerialization
management: combination of waste streams, technology
treatment and recovery options to achieve environmental benefit, stress
minimization
Sustainable
economic optimization
Resource i l ti
Production
circulating Society Green
Production/S i
ReuseRecycling
ServiceSystem
System
Labeling, green procurement,Labeling, green procurement, services-oriented business,
PSS system, lifestyle changeSustainable waste
managementSustainable
Consumption
A summary and discussion – part 1
Historically, three main characteristics of J t t b dJapanese wastes managements are observed:
1) Reliance on incineration as a means to reduce waste volumevolume,
2) Material recycling with ambitious recycling targets for specific wastes,wastes,
3) An integral resource management approach that stresses not only energy and material recovery but also an increase in resource productivity.
A comprehensive sets of indicator systems with effective monitoring systems shall be further g yneeded to shift the society towards sustainability
2 Bi t tili ti t d2. Biomass wastes utilization towards a new perspective for waste management and low
b i t f l dcarbon society – a case of sewage sludge
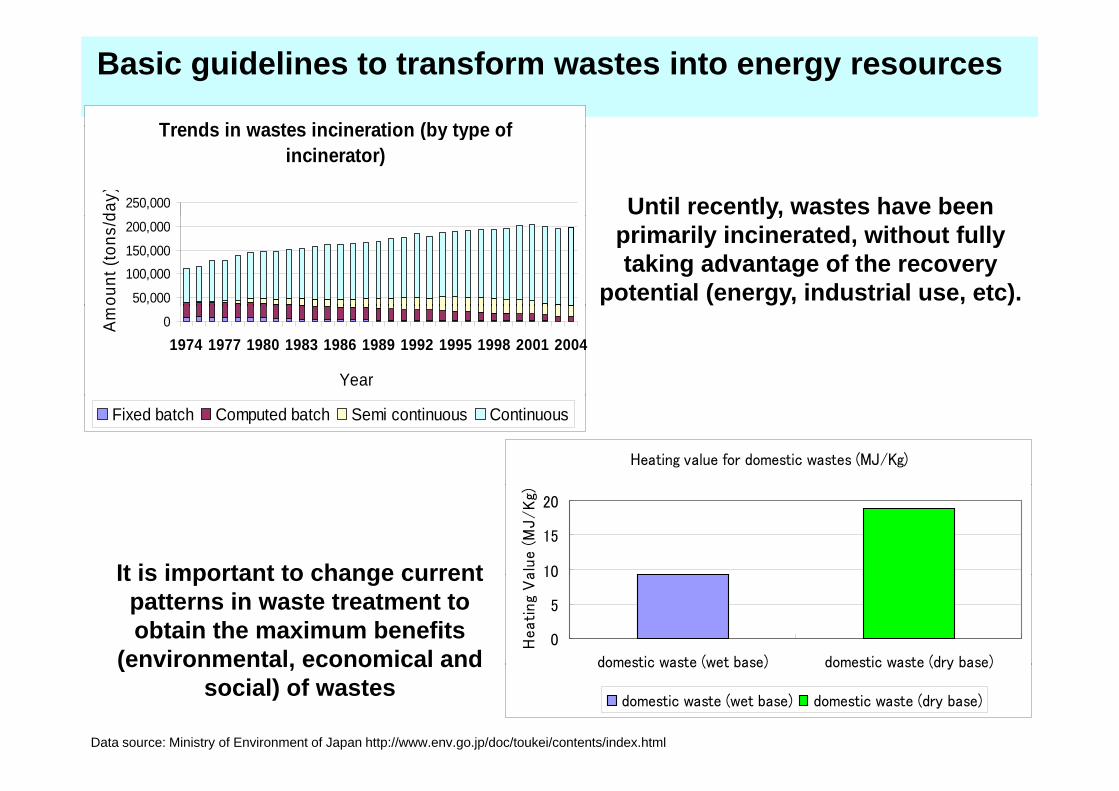
Trends in wastes incineration (by type of
Basic guidelines to transform wastes into energy resources
Trends in wastes incineration (by type ofincinerator)
250,000
day) Until recently, wastes have been
50,000
100,000150,000
200,000
ount
(ton
s/d y,
primarily incinerated, without fully taking advantage of the recovery
potential (energy, industrial use, etc).0
1974 1977 1980 1983 1986 1989 1992 1995 1998 2001 2004
Year
Am
Fixed batch Computed batch Semi continuous Continuous
Heating value for domestic wastes (MJ/Kg)
It is important to change current 10
15
20
alu
e (
MJ
/K
g)
It is important to change current patterns in waste treatment to obtain the maximum benefits
(environmental, economical and0
5
10
domestic waste (wet base) domestic waste (dry base)
Heati
ng
Va
Data source: Ministry of Environment of Japan http://www.env.go.jp/doc/toukei/contents/index.html
(environmental, economical and social) of wastes
domestic waste (wet base) domestic waste (dry base)
domestic waste (wet base) domestic waste (dry base)
Generation and Utilization of biomass in Japan, 2005
i lbiomass annual output state of utilization
10^4 tanimal manure
food waste
use non‐use x 10^4 ton
waste paper
Black liquor
ill id lsawmill residuals
wooden construction waste
forestland residuals
sewage sludge
non‐eatable organicsg
Source: MAFF
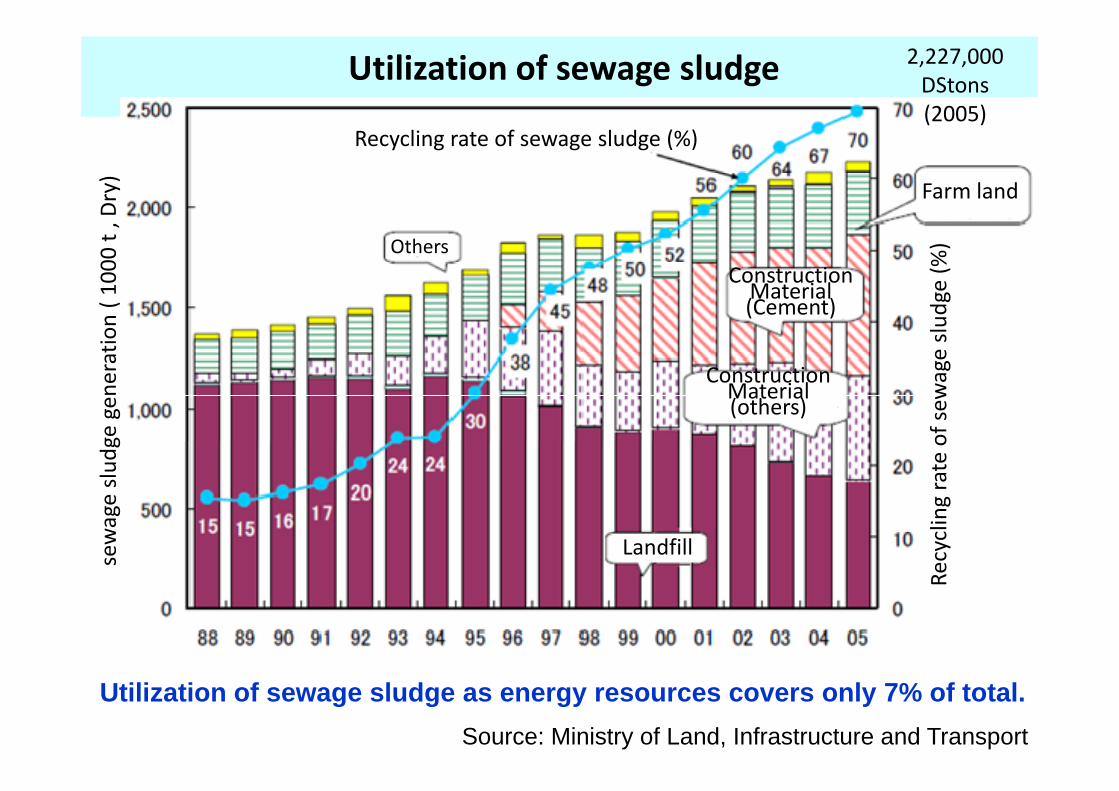
Utilization of sewage sludge 2,227,000DStons(2005)
Recycling rate of sewage sludge (%)Dry)
Farm land
dge (%
)
( 1000 t ,
ConstructionMaterial(Cement)
Others
wage slud
neratio
n ( (Cement)
ConstructionMaterial
rate of sew
slud
ge ge Material
(others)
Recycling r
sewage s
Landfill
R
Source: Ministry of Land, Infrastructure and Transport
Utilization of sewage sludge as energy resources covers only 7% of total.
Energy conversion technologies of biomass
aerobic decomposition (compost)microbial process
Bio chemical
alcohol fermentation ethanol
Waste
methane fermentation methane
Wastebiomass combustion heat、power
Thermo gasification
pyrolysis coal, oil
gaschemical
gasification
liquefaction
gas
oilphysicochemicalp yyellow-colored technologies are related to sewage sludge.
Dr. Yoshida. N (2009)
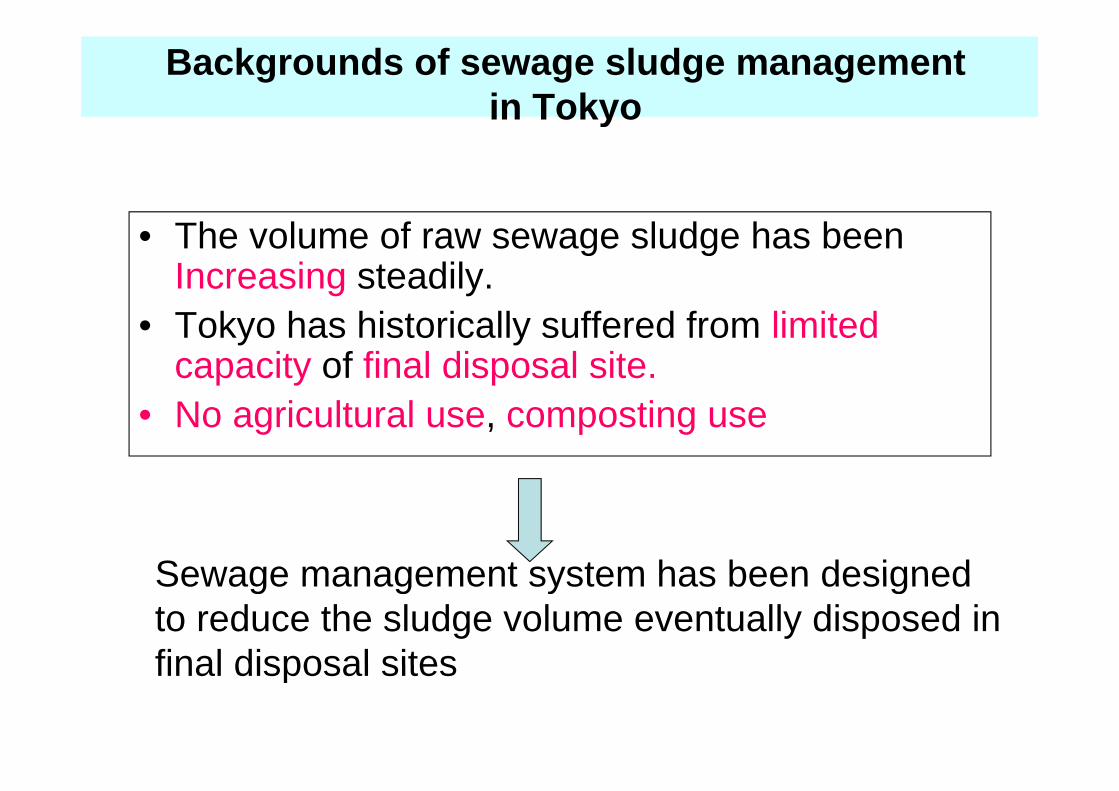
Backgrounds of sewage sludge management in Tokyoy
• The volume of raw sewage sludge has been Increasing steadily.
• Tokyo has historically suffered from limited capacity of final disposal site.
• No agricultural use, composting use
Sewage management system has been designedSewage management system has been designed to reduce the sludge volume eventually disposed in final disposal sitesfinal disposal sites
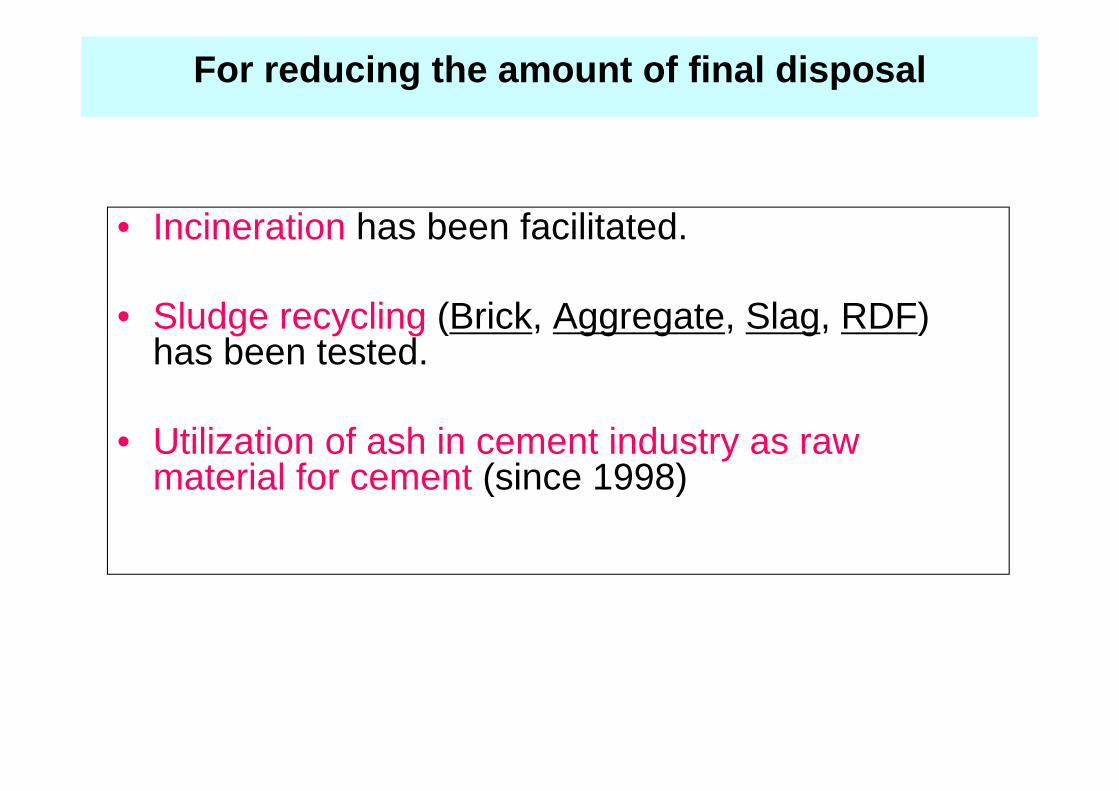
For reducing the amount of final disposal
I i ti h b f ilit t d• Incineration has been facilitated.
Sl d li (B i k A t Sl RDF)• Sludge recycling (Brick, Aggregate, Slag, RDF) has been tested.
• Utilization of ash in cement industry as raw material for cement (since 1998)material for cement (since 1998)
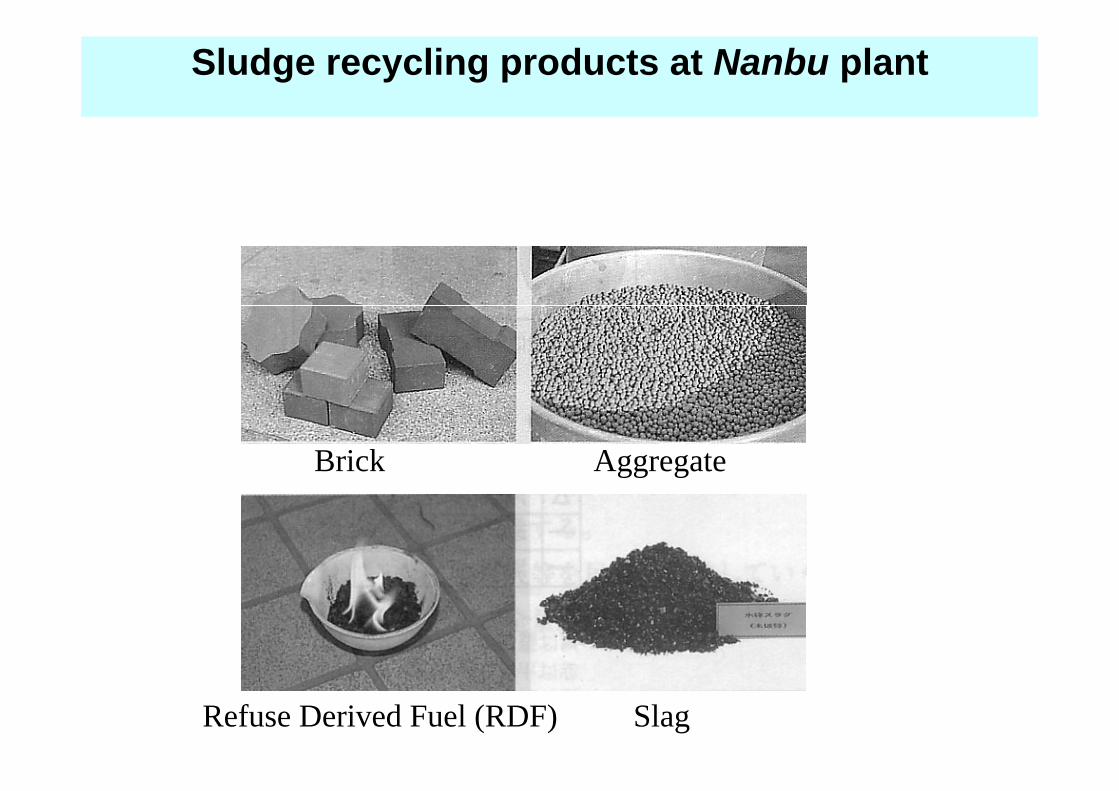
Sludge recycling products at Nanbu plant
Brick Aggregate
Refuse Derived Fuel (RDF) Slag
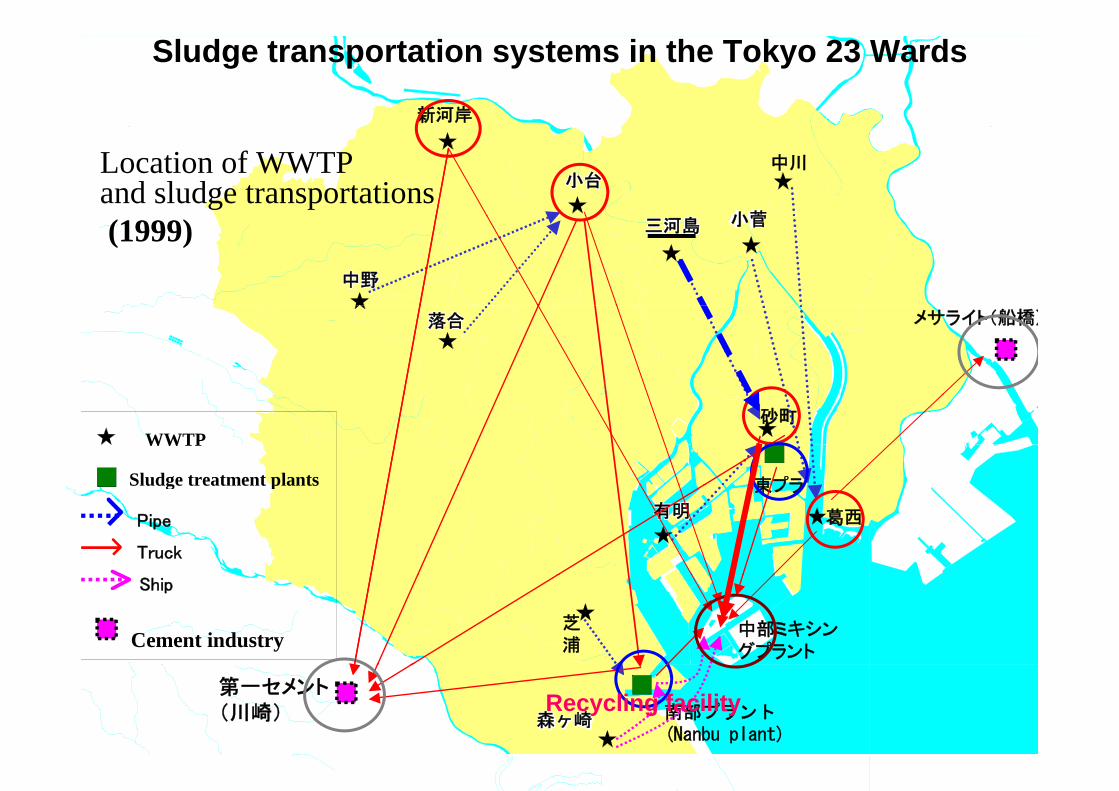
新河岸
Sludge transportation systems in the Tokyo 23 Wards
小台小台小台小台小台小台小台小台小台中川
小菅小菅小菅小菅小菅小菅小菅小菅小菅島島島
Location of WWTPand sludge transportations
小菅小菅小菅小菅小菅小菅小菅小菅小菅 三河島三河島三河島三河島三河島三河島三河島三河島三河島
中野中野中野中野中野中野中野中野中野
(1999)
落合落合落合落合落合落合落合落合落合 メサライト(船橋)
砂町 WWTP
Sludge treatment plants 東プラ
有明有明有明有明有明有明有明
Sludge treatment plants
Pipe
Truck
葛西
東プラ
Ship
中部ミキシングプラント
芝浦Cement industry
南部プラント(Nanbu plant)
森ヶ崎森ヶ崎森ヶ崎森ヶ崎森ヶ崎森ヶ崎森ヶ崎森ヶ崎森ヶ崎
第一セメント(川崎) Recycling facility
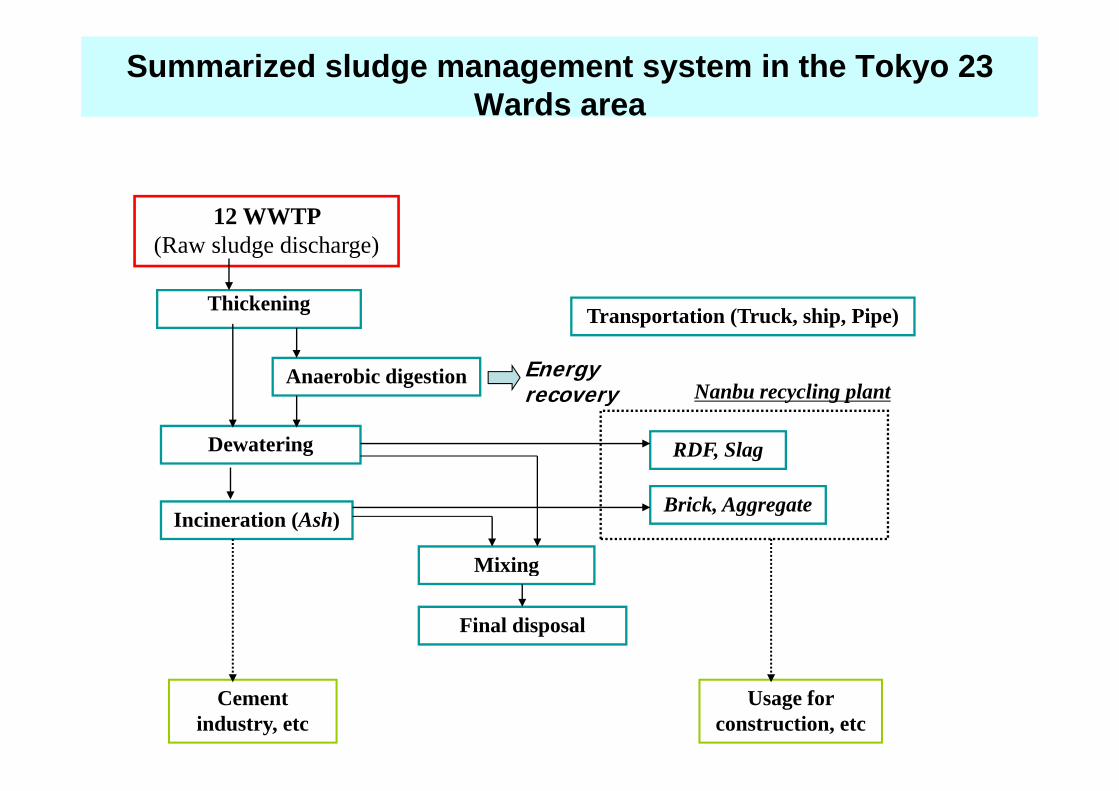
Summarized sludge management system in the Tokyo 23 Wards area
12 WWTP
Thickening
12 WWTP (Raw sludge discharge)
Thickening
Anaerobic digestion
Transportation (Truck, ship, Pipe)
Nanbu recycling plantEnergy recovery
Dewatering RDF, Slag
Nanbu recycling plantrecovery
Incineration (Ash)Brick, Aggregate
Mixingg
Final disposal
Cement industry, etc
Usage for construction, etc
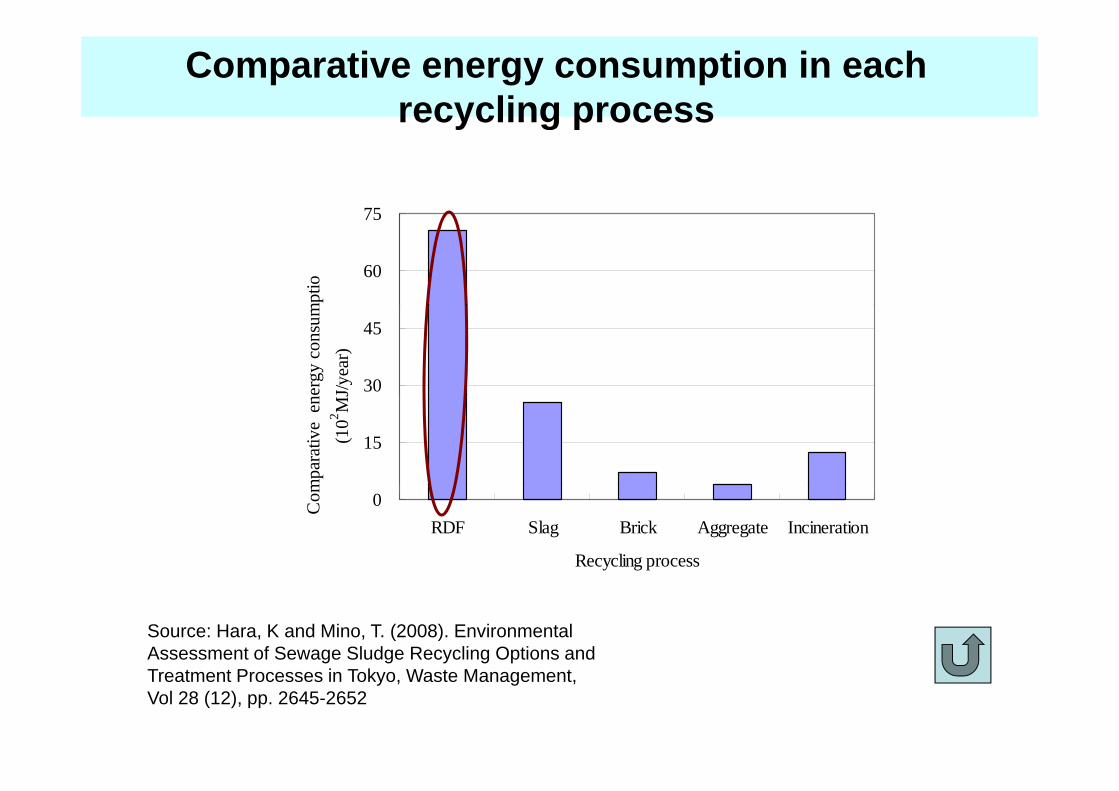
Comparative energy consumption in each recycling processy g p
75
60
75
mpt
io
30
45er
gy c
onsu
mJ/y
ear)
15
mpa
rativ
e e
n(1
02 MJ
0RDF Slag Brick Aggregate Incineration
Recycling process
Com
Source: Hara, K and Mino, T. (2008). Environmental Assessment of Sewage Sludge Recycling Options and Treatment Processes in Tokyo, Waste Management, Vol 28 (12), pp. 2645-2652
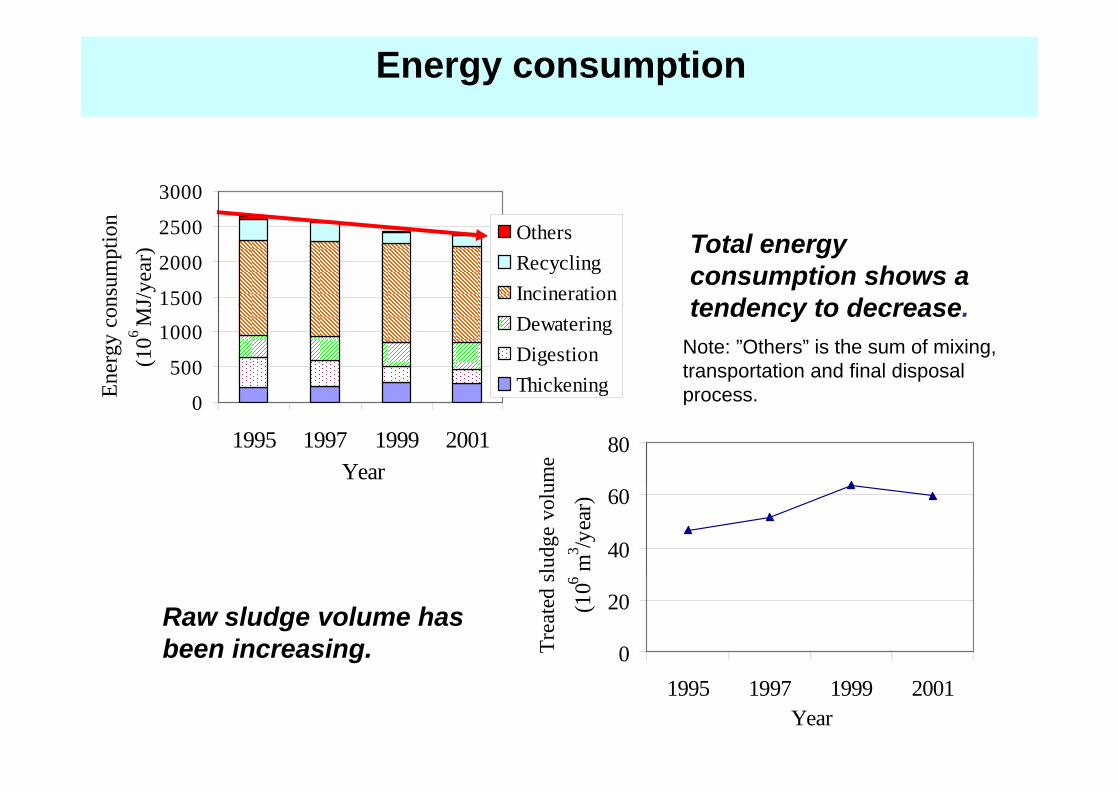
Energy consumption
3000
n
1500
2000
2500
nsum
ptio
nJ/
year
)
OthersRecyclingIncineration
Total energy consumption shows a tendency to decrease
500
1000
Ener
gy c
on(1
06 M
J
DewateringDigestionThickening
Note: ”Others” is the sum of mixing, transportation and final disposal process
tendency to decrease.
0
1995 1997 1999 2001Year
E g process.
80
ume
40
60
slud
ge v
olu
m3 /y
ear)
0
20
Trea
ted
s
(106
Raw sludge volume has been increasing.
1995 1997 1999 2001Year
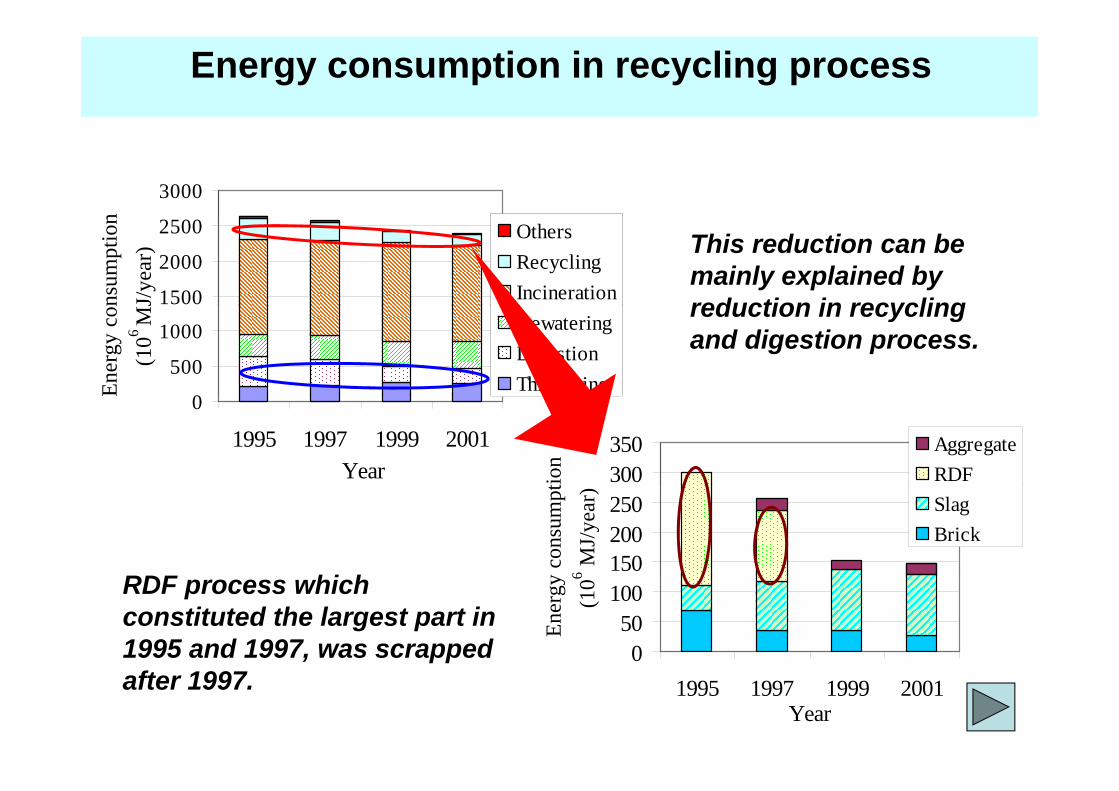
Energy consumption in recycling process
3000
n
1500
2000
2500
nsum
ptio
nJ/
year
)
OthersRecyclingIncineration
This reduction can be mainly explained by reduction in recycling
0
500
1000
Ener
gy c
on(1
06 M
J
DewateringDigestionThickening
reduction in recycling and digestion process.
0
1995 1997 1999 2001Year
E
300350
tion
AggregateRDF
150200250
y co
nsum
pt6 M
J/ye
ar)
SlagBrick
RDF hi h
050
100
Ener
gy (106RDF process which
constituted the largest part in 1995 and 1997, was scrapped
1995 1997 1999 2001Year
after 1997.
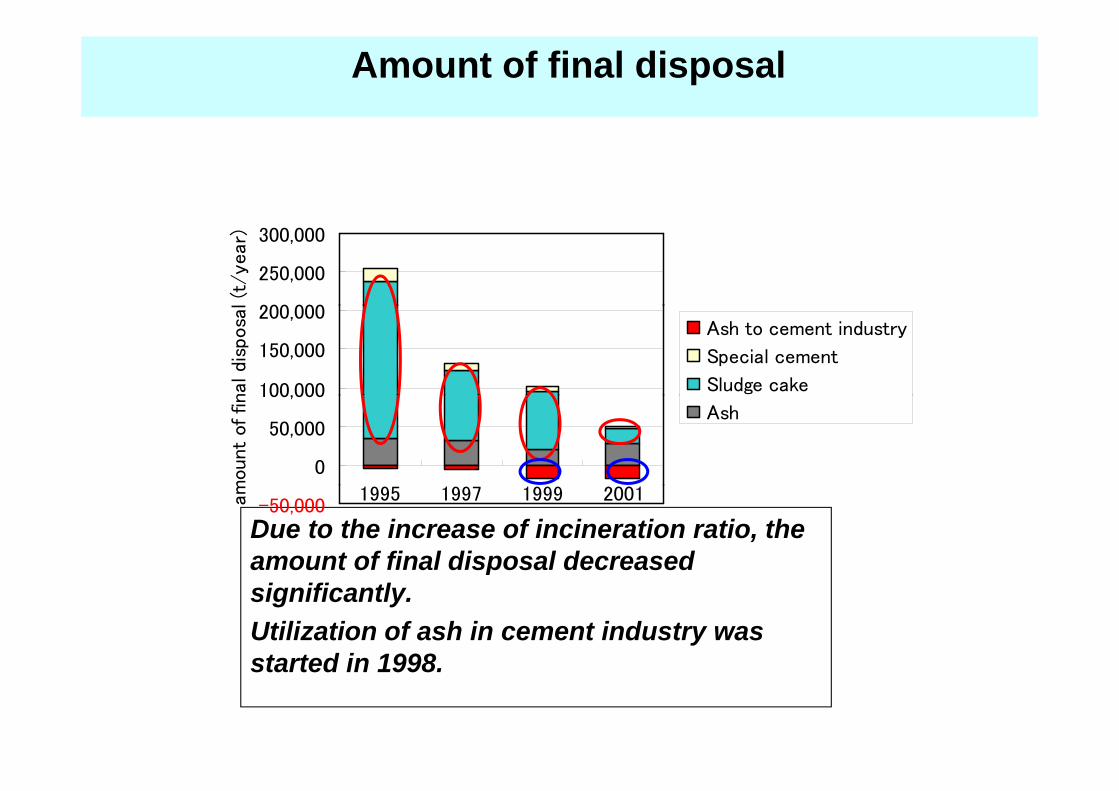
Amount of final disposal
200 000
250,000
300,000l (t
/ye
ar)
100,000
150,000
200,000
nal di
sposa
l
Ash to cement industry
Special cement
Sludge cake
0
50,000
100,000
mou
nt
of fin
Ash
Due to the increase of incineration ratio, the amount of final disposal decreased
-50,0001995 1997 1999 2001am
significantly.Utilization of ash in cement industry was started in 1998started in 1998.
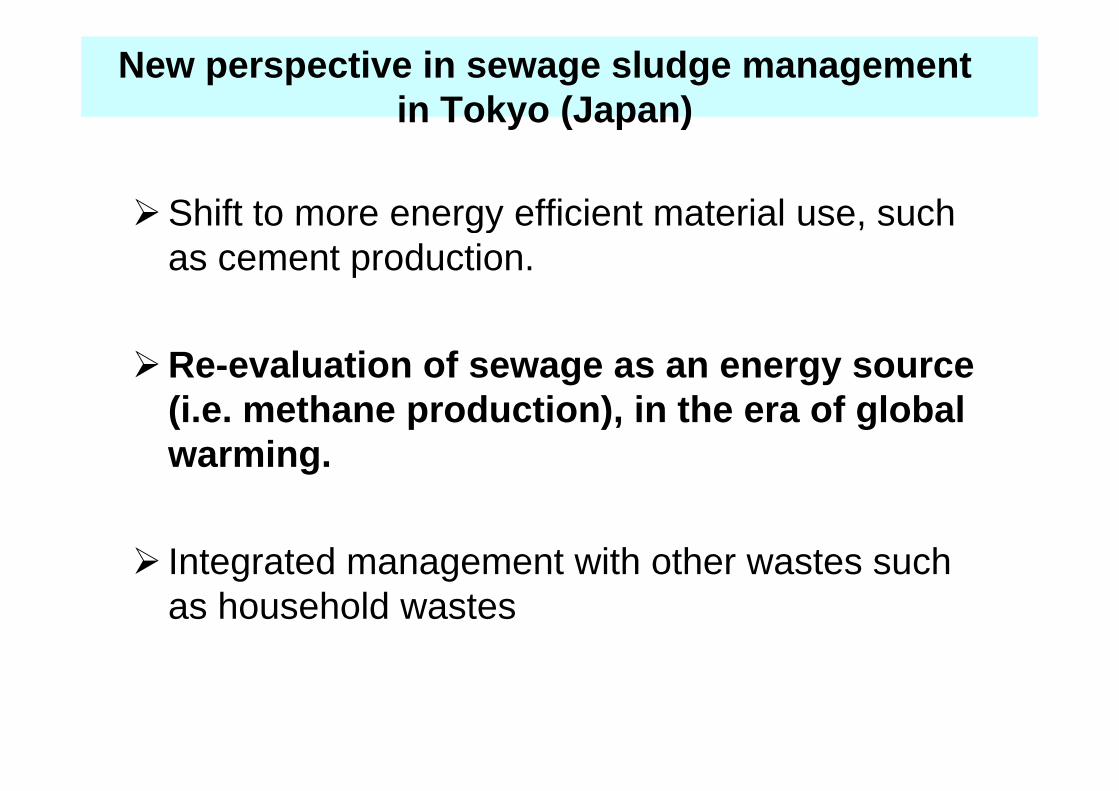
New perspective in sewage sludge management in Tokyo (Japan)y ( p )
Shift to more energy efficient material use suchShift to more energy efficient material use, such as cement production.
Re-evaluation of sewage as an energy source (i h d i ) i h f l b l(i.e. methane production), in the era of global warming.
Integrated management with other wastes such g gas household wastes
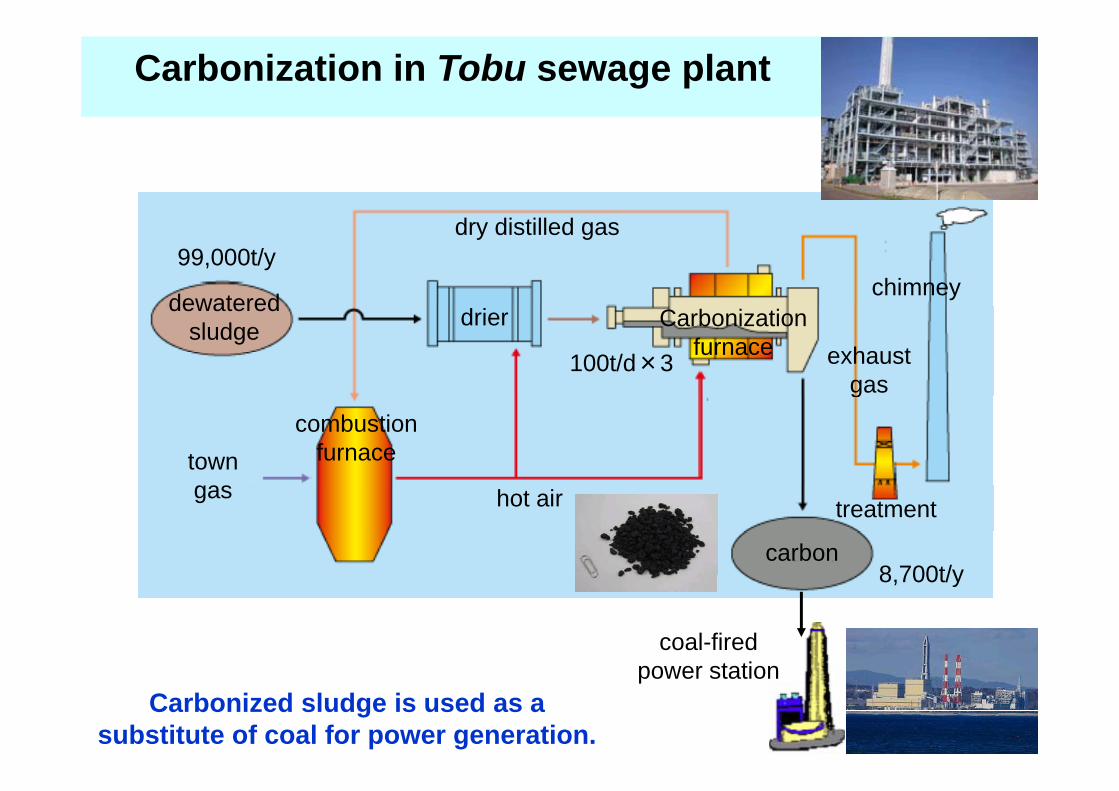
Carbonization in Tobu sewage plant
dewatered
dry distilled gas
chimney99,000t/y
dewatered sludge drier Carbonization
furnace exhaust gas
100t/d×3
town combustion
furnace
g
gas hot air
carbon
treatment
8 700t/y
coal-firedt ti
8,700t/y
power stationCarbonized sludge is used as a
substitute of coal for power generation.
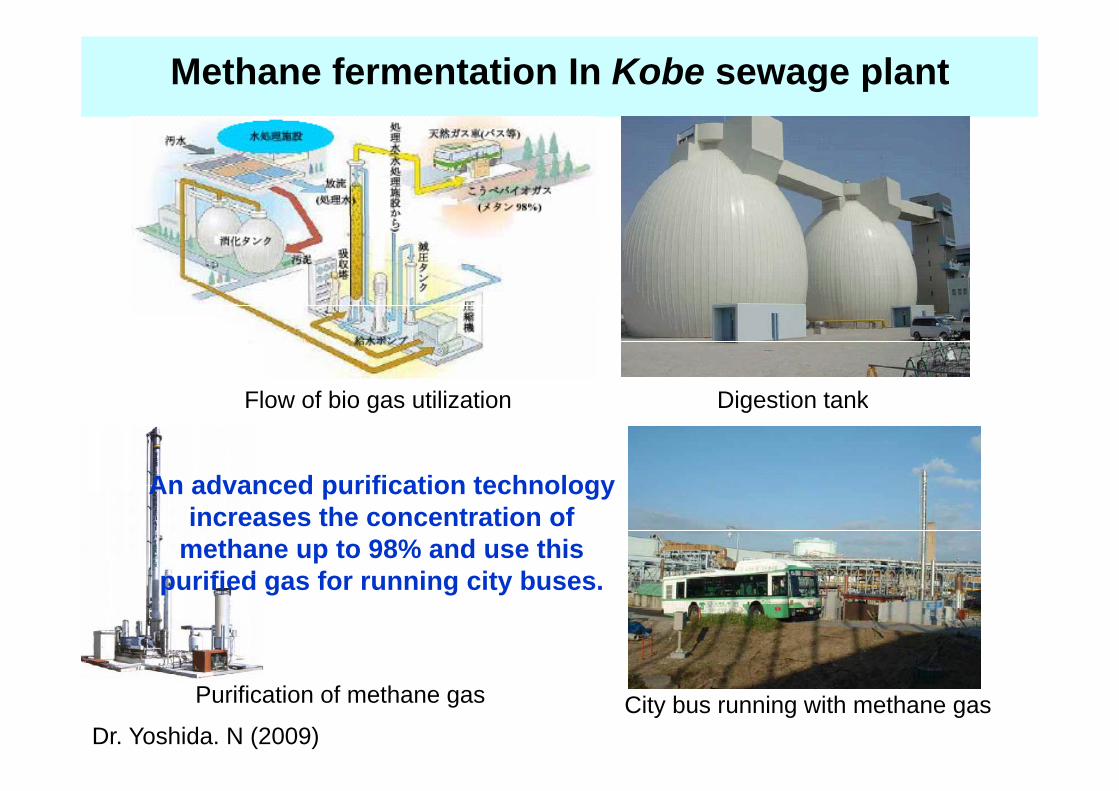
Methane fermentation In Kobe sewage plant
Flow of bio gas utilization Digestion tankFlow of bio gas utilization Digestion tank
An advanced purification technologyAn advanced purification technology increases the concentration of
methane up to 98% and use this ifi d f i it bpurified gas for running city buses.
Purification of methane gas City bus running with methane gasDr. Yoshida. N (2009)
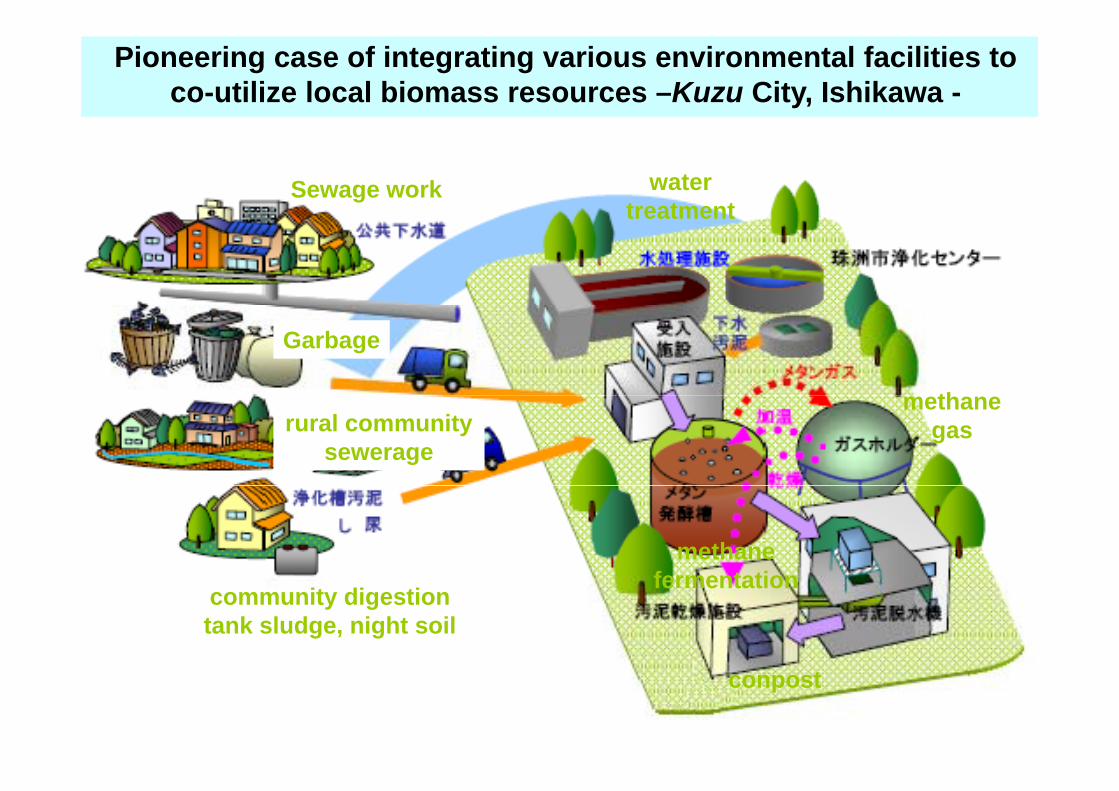
Pioneering case of integrating various environmental facilities to co-utilize local biomass resources –Kuzu City, Ishikawa -
Sewage work water treatmenttreatment
Garbage
thrural community
sewerage
methane gas
methane f t ti
community digestion tank sludge, night soil
fermentation
conpost
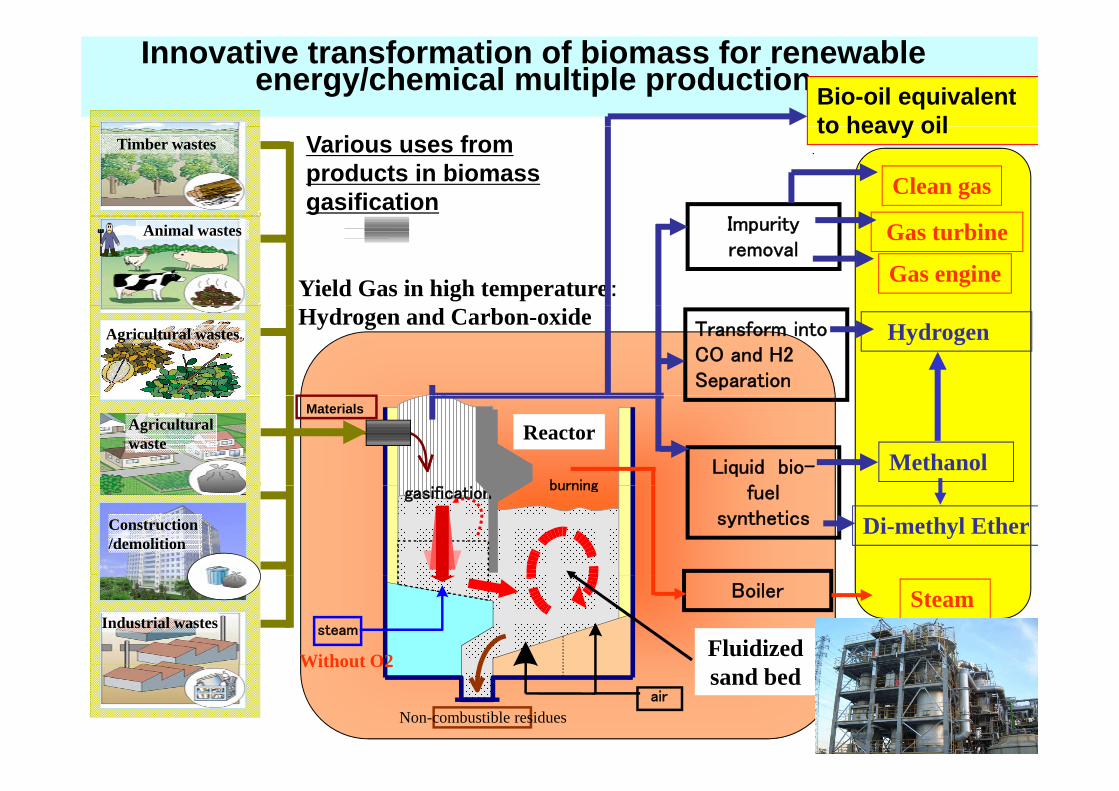
Innovative transformation of biomass for renewable energy/chemical multiple production Bio-oil equivalent
to heavy oilTimber wastes
Clean gas
to heavy oilVarious uses from products in biomass gasification
Gas turbine
Gas engine
Impurity removal
Yield Gas in high temperature:
Animal wastes
HydrogenTransform into CO and H2 Separation
Hydrogen and Carbon-oxideAgricultural wastes
burning
Materials
ReactorMethanolLiquid bio-
f l
Agricultural waste
burninggasification
Di-methyl Etherfuel
syntheticsConstruction /demolition
steam
Without O2
Boiler Steam
Fluidized Industrial wastes
air
Non-combustible residues
Without O2sand bed
A summary and discussion – part 2
Utili ti f bi i b d l iUtilization of biomass in urban and rural areas is an essential policy direction to develop a
t i bl i t ( ith d t i l lsustainable society (with sound-materials cycle society and low-carbon society, combined.)
Institutional designs for integrated approaches g g ppare indispensable in promoting biomass utilization.


![THE URGENT TRANSITION TO ENVIRONMENTAL SUSTAINABILITY · Title: Libya: The Urgent Transition to Environmental Sustainability, 152 pp. [For] The Environment General Authority, Tripoli,](https://img.pdfslide.us/doc/110x75/5ecd5cc45d54ef6f3c226366/the-urgent-transition-to-environmental-sustainability-title-libya-the-urgent-transition.jpg)