Embed Size (px)
Citation preview
PROFESSIONAL STAFF William G. Hamm-Legislative Analyst
John L. Vickerman-Chief Deputy Clinton M. Jordan-Deputy Arthur E. Buck, Jr.-Deputy
Willirun E. Behnk Donald W~ Benedict Richard W. Brandsma Kenneth A. Carter Ted Clement
Principal Program Analysts
Gerald Concklin Thomas Dooley Harold E. Geiogue Arthur Packenham
Gerald Beaver8-'-Principal Capital Outlay Analyst
Program Analysts .Glenn Allen John Baker Nicholas Bartsch Joan Bissell Neil Burraston Dale Claypoole James Cooney Robert A. DeiAgostino Willirun Grow Gary ,Kaiser
Craig Brown Phyllis Cadei Michael Corbett Maureen Fitzgerald Anne Frentz
John Goldman Robert Hesse Mary Jones
Anne Cowden Lesley Cummings James Ford Stephen Hathaway Elizabeth Hill Hadley Johnson, Jr. Nancy Ordway
Administrative Analysts
Wayne Keithley Richard A. Lee, Jr. Harry Osborne James Patterson William Rogers Thomas Tanner George Thomas Jon David Vasche John Woods
Charles Lieberman Robert McCleary Rudolph Marshall William Moseley Stephen Rhoads Peter Schaafsma Steven Schnaidt Stuart Schulz
Assistant Administrative Analysts
iii
David Perales Robert Plath Thomas Putnam Jeffrey Shellito Arnoldo Torres George White
LETTER OF TRANSMITTAL
925 L Street, Suite 650 Sacramento, California 95814 February 16, 1978
THE HONORABLE DENNIS E. CARPENTER, Chairman and Members of the Joint Legislative Budget Committee State Capitol, Sacramento
Gentlemen:
In accordance with the provisions of Government Code, Sections 9140-9143, and JOint Rule No. 37 of the Senate and Assembly, I submit for your consideration an analysis of the Budget Bill of the State of California for the fiscal year July 1, 1978, to June 30, 1979.
The purpose of this analysis is to assist the committee in performing its duties which are set forth in Joint Rule No. 37 as follows:
"It shall be the duty of the committee to ascertain facts and make recommendations to the Legislature andto the houses thereof concerning the state budget, the revenues and expenditures of the state, and of the organization and functions of the state, its departments, subdivisions and agencies, with a view of reducing the cost of the state government, and securing greater efficiency and economy."
I am grateful to the staff of the Department of Finance and to the other agencies of state government for their generous assistance in furnishing information necessary for this report.
v
Respectfully submitted,
WILLIAM G. HAMM Legislative Analyst
BUDGET OVERVIEW The Governor's Budget program for the State of California in fiscal year
1978-79 amounts to $26.6 billion. Of the total: • $16.2 billion is included in the regular budget, and covers expendi
tures from the General Fund, special funds, and bond funds. • $1.8 billion is "reserved" for property tax relief, low and moderate
income rental housing, energy conservation and development, and reforestation. These programs are not included in the regular budget because they require implementing legislation before they can become effective.
• $8.6 billion is from various federal government sources. Since the Governor's budget was submitted, the Director of Finance has
stated that only about $1.2 billion of the $1.8 billion reserved for new programs would be spent in 1978-79 if the programs are approved by the Legislature. Thus, total spending from state sources would be $17.4 billion -an increase of $2.4 billion, or 15.8 percent,over estimated expenditures from state sources in 1977-78.
Increases in General Fund expenditures are almost entirely responsible f~)r the increased spending from state sources. The proposed increase$2.5 billion or 21 percent-would be the second largest rate of increase in General Fund expenditures in 25 years. In fact the increase is larger than the total General Fund budget prior to 1965-66.
Changes in Budget Estimates
It is important to recognize that both expenditure and revenue estimates for a given fiscal year can change greatly between the time the Governor's Budget is submitted and the close of the fiscal year. Traditionally, the Governor's Budget is the low point in state expenditure projections. In 10 of the last 11 years, actual expenditures ,have turned out to be higher than the level called for in the budget as submitted. This is because:
• the administration and the Legislature normally add additional spending to the budget before it .becomes law.
• other financial legislation enacted subsequent to the Budget Bill usually increases state costs.
• increased expenditures invariably are authorized by the administration using the Emergency Fund, Sections 28 and 28.5 of the Budget Act, and Sections 16352 and 16409 of the California Government Code.
Anal.ysis of the Governor's Budget
Similarly, the revenue estimates contained in the Governor's Budget tend to be lower than actual revenues. This has been the case in nine of the last 11 years.
In this Analysis, we have continued the practice of carefully examining each program and recommending reductions where we think they can appropriately be made. We believe our recommendations will maintain the levels of service required to achieve the basic objectives of the budget even though many program reductions are included. We have also recommended augmentations for those programs where we feel legislative intent, inflation or workload elements were not sufficiently recognized in
A-I
the budget. No attempt was made to tailor these recommended reductions and augmentations to achieve a specific overall spending level.
A number of. significant program expansions and new programs proposed by the administration have not been adequately defined or described. As a consequence, they cannot be properly evaluated at this time. This is particularly true of the new programs for which $1.8 billion has been reserved, and the increases in the mental health area. Supplemental reports analyzing these proposals will be submitted when information on them has been received and reviewed.
General Fund Surplus
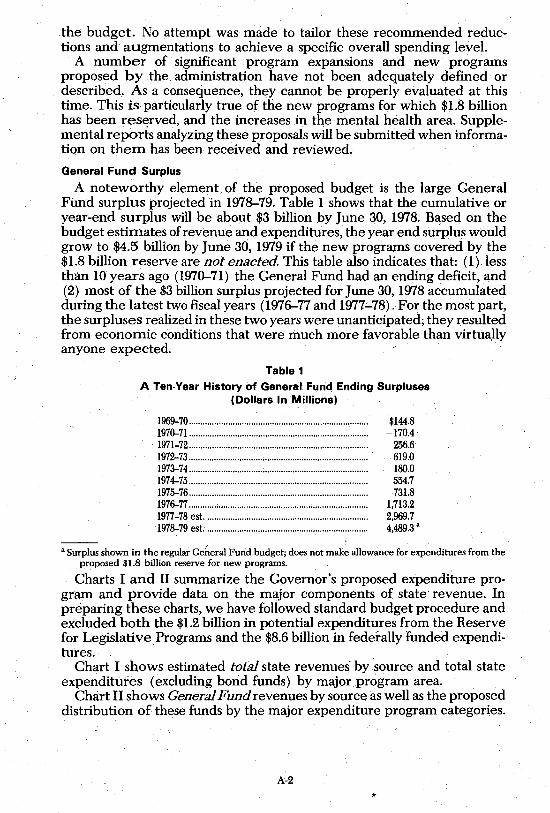
A noteworthy element of the proposed budget is the large General Fund surplus projected in 1978-79. Table 1 shows that the cumulative. or year-end surplus will be about $3 billion by June 30, 1978. Based on the budget estimates of revenue and expenditures, the year end surplus would grow to $4.5 billion by June 30, 1979 if the new programs covered by the $1.8 billion reserve are not enacted This table also indicates that: (1) less than 10 years ago (1970-71) the General Fund had an enc!ing deficit, and (2) most of the $3 billion surplus projected for June 30, 1978 accumulated during the latest two fiscal years (1976-77 and 1977-78). For the most part, the surpluses realized in these two years were unanticipated; they resulted from economic conditions that were much more favorable than virtuaHy anyone expected.
Table 1 A Ten·Year History of General Fund Ending Surpluses
(Dollars In Millions)
1969-70 ............................................................ : ................ . 197(}..71 ............................................................................. . 1971-72 ............................................................................. . 1972-73 ........................ , .................................................... . 1973-74 ................................ ; ............................................ . 1974-75 ............................................................................. . 1975-76 ............................................................................. . 1976-77 ....................................................... : ..................... . 1977-78 est. ..................................................................... . 1978-79 est: ................ , .................................................... .
$144.8 -170.4
256.6 619.0 180.0 554.7 ·731.8
1,713.2 2,969.7 4,489.3 a
a Surplus shown in the regular Gerieral Fund budget; does not make allowance for expenditures from the proposed $1.8 billion reserve for new programs.
Charts I and II summarize the Governor's proposed expenditure program and provide data on the major components of state revenue. In preparing these charts, we have followed standard budget procedure and excluded both the $1.2 billion in potential expenditures from the Reserve for Legislative Programs and the $8.6 billion in federally funded expendi-tures. .
Chart I shows estimated total state revenues by source and total state expenditures (excluding bond funds) by major program area.
Chart II shows General Fund revenues by source as well as the proposed distribution of these funds by the major expenditure program categories.
A-2 .•
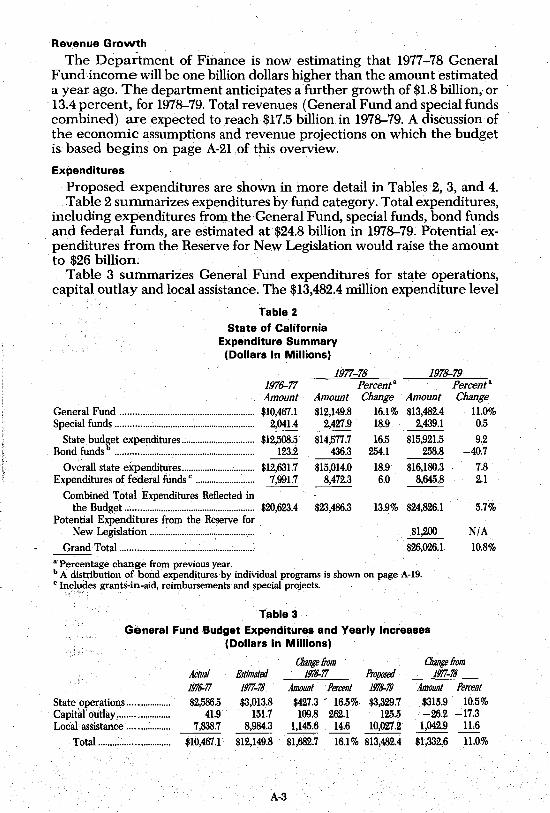
Revenue Growth
The Department of Finance is now estimating that 1977-78 General Fund income will be one billion dollars higher than the amount estimated a year ago. The department anticipates a further growth of $1.8 billion, or 13.4 percent, for 1978-79. Total revenues (General Fund and special funds combined) are expected to reach $17.5 billion in 1978-79. A discussion of the economic assumptions and revenue projections on which the budget is based begins on page A-21 of tp.is overview.
Expenditures
Proposed expenditures are shown in more detail in Tables 2, 3, and 4. Table 2 summarizes expenditures byfupd category. Total expenditures,
including expenditures from the General Fund, special funds, bond funds and federal funds, are estimated at $24.8 billion in 1978-79. Potential expenditures from the Reserve for New Legislation would raise the amount to $26 billion.
Table 3 summarizes General Fund expenditures for state operations, capital outlay and local assistance. The $13,482.4 million expenditure level
Table 2
State of California Expenditure Summary
(Dollars In Millions)
1977-78 1978-79 1976-77 PercentS Amount Amount Change Amount
General Fund .......................................................... $10,467.1 $12,149.8 16.1% $13,482.4 Special funds ............................................................ 2,041.4 2,427.9 18.9 2,439.1
State bud~et expenditures ................................ $12,508.5 Bond funds ............................................................ 123.2
$14,577.7 16.5 $15,921.5 436.3 254.1 258.8
Overall state expenditures ................................ $12,631.7 $15,014.0 18.9 $16,180.3 Expenditures of federal funds C .......................... 7,991.7 8,472.3 6.0 8,645.8
Combined Total Expenditures Reflected in the Budget ........................................................ $20,623.4 $23,486.3 13.9% $24,826.1
Potential Expenditures from the Reserve for New Legislation ............................................. . $1,200
. Grand Total ................................. : ....................... . $26,026.1
S Percentage change from previous year. b A distribution of bond expenditures by individual programs is shown on page A-19. C Incl~~es grants-in-aid, reimbursements and special projects.
Table 3 General Fund Budget Expenditures and Yearly Increases
(Dollars In Millions)
PercentS Change
11.0% 0.5
9.2 -40.7
7.8 2.1
5.7%
N/A 10.8%
Ciwlge from Change from
State operatiolls .... _ ............ . Capitiil outlay ..................... . Local assistance ................. .
Total ............................. .
Actual 1!l76-77 $2,586.5
41.9 7,838.7
$10,467.1
Estimated 1!l77-7S $3,013.8
151.7 8,984.3
$12,149.8
A-3
1!l76-77 Proposed 1!l77-7S Amount Percent 1!l71J-.79 Amount Percent
$427.3 - 16.50/0. $3,329.7 $315.9 10.5% 109.8 262.1 125.5 - 26.2 -17.3
1,145.6 14.6 10,02a 1,042.9 U.6 $1,682.7 16.1 % $13,482.4 $1,332,6 11.0%
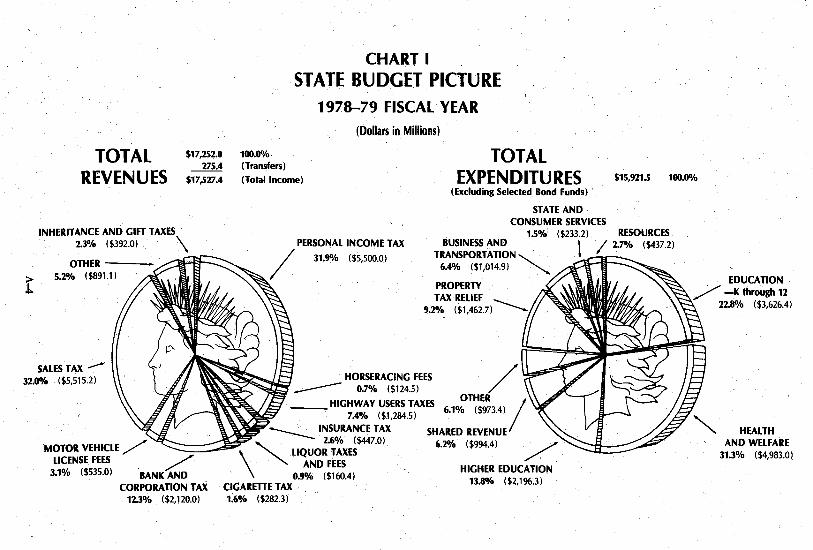
CHART I STATE BUDGET PICTURE
1978-79 FISCAL YEAR (Dollars in Millions)
$17,252.0 100.0"10 275.4 IT ransfers)
TOTAL REVENUES $17,527.4 (Total Income)
TOTAL EXPEN DITU RES $15,921.5 100.0"10
INHERITANCE AND GIFT TAXES 2.3"10 ($392.0) \
OTHER • ~
1 5.20/0 ($891.11
SALES TAX --32.00/0 ($5,515.2)
MOTOR VEHICLE /' LICENSE FEES
PERSONAL INCOME TAX
/ 31.9"10 ($5,500.0)
(Excluding Selected Bond Funds)
STATE AND CONSUMER SERVICES
1.5"10: ($233.2) RESOURCES BUSINESS AND
TRANSPORTATlON,,- . 6.4"10 ($1,014.9) ."'-...
PROPERTY TAX RELIEF
9.2"10 ($1,462.7)---'"
\ L 2::a ($437.2)
0.7"10 ($124.5) /
_ HIGHWAY USERS TAXES OTHER 7.4"10 ($1,284.5) 6.1"10 ($973.4) /
~ INSURANCE TAX ""'- 2.6"10 ($447.0) SHARED REVENUE
3.1"10 ($535.0) / BANK AND
CORPORATION TAX 123"10 ($2,120.0)
\
""" LIQUOR TAXES 6.2"10 ($994.4)
AND FEES 09"10 . CIGARETTE TAX " ($160.4) HIGHER EDUCATION
1;6"10 ($282.3) 13.8"10 ($2,196.3)
EDUCATION / -K through 12
22.8"10 ($3,626.4)
HEALTH AND WELFARE
313"10 ($4,983.0)
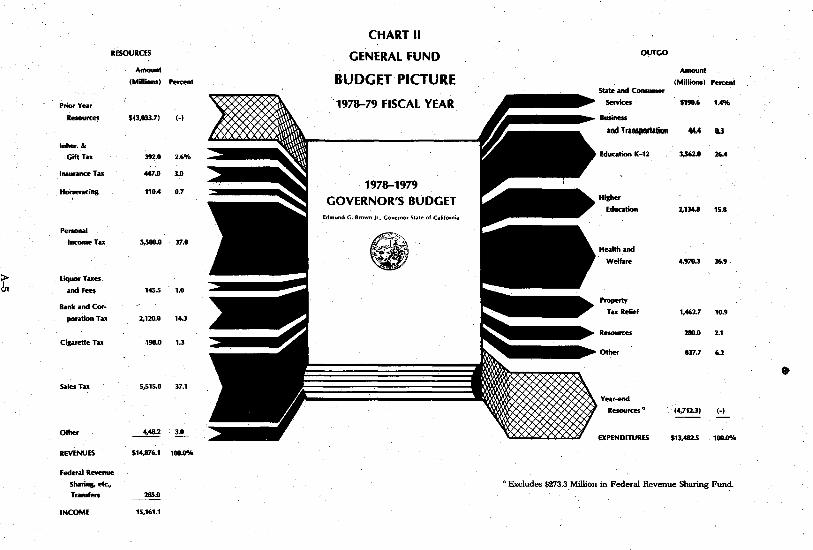
CHART II
RESOURCES GENERAL FUND OUTGO
Amount Amount
(Millions) Percent BUDGET PICTURE (Millions) Percent ~Ie ond Consumer
Prior Yeor m~ 1978-79 FISCAL YEAR ~ ••••• ~ Services $1,..6 1.4%
Resources $(1,G33.7) H ~ Busi .....
.. ....-.... md T!lnsptllli\iQn 44.4 Q.3
In,;~ ~ox ~.o 2.6% ~---------------~ ~ Edualion K-12 1,562.0 l6.4
Insurance Tu 447.0 1.0
~ 1978-1979 H~rocing 110.4 0.7 ::::::._--... ..., GOVERNOR'S BUDGET r~ HisM<
~ Edualion 2,1lC.8 15.8 Edmund G. Brown Jr., Governor St.te of California
Penonol
Income Tox 5,500.0 17.0 Heohh ond
Welfore 4,970.1 16.9 . ~
> Liq_Toxes.
6; ond Fees 1CS.s 1.0
Bonk ondC",· ~ Property Tox Relief 1,462.7 1Q.9 por~tion Tax 2,120.0 14.3
!!!!!!!~: Resources 280.0 2.1 C"lrette Tox 198.0 1.]
Other 1ll7:7 6.2
• SoIesTox 5,515.0 37.1 _t ~
Year-end
Resources a (4,712.1) H
Other 4,CII.2 ~ ~===;;" . ~ EXPENDITURES $11,482.5 100.0%
REVENUES $14,876.1 100.0%
Feder ... Revenue
Shoring, etc., a Excludes $213.3 Million in Federal Revenue Sharing Fund. Transfers 285.0
INCOME 15,161.1
.. proposed in the budget for 1978-79 is $1,332.6 million, or 11 percent, higher than in 1977-78. The increase is over $2.5 billion or about 21 percent, when the prospective expenditures from reserves are included.
Table 4 provides the same budget category breakdown for special fund expenditures which are estimated at $2,439 million in 1978-79.
Table 4
Special Fund Budget Expenditures and Yearly Increases (Dollars In Millions)
Change from Change from Actual Estimated lfJ76-77 Proposed 1977-18, 1976-77 1977-18 Amount Percent 1978-19 A1l1otfnt Percent
State operations ........................ $719.1 $844.9 $125.8 17.5% $968.9 $124.0 14.7% Capital outlay ............................ 377.2 500.1 122.9 32.6 323.9 -176.2 "-:35.2 Local assistance ........................ 945.1 1,082.9 137.8 14.6 1,146.3 63.4 5.9 -- - --
Total .................................... $2,041.4 $2,427.9 $386.5 18.9% $2,439.1 $11.2 0.5%
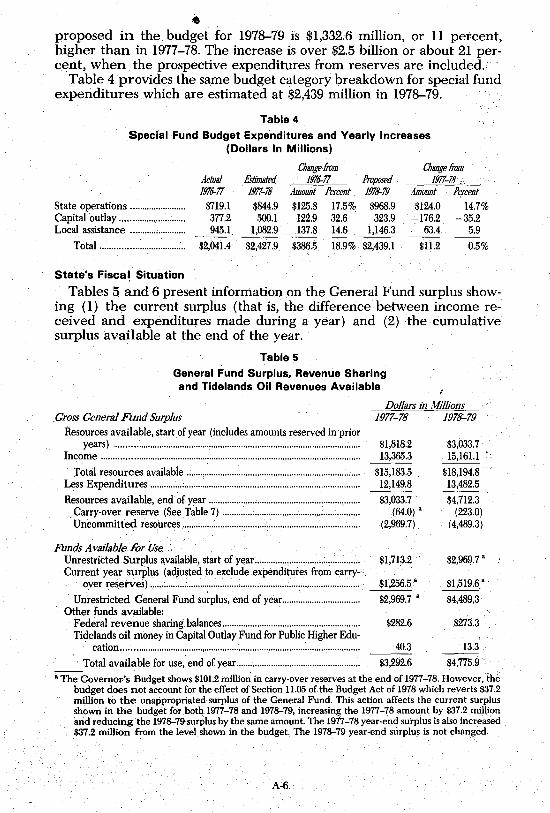
State's Fiscal Situation
Tables 5 and 6 present information on the General Fund surplus showing (1) the current surplus (that is, the differerice between' income received and expenditures made during a year) and (2) the cumulative surplus available at the end of the year.
Table 5
General Fund Surplus, Revenue Sharing and Tidelands Oil Revenues A.vailable
I
Dollars in Millions Gross General Fund Surplus 1977-78 1978-79
Resources available, start of year (includes amounts reserved in'prior years) ........................................................................................................ .. $1,818.2 $3,033.7
Income .............................................................................................................. .. 13,365.3 15,161:1
Total resources available ........................................................................... . $15,183.5 , $18,194.8 Less Expenditures .............. ; ........................................................................... .. 12,149.8 13,482.5
Resources available, end of year .......................................... ; ..................... .. . Carry-over re~erve (See Table 7) ................................................ : .......... .
$3,033.7 $4,712.3 (64.0) " (223.0)
Uncommitted resources , ..................................... ; ........................................ . (2,969.7) (4,489.3)
Funds A vailable for Use $1,713.2 , $2,969.7" Unrestricted Surplus available, start of year .................................. :.: ........ .
Current year surplus (adjusted to exclude expenditures from carry-over reserves) ......................... : ................................................................. . $1,256.5" $1,519.6'-
Unrestricted General Fund surplus, end of year ................................ .. 82,969.7 " $4,489.3 Other funds available:
Federal revenue sharing balances .......................................................... .. 8282.6 $273.3 Tidelands oil money in Capital Outlay Fund for Public Higher Edu-
cation ....................................................................................................... . 40.3 13.3
. Total available for use, end of year .................................................... .. $3,292.6 $4,775.9 • • The Governor's Budget shows $101.2 million in carry-over reserves at the end of 1977-78. However, the
budget does not account for the effect of Section 11.05 ofthe Budget Act of 1978 which reverts $37.2 million to the unappropriated surplus of the General Fund. This action affects the current surplus shown in the budget for both 1977-78 and 1978-79, increasing the 1977-78 amount by $37.2 million and reducing the 1978-79 surplus by the same amount. The 1977-78 year-end surplus is also increased $37.2 million from the level shown in the budget. The 1978-79 year-end surplus is not changed.
A-6
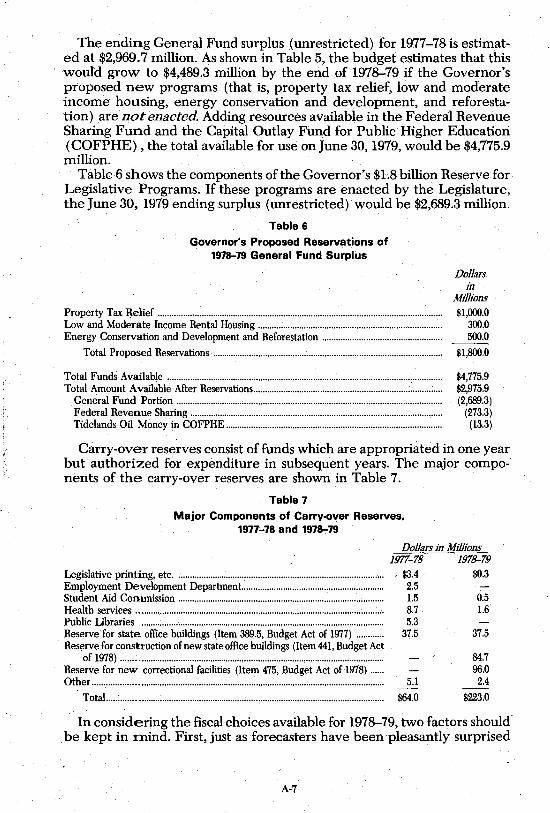
The ending General Fund surplus (unrestricted) for 1977-78 is estimat~ ed at $2,969.7 million. As shown in Table 5, the budget estimates that this would grow to $4,489.3 million by the end of 1978-79 if the Governor's proposed new programs (that is, property tax relief, low and moderate incom~ housing, energy conservation and development, and reforestation) are not enacted. Adding resources available in the Federal Revenue Sharing Fund and the Capital Outlay Fund for Public Higher Education (COFPHE), the total available for use on June 30,1979, would be $4,775.9 million.
Table 6 shows the components of the Governor's $1.8 billion Reserve for Legislative Programs. If these programs are enacted by the Legislature, the June 30, 1979 ending surplus (unrestricted) would be $2,689.3 million.
Table 6
Governor's Proposed Reservations of 197~79 General Fund Surplus
Property Tax Relief ........................................................................................................................... . Low and Moderate Income Rental Housing ............................................................................... . Energy Conservation and Development and Reforestation ................................................... .
Total Proposed Reservations ................................................................................................... .
Total Funds Available ....................................................................................................................... . Total Amount Available After Reservations .................................................................... : ............ .
General Fund Portion ............................. , ..................................................................................... . Federal Revenue Sharing ............................................................................................................. . Tidelands Oil Money in COFPHE ............................................................................................. .
Dollars in
MIllions $1,000.0
300.0 500.0
$1,800.0
$4,775.9 $2,975.9 (2,689.3)
(273.3) (13.3)
Carry~over reserves consist of funds which are appropriab~d in one year but authorized for expenditure in subsequent years. The major components of the carry-over reserves are shown in Table 7.
Table 7
Major Components of Carry·over Reserves, 1977-78 and 1978-79
Legislative printing, etc. . ....................................................................................... , .. Employment Development Department.. ........................................................... . Student Aid Commission ......................................................................................... . Health services ........................................................................................................... . Public Libraries ......................................................................................................... . Reserve for state office buildings (Item 389.5, Budget Act of 1977) ........... . Reserve for construction of new state office buildings (Item 441, Budget Act
of 1978) ................................................................................................................. . Reserve for new correctional facilities (Item 475, Budget Act of 1978) ..... . Other ............................................................................................................................. .
TotaL ... : ................................................................................................................. .
Dollars in Millions 1977-78 1978-79
. $3.4 $0.3 2.5 1.5 0.5 8.7 1.6 5.3
37.5 37.5
84.7 96.0
5.1 . 2.4
$64.0 $223.0
In considering the fiscal choices available for 1978-79, two factors shouH . be kept in :mind. First, just as forecasters have been . pleasantly surprised
A-7
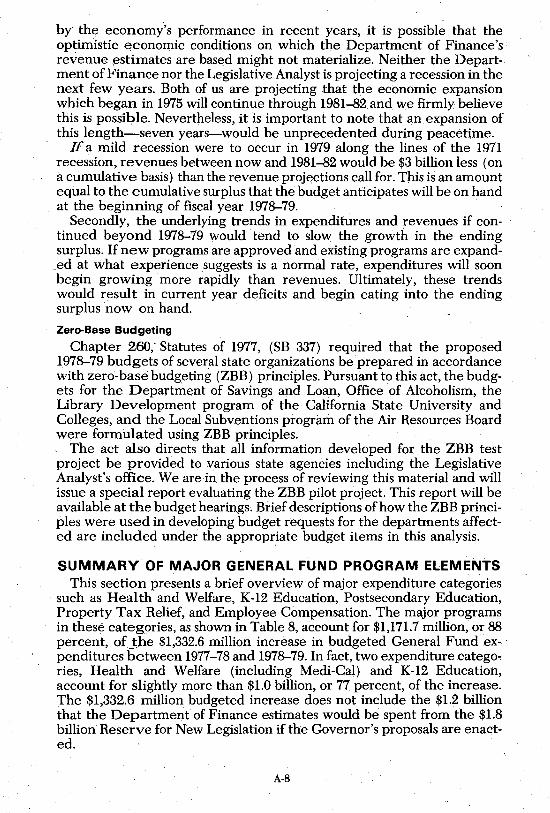
by the economy"s performance in recent years, it is possible that the optimistic economic conditions on which the Department of Finance's revenue estimates are based might not materialize. Neither the Department of Finance nor the Legislative Analyst is projecting a recession in the next few years. Both of us are projecting that the economic expansion which began in 1975 will continue through 1981-82 and we firmly believe this is possible. Nevertheless, it is important to note that an expansion of this length-seven years-would be unprecedented during peacetime.
If a mild recession were to occur in 1979 along the lines of the 1971 recession, revenues between now and 1981-82 would be $3 billion less (on a cumulative basis) than the revenue projections call for. This is an amount equal to the cumulative surplus that the budget anticipates will be on hand at the beginning of fiscal year 1978-79. .
Secondly, the underlying trends in expenditures and revenues if continued beyond 1978-79 would tend to slow the growth in the ending surplus. If new programs are approved and existing programs are expand
_ed at what experience suggests is a normal rate, expenditures will soon begin growing more rapidly than revenues. Ultimately, these trends would result in current year deficits and begin eating into the ending surplus now on hand.
Zero-Base Budgeting
Chapter 260,- Statutes of 1977, (SB 337) required that the proposed 1978-79 budgets of several state organizations be prepared in accordance with zero-base budgeting (ZBB) principles. Pursuant to this act, the budgets for the Department of Savings and Loan, Office of Alcoholism, the Library Development program of the California State University and Colleges, and the Local Subventions program of the Air Resources Board were formulated using ZBB principles.
The act also directs that all information developed for the ZBB test project be provided to various state agencies including the Legislative Analyst's office. We are in the process ofreviewing this material and will issue a special report evaluating the ZBB pilot project. This report will be available at the budget hearings. Brief descriptions of how the ZBB principles were used in developing budget requests for the departments affected are included under the appropriate budget items in this analysis.
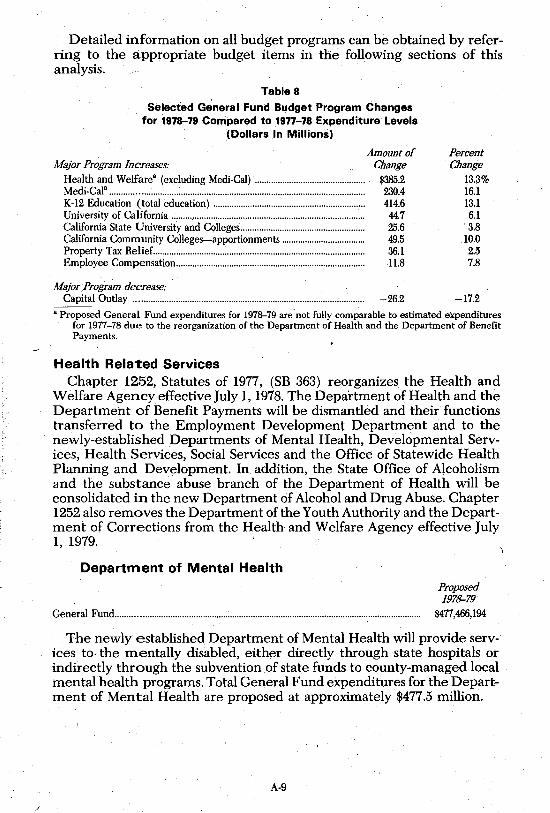
SUMMARY OF MAJOR GENERAL FUND PROGRAM ELEMENTS This section presents a brief overview of major expenditure categories
such as Health and Welfare, K-12 Education, Postsecondary Education, Property Tax Relief, and Employee Compensation. The major programs in these categories, as shown in Table 8, account for $1,171.7 million, or 88 percent, of she $1,332.6 million increase in budgeted General Fund expenditures between 1977-78 and 1978-79. In fact, two expenditure catego" ries, Health and Welfare (including Medi-Cal) and K-12 Education, account for slightly more than $1.0 billion, or 77 percent, of the increase. The $1,332;6 million budgeted increase does not include the $1.2 billion that the Department of Finance estimates would be spent from the $1.8 billion Reserve for New Legislation if the Governor's proposals are ena~ted.
A-8
/
Detailed information on all budget programs can be obtained by referring to the appropriate budget items in the following sections of this analysis.
Table 8 Selected General Fund Budget Program Changes
for 1978-79 Compared to 1977-78 Expenditure Levels (Dollars In Millions)
Major Program Increases: Health and Welfare· (excluding Medi-Cal) ............................................... . Medi-Cal· ............................................................................................................. . K-12 Education (total education) ................................................................ .. University of California ................................................................................... . California State University and Colleges ..................................................... . California Community Colleges-apportionments ................................... . Property Tax Relief ........................................................................................... . Employee Compensation ................................................................................. .
Major Proir"am decrease: Capital Outlay ................................................................................................... .
Amount of Change
$385.2 230.4 414.6 44.7 25.6 49.5 36.1 H.8
-26.2
Percent Change
13.;3% 16.1 13.1 6.1 3.8
10.0 2.5 7.8
-17.2
a Proposed General Fund expenditures for 1978-79 are' not fully comparable to estimated expenditures for 1977-78 due to the reorganization of the Department of Health and the Department of Benefit Payments.
Health Related Services Chapter 1252, Statutes of 1977, (SB 363) reorganizes the Health and
Welfare Agency effective July 1, 1978. The Department of Health and the Department of Benefit Payments will be dismantled and their functions transferred to the Employment Development Department and to the newly-established Departments of Mental Health, Developmental Services, Health Services, Social Services and the Office of Statewide Health Planning and Development. In addition, the State Office of Alcoholism and the substance abuse branch of the Department of Health will be consolidated in the new Department of Alcohol and Drug Abuse. Chapter 1252 also removes the Department of the Youth Authority and theDepartment of Corrections from the Health and Welfare Agency effective July 1, 1979. '
Department of Mental Health Proposed 1978-79
General Fund.................................................................................................................................... $477,466,194
The newly established Department of Mental Health will provide services to· the mentally disabled, either directly through state hospitals or indirectly through the subvention of state funds to county-managed local mental health programs. Total General Fund expenditures for the Department of Mental Health are proposed at approximately $477.5 million.
A-9
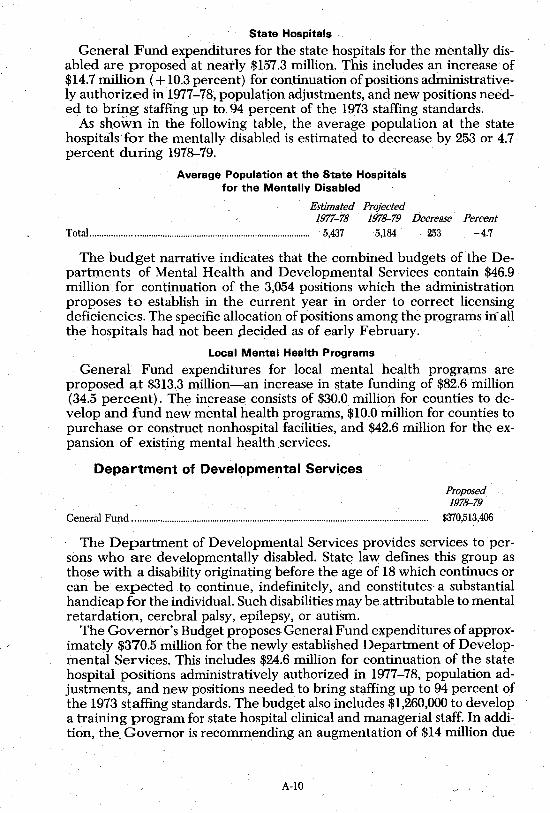
St.ate Hospitals
General Fund expenditures for the state hospitals for the mentally disabled are proposed at neatly $157~3 million. This includes an increase of $14.7 million ( + 10.3 percent) for continuation of positions administratively authorized in1977-78, population adjustments, and new positions needed to bring staffing up to 94 percent of the 1973 staffing standards.
As shown in the following table; the average population at the state hospitals for the mentally disabled is estimated to decrease by 253 or 4.7 percent during 1975-79.
Average Population at the State Hospitals for the Mentally Disabled
Estimated Projected 1977-78 1ffl~79 Decrease Percent
Total.................. ............................................................................ 5,437 5,184 253 -4.7
The budget narrative indicates that the combined budgets of the Departments of Mental Health and Developmental Services contain $46.9 million for continuation of the 3,054 positions which the administration proposes to establish in the current year in order to correct licensing deficiencies. The specific allocation of positions among the programs in all the hospitals had not been ,decided as of eatly February. .
Local Mental Health Programs
General Fund expenditures for local mental health programs are proposed at $313.3 million-an increase in state funding of $82.6 million (34.5 percent). The increase consists of $30.0 million for counties to develop and fund new mental health programs, $10.0 million for counties to purchase or construct nonhospital facilities, and $42.6 million for the expansion of existing mental health services.
Department of Developme,:,tal Servi,ces
Proposed 197~79
General Fund ................................................................................................................................ $370,513,406
The Department of Developmental Services provides services to persons who are developmentally disabled. State law defines this group as those with a disability originating before the age of 18 which continues or can be expected to continue, indefinitely, and constitutes- a substantial handicap for the individual. Such disabilities may be attributable to mental retardation, cerebral palsy, epilepsy, or autism.
The Governor's Budget proposes General Fund expenditures of approximately $370.5 million for the newly established Department of Developmental Services. This includes $24.6 million for continuation of the state hospital positions administratively authorized in 1977-78, population adjustments, and new positions needed to bring staffing up to 94 percent of the 1973 staffing standards. The budget also includes $1,260,000 to develop a training program for state hospital clinical and managerial staff. In addition, the Governor is recommending an augmentation of $14 million due
A-lO
to the projected growth in the developmental disabilities caseload for regional centers. It is estimated that'the regional center caseload will increase by 10,164 (18.8 percent) to 64,325 during 1978-79.
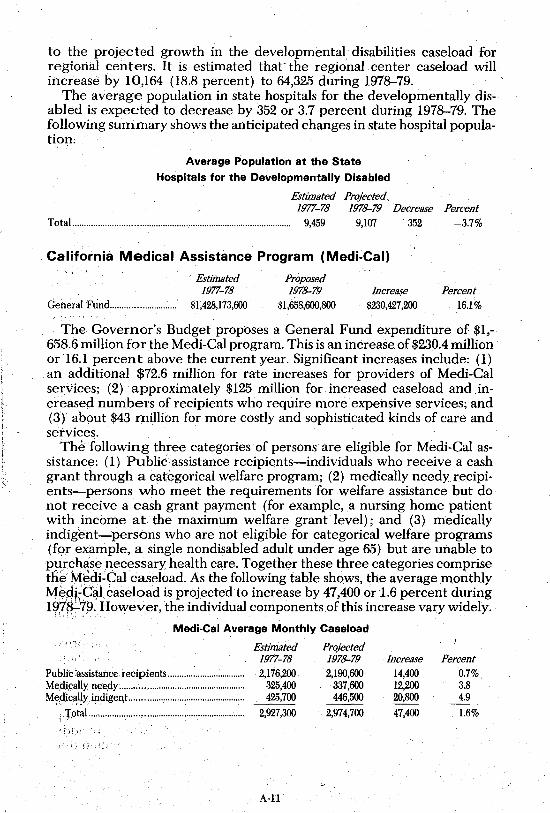
The average population in state hospitals for the developmentally disabled is expected to decrease by 352 or 3.7 percent during 1978-79. The following summary shows the anticipated changes in state hospital population;
Average Population at the State
Hospitals for the Developmentally Disabled
Estimated Projected 1977-78 1978-79 Decrease Percent
Total.............................................................................................. 9,459 9,107 352 -3.7%
California Medical Assistance Program (Medi-Cal)
. Estimated 1977-78
General Fund............................ $1,428,173,600
Proposed 1978-79
$1,658,600,800 Increase
$230,427,200 Percent
16.1%
The Governor's Budget proposes a General Fund expenditure of $1,-658.6 million for the Medi-Cal program. This is an increase. of $230.4 million or 16.1 percent above the current year. Significant increases include: (1) an additional $72.6 million for rate increases for providers of Medi-Cal services; (2) approximately $125 million for increased caseload and .increased numbers of recipients who require more expensive services; and (3) about $43 million for more costly and sophisticated kinds of care and services.
The following three categories of persons are eligible for Medi-Cal assistance: (1) Public assistance recipients-individuals who receive a cash grant through a categorical welfare program; (2) medically needyrecipients-persons who meet the requirements for welfare assistance but do not receive a cash grant payment (for example, a nursing home patient with income at the maximum welfare grant level); and (3) medically iridigt:mt--persons who are not eligible for categorical welfare programs (for example, a single nondisabled adult under age 65) but are unable to p!lr~hlls~ necessary health care. Together these three categories comprise tfi~ ~~di~~al caseload. As the following table shows, the average monthly MepkC~1 caseload is projected to increase by 47,400 or 1.6 percent during 19?~7~. However, the individual components of this increase vary widely.
Medi-Cal Average Monthly Caseload
Public lassistance recipients ................................. . Mec!~cally neepy ........... , ......................................... . Me,dJci~I'Yi indigent ................................................. .
i To~a!'" .. · ........................................................... : .. .
Estimated 1977-78 2,176,200
325,400 425,700
2,927,300
A-ll
Projected 1978-79 2,190,600
337,600 446,500
2,974,700
Increase Percent 14,400 0.7% 12,200 3.8 20,800 4.9
47,400 .1.6%
Other Health Services Proposed 1978-79
General Fund.................................................................................................................................... $198,784,736
,General Fund expenditures for all other health services are budgeted at approximately $198.8 mmion. This includes $137.1 million for the Department of Health Services (excluding Medi-Cal), $57.4 million for the Department of Alcohol and Drug Abuse and $4.3 million for the Office of Statewide Health Planning and Development.
Department of Social Services
Proposed 1978-79
General Fund ................................... ;............................................................................................ $1,771,416,847
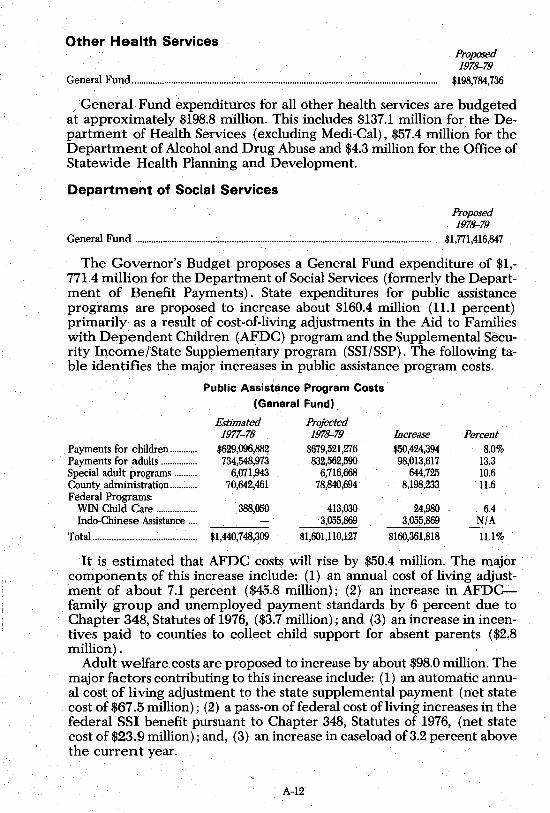
The Governor's Budget proposes a General Fund expenditure of $1,-771.4 million for the Department of Social Services (formerly the Department of Benefit Payments). State expenditures for public assistance programs are proposed to increase about $160.4 million (11.1 percent) primarily as a result of cost-of-living adjustments in the Aid to Families with Dependent Children (AFDC) program and the Supplemental Security Income/State Supplementary program (SSIISSP). The following table identifies the major increases in public assistance program costs.
Public Assistance Program Costs
(General Fund)
Estimated Projected 1977-78 1978-79 Increase Percent
Payments for children ............ $629,096,88~ $679,521,276 $50,424,394 8.0% Payments for adults ................ 734,548,973 832,562,590 98,013,617 13.3 Special adult programs .......... 6,071,943 6,716,668 644,725 10.6 County administration ............ 70,642,461 78,840,694 8,198,233 'U.6 Federal Programs:
WIN Child Care .................. 388,050 413,030 24,980 6.4 Indo-Chinese Assistance .... 3,055,869 3,055,869 N/A
Total ............................................ $1;440,748,309 $1,601,UO,127 $160,361,818 11.1%
It is estimated that AFDC costs will rise by $50.4 million. The maj()r components of this increase include: (1) an annual cost of living adjustment of about 7.1 percent ($45.8 million); (2) an increase in AFDCfamily group and unemployed payment standards by 6 percent due to Chapter 348, Statutes of 1976, ($3.7 million); and (3) an increase in incentives paid to counties to collect child support for absent parents ($2.8 million) .
Adult welfare costs are proposed to increase by about $98.0 million. The major factors contributing to this increase include: (1) an automatic annual cost of living adjustment to the state supplemental payment (net state cost of $67.5 million); (2) a pass-on of federal cost of living increases in the federal SSI benefit pursuant to Chapter 348, Statutes of 1976, (net state cost of $23_ 9 million) ; and, (3) an increase in caseload of 3.2 percent above the current year.
A-12
The budget also proposes nearly $3.1 million for the Indo-Chinese Refugee Assistance program. This program is fully funded by the federal government in the current federal fiscal year. However, federal support is scheduled to be reduced over the next four years as follows: to 75 percent in 1979; to 50 percent in 1980; and to 25 percent in 198!.
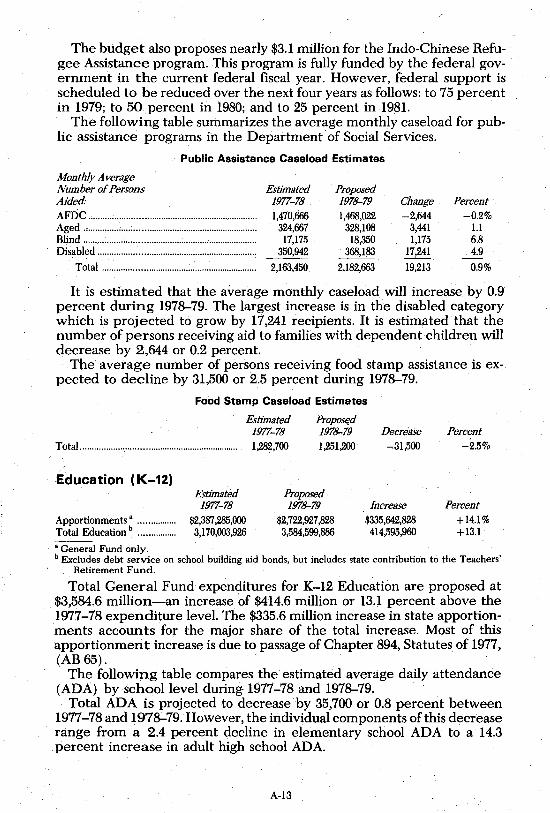
The following table summarizes the average monthly caseload for public assistance programs in the Department of Social Services.
Public Assistance Caseload Estimates
Monthly Average Number of Persons Aided: AFDC ....................................................................... . Aged ......................................................................... . Blind ........................................................................ .. Disabled .................................................................. ..
Total ................................................................ ..
Estimated 1977-78. 1,470,666
324,667 17,175
350,942
2,163,450
Proposed 1978-79 1,468,022
328,108 18,350
368,183
2,182,663
Change Percent. -2,644 -0.2%
3,441 1.1 1,175 6.8
17,241 4.9
19,213 0.9%
It is estimated that the average monthly caseload will increase by 0.9 percent during 1978-79. The largest increase is in the disabled category which is projected to grow by 17,241 recipients. It is estimated that the number of persons receiving aid to families with dependent children will decrease by 2,644 or 0.2 percent.
The average number of persons receiving food stamp assistance is expected to decline by 31,500 or 2.5 percent during 1978-79.
Food Stamp Caseload Estimates
- Estimated 1977-78
Propost:d 1978-79 1,251,200 Total.................................................................... 1,282,700
Education (K-12) Estimated 1977-78
Apportionments· ... ............. $2,387,285,000 Total Education b ................ 3,170,003,926
Proposed 1978-79
$2,722,927,828 3,584,599,886
Decrease -31,500
Increase $335,642,828 414,595,960
Percent -2.5%
Percent +14.1 % +13.1
• General Fund only. b Excludes debt service on school building aid bonds, but includes state contribution to the Teachers'
Retirement Fund.
Total General Fund expenditures for K-12 Education are proposed at $3,584,6 million-an increase of $414.6 million or 13.1 percent above the 1977-78 expenditure level. The $335.6 million increase in state apportionments accounts for the major share of the total increase. Most of this apportionment increase is due to passage of Chapter 894, Statutes of 1977, (AB 65).
The following table compares the estimated average daily attendance (ADA) by school level during 1977-78 and 1978-79. .
Total ADA is projected to decrease by 35,700 or 0.8 percent between 1977-78 and 1978-79. However, the individual components of this decrease range from a 2.4 percent decline in elementary school ADA to a 14.3 percent increase in adult high school ADA.
A-13
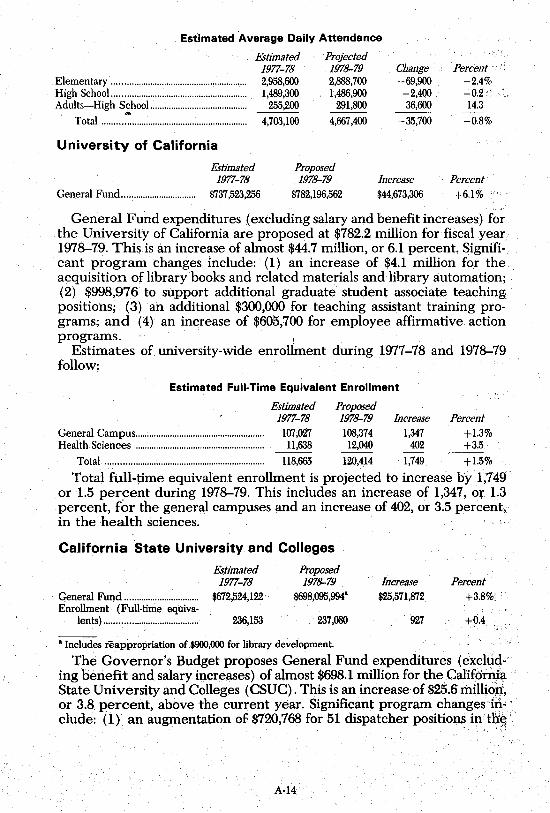
. Estimated Average Daily Attendance
. Elementary ......................................................... . High School ......................................................... . Adults-High School ......................................... .
. ... Total ............................................................. .
University of California
Estimated 1977-78 2,958,600 1,489,300
255,200
4,703,100
Projected 1978-79 2,888,700 1,486,900
291,800
4,667,400
Estimated 1977-78
General Fund................................ $737,523,256
Proposed 1978-79
$782,196,562
Change -69,900 -2,400 36,600
-35,700
Increase $44,673,306
Percent ",. -2.4% -0.2, 14.3
-0.8%
Percent
+6.1%
General Fund expenditures (excluding salary and benefit increases) for the University of California are proposed at $782.2 million for fiscal year 1978-79. Thisis anincrease of almost $44.7 million, or 6.1 percent. Significant program changes include: (1) an increase of $4.1 million for the acquisition of library books and related materials and library automation; (2) $998,976 to support additional graduate student associate teaching positions; (3) an additional $300,000 for teaching assistant training programs; and (4) an increase of $605,700 for employee affirmative action programs. I
Estimates of university-wide enrollment during 1977-78 and 1978-79 follow:
Estimated Full-Time Equivalent Enrollment
Estimated Proposed 1977-78 1978-79 Increase Percent
General Campus........................................................ 107,027 108,374 1,347 +1.3% Health Sciences ........................................................ 11,638 12,040 402 +3.5
Total.................................................................... 118,665 120,414 1,749 +1.5%
Total full-time equivalent enrollment is projected to increase by 1,749 or 1.5 percent during 1978-79. This includes an increase of 1,347, or 1.3 percent, for the general campuses and an increase of 402, or 3.5 percent, I in the health sciences.
California State University and Colleges
Es.timated Proposed 1977-78 1978-79 Increase Percent
General Fund ................................ $672,524,122 $698,095,994" $25,571,872 +3.8% . Enrollment (Full·time equiva·
lents) ........................................ 236,153 237,080 927 +0.4
" Includes reappropriation of $900,000 for library development.
The Governor's Budget proposes General Fund expenditures (excll?d-' ing benefit and salary increases) of almost $698.1 million for the.Calif6rrij:a State University and Colleges (CSUC). This is an increase of $25.6 riliJli6)r, or 3.8 percent, above the current year. Significant program changes-in"; elude: (1) an augmentation of $720,768 for 51 dispatcher positions intIiEl"
.' . / ~
A-14
campus police units; (2) $510,510 for an employee affirmative action prograIn; and (3) an increase of $420,592 to addl1,OOO volumes annually to the CSUC library system.
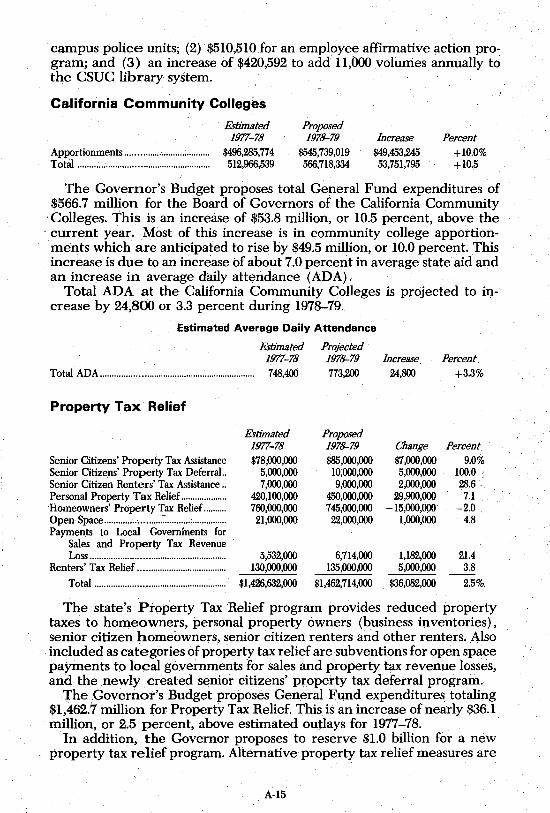
California Community Colleges
Estimated 1977-78
Apportionments .................................... $496,285,774 Total ........................................................ 512,966,539
Proposed 1978-79
$545,739,019 566,718,334
Increase $49,453,245 53,751,795
Percent +10.0% +10.5
The Governor's Budget proposes total General Fund expenditures of $566.7 million for the Board of Governors of the California Community
. Colleges. This is an increase of $53.8 million, or 10.5 percent, above the - current year. Most of this increase is in community college apportionments which are anticipated to rise by $49.5 million, or 10.0 percent. This increase is due to an increase of about 7.0 percent in average state aid and an increase in average daily attendance (ADA).
Total ADA at the California Community Colleges is projected to increase by 24,800 or 3.3 percent during 1978-79.
Estimated Average Daily Attendance
Estimated 1977-78
Total ADA.................................................................. 748,400
Property Tax Relief
Eshmated 1977-78
Senior Citizens' Property Tax Assistance $78,000,000 Senior Citizens' Property Tax Deferral .. 5,000,000 Senior Citizen Renters' Tax Assistance .. 7,000,000 Personal Property Tax ReHef... ................. 420,100,000 ·H.omeowners· Property Tax ReHef .......... 760,000,000 Open Space .............. · .......... : ........... ; ............... 21,000,000 Payments to' Local Governments for
Sales and Property Tax Revenue Loss .......................................................... 5,532,000
Renters' Tax ReHef ...................................... 130,000,000
Total ......................................................... $1,426,632,000
Projected 1978-79 773,200
Proposed 1978-79 $85,000,000 10,000,000 9,000,000
450,000,000 745,000,000 22,000,000
6,714,000 135,000,000
$1,462,714,000
Increase 24,800
Change. $7,000,000 5,000,000 2,000,000
29,900,000 -15,000,000
1,000,000
1,182,000 5,000,000
$36,082,000
Percent. +3.3%
Percent 9.0%
100.0 28.6·
7.1 -2.0
4.8
21.4 3.8
2:5%.
The state's Property Tax Relief program provides reduced property taxes to homeowners, personal property owners (business inventories), senior citizen homeowners, senior citizen renters and other renters. Also included as categories of property tax relief are subventions for open space payments to local governments for sales and property tax revenue losses, and the newly created senior citizens' property tax deferral program.
The Governor's Budget proposes General Fund expenditures totaling $1,462.7 million for Property Tax Relief. This is anincrease of nearly $36.1 million, or 2.5 percent, above estimated outlays for 1977-78.
In addition, the Governor proposes to reserve $1.0 billion for a new property tax relief program. Alternative property tax relief measures are
A-IS
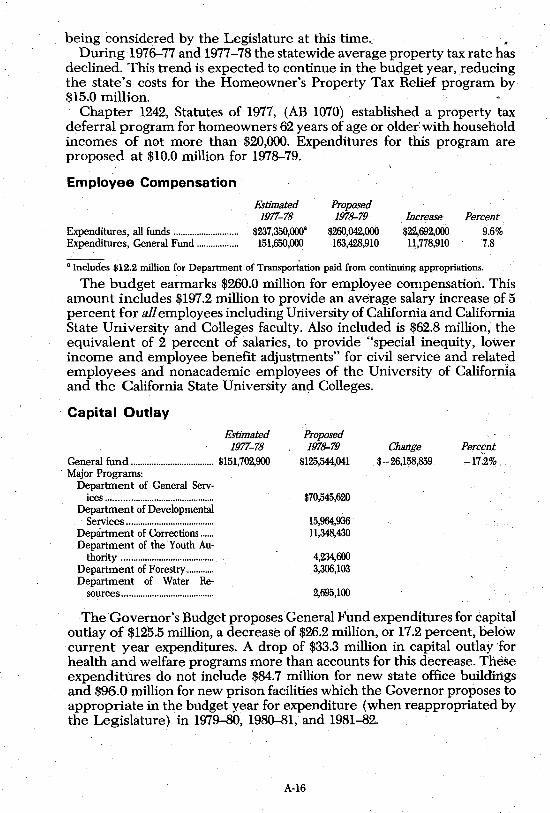
being considered by the Legislature at this time. • During 1976-77 and 1977-78 the statewide average property tax rate has
declined. This trend is expected-to continue in the budget year, reducing the state's costs for the Homeowner's Property Tax Relief program by $15.0 million.
Chapter 1242, Statutes of 1977, (AB 1070) established a property tax deferral program for homeowners 62 years of age or older: with household incomes of not more than $20,000. Expenditures for this program are proposed at $10.0 million for 1978-79.
Employee Compensation
Expenditures, all funds .......................... .. Expenditures, General Fund ................ ..
Estimated 1977-78
$237,350,000" 151,650,000
Proposed 1978-79
$260,042,000 163,428,910
Increase $22,692,000 11,778,910
Percent 9.6% 7.8
a Includes $12.2 million for Department of Transportation paid from continuing appropriations.
The budget earmarks $260.0 million for employee compensation. This amount includes $197.2 million to provide an aVeirage salary increase of5 percent for all employees including University of California and California State University and Colleges faculty. Also included is $62.8 million, the equivalent of 2 percent of salaries, .to provide "special inequity, lower income and employee benefit adjustments" for civil service and related employees and nonacademic employees of the University of California and the California State University and Colleges.
Capital Outlay
Estimated 1977-78
General fund .................................... $151,702,900 . Major Programs:
Department of General Servo ices ............................................. .
Department of Developmental Services ..................................... .
Department of Corrections .... .. Department of the Youth Au·
thority ...................................... .. Department of Forestry .......... .. Department of Water Re·
sources ...................................... ..
Proposed 1978-79
$125,544,041
$70,545,620
15,964,936 11,348,430
4,234,600 3,306,103
2,695,100
Change $ - 26,158,859.
Percen.t -17.2%
The Governor's Budget proposes General Fund expenditures for capital outlay of $125.5 million, a decrease of $26.2 million, or 17.2 percent, below current year expenditures. A drop of $33.3 million in capital outlay for health and welfare programs more than accounts for this decrease. These expenditures do not include $84.7 million for new state office buildings and $96.0 million for new prison facilities which the Governor proposes to appropriate in the budget year for expenditure (when reappropriated by the Legislature) in 1979-80, 198Q...;81, and 1981-82.
A-16
A General Fund expenditure of $70.5 million is proposed for capital outlay projects under the jurisdiction of the Department of General Services. Most of these funds would be used for the construction of new state office buildings in Sacramento, San Jose and Long Beach. Capital outlay expenditures for the Department of Developmental Services are projected at nearly $16.0 million, of which $4.3 million is for a fire and life safety program at the state hospitals. The Governor's Budget proposes capital outlay expenditures of approximately $11.4 million for the Department of Corrections. Four million dollars of this amount is proposed for site acquisition and preliminary plans for new prison facilities.
GENERAL OBLIGATION BONDS State general obligation bonds outstanding on December 31, 1977, to
. taled $5,589,428,000, an increase of $94,456,000, or 1.7 percent, from December 31, 1976, when they totaled $5,494,972,000.
State general obligation bonds unsold on December 31, 1977, totaled $1,595,900,000 a decrease of $395~0 million, or 19.8 percent, from the $1,990,900,000 unsold on December 31, 1976.
Bond Categories
General obligation bonds are backed by the General Fund. There are three categories of such bonds: (1) General Fund Bonds, with debt service fully paid from the General Fund; (2) Partially Self-Liquidating Bonds, with debt service paid partly from project or program revenues and partly from the General Fund, and (3) Self-Liquidating Bonds, with debt service entirely paid from project or program revenues. If project or program revenues are insufficient to cover the debt service on partially self-liquidating or self-liquidating general obligation bonds, the General Fund must make up the difference.
Revenue bonds are also issued by state agencies. These bonds are for specific projects where only the revenue generated from the program is pledged for payment of the bonds. Revenue bonds have been issued for the construction of dormitories and parkiJ;lg lots at the University of California and California State University and Colleges, Cal-Expo Facilities, pollution control, and bridges, as well as for other purposes. Revenue bonds are not general obligations of the state. Nevertheless, when a revenue deficiency occurred in the Cal-Expo program the General· Fund picked up the debt service payments on these bonds. Revenue bonds are not included in the totals of this summary but are mentioned merely to illustrate the different state debt service instruments.
Table 9, on page A-17, shows the amount of bonds by program which have been authorized but are unsold, and the amount of bonds sola and outstanding as of December 31, 1977. Each of the programs listed was approved by a majority of the electorate after having been passed by at least a two-thirds vote in each house of the Legislature.
A-17
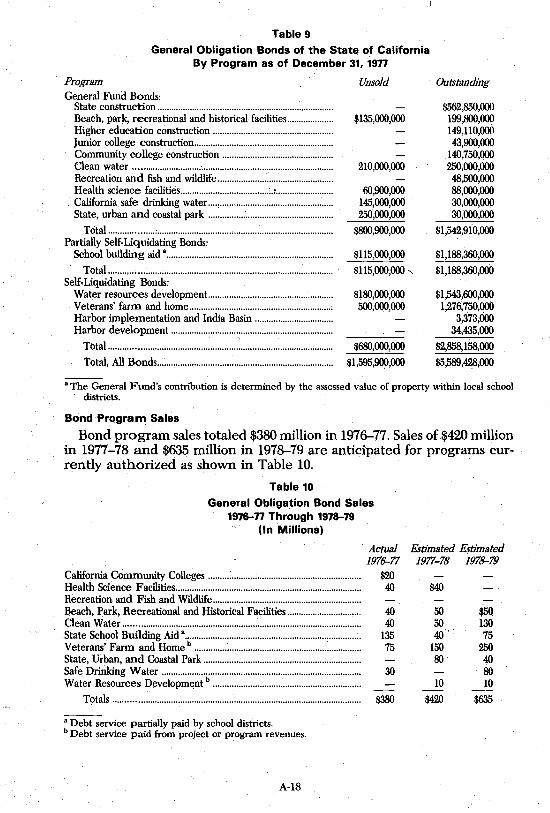
Table 9
General Obligation Bonds of the State of California By Program as of December 31, 1977
Program General Fund Bonds:
State construction ........................................................................... . Beach, park, recreational and historical facilities ................... . Higher education construction ................................................... . Junior college construction ........................................................... . Community college construction ............................................... . Clean water ......•............................................................................... Recreation and fish and wildlife ................................................. . Health science facilities ...................................... :.: ........................ . California safe drinking water .... , ........................................... : .... . State, urban and coastal park ..................................................... .
Total ................... : ........................................................................... . Partially Self-Liquidating Bonds:
School building aid a •..••••••••.....•••.•..••••.....•.•••••.•.•••••...••.•.•.•.....•••.....•
Total ................................................................................................ . Self-Liquidating Bonds:
Water resources development ..................................................... . Veterans' farm and home ............................................................. . Harbor implementation and India Basin ................................. . Harbor development .................................................................... ..
Total ....................................................... : ...................................... ..
Total, All Bonds .......................................................................... ..
Unsold
$135,000,000
210,000,000
60,900,000 145,000,000 250,000,000
$800,900,000
$115,000,000
$115,000,000 "
$~80,000,000 500,000,000
$680,000,000
$1,595,900,000
Outstanding
$562,850,000 199,800,000 149,110,000 43,900,000
140,750,000 250,000,000 48,500,000 88,000,000 30,000,000 30;000,000
$1,542,910,000
$1,188,360,000
$1,188,360,000
$1,543,600,000 1,276,750,000
3,373,000 34,435,000
$2,858,158,000
$5,589,428,000
a The General Fund's contribution is determined by the assessed value of property within local school districts.
Bond Program Sales
Bond program sales totaled $380 million in 1976-77. Sales of $420 million in 1977-78 and $635 million in 1978-79 are anticipated for programs currently authorized as shown in Table 10.
Table 10
General Obligation Bond Sales 1976-77 Through 1978-79
(In Millions)
California COmmunity Colleges ......... : ...................................................... .. Health Science Facilities ............................................................................... . Recreation and Fish and Wildlife .............................................................. .. Beach, Park, Recreational and Historical Facilities ............................... . Clean Water ......................................... ; .......................................................... ..
~:::r::.~~=gH~;·b·:::::::::::::::::::::::::::::::::::::::::::::::::::::::::::::::::::::::: State, Urban, and Coastal Park .................................................................. .. Safe Drinking Water .................................................................................... .. Water Resources Developme,nt b ............................................................... .
Totals ......................................................................................................... .
a Debt service partially paid by school districts. b Debt service paid from project or program revenues.
A-IS
Actual 1976-77
$20 40
40 40
135 75
30
$380
Estimated Estimated 1977-78 1978-79
$40
50 $50 50 130 40' 75
150 250 80 40
80 10 10
$420 $635
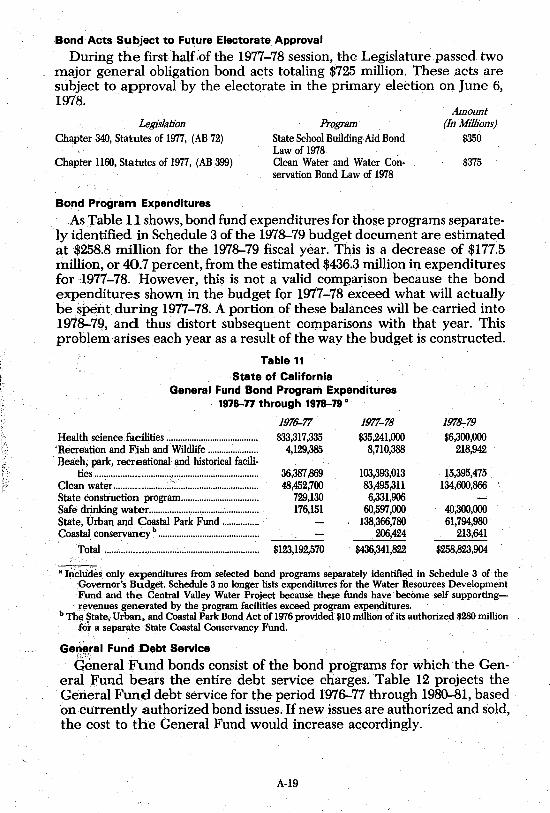
Bond Acts Subject to Future Electorate Approval
During the first half.of the 1977-78 session, the Legislature passed two major general obligation bond acts totaling $725 million. These acts are subject to approval by the electorate in the primary election on June 6, 1978.
Legislation Chapter 340, Statutes of 1977, (AB 72)
Chapter 1160, Statutes of 1977, (AB 399)
.Bond Program Expenditures
Program State School Building Aid Bond Law of 1978 Clean Water and Water Con· servation Bond Law of 1978
Amount (In Millions)
$350
$375
As Table 11 shows, bond fund expenditures for those programs separately identified in Schedule 3 of the 1978-79 budget document are estimated at $258.8 million for the 1978-79 fiscal year. This is a decrease of $177.5 million, or 40.7 percent, from the estimated $436.3 million in expenditures for 1977-78. However, this is not a valid comparison because the bond expenditures shown in the budget for 1977-78 exceed what will actually be .~pent during 1977-78. A portion of these balances will be carried into 1978-79, and thus distort subsequent comparisons with that year. This problem arises each year as a result of the way the budget is constructed.
Table 11
State of California General Fund Bond Program Expenditures
1976-n through 1978-79·
Health science facilities ...................................... .. 'Recreation and Fish and Wildlife .................... .. Beach; park, recreational.and historical facili·
ties .................................. " .................................. . Clean water ...................... ~: ...................................... .. State construction program ................................ .. Safe drinking water .............................................. .. State, Urban and Coastal Park Fund .............. .. Coastal. conservancy b .......................................... ..
Total ......... : ...................................................... ..
197fJ-77 $33,317,335
4,129,385
36,387,869 48,452,700
729,130 176,151
$123,192,570
1977-78 $35,241,000
8,710,388
103,393,013 83,495,311 6,331,906
60,597,000 138,366,780
206,424
$436,341,822
197~79
$6,300,000 218,942
15,395,475 134,600,866
40,300,000 61,794,980
213,641
$258,823,904
• InClude~ only expenditures from selected bond programs separately identified in Schedule 3 of the Governor's Budget. Schedule 3 no longer lists expenditures for the Water Resources Development Fund and the Central Valley Water Project because. these funds have become self supporting-revenues generated by the program facilities exceed program expenditures. .
b The. $tate, Urban. and Coastal Park Bond Act of 1976 prOvided $10 mUlion of its authorized $280 million for a separate State Coastal Conservancy Fund.
Ge~'.ral Fund Debt Service
qEmeral Fund bonds consist of the bond programs for which the General Fund bears the entire debt service charges. Table 12 projects the General Fund debt service for the period 1976-77 through 1980-:-81, based on currently authorized bond issues. If new issues are authorized and sold, the cost to the General Fund would increase accordingly.
A-19
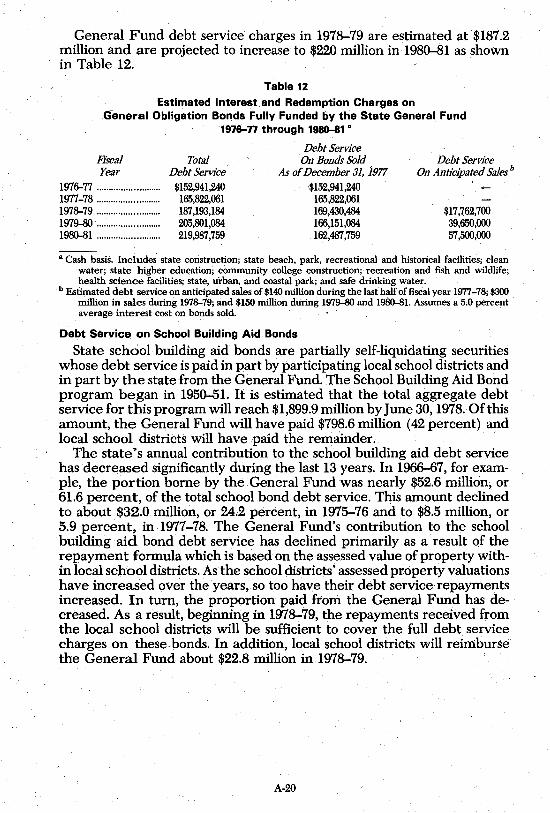
General Fund debt service charges in 197&-79 are estimated at $187.2 million and are projected to increase to $220 million in 1980-81 as shown in Table 12.
Table 12
Estimated Interest and Redemption Charges on G-eneral Obligation Bonds Fully Funded 6y the State General Fund
1976-77 through 1980-81 •
Fiscal Year
1976-77 ....................... , .. 1977-78 .......... , ....... " .. , .. . 1978-79 .... "" ................ " 1979-80 .... , .................... . 1980-81 ....... " ........ " ...... .
Total , Debt Service
$152,941,240 165,822,061 187,193,184 205,801,084 219,987,759
Debt Service On Bonds Sold
As of December 31, 1977 '$152,941,240
165,822,061 169,430,484 166,151,084 162,487,759
Debt Service On Anticipated Sales b
$17,762,700 39,650,000 57,500,000
a Cash basis. Includes state construction; state beach, park, recreational and historical facilities; clean water; state higher education; community college construction; recreation and fish and wildlife; health science facilities; state, urban, and coastal park; and safe drinking water.
b Estimated debt service on anticipated sales of $140 million during the last half of fiscal year 1977-78; $300 million in sales during 1978-79; and $150 million during 1979-80 and 1980-81. Assumes a 5.0 percent average interest cost on bonds sold.
Debt Service on School Building Aid Bonds
State school building aid bonds are partially self-liquidating securities whose debt service is paid in part by participating local school districts and in part by the state from the General Fund. The School Building Aid Bond program began in 1950-51. It is estimated that the total aggregate debt service for this program will reach $1,899.9 million by June 30, 1978. Of this amount, the General Fund will have paid $798.6 million (42 percent) and local school districts will have paid the remainder. '
The state's annual contribution to the school building aid debt service has decreased significantly during the last 13 years. In 1966-67, for exam-
, pIe, the portion borne by the General Fund was nearly $52.6 million, or 61.6 percent, of the total school bond debt service. This amount declined to about $32.0 million, or 24.2 percent, in 1975-76 and to $8.5 million, or 5.9 percent, in 1977-78. The General Fund's contribution to the school building aid bond debt service has declined primarily as a result of the repayment formula which is based on the assessed value of property within local school districts. As the school districts' assessed property valuations have increased over the years, so too have their debt service repayments increased. In turn, the proportion paid from the General Fund has decreased. As a result, begmning in 197&-79, the repayments received from the local school districts will be sufficient to cover the full debt service charges on these ,bonds. In addition, local school districts will reimburse the General Fund about $22.8 million in 197&-79.
A-20
ECONOMIC OUTLOOK AND REVENUE ANALYSIS
Summary
The economic expansion that began in 1975 continued through 1977 at a relatively fast pace. Although the rate of expansion nationally tapered downward during the year, and for the year as a whole fell below that in 1976, the growth rate was in line with earlier expectations. Employment growth maintained its vigor, and the expansion was still on track at yearend. California's 1977 experience was particularly strong, especially in such areas as housing starts, employment growth, new automobile sales and overall taxable sales. Unfortunately, however, both unemployment and inflation continued to be excessive.
Both California and the nation are expected to experience moderate expansion in 1978 and 1979. The Department of Finance projections for 1978 generally are similar to the concensus of other forecasts for such variables as real GNP growth (4.8%), consumer price inflation (6.3%), U. S. housing starts (1.90 million), California personal income growth (10.7%), California bUilding permits (235,000), and unemployment rates for the nation (6.7%) and state (7.2%).
The outlook is thus generally favorable, although inflation remains a special concern due to such factors as slowing productivity improvements, higher energy costs, increased prices of imported goods, and recent federal increases in minimum wages, social security taxes and farm price supports. Consumer support will continue, particularly in terms of new housing purchases and automobile sales. Some economic stimulus is anticipated in late 1978 and 1979 from the President's tax reduction proposals .. Moreover, the near term outlook· for California has strengthened recently due to an apparent weakening of drought conditions. However, the outlook for business investment continues to be uncertain, due to the e:xpected increases in interest rates, remaining unused productive capacity, and the absence of agreed upon federal energy policies. In addition, the international sector remains troubled. Both the nation and state are expected to experience further employment expansion in 1978, although unemployment rates will remain at high levels due to labor force growth.
In summary, the overall state and national forecast is a fairly optimistic one of continued expansion, although accompanied by high unemployment and uncertainty concerning business spending, foreign sector devel-opments, and certain federal government policies. .
In line with the generally favorable economic outlook, the Governor's Budget forecasts a strong growth in General Fund revenues to $15.2 billion for 197~79, up 13.4 percent from the current year. Substantial gains are expected for the three major revenue sources.;...sales taxes (up 10 percent), personal incom.e taxes (up 20 percent), and bank and corporation taxes (up 11.6 percent). The projected 20 percent growth in personal income tax revenues to $5.5 billion in 197~79 will place this tax on a par with the sales tax as a source of General Fund revenues. The total General Fund revenue increase of $1.8 billion over 1977-78 follows an exceptionally strong $2.0 billion gain estimated for the current year.
In general, the estimates for most revenue sources appear to be consist-
A-21
ent with the underlying economic forecasts. There is reason to believe, however, that the projections for sales tax revenues may be too optimistic. In relation to disposable personal income, taxable sales for 1977 were significantly higher than in any year in the past decade. The budget estimates are based on the assumption that this relationship will essentially be maintained during calendar 1978. Although there are several factors which will tend to support a relatively high ratio of sales to income well into 1978, we believe there is a stronger possibility that the ratio will begin to decline during the year toward a level more consistent with historical trends. If such a decline occurs, a shortfall in budget year revenues in the range of $200 million to $400 would result.
19n IN RETROSPECT
Recovery Continued. Though Problems Remained
The national economy was relatively strong during 1977, with real growth in Gross National Product (GNP) of 4.9 percent. This performance, although well below the 6.0 percent GNP growth in 1976, was essentially identical to the consensus forecast discussed in last year's Analysis and was only 0.1 percent above the original Department of Finance forecast (Table 1~ page A-23). Also expected was the modest decline in the national unemployment rate to a still high 7.1 percent (unrevised) .average for the year, due to the combination of strong employment growth and strong labor force expansion. Inflation, however, was more severe than expected, with consumer prices rising 6.5 percent. As noted in Table 1, the economy's 1977 performance was led by the consumption sector (especially durable goods, like autos and home furnishings) and residen~ tial construction, which registered gains even in excess of the optimistic levels initially forecast. On the other hand, these strengths were partially offset by less than hoped-for performances in such sectors as business investment and foreign trade. In general, then, 1977 can be remembered as a year of inflationary expansion, characterized by continued relatively strong economic growth, persistently high inflation, declining though excessive unemployment, and a mixture of unexpectedly ebullient and disappointingly sluggish sectors.
Some analysts have called special attention to the fact that the current expansion is one of the longer recovery periods in the postwar period,anq have taken this as an indication that the recovery is especially durable. Indeed, as of January 1978, the recovery had extended some 34 'months, equal to the average of the four previous peacetime recovery periods (this excludes the Viet Nam period in the mid 1960's) and destined 'soon .to surpass the longest (39 months). However, even though the expansion has generally been at least "typical" if not somewhat better than average; the 1973-75 recession was far more severe than any of the previous postwar downturns. Thus, despite the favorable rates of expansio]J. for such indicators as GNP and employment over thepast.several years, the economy continues to operate well below its potential as evidenced by the current indices for unemployment and capacity utilization. The inability of traditional fiscal and monetary policy tools to significantly reduce inflation in the midst of high unemployment has been of special concern. In addition,
A-22
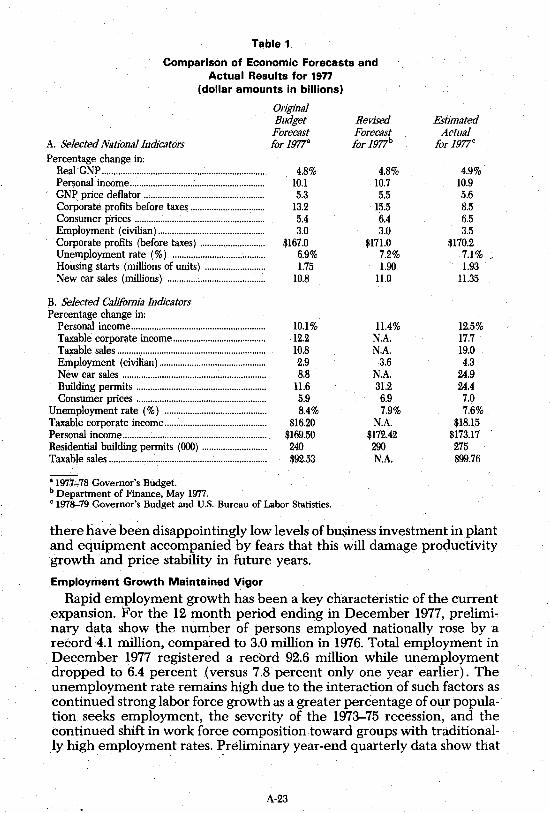
Table 1
Comparison of Economic Forecasts and Actual Results for 1977
(dollar amounts in billions)
A. Selected Nationallndicators Percentage change in:
Real·GNP .................................................................... .. Personal' income ... : ..................................................... . GN~ price deflator ................................................... . Corporate profits before taxes ............................... . Consumer prices ...................................................... .. Employment (civilian) ............................................ .. Corporate profits (before taxes) .......................... .. Unemployment rate (%) ....................................... . Housing starts (millions of units) ........................ .. New car sales (millions) ........................................ ..
B. Selected California Indicators Percentage change in:
Personal income ......................................................... . Taxable corporate income ....................................... . Taxable sales .............................................................. .. Employment (civilian) ............................................ .. New car sales ............................................................ .. Building permits ....................................................... . Consumer prices ....................................................... .
Unemployment rate (%) .......................................... .. Taxable corporate income ........................................... . Personal income ............................................................. . Residential building permits (000) .......................... .. Taxable sales ................... : ................ : ............................. ..
, 197·7..,78 Governor's Budget. b Department of Finance, May 1977.
Original Budget Forecast for 1977'
4.8% 10.1 5.3
13.2 5.4 3.0
$167.0 6.9% 1.75
10.8
10.1% 12.2 10.8 2.9 8.8
11.6 5.9 8.4%
$16.20 $169.50 240 $92.53
c 1978-79 Governor's Budget and U.S. Bureau of Labor Statistics.
Revised Forecast for 1977b
4.8% 10.7 5.5
15.5 6.4 3.0
$171.0 7.2% 1.90
11.0
11.4% N.A. N.A.
3.6 N.A. 31.2 6.9 7.9%
N.A. $172.42 290 N.A.
Estimated Actual
for 1977c
4.9% 10.9 5.6 8.5 6.5 3.5
$170.2 7.1% / 1.93
11.35
12.5% 17.7 19.0 4.3
24.9 24.4 7.0 7.6%
$18.15 $173.17 275 $99.76
there have been disappointingly low levels of business investment in plant and equipment accompanied by fears that this will damage productivity growth and price stability in future years.
Employment Growth Maintained Vigor
Rapid employment growth has been a key characteristic of the current expansion. For the 12 month period ending in December 1977, preliminary data show the number of persons employed nationally rose by a record 4.1 million, compared to 3.0 million in 1976. Total employment in December 1977 registered a record 92.6 million while unemployment dropped to 6.4 percent (versus 7.8 percent only one year earlier). The unemployment rate remains high due to the interaction of such factors as continued strong labor force growth as a greater percentage of our population seeks employment, the severity of the 1973-75 recession, and the continued shift in work force composition toward groups with traditionally high employment rates. ~reliminary year-end quarterly data show that
A-23
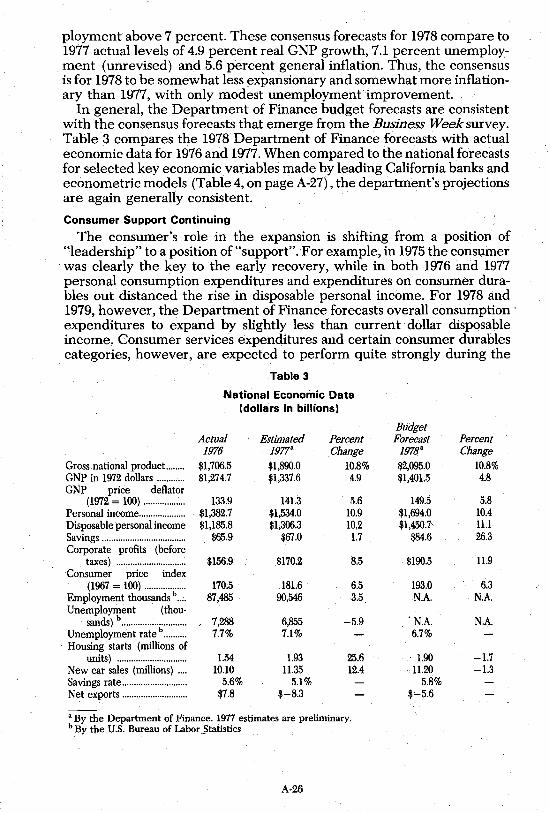
ployment above 7 percent. These consensus forecasts for 1978 compare to 1977 actual levels of 4.9 percent real GNP growth, 7.1 percent unemployment (unrevised) and 5.6 percent general inflation. Thus, the consensus is for 1978 to be somewhat less expansionary and somewhat more inflationary than 1977, with only modest unemployment improvement.
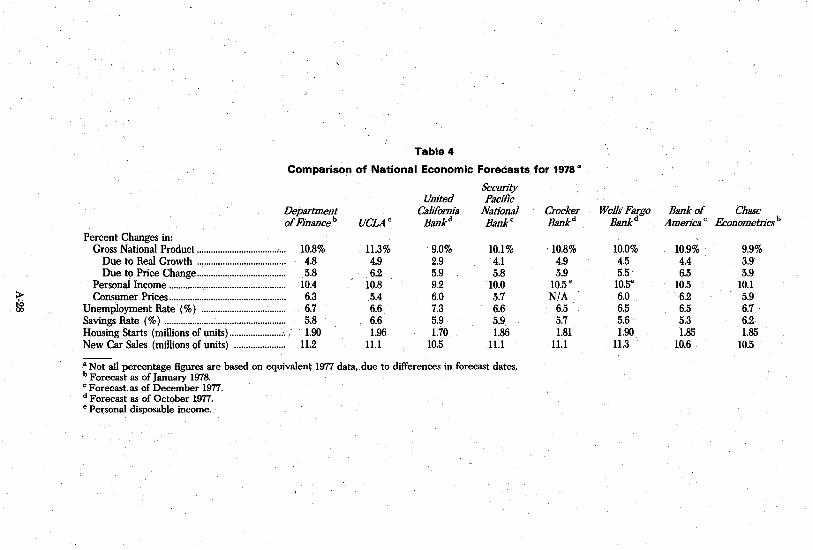
In general, the Department of Finance budget forecasts are consistent with the consensus forecasts that emerge from the Business Weeksurvey. Table 3 compares the 1978 Department of Finance forecasts with actual economic data for 1976 and 1977. When compared to the national forecasts for selected key economic variables made by leading California banks and econometric models (Table 4, on page A-27) , the department's projections are again generally consistent.
Consumer Support Continuing
The consumer's role in the expansion is shifting from a position of "leadership" to a position of "support" . For example, in 1975 the consumer was clearly the key to the early recovery, while in both 1976 and 1977 personal consumption expenditures and expenditures on consumer durables out distanced the rise in disposable personal income. For 1978 and 1979, however, the Department of Finance forecasts overall consumption' expenditures to expand by slightly less than current dollar disposable income. Consumer services expenditures and certain consumer durables categories, however, are expected to perform quite strongly during the
Table 3
National Economic Data (dollars in billions)
Budget Actual Estimated Percent Forecast Percent 1976 1977" Change 19788 Change
Gross national product... ..... $1,706.5 $1,890.0 10.8% $2,095.0 10.8% GNP in 1972 dollars ............ $1,274.7 $1,337.6 4.9 $1,401.5 4.8 GNP price deflator
(1972 = 100) .................. 133.9 141.3 5.6 149.5 5.8 Personal income .................... $1,382.7 $1,534.0 10.9 $1,694.0 10.4 Disposable personal income $1,185.8 $1,306.3 10.2 $1,450.7 11.1 Savings .................................... $65.9 $67.0 1.7 $84.6 26.3 Corporate profits (before
taxes) .............................. $156.9 $170.2 8.5 $19o.s 11.9 Consumer price index
(1967 = 100) .................. 170.5 181.6 6.5 193.0 6.3 Employment thousands b .. ;. 87,485 90,546 3.5 N.A. N.A. Unemployment (thou·
sands) b ............................ 7,'lBS 6,855 -5.9 . N.A. N.A. Unemployment rate b .......... 7.7% 7.1 % 6.7% Housing starts (milliOns of
units) .............................. 1.54 1.93 25.6 1.90 -1.7 New car sales (millions) .... 10.10 11.35 12.4 11.20 -1.3 Savings rate ............................ 5.6% 5.1 % 5.8% Net exports ............................ $7.8 $-8.3 $~5.6
"By the Department of Finance. 1977 estimates are preliminary. b By the U.S. Bureau of Labor "Statistics
A·26
period. Overall, the consumer can be viewed as continuing to provide modest support for the recovery. .
There are several reasons why the economy may receive less support-. from the consumer sector in 1978 than it did during the past several years. These include projected increases in the savings rate from its historically low 1977 levels, the rapid rate of growth in consumer indebtedness recently, and a probable slowdown in the extent to which increases in home equities are "monetized" (that is, converted to cash by owners borrowing against their equities) to provide additional purchasing power.
As for consumer indebtedness, credit extensions were at near-record levels late in 1977, with outstanding consumer installment debt up $30 billioI). from one year earlier. Automobile loan demand was a particularly important con tributor to the increase. The r~tio of total credit borrowings to GNP has recently been close to the all-time peak in 1973, when considerable amounts of speculative borrowing preceded the recession. Of course, credit extensions carry with them future repayment obligations, which can serve as a drag on future demand expansion.
The issue of home equity "monetization" is of particular interest in California, where housing prices have witnessed dramatic increases during the past several years. Such "monetization", which essentially represents a type of wealth conversion from illiquid to liquid form, can occur in a number of ways, both direct and indirect. The direct routes include refinancing existing home mortgages and creation of" second mortgages", while the indirect routes include expansion oHnstallment credit and reductions in current savings out of disposable income. Unfortunately, little data exist to accurately assess the stimulative effects of "equity monetization" on consumption spending. However, our discussions with California economists and financial institutions suggest that such "monetization" is quite significant, and may help to explain the unexpected strength in 1977 California taxable· sales and the related sales and use tax revenues. Of course, if future rates of home price appreciation more closely approximate general price inflation, the stimulative consumption effects of "monetization" could taper somewhat.
Lastly, as discussed below, the President's recently proposed income tax cut may have relatively little effect on consumption during 1978, although a net stimulative impact over the 1978-79 period is expected.
Auto Sales Look Favorable
One major source of strength in the consumer durables outlook continues to be the motor vehicle industry. Motor vehicle sales in the United States totaled a record 15 million in 1977, including nearly 11.4 million passenger vehicles and 3.6 million trucks (about 40 percent of which are now purchased J:>y individuals). Thus, 1977 was a strong motor vehicle year, as was 1976. Much of the same is forecast for 1978. Although some slowing from 1977 levels is widely anticipated, there are many economists who are predicting that new car sales will still exceed 11 million units. One factor supporting continuing high levels of motor vehicle sales is the recent trend toward longer automobile loan maturities. By mid-1977, for example, average maturities for new'car loans by major U.S. finance com-
" ',~
A-27
~
Table 4
Comparison of National Economic Forecasts for 1978·
Department ofFinance b
Percent Changes in: Gross National Product ...................................... 10.8%
Due to Real Growth ...................................... 4.8 Due to Price Change ...................................... 5.8
Personal Income .................................................. 10.4 Consumer Prices .................................................. 6.3
Unemployment Rate (%) .................................... 6.7 Savings Rate (%) .................................................... 5.8 Housing Starts (millions of units) ........................ , . 1.90 New Car Sales (millions of units) ...................... 11.2
UCLA e
11.3% 4.9 6.2
10.8 5.4 6.6 6.6 1.96
ILl
United California
Bankd
9.0% 2.9 5.9 9.2 6.0 7.3 5.9 1.70
10.5
Security Pacific
National Banke
10.1% 4.1 5.8
10.0 5.7 6.6 5.9 1.86
ILl
• Not all percentage figures are based on equivalent 1977 data, due to differences in forecast dates. b Forecast as of January 1978. . e Forecast as of December 1977. d Forecast as of October 1977. "Personal disposabl~ income.
Crocker Bankd
10.8% 4.9 5.9
10.5" N/A
6.5 5.7 1.81
ILl
WeUsFargo Bankd
10.0% 4.5 5.5
10.5" 6.0 6.5 5.6 1.90
11.3
Bank of Chase America e Econometrics b
10.9% 9.9% 4.4 3.9 6.5 5.9
10.5 10.1 6.2 5.9 6.5 6.7 5.3 6.2 1.85 1.85
10.6 10.5
panies exceeded 40 months, versus only 35 months in 1974. Foreign imports accounted for, somewhat under one-fifth of the U.S.
new car market in 1977, although the current dollar weakness on foreign exchange markets could eventually lead to some reduction in this share. In 1977, the share of foreign imports (primarily small cars) actually rose from about 15 percent in 1976 to 18 percent, while the share of intermediate and larger domestic cars rose from 50 percent to 52 percent. Domestic small cars thus fell from 35 percent to 30 percent of the market. One factor which continues to puzzle market analysts is the exact nature of public preferences for car types and models, particularly with respect to changes in car prices and differing fuel economies. These uncertainties, as discussed below, are complicating business investment decisions in the automobile industry.
As 1977 ended and 1978 began, car sales had weakened and overall, industry inventory levels exceeded normal desired levels for many models and makes. However, the 10.5 million unit sales rate realized in the fourth quarter of 1977 appears below long-run potential demand, and a fairly strong auto year is the consensus outlook for 1978.
Business Spending Remains Hesitant
Considerable uncertainty again surrounds the outlook for business spending in 1978, as was true both for 1977 and 1976. Real expenditures on plant and equipment strengthened a bit during 1977 with an expansion of about 8 percent, versus only 2 percent in 1976 and a 14 percent decline in 1975. However, at this time the ratio of real nonresidential fixed business in:vestment to GNP remains well below the average for the decade preceding the recession of over 10 percent. In fact, even the level of real fixed business investment expenditures is still below its pre-recession peak.
Some forecasters, including the Department of Finance, expect a moderate expansion in nonresidential investment during 1978, due to such factors as increased capacity utilization, respectable profits performance and the President's proposed business tax cut package. Less optimistic forecasters point out, however, that the tax cuts would not become effective until October 1978, interest rates could increase somewhat during the year, and capacity utilization is still well below its pre-recession level of over 88 percent. Several recent national surveys of business investment plans for 1978 report that real capital spending will rise by under 5 percent, even assuming the administration's proposed tax cut. Thus, although a moderate and even considerable strengthening of capital spending is. certainly possible, there is still considerable uncertainty surrounding the investment outlook. This uncertainty is partly due to unknown factors concerning the fed,eral energy and tax packages, environmental controls, and the future strength of final sector demands faced by many industries. In addition, business confidence is not viewed as particularly strong, and previous large increases in energy prices have undoubtedly reduced desired levels of capital stocks. Lastly, there remains doubt as to exactly how much investment will actually be stimulated by such recommended tax changes as expansion of the investment tax credit and reductions in corporate tax rates. .
A-29
Even if 1978 business investment expenditures are not particularly strong, the development of general capacity shortages and bottlenecks in 1978 appears somewhat remote. However, the possibility of a weak investment performance raises both short-term and long-term concerns. In the short-term, weak investment contributes to weak aggregate demand for output and labor, thus jeopardizing a continued expansion. In the longerterm, weak invest~ent can reduce labor productivity and lead to higher inflation and reduced real incomes. Investment, for instance, not only increases total production capabilities; it also provides the route by which more efficient technology is integrated into the economy. Such efficiencies traditionally have both raised real wages of labor and reduced unit labor costs of production.
One major industry sector expected to record relatively strong investment outlays is the automobile industry. This industry is engaged in a massive capital expenditure program to '''down size" cars. In 1977, for example, plant and equipment outlays rose over four times faster than for the econOITIY as a whole, and were far in excess of the previous 1974 high. The underlying stimulus for such expenditures is federal legislation that requires U.S. auto producers to improve their average miles per gallon per company, from 18 in 1978 to nearly 28 by 1985. This, in turn, requires body design changes, substitution of other inputs for steel, and smaller engine size, as well as conversions to diesel engines and increased reliance on imported autos. The U.S. auto industry clearly faces a difficult task in targeting its investment expenditures to produce a "mix" of car types which will both satisfy public preferences and government environmental standards.
Housing Sector Remains Strong
Residential housing starts are generally expected to taper slightly from the unexpectedly strong 2 million unit level of 1977, although a healthy rate of 1.8 million to 1.9 million units is still fUlticipated. In 1977, single family starts reached a record level of nearly 1.5 million units and accounted for nearly 15 percent of total starts. However, the mix of starts should move more in favor of multiple family units in 1978, with the latter assisted by lower vacancy rates, upward pressures on rents, financing availability and federal assistance programs. Housing prices are expected to rise further in 1978 due to continued strong housing demand and increasing costs for labor, land and materials. However, much of the earlier speculative activity in housing markets appears to have stopped, and most analysts expect annual single family housing price increases in the more 'moderate range of 10 percent. As noted earlier, rising home values can have both positive as well as negative economic impacts, to the extent that "monetization" of increasing home equities can stimulate consumption expenditures. This seems to have been particularly true during 1976 and 1977.'
There seems little doubt that thrift institutions will be able to provide adequate financing for the 1.8 million to 1.9 million starts forecast. While gradually rising 1978 interest rates on such assets as Treasury securities should reduce the level of deposits in savings and loan associations and commercial banks during the year, there seems little chance of any signifi-
A-30
cant disintermediation. Savings and loan associations, which handle over 40 percent of the nation's mortgage financing and an even higher percentage in California, are becoming more and more resistant to disintermediation. This is because a high percent of their deposits are now in longer-term, high interest bearing savings certificates having heavy lossof-interest penalties for early withdrawal. In California, for instance, about 65 percent of savings and loan deposits are in such accounts, with roughly one-half of these having terms extending six years. In addition, California savings and loan associations currently are in a position to raise additional funds, if needed, through secondary mortgage market transactions and mortgage-backed bond sales. Thus, the mortgage financing outlook seems relatively positive for 1978, even with the prospect of tighter (but sufficient) credit availability, and the possibility of mortgage rate increases.
A noteworthy development in the housing sector is the increasing use of "new" mortgage instruments, such as variable rate mortgages (VRMs), graduated payment mortgages (GPMs), reverse mortgages and housing annuities. The continuing spread of these instruments will facilitate house purchase agreements for both borrowers and lenders in our inflationary economy, particularly if federal and state government regulations permit them to be used more extensively. Over the past two years, for instance, an estimated 20 percent of new home loans in California have been VRMs. Effective January 1, 1978, California state mortgage lenders are allowed to use a number of new techniques in addition to VRMs, such as the "roll over" mortgage which provides for renewable five-year mortgage terms, with interest rate levels periodically indexed to inflation.
Inflation Still is a Problem
Inflation, perhaps still the economy's major threat, should remain at relatively "moderate" levels through 1978. The consensus view for 1978 consumer price inflation, for example, is 6 percent to 6.5 percent, with abo~t 6 percent increasingly viewed as the economy's "basic" or "underlying" inflation rate. Some forecasters, however, think that inflation in 1978 may actually exceed the 6.5 percent rate of 1977. The consensus outlook is generally based on an average 2 percent annual labor productivity gain, and an 8 percent to9 percent increase in total labor compensation (including wages, fringes, employer social security contributions, etc.).
The chance that consumer price inflation will decline below 6 percent has decreased because of hikes in payroll taxes for social security, an increased federal minimum wage, the first installment of the crude oil equalization tax, and crop acreage cut backs under government farm programs. In addition, productivity gains appear harder and harder to realize, especially given lagging business investment .. Other negative factors include increasing energy costs, higher prices for certain raw materials, and the depreciating value of the dollar which causes many types of imported supplies to become more costly.
The predicted increase in food prices, which rose 6.3 percent during 1977, ranges from as little as 4 percentto as much as 8 percent. Although reduced feed grain costs will help to hold meat prices in check, nonfarm fac~ors such as labor, transportation and food processing costs will cause
A-31
food prices generally to rise. On the positive side, no OPEC oil price increases have yet been an
nounced for 1978. In addition, there is a relatively light 1978 collective bargaining schedule involving only 2 million workers covered by major contracts. This contrasts to 4.4 million in 1976 and 5 million in 1977. It is hoped that the bargaining agreements reached in 1978 will produce only moderate labor cost increases, given the combination of more stable inflation expectations, continuing high unemployment, and slackened productivity gains. Most of the 1978 contract expirations were negotiated after the 1974 wage and price controls were scrapped and, thus, "catch-up" wage increases were in part already realized. Key 1978 negotiations will include construction, transportation equipment, retail food, airlines, maritime and postal workers. Concerning 1979, however, wage induced pressures could heighten due to the heavy bargaining schedule which includes the trucking and automobile industries.
There is increasing concern that the 6 percent "underlying" inflation rate in the United States is being "institutionalized", and is no longer controllable through traditional monetary and fiscal policies. In certain major economic sectors and markets,. for example, flexible pricing and wage making mechanisms have given way over time to "negotiated" agreements between concentrated business and labor groups. These agreements can produce wage-price spirals as inflationary expectations are incorporated in wages and prices, thereby contributing to inflation. As inflation rates become embedded in interest rates, long-term contract arrangements, collective bargaining agreements and public transfer payments, past and expected inflation rates become increasingly dominant determinants of future inflation rates.
Although economists agree that other factors such as excessive monetary growth are also responsible for today's 6 percent inflation rate, a number of leading economists have stressed the need to provide for a mutual de-escalation of wage and price increases through such policy tools as business income tax rebates or credits for price and wage restraints. Although such proposals remain controversial, there is a real need to creatively and effectively address the economy's inflationary problems. This is especially the case, given the past failures of standard monetary and fiscal policy tools to do so even in the midst -of excessive and persistent excess capacity and unemployment.
Major Price Index Revisions Forthcoming
The Consumer Price Index (CPI) is now extensively used to "index" a wide variety of economic variables such as wage rates and salaries, social security payments and other retirement benefits. The Bureau of Labor Statistics (BLS) has estimated that income payments received by more than one-half of all Americans (and representing about 15 percent of the total dollar value of all income payments in the nation) are automatically adjusted to changes in the CPI. Included among these groups are 8.5 million union members, 32 million social security recipients, nearly 2.5 million retired militarY and federal civil service employees and survivors, and about 20 million food stamp recipients. There are also 25 million school
A-32
children receiving free lunches through programs that are paid dollar adjustments for CPI-measured food price changes. Other places where the CPI is used include state and local government retirement programs, alimonies, lease agreements, certain royalty agreements, poverty thresholds and low-income programs. Even relatively small changes in the CPI can involve substantial monies. For example, the BLS estimates that a 1 percent change in the CPI can trigger more than a $1 billion change in income payments. The CPI index is, of course, also used as' a general measure of the economy's inflation rate, and thus, as a signal for governmental actions to encourage price stability. As the use of this index has expanded and significant rates of inflation have become commonplace, the need for improving the characteristics of the index has increased.
Beginning in 1978, a new revised CPI will be published by the BLS. The statistical sample used to construct this index will be based on far more commodities and geographic locations than the existing index. In addition, it will weight the importance of the various commodities in the index according to consumption patterns existing in 1972-73, as opposed to the 1961-62 patterns used in the old index. Lastly, the new revised index will represent the consumption habits of approximately 80 percent of the population, as opposed to the 40 percent previously represented. Significant revisions are also being made in the wholesale price index, which is used to automatically adjust prices for many products and materials.
The new revised CPI index is scheduled to be issued later this quarter. For a while thereafter, the BLS will publish three CPI indexes, including the new revised index, the old index, and a "hybrid" index which changes the old index only so as to substitute 1972-73 consumption habits for 1960-61 habits. Although this multiplicity of indexes will undoubtedly prove confusing to many observers, they will be needed for analysts to understand how inflation measured with the new index differs from inflation measured with the old. At present, these relationships are unknown. Exactly how the economy will make the transition between the old and new CPI for "indexing" various programs also remains to be seen.
Government Sector Stimulus Expected
Throughout much of 1977, uncertainties concerning federal government policies in such areas as social security financing, tax reform and reduction, energy taxes, and minimum wages appeared to dampen business confidence and hamper capital spending decisions. Some of these uncertainties have be,en alleviated. For example, the federal minimum wage was increased effective January 1978 from $2.30 per hour to $2.65 per hour, a change which will immediately affect an estimated 4.5 million workers (or nearly 5 percent of the labor force) . Further annual increases in the 'minimum wage have also been legislated through 1981. Secondly, social security tax increases on top of the increases previously legislated have been set. The most recent schedule of increases in both rates and the maximum taxable wage base will raise an estimated additional $230 billion in social security trust fund monies over the next decade. In 1978, federal social security tax receipts will increase by about $20 billion, with about $10 billion of this due to changes in the tax schedule. Both employees and
A-33
employers will share these added costs, with the maximum individual contribution dramatically increasing from under $1,000 in 1977 to over $3,000 in 1987. Although these changes could have certain negative impacts on the economy's near term inflation and unemployment situation, the resolution of minimum wage· and social security changes have undoubtedly dispelled some of the uncertainty concerning government poli-cies. .
As discussed below, however, federal energy policies remain clouded. Certain private research organizations have estimated that energy related tax hikes could raise federal receipts by anywhere between $3 billion and $10 billion by 1980, depending upon the exact congressional proposals actually enacted. In addition, energy policies will have unknown effects on overall domestic prices, the foreign trade balance, dollar values abroad, and foreign investments in the United States.
The most recent significant federal economic policy development, of course, involves the President's proposed $25 billion tax reduction package. Key features of the proposal include net reductions of $17 billion in income taxes for individuals, $6 billion in income taxes for corporations, and $2 billion for reduced business unemployment insurance taxes and repeal of the federal excise tax on telephone service. The individual cuts would apply primarily to incomes under $30,000. The business tax reduction includes expansion in coverage of the investment tax credit and reduction in corporate. tax rates, with the aim being to stimulate capital spending on plant and equipment. The package does not include such previously discussed reforms as elimination of preferential tax rates on capital gains, or reductions in double taxation of dividends. The stimulative effect of the tax package for the economy in 1978 will be limited because the package will not take effect until October 1978. In addition, the overall net stimulatory effect of the package is reduced to the extent that it merely offsets increased social security taxes and inflation-induced increases in income tax receipts. Most economists believe that the-package will help to ensure continuation of the expansion through 1979, although a number of analysts believe that a much larger tax reduction could significantly benefit the economy.
The proposed federal tax package will naturally tend to increase the federal budget deficit, probably to somewhat over $60 billion for fiscal 1979 (which begins October 1978). Thus, large federal budget deficits will continue over the forecast period. Some of the existing federal sector deficit, however, is being offset by the state-local government sector's budget surplus which is estimated at nearly $30 billion for 1977 and 1978. About half of this surplus is accounted for by special pension and unemployment account funds, with federal grants such as those for public works and public service employment, also contributing to the total. During 1977, federal grants to localities were running at an annual rate of over $70 billion with further increases expected. Local bond offerings also reached a record level in 1977: the $45 billion in offerings exceeded the previous peak by nearly 50 percent.
At the state level, current fiscal year revenues are expected to exceed expenditures by about $4.3 billion, with particularly large surpluses in
A-34
Texas and California. Notwithstanding these surpluses, however, states and cities are not expected to go on spending sprees. Rather, increased costs will be faced for social security coverage and unemployment compensation, and governments seem more inclined to trim or slow the increase in taxes. For example, state legislatures are estimated to have approved $475 million in tax increases in 1977, orronly about 50 percent of what was approved in each of the preceding two years. On balance, the state-local sector is expected to provide modest support for the 1978 economy.
Rising Interest Rates and Tightening Money Markets
Since April of 1977, short-term interest rates have risen substantially, as short-term credit demands have strengthened and inflation rates have somewhat stabilized. These short-term interest rates are now above 1976 levels. In contrast, most long-term interest rates have remained rather stable over this period, thus allowing the spread between short-term and long-term rates to narrow.
Movements in 1978 money market interest rates will depend upon such factors as monetary and fiscal policies, inflation, economic growth, and international sector developments. It is, therefore, not surprising that much uncertainty surrounds the 1978 interest rate outlook.
The basic assumptions underlying most interest rate forecasts for 1978 include accommodative yet moderate money supply expansion, a federal budget deficit in the vicinity of approximately $60 billion, overall CPI inflation in the 6 percent to 6.5 percent range, and economic growth somewhere between 3 percent and 5 percent. The actual level of economic expansion will largely determine the strength of credit demands and money market pressures. Although a variety of forecast scenarios exist, the consensus outlook suggests that moderate interest rate increases will appear during 1978 . .These increases will be due to the combination of a large federal deficit, continued strong mortgage demands, greater business borrowings, and reduced foreign purchases of Treasury securities caused by a depreciating dollar. Corporate bond financing in 1978 is. expected to approximate the $30 billion 1977 figure, while municipal bond offeririgs are anticipated to drop below the record 1977 level due to the improving fiscal position of many government entities.
One of the key elements in the outlook for interest rates is monetary policy. The growth in key monetary aggregates during 1976 and 1977 was high, with rates in the 6 percent to 9 percent range. This compares to under 5 percent during the period from mid-1973 to 1976. Manyeconomists believe that the 1977 rates are excessive if such aims as long-term price stability and a stable international economy are to be achieved. However, reduced rates of monetary expansion run the risk of interest rate increases in the short-term, which would initially threaten business investment, housing activity, and the' overall expansion of the economy. Monetary policy thus will have to continue "walkirig a fine line" between stimulating excessive inflation and supporti~g the current expansion.
A-35
Energy Concerns Continue·
. Energy related considerations in the overall 1978 economic outlook include continuing increases in energy costs, uncertainties concerning the administration's "energy program", and the persistent increases in U.S. imports of foreign oil with their contribution to both the substantial U.S. balance of payments deficit and the declining value of the dollar on for-eign exchange markets. .
Concerning energy prices, 1977 witnessed increases over the year of 10.2 percent for all fuels and utilities, a weighted average of 11.9 percent for gas and electricity, 17.3 percent for heating gas, 6.1 percent for electricity specifically, and 4.5 percent for gasoline. In 1978, energy prices are expected to continue rising. Overall electricity price increases in 1978 are generally expected to be under 10 percent although they will probably exceed 1977 levels. The actual amount of increase will depend upon factors such as the effects of the coal strike, the severity of the cold winter in the East, and the extent to which hydroelectric generating power is available in the West as drought conditions are alleviated. Energy industry sources project that natural gas prices will increase a minimum of about 13 percent in 1978, assmning that the 1977 pricing system remains in effect. Of course, natural gas prices could go up by far more than this amount if the President's proposed energy package is passed. The increase in gasoline prices, which now average about 63 cents per gallon nationally, will again depend largely on federal energy policies. If Congress passes legislation to raise the price of domestically produced crude oil to world levels, some analysts have predicted that gasoline prices could rise by 5 cents to 10 cents per gallon. One positive factor in the energy price outlook is that the OPEC cartel nations will apparently freeze their crude oil export prices for at least the first six months of 1978, due to continued weakness of the worldwide economic recovery and a current world excess of oil production over demand.
Apart from the issue offuture OPEC price changes, however, the magnitude of U.S. crude oil imports and their effect on international economic stability has been a subject of growing concern. United States oil imports have continued to rise, and now account for close to 50 percent of total U.S. consumption. This compares to under 35 percent in 1972. Meanwhile, U.S. domestic production of both oil and gas has been declining for over five years, while energy consumption has been rising. Many analysts believe that this growing U.s. energy import bill is the major cause of not only the current U.S. trade deficit, but also the worldwide exchange market disorders and exchange rate speculation. Foreign nations have been particularly critical of the U.S. for its lack of a meaningful energy program.
The President's proposals to deal with these energy problems; introduced in April 1977, were intended not only to reduce energy imports, but also to reduce overall energy consumption, increase coal production, accelerate the shift to alternative nonfossil energy sources such as solar and nuclear energy, establish strategic petroleum reserves, improve energy recovery technology, and increase the use of insulation. A variety of tax levies and credits were proposed to encourage these actions, including stiff new taxes on crude oil and "gas guzzling" autos, and partial price
" A-36
deregulation for natural gas. The administration's proposals remain subject to controversy and debate and, even if approved, would probably require considerable time for the development and implementation of regulations. Thus, the energy sector in 1978 remains clouded by much uncertainty and unresolved problems.
Troubled International Sector
The U.S. experienced a record trade deficit of nearly $30 billion in 1977, far greater than the $5.9 billion deficit recorded for 1976. For 1978, the outlook appears equally poor. The 1977 deficit developed due to a combination of high coffee import prices, increased dollar imports of oil and natural gas, reduced farm exports caused by good grain harvests abroad, and a deterioration of trade in manufactured goods. The 1978 outlook for foreign economies is rather pessimistic, as many nations face the prospect of anemic real growth, continued high unemployment and balance of payments problems. Some industrial nations face stronger inflationary pressures than others, making them less able to pursue stimulative policies. Nations with high rates of inflation continue to be hurt by high interest rates which deter capital investment. This problem is compounded by current uncertainties and volatility in foreign exchange markets. Thus, it is not surprising that the volume of real international trade is expected to expand by less in 1978 than in either 1976 or 1977. Exports from the U.S. will continue to be weak due to the sluggishness of foreign economies.
Perhaps the most dramatic foreign sector development of 1977 has been the sharp fall in the dollar's value against the currencies of such nations as Germany, France, Switzerland, England and Japan. Eventually, depreciation of the dollar would be expected to help the U.S~ balance of payments as the cost of U.S. foreign imports rises relative to that of U.S. domestic exports. However, because these price changes normally precedethe associated changes in the demands for imports and exports, the mosttmmediate effect of dollar depreciation has been to further depress the U.S. trade balance. At present, there is increasing concern about the "sagging" dollar and its adverse impact on foreign investment in the U.S., the dollar's position as the world's primary trading currency, the U.S .. balance of payments, international petroleum prices, and inflation in the U.S. The potential effects of these foreign sector problems have become quite significant for our nation, as the combined volume of U.S. imports and exports has risen over the past decade from the equivalent of about 10 percent of GNP to nearly 20 percent of GNP. I
Given the outlook for international trade, it is not surprising that there have been sharp pressures for "protectionism". Within the U.S., organized labor has sought quotas and other import restraints to aid such industries as steel, electronics, shoes, textiles and apparel from, among others, Japanese competition. Additional pressures have been surfacing to eliminate favorable existing tax provisions for domestic international sales corporations (DISCs) and foreign corporate operations, andthe repeal of certain tariff provisions encouraging the use of cheap foreign labor.
There is considerable doubt as to how the world's complex international
A-37
currency and trade problems will be approached in 1978. Much of the uncertainty is due to the lack of agreement over the underlying causes of
, these problems. The U.S., for example, would like to see certain major foreign nations apply more stimulus to their economies so as to aid U.S. exports. On the other hand, foreigners suggest that the lack of a coherent U.S. policy to reduce the large oil import bill is a major factor. Yet, any immediate reduction in U.S. energy imports cOllld itself threaten the domestic expansion. .
Recently, both the U.S. and certain foreign nations have intervened in foreign exchange markets to support the value of the U.S. curency, while Japan has agreed to increase its imports of U.S. agricultural products so as to reduce its mounting trade surplus with the U.S. Nevertheless, a solution to the many problems of the troubled international sector seems far away, and the foreign trade sector will continue to be a source of considerable uncertainty in the U.S. outlook.
1978 CALIFORNIA FORECAST
Last Year Exceeded Expectations
As with the nation, 1977 was, on balance, a year of continued expansion for the California economy, though one marked with troublesome inflation. On the basis of most economic indicators, California outperformed the nation. Personal income rose by 12.5 percent, taxable corporate profits by nearly 20 percent and residential building permits by 25 percent. The preliminary estimate of 4.3 percent civilian employment growth in 1977 was the greatest yearly increase since 1966.
Table 1 indicates that the state outperformed the Department of Finance's initial expectations for personal income, corporate profits, taxable sales, employment and unemployment, building permits and new car sales (which recorded the largest increase in history). In fact the record 19 percent increase in taxable sales was nearly twice the initial forecast. On the negative side, unemployment remained at an excessive 7.6 percent (unrevised), while consumer price inflation ran at a disturbingly high 7 percent rate. Both were a bit higher than the national averages. Although 1977 drought conditions had a negative impact on certain agricultural sectors and geographic areas, agriculture in California fared far better than many analysts had predicted. California's gross farm income managed to maintain its $9.5 billion 1976 level, although increased production costs reduced net farm income by about 10 percent, to slightly above $2 billion.
As the year ended, the estimated 5 percent growth in gross state product had made California the equivalent economically of the eighth largest "niltion" in the world.
1978 to Produce Slower Growth but Significant Gains
California's 1978 economic outlook, like the nation's, is' for continued expansion. Because the state'represents about one-tenth of the nation in terms of income, population and employment, it is not surprising that the overall economic outlooks for the state and nation are somewhat similar. On the other hand, the structure of the state's economic base has certain
A-38
special features that distinguish it from the U.S. economy. For example, a smaller portion of its work force is employed by goods-producing industries, and what manufacturing activity the state does have is concentrated in high technology industries such as electronics and aerospace. The lack of heavy manufacturing, plus the large service sector, makes the state less cyclically volatile than the nation during business fluctuations. In the 1973-75 recession period, for example, the recession pattern in California was similar to that nationally, whereas the state's recession magnitude was far less severe. California essentially outperformed the nation during the recession, and has continued to do so since then, as can be seen from state-national employment growth comparisons.
The consensus outlook is for continued though slowing expansion of the California economy through 1978 and into 1979, accompanied by inflation in the 6 percent to 7 percent range. Personal income is expected to increase between 10 percent to 11 percent with wage and salary income at the upper end of this range. Further significant employment gains are expected, although 1978 unemployment will probably still exceed 7 percent. Most analysts expect California to continue to perform favorably relative to the nation during 1978 as regards economic growth, employment and income expansion. However, certain forecasters have suggested that the state's "edge" over the nation could diminish and eventually disappear, based on long-term relationships between the state and national economies. California's unemployment rate will remain above that nationally over the forecast period due to various state labor force characteristics such as strong overall labor force growth, high mobility, continued increases in female labor force participation, a relatively high proportion of youth in the job market, and relatively heavy in-migration. Federal government stimulatory policies could give the expansion additional strength, however, depending upon their specific provisions. Of course, 'any significant improvement in capital spending nationally would help California's electrical equipment, electronics and nonelectrical machinery manufacturing industries.
- California's export growth will again be restrained by the weaknesses in foreign economies. Exports in 1977 were particularly hurt by declines in shipments of agricultural products, as foreign harvests improved and farm prices softened. In addition, the commercial aircraft industry faced stiff foreign competition. Although interpretation of full year 1977 trade statistics is complicated by a major dock strike, California exports for the first half of 1977 rose only 0.3 percent versus 12 percent for all of 1976. In contrast, 1977 California imports rose faster than in 1976, due to coffee, automobile and petroleum demands. Many of these trends are anticipated to continue in 1978.
Table 5, on page A-40, presents highlights of the Department of Finance forecast for California as compared with the prior two years. Table 6, on page A-41, indicates that the department's California outlook is generally compatible with those of other forecasters. Table 7, on page A-41, compares selected economic indicators for the state to those of the nation.
A-39
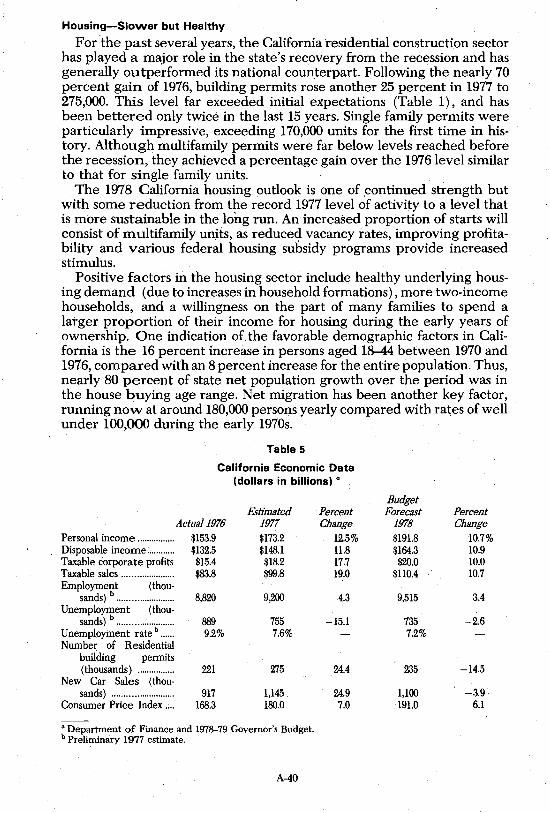
Housing-Slovver but Healthy
For the past several years, the California residential construction sector has played a major role in the state's recovery from the recession and has generally outperformed its national counterpart. .Following the nearly 70 percent gain of 1976, building permits rose another 25 percent in 1977 to 275,000. This level far exceeded initial expectations (Table 1), and has been bettered only twice in the last 15 years. Single family permits were particularly impressive, exceeding 170,000 units for the first time in history. Although multifamily permits were far below levels reached before the recession, they achieved a percentage gain over the 1976 level similar to that for single family units.
The 1978 California housing outlook is one of continued strength but with some reduction from the record 1977 level of activity to a level that is more sustainable in the long run. An increased proportion of starts will consist of multifamily units, as reduced vacancy rates, improving profitability and various federal housing subsidy programs provide increased stimulus.
Positive factors in the housing sector include healthy underlying housing demand (due to increases in household formations) , more two-income households, and a willingness on the part of many families to spend a larger proportion of their income for housing during the early years of ownership. One indication of the favorable demographic factors in California is the 16 percent increase in persons aged 18-44 between 1970 and 1976, compared with an 8 percent increase for the entire population. Thus, nearly 80 percent of state net population growth over the period was in the house buying age range. Net migration has been another key factor, running now at around 180,000 persons yearly compared with rates of well under 100,000 during the early 1970s.
Table 5
California Economic Data (dollars .in billions) a
Estimated . Percent Actual 1976 1977 Change
Personal income ................ $153.9 $173.2 12.5% Disposable income ............ $132.5 $148.1 11.8 Taxable corporate profits $15.4 $18.2 17.7 Taxable sales ...................... $83.8 $99.8 19.0 Employment (thou-
sands) b .•....••....••••••...... 8,820 9,200 4.3 Unemployment (thou-
sands) b ..........•.••••••...... 889 755 -15.1 Unemployment rate b •••... 9.2% 7.6% Number of Residential
building permits (thousands) ................ 221 275 24.4
New Car Sales (thou-sands) .......................... 917 1,145 24.9
Consumer Price Index .... 168.3 180.0 7.0
a Department of Finance and 1978-79 Governor's Budget. b Preliminary 1977 estimate.
A-40
Budget Forecast Percent
1978 Change $191.8 10.7% $164.3 10.9 $20.0 10.0
$110.4 10.7
9,515 3.4
735 -2.6 7.2%
235 -14.5
1,100 -3.9 191.0 6.1
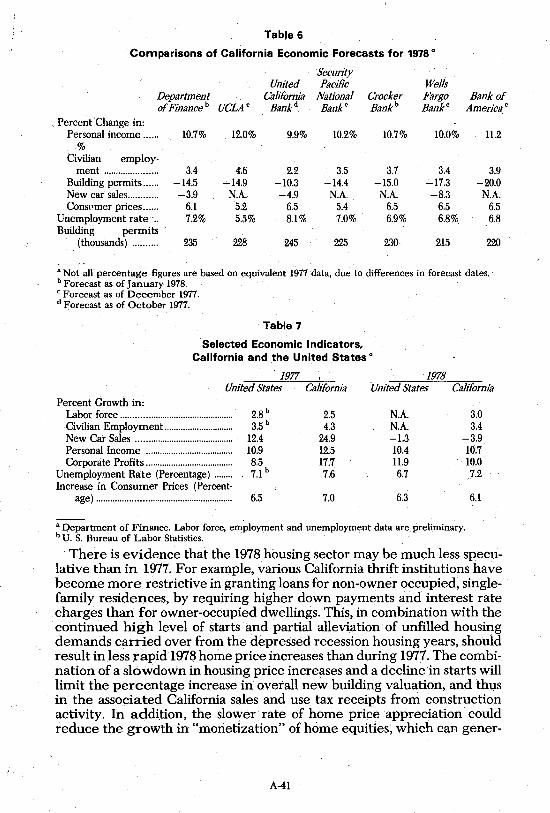
Table 6
Comparisons of California Economic Forecasts for 1978 Q
Security United Pacific Wells
Department California National Crocker Fargo Bank of ofFinance b UCLA e Bank d Banke Bank b Banke America e
,Percent Change in: Personal income ...... 10.7% 12.0% 9.9% 10.2% 10.7% 10.0% 11.2
% Civilian employ-
ment ...................... 3.4 4.6 2.2 3.5 3.7 3.4 3.9 Building permits ...... -14.5 -14.9 -10.3 ~14.4 -15.0 -17.3 -20.0 New car sales ............ -3.9 N.A. -4.9 N.A. N.A. -8.3 N.A. Consl'mer prices ...... 6.1 5.2 6.5 5.4 6.5 6.5 6.5
Unemployment rate -.. 7.2% 5.5% 8.1 % 7.0% 6.9% 6.8%. 6.8 Building permits
(thousands) .......... 235 228 245 225 230, 215 220
a Not all percentage figures are based on equivalent 1977 data, due to differences in forecast dates. b Forecast as of January 1978. e Forecast as of December 1977. d Forecast as of October 1977.
Table 7
Selected Economic Indicators, California and the United States Q
1977 , -1978 United States California United States California
Percent Growth in: Labor force ........................ ; ..................... .. Civilian Employment ............................ .. New Car Sales ......................................... . Personal Income ..................................... . Corporate Profits .................................... ..
Unemployment Rate (Percentage) ....... . Increase in Consumer Prices (Percent-
age) ........................................................ ..
2.8 b
3.5 b
12.4 10.9 8.5 7.1 b
6.5
2.5 4.3
24.9 12.5 17.7 7.6
7.0
N.A. N.A. -1.3 10.4 11.9 6.7
6.3
3.0 3.4
-3.9 10.7 10.0 7.2
6.1
a Department of Finance. Labor force, employment and unemployment data are preliminary. bU. S. Bureau of Labor Statistics.
There is evidence that the 1978 housing sector may be much less speculative than in 1977. For example, various California thrift institutions have become more restrictive in granting loans for non-owner occupied, singlefamily residences, by requiring higher down payments and interest rate charges than for owner-occupied dwellings. This, in combination with the continued high level of starts and partial alleviation of unfilled housing demands carried over from the depressed recession housing years, should result in less rapid 1976 home price increases than during 1977. The combination of a slowdown in housing price increases and a decline in starts will limit the percentage increase in overall new building valuation, and thl.,ls in the associated California sales and use tax receipts from construction activity. In addition, the slower rate of home price appreciation could reduce the growth in "monetization" of home equities, which can gener-
A-41
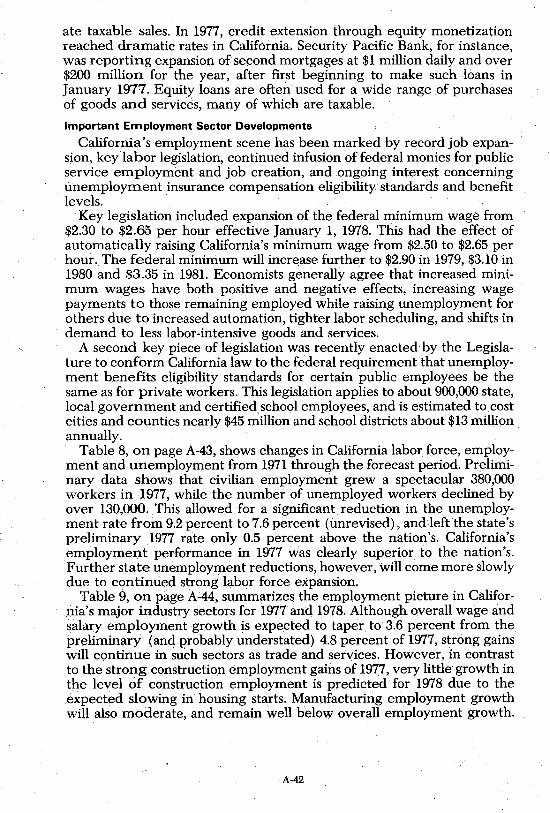
ate taxable sales. In 1977, credit extension through equity monetization reached dramatic ra.tes in California. Security Pacific Bank, for instance, was reporting expansion of second mortgages at $1 million daily and over $200 million for the year, after first beginning to make such loans in January 1977. Equity loans are often used for a wide range of purchases of goods and services, many of which are taxable.
Important Employment Sector Developments
California's employment scene has been marked by record job expansion, key labor legislation, continued infusion of federal monies for public service employment and job creation, and ongoing interest concerning unemployment insurance compensation eligibility standards and benefit levels.
Key legislation included expansion of the federal minimum wage from $2.30 to $2.65 per hour effective January 1, 1978. This had the effect of automatically raising California's minimum wage from $2.50 to $2.65 per hour. The federal minimum will increase further to $2.90 in 1979, $3.10 in 1980 and $3.35 in 1981. Economists generally agree that increased minimum wages have both positive and negative effects, increasing wage payments to those remaining employed while raising unemployment for others due to increased automation, tighter labor scheduling, and shifts in demand to less labor-intensive goods and services.
A second key piece of legislation was recently enacted by the Legislature to conform California law to the federal requirement that unemployment benefits eligibility standards for certain public employees be the same as for private workers. This legislation applies to about 900,000 state, local government and certified school employees, and is estimated to cost cities and counties nearly $45 million and school districts about $13 million annually. . . Table 8, on page A-43, shows changes in California labor force, employment and unemployment from 1971 through the forecast period. Pr~liminary data shows that civilian employment grew a spectacular 380,000 workers in 1977, while the number of unemployed workers declined by over 130,000. This allowed for a significant reduction in the unemployment rate from 9.2 percent to 7.6 percent (unrevised), and1eft the state's preliminary 1977 rate only 0.5 percent above the nation's. California's employment performance in 1977 was clearly superior to the nation's. Further state unemployment reductions, however, will come more slowly due to continued strong labor force expansion.
Table 9, on page A-44, summarizes the employment picture in Califor.nia's major industry sectors for 1977 and 1978. Although overall wage and salary employment growth is expected to taper to 3.6 percent from the preliminary (and probably understated) 4.8 percent of 1977, strong gains will continue in such sectors as trade and services. However, in contrast to the strong construction employment gains of 1977, very little· growth in the level of construction employment is predicted for 1978 due to the expected slowing in housing starts. Manufacturing employment growth will also moderate, and remain well below overall employment growth.
A-42
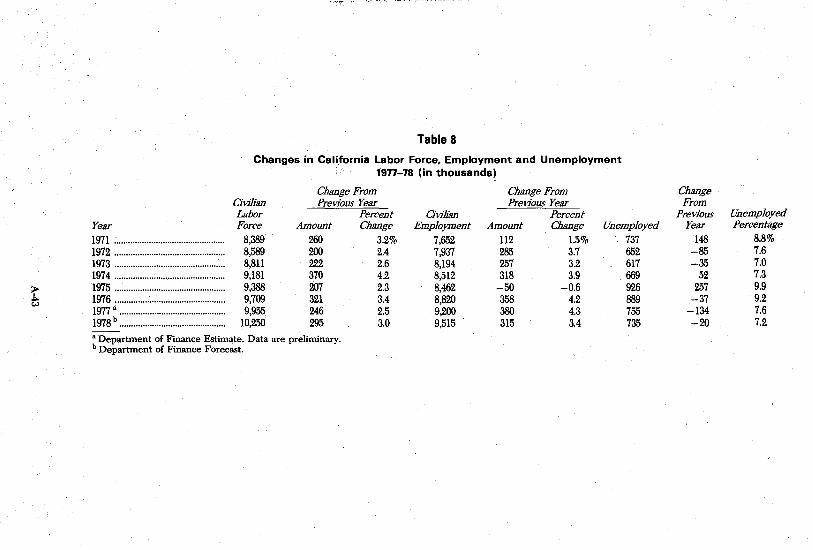
t
Table 8
Changes in California labor Force, Employment and Unemployment 1977-78 (in thousands)
Change From Change From Civilian Previous Year Previous Year Labor Percent Civilian Percent
Year Force Amount Change Employment Amount Change Unemployed
1971 : ............................................... 8,389 260 1972 ................................................ 8,589 200 1973 ................................................ 8,811 222 1974 ................................................ 9,181 370 1975 ................................................ 9,388 207 1976 ................................................ 9,709 321 1977" .............................................. 9,955 246 1978 b .............................................. 10,250 295
• Department of Finance Estimate. Data are preliminary. b Department of Finance Forecast.
3.2% 2.4 2.6 4.2 2.3 3.4 2.5 3.0
7,652 112 1.5% 737 7,937 285 3.7 652 8,194 257 3.2 617 8,512 318 3.9 669 8,462 -50 -0.6 926 8,820 358 4.2 889 9,200 380 4.3 755 9,515 315 3.4 735
Change From
Previous Unemployed Year Percentage
148 8.8% -85 7.6 -35 7.0
52 7.3 257 9.9
-37 9.2 -134 7.6 -20 7.2
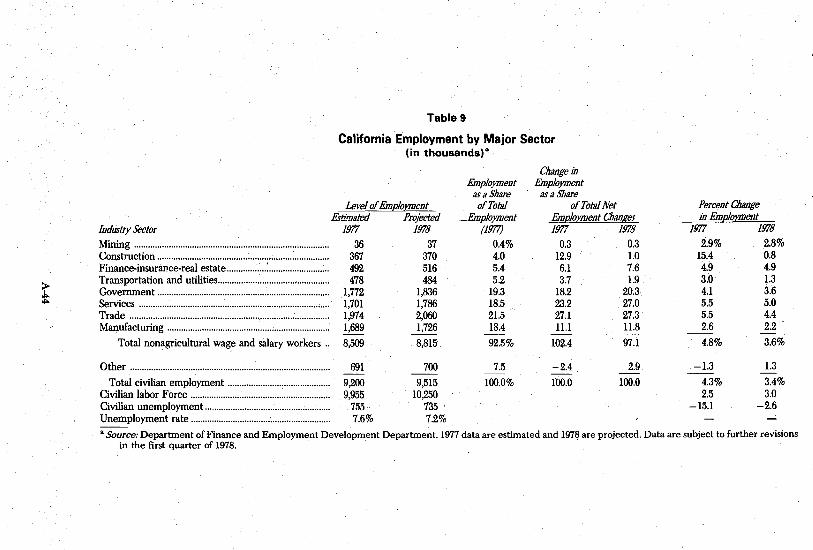
~
Industry Sector Mining ................................................................................... . Construction ......................................................................... . Finance-insurance-real estate ................. : ....................... : .. Transportation and utilities ................................. , ............. . Government ......................................................................... . Services ................................................................................. . Trade ...................................................................... : ............. . Manufacturing ..................................................................... .
Total nonagricultural wage and salary workers ..
Other .............. · .............. c •••••••••••••••••••••••••••••••••••••••••••••••••••••••••
Total civilian employment ........................................... . Civilian labor Force ........................................................... . Civilian unemployment ..................................................... . Unemployment rate ........................................................... .
Table 9
California Employment by Major Sector (in thousands)·
Levelof Employment Esti!'!laied
1977 36
367 492 478
1,772 1,701 1,974 1,689
8,509
691
9,200 9,955
755 7.6%
Projected 1978
37 370 516 484
1,836 1,786 2,060 1,726
8,815
700
9,515 10,250
735 7.2%
Employment asaShare ofTota/
__ Employment (1977)
0.4% 4.0 5.4 5.2
19.3 18.5 21.5 18.4
92.5%
7.5
100.0%
Change in Employment
. asaShare ofTota/Net
Employment Changes 1977 1978
0.3 0.3 12.9 1.0 6.1 7.6 3.7 1.9
18.2 20.3 23.2 27.0 27.1 27.3 ILl 11.8
102.4
-2.4
100.0
97.1
2.9
100.0
Percent Change in Employment
1977 1978 2.9% 2.8%
15.4 0.8 4.9 4.9 3.0 1.3 4.1 3.6 5.5 5.0 5.5 4.4 2.6 2.2
4.8%
-1.3
4.3% 2.5
-15.1
3.6%
1.3
3.4% 3.0
-2.6
a Source: Department of Finance and Employment Development Department. 1977 data are estimated and 1978 are projected. Data are subject to further revisions in the first quarter of 1978.
One surprising development in 1977 was that cancellation of the B-1 bomber project caused less net job loss than was initially expected.
Table 9 also summarizes the distribution of employment gains by major industry sector for 1977 and 1978. In 1977, approximately 70 percent of total job gains occurred in the government, services and trade sectors, and these sectors are expected to account for some 75 percent of the gains in 1978. Over 50 percent of such gains are predicted to occur in services and trade alone.These projections do not consider the possible effects on the levels and distribution of employment by sector due to the possible adoption of the Jarvis-Gann Initiative on the June 1978 ballot. This initiative would reduce local property tax revenues by about $7 billion. Table 10, on the following page, provides a more detailed view of the role which selected innividual industries played in the record employment growth of 1977.
Some of these gains may have been stimulated by federal monies for public service employment, job creation and training received under the CETA and PWEA programs. However, the debate continues over the extent to which CETA and PWEA programs create jobs rather than merely substitute federal for state and local money.
Employment and Unemployment Data Improvements Recommended
State employment and unemployment estimates are important for a number of reasons. Employment data are used as the basis for projecting state personal income growth and state tax revenues. In addition, billions of federal dollars are distributed annually for such programs as manpower revenue sharing, unemployment compensation, public service jobs and public works, on the basis of national, state and local area unemployment rates. Lastly, the availability of reliable and relatively comprehensive employment and unemployment data has the potential to significantly improve the effectiveness of state programs in such areas as vocational education, manpower training, health and welfare needs, and housing and transportation planning. .
Many problems exist concerning employment and unemployment data. At the federal level, the National Commission on Employment and Unemployment Statistics was recently established to comprehensively review and recommend changes in the area of unemployment data. At present, the Department of Labor has at least half a dozen basic aggregate unemployment indicators, and there is considerable debate over what specific definition of unemployment should ideally be used to allocate federal monies. Typical problems include how to treat involuntary part-time workers (who are currently treated as employed), "discouraged workers" who have quit looking for jobs because they do not expect to be successful in finding one (and thus, are not counted as unemployed), "low productivity" workers (who are employed below their potential abilities) , and students who cannot find temporary employment. There is also debate as to whether "long~term" unemployed persons should count more heavily than other unemployed persons for federal money allocations. Unfortunately, the commission's findings will not be available for severalyears.
The· problem of employment and unemployment data for states and localities is both more immediate and severe than it is nationally. National
A-45
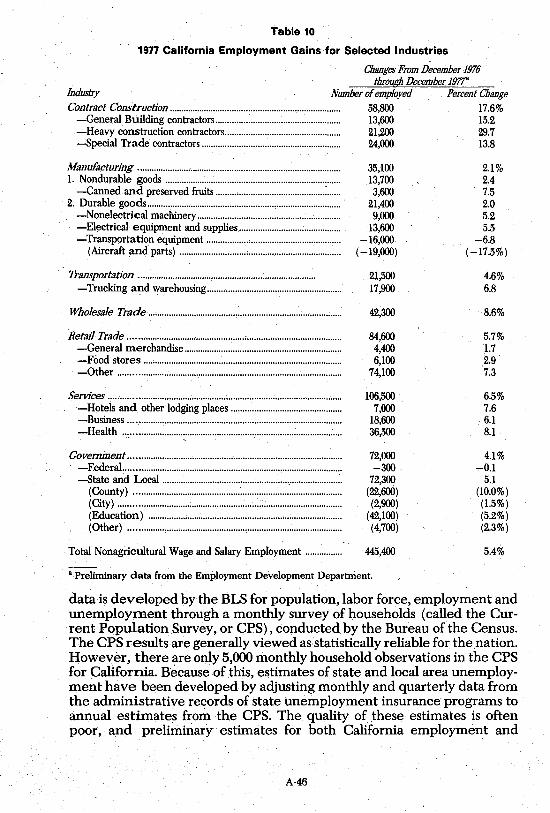
Table 10
1977 California Employment Gains for Selected Industries
. Changes From December 1976 through December 1977"
Industry Number of employed Percent Change Contract Construction .......................................................................... 58,800 17.6%
-General Building contractors...................................................... 13,600 15.2 -Heavy construction contractors.................................................. 21,200 29.7 --.:special Trade contractors ............................................................ 24,000 13.8
Manufacturing ........................................................................................ . 1. Nondurable goods ........................................................................... .
-Canned and preserved fruits ............................................... : ..... . 2. Durable goods ................................................................................... .
-Nonelectrical machinery ............................................................. . -Electrical equipment and supplies ........................................... . -Transp9rtation equipment ......................................................... .
(Aircraft and parts) ..................................................................... .
Transportabon· ............................................................................ .. -Trucking and warehousing ......................................................... .
Wholesale Trade ....................................... : ............................. , ............. .
Retail Trade .................................................. ; ....................................... .. -General merchandise ................................................................... . -Food stores .................................................................................... .. -Other .............................................................................................. ..
Services .................................................................................................. .. -Hotels and other lodging places .............................................. .. -Business ............................................................................................ . -Health ... : .......................................................................................... .
Government ........................................................................................... . -Federal ............................................................................................. . -State and Local ............................................................................. .
(County) ........................................................................................ .. (City) .............................. ; ................................................................ . (Education) ................................................................................... . (Other) ........................................................................................... .
Total Nonagricultural Wage and Salary Employment .............. ..
35,100 13,700 3,600
21,400 9,000
13,600 -16,000
(-19,000)
21,500 17,900
42,300
84,600 4,400 6,100
74,100
106,500 7,000
18,600 36,500
72,000 -300 .
72,300 (22,600) (2,900)
(42,100) (4,700)
445,400
"Preliminary data from the Employinent Development Department.
2.1% 2.4 7.5 2.0 5.2 5.5
-6.8 (-17.5%)
4.6% 6.8
8.6%
5.7% 1.7 2.9 7.3
6.5% 7.6 6.1 8.1
4.1% -0.1
5.1 (10.0%) (1.5%) (5.2%) (2.3%)
5.4%
data is developed by the BLS for population, labor force, employment and unemploym.ent through a monthly survey of households (called the Current Population Survey, or CPS) , conducted by the Bureau of the Census. The CPS results are generally viewed as statistically reliable for the nation. However, there are only 5,000 monthly household observations in the CPS for California. Because of this, e~timates of state· and local area unemployment have been developed by adjusting monthly and quarterly data from the administrative records of state unemployment insurance' programs to annual estimates from the CPS. The quality of these estimates is often poor, and preliminary estimates for both California employment and
A-46
unemployment are typically subject to much revision. Early in 1977, for example, revisions were made that raised the 1976 growth rate forCalifornia wage and salary employment from 1.9 percent to 3.7 percent, the civilian employment growth rate from 1.7 percent to 4.2 percent, and the labor force growth rate from 1.4 percent to 3.4 percent, while the civilian unemployment rate was revised downward from 9.6 percent to 9.2 percent. Significant revisions in the preliminary 1977 data are also expected. Obviously, such revisions can create considerable problems in accurately assessing the direction of the state's economy; its revenue expectations and, to some extent, the amount of federal monies that can be anticipated.
One way of improving California's employment, unemployment and labor force data is to expand the size of the CPS sample in the state. We believe that this possibility should be explored, and are, therefore, recommending that the Employment Development Department allocate $7.6 million in PWEA funds for a one-year trial project to expand the CPS survey. in California by 35,000 households. This recommendation is presented and discussed on page 567. As the improved data become available, state departments and agencies will be in a position to report to the Legislature on the various potential benefits to their programs of the extensive CPS data involving the labor force, employment and unemployment, education, housing, income distributions, receipt of public assistance monies,and so forth. We also believe that the Employment Development Department should review the possibility of improving its data collection and retrieval systems associated with unemployment insurance records. Improved information from this source may offer significant potential benefits for effective manpower planning, state unemployment insurance program modification, and health and welfare policy decisions.
Drought Fears Lessen
Unexpectedly strong precipitation and snowfall in late 1977 and early 1978 have raised hopes that California's severe drought period may be ever. As of early February, water storage in major northern California reservoirs was above 60 percent of capacity, versus only 40 percent at the same time last year. In addition, the heavy snowpack in the mountain areas ensures that reservoir inflows will be significant through next spring. This should increase the availability of hydroelectric power generation as opposed to 1977, when more expensive substitute power sources were required. Recent precipitation has also begun the slow process of replenishing water tables and underground basins, which dropped significantly over the past several years in certain regions of the state. . The overall impacts 6f the drought on the 1977 California economy were less than commonly anticipated. The hardest hit sector was the livestock industry, which recorded considerable losses. Some recovery in 1978 is likely if sufficient rain keeps range grass healthy. The dairy industry benefited from a drop in feed grain costs and an increase in state-regulated milk prices: In spite of the drought, gross agricultural output in the state remained at its 1976 level, due to ground water pumping, crop rotations, increased well drilling, and improved irrigation efficiencies. Many of these adjustments, though, raised costs to farmers and contributed to an approxi-
A-47
mate lO percent decline in net farm income. Both state and federallegislation helped to soften the drought's impacts by authorizing various feed programs, loans for well drilling, and agricultural property tax relief. Industrial activity appeared little affected by the drought, while the housing construction sector was not particularly damaged by limitations on water hookups and may have actually benefited due to more dry "building days".
For 1978, California agricultural prospects are favorable. Of course, farm expenses will continue to rise, and there are certain weaknesses such as the current high unsold inventory of canning crops; However, water availability should be generally sufficient, and the outlook for California farm prices is good.
Business Climate Generally Favorable
California's attractiveness to business is affected by many factors including the state's regulatory and environmental standards, tax policies, and energy availability. The effect of both the business inventory tax and the unitary tax assessment method for multistate and multinational corporations continues to be debated. However, there is little objective informatim! available as to their actual disincentive effects to industry. Energy uncertainties involve the future price and availability of natural gas (which is heavily relied on in southern California) and the inevitable clashes between environmental and other economic goals. One example of such a clash will come about as the economy continues to increase its energy demands. Shortages of low-polluting natural gas and hydroelectric power may require increased use of oil and coal.
On the positive side the Legislature enacted provisions in 1977 to speedup the permit approval process for business location. proposals, and a permit clearinghouse function was established in the Office of Planning and Research.
Overall, the California economy remains unusually attractive to business, despite its problems and uncertainties. This is not surprising given its modern and efficient capital stock, diverse agricultural sector, highly educated and skilled labor force, high technology industrial base, extensive economic infrastructure, international trade activities, excellent public services and large in-state market for goods and services.
REVENUE ANALYSIS
Substantial Revenue Increase Expected in Current Year
Current estimates by the Department of Finance indicate General Fund revenues and transfers in 1977-78 will total approximately $13.4 billion, an increase of 17.4 percent over actual receipts of $11.4 billion in the previous year. Table 11 compares, by major source, revenues received in 1976--77 with those estimated for the current year.
A-48
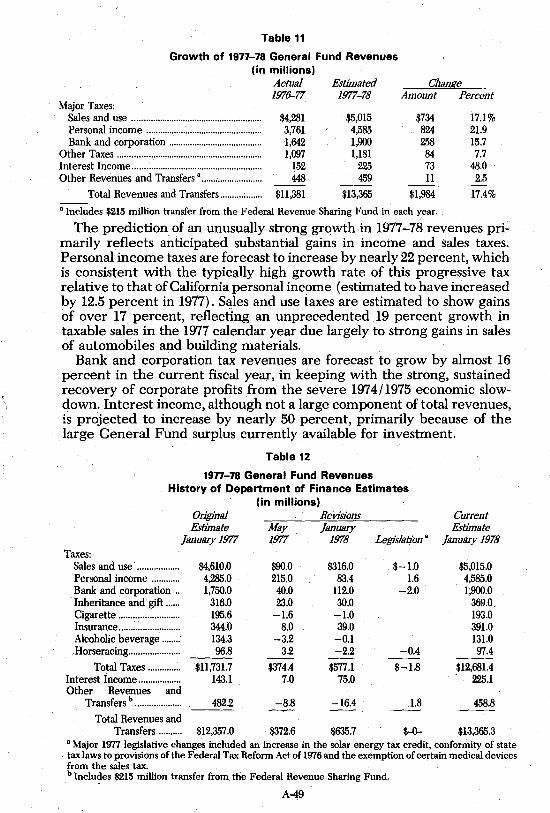
Table 11
Growth of 1977-78 General Fund Revenues (in millions)
Actual Estimated Change 1976-77 1977-78 Amount Percent
Major Taxes: Sales and use ....................................................... . Personal income ................................................. . Bank and corporation ....................................... .
Other Taxes ............................................................. . Interest Income ....................................................... . Other Revenues and Transfers' ......................... .
Total Revenues and Transfers ................. .
$4,281 3,761 1,642 1,097
152 448
$11,381
$5,015 4,585 1,900 1,181
225 459
$13,365
$734 824 258 84 73 11
$1,984
• Includes $215 million transfer from the Federal Revenue Sharing Fund in each year.
17.1 % 21.9 15.7 7.7
48.0 2.5
17.4%
The prediction of an unusually strong growth in 1977-78 revenues primarily reflects anticipated substantial gains in income and sales taxes. Personal income taxes are forecast to increase by nearly 22 percent, which is consistent with the typically high growth rate of this progressive tax relative to that of California personal income (estimated to have increased by 12.5 percent in 1977). S~les and use taxes are estimated to show gains of over 17 percent, reflecting an unprecedented 19 percent growth in taxable sales in the 1977 calendar year due largely to strong gains in sales of automobiles and building materials.
Bank and corporation tax revenues are forecast to grow by almost 16 percent in the current fiscal year, in keeping with the strong, sustained recovery of corporate profits from the severe 1974/1975 economic slowdown. Interest income, although not a large component of total revenues, is projected to increase by nearly 50 percent, primarily because of the large General Fund surplus currently available for investment.
Table 12
1977-78 General Fund Revenues History of Department of Finance Estimates
(in millions) Original Revisions Current Estimate May January Estimate
January 1977 1977 1978 Legislation • Januilry 1978 Taxes:
Sales and use .................. $4,610.0 $90.0 $316.0 $-1.0 $5,015.0 Personal income ............ 4,285.0 215.0 83.4 1.6 4,585.0 Bank and corporation .. 1,750.0 40.0 112.0 -2.0 1,900.0 Inheritance and gift ...... 316.0 23.0 30.0 369.0 Cigarette .......................... 195.6 -1.6 -1.0 193.0 Insurance ........ ~ ................. 344.0 8.0 39.0 391.0 Alcoholic beverage ........ 134.3 -3.2 -0.1 131.0 .Horseracing ...................... 96.8 32 -2.2 -0.4 97.4 -- --
Total Taxes .............. $11,731.7 $374.4 $577.1 $-1.8 $12,681.4 Interest Income .................. 143.1 7.0 75.0 225.1 Other Revenues and
Transfers b .................... 4822 -8.8 -16.4 1.8 458.8
Total Revenues and Transfers .......... $12,357.0 $372.6 $635.7 $-0- $13,365.3
• Major 1977 legislative changes included an increase in the solar energy tax credit, conformity of state tax laws to prOvisions of the Federal Tax Reform Act of 1976 and the exemption of certain medical devices from the sales tax. b Includes $215 million transfer from the Federal Revenue Sharing Fund.
A-49
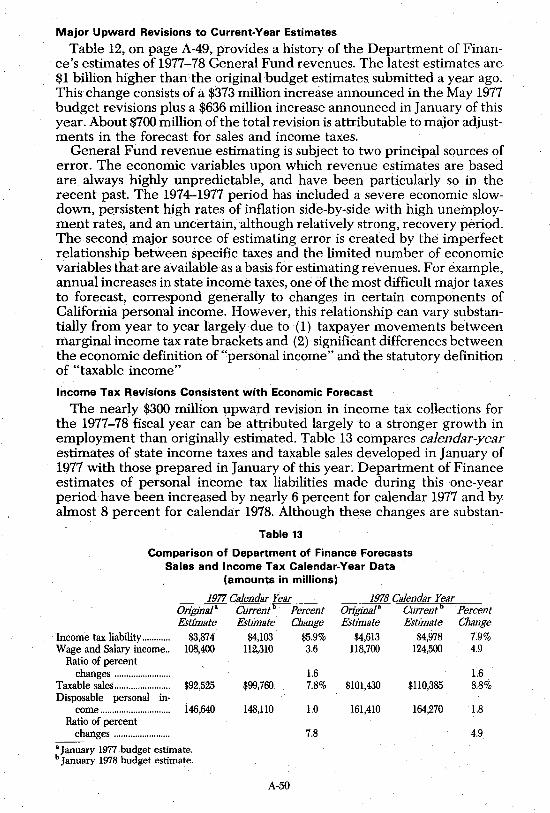
Major Upward Revisions to Current-Year Estimates
Table 12, on page A-49, provides a history of the Department of Finance's estimates of 1977-78 General Fund revenues. The latest estimates are $1 billion higher than the original budget estimates submitted a year ago. This change consists of a $373 million increase announced in the May 1977 budget revisions plus a $636 million increase announced in January of this year. About $700 million of the total revision is attributable to major adjustments in the forecast for sales and income taxes.
General Fund revenue estimating is subject to two principal sources of error. The economic variables upon which revenue estimates are based are always highly unpredictable, and have been particularly so in the recent past. The 1974-1977 period has included a severe economic slowdown, pe_rsistent high rates of inflation side-by"side with high unemployment rates, and an uncertain, although relatively strong, recovery period. The second major source of estimating error is created by the imperfect relationship between specific taxes and the limited number of economic variables that are available as a basis for estimating revenues. For example, annual increases in state income taxes, one of the most difficult major taxes to forecast, correspond generally to changes in certain components of California personal income. However, this relationship can vary substantially from year to year largely due to (1) taxpayer movements between marginal income tax rate brackets and (2) significant differences between the economic definition of "personal income" and the statutory definition of "taxable income"
Income Tax Revisions Consistent with Economic Forecast
The nearly $300 million upward revision in income tax collections for the 1977-78 fiscal year can be attributed largely to a stronger growth in employment than originally estimated. Table 13 compares calendar-year estimates of state income taxes and taxable sales developed in January of 1977 with those prepared in January of this year. Department of Finance estimates of personal income tax liabilities made during this one-year period have been increased by nearly 6 percent for calendar 1977 and by almost 8 percent for calendar 1978. Although these changes are substan-
Table 13
Comparison of Department of Finance Forecasts Sales and Income Tax Calendar-Year Data
(amounts in millions)
1977 Calendar Year Original" Estimate
Income tax liability ........... . $3,874 Wage and Salary income .. 108,400
Ratio of percent changes ....................... .
Taxable sales ....................... . $92,525 Disposable personal in-
come ............................. . 146,640 Ratio of percent
changes ....................... .
"January 1977 budget estimate. b January 1978 budget estimate.
Current b Percent Eshmate Change
$4,103 $5.9% 112,310 3.6
1.6 $99,760 7.8%
148,110 1.0
7.8
A-50
1978 Calendar Year Original" Current b
Eshmate Eshmate $4,613 $4,978
118,700 124,500
$101,430 $110,385
161,410 164,270
Percent Change
7.9% 4.9
1.6 8.8%
1.8
4.9
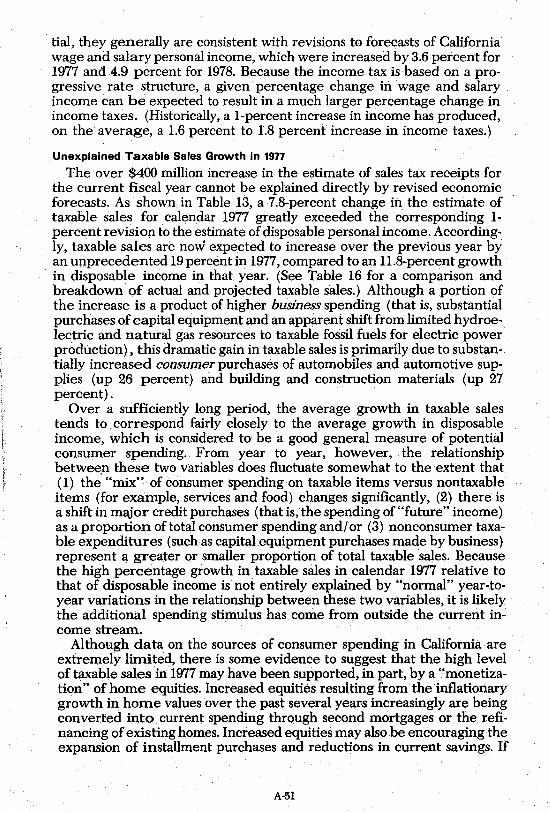
tial, they generally are consistent with revisions to forecasts of California wage and salary personal income, which were increased by 3.6 percent for 1977 and 4.9 percent for 1978. Because the income tax is based on a progressive rate structure, a given percentage change in wage and salary income can be expected to result in a much larger percentage change in income taxes. (Historically, a I-percent increase in income has produced, on the average, a 1.6 percent to 1.8 percent increase in income taxes.)
Unexplained Taxable Sales Growth in 19n
The over $400 million increase in the estimate of sales tax receipts for the current fiscal year cannot be explained directly by revised economic forecasts. As shown in Table 13, a 7.8-percent change in the estimate of taxable sales for calendar 1977 greatly exceeded the corresponding 1-percent revision to the estimate of disposable personal income. Accordingly, taxable sales are now expected to increase over the previous year by an unprecedented 19 percent in 1977, compared to an I1.8-percent growth in disposable income in that year. (See Table 16 for a comparison and breakdown of actual and projected taxable sales.) Although a portion of the increase is a product of higher business spending (that is, substantial purchases of capital equipment and an apparent shift from limited hydroelectric and natural gas resources to taxable fossil fuels for electric power production), this dramatic gain in taxable sales is primarily due to substantially increased consumer purchases of automobiles and automotive supplies (up 26 percent) and building and construction materials (up 27 percent). .
Over a sufficiently long period, the average growth in taxable sales tends to correspond fairly closely to the average growth in disposable income, which is considered to be a good general measure of potential consumer spending .. From year to year, however, the relationship betweep these two variables does fluctuate somewhat to the extent that (1) the "mix" of consumer spending on taxable items versus nontaxable items (for example, services and food) changes significantly, (2) there is a shift in major credit purchases (that is, the spending of "future" income) as a proportion oftotal consumer spending and/or (3) nonconsumer taxable expenditures (such as capital equipment purchases made by business) represent a greater or smaller proportion of total taxable sales. Because the high percentage growth in taxable sales in calendar 1977 relative to that of disposable income is not entirely explained by "normal" year-toyear variations in the relationship between these two variables, it is likely the additional spending stimulus has come from outside the current income stream.
Although data on the sources of consumer spending in California are extremely limited, there is some evidence to suggest that the high level of taxable sales in 1977 may have been supported, in part, by a "monetization" of home equities. Increased equities· resulting from the inflationary growth in hOlIle values over the past several yeal's increasingly are being converted into current spending through second mortgages or the refinancing of existing homes. Increased equities may also.be encouraging the expansion of installment purchases and reductions in current savings. If
A·51
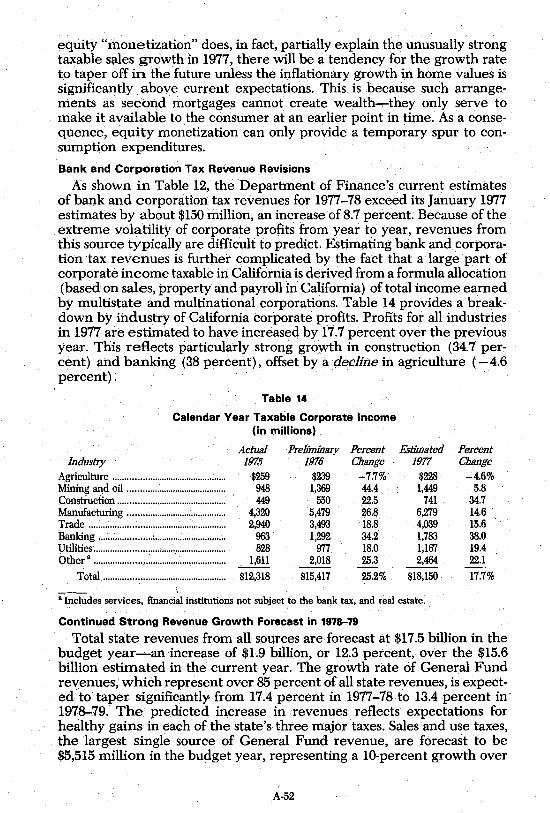
equity "monetization" does, in fact, partially explain the unusually strong taxable sales growth in 1977, there will be a tendency for the growth rate to taper off in the future unless the inflationary growth in home values is significantly above current expectations. This is because such arrangements as second mortgages cannot create wealth-.-they only serve to make it available to the consumer at an earlier point in time. As a consequence, equity monetization can only provide a temporary spur to consumption expenditures.
Bank and Corporation Tax Revenue Revisions
As shown in Table 12, the Department of Finance's current estimates of bank and corporation tax revenues for 1977-78 exceed its January 1977 estimates by about $150 million, an increase of 8.7 percent. Because of the extreme volatility of corporate profits from year to year, revenues from this source typically are difficult to predict. Estimating bank and corporation tax revenues is further complicated by the fact that a large part of corporate income taxable in California is derived from a formula allocation (based on sales, property and payroll in California) of tbtal income earned by multistate and multinational corporations. Table 14 provides a breakdown by industry of California corporate profits. Profits for all industries in 1977 are estimated to have increased by 17.7 percent over the previous year. This reflects particularly strong growth in construction (34.7 percent) and banking (38 percent), offset by a declinein agriculture (-4.6 percent).
Table 14
Calendar Year Taxable Corporate Income (in millions)
Industry Agriculture .............................................. .. Mining and oil ........................................ .. Construction ........................ ; ................... .. Manufacturing ........................................ .. Trade ........................................................ .. Banking ..................... ;, ............................. .. Utilities ........................... ; ........................... . Other" ....................................................... ..
Total .................................................. .. \
Actu8J Preliminary 1975 1976
$259 $239 948 1,369 449 550
4,320 5,479 2,940 3,493
963 1,292 828 977
. 1,611 2,018
$12,318 $15,417
Percent Change
-7.7% 44.4 22.5 26.8 18.8 34.2 18.0 25.3
25.2%
Estimated 1977
$228 1,449
741 6,279 4,039 1,783 1,167 2,464
$18,150
"Includes services, financial institutions not subject to the bank tax, and real estate.
Continued Strong Revenue Growth Forecast in 1978-79
Percent Change
-4.6% 5.8
34:7 14.6 15.6 38.0 19.4 22.1
17.7%
Total state revenues from all sources are forecast at $17.5 billion in the budget year~an increase of $1.9 billion, or 12.3 percent, over the $15.6 billion estimated in the current year. The growth rate of General Fund revenues, which represent over 85 percent of all state revenues, is expected to taper significantly from 17.4 percent in 1977-78 to 13.4 percent in" 197~79. The predicted increase in revenues reflects expectations for healthy gains in each of the state's three major taxes. Sales and use taxes, the largest single source of General Fund revenue, are forecast to be $5,515 million in the budget year, representing a l().,percent growth over
A-52
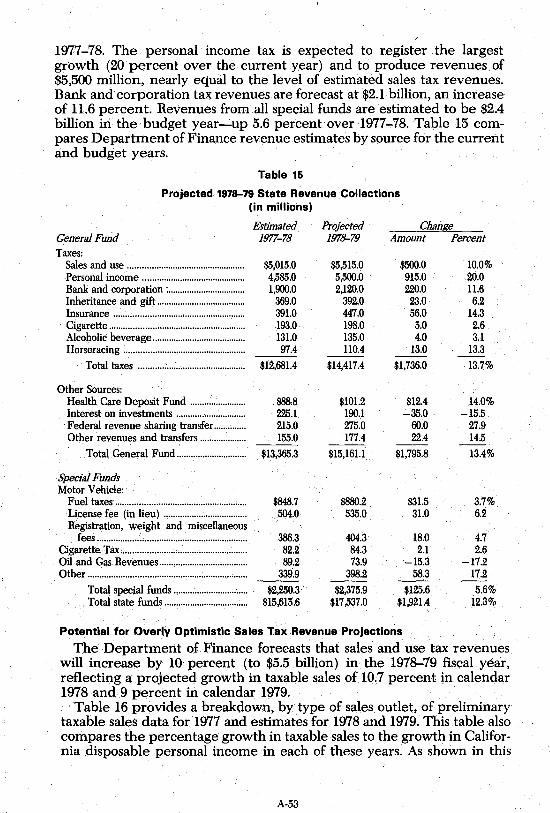
1977-78. The personal income tax is expected to register the largest growth (20 percent over the current year) and to produce revenues of $5,500 million, nearly equal to the level of estimated sales tax revenues. Bank and corporation tax revenues are forecast at $2.1 billion, an increase of 11.6 percent. Revenues from all special funds are estimated to be $2.4 billion iIi the budget year--':'up 5.6 percent over 1977-78. Table 15 compares Department of Finance revenue estimates by source for the current and budget years.
Table 15
Projected 1978-79 State Revenue Collections (in millions)
Estimated Projected Change General Fwid 1977-78 1978-79 Amount Percent
. Taxes: Sales and use .................................................. $5,015.0 $5,515.0 $500.0 10.0% Personal income ............................................ 4,585.0 5,500.0 915.0 20.0 Bank and corporation : ................................. 1,900.0 2,120.0 220.0 11.6 Inheritance and gift ...................................... 369.0 392.0 23.0 6.2 Insurance ....... ; ................................................ 391.0 447.0 56.0 14.3 Cigarette .......................................................... 193.0 198.0 5.0 2.6 Alcoholic beverage ........................................ 131.0 135.0 4.0 3.1 Horseracing .................................................... 97.4 110.4 13.0 13.3 ---
Total taxes .............................................. $12,681.4 $14,417.4 $1,736.0 13.7%
Other Sources: Health Care Deposit Fund ........................ $88.8 $101.2 $12.4 14.0% Interest on investments .............................. 225.1 190.1 -35.0 -15.5 Federal revenue sharing transfer ....... ; ...... 215.0 275.0 60.0 27.9 Other revenues and transfers .................... 155.0 177.4 22.4 14.5 --
Total General Furid .............................. $13,365.3 $15,161.1 $1,795.8 13.4%
Special Flinds Motor Vehicle:
Fuel taxes ........................................................ $848.7 $880.2 $31.5 3.7% License fee (in lieu) .................................... 504.0 535.0 31.0 6.2 Registration, weight and miscellaneolJs
fees ................................................................ 386.3 404.3 18.0 4.7 Cigarette·Tax ...................................................... 82.2 84.3 2.1 2.6 Oil and Gas Revenues ...................................... 89.2 73.9 -15.3 -17.2 Other ..... : .............................................................. 339.9 398.2 58.3 17.2 --
Total special funds ................................ $2,250.3 $2,375.9 $125.6 5.6% , Total state funds .................................... $15,615.6 $17,537.0 $1,921.4 12.3%
Potential for Overly Optimistic Sales Tax Revenue Projections
The Department of Finance· forecasts that sales and use tax revenues will increase by 10 percent (to $5.5 billion) in the 1978-79 fiscal year, reflecting a projected growth in taxable sales of 10.7 percent in calendar 1978 and 9 percent in calendar 1979 .
. Table 16 provides a breakdown, by type of sales outlet, of preliminary taxable sales data for' 1977 and estimates for 1978 and 1979. This table also compares the percentage growth in taxable sales to the growth in California disposable personal income in each of these years. As shown in this
A-53
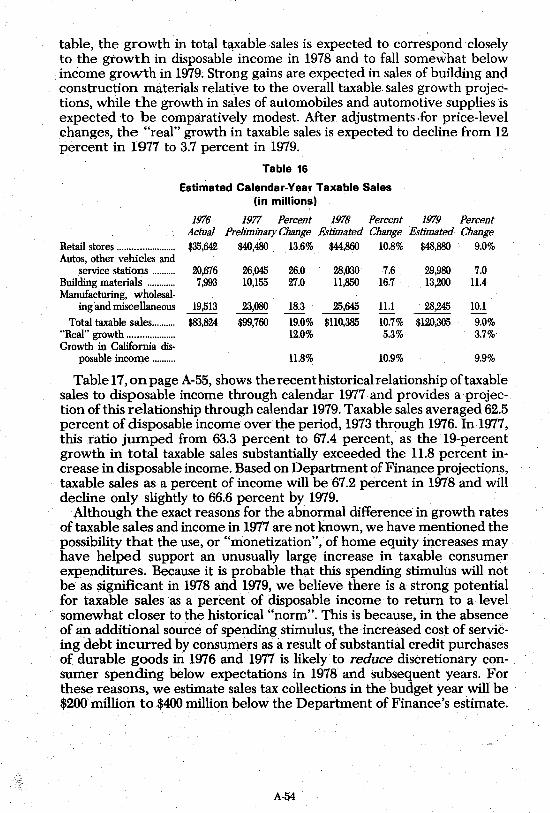
table, the growth in total taxable sales is expected to correspond closely to the growth in disposable' income in 1978 and to fall somewhat below income growth in 1979. Strong gains are expected in sales of building and construction materials relative to the overall taxable. sales growth projections, while the growth in sales of automobiles and automotive supplies is expected to be comparatively modest. After adjustments .for price-level changes, the "real" growth in taxable sales is expected to decline from 12 percent in 1977 to 3.7 percent in 1979.
Table 16
Estimated Calendar-Year Taxable Sales (in millions)
1976 1977 Percent 1978 Percent 1979 Percent Actual Prehininary Change Estimated Change Estimated Change
Retail stores ........................ $35,642 $40,480 13.6% $44,860 10.8% $48,880 \ 9.0% Autos, other vehicles and
service stations ......... . Building materials ........... . Manufacturing, wholesal
ingand miscellaneous
Total taxable sales ......... . "Real" growth ................... . Growth in California dis-
posable income ......... .
20,676 7,993
19,513
$83,824
26,045 26.0 10,155 27.0
23,080 18.3
$99,760 19.0% 12.0%
11.8%
28,030 7.6 29,980 7.0 11,850 16.7 13,200 11.4
25,645 ILl 28,245 10.1
$110,385 10.7% $120,305 9.0% 5.3% 3.7%
10.9% 9.9%
Table 17, on page A-55, shows the recent historical relationship of taxable sales to disposable income through calendar 1977 and provides a projection of this relationship through calendar 1979. Taxable sales averaged 62.5 percent of disposable income over the period, 1973 through 1976. In 1977, this ratio jumped from 63.3 percent to 67.4 percent, as the 19-percent growth in total taxable sales substantially exceeded the 11.8 percent increase in disposable income. Based on Department of Finance projections, taxable sales as a percent of income will be 67.2 percent in 1978 and will decline only slightly to 66.6 percent by 1979.
Although the exact reasons for the abnormal difference in growth rates of taxable sales and income in 1977 are not known, we have mentioned the possibility that the use, or "monetization", of home equity increases may have helped support an unusually large increase in taxable consumer expenditures. Because it is probable that this spending stimulus will not be as significant in 1978 and 1979, we believe there is a strong potential for taxable sales as a percent of disposable income to return to a level somewhat closer to the historical "norm". This is because, in the absence of an additional source of spending stimuluS", the increased cost of servicing debt incurred by consumers as a result of substantial credit purchases of durable goods in 1976 and 1977 is likely to reduce discretionary consumer spending below expectations in 1978 and subsequent years. For these reasons, we estimate sales tax collections in the budget year will be $200 million to $400 million below the Department of Finance's estimate.
A-54
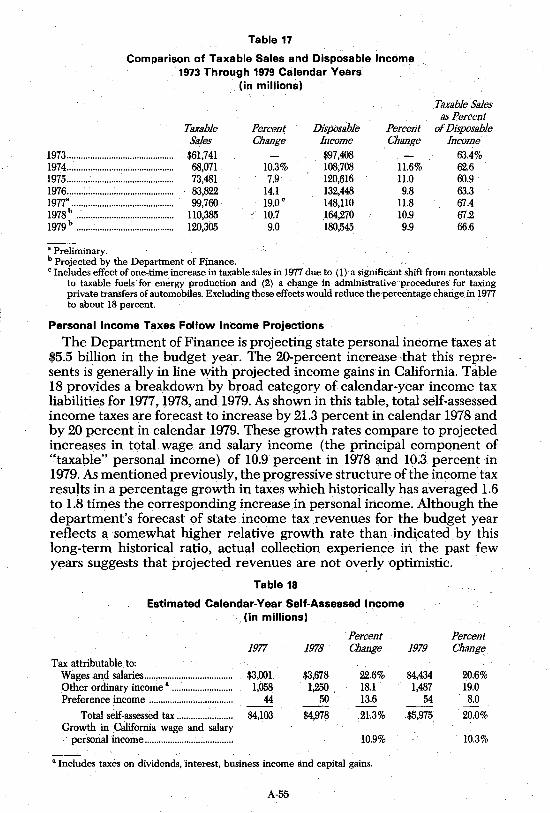
Table 17
Comparison of Taxable Sales and Disposable Income 1973 Through 1979 Calendar Years
1973 ............................................. . 1974 ............................................. . 1975 ............................................. . 1976 ............................................. . 1977" ........................................... . 1978 b.: ........................................ . 1979 b •••.....••••.....••••••.....•••••......•••
Taxable Sales $61,741 68,071 73,481 83,822 99,760
110,385 120,305
a Preliminary. b Projected by the Department of Finance.
(in millions)
Percent Change
10.3% 7.9
14.1 19.0 c
10.7 9.0
Disposable Income $97,408 108,708 120,616 132,448 148,110 164,270 180,545
Percent _ Change
11.6% 11.0 9.8
11.8 10.9 9.9
. Taxable Sales as Percent
of Disposable Income
63.4% 62.6 60.9 63.3 67.4 67.2 66.6
c Includes effect of one-time increase in taxable sales in Url7 due to (1) a Significant shift from nontaxable to taxable fuels for energy production and (2) a change in administrative procedures for taxing private transfers of automobiles. Excluding these effects would reduce the-percentage change in 1977 to about 18 percent.
Personal Income Taxes Follow Income Projections
The Department of Finance is projecting state personal income taxes at $5.5 billion in the budget year. The 20-percent increase that this represents is generally in line with projected income gains in California. Table 18 provides a breakdown by broad category of calendar-year income tax liabilities for 1977, 1978, and 1979. As shown in this table, total self-assessed income taxes are forecast to increase by 21.3 percent in calendar 1978 and by 20 percent in calendar 1979. These growth rates compare to projected increases in total wage and salary income (the principal component of "taxable" personal income) of 10.9 percent in 1978 ~d 1O~3 percent in 1979. As mentioned previously, the progressive structure of the income tax results in a percentage growth in taxes which historically has averaged 1.6 to 1.8 times the corresponding increase in personal income. Although the department's forecast of state income tax revenues for the budget year reflects a somewhat higher relative growth rate than indi_cated by this long-term historical ratio, actual collection experience in the past few years suggests that projected revenues are not ov~rly optimistic.
Table 18
Estimated Calendar-Year Self-Assessed Income (in millions)
. Percent 1977 1978 Change
Tax attributable to: Wages and salaries ...................................... $3,001 $3,678 22.6% Other ordinary income" .......................... 1,058 1,250 18.1 Preference income .................................... 44 50 13.6 --
Total self-assessed tax ........................ $4,103 $4,978 21.3% Growth in CaIifornia wage and salary
personal income ...................................... 10.9%
" Includes taxes on dividends, -interest, business income and capital gains.
A-55
Percent 1979 Change
$4,434 20.6% 1,487 19.0
54 8.0 --$5,975 20.0%
10.3%
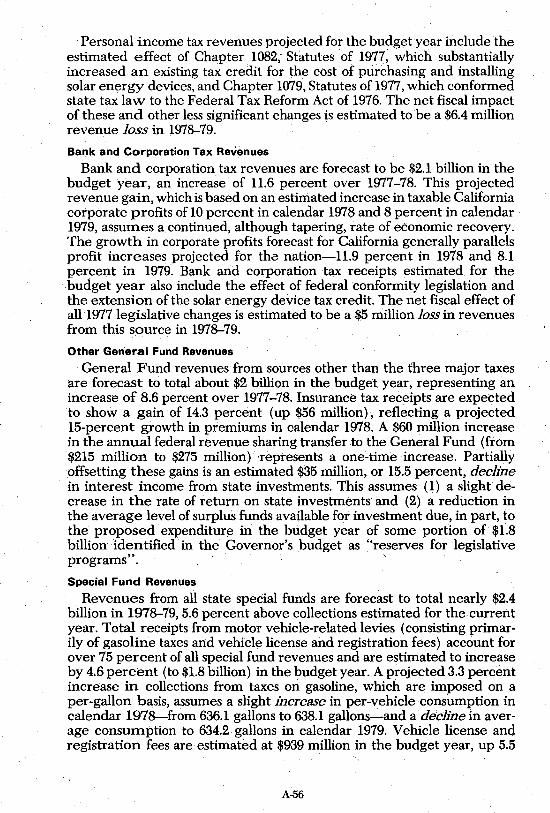
Personal income tax revenues projected for the budget year include the estimated effect of Chapter 1082, Statutes of 1977, which substantially increased an existing tax credit for the cost of purchasing and installing solar energy devices, and Chapter 1079, Statutes of 1977, which conformed state tax law to the Federal Tax Reform Act of 1976. The net fiscal impact of these and other less significant changes is estimated to be a $6.4 million revenue loss in 1978-79.
Bank and Corporation Tax Revenues
Bank and corporation tax revenues are forecast to be $2.1 billion in the budget year, an increase of 11.6 percent over 1977-78. This projected revenue gain, which is based on an estimated increase in taxable California corporate profits of 10 percent in calendar 1978 and 8 percent in calendar 1979, assumes a continued, although tapering, rate of economic recovery. The growth in corporate profits forecast for California generally parallels profit increases projected fur the nation~11.9 percent in 1978 and 8.1 percent in 1979. Bank and corporation tax receipts estimated for the budget year also include the effect of federal conformity legislation and the extension of the solar energy device tax credit. The net fiscal effect of all 1977 legislative changes is estimated to be a $5 million loss in revenues from this source in 1978-79.
Other Gerieral Fund Revenues
General Fund revenues from sources other than the three major taxes are forecast to total about $2 billion in the budget year, representing an increase of 8.6 percent over 1977-78. Insurance tax receipts are expected to show a gain of 14.3 percent (up $56 million), reflecting a projected 15-percent growth in premiums in calendar 1978. A $60 million increase in the annual federal revenue sharing transfer to the General Fund (from $215 million to $275 million) represents a one-time increase. Partially offsetting these gains is an estimated $35 million, or 15.5 percent, decline in interest income from state investments. This assumes (1) a slight decrease in the rate of return on state investments' and (2) a reduction in the average level of surplus funds available for investment due, in part, to the proposed expenditur~ in the budget year of some portion of $1.8 billion identified . in the Governor's budget as "reserves for legislative programs". '
Special Fund Revenues
Revenues from all state special funds are forecast to total nearly $2.4 billion in 1978-79, 5.6 percent above collections estimated for the current year. Total receipts from motor vehicle-related levies (consisting primarily of gasoline taxes and vehicle license and registration fees) account for over 75 percent of all special fund revenues and are estimated to increase by 4.6 percent (to $1.8 billion) in the budget year. A projected 3.3 percent increase in collections from taxes on gasoline, which are imposed on a per-gallon basis, assumes a slight increase in per-vehicle consumption in calendar 1978-from 636.1 gallons to 638.1 gallons-and a decline in average consum.ption to 634.2 gallons in calendar 1979. Vehicle license and registration fees are estimated at $939 million in the budget year, up 5.5
A-56
percent over 1977-78, and assume a ;3.5 percent average annual increase in registrations from 1977 to 1979 and a total stock of 18.8 million registered vehicles in California as of the end of 1979.
3--76788 . A-57