Embed Size (px)
Citation preview

1 www.flexerasoftware.com
VULNERABILITY REVIEW
2017 Key figures and facts on vulnerabilities from
a global information security perspective
Published March 13, 2017
2 www.flexerasoftware.com
Index
Introduction
Global Trends – All Products ................................................................................................. 4
Global Trends – Top 50 Portfolio .......................................................................................... 4
Vendor Update – Top 50 Portfolio ....................................................................................... 12
Time-to-Patch – All Products ............................................................................................... 17
Time-to-Patch – Top 50 Portfolio......................................................................................... 17
Zero-day Vulnerabilities ...................................................................................................... 19
Browser Security ................................................................................................................ 20
PDF Reader Security ......................................................................................................... 23
Appendix
Secunia Software Vulnerability Tracking Process .............................................................. 26
Attack Vector ..................................................................................................................... 27
Unique and Shared Vulnerabilities ..................................................................................... 27
Secunia Vulnerability Criticality Classification .................................................................... 28
The Top 50 Software Portfolio ............................................................................................. 29
Glossary.............................................................................................................................. 30
3 www.flexerasoftware.com
Introduction to the
Vulnerability Review 2017 The annual Vulnerability Review analyzes the
evolution of software security from a vulnerability
perspective.
The review presents global data on the
prevalence of vulnerabilities and the availability
of patches, maps the security threats to IT
infrastructures, and also explores vulnerabilities
in the 50 most popular applications on private
PCs.
What does the Vulnerability Review cover?
The annual Vulnerability Review is based on
data from Secunia Research at Flexera
Software.
Secunia Research monitors more than 50,000
applications, appliances and operating systems,
and tests and verifies the vulnerabilities reported
in them.
The systems and applications monitored by
Secunia Research are those in use in the
environments of the customers of Flexera
Software’s Software Vulnerability Management
product line.
In the event of customers using products that are
not already being monitored by Secunia
Research, these products can be submitted to
Secunia Research who will initiate monitoring
within three business days. Secunia Research
only monitors public or commercially available
solutions.
The Vulnerability Database covers vulnerabilities
that can be exploited in all types of products –
software, hardware, firmware, etc.
The vulnerabilities verified by Secunia Research
are described in Secunia Advisories and listed in
the Secunia Vulnerability Database, detailing
what IT Security teams need to know to mitigate
the risk posed by the vulnerability in their
environment. The Secunia Advisory descriptions
include criticality, attack vector and solution
status.
How do we count vulnerabilities?
Different approaches to counting vulnerabilities
are adopted by research houses in the
vulnerability management space.
Secunia Research counts vulnerabilities per
product the vulnerability appears in. We apply
this method to reflect the level of information our
customers need, to keep their environments
secure, i.e. verified intelligence on all products
affected by a given vulnerability.

See the Appendix for methodology, including definitions of Secunia Advisories, CVEs and Vulnerabilities; criticality ratings, attack vectors.
4 www.flexerasoftware.com
Vulnerability Update
Numbers - All Products Number of Vulnerabilities - All products The absolute number of vulnerabilities detected was 17,147, discovered in 2,136(1) applications from 246 vendors. The number shows a 33% increase in the five year trend, and a 6% increase from 2015 to 2016. Since 2015, the number of vendors behind the vulnerable products has decreased by 7% and the amount of vulnerable products has decreased by 14%. The substantial drop in numbers of Vendors and Products during the years 2015 and 2016 is occasioned by Secunia Research's decision to focus on the products and vendors present in the environments of Flexera Software’s Software Vulnerability Management customers. As a result, a number of products and vendors not used in customer environments are no longer tracked systematically.
Criticality – All Products 18% of vulnerabilities in 2016 were rated as ‘Highly Critical’, and 0.5% as ‘Extremely Critical’. The most notable changes in criticality levels occurred in the ‘Highly’ critical bracket, with an increase from 13% in 2015 to 18% in 2016.
Attack Vector – All Products With a 56% share, the primary attack vector available to attackers to trigger a vulnerability for all products in 2016 was again via remote network, a drop from the 56.5% the year before. Local network has decreased, from 35% in 2015, to 31.5% in 2016. Local system increased, from 8.5% in 2015, to 12.5% in 2016.
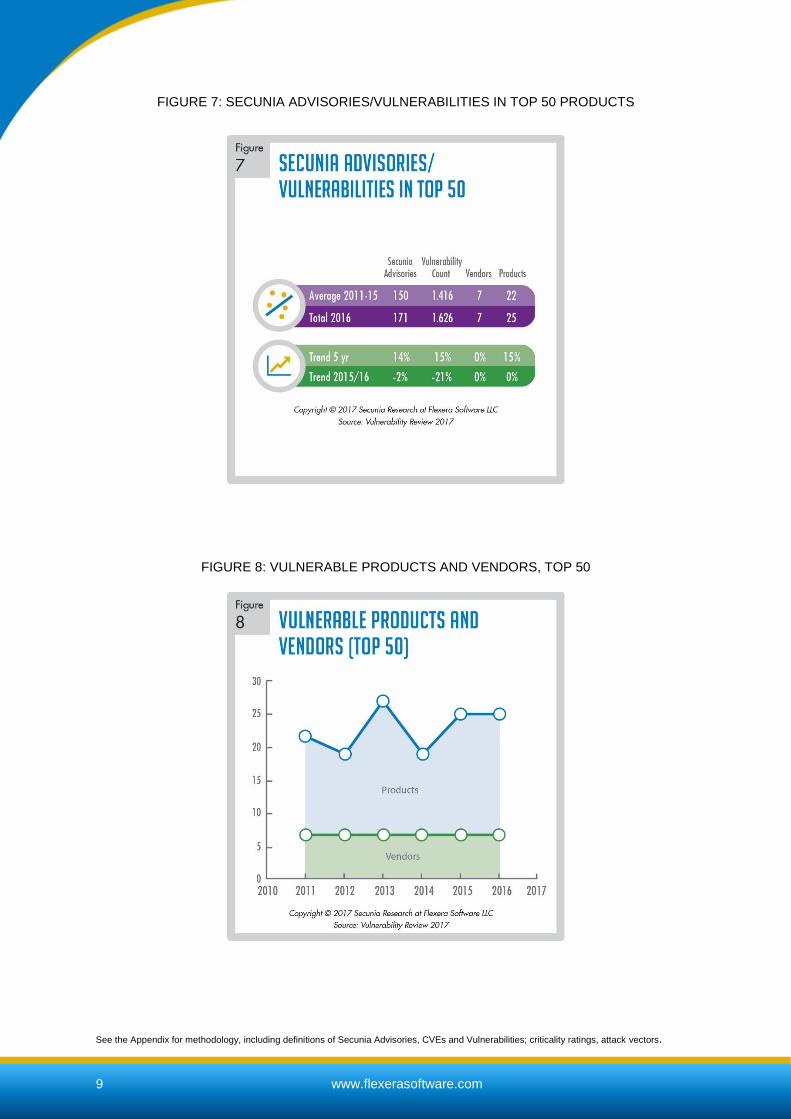
Global Trends – Top 50 Portfolio (1) Number of Vulnerabilities - Top 50 Portfolio The number of vulnerabilities in the Top 50 portfolio was 1,626, discovered in 25 products from 7 vendors plus the most used operating system, Microsoft Windows 7. The number shows a 15% increase in the five year trend, and a 21% decrease from 2015 to 2016.
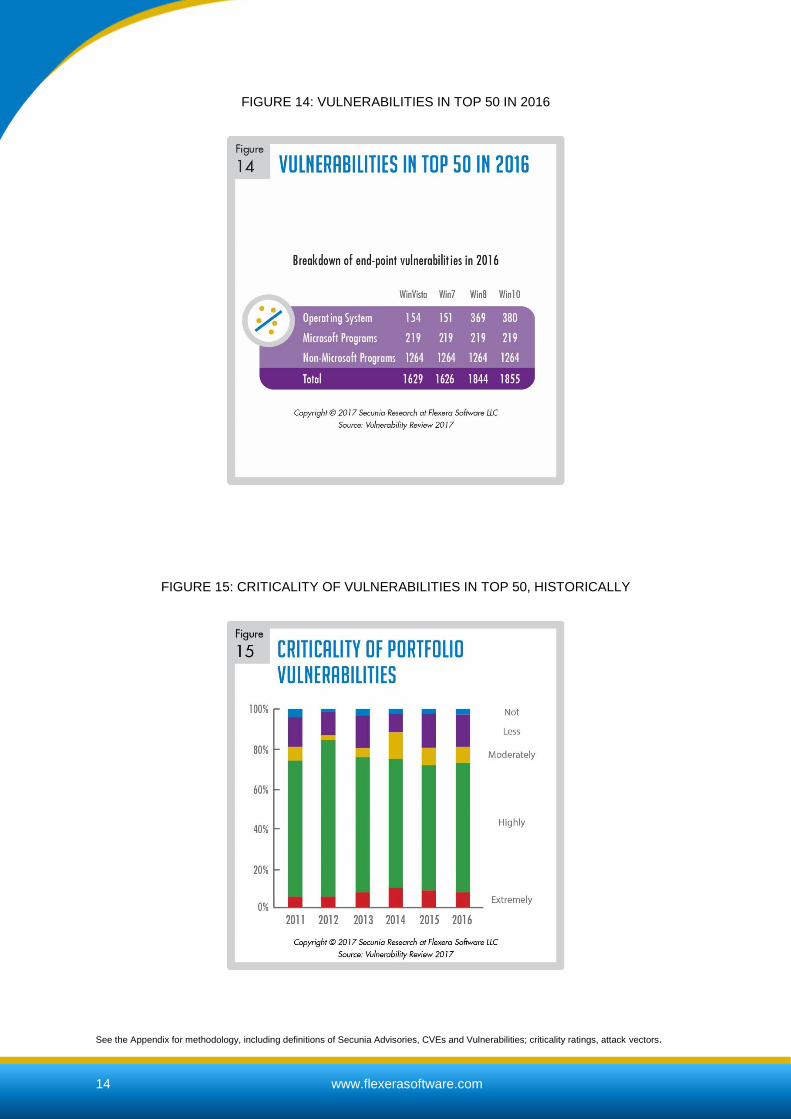
Criticality – Top 50 Portfolio The combined number of ‘Highly Critical’ and ‘Extremely Critical’ vulnerabilities: 72.5% represented the majority of vulnerabilities in the Top 50 rated by Secunia Research in 2016.
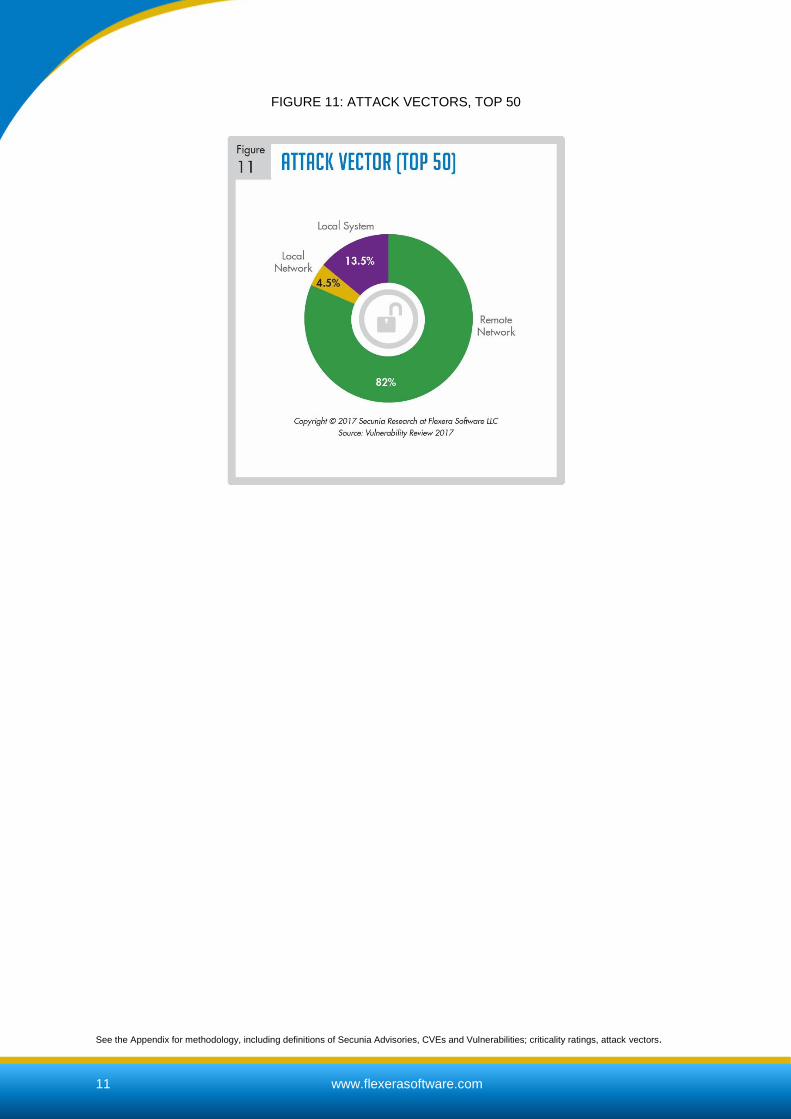
Attack Vector – Top 50 Portfolio With an 82% share, the foremost attack vector available to attackers to trigger a vulnerability in the Top 50 portfolio was Remote Network. This, however, is a small increase compared to 2015. Local Network saw an increase, from 3.5% in 2015, to 4.5% in 2016. Local System recorded a decrease compared to last year, from 15%, to 13.5% in 2016.
(1): Find the list of the Top 50 applications in the Appendix

See the Appendix for methodology, including definitions of Secunia Advisories, CVEs and Vulnerabilities; criticality ratings, attack vectors.
5 www.flexerasoftware.com
We Divide the Products into Three Categories
(2): Find the list of the Top 50 applications in the Appendix
What is the Top 50 Portfolio? (2) To assess how exposed endpoints are, we analyze the types of products typically found on an endpoint. For this analysis, we use anonymous data gathered from scans throughout 2016 of the Personal Software Inspector users’ computers – with an average of 75 programs installed on them. From country to country and region to region, there are variations as to which applications are installed. For the sake of clarity, we have chosen to focus on the state of a representative portfolio of the 50 most common applications found on computers. These 50 applications are comprised of 35 Microsoft applications and 15 non-Microsoft applications.
Product composition, PSI computer Microsoft applications: Represent on average 40% of the applications on a computer with Personal Software Inspector installed. Non-Microsoft applications: Software from all other vendors – represents 60% of the applications on a computer with Personal Software Inspector installed. Operating Systems: We track vulnerabilities in Windows operating systems: Windows Vista, Windows 7, Windows 8 and Windows 10.
Product composition, Top 50 portfolio Microsoft applications: Represent 69% of the Top 50 applications on a computer with Personal Software Inspector installed. Non-Microsoft applications: Software from all other vendors – represents 29% of the Top 50 applications on a computer with Personal Software Inspector installed. Operating Systems: We track vulnerabilities in the most prevalent operating system Windows 7. Windows 7 represents 2% of the products in the Top 50 portfolio.

See the Appendix for methodology, including definitions of Secunia Advisories, CVEs and Vulnerabilities; criticality ratings, attack vectors.
6 www.flexerasoftware.com
FIGURE 1: SECUNIA ADVISORIES/VULNERABILITIES IN ALL PRODUCTS
FIGURE 2: SECUNIA ADVISORIES/VULNERABILITIES IN ALL PRODUCTS

See the Appendix for methodology, including definitions of Secunia Advisories, CVEs and Vulnerabilities; criticality ratings, attack vectors.
7 www.flexerasoftware.com
FIGURE 3: VULNERABLE PRODUCTS AND VENDORS, ALL PRODUCTS
FIGURE 4: CRITICALITY, ALL PRODUCTS

See the Appendix for methodology, including definitions of Secunia Advisories, CVEs and Vulnerabilities; criticality ratings, attack vectors.
8 www.flexerasoftware.com
FIGURE 5: ATTACK VECTORS, ALL PRODUCTS
FIGURE 6: CRITICALITY OF VULNERABILITIES IN ALL PRODUCTS, HISTORICALLY
See the Appendix for methodology, including definitions of Secunia Advisories, CVEs and Vulnerabilities; criticality ratings, attack vectors.
9 www.flexerasoftware.com
FIGURE 7: SECUNIA ADVISORIES/VULNERABILITIES IN TOP 50 PRODUCTS
FIGURE 8: VULNERABLE PRODUCTS AND VENDORS, TOP 50

See the Appendix for methodology, including definitions of Secunia Advisories, CVEs and Vulnerabilities; criticality ratings, attack vectors.
10 www.flexerasoftware.com
FIGURE 9: SECUNIA ADVISORIES/VULNERABILITIES IN TOP 50 PRODUCTS
FIGURE 10: CRITICALITY, TOP 50
See the Appendix for methodology, including definitions of Secunia Advisories, CVEs and Vulnerabilities; criticality ratings, attack vectors.
11 www.flexerasoftware.com
FIGURE 11: ATTACK VECTORS, TOP 50

See the Appendix for methodology, including definitions of Secunia Advisories, CVEs and Vulnerabilities; criticality ratings, attack vectors.
12 www.flexerasoftware.com
Vendor Update – Top 50 Portfolio(3)
Different vendors have different security update mechanisms. Microsoft applications, which account
for 71% of the applications (including Windows 7 OS) in the Top 50 portfolio, are updated
automatically.
But Microsoft applications (including Windows 7 OS) are only responsible for 22.5% of the
vulnerabilities discovered in the Top 50 portfolio. Therefore, the non-Microsoft applications in your
system - your corporate environment or your private PC – play a significant role your security efforts.
Vulnerabilities in non-Microsoft applications in your system have a significant impact on security efforts. In this section we break down the source of vulnerabilities in the Top 50 portfolio.
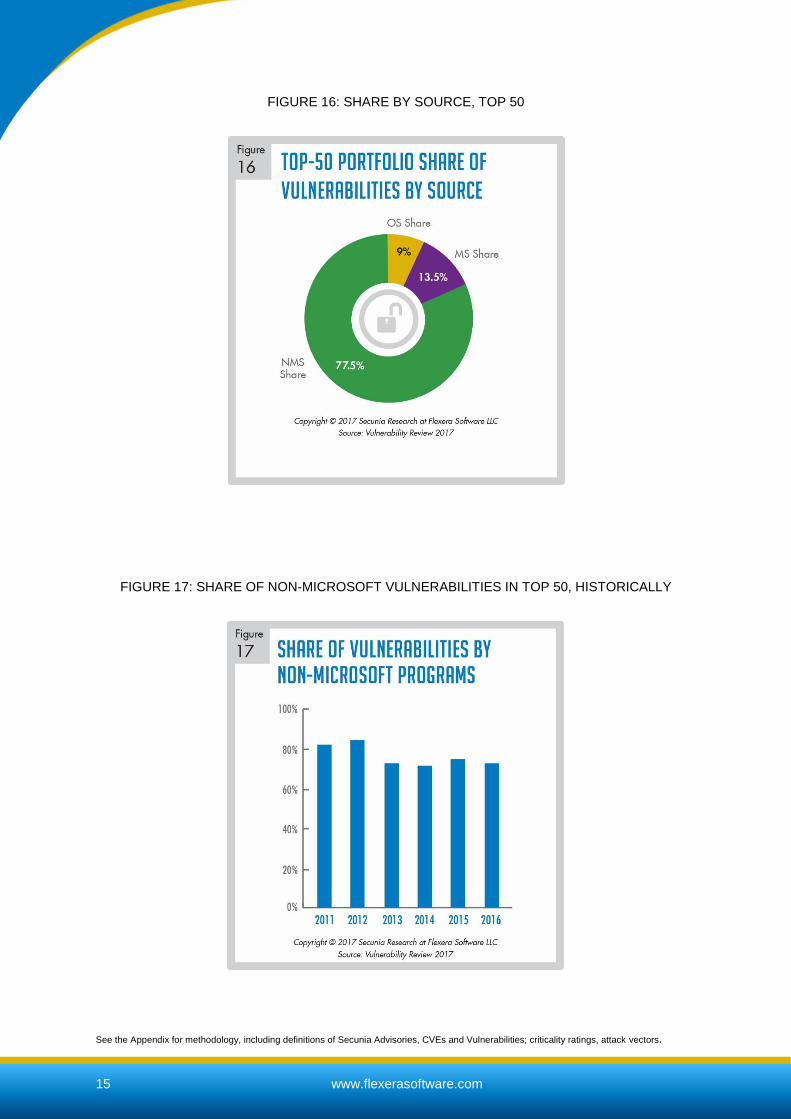
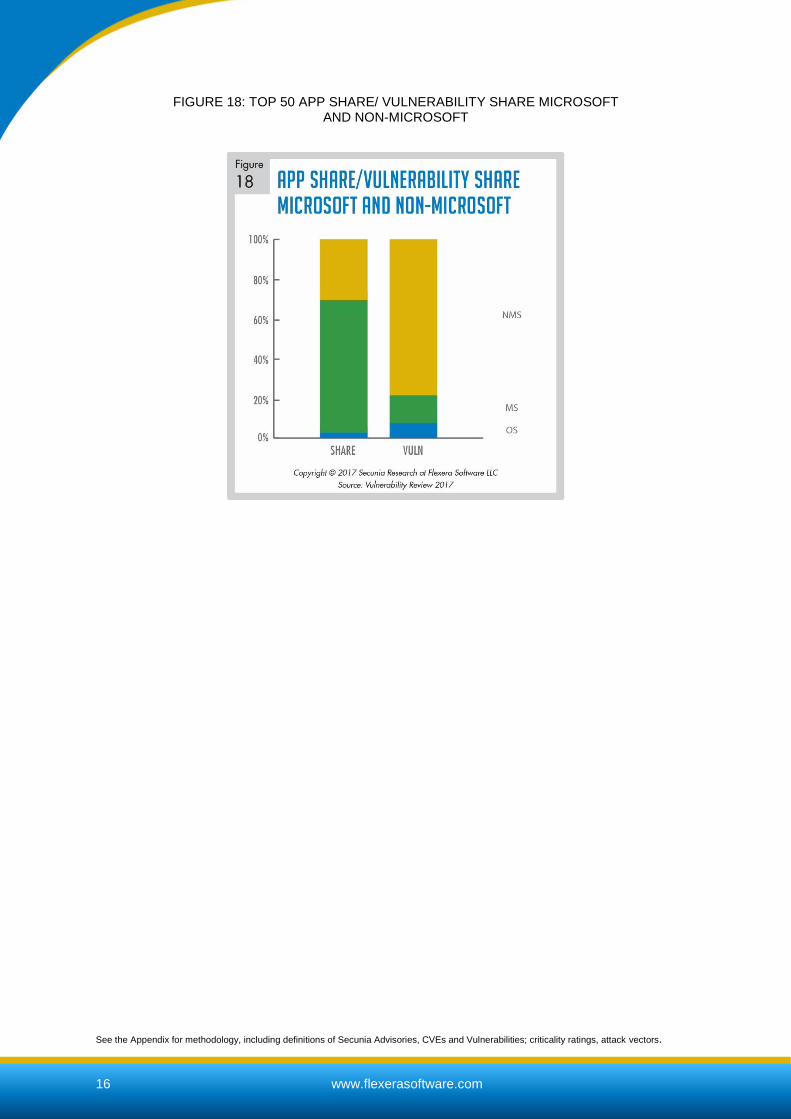
Non-Microsoft software In 2016, 77.5% of the vulnerabilities affecting the Top 50 applications in the representative software portfolio affected non-Microsoft applications. This means that 22.5% of the remaining vulnerabilities in the Top 50 applications installed on the computers of Personal Software Inspector users stem from the Windows 7 operating system (9%) and Microsoft applications (13.5%). On average, over a five year period, the share of non-Microsoft vulnerabilities has hovered around 78%, peaking at 88.5% in 2012. This high-level percentage plateau is significant and makes it evident why end users and organizations cannot manage security by focusing on patching their Microsoft applications and operating systems alone. If they do that, they are only protecting their computers and IT infrastructures from 22.5% – less than a quarter – of the total risk posed by vulnerabilities. Non-Microsoft software is by definition issued by a variety of vendors, who each have their own security update mechanisms and varying degrees of focus on security. Consequently, it is up to the users of personal computers and administrators of IT infrastructures to make sure that they stay updated about the security status of all the different products on their computers. This is a major challenge because not all vendors offer automated update services and push security updates to their users. Therefore, users and administrators have to resort to alternative methods and sources of information to ensure that their systems are protected from vulnerable software, and that patches or other mitigating actions are deployed No IT administrator has the time and resources to manually keep track of the patch state of all the applications on all computers in their IT infrastructure on a continuous basis.
Similarly, it is an unrealistic assumption that an end user is going to take the time to stay updated by visiting the websites of a multitude of vendors whose applications are installed on their PC – and then search, download and apply individual security updates.
Operating systems The choice of operating system had an impact on the total number of vulnerabilities on a typical endpoint: In 2016, 9% of vulnerabilities were reported in Windows 7, the operating system we are
tracking with the Top 50 portfolio.
Microsoft applications There were less vulnerabilities reported in Microsoft applications in 2016 compared to the previous year: down from 14.5% to 13.5%. The vulnerability count in Microsoft applications was 219 in 2016; in 2015 it was 295.
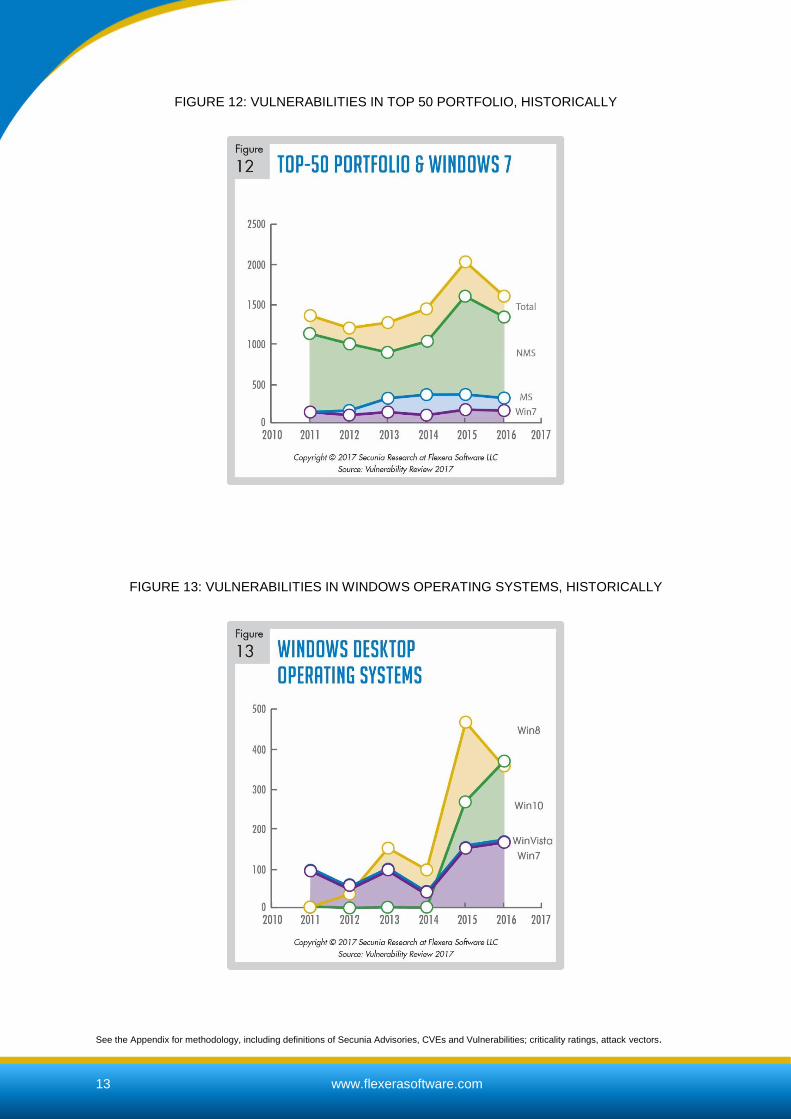
Increase in vulnerabilities in Windows Data shows an increase in in the number of vulnerabilities recorded in all Windows operating systems except Windows 8:
Windows 10(4) went from 257 in 2015, to 380 in 2016.
Windows 8(4) went from 467 in 2015, to 369 in 2016.
Windows 7 went from 144 in 2015, to 151 in 2016.
Windows Vista went from 147 in 2015, to 154 in 2016.
(3): Find the list of the Top 50 applications in the Appendix
(4): Windows 8 and Windows 10 are bundled with Adobe Flash, adding Flash’s to the number of vulnerabilities reported in Windows 8
and upwards.
See the Appendix for methodology, including definitions of Secunia Advisories, CVEs and Vulnerabilities; criticality ratings, attack vectors.
13 www.flexerasoftware.com
FIGURE 12: VULNERABILITIES IN TOP 50 PORTFOLIO, HISTORICALLY
FIGURE 13: VULNERABILITIES IN WINDOWS OPERATING SYSTEMS, HISTORICALLY
See the Appendix for methodology, including definitions of Secunia Advisories, CVEs and Vulnerabilities; criticality ratings, attack vectors.
14 www.flexerasoftware.com
FIGURE 14: VULNERABILITIES IN TOP 50 IN 2016
FIGURE 15: CRITICALITY OF VULNERABILITIES IN TOP 50, HISTORICALLY
See the Appendix for methodology, including definitions of Secunia Advisories, CVEs and Vulnerabilities; criticality ratings, attack vectors.
15 www.flexerasoftware.com
FIGURE 16: SHARE BY SOURCE, TOP 50
FIGURE 17: SHARE OF NON-MICROSOFT VULNERABILITIES IN TOP 50, HISTORICALLY
See the Appendix for methodology, including definitions of Secunia Advisories, CVEs and Vulnerabilities; criticality ratings, attack vectors.
16 www.flexerasoftware.com
FIGURE 18: TOP 50 APP SHARE/ VULNERABILITY SHARE MICROSOFT AND NON-MICROSOFT

See the Appendix for methodology, including definitions of Secunia Advisories, CVEs and Vulnerabilities; criticality ratings, attack vectors.
17 www.flexerasoftware.com
Time-to-Patch
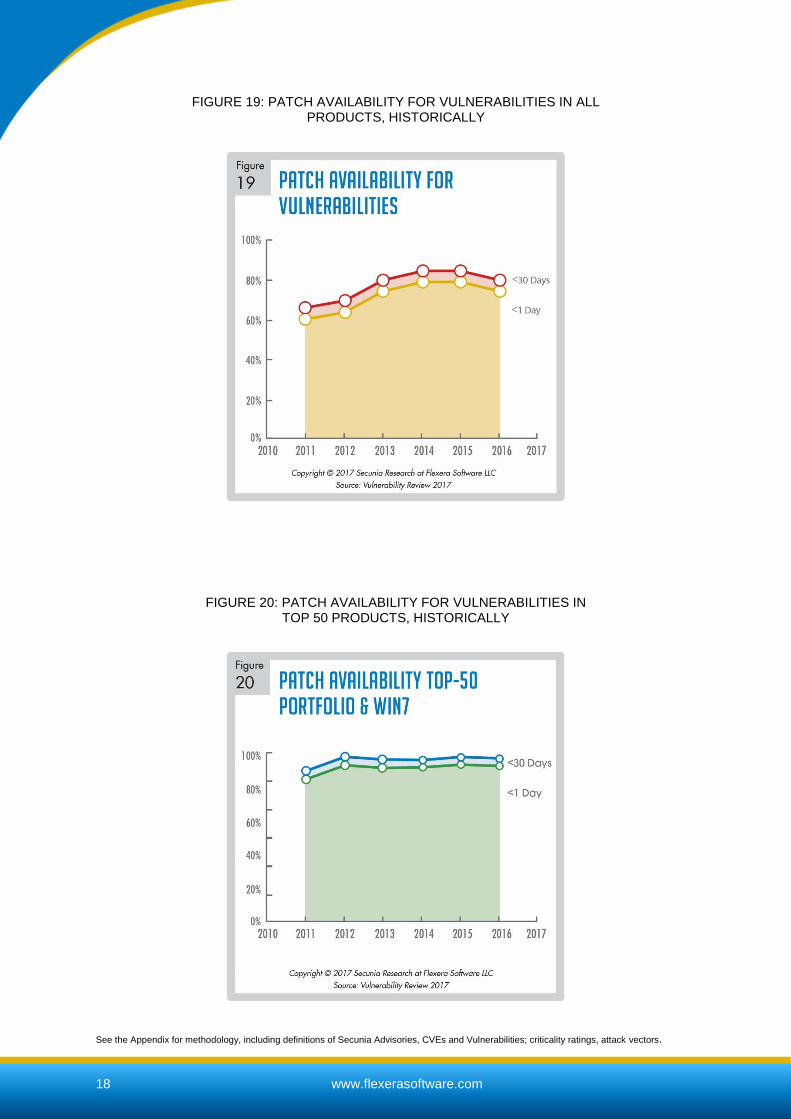
In 2016, 81% of all vulnerabilities had a patch
available on the day of disclosure - slightly lower
compared to the 84.5% in 2015.
In the Top 50 applications, 92.5% of
vulnerabilities had a patch available on the day of
disclosure. This number is on a par with the
92.5% time-to-patch rate that was recorded in
2015.
The 2016 results remain positioned at the higher
end of the scale, indicating that it is still possible
to remediate the majority of vulnerabilities.
It is however worth noting that some vendors
choose to issue major product releases rather
than minor updates, which can be more complex
for users and administrators to manage
manually.
The 2016 time-to-patch results show that about
one fifth of vulnerabilities (19% of all
vulnerabilities) were without patches for longer
than the first day of disclosure.
This percentage is a representative proportion of
software products that are not patched
immediately – e.g. due to a lack of vendor
resources, uncoordinated releases or, more
rarely, zero-day vulnerabilities.
In the Top 50 applications, however, the figure
drops to less than one tenth (7.5%) suggesting
that most commonly used products receive better
support when it comes to providing patches.
Consequently, and particularly for organizations
with a vast array of endpoints to manage
(including devices not regularly connected to
corporate networks), the fact that a percentage of
vulnerabilities do not have patches at the first
day of disclosure means that a variety of
mitigating efforts are required to ensure sufficient
protection, in support of patch management
efforts.
Cooperation between vendors and
researchers
That 81% of vulnerabilities in ‘All’ products, and
92.5% of vulnerabilities in products in the Top 50
portfolio have a patch available on the day of
disclosure, represents a continued improvement
in time-to-patch, particularly when taking a
retrospective view of the last five years and the
low of 65% recorded in 2011 in All products. The
most likely explanation for the continuously
improving time-to-patch rate is that researchers
are continuing to coordinate their vulnerability
reports with vendors and vulnerability programs,
resulting in immediate availability of patches for
the majority of cases.
30 days after day of disclosure, 82% of
vulnerabilities have a patch available, indicating
that if a patch is not available on the first day, the
vendor does not prioritize patching the
vulnerability.
See the Appendix for methodology, including definitions of Secunia Advisories, CVEs and Vulnerabilities; criticality ratings, attack vectors.
18 www.flexerasoftware.com
FIGURE 19: PATCH AVAILABILITY FOR VULNERABILITIES IN ALL PRODUCTS, HISTORICALLY
FIGURE 20: PATCH AVAILABILITY FOR VULNERABILITIES IN TOP 50 PRODUCTS, HISTORICALLY
See the Appendix for methodology, including definitions of Secunia Advisories, CVEs and Vulnerabilities; criticality ratings, attack vectors.
19 www.flexerasoftware.com
Zero-Day Vulnerabilities
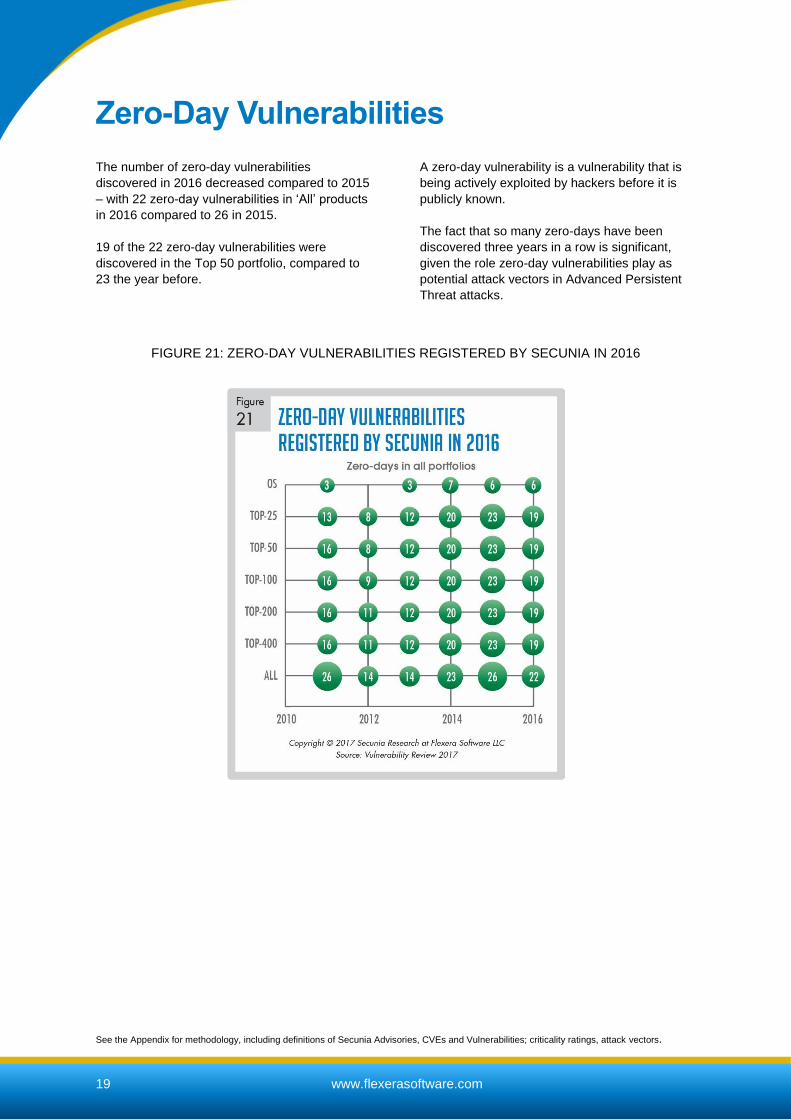
The number of zero-day vulnerabilities
discovered in 2016 decreased compared to 2015
– with 22 zero-day vulnerabilities in ‘All’ products
in 2016 compared to 26 in 2015.
19 of the 22 zero-day vulnerabilities were
discovered in the Top 50 portfolio, compared to
23 the year before.
A zero-day vulnerability is a vulnerability that is
being actively exploited by hackers before it is
publicly known.
The fact that so many zero-days have been
discovered three years in a row is significant,
given the role zero-day vulnerabilities play as
potential attack vectors in Advanced Persistent
Threat attacks.
FIGURE 21: ZERO-DAY VULNERABILITIES REGISTERED BY SECUNIA IN 2016
See the Appendix for methodology, including definitions of Secunia Advisories, CVEs and Vulnerabilities; criticality ratings, attack vectors.
20 www.flexerasoftware.com
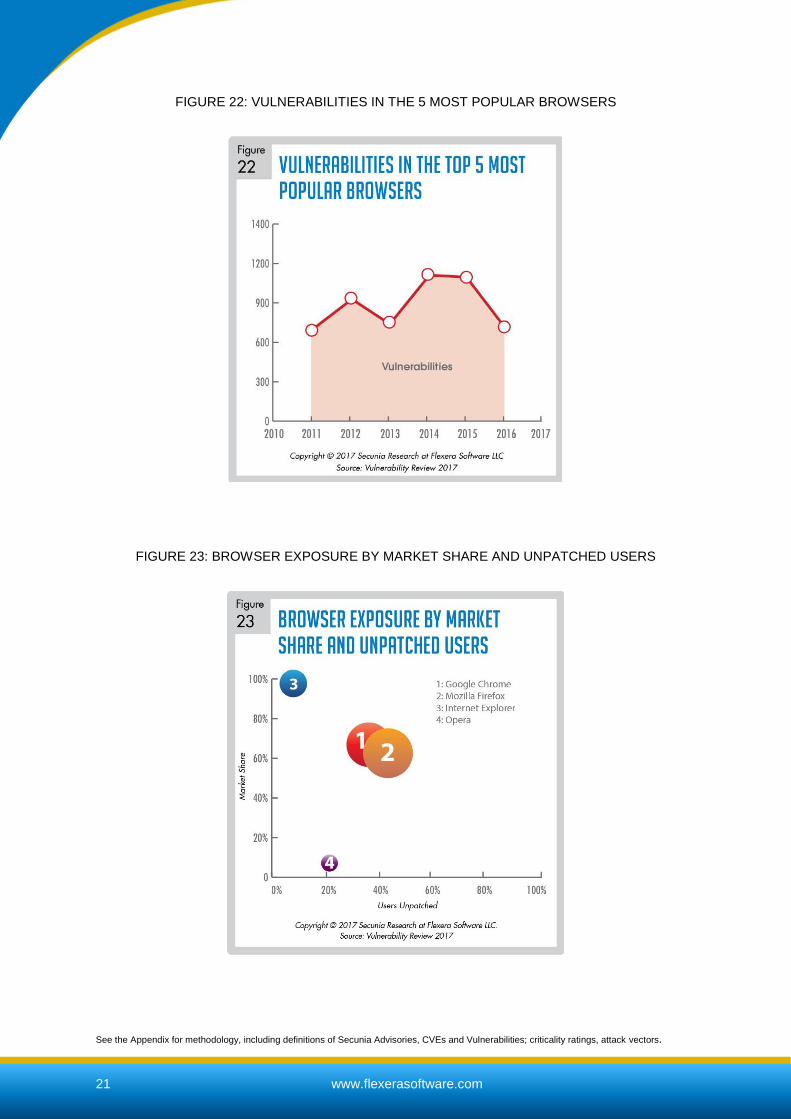
Browser Security
This snapshot of browser security outlines the
evolvement of vulnerabilities relating to the five
most popular browsers (Google Chrome, Mozilla
Firefox, Internet Explorer, Opera and Safari(5)).
Overall, data shows that there were 713
vulnerabilities in these browsers in 2016
compared to 983 in 2015 – a year-on-year
decrease of 27.5%. The majority of these
vulnerabilities were rated as ‘Highly Critical’.
Although Apple Safari for Windows is
categorized as end-of-life by Secunia Research,
because it has not received maintenance and
development for a period of four years, it is still
found on 6% of PCs, making it the fifth most
popular browser on computers with Personal
Software Inspector installed.
Figure 23 illustrates the distribution of
vulnerabilities across the five browsers in 2016,
including their market share, exposure level and
patch status. For Apple Safari, the number of
vulnerabilities and patch status are not shown, as
Secunia Research does not track
vulnerabilities/patch state in end-of-life products.
End-of-life products are by definition insecure,
because they are no longer supported by the
vendor and do not receive security updates.
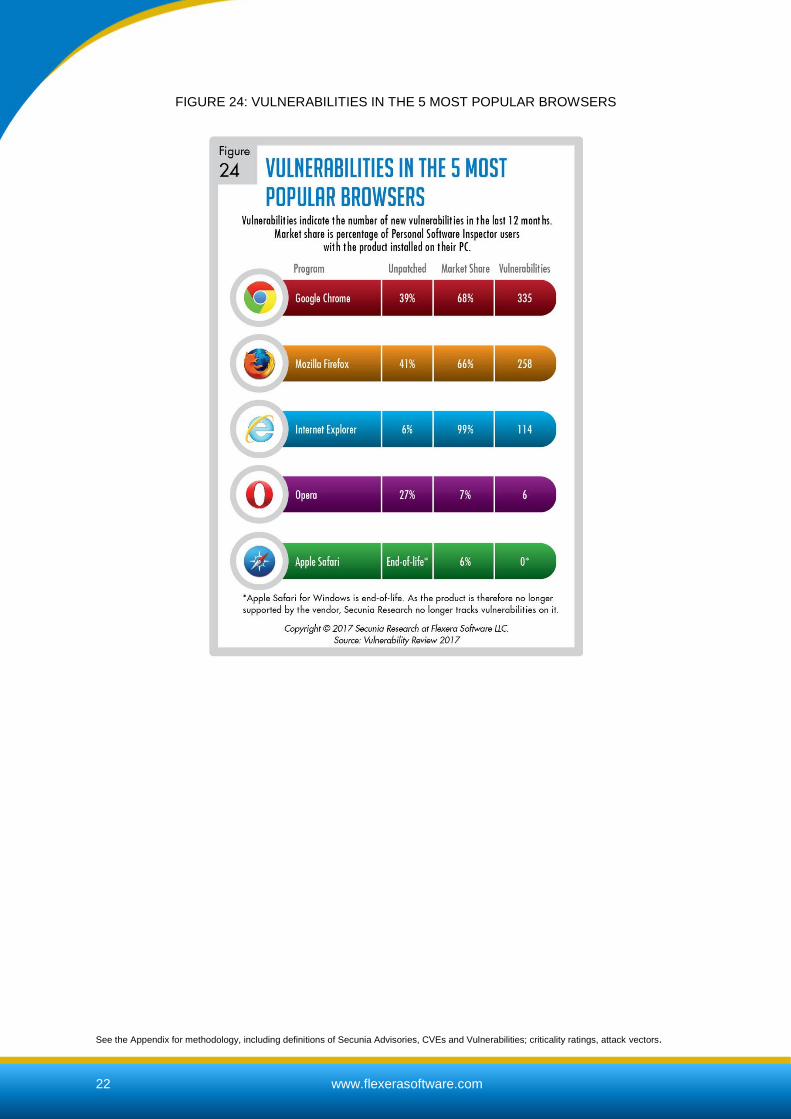
In Figure 24 we have ranked the Top 5 browsers,
based on risk exposure. We rank them by
exposure based on two parameters: “Market
share” in %, multiplied by “Unpatched” in %. That
is, how widespread the browser is, multiplied by
how many of the private users who have installed
the browser neglected to apply a patch, even
though a patch is available.
The position of the bubbles on the axis shows
the market share and unpatched level. The size
of the bubbles shows the exposure, indicating
how exposed a target, the software is.
The more widespread a program is, and the
higher the unpatched share, the more lucrative it
is for a hacker to target this program, as it will
allow the hacker to compromise more victims.
The calculation of the yearly average is based on
Personal Software Inspector data.
Importantly, even though Internet Explorer has a
market share of 99%, Firefox and Chrome are
actually installed on 66% and 68% of the
scanned systems with the Personal Software
Inspector installed, respectively. Since these
applications are used for the same purpose, it is
fair to assume that users have multiple browsers
installed but only use one of them, forgetting
about the others. This practice may also directly
affect the “unpatched” status of these browsers,
because users are not likely to prioritize the
security of a browser no longer in use.
(5) Apple Safari for Windows is end-of-life. As the product is therefore no longer supported by the vendor, Secunia Research no
longer tracks vulnerabilities in it.
See the Appendix for methodology, including definitions of Secunia Advisories, CVEs and Vulnerabilities; criticality ratings, attack vectors.
21 www.flexerasoftware.com
FIGURE 22: VULNERABILITIES IN THE 5 MOST POPULAR BROWSERS
FIGURE 23: BROWSER EXPOSURE BY MARKET SHARE AND UNPATCHED USERS
See the Appendix for methodology, including definitions of Secunia Advisories, CVEs and Vulnerabilities; criticality ratings, attack vectors.
22 www.flexerasoftware.com
FIGURE 24: VULNERABILITIES IN THE 5 MOST POPULAR BROWSERS

See the Appendix for methodology, including definitions of Secunia Advisories, CVEs and Vulnerabilities; criticality ratings, attack vectors.
23 www.flexerasoftware.com
PDF Readers
This snapshot of the security status of PDF
readers outlines the evolvement of vulnerabilities
relating to the five most popular products (Adobe
Reader, Foxit Reader, PDF-XChange Viewer,
Sumatra PDF and Nitro PDF Reader). There
has been an increase in the overall number of
vulnerabilities in these PDF readers, with 289
vulnerabilities identified in 2016 (147 in 2015).
The majority of these vulnerabilities were rated
as either ‘Highly Critical’ or ‘Extremely Critical’.
Figure 25 below illustrates the distribution of
vulnerabilities across the five PDF readers in
2016, including their market share and exposure
level, and patch status.
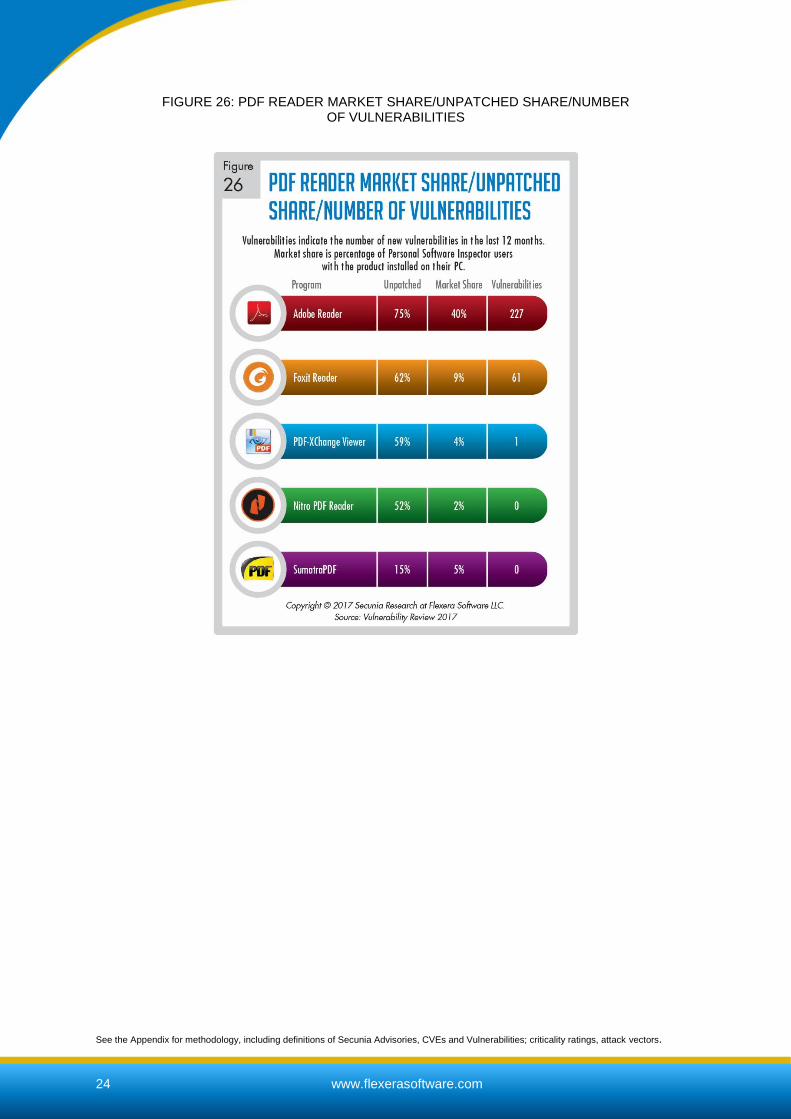
In Figure 26 we have ranked the Top 5 PDF
readers, based on risk exposure. We rank them
by exposure based on two parameters: “Market
share” in %, multiplied by “Unpatched” in %. That
is, how widespread the PDF reader is, multiplied
by how many of the private users who have
installed the reader neglected to apply a patch,
even though a patch is available.
The position of the bubbles on the axis shows
the market share and unpatched level. The size
of the bubbles shows the exposure, indicating
how exposed a target, the software is.
The calculation of the yearly average is based on
Personal Software Inspector data.
Installed on 40% of PCs, Adobe Reader has the
lion share of the market and the largest amount
of vulnerabilities: 227 in 2016 – with 75% of its
users leaving it unpatched despite this fact.
Another PDF reader with reported vulnerabilities,
Foxit Reader, had 61, and more than half of the
users – 62% – failed to patch it. Finally PDF-
XChange Viewer, having a market share of 4%,
only had one vulnerability in 2016. But with 59%
of the users running an unpatched version. Even
though the remaining two PDF readers are listed
as having 0 vulnerabilities they will still be
labelled ‘unpatched’ if vulnerable versions from a
previous year still have not been patched.
FIGURE 25: PDF READER EXPOSURE BY MARKET SHARE AND UNPATCHED USERS
See the Appendix for methodology, including definitions of Secunia Advisories, CVEs and Vulnerabilities; criticality ratings, attack vectors.
24 www.flexerasoftware.com
FIGURE 26: PDF READER MARKET SHARE/UNPATCHED SHARE/NUMBER OF VULNERABILITIES

See the Appendix for methodology, including definitions of Secunia Advisories, CVEs and Vulnerabilities; criticality ratings, attack vectors.
25 www.flexerasoftware.com
Appendix & Glossary
See the Appendix for methodology, including definitions of Secunia Advisories, CVEs and Vulnerabilities; criticality ratings, attack vectors.
26 www.flexerasoftware.com
Appendix
Secunia Research Software Vulnerability Tracking Process A vulnerability is an error in software which can be exploited with a security impact and gain. Secunia Research validates, verifies and tests vulnerability information gathered and includes it in the Secunia Vulnerability Intelligence database with consistent and standard processes, which have been constantly refined over the years. Whenever a new vulnerability is reported, a Secunia Advisory is released after verification of the information. A Secunia Advisory provides details, including description, risk rating, impact, attack vector, recommended mitigation, credits, references and more for the vulnerability including additional details discovered during verification and testing, thus providing the information required to make appropriate decisions about how to protect systems. After the first publication, the status of the vulnerability is tracked throughout its lifecycle and updates are made to the corresponding Secunia Advisory as new relevant information becomes available.
Metrics used to count vulnerabilities
Secunia Advisory The number of Secunia Advisories published in a given period of time is a first order approximation of the number of security events in that period. Security events stand for the number of administrative actions required to keep the specific product secure throughout a given period of time.
Secunia Vulnerability Count A vulnerability count is added to each Secunia Advisory to indicate the number of vulnerabilities covered by the Secunia Advisory. Using this count for statistical purposes is more accurate than counting CVE identifiers. Using vulnerability counts is, however, also not ideal as this is assigned per advisory. This means that one advisory may cover multiple products, but multiple advisories may also cover the same vulnerabilities in the same code-base shared across different applications and even different vendors.
Common Vulnerabilities and Exposures (CVE) Common Vulnerabilities and Exposures (CVE) is a dictionary of publicly known information security vulnerabilities and exposures. CVE has become a de facto industry standard used to uniquely identify vulnerabilities which have achieved wide acceptance in the security industry. Using CVEs as vulnerability identifiers allows correlating information about vulnerabilities between different security products and services. CVE information is assigned in Secunia Advisories. The intention of CVE identifiers is, however, not to provide reliable vulnerability counts, but is instead a very useful, unique identifier for identifying one or more vulnerabilities and correlating them between different sources. The problem in using CVE identifiers for counting vulnerabilities is that CVE abstraction rules may merge vulnerabilities of the same type in the same product versions into a single CVE, resulting in one CVE sometimes covering multiple vulnerabilities. This may result in lower vulnerability counts than expected when basing statistics on the CVE identifiers. NOTE: From 2015, the MITRE CVE only provides coverage of products on the CVE Published Priorities list. For more information, go to www.cve.mitre.org
See the Appendix for methodology, including definitions of Secunia Advisories, CVEs and Vulnerabilities; criticality ratings, attack vectors.
27 www.flexerasoftware.com
Attack Vector The attack vector describes the way an attacker can trigger or reach the vulnerability in a product. Secunia Research classifies the attack vector as “Local system,” “From local network,” or “From remote.”
Unique and Shared Vulnerabilities
Local System Local system describes vulnerabilities where the attacker is required to be a local user on the system to trigger the vulnerability.
From Local Network A vulnerability count is added to each Secunia Advisory to indicate the number of vulnerabilities covered by the Secunia Advisory. Using this count for statistical purposes is more accurate than counting CVE identifiers. Using vulnerability counts is, however, also not ideal as this is assigned per advisory. This means that one advisory may cover multiple products, but multiple advisories may also cover the same vulnerabilities in the same code-base shared across different applications and even different vendors.
From Remote From remote describes other vulnerabilities where the attacker is not required to have access to the system or a local network in order to exploit the vulnerability. This category covers services that are acceptable to be exposed and reachable to the Internet (e.g. HTTP, HTTPS, SMTP). It also covers client applications used on the Internet and certain vulnerabilities where it is reasonable to assume that a security conscious user can be tricked into performing certain actions.
Unique vulnerabilities Vulnerabilities found in the software of this and only this vendor. These are vulnerabilities in the code developed by this vendor that are not shared in the products of other vendors.
Shared vulnerabilities Vulnerabilities found in the software of this and other vendors due to the sharing of either code, software libraries, or product binaries. If vendor A develops code or products that are also used by vendor B, the vulnerabilities found in these components are categorized as shared vulnerabilities for both vendor A and vendor B.
Total vulnerabilities The total number of vulnerabilities found in the products of the vendor, be it unique or shared vulnerabilities. These are the vulnerabilities that affect the users of the vendor’s products.
See the Appendix for methodology, including definitions of Secunia Advisories, CVEs and Vulnerabilities; criticality ratings, attack vectors.
28 www.flexerasoftware.com
Secunia Vulnerability Criticality Classification
The criticality of a vulnerability is based on the assessment of the vulnerability’s potential impact on a system, the attack vector, mitigating factors, and if an exploit exists for the vulnerability and is being actively exploited prior to the release of a patch.
Extremely Critical (5 of 5) Typically used for remotely exploitable vulnerabilities that can lead to system compromise. Successful exploitation does not normally require any interaction and exploits are in the wild. These vulnerabilities can exist in services like FTP, HTTP and SMTP or in certain client systems like email applications or browsers.
Highly Critical (4 of 5) Typically used for remotely exploitable vulnerabilities that can lead to system compromise. Successful exploitation does not normally require any interaction but there are no known exploits available at the time of disclosure. Such vulnerabilities can exist in services like FTP, HTTP and SMTP or in client systems like email applications or browsers.
Moderately Critical (3 of 5) This rating is also used for vulnerabilities allowing system compromise on LANs in services like SMB, RPC, NFS, LPD and similar services that are not intended for use over the Internet. Typically used for remotely exploitable Denial of Service vulnerabilities against services like FTP, HTTP and SMTP, and for vulnerabilities that allow system compromises but require user interaction.
Less Critical (2 of 5) Typically used for cross-site scripting vulnerabilities and privilege escalation vulnerabilities. This rating is also used for vulnerabilities allowing exposure of sensitive data to local users.
Not Critical (1 of 5) Typically used for very limited privilege escalation vulnerabilities and locally exploitable Denial of Service vulnerabilities. This rating is also used for non-sensitive system information disclosure vulnerabilities (e.g. remote disclosure of installation path of applications).

See the Appendix for methodology, including definitions of Secunia Advisories, CVEs and Vulnerabilities; criticality ratings, attack vectors.
29 www.flexerasoftware.com
The Top 50 Software Portfolio The following table lists the applications in the Top 50 software portfolio together with the type of program (MS Microsoft, NMS non-Microsoft), market share as of December 2016 and the number of vulnerabilities affecting the program in 2015 and 2016. The ranking and market share is derived from anonymous scans of Personal Software Inspector in December 2016. Note that the sum of the vulnerabilities in this table does not reflect the total number of vulnerabilities in the portfolio as many products share vulnerabilities. For example Adobe Flash Player (#7) and Adobe AIR (#34) share code components and thereby also share numerous vulnerabilities.
See the Appendix and Glossary for definitions of Secunia Advisories, CVEs and Vulnerabilities.
RANK TYPE PRODUCT SHARE ADVS VULNS
1 ms Microsoft XML Core Services (MSXML) 99,9% 1 1
2 ms Microsoft .NET Framework 99,7% 8 16
3 ms Microsoft Visual C++ Redistributable 99,3% 0 0
4 ms Microsoft Windows Media Player 99,1% 0 0
5 ms Microsoft Windows Script Control 99,0% 0 0
6 ms Microsoft Internet Explorer 98,8% 12 114
7 nms Adobe Flash Player 95,5% 14 335
8 ms Windows PowerShell 92,4% 0 0
9 ms Microsoft Silverlight 84,1% 3 10
10 ms Microsoft XPS-Viewer 81,0% 0 0
11 ms Microsoft Word 74,2% 11 66
12 ms Microsoft Excel 73,9% 8 67
13 nms Oracle Java JRE 73,2% 5 39
14 ms Microsoft PowerPoint 72,0% 4 36
15 nms Google Chrome 68,7% 21 335
16 ms Microsoft Windows Malicious Software Removal Tool 68,0% 0 0
17 nms Mozilla Firefox 66,9% 23 258
18 ms Microsoft Windows Defender 66,1% 0 0
19 nms Mozilla Maintenance Service 63,5% 0 0
20 ms Windows DVD Maker 62,3% 0 0
21 ms Microsoft Visio Viewer 59,7% 1 4
22 ms Driver Package Installer (DPInst) 58,6% 0 0
23 ms Microsoft SQL Server 57,2% 1 6
24 ms Microsoft Outlook 56,8% 3 22
25 ms Windows Media Center 55,1% 1 1
26 nms Realtek AC 97 Update and remove driver Tool 55,0% 0 0
27 ms Microsoft Publisher 54,9% 1 16
28 ms Microsoft Access 54,8% 0 0
29 ms comdlg32 ActiveX Control 52,1% 0 0
30 ms Microsoft Visual C++ Redistributable 51,8% 0 0
31 nms Adobe Reader 49,8% 5 227
32 ms Windows Live Movie Maker 49,3% 0 0
33 ms Windows Live Mail 49,2% 0 0

See the Appendix for methodology, including definitions of Secunia Advisories, CVEs and Vulnerabilities; criticality ratings, attack vectors.
30 www.flexerasoftware.com
RANK TYPE PRODUCT SHARE ADVS VULNS
34 nms Adobe AIR 47,5% 4 97
35 ms MSCOMCT2 ActiveX Control 47,2% 0 0
36 ms Chess Titans 47,0% 0 0
37 nms CCleaner 46,7% 0 0
38 ms Windows Live Writer 46,6% 0 0
39 nms Apple Bonjour for Windows 46,6% 0 0
40 nms Adobe Acrobat 45,0% 5 227
41 ms Windows Live Photo Gallery 44,2% 0 0
42 nms Realtek Voice Manager 44,0% 0 0
43 ms Windows Live Messenger 43,1% 0 0
44 nms Apple QuickTime 43,1% 2 11
45 ms Skype for Windows 41,8% 0 0
46 nms VLC Media Player 41,8% 4 7
47 nms Apple iTunes 41,7% 4 52
48 ms Windows Live Essentials 38,5% 0 0
49 ms Microsoft PowerPoint Viewer 38,1% 2 24
50 ms Microsoft OneNote 36,8% 1 5
OS ms Microsoft Windows 7 N/A 57 151
Glossary
Vulnerability
A vulnerability is an error in software which can be exploited with a security impact and gain.
Exploit
Malicious code that takes advantage of vulnerabilities to infect a computer or perform other harmful actions.
Zero-day vulnerability
A zero-day vulnerability is a vulnerability that is actively exploited by hackers before it is publicly known.
31 www.flexerasoftware.com
About Flexera Software Flexera Software is reimagining the way software is bought, sold,
managed and secured. Our next-generation software licensing,
compliance, security and installation solutions are essential to ensure
continuous licensing compliance, optimize software investments and
future-proof businesses against the risks and costs of constantly
changing technology. Over 80,000 customers turn to Flexera
Software as a trusted and neutral source for the knowledge and
expertise we have gained as the marketplace leader for over 25
years and for the automation and intelligence designed into our
products. For more information, please go to:
www.flexerasoftware.com
Flexera Software, LLC.
(Global Headquarters),
+1 800-809-5659
United Kingdom (Europe,
Middle East Headquarters):
+44 870-871-1111
+44 870-873-6300
Australia (Asia,
Pacific Headquarters):
+61 3-9895-2000
For more locations visit:
www.flexerasoftware.com
©2017 Flexera Software LLC. All rights reserved. All other brand and product names are trademarks, registered trademarks,
or service marks of their respective owners.
This report may only be redistributed unedited and unaltered. This report may be cited and referenced only if clearly crediting Secunia Research and
this report as the source. Any other reproduction and redistribution in print or electronically is strictly prohibited without explicit permission.