Embed Size (px)
Citation preview
VULNERABILITY OF BLUETOOTH TO IMPULSIVE NOISE
IN ELECTRICITY TRANSMISSION SUBSTATIONS
S A Bhatti l, I A Gloverl, R Atkinson2 lCentre for Excellence in Signal and Image Processing 2Centre for Intelligent Dynamic Communications
Department of Electronic & Electrical Engineering, University of Strathclyde
204 George Street, Glasgow G 1 lXW, UK Email: [email protected]
Keywords: Impulsive noise, Symmetric alpha stable process, Measurements, Bluetooth, Industrial environments.
Abstract- Vulnerability of Bluetooth receiver to impulsive noise has been assessed in this paper. Impulsive noise environment of an Electricity transmission substation environment is modelled as a Symmetric Alpha Stable process. Parameters of the model are estimated from the measurements carried out in control room of an electricity transmission substation.
I. INTRODUCTION
In industrial environments, Supervisor Control and Data Acquisition (SCADA) systems are becoming more sophisticated and more pervasive. These are computer based monitoring systems which in many applications are complemented by a Distributed Control System (DCS). The principal components of a SCADA system are remote terminal units (RTUs), the Human Machine Interface (HMI) and a Communication Infrastructure (CI). RTUs are connected to sensors which send data to a control centre. In some more recent SCADA implementations RTUs have been replaced with Programmable Logic Controllers (PLCs) which are more easily reconfigured than special purpose RTUs. The HMI presents the data collected to an operator who can supervise and manage the entire system. Alternatively the system can be semi-automated by allowing computer programs to make control decisions. The CI connects the RTUs to the HMI and its reliability is critical.
SCADA and DCS technologies are being increasingly used in the electricity supply industry and this trend is likely to accelerate with the implementation of the smart grid. RTUs can be widely scattered throughout electricity transmission substations and are traditionally connected by cables or optical fibers to the HMI [1]. Ethernet local area network (LAN) implementations of such UCA/SCADA systems, which simplify the additionlreconfiguration of
Qingshan Shan3, Yang Yang4, J M R de S NetaS, J S da Rocha NetaS
3MRC Institute of Hearing Research, University Park, Nottingham, NG7 2RD, UK 4Shanghai Research Center for Wireless
Communications, SIMIT, Chinese Academy of Sciences, Shanghai, China 5Departamento de Engenharia Eletrica, Universidade,
Federal de Campina Grande, Campina Grande, Brazil
instrumentation and the coordination of protection systems, have been proposed and are already being evaluated [2]. Significant flexibility and cost advantages over a wired LAN infrastructure would be gained, if signals could be routed around electricity substation compounds wirelessly. Furthermore, wireless communication technologies hold out the prospect of 'hot-line', sensors that can be deployed on energized HV equipment without the inconvenience and costs associated with bridging the system's primary insulation [3, 4]. Bluetooth (a short-range wireless communication technology) represents an obvious opportunity to realize these advantages.
The Bluetooth Special Interest Group (SIG) has, with three sponsoring member companies, recently formed a 'Smart Energy Study Group'. This group is investigating the applications of Bluetooth in the context Smart Grid Communications.
Wireless transceivers are typically designed for operation in additive, white, Gaussian noise (A WGN). The noise environment in electricity substations is hostile (in the sense that the levels may be high) and, typically, impulsive. It therefore has more structure than A WGN. A model of impulsive noise specific to electricity substations would allow the assessment of risk associated with the deployment of Bluetooth (and other similar wireless technologies) in electricity substations for control, monitoring and surveillance purposes. This paper addresses such a model. It is organized as follows.
Section II gives an overview of the Bluetooth specification as standardized by the IEEE 802.l5.l work group.
Section III includes an overview of existing impulsive noise models and their suitability for INE of electricity transmission substations
Section IV describes the experimental observation of the Impulsive Noise Environment (INE) in a measurement campaign and the processing of recorded data.
Section V describes the details of selected impulsive noise model which is based on symmetric a-stable (SaS) distributions.
Section VI concludes the work with presentation of results. Results include validation of SaS noise model and performance assessment of Bluetooth receiver in terms of bit-error rate (BER) plotted against signal-to-noise ratio.
II. BLUETOOTH SHORT RANGE WIRELESS TECHNOLOGY
IEEE 802.15.1 (commonly referred to as Bluetooth) is a wireless Personal Area Network (PAN) standard originally based on the technology developed by the Bluetooth ™
Special Interest Group (SIG). It defines physical (PHY) and wireless medium access control (MAC) layers of a communications protocol for RF short-range connectivity of portable devices [5]. Its operating range depends on transmit power and can be extended from 1 m (transmit power of 1 mW) to 100 m (transmit power of 100 mW). The most commonly used Bluetooth devices have a nominal range of up to 10 m and have a transmit power of 2.5 mW [6].
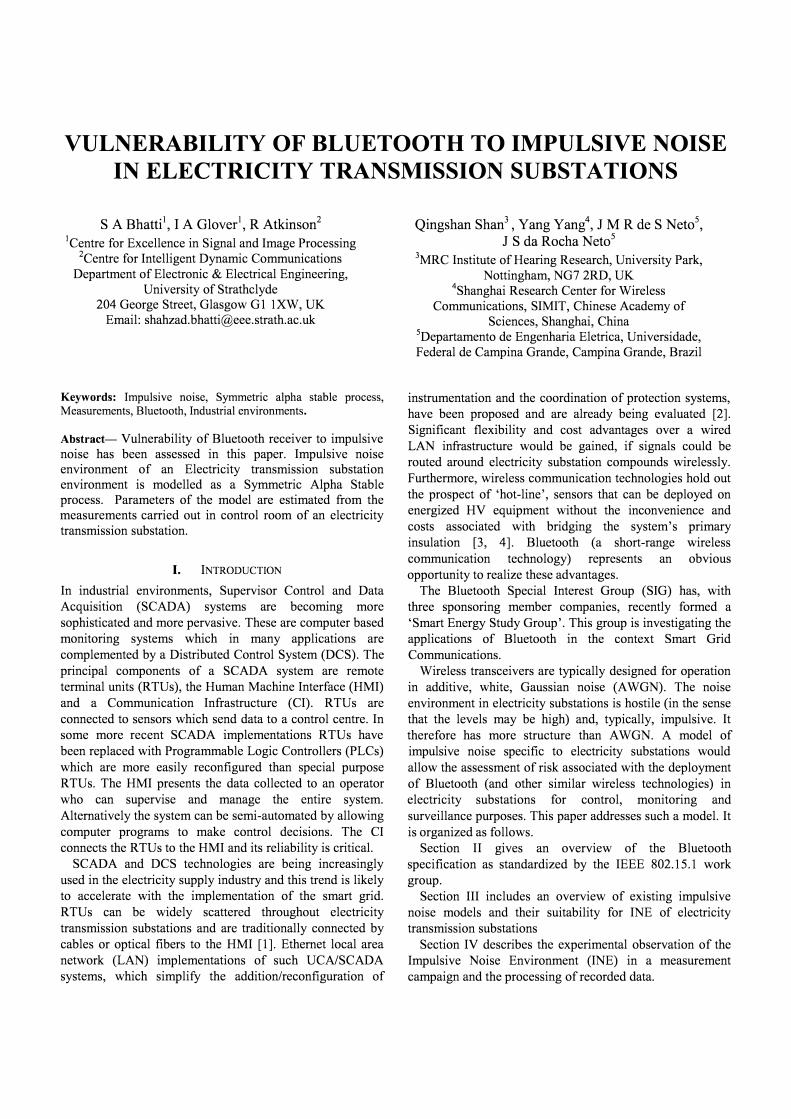
Bluetooth transceivers operate in the unlicensed Industrial Scientific and Medical (ISM) 2.4 - 2.483 GHz band using Frequency Hopping Spread Spectrum (FHSS). To combat interference and fading from co-existing WLAN (IEEE 802.11 b) transceivers, it hops among 79 frequencies with 1 MHz spacing at a rate of 1600 hops/s [6]. The modulation used is Gaussian Minimum Shift Keying (GMSK) with bandwidth-time (BT) product of 0.5 and modulation index is around 0.3. The transmitted symbol rate is 1 Mbaud. For error correction, it employs a 2/3 Hamming FEC code. A block diagram of a Bluetooth transceiver is shown in Fig. 1. (The receiver hard limiter is necessary to limit impulsive noise power as explained in section V.)
Generator
GeM!lator1
Fig.l Simulink block diagram of Bluetooth transmitter and receiver
III. IMPULSE NOISE - ORIGIN AND MODELLING
Major sources of impulsive noise in an electricity substation are: (i) Partial Discharge (PD) and (ii) Sferic Radiation (SR).
PD occurs due to imperfect insulation. The presence of air voids in solid insulation or gas bubbles in liquid insulation results, when the insulation is electrically stressed, in higher electric field strength inside the void or bubble (due to the lower dielectric constant) than outside. This can result in a discharge within the void or bubble but no discharge outside it. The discharge manifests itself as a series of quasi-random, short-duration, current pulses. The duration of the pulses is generally inversely related to the electrical strength of the insulator. Current pulses in strong insulators can have rise-times as short as 50 ps and may contain significant energy at frequencies up to 3 GHz [7].
SR is the result of switching and fault transients. It results in sporadic, but potentially large, impulsive radiation events. SR arising from operation of circuit breakers and isolators (off-load operation) have typical durations of microseconds and several tenths of a second, respectively. The power spectrum associated with SR is not, therefore, expected to extend to such high frequencies as PD. The impulsive processes which arise from PD and SR represent a source of noise that may have the potential to degrade the performance of wireless devices. The degree of degradation will, naturally, depend on the operating frequency, bandwidth, modulation scheme and error control coding employed by the device as well as on the signal-toimpulsi ve-noise-ratio.
The most widely applied impulsive noise models in recent years are due to Middleton [8] who proposed three statistical-physical models that are distinguished by the relative bandwidths of noise and receiver.
The Middleton Class A model is appropriate when receiver bandwidth is wide compared to the noise bandwidth and the noise does not produce any noticeable transients in the receiver.
The Middleton Class B model is appropriate when receiver bandwidth is narrow compared to the noise bandwidth and the noise produces strong transients in the receiver.
The Middleton Class C model is a mixture (sum) of Class A and Class B.
The impulsive characteristics of the Class B model make it a good choice for the electricity transmission substation (ETS) noise environment but Class B noise has seven parameters and no straight forward method of estimating these parameters from measured data is known. An alternative to Class B model has therefore been proposed by Nikias and Shao [9, 10] who represent impulsive noise using symmetric a-stable distributions. It has been shown [11] that the probability density function (pdf) of symmetric a-stable (SaS) process, in the presence of zero-mean
Gaussian noise is a close approximation to Middleton's Class B pdf [12J.
In the work presented here, the ETS noise environment is modelled as SaS process. The parameters of the SaS noise process have been estimated from time-series data obtained in a 400 kV substation. The measurement campaign that secured this data is described below.
IV. MEASUREMENT CAMPAIGN
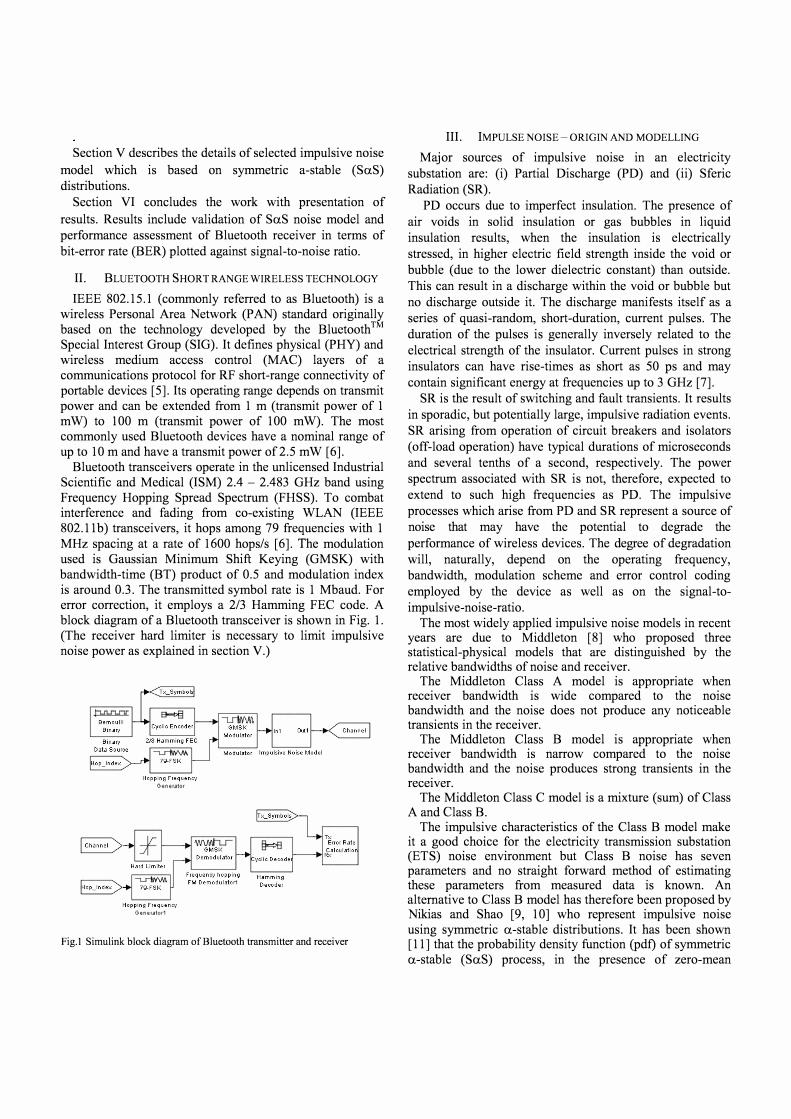
An impulsive noise recording system has been developed and deployed in a 400 kV substation. The system has been described in [13] but the description is repeated here for completeness. It consists of a low-band (LB) TEM half-hom antenna, a high-band (HB) TEM half-hom antenna, a diskcone antenna, a WLAN dual-band (2.4/5 GHz) antenna, a high-bandwidth (6 GHz) digital storage oscilloscope (DSO) and a 1 TB external hard drive disk (HDD). The system, installed in the substation control room, is shown in Fig. 2.
Fig. 2 Impulsive noise detection and recording system installed in electricity substation control room
The LB hom is constructed from a triangular aluminum plate and a 122cmx122cm aluminum ground plane. The width of the triangular plate at the aperture is 65.1cm, its length is 84cm and its aperture height measured from the ground plane is 20.1cm. The antenna feed is a 50n SMA connector with its flange in electrical contact with the ground plane and its centre-conductor connected to the triangular plate apex. The amplitude response, measured with network analyzer, shows the -3dB bandwidth of a pair of identical horns (transmit and receive) to be 1.264 GHz covering the frequency range 716 MHz - 1.98 GHz. The peak value of the amplitude response occurs at 1.068 GHz.
The HB hom triangular flange is constructed from a PCB. The flange width at the aperture is 21.7cm and its length is 28cm. The aperture height is 6.7cm. The feed structure and ground plane are identical to those of the LB hom. The -3dB bandwidth of a cascaded pair (transmit and receive) is 3.195 GHz (1.905 to 5.1 GHz) and the amplitude response peak value occurs at 2.13 GHz.
The disk-cone antenna covers frequencies below 710 MHz. This is the frequency range conventionally assumed to be important for PD. It is the data collected by the hom antennas, however, that is most significant in the context of
interference to ISM-band communications equipment and it is data from these antennas which has been analyzed. The The DSO is a LeCroy SDA 9000 with four simultaneous sampling channels. Each channel has a sampling rate of 20 GS/s and 50 MS of RAM. The analogue bandwidth is 6 GHz, and the input impedance is 50 n.
The antennas are connected (directly) to the DSO. Direct sampling is used since previous studies, e.g. [14], have shown this to be advantageous in terms of minimizing signal distortion. Interconnection is via 18 GHz, 50 n, coaxial cables. Time-series are recorded using conventional amplitude triggering. Each recorded time series is 2.5 ms in length which is the longest possible using the available RAM. The recorded signals are saved to the external HDD which is connected to the DSO via a USB interface.
The measurement site is Strathaven 400/2751132 kV airinsulated substation in the UK, owned by Scottish Power Ltd.
V. SYMMETRIC a-STABLE PROCESS
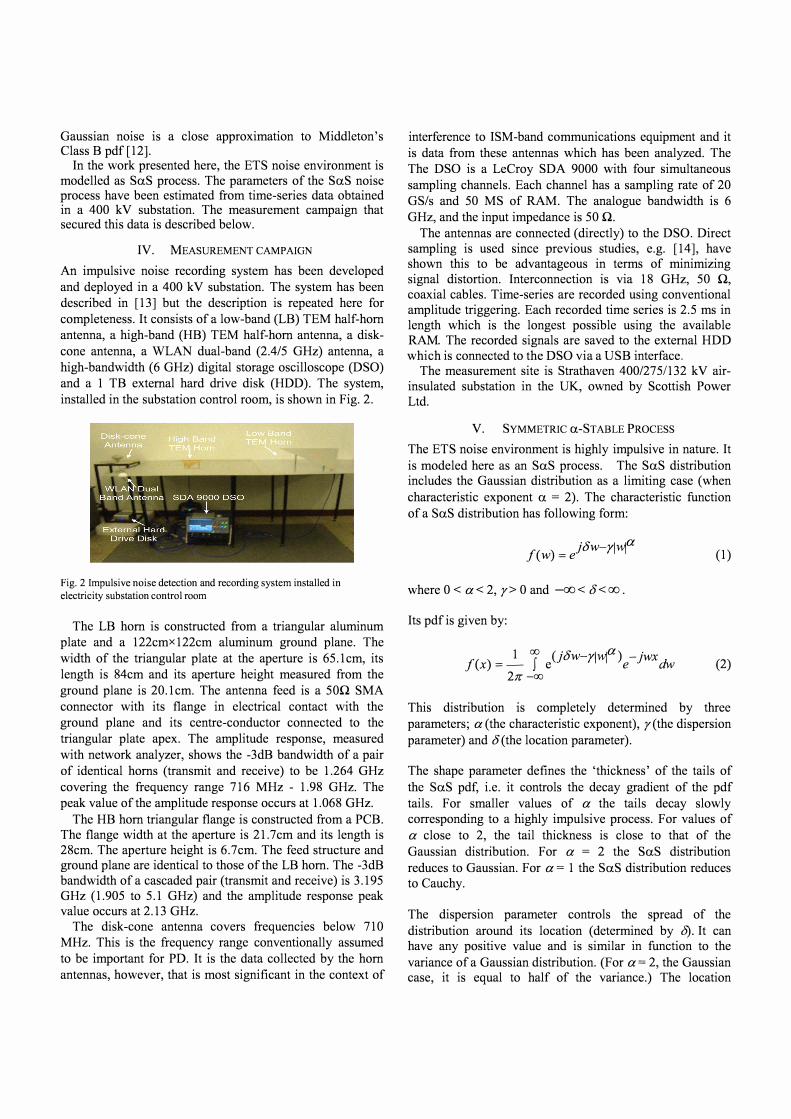
The ETS noise environment is highly impulsive in nature. It is modeled here as an SaS process. The SaS distribution includes the Gaussian distribution as a limiting case (when characteristic exponent a = 2). The characteristic function of a SaS distribution has following form:
fe w) = ejow-YIYl-f (1)
where 0 < a< 2, y> 0 and -00< 0<00.
Its pdf is given by:
f(x) = _1 f e(jow-Yll1,f) e -jwx dw (2) 27r -00
This distribution is completely determined by three parameters; a (the characteristic exponent), y(the dispersion parameter) and o(the location parameter).
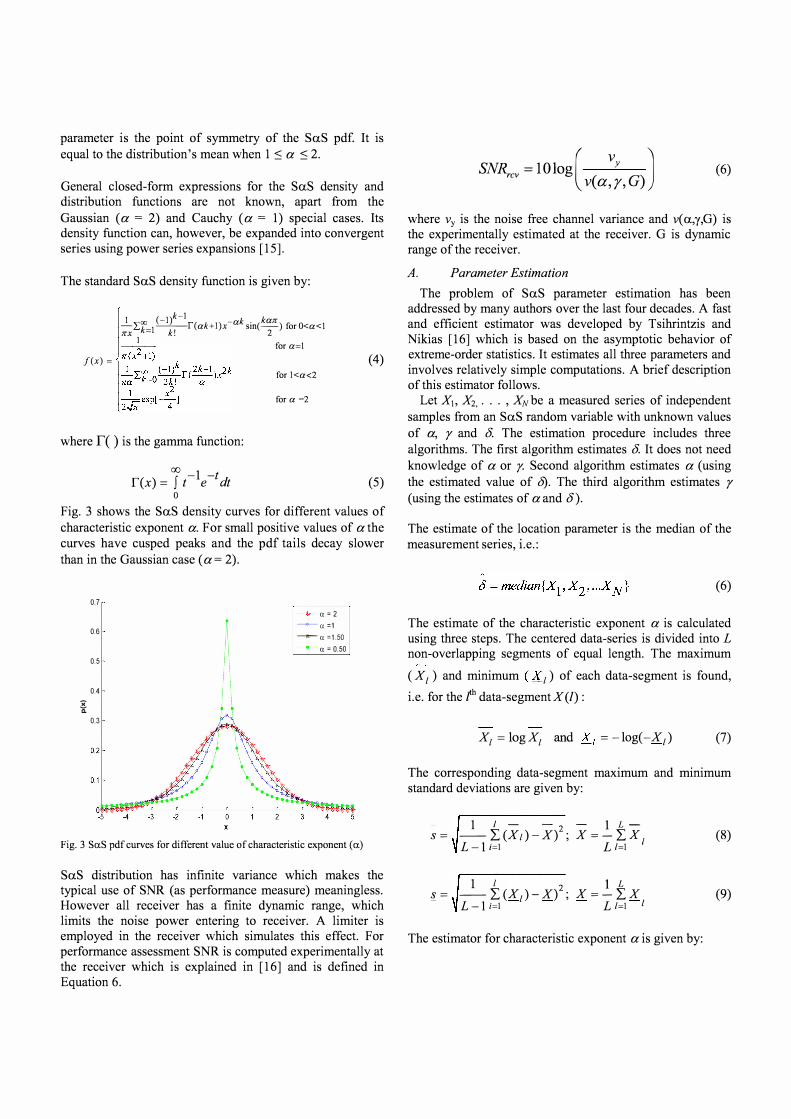
The shape parameter defines the 'thickness' of the tails of the SaS pdf, i.e. it controls the decay gradient of the pdf tails. For smaller values of a the tails decay slowly corresponding to a highly impulsive process. For values of a close to 2, the tail thickness is close to that of the Gaussian distribution. For a = 2 the SaS distribution reduces to Gaussian. For a = 1 the SaS distribution reduces to Cauchy.
The dispersion parameter controls the spread of the distribution around its location (determined by 8). It can have any positive value and is similar in function to the variance of a Gaussian distribution. (For a = 2, the Gaussian case, it is equal to half of the variance.) The location
parameter is the point of symmetry of the SuS pdf. It is equal to the distribution's mean when 1 :s a :s 2.
General closed-form expressions for the SuS density and distribution functions are not known, apart from the Gaussian (a = 2) and Cauchy ( a = 1) special cases. Its density function can, however, be expanded into convergent series using power series expansions [15].
The standard SuS density function is given by:
I(x) �
1 (�I)k�1 � k . kwr
-Look�I--l(ak+l)x a sm(-) forO<a<1 7fX � k! 2
1 for a�1
for l<a<2
for a =2
where r( ) is the gamma function:
OOf -1 -t l(x) = t e dt o
(4)
(5)
Fig. 3 shows the SuS density curves for different values of characteristic exponent a. For small positive values of a the curves have cusped peaks and the pdf tails decay slower than in the Gaussian case ( a = 2).
0.7 t· a=2
0.6 --0.=1 ---.- a =1.50
II . a = 0.50
0.5
I I 0.4
)( c:
0.3
Fig. 3 SuS pdf curves for different value of characteristic exponent (u)
SuS distribution has infinite variance which makes the typical use of SNR (as performance measure) meaningless. However all receiver has a finite dynamic range, which limits the noise power entering to receiver. A limiter is employed in the receiver which simulates this effect. For performance assessment SNR is computed experimentally at the receiver which is explained in [16] and is defined in Equation 6.
SNRrcv = IOlOg( Vy J v(a,r,G)
(6)
where Vy is the noise free channel variance and v( u,y,G) is the experimentally estimated at the receiver. G is dynamic range of the receiver. A. Parameter Estimation
The problem of SuS parameter estimation has been addressed by many authors over the last four decades. A fast and efficient estimator was developed by Tsihrintzis and Nikias [16] which is based on the asymptotic behavior of extreme-order statistics. It estimates all three parameters and involves relatively simple computations. A brief description of this estimator follows.
Let XI, X2, . . . , XN be a measured series of independent samples from an SuS random variable with unknown values of a, rand 8. The estimation procedure includes three algorithms. The first algorithm estimates 8. It does not need knowledge of a or y. Second algorithm estimates a (using the estimated value of 6). The third algorithm estimates r (using the estimates of a and 8).
The estimate of the location parameter is the median of the measurement series, i.e.:
(6)
The estimate of the characteristic exponent a is calculated using three steps. The centered data-series is divided into L non-overlapping segments of equal length. The maximum (XI ) and minimum (X I) of each data-segment is found, i.e. for the rh data-segment X (I) :
XI = log XI and XI = -log(-X,) (7)
The corresponding data-segment maximum and minimum standard deviations are given by:
1 1 - -2 - lLS = - 2: (XI) -X) ; X = -2: X, L -1 1�1 L 1=1
s= 1 I 2 1 L - 2:(XI)-X) ; X=-2:X L -1 i�1 L 1=1 ,
The estimator for characteristic exponent a is given by:
(8)
(9)
as explained in [17].
1[ 1 1 a=�(-+-) 2'16 s �
(10)
The estimator for dispersion r is based on the theory of fractional lower order pdf moments [17] and is:
r= A (11)
C(p,a)
A
where C(p, a) IS given by Equation (12) and the recommended order of fractional moment p is 1/3 of the estimated value of the characteristic exponent a.
(12) TC
cos( - p)1(I-p) 2
The performance of these estimators has been shown to be satisfactory [16]. The estimated values of 6, a and r made using the data from the measurement campaign are shown in Table 1.
TABLEl SYMMETRIC ALPHA STABLE MODEL PARAMETERS ESTIMATED FROM
MEASUREMENT CAMPAIGN
Parameters Estimated Value Location Parameter (8) I.ISOSE-7 Characteristic Exponent (a) 1.4130 Dispersion (y) 6.3422E-7
VI. SIMULATION RESULTS AND DISCUSSION
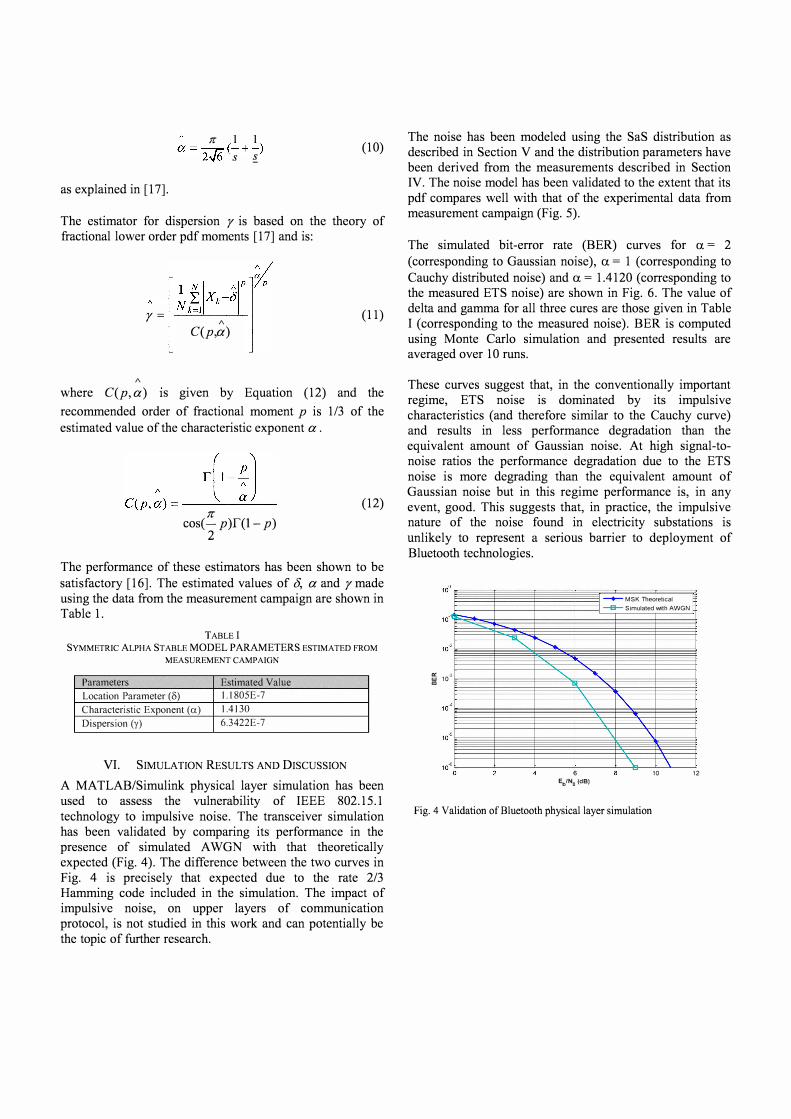
A MATLAB/Simulink physical layer simulation has been used to assess the vulnerability of IEEE 802.15.1 technology to impulsive noise. The transceiver simulation has been validated by comparing its performance in the presence of simulated A WGN with that theoretically expected (Fig. 4). The difference between the two curves in Fig. 4 is precisely that expected due to the rate 2/3 Hamming code included in the simulation. The impact of impulsive noise, on upper layers of communication protocol, is not studied in this work and can potentially be the topic of further research.
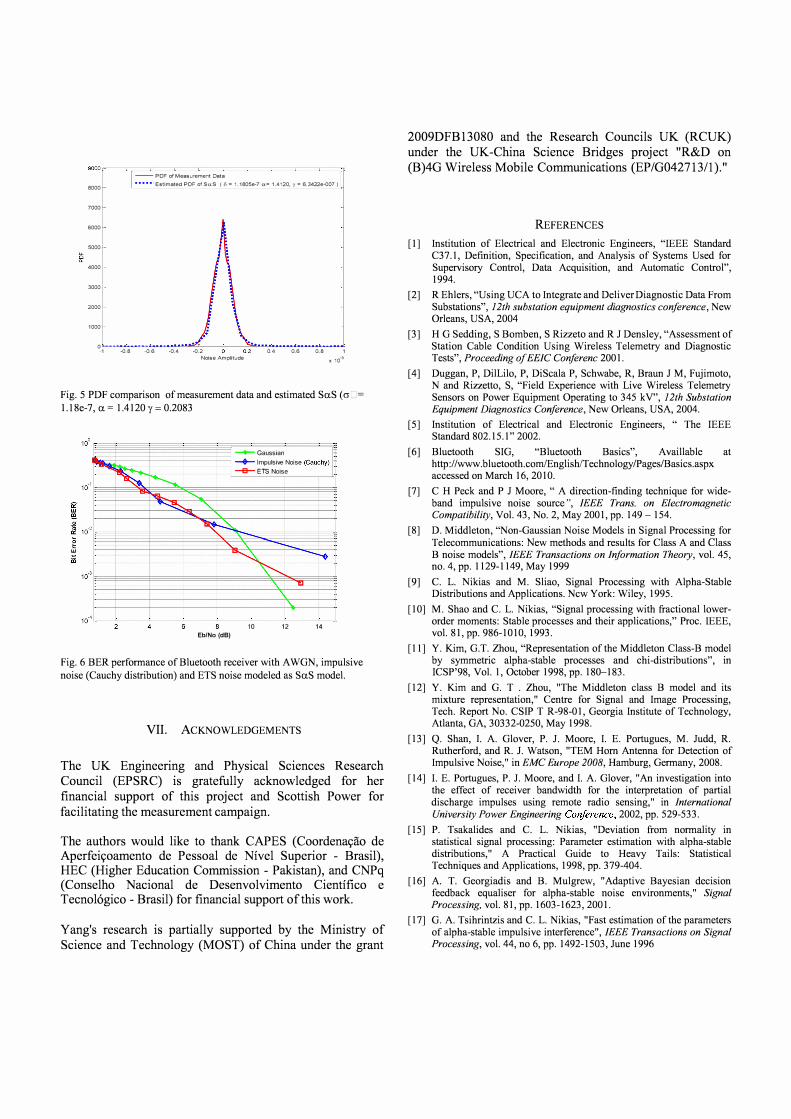
The noise has been modeled using the SaS distribution as described in Section V and the distribution parameters have been derived from the measurements described in Section IV. The noise model has been validated to the extent that its pdf compares well with that of the experimental data from measurement campaign (Fig. 5).
The simulated bit-error rate (BER) curves for a = 2 (corresponding to Gaussian noise), a = 1 (corresponding to Cauchy distributed noise) and a = 1.4120 (corresponding to the measured ETS noise) are shown in Fig. 6. The value of delta and gamma for all three cures are those given in Table I (corresponding to the measured noise). BER is computed using Monte Carlo simulation and presented results are averaged over 10 runs.
These curves suggest that, in the conventionally important regime, ETS noise is dominated by its impulsive characteristics (and therefore similar to the Cauchy curve) and results in less performance degradation than the equivalent amount of Gaussian noise. At high signal-tonoise ratios the performance degradation due to the ETS noise is more degrading than the equivalent amount of Gaussian noise but in this regime performance is, in any event, good. This suggests that, in practice, the impulsive nature of the noise found in electricity substations is unlikely to represent a serious barrier to deployment of Bluetooth technologies.
'" . � 10
, .,..
, "'
3
,
5
.......
........ ,
'\
6 ..,lNo (dB)
� MSK Theoretical --e-- Simulated 'Nith AWGN
"\.
'\
\. \ 10
Fig. 4 Validation of Bluetooth physical layer simulation
12
OOOO .-�r=�==�===c===c==�==�==�==c=� -- PDF of Measurement Data
8000 ••••• , Estimated PDF of SaS (15 '" 1. 1805e-7 0."' 1.4120, r ,. 6. 3422e"()()7 )
7000
6000
5000
4000
3000
2000
'000
o ..... �-·-· .. -.:· ·· ·-.. ··-.. -··-·-.. ··-.. · ·· � .. .. . •.•.•. ..: ........... .... ... ...... ....... .. .. . ·1 -0.8 -0.6 -0.4 -0.2 0.4 0.6 0.8 1
Noise Amplitude x 10.3
Fig. 5 PDF comparison of measurement data and estimated SuS (0 1.l8e-7, u = IAI20 Y = 0.2083
--+- Gaussian
I �
� Impulsive Noise (Cauchy) .... � �ElSNoise
, � -----
'" 2 � �
� w
iii
- � ......... � -V" i 3 � I
•
� r-r- t --.
10 12 14 EbfNo (dB)
Fig. 6 BER perfonnance of Bluetooth receiver with A WGN, impulsive noise (Cauchy distribution) and ETS noise modeled as SuS model.
VII. ACKNOWLEDGEMENTS
The UK Engineering and Physical Sciences Research Council (EPSRC) is gratefully acknowledged for her financial support of this project and Scottish Power for facilitating the measurement campaign.
The authors would like to thank CAPES (Coordenayao de Aperfeiyoamento de Pessoal de Nivel Superior - Brasil), HEC (Higher Education Commission - Pakistan), and CNPq (Conselho Nacional de Desenvolvimento Cientifico e Tecnologico - Brasil) for financial support of this work.
Yang's research is partially supported by the Ministry of Science and Technology (MOST) of China under the grant
2009DFB 13080 and the Research Councils UK (RCUK) under the UK-China Science Bridges project "R&D on (B)4G Wireless Mobile Communications (EP/G042713/l)."
REFERENCES
[I] Institution of Electrical and Electronic Engineers, "IEEE Standard C37.1, Definition, Specification, and Analysis of Systems Used for Supervisory Control, Data Acquisition, and Automatic Control", 1994.
[2] R Ehlers, "Using UCA to Integrate and Deliver Diagnostic Data From Substations", 12th substation equipment diagnostics conference, New Orleans, USA, 2004
[3] H G Sedding, S Bomben, S Rizzeto and R J Densley, "Assessment of Station Cable Condition Using Wireless Telemetry and Diagnostic Tests", Proceeding of EEIC Conferenc 2001.
[4] Duggan, P, DilLilo, P, DiScala P, Schwabe, R, Braun J M, Fujimoto, N and Rizzetto, S, "Field Experience with Live Wireless Telemetry Sensors on Power Equipment Operating to 345 kV", 12th Substation Equipment Diagnostics Conference, New Orleans, USA, 2004.
[5] Institution of Electrical and Electronic Engineers, " The IEEE Standard 802.15.1" 2002.
[6] Bluetooth SIG, "Bluetooth Basics", Availlable at http://www.bluetooth.comlEnglishiTechnology/Pages/Basics.aspx accessed on March 16, 2010.
[7] C H Peck and P J Moore, " A direction-finding technique for wideband impulsive noise source ", IEEE Trans. on Electromagnetic Compatibility, Vol. 43, No. 2, May 2001, pp. 149 - 154.
[8] D. Middleton, "Non-Gaussian Noise Models in Signal Processing for Telecommunications: New methods and results for Class A and Class B noise models", IEEE Transactions on Information Theory, vol. 45, no. 4, pp. 1129-1149, May 1999
[9] C. L. Nikias and M. Sliao, Signal Processing with Alpha-Stable Distributions and Applications. Ncw York: Wiley, 1995.
[10] M. Shao and C. L. Nikias, "Signal processing with fractional lowerorder moments: Stable processes and their applications," Proc. IEEE, vol. 81, pp. 986-1010,1993.
[II] Y. Kim, G.T. Zhou, "Representation of the Middleton Class-B model by symmetric alpha-stable processes and chi-distributions", in ICSP'98, Vol. I, October 1998, pp. 180-183.
[12] Y. Kim and G. T . Zhou, "The Middleton class B model and its mixture representation," Centre for Signal and Image Processing, Tech. Report No. CSIP T R-98-01, Georgia Institute of Technology, Atlanta, GA, 30332-0250, May 1998.
[13] Q. Shan, L A. Glover, P. J. Moore, I. E. Portugues, M. Judd, R. Rutherford, and R. 1. Watson, "TEM Horn Antenna for Detection of Impulsive Noise," in EMC Europe 2008, Hamburg, Gennany, 2008.
[14] 1. E. Portugues, P. J. Moore, and 1. A. Glover, "An investigation into the effect of receiver bandwidth for the interpretation of partial discharge impulses using remote radio sensing," in International University Power Engineering Conference, 2002, pp. 529-533.
[15] P. Tsakalides and C. L. Nikias, "Deviation from nonnality in statistical signal processing: Parameter estimation with alpha-stable distributions," A Practical Guide to Heavy Tails: Statistical Techniques and Applications, 1998, pp. 379-404.
[16] A. T. Georgiadis and B. Mulgrew, "Adaptive Bayesian decision feedback equaliser for alpha-stable noise environments," Signal Processing, vol. 81, pp. 1603-1623,2001.
[17] G. A. Tsihrintzis and C. L. Nikias, "Fast estimation of the parameters of alpha-stable impulsive interference ", IEEE Transactions on Signal Processing, vol. 44, no 6, pp. 1492-1503, June 1996