Embed Size (px)
Citation preview
University of Arkansas, FayettevilleScholarWorks@UARKIndustrial Engineering Undergraduate HonorsTheses Industrial Engineering
5-2019
Vulnerability Analysis of Modern Electric Grids: AMathematical Optimization ApproachMatthew Millis
Follow this and additional works at: https://scholarworks.uark.edu/ineguht
This Thesis is brought to you for free and open access by the Industrial Engineering at ScholarWorks@UARK. It has been accepted for inclusion inIndustrial Engineering Undergraduate Honors Theses by an authorized administrator of ScholarWorks@UARK. For more information, please [email protected].
Recommended CitationMillis, Matthew, "Vulnerability Analysis of Modern Electric Grids: A Mathematical Optimization Approach" (2019). IndustrialEngineering Undergraduate Honors Theses. 62.https://scholarworks.uark.edu/ineguht/62
1
Vulnerability Analysis of Modern Electric Grids: A Mathematical Optimization Approach
A thesis submitted in partial fulfillment
of the requirements for the degree of
Bachelor of Science in Industrial Engineering with Honors
by
Matthew Millis
April 2019
University of Arkansas
Thesis Advisor: Dr. Kelly Sullivan
Thesis Reader: Dr. Chase Rainwater

2
Acknowledgements
First and foremost, I owe all credit to my God; without Him, I am nothing. To my parents, thank
you for setting the bar high. Your standard for me is excellence, which I would never achieve
without you. To Maddie, in me you instill patience and persistence, two qualities this thesis
would not have been completed without. To Dr. Kelly Sullivan, thank you for helping me find a
topic, for encouraging me to believe in myself and my work, for keeping me dedicated and
humble, and most of all, for consistently being there. I am a better student, researcher, and man
because of you. Lastly, I would like to thank the State of Arkansas for the financial support
through the Student Undergraduate Research Fellowship.
3
Abstract
Electrical power must be transmitted through a vast and complicated network of interconnected
grids to arrive at one’s fingertips. The US electric grid network and its components are rapidly
advancing and adapting to the advent of smart technologies. Production of electricity is
transitioning to sustainable processes derived from renewable energy sources like wind and solar
power to decrease dependence on nonrenewable fossil fuels. These newly pervasive natures of
smart technology and the variable power supply of renewable energy introduce previously
unexamined vulnerabilities into the modern electric grid. Disruption of grid operations is not
uncommon, and the effects can be economically and societally severe. Thus, a vulnerability
analysis can provide decision makers with the ability to characterize points of improvement in
the networks they supervise.
This thesis performs a vulnerability analysis of electric grid operations including storage.
This vulnerability analysis is achieved through a set of numerical experiments on a multi-period
optimal power flow model including storage and variable demand. This model resulted in an
analysis indicating storage is helpful in increasing resilience in networks with excess generation,
no matter how severe the disruption. Networks with constrained generation benefit little, if at all,
from storage. This analysis allows us to conclude careful implementation is the best way to
improve electric grid security in the face of widespread use of renewable energy and smart
technology.
4
Table of Contents
1. Introduction ........................................................................................................................................................ 5
2. Research Contributions ..................................................................................................................................... 7
3. Methodology ........................................................................................................................................................ 7
3.1. Discipline Techniques ......................................................................................................................................... 8
3.2. Model Development and Computation ............................................................................................................. 8
3.3. Data Specification ............................................................................................................................................. 12
3.4. Summary of Numerical Experiments ............................................................................................................. 15
4. Results ................................................................................................................................................................ 16
4.1. Component Analysis ......................................................................................................................................... 16
4.2. Broad Outcomes ............................................................................................................................................... 19
5. Conclusion ......................................................................................................................................................... 20
6. Future Work ..................................................................................................................................................... 20
7. References ......................................................................................................................................................... 22
8. Appendix ........................................................................................................................................................... 24
5
1. Introduction
An electric grid is an interconnected network that delivers electricity from producers to
consumers. The electric grid in the continental US is composed of three interconnected grids:
The Eastern Interconnection, Western Interconnection, and Texas Interconnected System [1, 6].
The American electric grid is becoming more technologically advanced to meet our population’s
increasing desire for an inexpensive, immediate, and environmentally friendly energy supply.
There are few infrastructures as extensive as the American electric grid, and there is a
clear governmental interest in electric grid operations (largely because of the national security
implications). On May 11th, 2017, President Trump issued an Executive Order in which he
expressed concern about deliberate cyberattacks on critical points of infrastructure and identified
steps to be taken to advance our government’s risk management techniques [16]. While we as a
nation have yet to experience a widespread, deliberate attack on our electric grid by an external
force, it is common for regions to experience outages from systems brought down by extreme
weather, human error, and/or system error. After Hurricane Irma struck the Southeast United
States in September 2017, over seven million households in the region were without power. A
spokeswoman for a Florida energy provider stated approximately 15.25 million Floridians (59%
of the state) were without power [9]. Additionally, Florida Power and Light had over 17,000
personnel from over 30 states on standby to aid power restoration efforts [11]. As evidenced by
this and other recent events, concern for addressing system outages is relevant and current.
As is typical with advancing technology, there are benefits and detriments to every
innovation. The nature of renewable energy and its decentralized production can lead to network
load stability problems and requires energy storage [12], which is pivotal to successful operation
of the electric grid. Further, and somewhat at odds with the goals of increasing reliability and

6
efficiency, renewable energy is not always able to provide a steady supply of power for
consumption needs [12]. The advent of smart technology is partially motivated by the
widespread adoption of renewable energy. The primary functions of smart grids are
characterized by efforts to mitigate the negative effects of reduced efficiency, reliability, and
safety introduced by the inherent nature of a vast network, especially one comprised of both
renewable and nonrenewable sources of energy [10]. However, these improvements might also
mitigate these vulnerabilities in growing networks, further compounding the need for defensible
networks [2]. Due to the unreliable nature of renewable energy, safe, cost effective storage
techniques are being developed to allow renewable energy sources to be integrated into
established networks.
It is unclear how significantly the incorporation of variable power supply and
introduction of storage influences the vulnerability of electric grid networks. Thus, the
dependence of an entire nation on such a network requires deeper analysis of emerging
disruptions to enable decision makers to design and operate more resilient electric grid networks.
In what follows, we present a vulnerability analysis approach, based on an optimal power flow
model, to analyze the impact of storage on the vulnerability of the electric grid.
Although electric grid networks operate on AC flow, the need for scalable mathematical
models to address the design and operation of electric grids has prompted the use DC
approximations of nonlinear AC power flow models [8]. DC flow models are often applied
across multiple periods using unit commitment to determine optimal scheduling. These DC flow
models are developed to evaluate grid operations, commonly with the objective of minimizing
cost of power generation and delivery. In literature, it is commonly seen to model electric grid
operations with DC flow, which approximates AC flow, because it is difficult to address AC
7
flow due to its nonlinear nature [8]. AC flow is more realistic, but it also carries significant
modeling and computational challenges; we have therefore chosen to focus on the simpler DC
approximation for the purposes of this research.
2. Research Contributions
This research contributes a methodology for assessing how grid vulnerability is impacted by
incorporating storage in an interdicted network. We designed a mathematical model to assist
decision makers with mitigating the risks of implementing storage. The mathematical model
attempts to reflect the current trends of technological advancements in the modern electric grid.
This thesis provides methodology to perform a vulnerability analysis of networks to external
disruptions, deliberate or otherwise.
Vulnerability studies in power flow have been performed on the physical components of
networks [12], the unit commitment approach [18], reliability of power supply [5], and cascading
failures [13], to name a few. Our research methodology first solves a multi-period DC power
flow network to determine a plan for generating, distributing, and storing power over time.
Multiple energy generation and storage strategies are implemented under a variety of disruption
situations. The results of this analysis were used to draw conclusions about the most effective
ways to mitigate risk in constructing and securing electric grids including storage. To the best of
our knowledge, our research is the first to quantify how different energy storage strategies
impact the vulnerability of power flow networks.
3. Methodology
The following section provides an overview of the existing power flow analysis techniques
within the discipline. Subsection 3.2 details and examines our model development and describes
8
the computation of the model. Subsection 3.3 examines the data specifications and subsection 3.4
describes the design of experiments. Finally, subsection 3.5 examines solution methodology.
3.1. Discipline Techniques
Optimal power flow (OPF) is a class of network optimization problems used to describe and/or
prescribe operational characteristics of an electric grid system with defined topology, or
arrangement of the constituent parts [8]. This research developed an OPF model to analyze the
vulnerabilities of electric grid networks with storage over time.
OPF models have been applied widely in analysis of power grid operations. For this
research, we have relied upon Frank and Rebennack’s “An introduction to optimal power flow:
Theory, formulation, and example” [8] to understand the space of OPF models at a high level.
Mégel, Andersson, and Mathieu’s “Reducing the Computational Effort of Stochastic Multi-
Period DC Optimal Power Flow with Storage” [14] provided robust background on what
complications are introduced through transforming an OPF model into a multi-period example.
3.2. Model Development and Computation
We adapted a computational model of a small, easily manipulated representation of an electric
grid from the IEEE 14 Bus Test Case [15]. This Test Case represents a portion of the American
Electric Power System in the Midwestern US as of February 1962. This test case is simplistic
and has been widely analyzed. We integrated storage, variable demand, variable power supply,
and multiple periods into the network. As demand changes, the generation and distribution plans
vary over time; our model is designed to account for these rapid changes in operation. Model
development began by using existing literature to verify that our model was capable of
reproducing expected outputs of previously observed and analyzed electric grids. Once we
9
verified operation of the model, we introduced disruptions to demonstrate potential
vulnerabilities.
The model was optimized according to an objective function minimizing costs of
generation and transmission. The objective function was further strengthened for the purposes of
this research by introducing resilience as another priority by incorporating costs of storage and
load shedding (based on the certainty of eventual disruption). Under conditions of potential grid
failure, the concept of load shedding can be applied [6]. Load shedding occurs when demand
outweighs the network’s capacity to supply power, which leads to reallocation of power based on
network priorities, or, in extremely rare cases, the cost of delivering power is simply
prohibitively high. Literature often considers the concept of (𝑛 − 1) failure in design of
networks [18]. An (𝑛 − 1) failure is when a disruption wholly removes a single component of a
network, often a branch, and is able to continue functioning normally or near normally. In this
research we consider a variety of (𝑛 − 1) interdictions, as well as more catastrophic (𝑛 − 2)
disruptions. The network topology was affected by the disruptions for the entirety of the testing
period with no opportunity for recovery.
Notation for the uninterrupted model is presented below.
Sets
𝐴: the set of branches (𝑖, 𝑗), where 𝑖 < 𝑗
𝑁: the set of nodes
𝑁(𝑖), 𝑖 ∈ 𝑁: the set of nodes 𝑗 ∈ 𝑁 such that (𝑖, 𝑗) ∈ 𝐴 or (𝑗, 𝑖) ∈ 𝐴
𝑇 = {1, … , |𝑇|}: the set of time periods
Parameters
𝑟𝑖,𝑗 = removal of branch (𝑖, 𝑗) ∈ 𝐴 (1 if line (𝑖, 𝑗) has been removed); 0 otherwise
𝑏𝑖,𝑗 = susceptance of branch (𝑖, 𝑗) ∈ 𝐴 [Siemens]
10
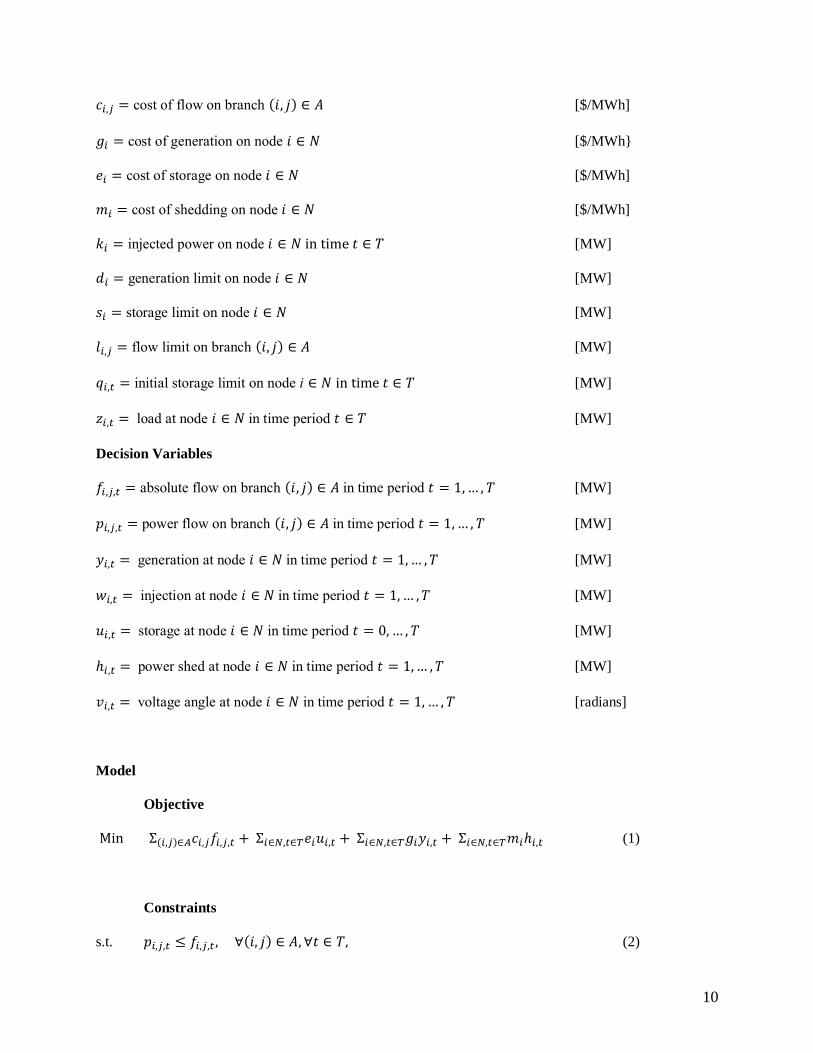
𝑐𝑖,𝑗 = cost of flow on branch (𝑖, 𝑗) ∈ 𝐴 [$/MWh]
𝑔𝑖 = cost of generation on node 𝑖 ∈ 𝑁 [$/MWh}
𝑒𝑖 = cost of storage on node 𝑖 ∈ 𝑁 [$/MWh]
𝑚𝑖 = cost of shedding on node 𝑖 ∈ 𝑁 [$/MWh]
𝑘𝑖 = injected power on node 𝑖 ∈ 𝑁 in time 𝑡 ∈ 𝑇 [MW]
𝑑𝑖 = generation limit on node 𝑖 ∈ 𝑁 [MW]
𝑠𝑖 = storage limit on node 𝑖 ∈ 𝑁 [MW]
𝑙𝑖,𝑗 = flow limit on branch (𝑖, 𝑗) ∈ 𝐴 [MW]
𝑞𝑖,𝑡 = initial storage limit on node i ∈ 𝑁 in time 𝑡 ∈ 𝑇 [MW]
𝑧𝑖,𝑡 = load at node 𝑖 ∈ 𝑁 in time period 𝑡 ∈ 𝑇 [MW]
Decision Variables
𝑓𝑖,𝑗,𝑡 = absolute flow on branch (𝑖, 𝑗) ∈ 𝐴 in time period 𝑡 = 1, … , 𝑇 [MW]
𝑝𝑖,𝑗,𝑡 = power flow on branch (𝑖, 𝑗) ∈ 𝐴 in time period 𝑡 = 1, … , 𝑇 [MW]
𝑦𝑖,𝑡 = generation at node 𝑖 ∈ 𝑁 in time period 𝑡 = 1, … , 𝑇 [MW]
𝑤𝑖,𝑡 = injection at node 𝑖 ∈ 𝑁 in time period 𝑡 = 1, … , 𝑇 [MW]
𝑢𝑖,𝑡 = storage at node 𝑖 ∈ 𝑁 in time period 𝑡 = 0, … , 𝑇 [MW]
ℎ𝑖,𝑡 = power shed at node 𝑖 ∈ 𝑁 in time period 𝑡 = 1, … , 𝑇 [MW]
𝑣𝑖,𝑡 = voltage angle at node 𝑖 ∈ 𝑁 in time period 𝑡 = 1, … , 𝑇 [radians]
Model
Objective
Min Σ(𝑖,𝑗)∈𝐴𝑐𝑖,𝑗𝑓𝑖,𝑗,𝑡 + Σ𝑖∈𝑁,𝑡∈𝑇𝑒𝑖𝑢𝑖,𝑡 + Σ𝑖∈𝑁,𝑡∈𝑇𝑔𝑖𝑦𝑖,𝑡 + Σ𝑖∈𝑁,𝑡∈𝑇𝑚𝑖ℎ𝑖,𝑡 (1)
Constraints
s.t. 𝑝𝑖,𝑗,𝑡 ≤ 𝑓𝑖,𝑗,𝑡 , ∀(𝑖, 𝑗) ∈ 𝐴, ∀𝑡 ∈ 𝑇, (2)
11
−𝑝𝑖,𝑗,𝑡 ≤ 𝑓𝑖,𝑗,𝑡 , ∀(𝑖, 𝑗) ∈ 𝐴, ∀𝑡 ∈ 𝑇, (3)
𝑓𝑖,𝑗,𝑡 ≤ 𝑙𝑖,𝑗 , ∀(𝑖, 𝑗) ∈ 𝐴, ∀𝑡 ∈ 𝑇, (4)
𝑤𝑖,𝑡 = 𝑦𝑖,𝑡 + ℎ𝑖,𝑡 + 𝑢𝑖,𝑡−1 − 𝑢𝑖,𝑡 − 𝑧𝑖,𝑡 , ∀𝑖 ∈ 𝑁, ∀𝑡 ∈ 𝑇, (5)
𝑝𝑖,𝑗,𝑡 = (1 − 𝑟𝑖,𝑗)𝑏𝑖,𝑗(𝑣𝑖,𝑡 − 𝑣𝑗,𝑡), ∀(𝑖, 𝑗) ∈ 𝐴, ∀𝑡 ∈ 𝑇, (6)
𝑤𝑖,𝑡 = ∑ (1 − 𝑟𝑖,𝑗)𝑏𝑖,𝑗(𝑣𝑖,𝑡 − 𝑣𝑗,𝑡)𝑗∈𝑁(𝑖) (7)
0 ≤ 𝑦𝑖,𝑡 ≤ 𝑑𝑖 , ∀𝑖 ∈ 𝑁, ∀𝑡 ∈ 𝑇, (8)
0 ≤ 𝑢𝑖,𝑡 ≤ 𝑠𝑖 , ∀𝑖 ∈ 𝑁, ∀𝑡 ∈ 𝑇, (9)
𝑞𝑖,0 = 0 ∀𝑖 ∈ 𝑁. (10)
Objective (1) minimizes the total cost due to power flow, power generation, power storage, and
load shedding. Constraints (2) – (3) are added to enforce 𝑓𝑖,𝑗,𝑡 = |𝑝𝑖,𝑗,𝑡| for the purpose of
allowing the objective to assess a flow cost for flow in either direction on a given branch; (4)
ensures the flow (in either direction) is less than or equal to the flow limit on a branch; (5)
enforces the injection at each node by stating it is equal to the sum of generation, shed power,
storage, and demand in a given period, as well as storage from the previous period; (6) states the
power flow on a branch is controlled by the susceptance of the branch, as well as the difference
between the voltage angles of the origin and destination nodes; (7) enforces nodal power balance
from the intersecting branches; (8) defines the generation limit of each node; (9) defines the
storage limit of each node; (10) guarantees that all nodes begin with no storage.
While formulating this model, we have made some assumptions about the network. As
previously explained, we assume the power to be DC flow, because AC flow is computationally
much more complicated [8]. Following [18], assume transmissions are lossless. Similarly, we
assume generation, storage, and consumption of power all are lossless as well. We assume there
12
are no ramp rates or penalties for changes in generation or transmission because we wished to
allow the grid to respond to disruptions as quickly and naturally as possible. We assume storage
is fixed at a single location, node 13 (i.e. 𝑠𝑖 = 0 ∀𝑖 ∈ 𝑁\{13}), which we determined by executing
a screening set of experiments to determine where it would have the greatest impact. We assume
all disruptions occur instantaneously, with no possibility for recovery. We made this assumption
because it is computationally much simpler to understand disruptions over a fixed period of time
and compare them to other grid operations, disrupted or not.
Consult Appendix A for contact information to retrieve the AMPL model, data file, and
any results.
3.3. Data Specification
The mathematical model was adapted from single period solutions of a commonly studied IEEE
electric grid to an OPF multiperiod analysis of an electric grid including storage and variable
demand interrupted by various interdiction efforts. The network topology is provided in Figure 1
[15].
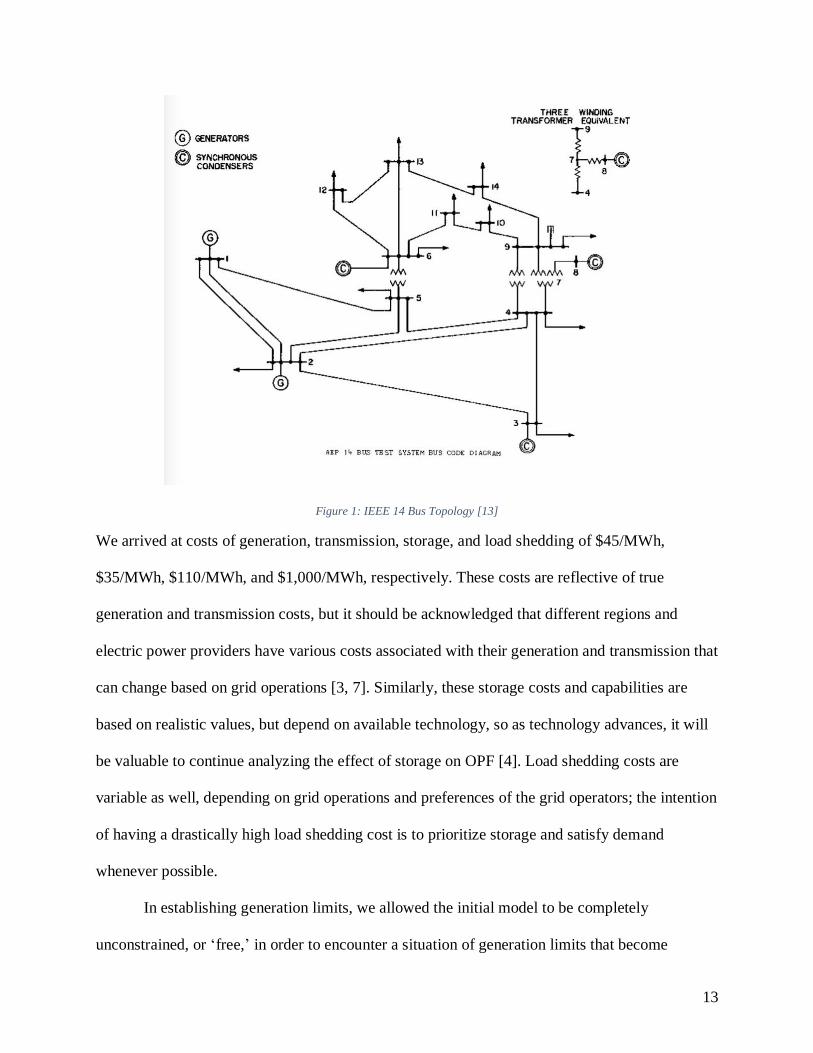
13
Figure 1: IEEE 14 Bus Topology [13]
We arrived at costs of generation, transmission, storage, and load shedding of $45/MWh,
$35/MWh, $110/MWh, and $1,000/MWh, respectively. These costs are reflective of true
generation and transmission costs, but it should be acknowledged that different regions and
electric power providers have various costs associated with their generation and transmission that
can change based on grid operations [3, 7]. Similarly, these storage costs and capabilities are
based on realistic values, but depend on available technology, so as technology advances, it will
be valuable to continue analyzing the effect of storage on OPF [4]. Load shedding costs are
variable as well, depending on grid operations and preferences of the grid operators; the intention
of having a drastically high load shedding cost is to prioritize storage and satisfy demand
whenever possible.
In establishing generation limits, we allowed the initial model to be completely
unconstrained, or ‘free,’ in order to encounter a situation of generation limits that become
14
binding under duress. These values were used to determine capacity values associated with the
five generation nodes. We tested three generation capacity settings: this initial setting (hereafter
referred to as “Free”), an instance of 5,000 MW/h limit (hereafter referred to as “Excess”), and
an instance of 2,500 MW/h (hereafter referred to as “Constrained”). Transmission limits were set
2,000 MW/h as an unconstrained limit that becomes binding under duress but is not exceeded in
the uninterdicted network. The storage limit at node 13 was set at 10,000 MW, a threshold we
did not arrive at or exceed in any tests. The susceptances of the grid come from given data [15].
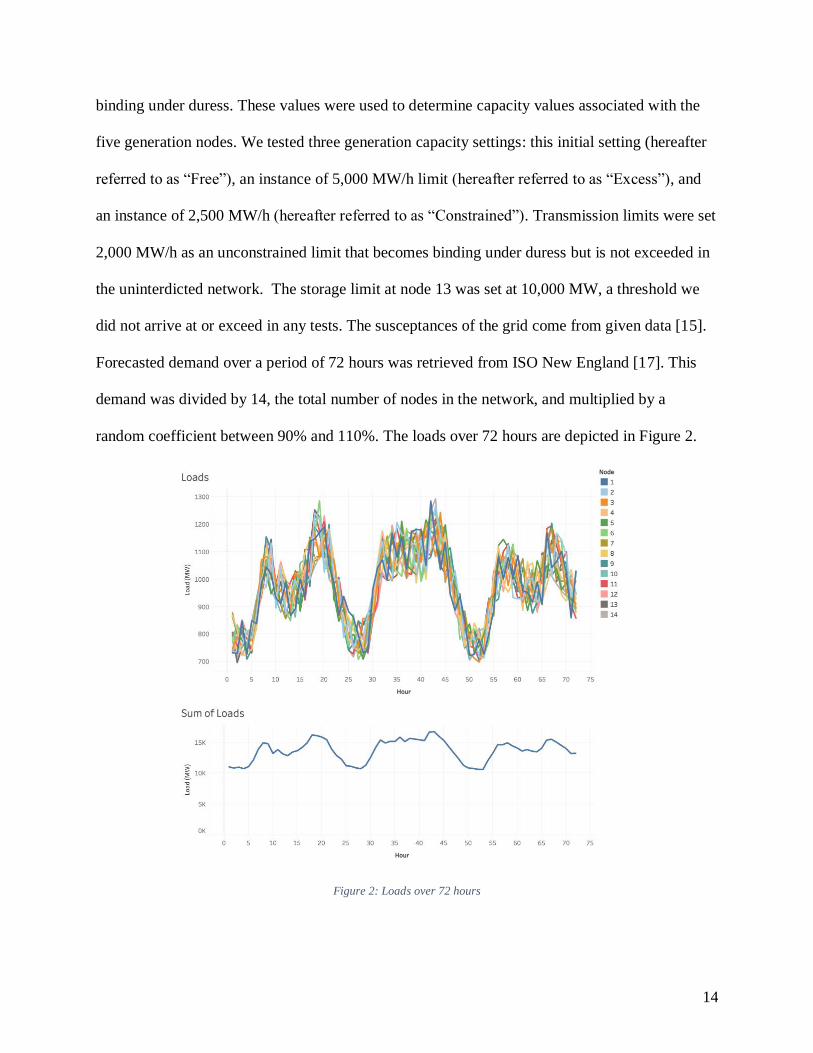
Forecasted demand over a period of 72 hours was retrieved from ISO New England [17]. This
demand was divided by 14, the total number of nodes in the network, and multiplied by a
random coefficient between 90% and 110%. The loads over 72 hours are depicted in Figure 2.
Figure 2: Loads over 72 hours
15
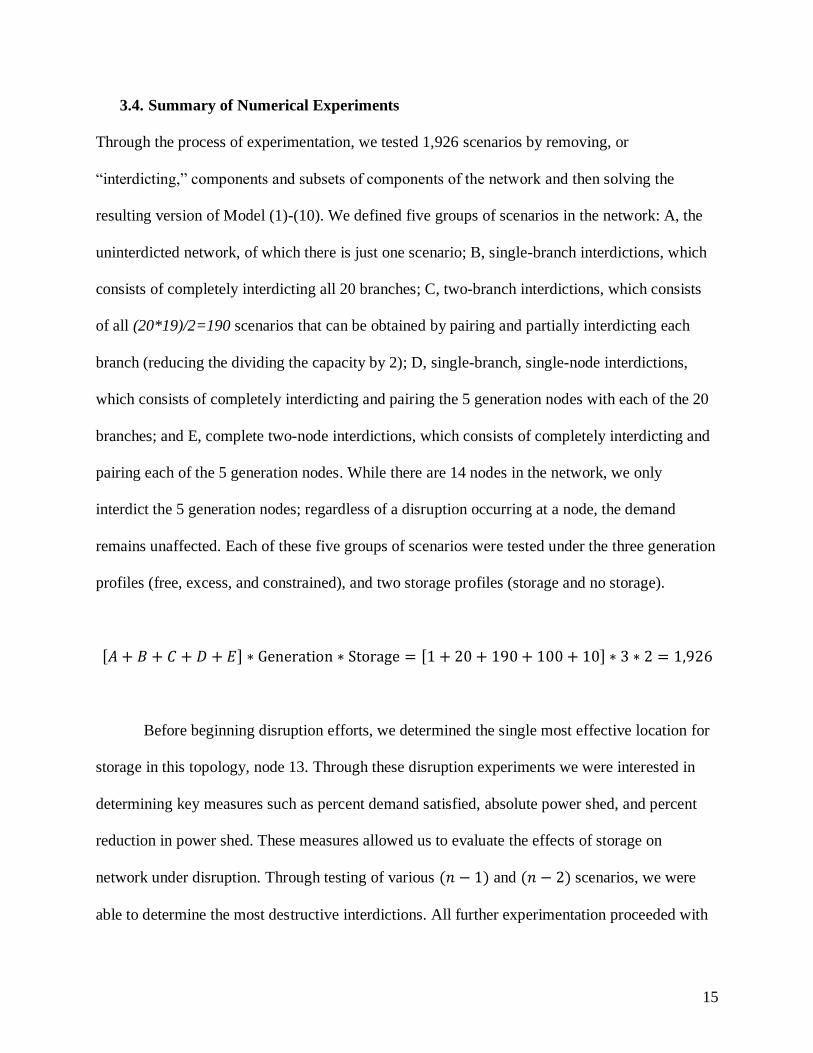
3.4. Summary of Numerical Experiments
Through the process of experimentation, we tested 1,926 scenarios by removing, or
“interdicting,” components and subsets of components of the network and then solving the
resulting version of Model (1)-(10). We defined five groups of scenarios in the network: A, the
uninterdicted network, of which there is just one scenario; B, single-branch interdictions, which
consists of completely interdicting all 20 branches; C, two-branch interdictions, which consists
of all (20*19)/2=190 scenarios that can be obtained by pairing and partially interdicting each
branch (reducing the dividing the capacity by 2); D, single-branch, single-node interdictions,
which consists of completely interdicting and pairing the 5 generation nodes with each of the 20
branches; and E, complete two-node interdictions, which consists of completely interdicting and
pairing each of the 5 generation nodes. While there are 14 nodes in the network, we only
interdict the 5 generation nodes; regardless of a disruption occurring at a node, the demand
remains unaffected. Each of these five groups of scenarios were tested under the three generation
profiles (free, excess, and constrained), and two storage profiles (storage and no storage).
[𝐴 + 𝐵 + 𝐶 + 𝐷 + 𝐸] ∗ Generation ∗ Storage = [1 + 20 + 190 + 100 + 10] ∗ 3 ∗ 2 = 1,926
Before beginning disruption efforts, we determined the single most effective location for
storage in this topology, node 13. Through these disruption experiments we were interested in
determining key measures such as percent demand satisfied, absolute power shed, and percent
reduction in power shed. These measures allowed us to evaluate the effects of storage on
network under disruption. Through testing of various (𝑛 − 1) and (𝑛 − 2) scenarios, we were
able to determine the most destructive interdictions. All further experimentation proceeded with
16
the assumption that storage was fixed at this location, and all disruptions would occur
instantaneously and with no possibility for recovery.
4. Results
Since the efforts to develop this model were based in realistic assumptions about electric grid
operations, we attempted to interdict the model with feasible disruptions. These feasible
disruptions entail complete or partial removal of various branches, or complete or partial
restriction of generation at specific nodes; further, these disruptions were selected because we
consider them to be a reasonable summation of practically possible disruption efforts. We
concluded more severe disruption efforts, of more than two branches or nodes, could not be
reasonably assumed to occur in a network of this nature. While these disruptions did strain the
network, we only prevented the generating nodes from reaching the necessary levels of power to
satisfy demand in the situations of extremely constrained generation. Thus, when load shedding
occurs, we believe it is because the changed topology prevents satisfaction of demand, not
because the cost is prohibitive.
As previously stated, the results of this research are limited by the defined topology and
components of the network. Regardless, it is possible to understand the potential effects of
storage on a network comprised of variable generation and demand under duress. Section 4.1
details the results specific to this topology. Section 4.2 analyzes more general trends behind
incorporating storage into an electric grid, applicable to other networks.
4.1. Component Analysis
Almost as a rule, interdiction of generating nodes is more impactful than interdiction of
transmission branches. Node 6 is by far the most pivotal generation node, followed by node 8,
then 1, 2, and 3, not necessarily in that order. Branches emerging from node 6 and node 9, near
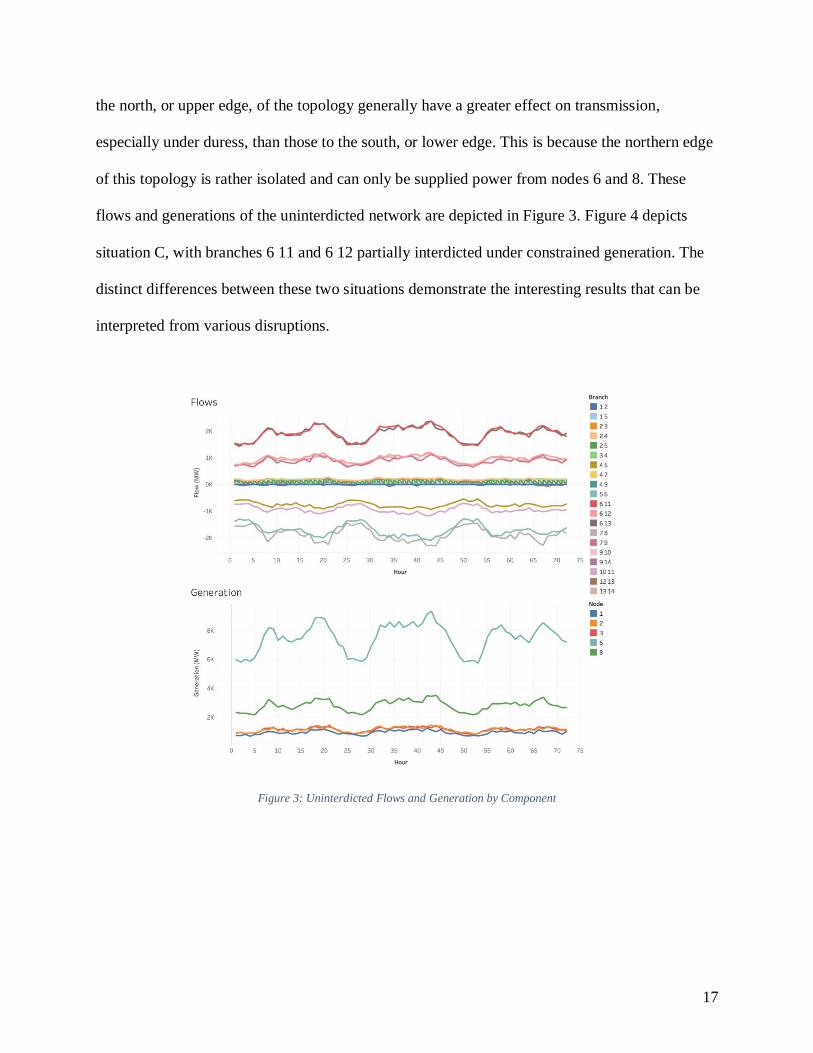
17
the north, or upper edge, of the topology generally have a greater effect on transmission,
especially under duress, than those to the south, or lower edge. This is because the northern edge
of this topology is rather isolated and can only be supplied power from nodes 6 and 8. These
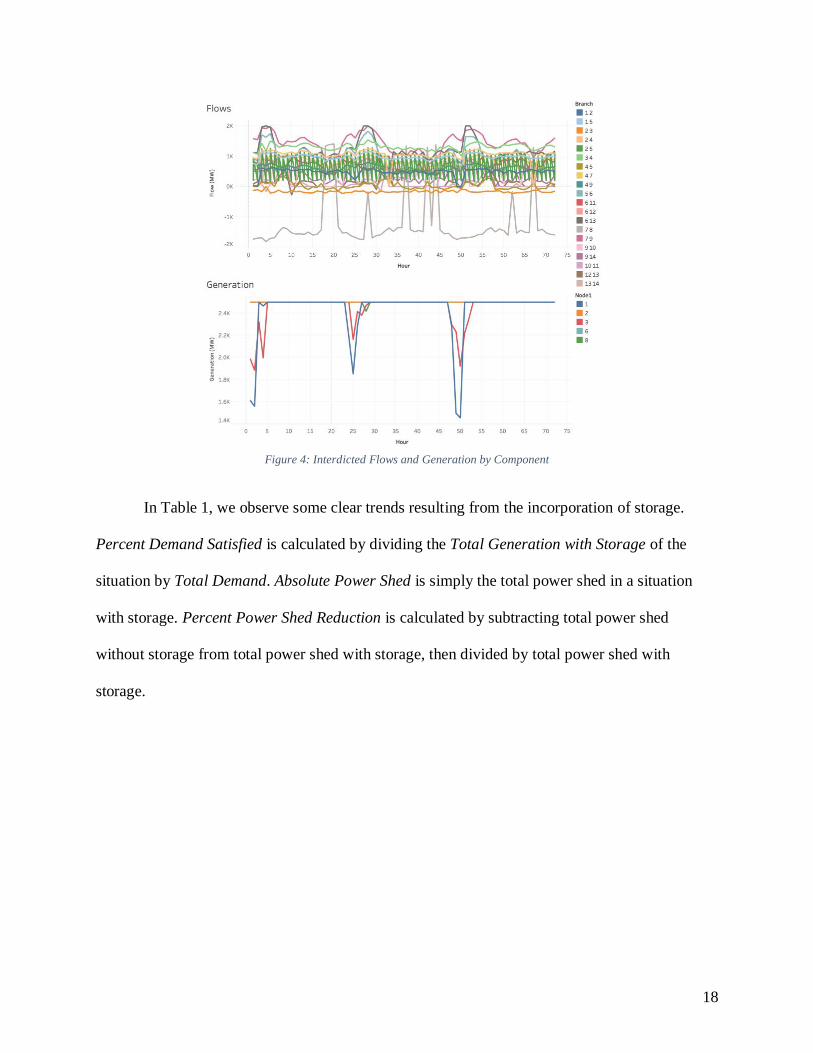
flows and generations of the uninterdicted network are depicted in Figure 3. Figure 4 depicts
situation C, with branches 6 11 and 6 12 partially interdicted under constrained generation. The
distinct differences between these two situations demonstrate the interesting results that can be
interpreted from various disruptions.
Figure 3: Uninterdicted Flows and Generation by Component
18
Figure 4: Interdicted Flows and Generation by Component
In Table 1, we observe some clear trends resulting from the incorporation of storage.
Percent Demand Satisfied is calculated by dividing the Total Generation with Storage of the
situation by Total Demand. Absolute Power Shed is simply the total power shed in a situation
with storage. Percent Power Shed Reduction is calculated by subtracting total power shed
without storage from total power shed with storage, then divided by total power shed with
storage.
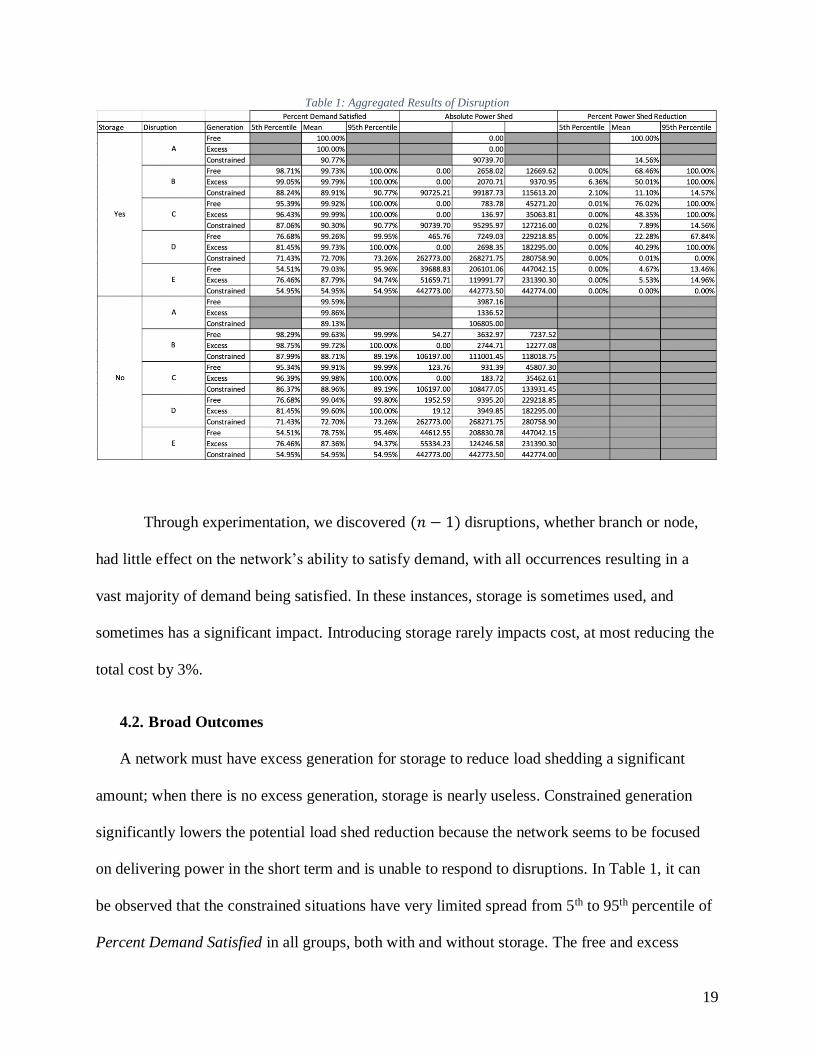
19
Table 1: Aggregated Results of Disruption
Through experimentation, we discovered (𝑛 − 1) disruptions, whether branch or node,
had little effect on the network’s ability to satisfy demand, with all occurrences resulting in a
vast majority of demand being satisfied. In these instances, storage is sometimes used, and
sometimes has a significant impact. Introducing storage rarely impacts cost, at most reducing the
total cost by 3%.
4.2. Broad Outcomes
A network must have excess generation for storage to reduce load shedding a significant
amount; when there is no excess generation, storage is nearly useless. Constrained generation
significantly lowers the potential load shed reduction because the network seems to be focused
on delivering power in the short term and is unable to respond to disruptions. In Table 1, it can
be observed that the constrained situations have very limited spread from 5th to 95th percentile of
Percent Demand Satisfied in all groups, both with and without storage. The free and excess
20
generation profiles, on the other hand, have large spreads between the 5th to 95th percentile of
Percent Demand Satisfied in some groups, and small spreads in others. All three generation
profiles have small differences in Percent Demand Satisfied between situations with and without
storage.
5. Conclusion
Through the results of this research, we can conclude that under certain circumstances electric
grid security can be significantly augmented by storage in (𝑛 − 1) and (𝑛 − 2) scenarios only if
there is potential excess generation. Thus, we observed storage can be beneficial to electric grid
security, but only to a point; the results of this research indicate storage does not reduce an
electric grid’s vulnerability to disruption to a substantial degree with consistency. The individual
topology of any network should be carefully considered when selecting a storage node and
performing any network hardening activities.
6. Future Work
This research can be furthered in the future by expanding the model in scope. We considered
instances of limited size; thus, more robust conclusions about larger, more realistic grids can be
drawn from a model with more nodes and branches, such as the IEEE 30, 57, 118, or 300 node
power flow topologies [15]. In larger topologies, it could be helpful to examine the potential
effect of multiple storage nodes, even shifting ones. The model can also be made more robust by
addressing this problem with AC power, not just DC. Similarly, some of the other assumptions
we decided not to include, such as ramp rates or lossless transmissions, could be incorporated to
allow for a more realistic OPF test case. As storage technology becomes more advanced, costs
will change; we believe it could be valuable to identify a break point for when storage should be
implemented, especially at multiple locations. Interdiction responses could be better understood

21
if disruptions occur at random intervals over a longer period of analysis, with operations
beginning and continuing normally before and after the disruption. Further, the disruptions could
be randomized and take place over varying periods of time, increasing the uncertainty of
operation. Conclusions drawn from this research could be further investigated within the context
of a formal network interdiction optimization model.
22
7. References
1. “Access to electricity (% of population).” Access to electricity (% of population) | Data,
data.worldbank.org/indicator/EG.ELC.ACCS.ZS?view=map. Accessed 18 Sept. 2017.
2. Blaabjerg, F., Teodorescu, R., Liserre, M., & Timbus, A. (2006). Overview of Control
and Grid Synchronization for Distributed Power Generation Systems. IEEE Transactions
on Industrial Electronics, 53(5), 1398-1409. doi:10.1109/tie.2006.881997
3. Electric Generating Costs: A Primer. (2014, February 28). Retrieved from
https://www.instituteforenergyresearch.org/renewable/electric-generating-costs-a-primer/
4. Energy Storage Not at Tipping Point. Retrieved from https://www.power-
eng.com/articles/2018/04/energy-storage-not-at-tipping-point-thoughts-on-why-and-
when.html
5. Enhancing the Resilience of the Nation’s Electricity System. (2017). Washington, DC:
The National Academies Press.
6. “Energy Transmission, Storage, and Distribution Infrastructure: Appendix C,
Electricity.” QER Report, Apr. 2015,
energy.gov/sites/prod/files/2015/09/f26/QER_AppendixC_Electricity.pdf. Accessed 18
Sept. 2017.
7. Fares, R. (2017, April 5). The U.S. Electric Grid's Cost in 2 Charts. Retrieved from
https://blogs.scientificamerican.com/plugged-in/the-u-s-electric-grids-cost-in-2-charts/
8. Frank, S., & Rebennack, S. (2016) An introduction to optimal power flow: Theory,
formulation, and examples, IIE Transactions, 48:12, 1172-1197, DOI:
10.1080/0740817X.2016.1189626
9. Fritz, A. “Most of Florida lost power in Hurricane Irma. Here’s what it looks like from
space.” The Washington Post, WP Company, 12 Sept. 2017,
www.washingtonpost.com/news/capital-weather-gang/wp/2017/09/12/most-of-florida-
lost-power-in-hurricane-irma-heres-what-it-looks-like-from-
space/?utm_term=.a0fdd6e89b08. Accessed 17 Sept. 2017.
10. Gungor, V. C., Lu, B., & Hancke, G. P. (2010). Opportunities and Challenges of Wireless
Sensor Networks in Smart Grid. IEEE Transactions on Industrial Electronics, 57(10),
3557-3564. doi:10.1109/tie.2009.2039455
23
11. Hurricane Irma & Hurricane Harvey Event Summary (Report #26). (2017, September
11). Retrieved September 17, 2017, from
https://www.energy.gov/sites/prod/files/2017/09/f36/hurricanes-irma-and-harvey-event-
summary-26.pdf
12. Ibrahim, H., Ilinca, A., & Perron, J. (2008). Energy storage systems—Characteristics and
comparisons. Renewable and Sustainable Energy Reviews, 12(5), 1221-1250.
doi:10.1016/j.rser.2007.01.023
13. Kinney, R., Crucitti, P., Albert, R., & Latora, V. (2005). Modeling cascading failures in
the North American power grid. The European Physical Journal B,46(1), 101-107.
doi:10.1140/epjb/e2005-00237-9
14. Megel, O., Andersson, G., & Mathieu, J. L. (2016). Reducing the computational effort of
stochastic multi-period DC optimal power flow with storage. 2016 Power Systems
Computation Conference (PSCC). doi:10.1109/pscc.2016.7541033
15. Power Systems Test Case Archive. Retrieved October 15, 2017, from
https://www2.ee.washington.edu/research/pstca/
16. Presidential Executive Order on Strengthening the Cybersecurity of Federal Networks
and Critical Infrastructure. (2017, May 11). Retrieved August 31, 2017, from
https://www.whitehouse.gov/the-press-office/2017/05/11/presidential-executive-order-
strengthening-cybersecurity-federal
17. Real-Time Maps and Charts. (n.d.). Retrieved from https://www.iso-ne.com/isoexpress/
18. Van den Bergh, K., Delarue, E., & D'haeseleer, W. (2014). DC power flow in unit
commitment models. KU Leuven Energy Institute.

24
8. Appendix
Appendix A:
Contact Dr. Kelly Sullivan at [email protected]
Contact Matthew Millis at [email protected]


![Modern Approach for WEB applications Vulnerability AnalysisThere are three common types of vulnerability analysis techniques [72]: Network specifications survivability analysis. This](https://img.pdfslide.us/doc/110x75/5fefb799c00f0829f51bfd48/modern-approach-for-web-applications-vulnerability-analysis-there-are-three-common.jpg)