Embed Size (px)
Citation preview

Vulcan Minerals Overview
November, 2018

This presentation may include “forward looking statements”. All statements, other than statements of historical fact, included herein, including without limitation, statements regarding exploration results, future plans, and objectives of Vulcan Minerals Inc. are forward looking statements that involve risks and uncertainties. There can be no assurance that such statements will prove to be accurate and actual results and future events could differ materially from those anticipated in such statements.
Forward Looking Statements

TSX-V Index10 Year Chart
“...lifting off the bottom...”
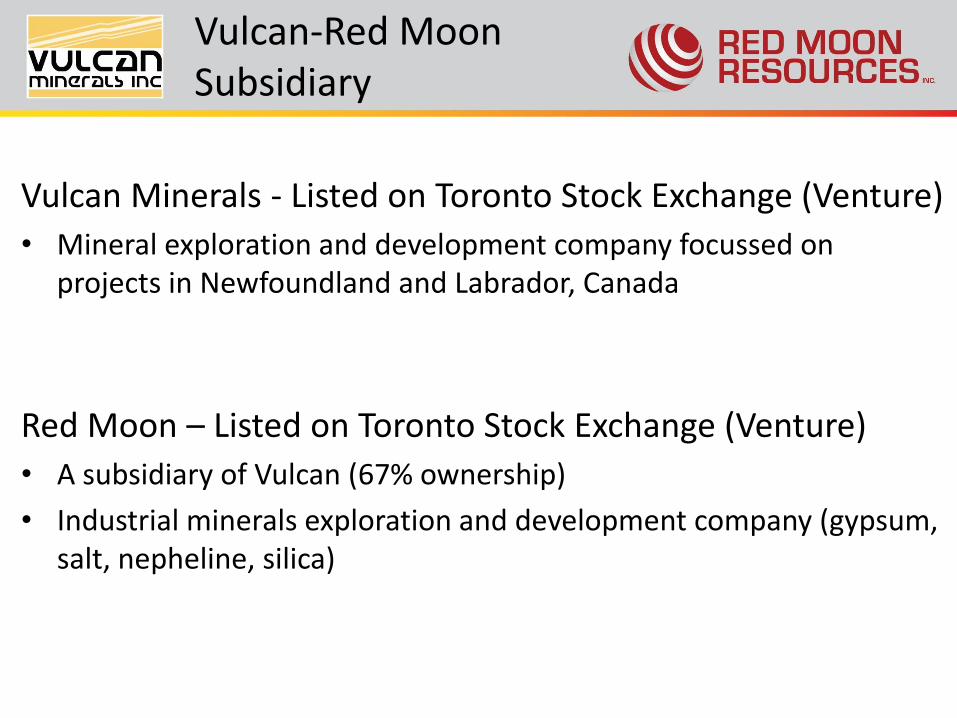
Vulcan-Red Moon Subsidiary
Vulcan Minerals - Listed on Toronto Stock Exchange (Venture)
• Mineral exploration and development company focussed on projects in Newfoundland and Labrador, Canada
Red Moon – Listed on Toronto Stock Exchange (Venture)
• A subsidiary of Vulcan (67% ownership)
• Industrial minerals exploration and development company (gypsum, salt, nepheline, silica)

Overview
• Captain Cook Salt Development Project – (Red Moon Resources Inc.)
• Colchester Copper – Gold project
• Nickel Projects - Ni-Cu-PGE
• Central Newfoundland Gold Projects

Property LocationOverview
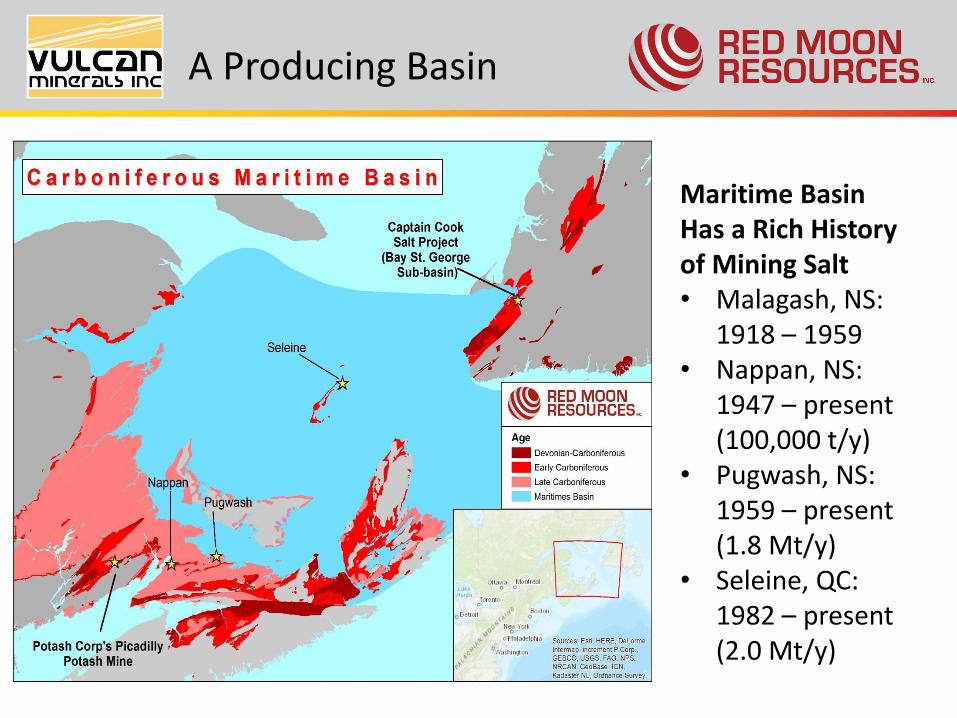
A Producing Basin
Maritime BasinHas a Rich History of Mining Salt• Malagash, NS:
1918 – 1959• Nappan, NS:
1947 – present (100,000 t/y)
• Pugwash, NS: 1959 – present (1.8 Mt/y)
• Seleine, QC: 1982 – present (2.0 Mt/y)
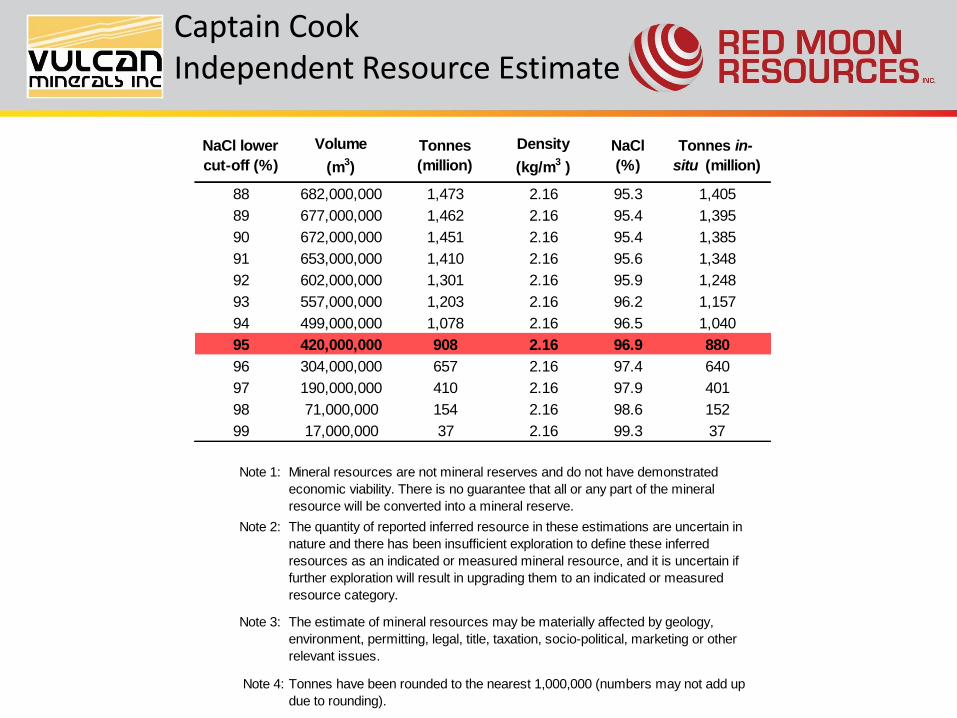
Captain CookIndependent Resource Estimate
NaCl lower
cut-off (%)
Volume
(m3)
Tonnes
(million)
Density
(kg/m3 )
NaCl
(%)
Tonnes in-
situ (million)
88 682,000,000 1,473 2.16 95.3 1,405
89 677,000,000 1,462 2.16 95.4 1,395
90 672,000,000 1,451 2.16 95.4 1,385
91 653,000,000 1,410 2.16 95.6 1,348
92 602,000,000 1,301 2.16 95.9 1,248
93 557,000,000 1,203 2.16 96.2 1,157
94 499,000,000 1,078 2.16 96.5 1,040
95 420,000,000 908 2.16 96.9 880
96 304,000,000 657 2.16 97.4 640
97 190,000,000 410 2.16 97.9 401
98 71,000,000 154 2.16 98.6 152
99 17,000,000 37 2.16 99.3 37
Note 1:
Note 2:
Note 3:
Note 4:
Mineral resources are not mineral reserves and do not have demonstrated
economic viability. There is no guarantee that all or any part of the mineral
resource will be converted into a mineral reserve.
The quantity of reported inferred resource in these estimations are uncertain in
nature and there has been insufficient exploration to define these inferred
resources as an indicated or measured mineral resource, and it is uncertain if
further exploration will result in upgrading them to an indicated or measured
resource category.
The estimate of mineral resources may be materially affected by geology,
environment, permitting, legal, title, taxation, socio-political, marketing or other
relevant issues.
Tonnes have been rounded to the nearest 1,000,000 (numbers may not add up
due to rounding).
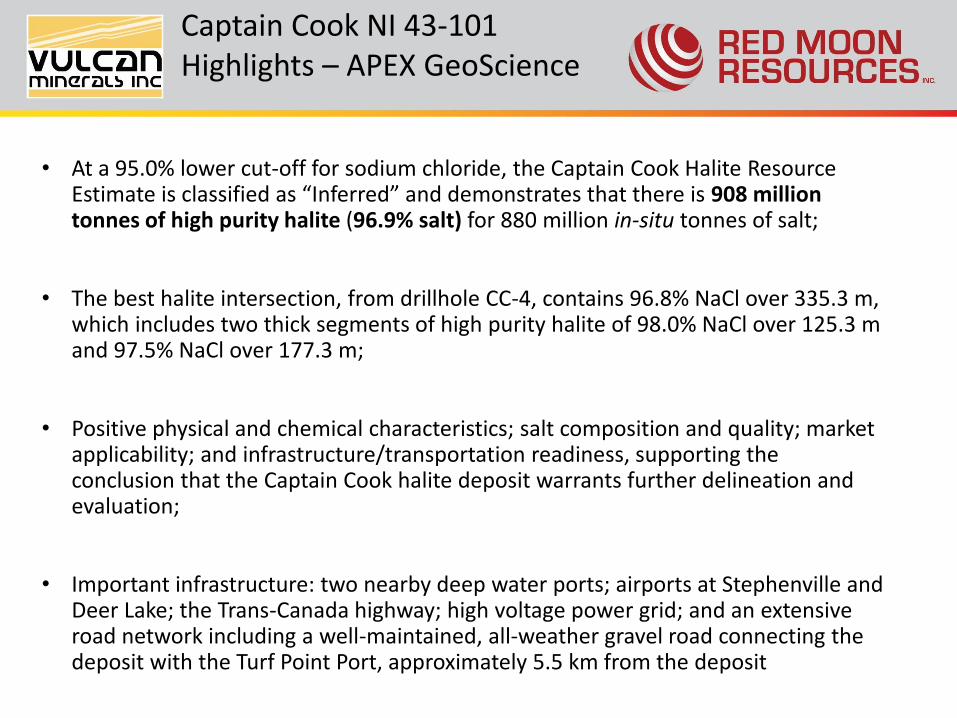
Captain Cook NI 43-101Highlights – APEX GeoScience
• At a 95.0% lower cut-off for sodium chloride, the Captain Cook Halite Resource Estimate is classified as “Inferred” and demonstrates that there is 908 million tonnes of high purity halite (96.9% salt) for 880 million in-situ tonnes of salt;
• The best halite intersection, from drillhole CC-4, contains 96.8% NaCl over 335.3 m, which includes two thick segments of high purity halite of 98.0% NaCl over 125.3 m and 97.5% NaCl over 177.3 m;
• Positive physical and chemical characteristics; salt composition and quality; market applicability; and infrastructure/transportation readiness, supporting the conclusion that the Captain Cook halite deposit warrants further delineation and evaluation;
• Important infrastructure: two nearby deep water ports; airports at Stephenville and Deer Lake; the Trans-Canada highway; high voltage power grid; and an extensive road network including a well-maintained, all-weather gravel road connecting the deposit with the Turf Point Port, approximately 5.5 km from the deposit

Infrastructure
• Significant existing infrastructure
• Nearby deep water ports (Turf Point and Port Harmon) provide access to markets in Europe, South America and Asia
• Airport within 20 minutes of property (Stephenville)
• TransCanada highway and multitude of secondary roads across property
• High voltage power line crosses the property
• Mining-friendly jurisdiction, Newfoundland & Labrador
• Skilled workforce with mining experience in nearby communities
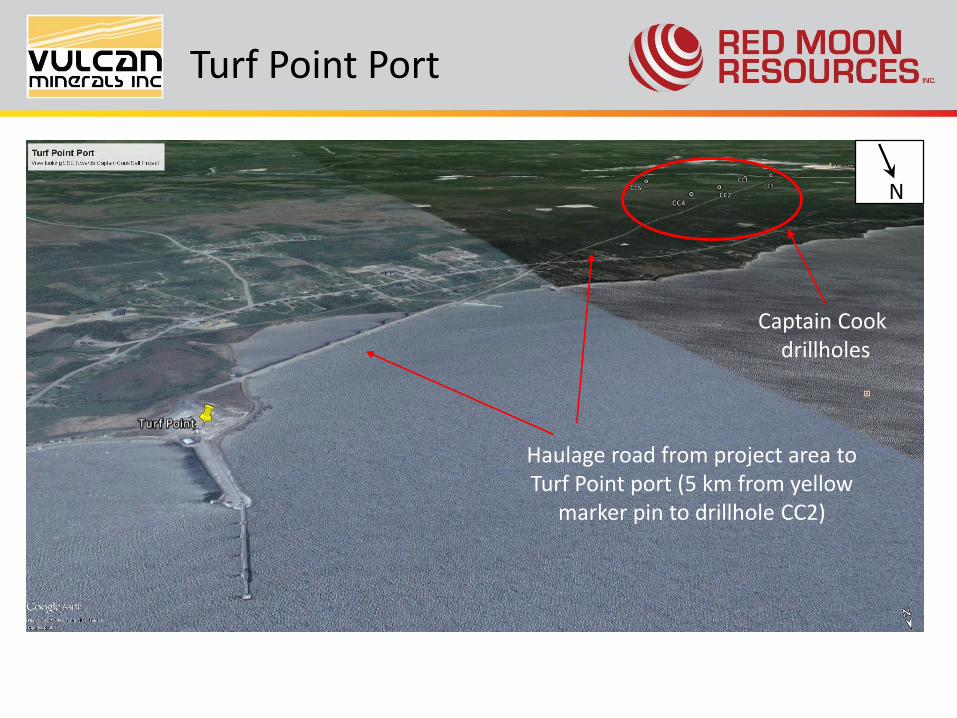
Turf Point Port
Captain Cook drillholes
Haulage road from project area to Turf Point port (5 km from yellow
marker pin to drillhole CC2)
N

Turf Point PortLoading Pier

Selected USSalt Imports
1Data are x1000 metric tonnes2Customs values only in millions of $USDSource: USGS Mineral Commodity Summaries, January 2015; US Census Bureau
• Chile is the largest salt exporter to the US, followed by Canada and Mexico
• Road de-icing consumed about 44% of total salt
2010 2011 2012 2013 2014
Quantity1 Value2 Quantity1 Value2 Quantity1 Value2 Quantity1 Value2 Quantity1 Value2
Canada 4,240 $ 119,000 5,340 $ 153,000 3,980 $ 126,000 4,960 $ 157,000 $ 5,800 $ 191,000
Chile 5,000 $ 96,100 5,030 $ 102,000 3,620 $ 68,600 3,900 $ 69,300 $ 7,890 $ 167,000
Mexico 1,000 $ 28,200 1,480 $ 44,700 1,270 $ 37,600 1,530 $ 39,000 $ 2,390 $ 71,000
Bahamas, The 935 $ 16,500 512 $ 8,940 366 $ 9,160 630 $ 24,900 $ 1,010 $ 33,500
Netherlands 362 $ 11,100 127 $ 5,800 134 $ 5,090 248 $ 7,380 $ 257 $ 7,770
France 8 $ 6,800 17 $ 5,620 8 $ 6,610 10 $ 6,300 $ 13 $ 6,090
Israel 10 $ 4,620 13 $ 4,120 11 $ 6,620 14 $ 6,280 $ 66 $ 10,100
Peru 406 $ 4,420 560 $ 8,250 154 $ 2,360 244 $ 3,720 $ 722 $ 11,300
Total 11,961 $ 286,740 13,079 $ 332,430 9,543 $ 262,040 11,536 $ 313,880 $ 18,148 $ 497,760
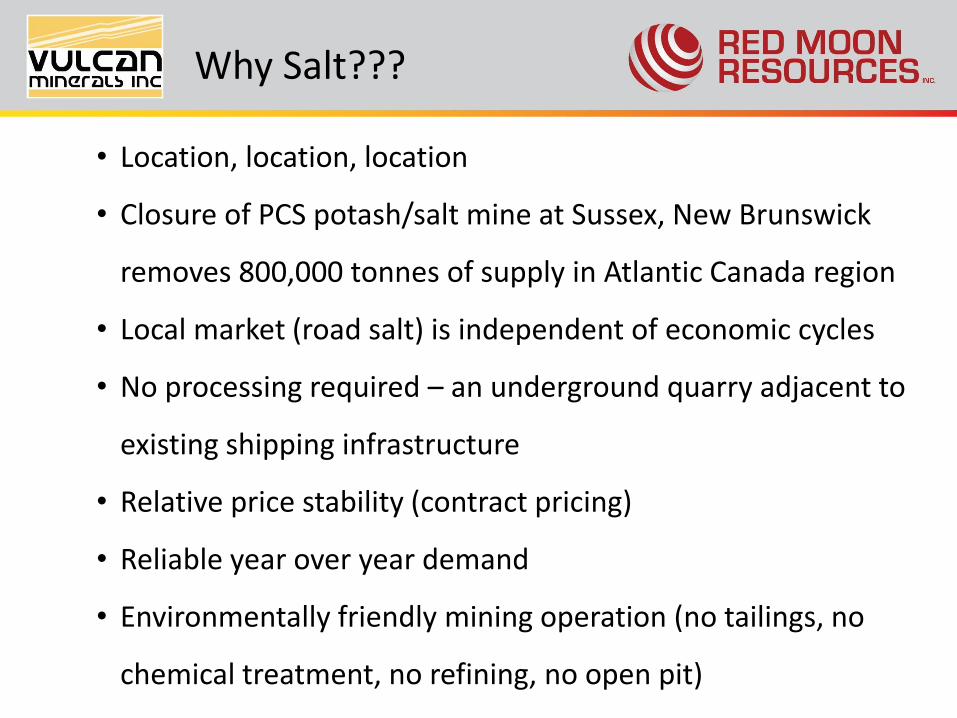
Why Salt???
• Location, location, location
• Closure of PCS potash/salt mine at Sussex, New Brunswick
removes 800,000 tonnes of supply in Atlantic Canada region
• Local market (road salt) is independent of economic cycles
• No processing required – an underground quarry adjacent to
existing shipping infrastructure
• Relative price stability (contract pricing)
• Reliable year over year demand
• Environmentally friendly mining operation (no tailings, no
chemical treatment, no refining, no open pit)

Red Moon Industrial Minerals
Captain Cook• Solicit Feasibility funding• Initiate & execute Feasibility Study
Ace Gypsum• Ramp up production to seize market opportunities• Solicit buyers for gypsum production in 2019-2020• Delineate gypsum resources for expanded market
opportunities
Black Bay Nepheline• Metallurgical test work ongoing• Marketing/partner solicitation
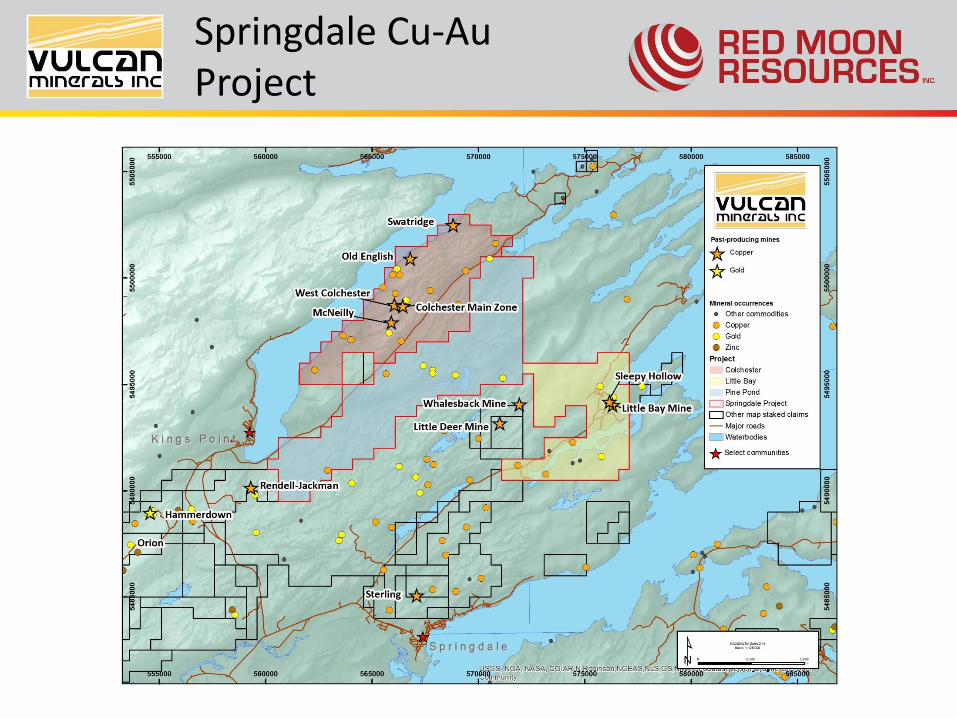
Springdale Cu-AuProject

Springdale Cu-AuProject Geology
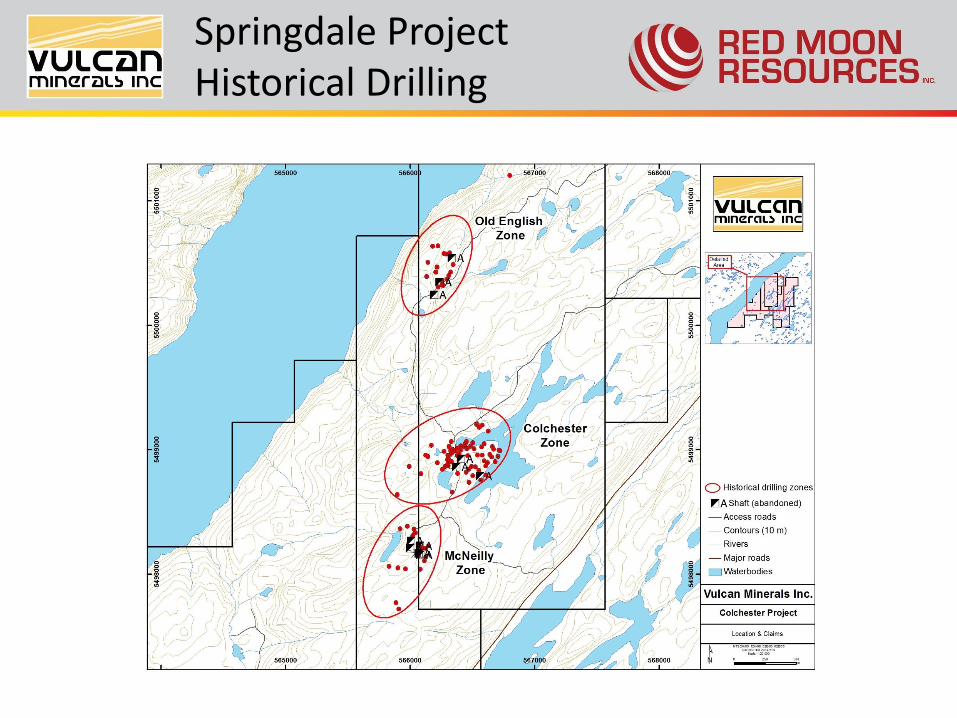
Springdale ProjectHistorical Drilling

Colchester HistoricalCopper Results
• Historical drilling in 3 major zones between 1967 to 2005
• 110 drillholes over 22,000 m
• Extensive copper and gold mineralization intersected in all zones
Hole-ID Zone From (m) To (m) Length (m) Composited Cu (%)
436-11 McNeilly 86.28 90.83 4.55 4.55 m @ 3.82%
436-16 Colchester 142.30 157.60 15.30 15.30 m @ 1.02%
436-16 Colchester 167.94 178.13 10.19 10.19 m @ 1.07%
436-21 Colchester 23.96 38.10 14.14 14.14 m @ 1.95%
436-21 Colchester 53.04 71.63 18.59 18.59 m @ 1.61%
436-21 Colchester 53.04 73.10 20.06 20.06 m @ 1.51%
436-30 Colchester 59.74 69.98 10.24 10.24 m @ 2.20%
436-31 Colchester 175.26 189.07 13.81 13.81 m @ 1.07%
436-35 Colchester 76.20 90.37 14.17 14.17 m @ 1.06%
436-37 Colchester 46.02 57.21 11.19 11.19 m @ 1.33%
436-38 Colchester 183.28 193.55 10.27 10.27 m @ 1.16%
436-39 Colchester 178.61 192.27 13.66 13.66 m @ 1.01%
436-41 Colchester 128.96 155.45 26.49 26.49 m @ 1.43%
436-6 Colchester 106.68 131.06 24.38 24.38 m @ 1.21%
436-8 Colchester 119.09 131.98 12.89 12.89 m @ 1.32%
CC-03-02 Colchester 74.20 90.00 15.80 15.80 m @ 2.19%
CC-03-11 McNeilly 72.85 84.00 11.15 11.15 m @ 1.68%
CC-04-18 Colchester 34.30 46.90 12.60 12.60 m @ 1.15%
CC-04-19 Colchester 208.80 221.40 12.60 12.60 m @ 1.04%
H-45 Colchester 233.17 248.20 15.03 15.03 m @ 1.06%
H-48 Colchester 322.78 346.01 23.31 23.31 m @ 1.24%
H-49 Colchester 187.45 203.61 16.16 16.16 m @ 1.68%
H-50 Colchester 270.51 281.94 11.43 11.43 m @ 1.32%
H-51 Colchester 70.10 82.60 12.50 12.50 m @ 2.49%
H-51 Colchester 160.02 192.63 32.61 32.61 m @ 1.04%
H-52 Colchester 146.91 172.21 25.30 25.30 m @ 1.02%
H-61 McNeilly 69.34 82.30 12.96 12.96 m @ 1.97%
H-69 Colchester 192.02 202.69 10.67 10.67 m @ 1.27%
H-78 Old English 96.62 132.59 35.97 35.97 m @ 1.03%
H-83 Old English 118.02 137.16 17.14 17.14 m @ 1.01%

Colchester HistoricalGold Results
Hole-ID Zone From (m) To (m) Length (m) Composited Au (g/t)
CC-03-02 Colchester 76.20 80.05 3.85 3.85 m @ 5.86 g/t
CC-03-03 Colchester 30.85 33.40 2.55 2.55 m @ 9.79 g/t
CC-03-03 Colchester 61.55 62.65 1.10 1.10 m @ 1.63 g/t
CC-03-04 Colchester 28.65 30.57 1.92 1.92 m @ 3.33 g/t
CC-03-07 Old English 29.56 31.54 1.98 1.98 m @ 1.28 g/t
CC-03-07 Old English 41.76 42.40 0.64 0.64 m @ 3.23 g/t
CC-03-07 Old English 47.85 49.07 1.22 1.22 m @ 2.03 g/t
CC-03-07 Old English 54.28 55.00 0.72 0.72 m @ 1.04 g/t
CC-03-08 Old English 42.00 43.00 1.00 1.00 m @ 1.53 g/t
CC-03-08 Old English 71.07 71.50 0.43 0.43 m @ 1.56 g/t
CC-03-08 Old English 72.48 73.03 0.55 0.55 m @ 2.06 g/t
CC-03-09 Old English 93.50 94.00 0.50 0.50 m @ 1.30 g/t
CC-03-09 Old English 97.60 100.50 2.90 2.90 m @ 4.18 g/t
CC-03-11 McNeilly 56.00 57.00 1.00 1.00 m @ 1.07 g/t
CC-03-11 McNeilly 80.00 81.00 1.00 1.00 m @ 1.54 g/t
CC-04-14 Colchester 32.35 33.95 1.60 1.60 m @ 1.65 g/t
CC-04-16 Colchester 183.50 185.10 1.60 1.60 m @ 1.17 g/t
CC-04-17 Colchester 18.60 19.30 0.70 0.70 m @ 1.07 g/t
• Historical drilling in 3 major zones between 1967 to 2005
• 110 drillholes over 22,000 m
• Extensive copper and gold mineralization intersected in all zones
Select composited historical Colchester gold drilling results
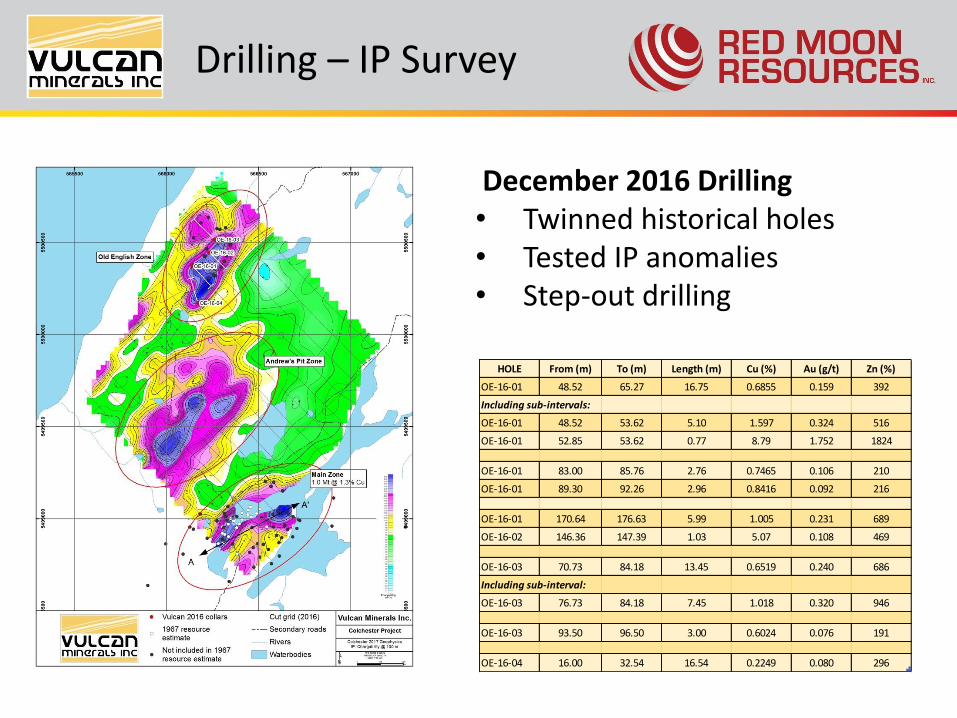
December 2016 Drilling • Twinned historical holes• Tested IP anomalies• Step-out drilling
HOLE From (m) To (m) Length (m) Cu (%) Au (g/t) Zn (%)
OE-16-01 48.52 65.27 16.75 0.6855 0.159 392
Including sub-intervals:
OE-16-01 48.52 53.62 5.10 1.597 0.324 516
OE-16-01 52.85 53.62 0.77 8.79 1.752 1824
OE-16-01 83.00 85.76 2.76 0.7465 0.106 210
OE-16-01 89.30 92.26 2.96 0.8416 0.092 216
OE-16-01 170.64 176.63 5.99 1.005 0.231 689
OE-16-02 146.36 147.39 1.03 5.07 0.108 469
OE-16-03 70.73 84.18 13.45 0.6519 0.240 686
Including sub-interval:
OE-16-03 76.73 84.18 7.45 1.018 0.320 946
OE-16-03 93.50 96.50 3.00 0.6024 0.076 191
OE-16-04 16.00 32.54 16.54 0.2249 0.080 296
Drilling – IP Survey
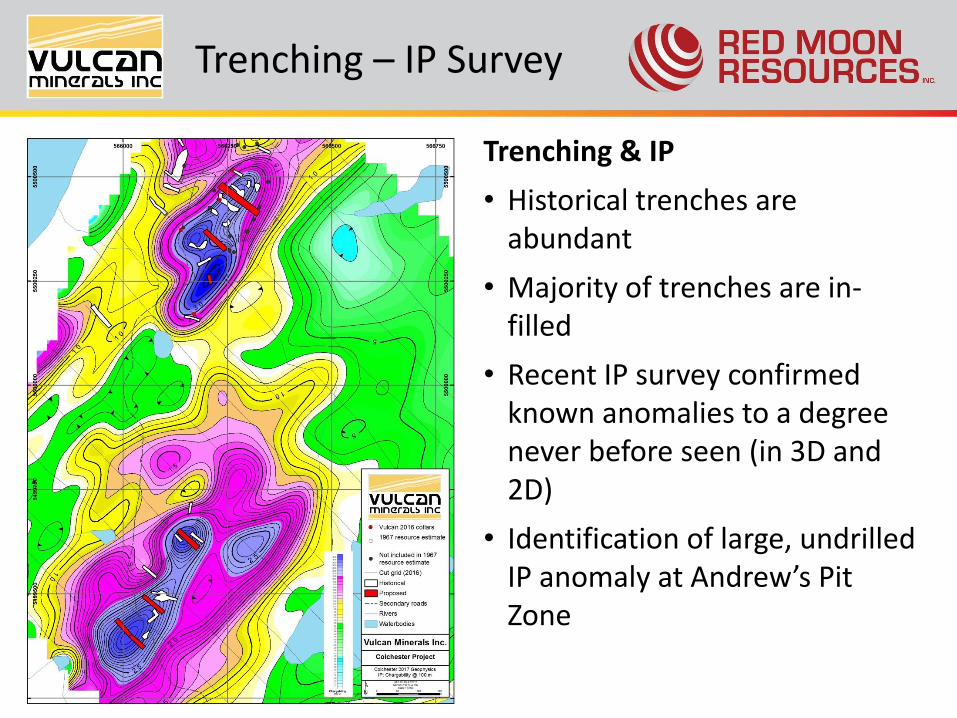
Trenching & IP
• Historical trenches are abundant
• Majority of trenches are in-filled
• Recent IP survey confirmed known anomalies to a degree never before seen (in 3D and 2D)
• Identification of large, undrilled IP anomaly at Andrew’s Pit Zone
Trenching – IP Survey

Central Newfoundland Gold Project Locations
Lizard PondHistorical Results
• The Lizard Pond South showing has received the most attention, having initially
yielded channel samples of 12.6 grams per tonne (g/t) gold over 0.4 metres and 6.6
g/t gold over 1.2 metres.
• Follow-up drilling included hole LP 87-01 which assayed 0.8 g/t gold over 15 metres
(66.6-81.6 metres depth) including 1.0 g/t gold over 8 metres (72.6-80.6 metres
depth).
• Approximately 500 metres east, the Lizard Pond Extension assayed 1.6 g/t gold
over 5.4 metres (41.3-46.7 metres) in drill hole MO-90-10.
• The Breccia Pond showing is located approximately 1500 metres east of the Lizard
Pond showing and yielded a channel sample of 3.2 g/t gold over 1.0 metre.
• Two rounds of drilling were conducted on the property in 1989 (totaling 510 m)
and 1990 (totaling 1371 m) by different operators, most of which focused on
delineating the Lizard Pond South showing.
• Prospecting by another operator in 2006 resampled (grab) the Lizard Pond South
showing with up to 22 g/t gold and up to 8.2 g/t gold at the Lizard Pond Extension.

Central NewfoundlandRed Cross Lake Nickel
• Red Cross Lake Intrusive Suite has potential for Ni-Cu-Co mineralization
• Property offsets Marathon’s exciting new gold discovery
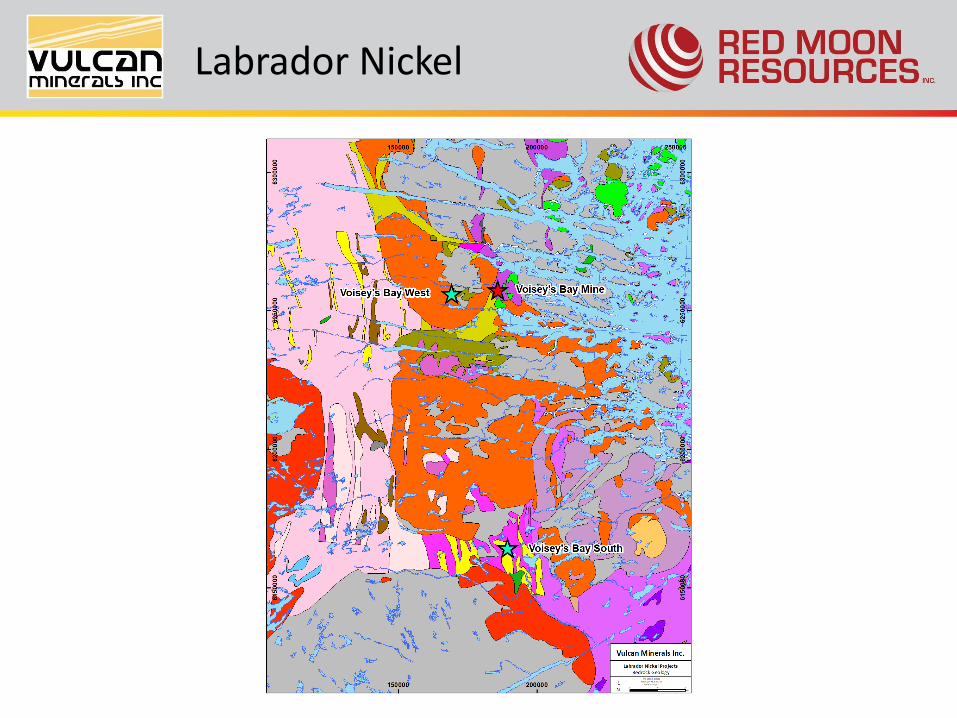
Labrador Nickel
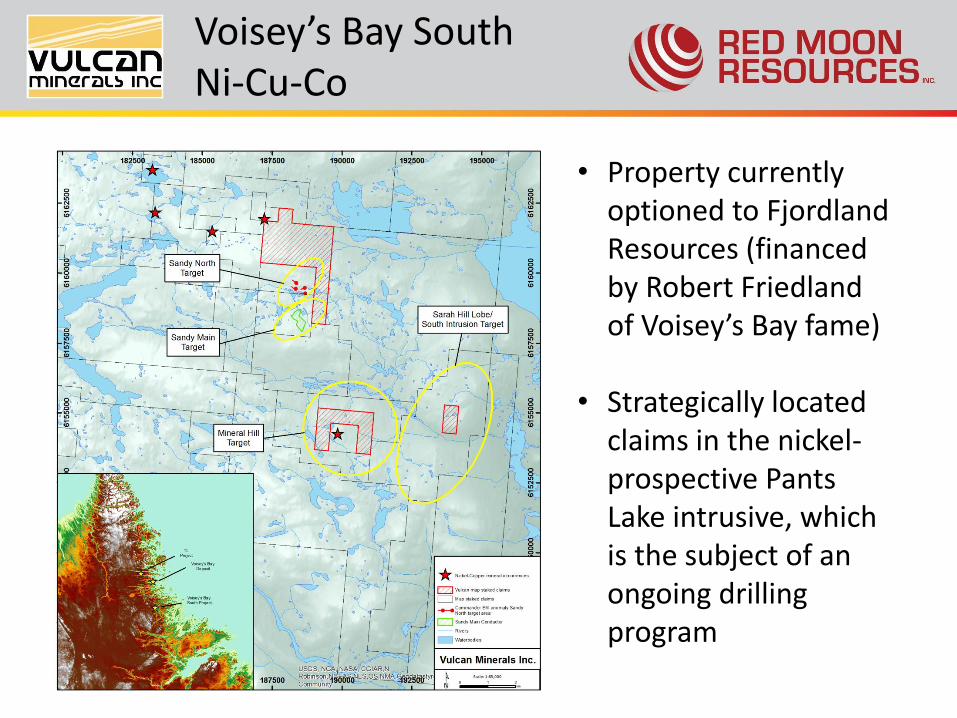
Voisey’s Bay SouthNi-Cu-Co
• Property currently optioned to FjordlandResources (financed by Robert Friedland of Voisey’s Bay fame)
• Strategically located claims in the nickel-prospective Pants Lake intrusive, which is the subject of an ongoing drilling program
2018-2019 Strategy
• Continue to create an inventory of high quality mineral exploration projects, add value and solicit partners for project evaluation
• Solicit Partner to complete a feasibility study on Red Moon’s Captain Cook Salt Project
• Springdale – Expand geophysical surveying, detailed investigation of geophysical (IP) anomalies towards identifying additional drill targets
• Nickel – evaluate current geological and geophysical data at Red Cross Lake and Labrador projects
• Central Newfoundland Gold Projects - prospecting and geological field evaluation ongoing


![VULCAN HIGH SPEED DEEP FAT FRYER (ELECTRIC) › vulcan-website...Vulcan catering equipment (ptY)ltD [ 2 ] VULCAN HIGH SPEED DEEP FAT FRYER (ELECTRIC) GENERAL DATA: MANUFACTURER: Vulcan](https://img.pdfslide.us/doc/110x75/60c05ae5c355355f26327394/vulcan-high-speed-deep-fat-fryer-electric-a-vulcan-website-vulcan-catering.jpg)