Embed Size (px)
Citation preview

VTrans2040 VTrans Multimodal Transportation Plan (VMTP)Blueprint for Livable Communities - Citizen Advisory Group Henrico, VAJuly 17, 2015Kelli Nash (OIPI)
2
What is VTrans2040?
• Vision• Guiding Principles• Goals• Objectives
VTrans Vision Document
• 2025 Needs Assessment• 2040 Scenario Analysis
VTrans Multimodal
Transportation Plan

33
INTR
OD
UCT
ION
KEY QUESTIONS
“Demographic and market studies consistently show that workers in the 21st century economy prefer walkable communities that are served by rail and public transit, as well as roads. If we want to cultivate this work force, which we need to do, we need to get ahead of these trends.”
Governor McAuliffe
June 18, 2014
44
INTR
OD
UCT
ION
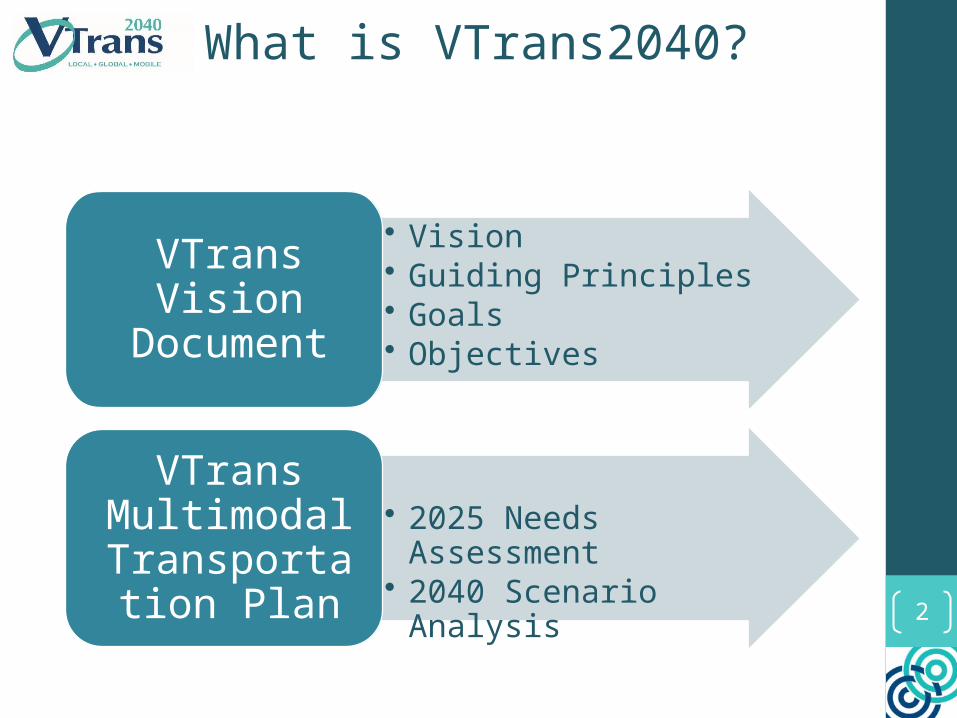
• Part of the first phase of developing VTrans2040
• Understanding the future trends that may shape current policies
TRENDS(what the world may look like in 2040)
OUTCOMES(what transportation may look like in 2040)
TRENDS ANALYSIS:

5
Growth by 2040:Virginia 28.6%USA 21.7%
Highest Millennial growth:• Urbanized Regions• Not Just Urban Centers
Seniors (65+):in 2012: 13%in 2040: 18%
Virginia is Growing
Virginia is Aging
Millennial Concentrations
71% of Growth by 2040 is concentrated in
10 cities/counties
Growth Concentrations

6
• Professional• Medical • Government • Admin. & Support
• Prof. Services & Finance in urban areas
• Health Care & Manufacturing more dispersed Statewide
• Real Estate• Manufacturing• Professional &
Scientific• Public Administration
Top Industry Sectors ( 56% of payroll Statewide by 2040)
Top Sectors for GDP
Concentrations By Region
Will hold steady to 2040with declines in agriculture offset by growth in health care
Rural Employment(Statewide by 2040)

• Port of VA growth since 2009 will continue
• Inbound coal freight will continue declines
• Rail up 88%• Truck up 31%• Air up 100%• Pipeline down 17%• Intermodal up 107%
Future Freight Trends
Freight Modal Shifts(Statewide by 2040)
Tourism Impacts(Statewide in 2012)
• $21.2 B in spending• Supported 210,00 jobs• Contributed to $4.7 B
in payroll
Future Commodities Trends• By value,
Pharmaceuticals, Electronics & Machinery are fastest –growing

8
• Ride sharing• Car sharing• Bike sharing• Ride matching
• Wireless vehicle communication
• Wireless elec. Charging• Driverless cars/buses
• Test bed on I-66 , I-495
• Smart Road by VTTI & VDOT
• Anti icing
Shared Use Mobility
Smart Technology - Infrastructure
Smart Technology - Vehicles
Rural Employment(Statewide by 2040)

9
• Coastal VA is 2nd most vulnerable region in US
• 308 ac. Port property• 129 ac. Airport runways• 253,990 ac. total
• Sea level rise greater than average
• Low elevations, land subsidence
• Ecosystem degradation
Climate Change
Sea Level Rise Impacts
At Risk Transportation Infrastructure(Statewide)
Heat Waves Impacts • Road/bridge expansion• Rail track deformation• Airport lift off
limitations

10
Draft Final Vision Plan
VTrans2040 Vision
Virginia’s multimodal transportation system will be Good for Business, Good for Communities, and Good to Go. Virginians will benefit from a transportation system that advances Virginia businesses and attracts a 21st century workforce by improving goods movement and supporting strategic placemaking.

11
VTrans and VMTP Steps
Trends Research
Vision/Goals/Objective
Complete Vision Plan
Performance Measures
Needs Assessment
Scenario Analysis
Recommendations
Complete VMTP
VTrans2040 Vision Plan VTrans2040 Multimodal Plan
We areHere HB2

12
VMTP Framework
Three types of needs:
CAPACITY &
OPERATIONS NEEDS
CoSS
Regional
Networks
UDAs
State of Good Repair
Safety
Capacity/Operations
HB2

13
VMTP Needs Assessment - Three Travel Markets
14
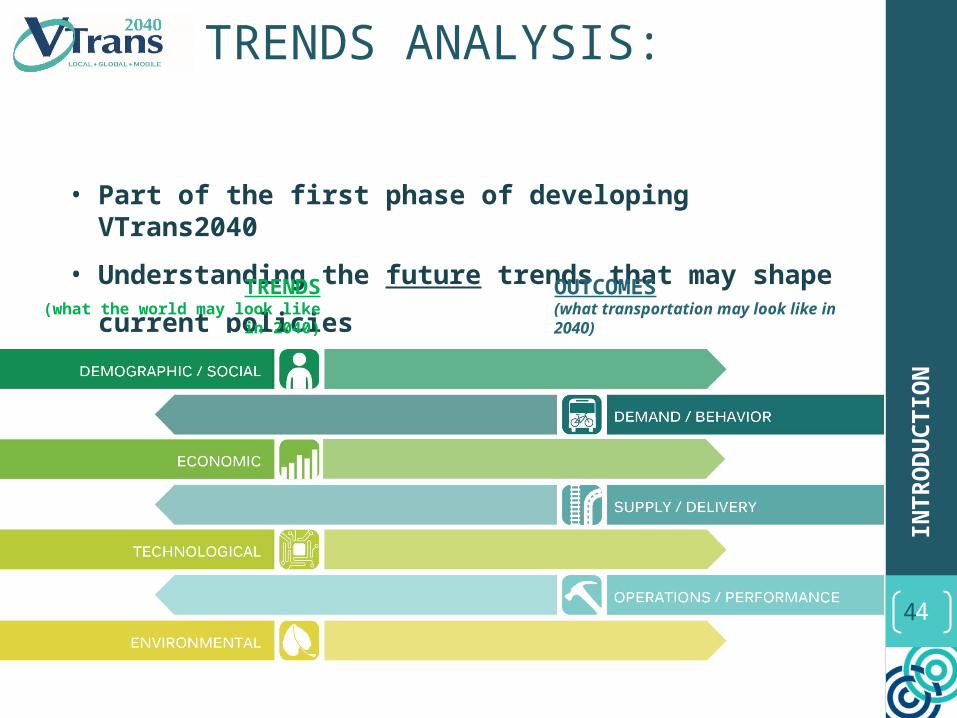
CoSS - Analysis Segments

15
CoSS 2025 Needs AssessmentCategories of Needs and Focus of Assessment
• Safety• Reliability• Congestion• Multimodal Choice & Redundancy

16
VMTP Needs Assessment - Three Travel Markets
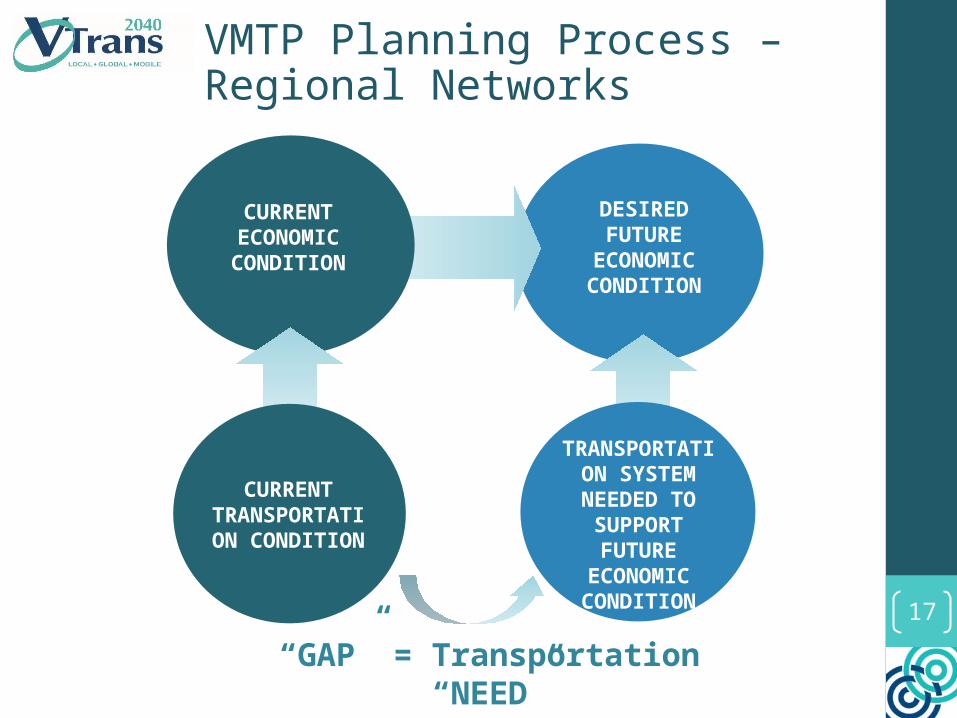
17
DESIRED FUTURE
ECONOMIC CONDITION
“GAP” = Transportation “NEED”
CURRENT ECONOMIC CONDITION
CURRENT TRANSPORTATION
CONDITION
TRANSPORTATION SYSTEM NEEDED
TO SUPPORT FUTURE
ECONOMIC CONDITION
VMTP Planning Process – Regional Networks

18
Regional Profiles

19
Needs Address the Area, Corridor andRegional Improvements Needed to Serve the 2025 Economy

20
Example Regional Network Needs
Needs Derived From Economic and Transportation Profile – Central Virginia Region
Improved trail and bike connections between and around Lynchburg-area colleges and University to strengthen Education sector

21
VMTP Needs Assessment - Three Travel Markets

22
Urban Development Areas - Background
VMTP Needs Assessment• Context sensitive multimodal transportation solutions • Last-mile access to jobs and non-work attractions • Safe bicycle and pedestrian circulation • Improve connections to local multimodal networks and regional
transportation options• Local planning assistance

23
Urban Development Areas
1. Location Research
2. Data Assessment
3. Local Needs
Assessment
4. Confirm & Organize
Needs
5. Share with Stakeholders
Ongoing April May June/July
Regional ForumsPublic Outreach
CTB Meetings

24
Updated UDA Locations
Designated UDAs per Section 15.2-2223.1Current Status* - 108 Total UDAs
*Note: OIPI is working with localities to identify other locally designated growth areas (not mapped here) that meet the intent of 15.2-2223.1 (but are not called UDAs). Localities are formally referencing the Code of Virginia for these places to ensure eligibility for HB2.

2525
UDA NEEDS Update on VTrans Multimodal TransportationPlan 2025 Needs Assessment
26
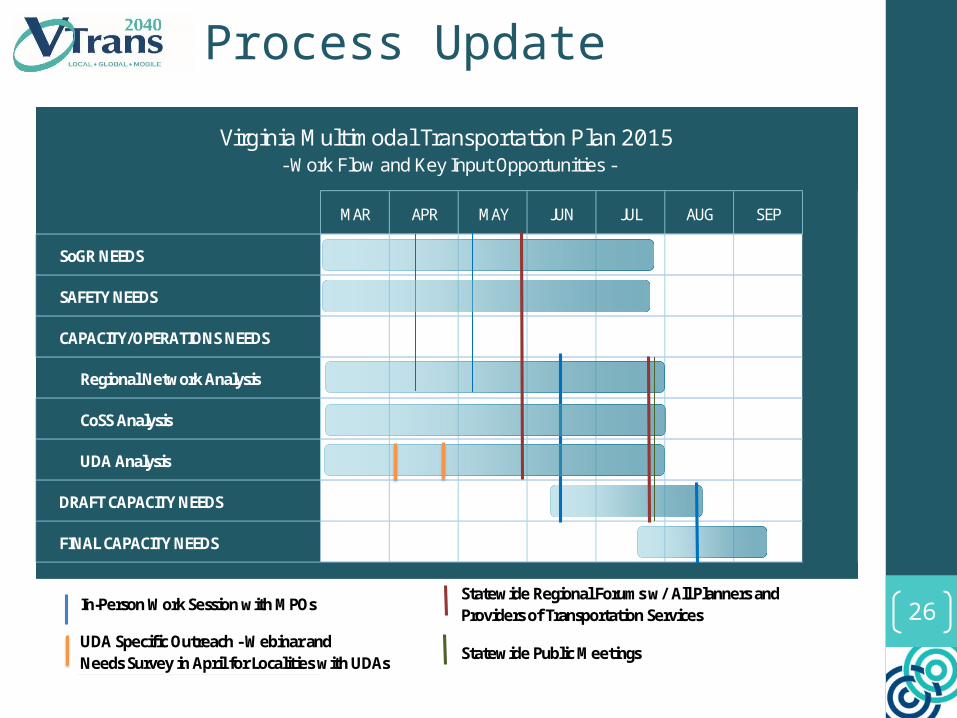
Process Update
MAR APR MAY JUN JUL AUG SEP
Regional Network Analysis
CoSS Analysis
UDA Analysis
Statewide Public Meetings
In-Person Work Session with MPOs Statewide Regional Forums w/ All Planners and Providers of Transportation Services
UDA Specific Outreach - Webinar and Needs Survey in April for Localities with UDAs
Virginia Multimodal Transportation Plan 2015- Work Flow and Key Input Opportunities -
FINAL CAPACITY NEEDS
CAPACITY/OPERATIONS NEEDS
SoGR NEEDS
SAFETY NEEDS
DRAFT CAPACITY NEEDS

27
Thank You


![VTrans2040 Vision and Multimodal Transportation Plan (VMTP)...Microsoft PowerPoint - OIPI presentation 2 4 15 MPO PDC meeting.pptx [Read-Only] Author Truda.Lee Created Date 2/3/2015](https://img.pdfslide.us/doc/110x75/5f9626f4e43c350287725c54/vtrans2040-vision-and-multimodal-transportation-plan-vmtp-microsoft-powerpoint.jpg)