Embed Size (px)
Citation preview
VSP1999
esxtop for Advanced Users
Name, Title, Company
2
Disclaimer
This session may contain product features that are currently under development.
This session/overview of the new technology represents no commitment from VMware to deliver these features in any generally available product.
Features are subject to change, and must not be included in contracts, purchase orders, or sales agreements of any kind.
Technical feasibility and market demand will affect final delivery.
Pricing and packaging for any new technologies or features discussed or presented have not been determined.
3
Before we dive in…
4
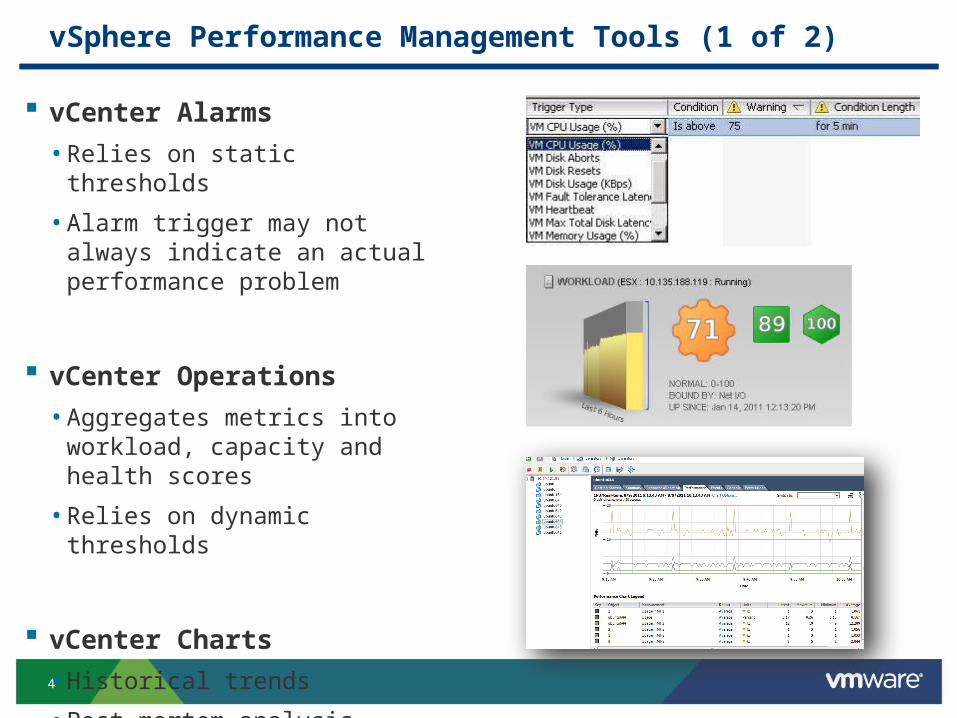
vSphere Performance Management Tools (1 of 2)
vCenter Alarms
• Relies on static thresholds
• Alarm trigger may not always indicate an actual performance problem
vCenter Operations
• Aggregates metrics into workload, capacity and health scores
• Relies on dynamic thresholds
vCenter Charts
• Historical trends
• Post mortem analysis, comparing metrics
5
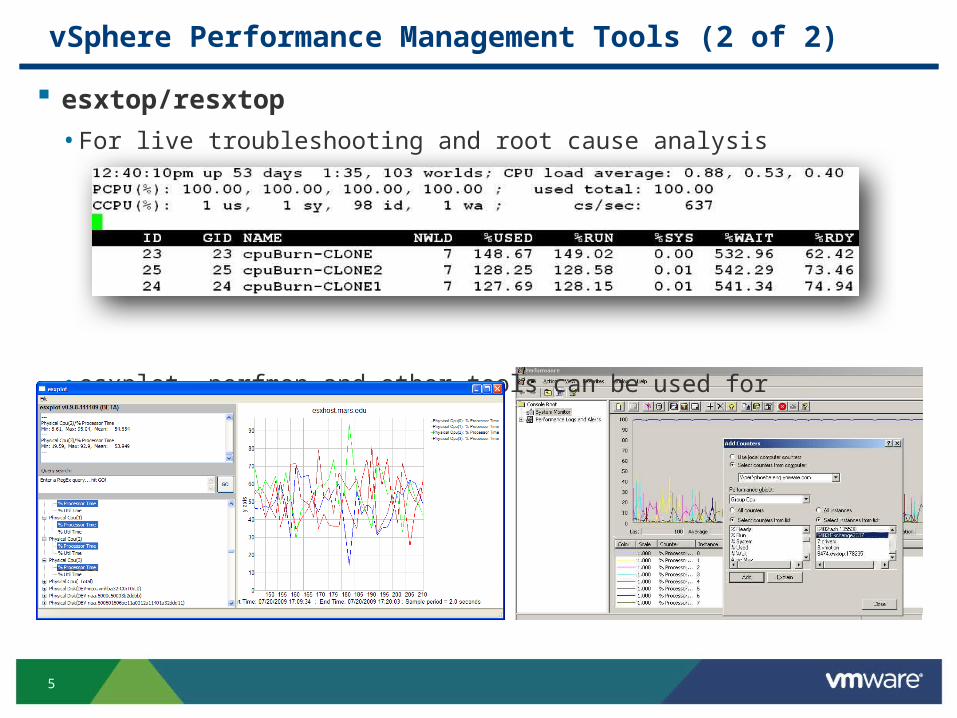
vSphere Performance Management Tools (2 of 2)
esxtop/resxtop
• For live troubleshooting and root cause analysis
• esxplot, perfmon and other tools can be used for offline analysis
6
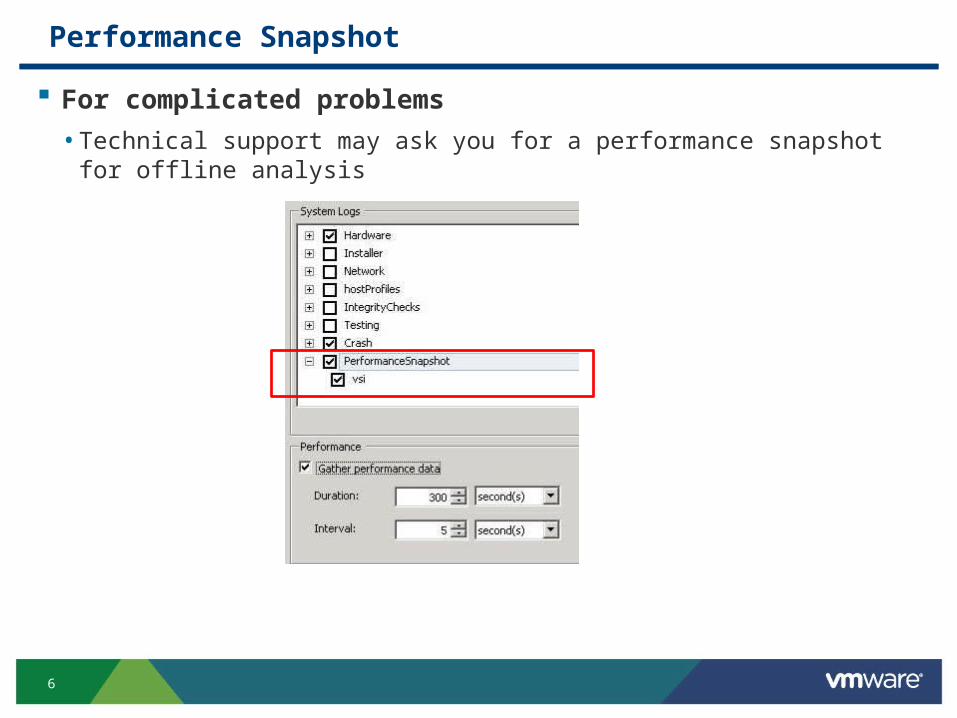
Performance Snapshot
For complicated problems
• Technical support may ask you for a performance snapshot for offline analysis
7
About This Talk
This talk will focus on the esxtop counters using illustrative examples
esxtop manual:
• http://www.vmware.com/pdf/vsphere4/r41/vsp_41_resource_mgmt.pdf
Interpreting esxtop statistics
• http://communities.vmware.com/docs/DOC-11812
Previous vmworld talks:
• VMworld 2008 - http://vmworld.com/docs/DOC-2356
• VMworld 2009 - http://vmworld.com/docs/DOC-3838
• VMworld 2010 - http://www.vmworld.com/docs/DOC-5101
8
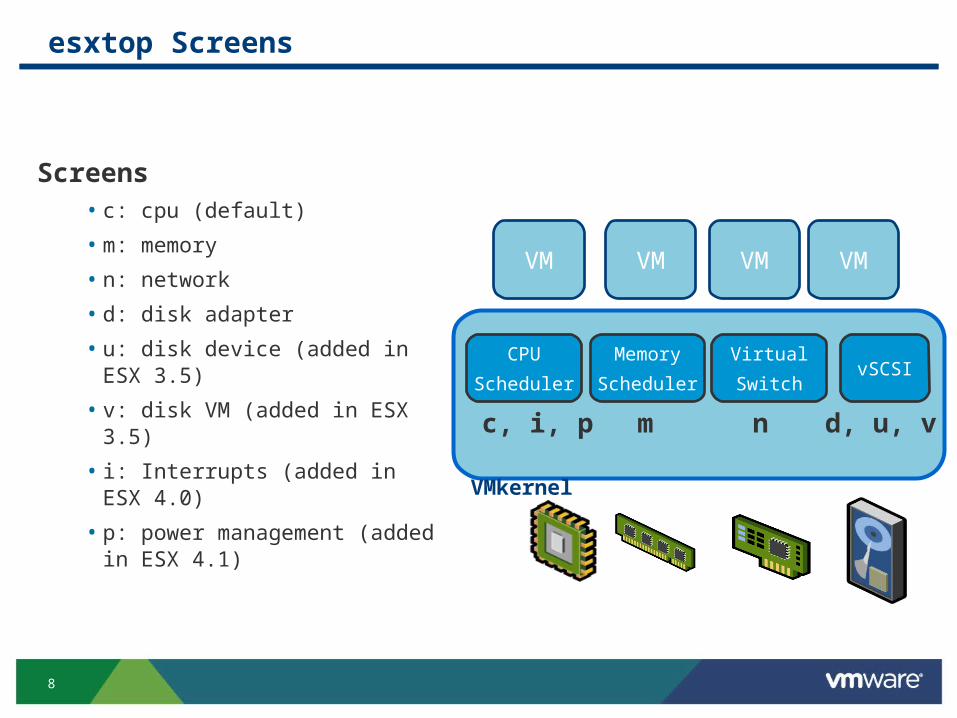
esxtop Screens
Screens• c: cpu (default)
• m: memory
• n: network
• d: disk adapter
• u: disk device (added in ESX 3.5)
• v: disk VM (added in ESX 3.5)
• i: Interrupts (added in ESX 4.0)
• p: power management (added in ESX 4.1) VMkernel
CPU
Scheduler
Memory
Scheduler
Virtual
SwitchvSCSI
c, i, p m d, u, vn
VM VM VMVM
9
New counters in ESX 5.0
10
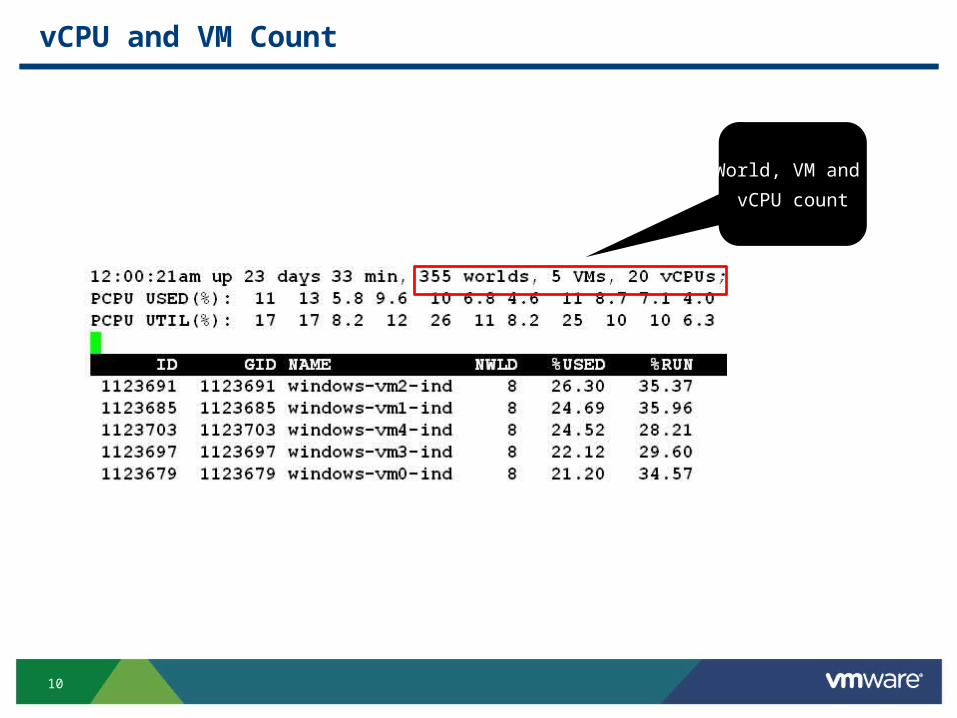
vCPU and VM Count
World, VM and
vCPU count
11
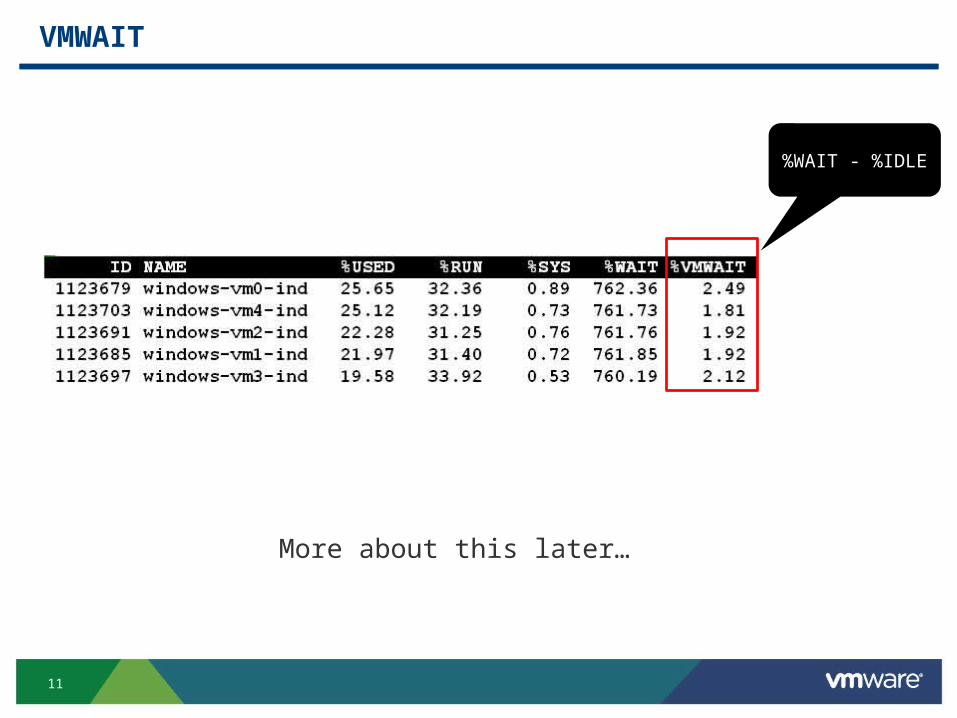
VMWAIT
%WAIT - %IDLE
More about this later…
12
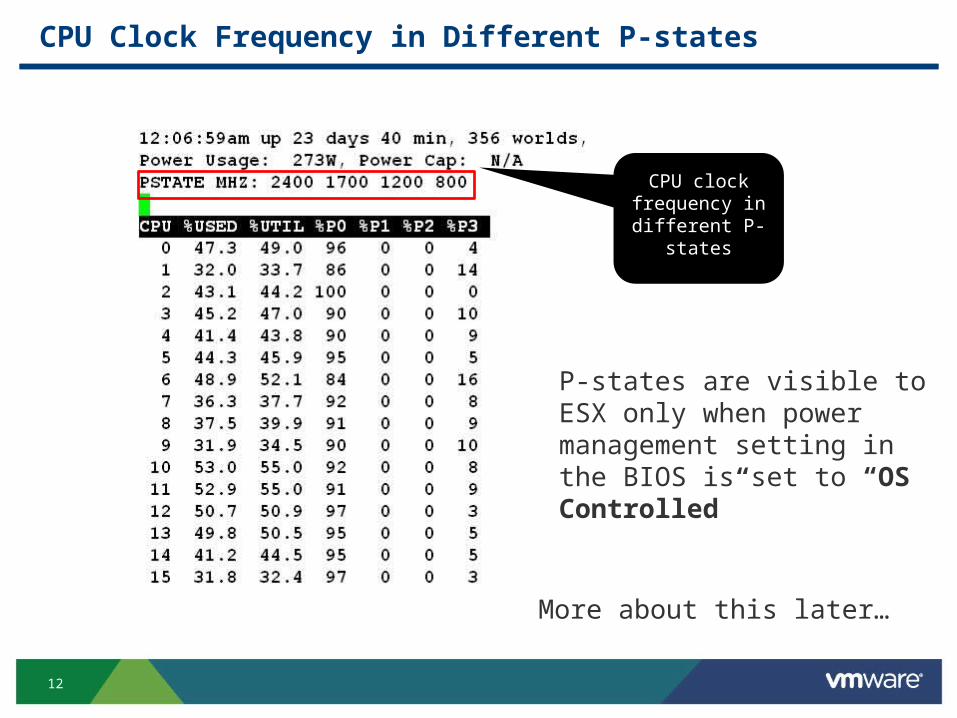
CPU Clock Frequency in Different P-states
CPU clock frequency in
different P-states
P-states are visible to ESX only when power management setting in the BIOS is set to “OS Controlled”
More about this later…
13
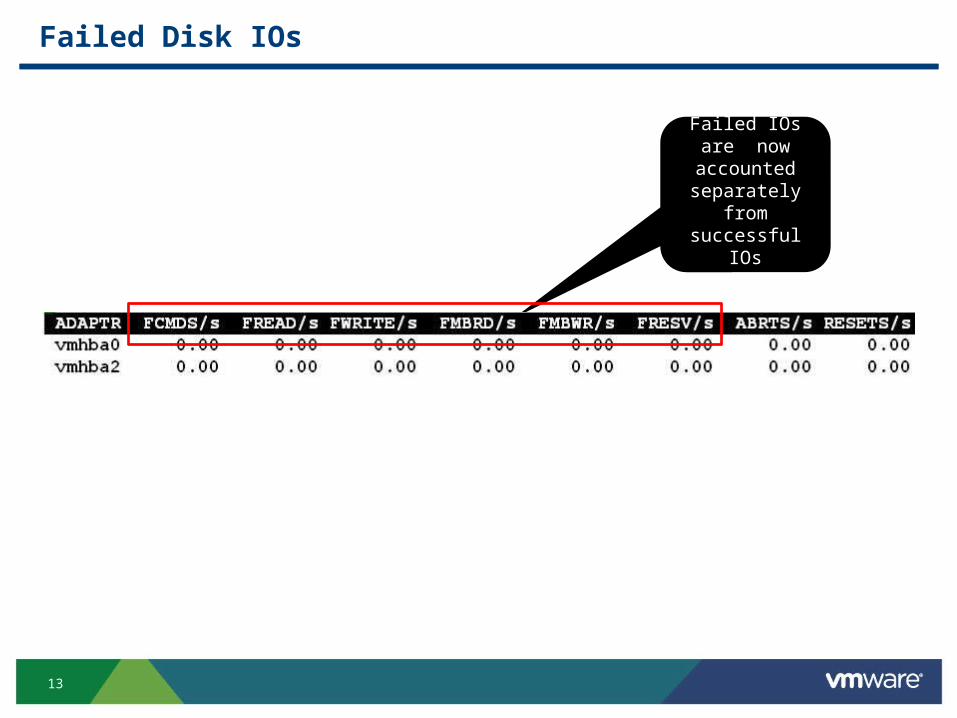
Failed Disk IOs
Failed IOs are now accounted separately from successful IOs
14
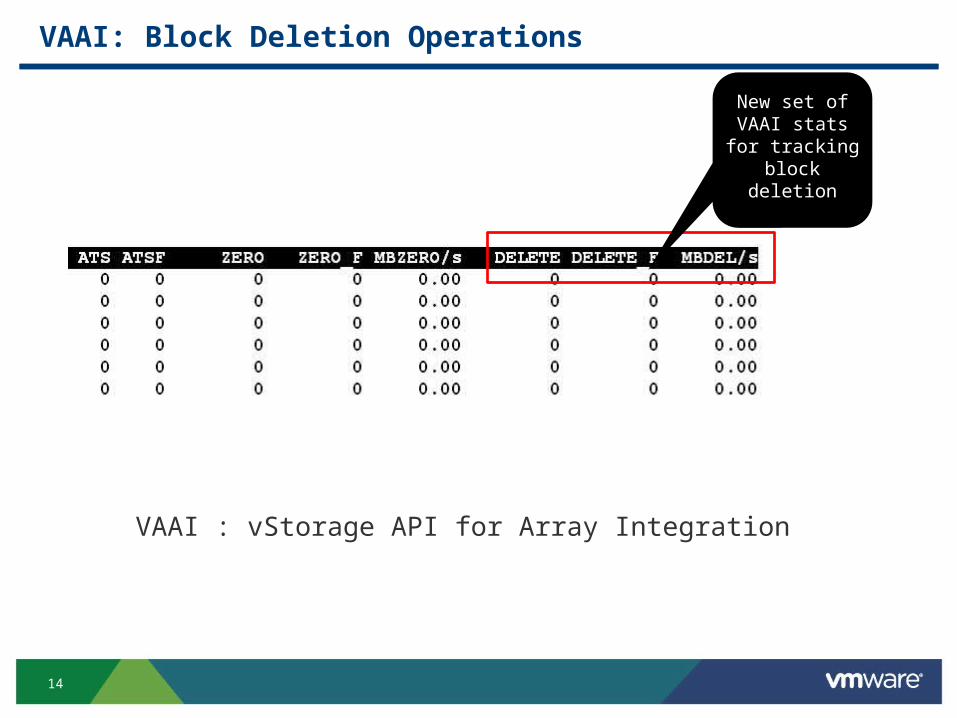
VAAI: Block Deletion Operations
New set of VAAI stats for tracking
block deletion
VAAI : vStorage API for Array Integration
15
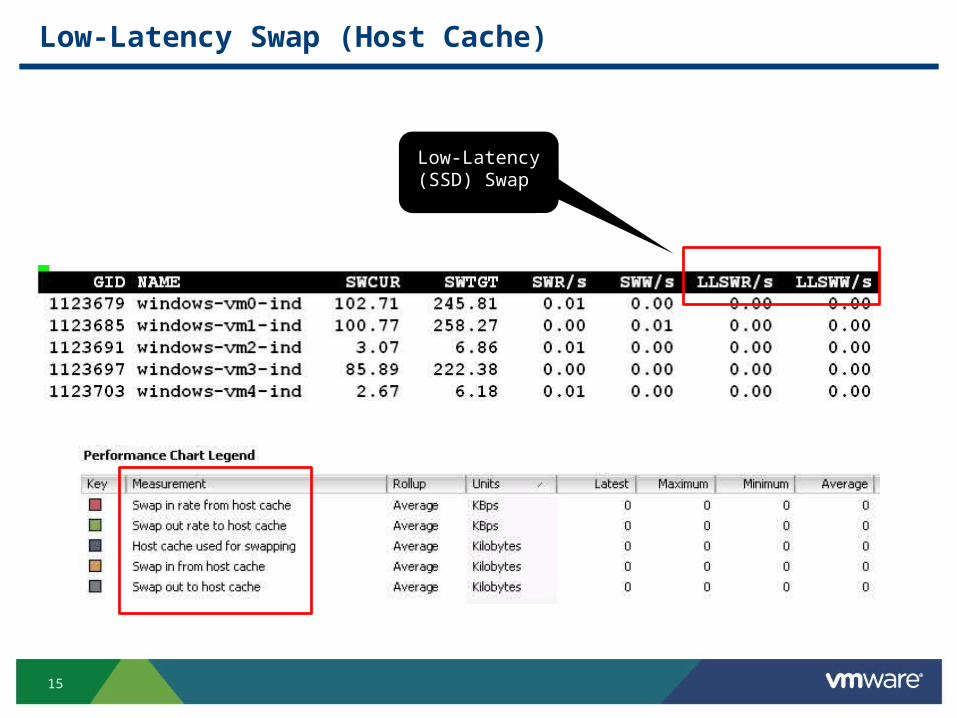
Low-Latency Swap (Host Cache)
Low-Latency (SSD) Swap
16
Understanding CPU counters
17
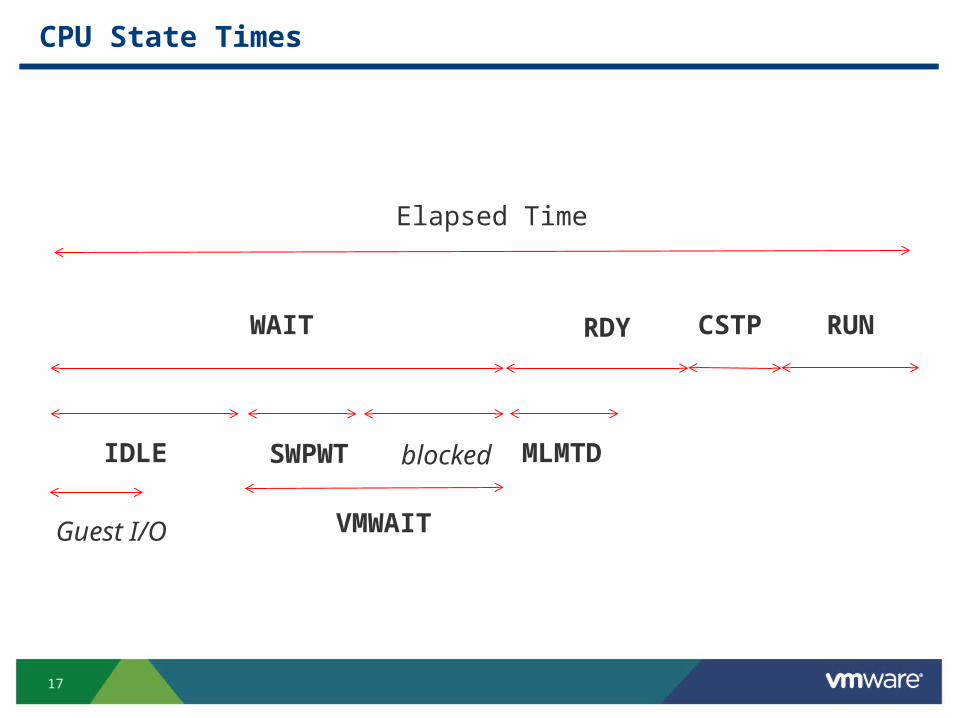
CPU State Times
IDLE
WAIT
SWPWT blocked
VMWAIT
RUNRDY
MLMTD
Elapsed Time
CSTP
Guest I/O
18
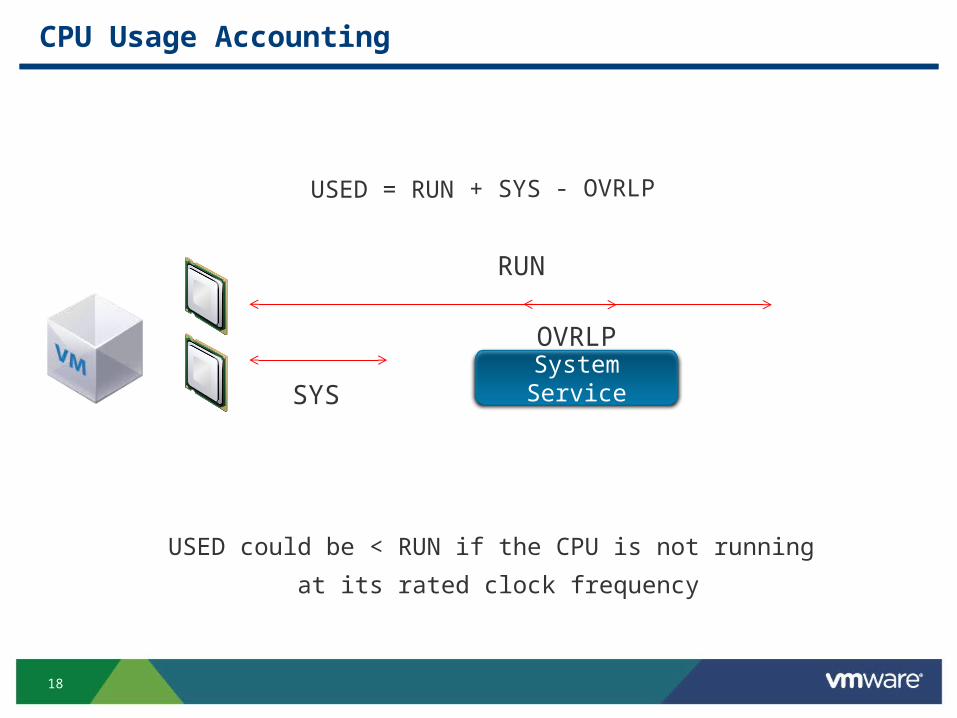
CPU Usage Accounting
USED = RUN
RUN
SYS
OVRLP
System Service
USED could be < RUN if the CPU is not running
at its rated clock frequency
+ SYS - OVRLP
19
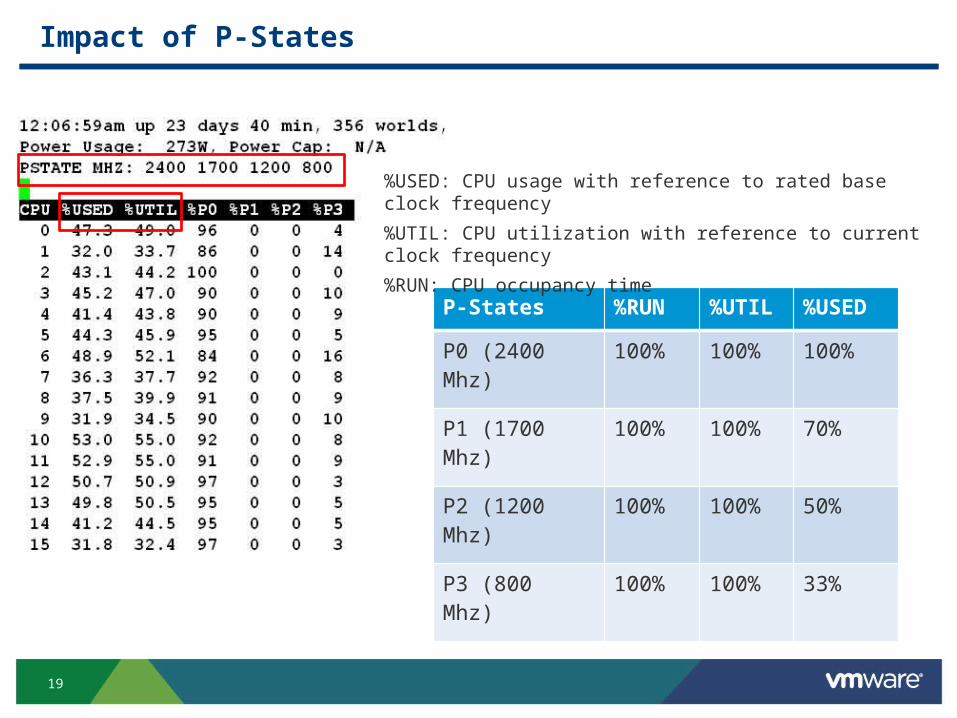
Impact of P-States
P-States %RUN %UTIL %USED
P0 (2400 Mhz) 100% 100% 100%
P1 (1700 Mhz) 100% 100% 70%
P2 (1200 Mhz) 100% 100% 50%
P3 (800 Mhz) 100% 100% 33%
%USED: CPU usage with reference to rated base clock frequency
%UTIL: CPU utilization with reference to current clock frequency
%RUN: CPU occupancy time
20
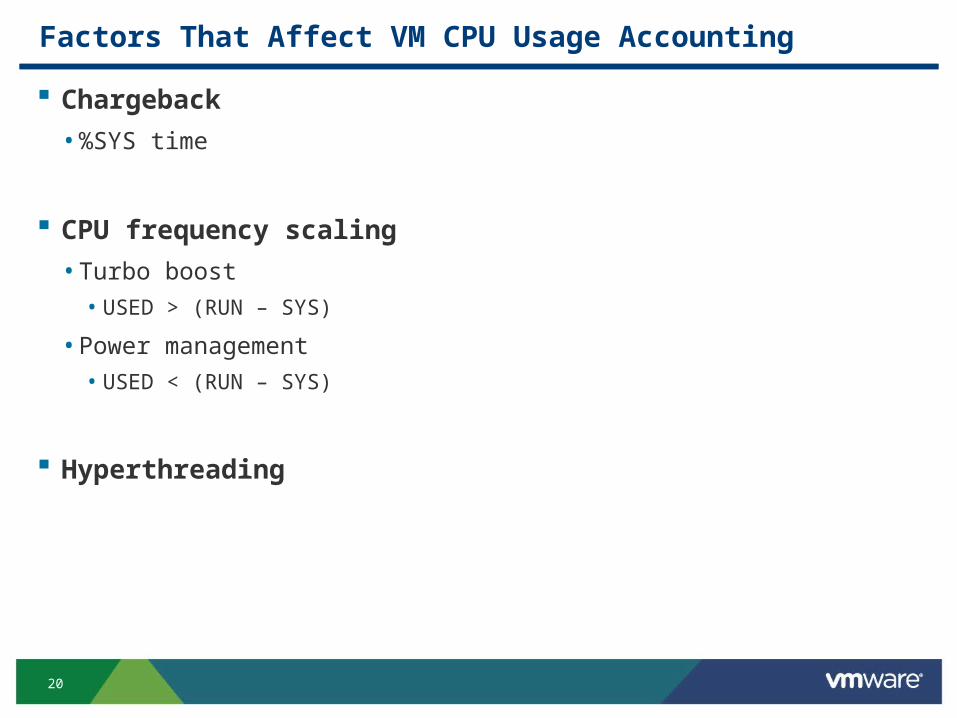
Factors That Affect VM CPU Usage Accounting
Chargeback
• %SYS time
CPU frequency scaling
• Turbo boost
• USED > (RUN – SYS)
• Power management
• USED < (RUN – SYS)
Hyperthreading
21
Poor performance due to power management
22
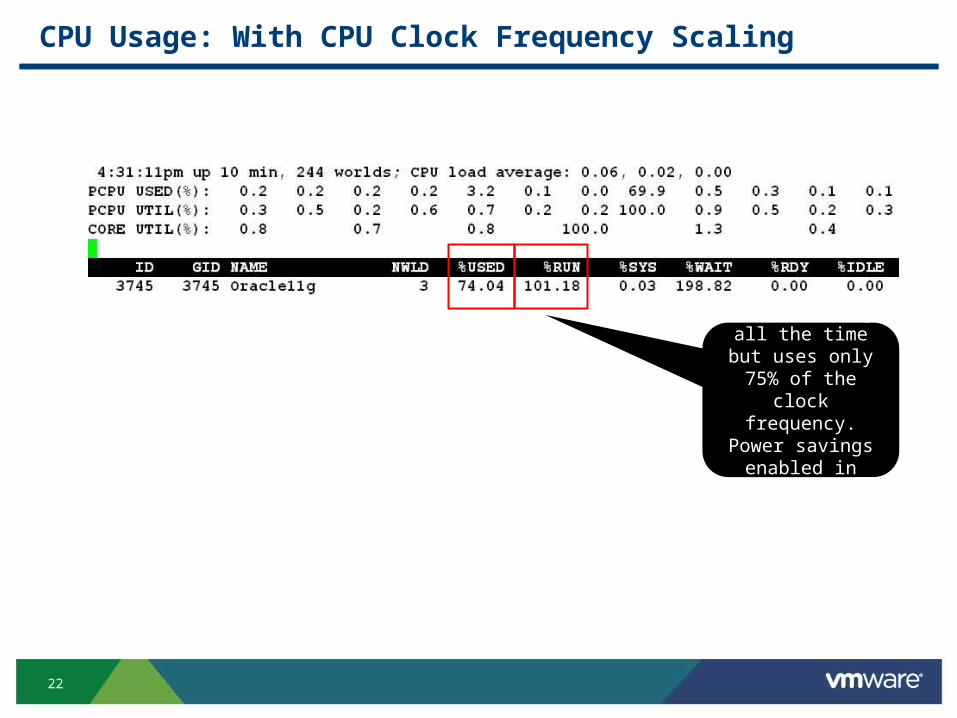
CPU Usage: With CPU Clock Frequency Scaling
VM is running all the time but uses only 75% of the clock frequency. Power savings
enabled in BIOS.
23
Poor performance due to core sharing
24
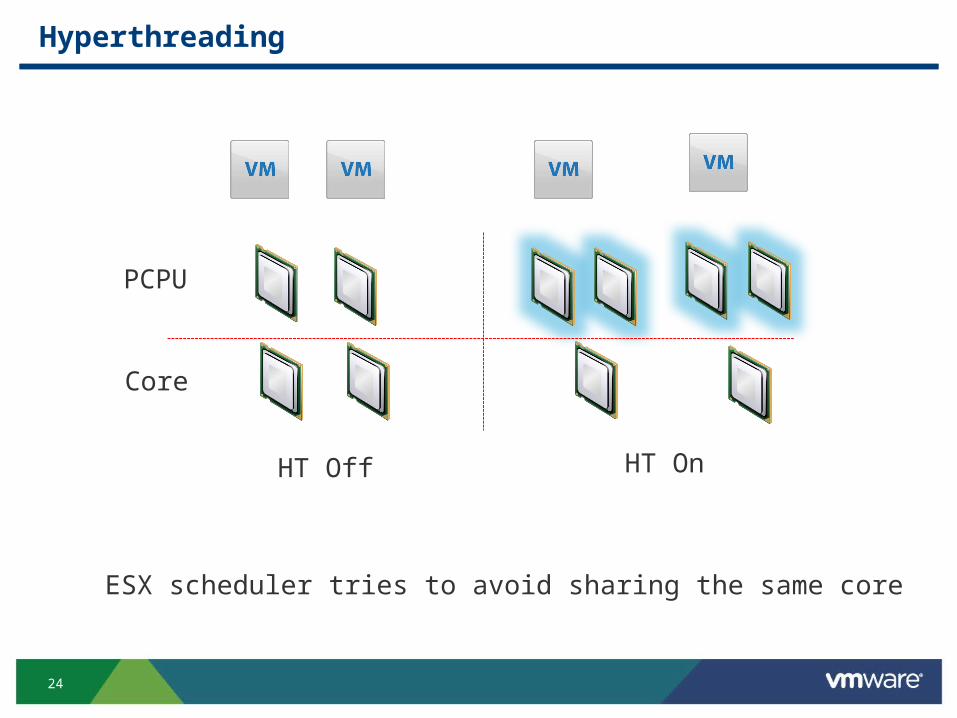
Hyperthreading
PCPU
Core
HT Off HT On
ESX scheduler tries to avoid sharing the same core
25
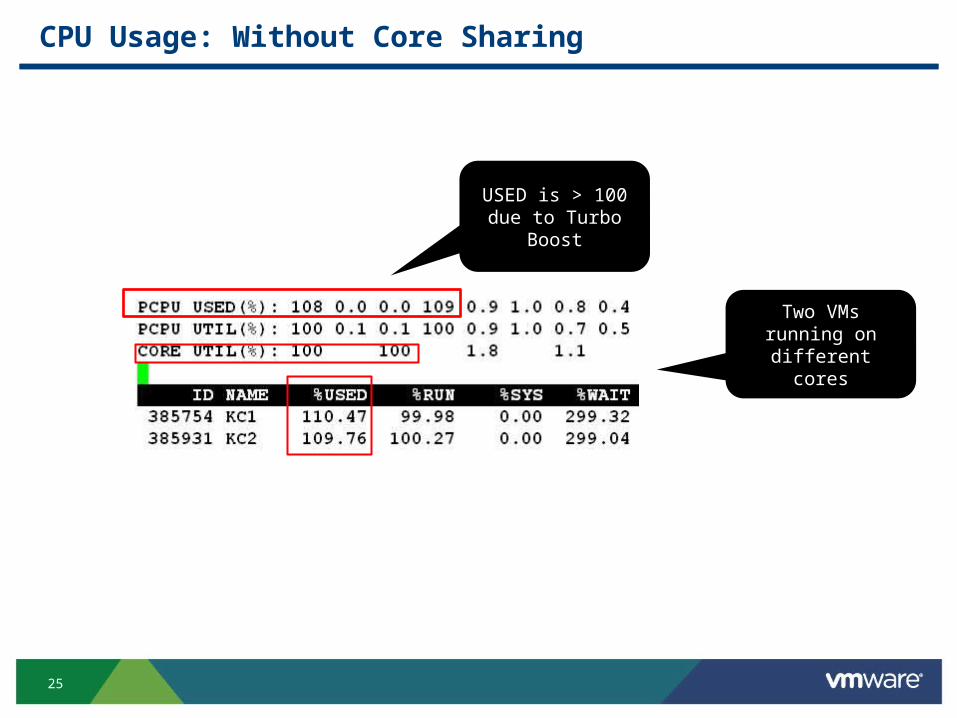
CPU Usage: Without Core Sharing
Two VMs running on different cores
USED is > 100 due to Turbo Boost
26
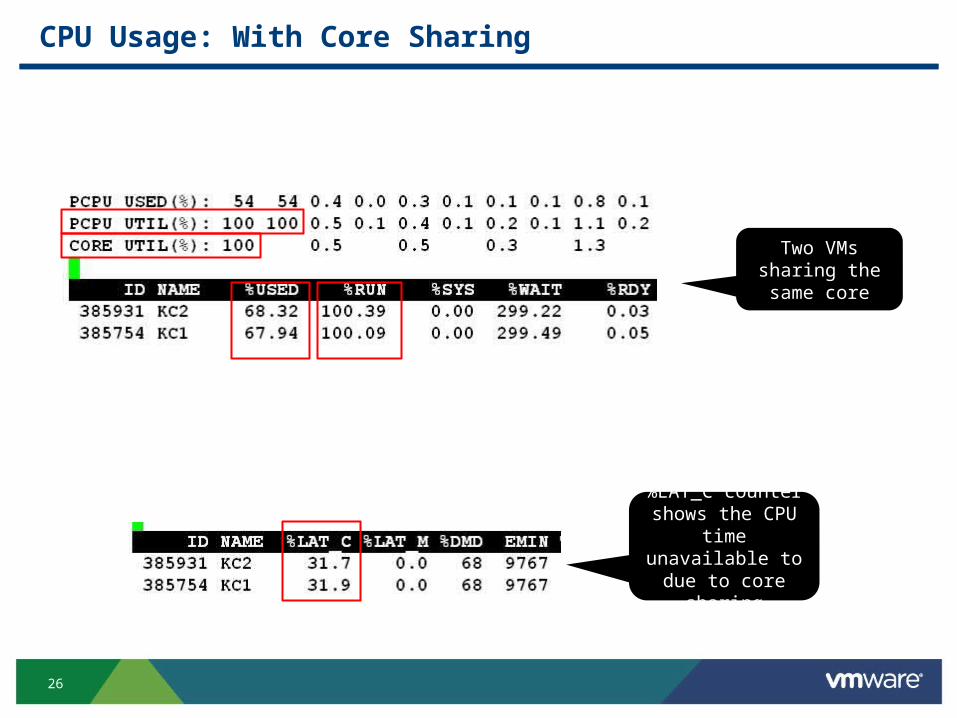
CPU Usage: With Core Sharing
Two VMs sharing the same core
%LAT_C counter shows the CPU
time unavailable to due to core sharing
27
Performance Impact of Swapping
28
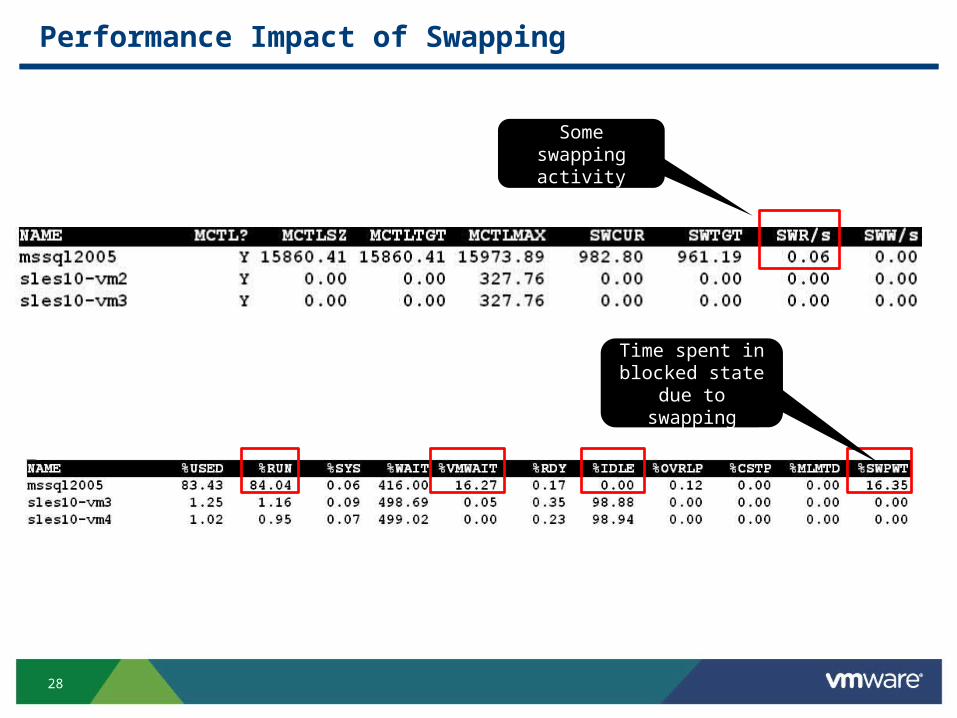
Performance Impact of Swapping
Some swapping activity
Time spent in blocked state due
to swapping
29
How to identify storage connectivity issues
30
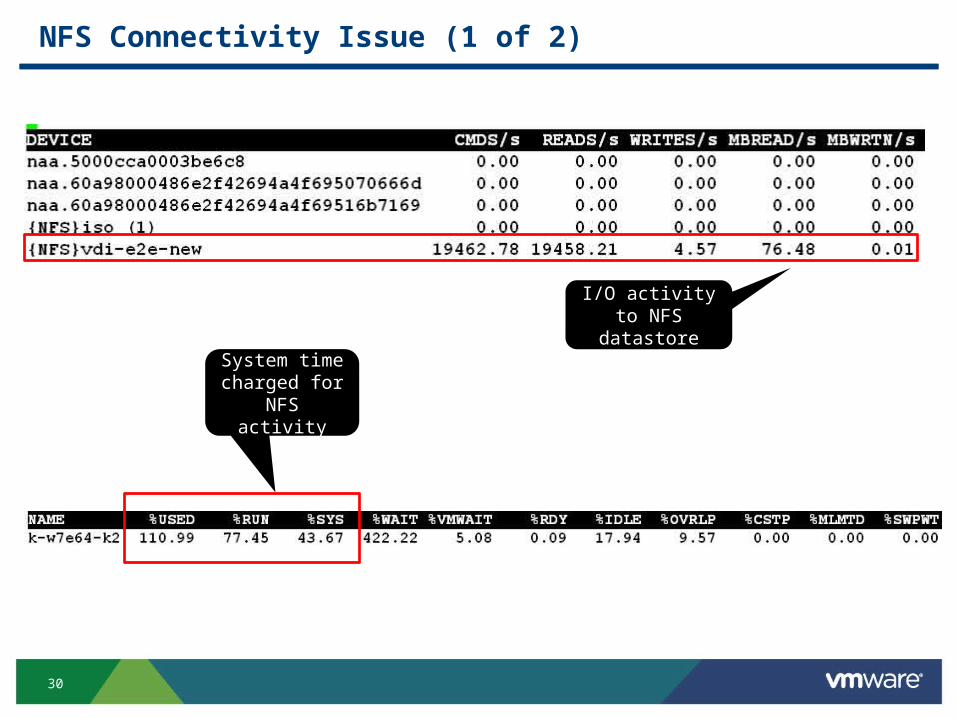
NFS Connectivity Issue (1 of 2)
I/O activity to NFS datastore
System time charged for NFS activity
31
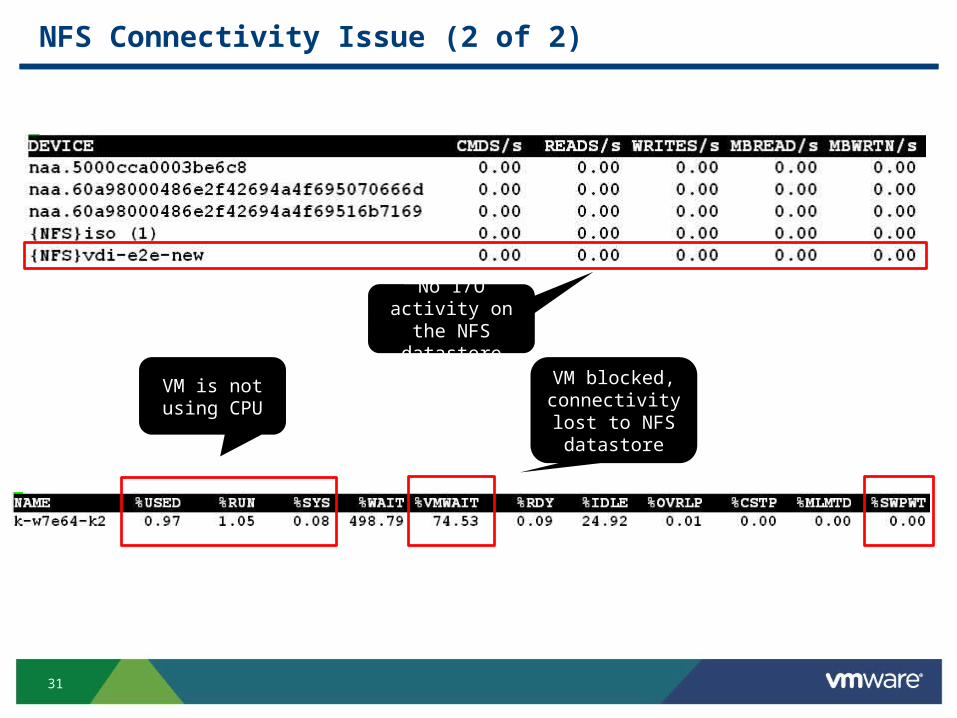
NFS Connectivity Issue (2 of 2)
VM blocked, connectivity lost
to NFS datastore
No I/O activity on the NFS datastore
VM is not using CPU
32
Poor performance during snapshot revert
33
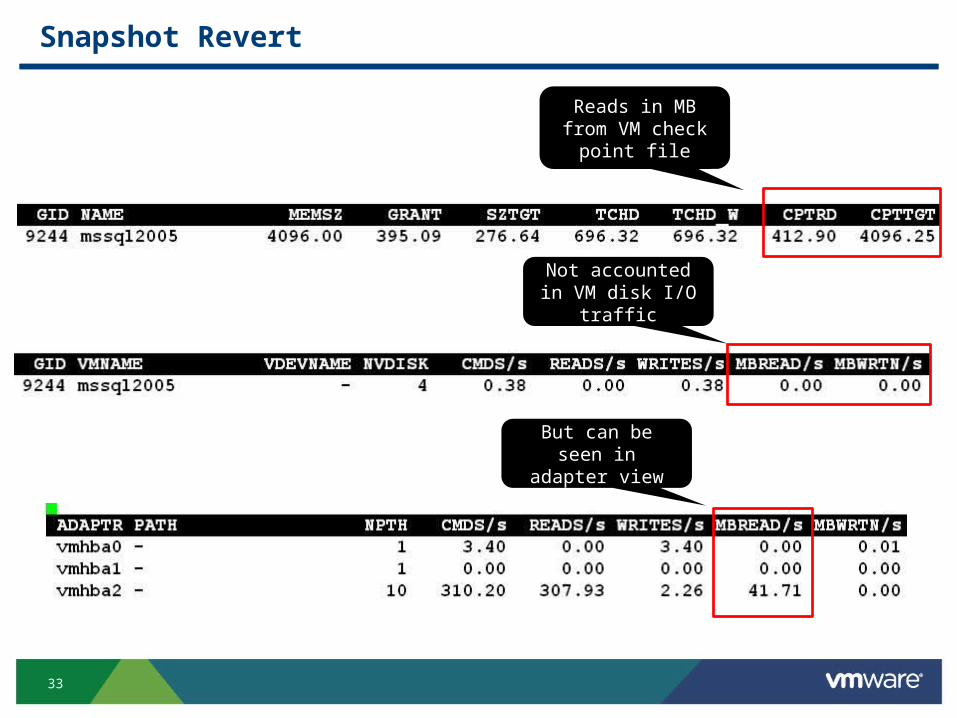
Snapshot Revert
Reads in MB from VM check point file
Not accounted in VM disk I/O traffic
But can be seen in adapter view
34
Wide-NUMA behavior in ESX 5.0
35
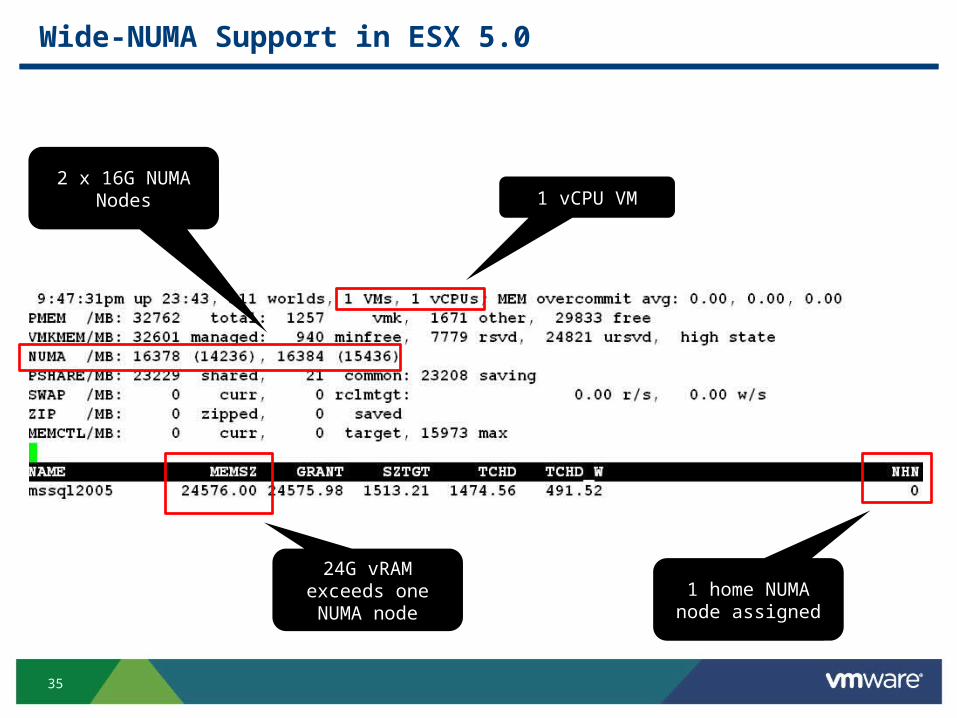
Wide-NUMA Support in ESX 5.0
2 x 16G NUMA Nodes
24G vRAM exceeds one NUMA node
1 home NUMA node assigned
1 vCPU VM
36
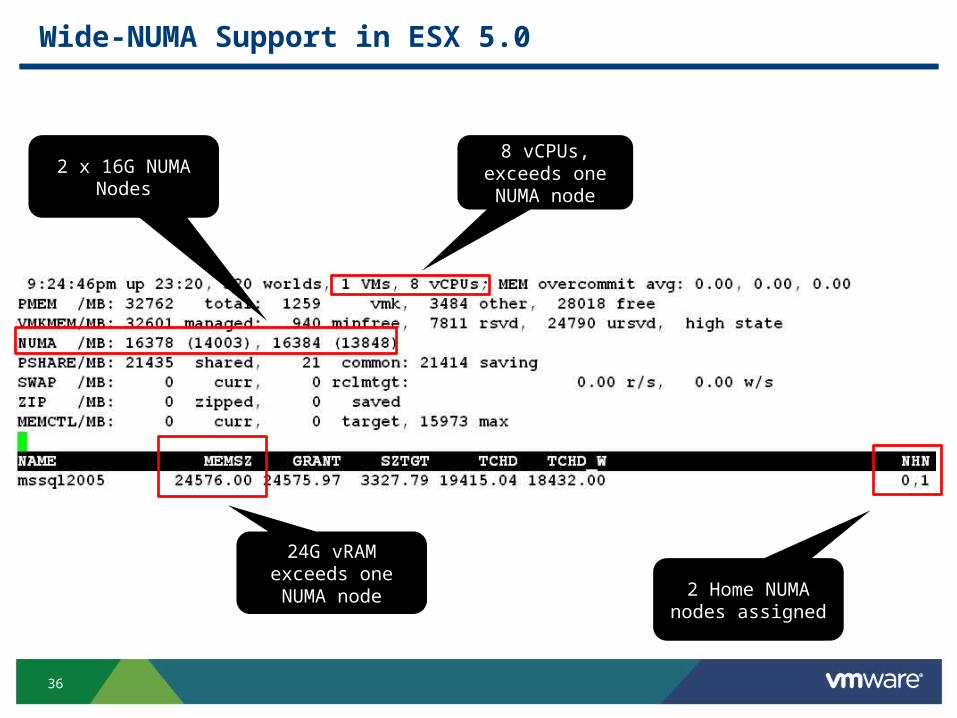
Wide-NUMA Support in ESX 5.0
8 vCPUs, exceeds one NUMA node
2 x 16G NUMA Nodes
24G vRAM exceeds one NUMA node 2 Home NUMA
nodes assigned
37
Network packet drops due to CPU resource issue
38
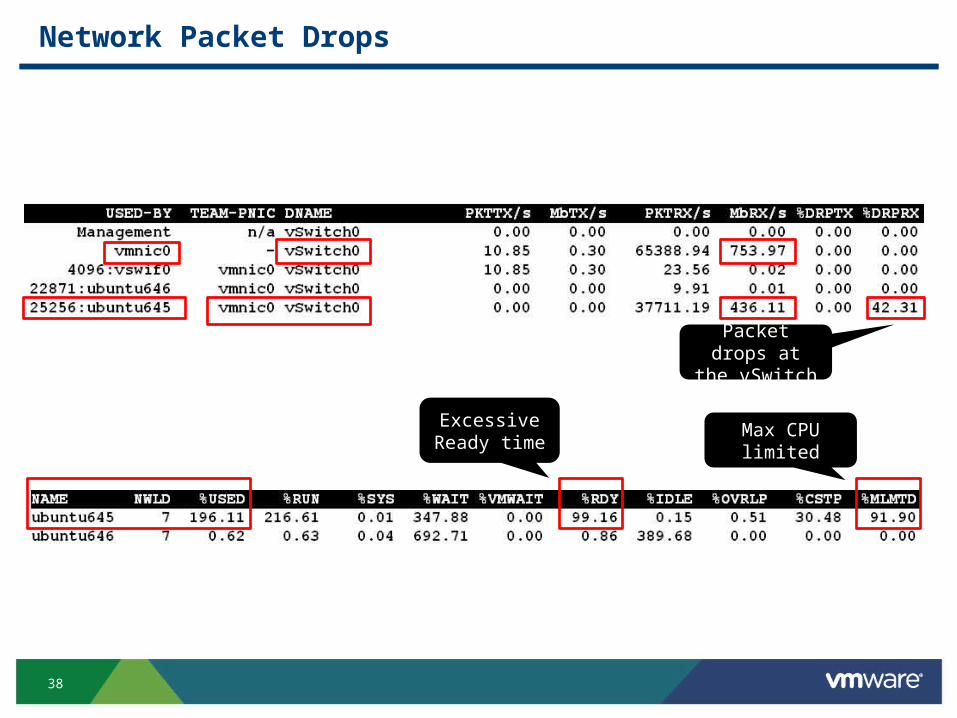
Network Packet Drops
Max CPU limited
Excessive Ready time
Packet drops at the vSwitch
39
Understanding esxtop disk counters
40
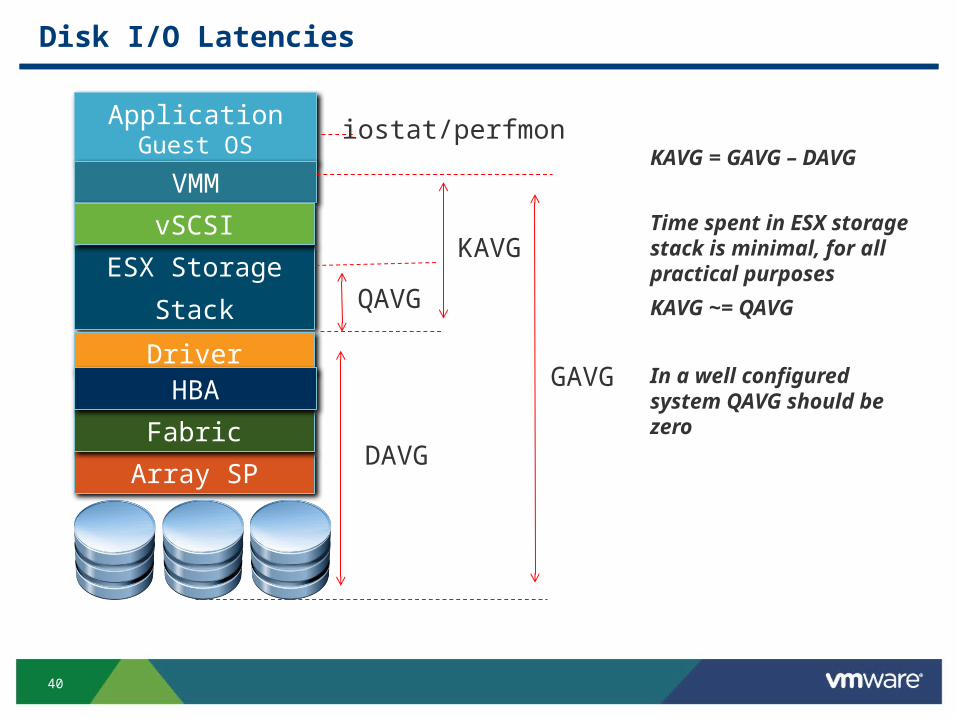
Disk I/O Latencies
ApplicationGuest OS
ESX Storage
Stack
VMM
Driver
KAVG
iostat/perfmon
DAVG
GAVG
QAVG
KAVG = GAVG – DAVG
Array SP
Fabric
vSCSI
HBA
Time spent in ESX storage stack is minimal, for all practical purposes
KAVG ~= QAVG
In a well configured system QAVG should be zero
41
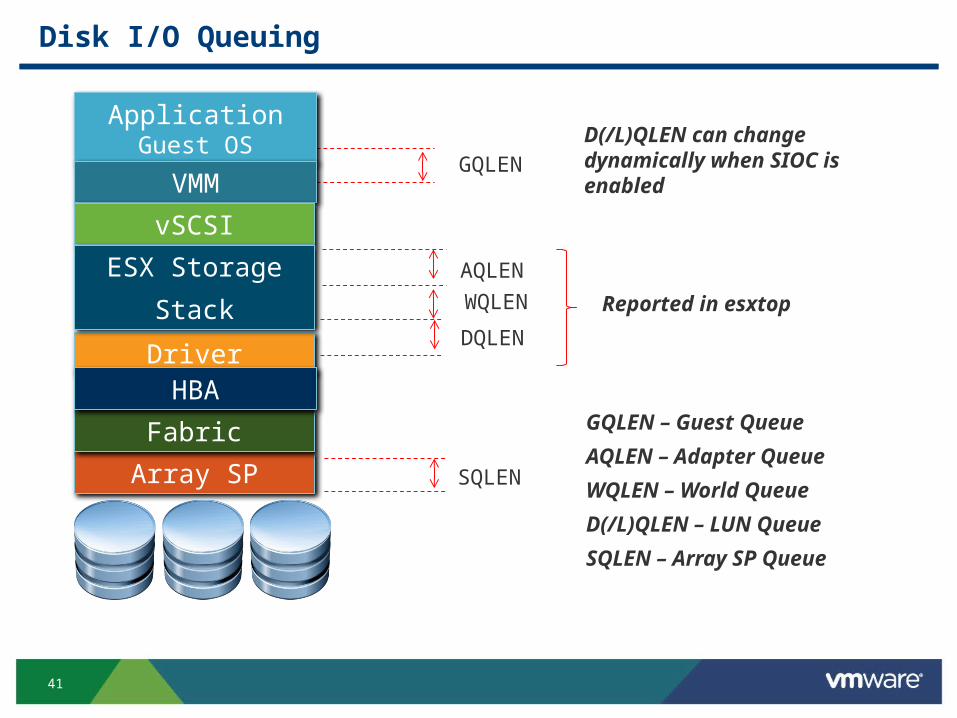
Disk I/O Queuing
GQLEN – Guest Queue
AQLEN – Adapter Queue
WQLEN – World Queue
D(/L)QLEN – LUN Queue
SQLEN – Array SP Queue
DQLEN
AQLEN
SQLEN
GQLEND(/L)QLEN can change dynamically when SIOC is enabled
Reported in esxtop
ApplicationGuest OS
VMM
Driver
Array SP
Fabric
vSCSI
HBA
WQLEN
ESX Storage
Stack
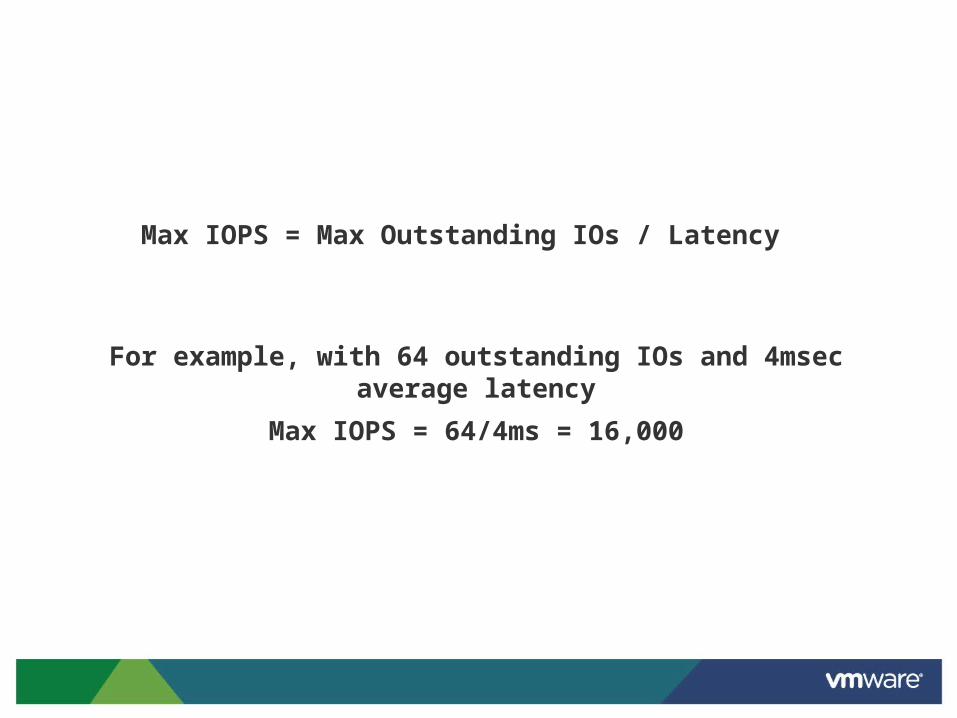
Max IOPS = Max Outstanding IOs / Latency
For example, with 64 outstanding IOs and 4msec average latency
Max IOPS = 64/4ms = 16,000
43
Identifying Queue bottlenecks
44
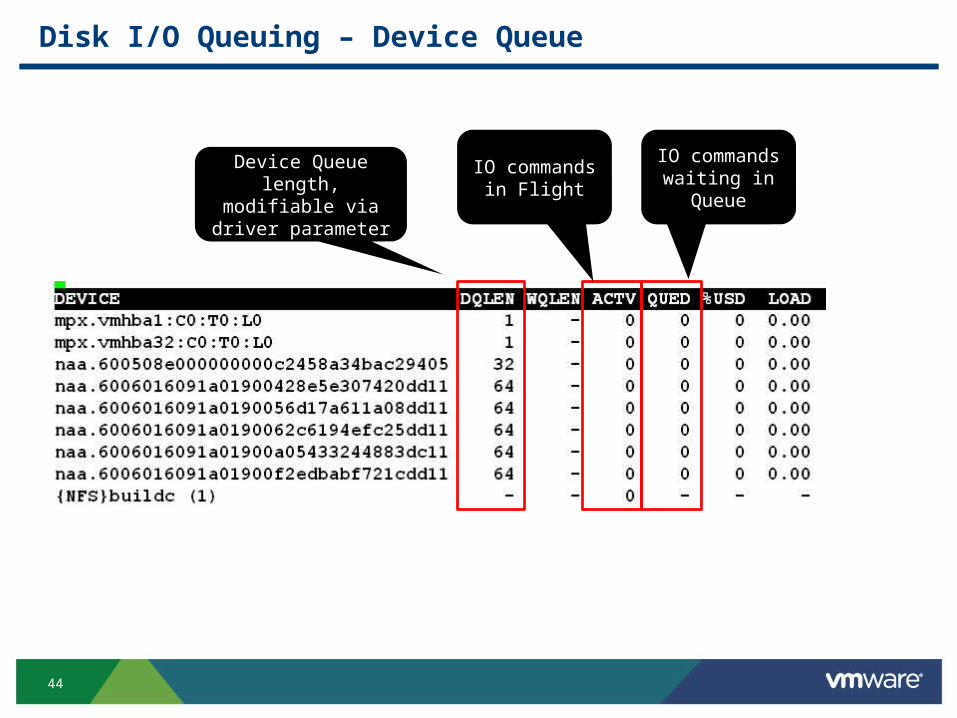
Disk I/O Queuing – Device Queue
Device Queue length, modifiable via driver
parameter
IO commands in Flight
IO commands waiting in
Queue
45
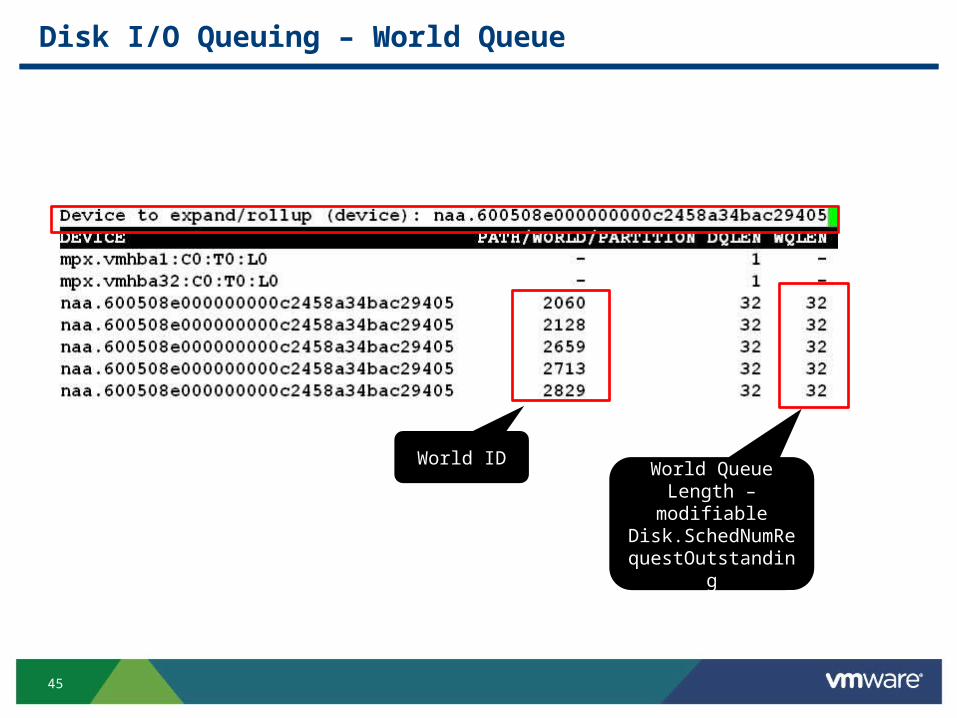
Disk I/O Queuing – World Queue
World ID
World Queue Length – modifiable
Disk.SchedNumRequestOutstanding
46
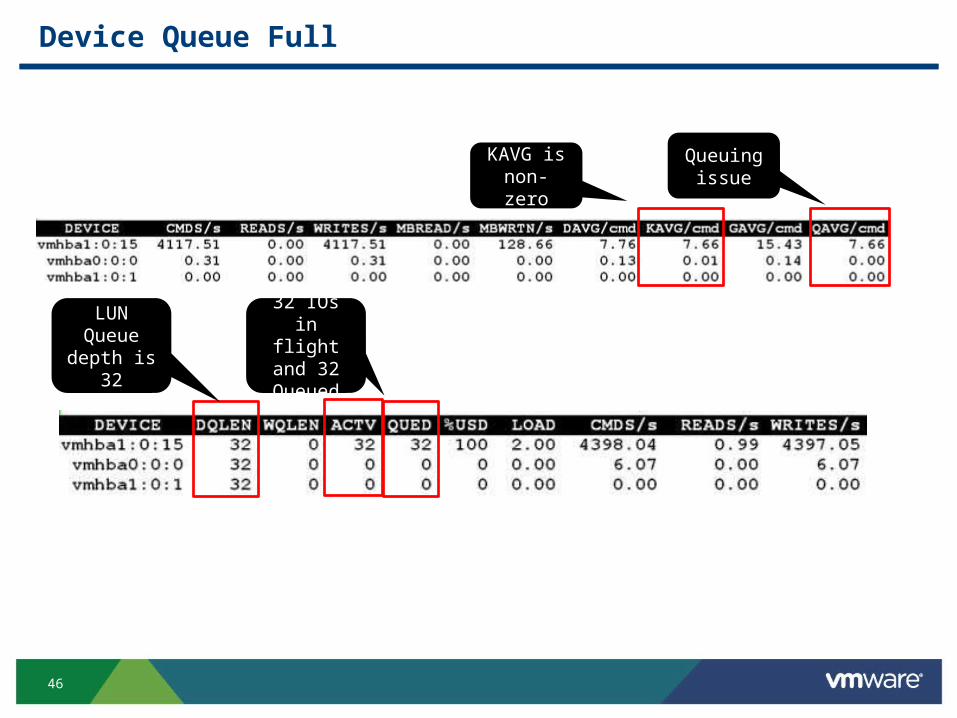
Device Queue Full
KAVG is non-zero
Queuing issue
LUN Queue
depth is 32
32 IOs in flight and
32 Queued
47
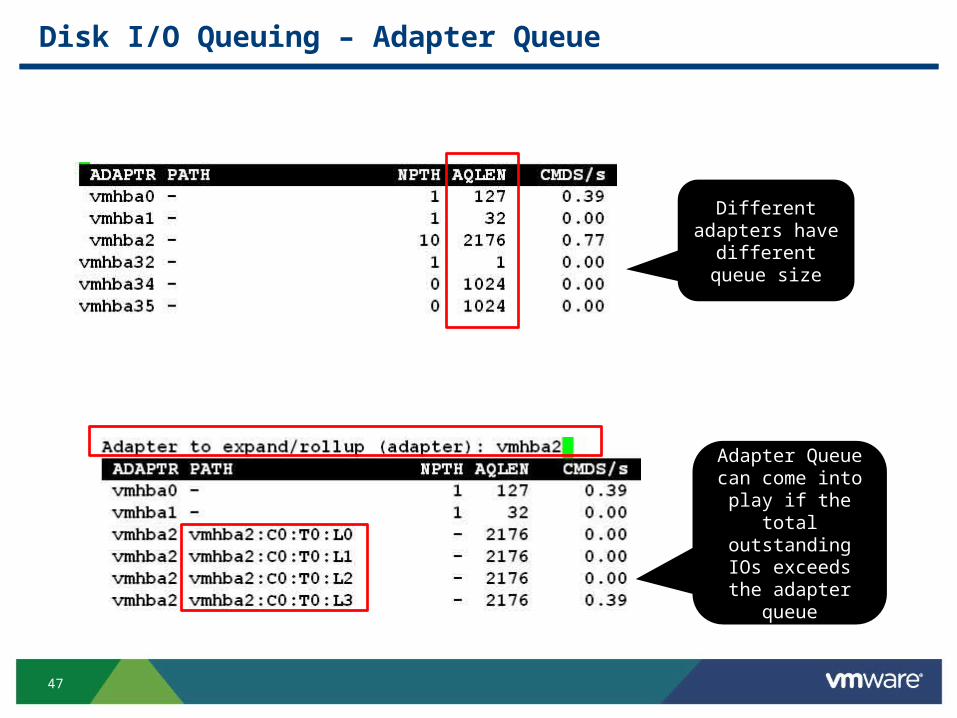
Disk I/O Queuing – Adapter Queue
Different adapters have different queue
size
Adapter Queue can come into play
if the total outstanding IOs
exceeds the adapter queue
48
A few takeaways…
49
Takeaways
esxtop is great for troubleshooting a diverse set of problems
You can do root-cause analysis by co-relating statistics from different screens
Good understanding of the counters is essential for accurate troubleshooting
esxtop is not designed for performance management
There are various other tools for vSphere performance management
50
Thank You!