Embed Size (px)
Citation preview

1
A FINANCIAL A FINANCIAL
COMPARISONCOMPARISON
Vs.
Which Stock to Decide on?
- Samarth Patwardhan - Sachin Mylavarapu
A Financial AnalysisA Financial Analysis

2
A FINANCIAL A FINANCIAL
COMPARISONCOMPARISON
AgendaAgenda
Company Overview Products and Services Recent Developments Financial Analysis Future Plans Conclusion

3
A FINANCIAL A FINANCIAL
COMPARISONCOMPARISON
Company Company OverviewOverview
Intel Corporation Incorporated as NM Electronics on July18th 1968 Introduced first ever Microprocessor in 1971 Went public on October 13th 1971 Sector – Technology, Industry – Semiconductor broad line(b = 2.1) Today – World leader in the manufacturing of microprocessors

4
A FINANCIAL A FINANCIAL
COMPARISONCOMPARISON
CompanyCompany OverviewOverview
Hitachi Corporation 1910 – Started as an Electrical Workshop IPO – 1949 – Tokyo Stock Exchange, April’1982 – New York Stock Exchange Sector – Consumer Goods, Industry – Electronic Equipment (b = 1.04) Today, Hitachi has a broad range of products to offer in the market

5
A FINANCIAL A FINANCIAL
COMPARISONCOMPARISON
Products and Products and ServicesServices
Intel Corporation Classified in four main categories Wide range of products From wireless networking solutions to programmable hardware Focus – Freedom of computing and reduction of infrastructure costs
6
A FINANCIAL A FINANCIAL
COMPARISONCOMPARISON
Products and Products and ServicesServices
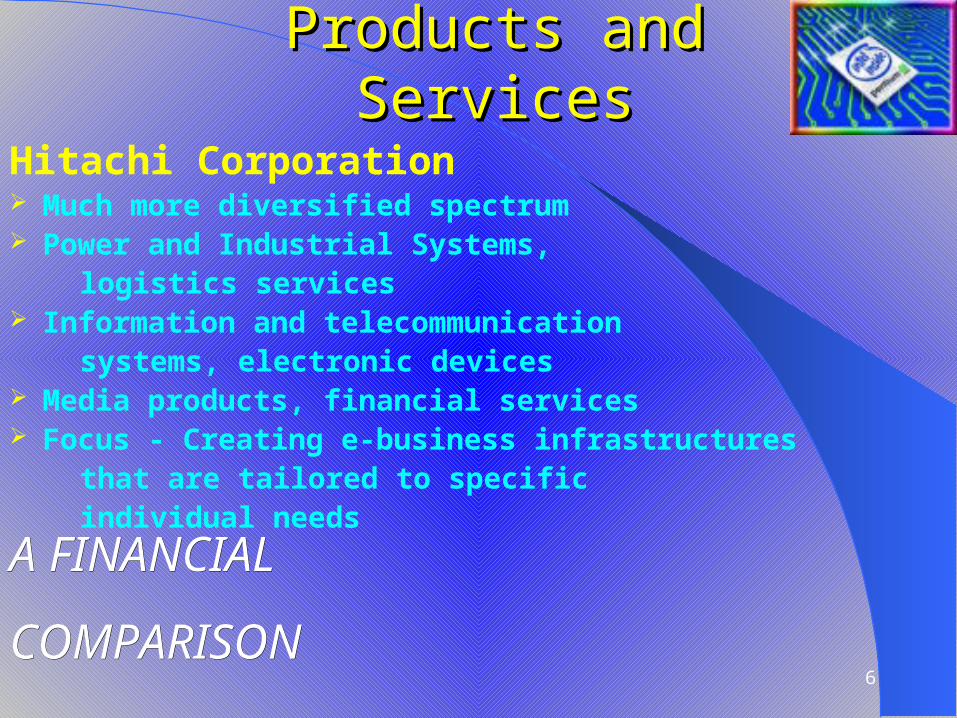
Hitachi Corporation Much more diversified spectrum Power and Industrial Systems, logistics services Information and telecommunication systems, electronic devices Media products, financial services Focus - Creating e-business infrastructures that are tailored to specific individual needs

7
A FINANCIAL A FINANCIAL
COMPARISONCOMPARISON
Recent Recent DevelopmentsDevelopments
Intel corporation In the last 2 years, seven acquisitions to broaden its product portfolio Target the network and Communications markets Shifted more than half of their R&D expenditure to server-related chipsets, microprocessors and platforms

8
A FINANCIAL A FINANCIAL
COMPARISONCOMPARISON
Recent Recent DevelopmentsDevelopments
Hitachi Corporation First half of Fiscal’ 01 – 2% drop in Sales Hit by a 90% price collapse for DRAM chips October’01 – decision to spin off two if its groups Recent reform measures include alliances, JV’s, acquisitions etc.
9
A FINANCIAL A FINANCIAL
COMPARISONCOMPARISON
Financial AnalysisFinancial Analysis
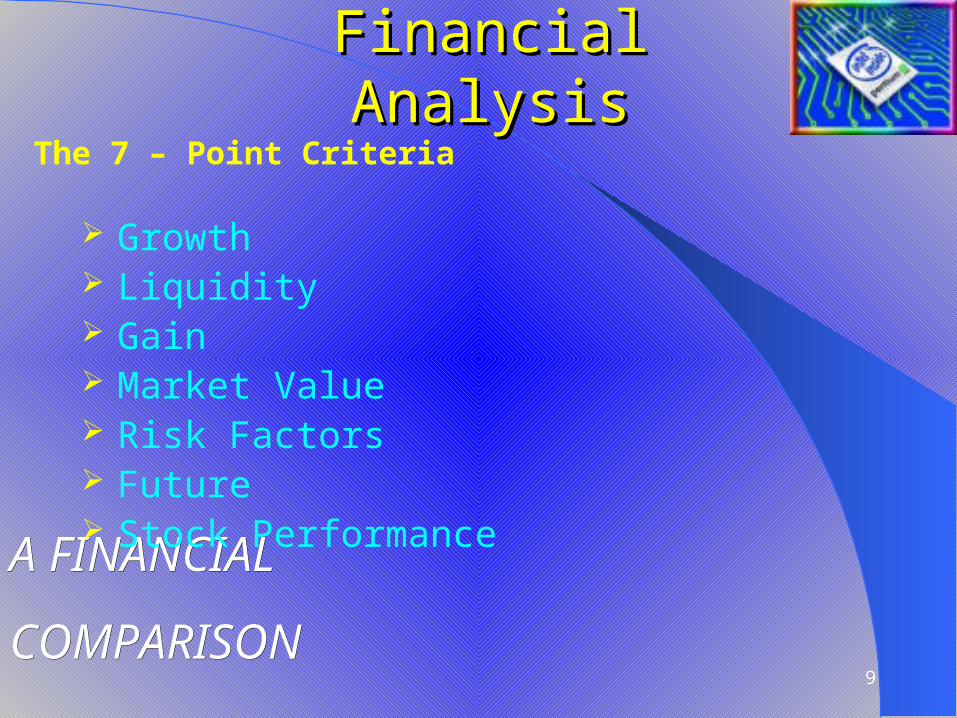
Growth Liquidity Gain Market Value Risk Factors Future Stock Performance
The 7 – Point Criteria

10
A FINANCIAL A FINANCIAL
COMPARISONCOMPARISON
OverviewOverview
0%
5%
10%
15%
20%
25%
30%
35%
Assets as a Percentage of Total Assets
Intel
Hitachi
Excess Inventory
More Accounts receivable
11
A FINANCIAL A FINANCIAL
COMPARISONCOMPARISON
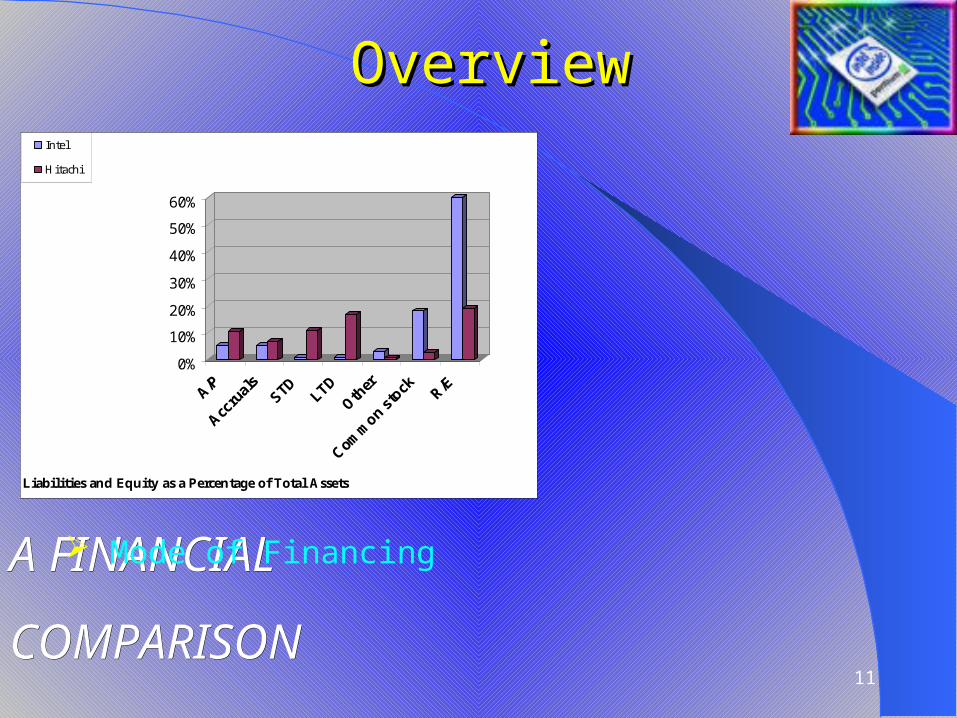
0%
10%
20%
30%
40%
50%
60%
A/P
Accru
als
STD LTDOth
er
Comm
on st
ock R/E
Liabilities and Equity as a Percentage of Total Assets
Intel
Hitachi
OverviewOverview
Mode of Financing

12
A FINANCIAL A FINANCIAL
COMPARISONCOMPARISON
Asset Growth
015000
30000450006000075000
90000105000
1997 1998 1999 2000
Time Span
US
D (
In M
illio
ns)
Intel
Hitachi
Growth In Net Revenues
0
15000
30000
45000
60000
75000
1997 1998 1999 2000
Time Span
US
D (
In M
illio
ns)
Intel
Hitachi
GrowthGrowth

13
A FINANCIAL A FINANCIAL
COMPARISONCOMPARISON
Earnings per Share
-1
-0.5
0
0.5
1
1.5
2
1997 1998 1999 2000
Time span
US
D Intel
Hitachi
Change in Net Income
-3600
-1800
0
1800
3600
5400
7200
9000
10800
12600
1997 1998 1999 2000
Time Span
US
D (
In M
illi
on
s)
Intel
Hitachi
GrowthGrowth

14
A FINANCIAL A FINANCIAL
COMPARISONCOMPARISON
Current Ratio
0
0.5
1
1.5
2
2.5
3
1997 1998 1999 2000
Time Span
Val
ue
Intel
Hitachi
Quick Ratio
0
0.5
1
1.5
2
2.5
1997 1998 1999 2000
Time Span
Val
ue Intel
Hitachi
LiquidityLiquidity

15
A FINANCIAL A FINANCIAL
COMPARISONCOMPARISON
Asset Asset UtilizationUtilization
0
0.5
1
1.5
2
Val
ue
1997 1998 1999 2000
Time Span
Total Asset Turnover Ratio Intel
Hitachi
GainGain

16
A FINANCIAL A FINANCIAL
COMPARISONCOMPARISON
Total Debt/Equity
0
0.2
0.4
0.6
0.8
1
1.2
1.4
1997 1998 1999 2000
Time Span
Val
ue Intel
Hitachi
Hitachi – Uses Debt
Intel – Less use of Debt
Use of leverage
GainGain

17
A FINANCIAL A FINANCIAL
COMPARISONCOMPARISON
Profit Margin
Profit Margin
-10
0
10
20
30
40
1997 1998 1999 2000
Time Span
Valu
e
Intel
HItachi
GainGain
Cost of sales.Money tied up in A/R and inventory
18
A FINANCIAL A FINANCIAL
COMPARISONCOMPARISON
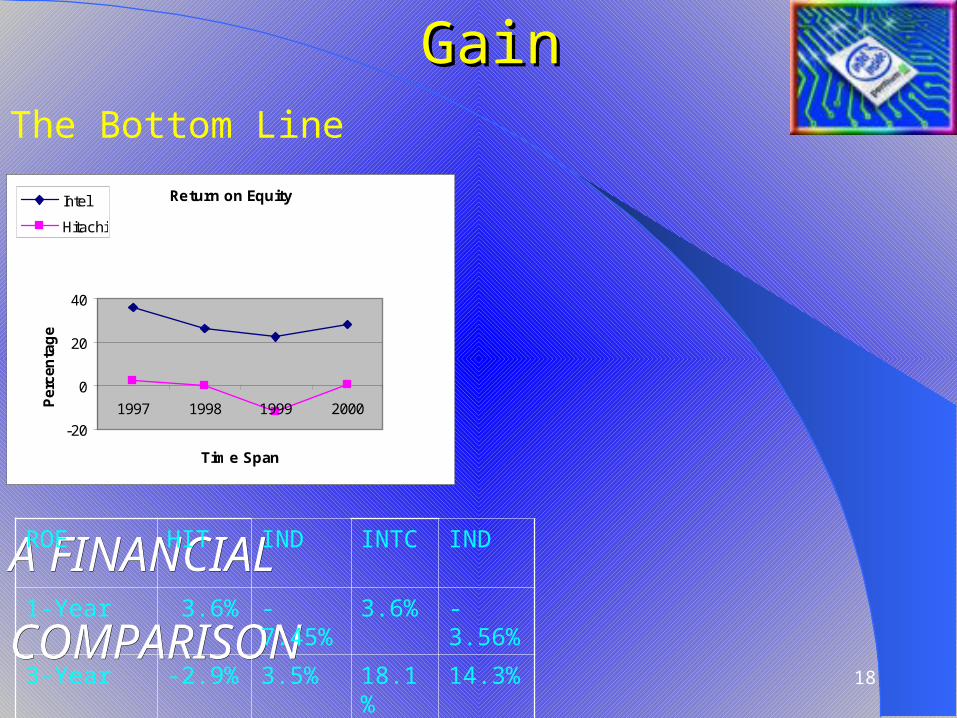
Return on Equity
-20
0
20
40
1997 1998 1999 2000
Time Span
Per
cen
tag
e
Intel
Hitachi
ROE HIT IND INTC IND
1-Year 3.6% -7.45%
3.6% -3.56%
3-Year -2.9% 3.5% 18.1%
14.3%
5-Year -1% 4.2% 23.3%
17.3%
The Bottom Line
GainGain
19
A FINANCIAL A FINANCIAL
COMPARISONCOMPARISON
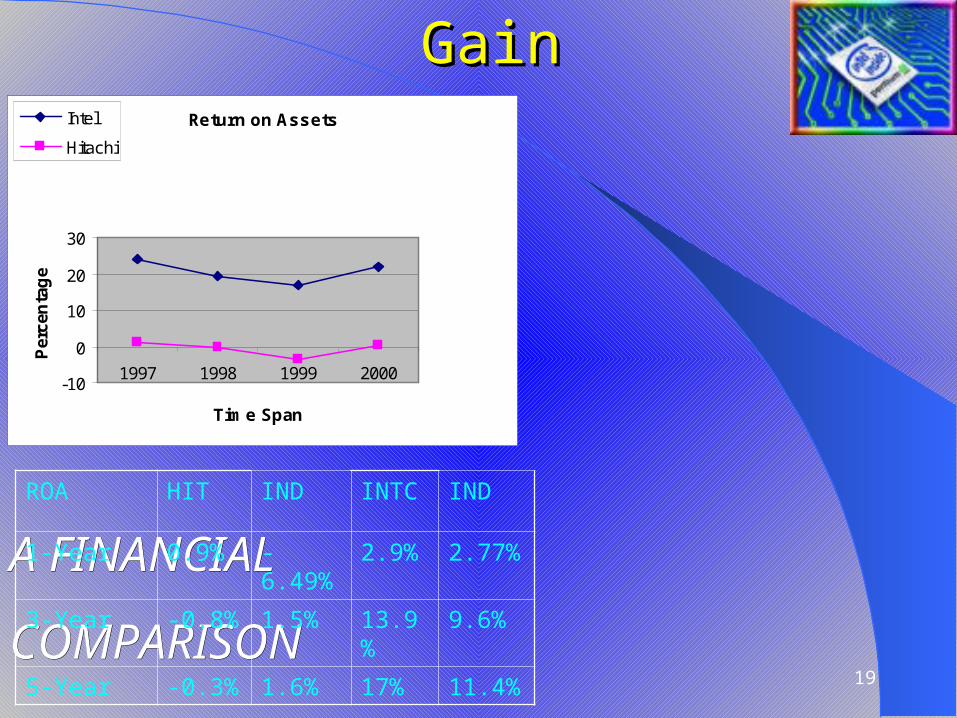
Return on Assets
-10
0
10
20
30
1997 1998 1999 2000
Time Span
Per
cen
tag
e
Intel
Hitachi
ROA HIT IND INTC IND
1-Year 0.9% -6.49%
2.9% 2.77%
3-Year -0.8% 1.5% 13.9%
9.6%
5-Year -0.3% 1.6% 17% 11.4%
GainGain

20
A FINANCIAL A FINANCIAL
COMPARISONCOMPARISON
Price/Earnings Price/Earnings
0
200
400
600
800
1997 1998 1999 2000
Time Span
Valu
e
Intel
Hitachi
Market ValueMarket Value
HIT IND INTC IND
P/E 36.4
89.87
165.5
147.26

22
A FINANCIAL A FINANCIAL
COMPARISONCOMPARISON
Future PlansFuture Plans
Intel corporation Market share for processors – increase from 20% to 69% by ‘03 Fiber optics industry Hyper-Threading technology CEO – “In the future, all computers will communicate and all communication devices will compute.”
23
A FINANCIAL A FINANCIAL
COMPARISONCOMPARISON
Future PlansFuture Plans
Hitachi Corporation April’2001 - The Corporate Innovation Innovative (CII) Reduce material purchasing costs by 20% Inventory and A/R by 25% Aim at doubling the sales from Fiscal 2000 to Fiscal 2002

24
A FINANCIAL A FINANCIAL
COMPARISONCOMPARISON
3 – Month Performance
StockStock PerformancePerformance
25
A FINANCIAL A FINANCIAL
COMPARISONCOMPARISON
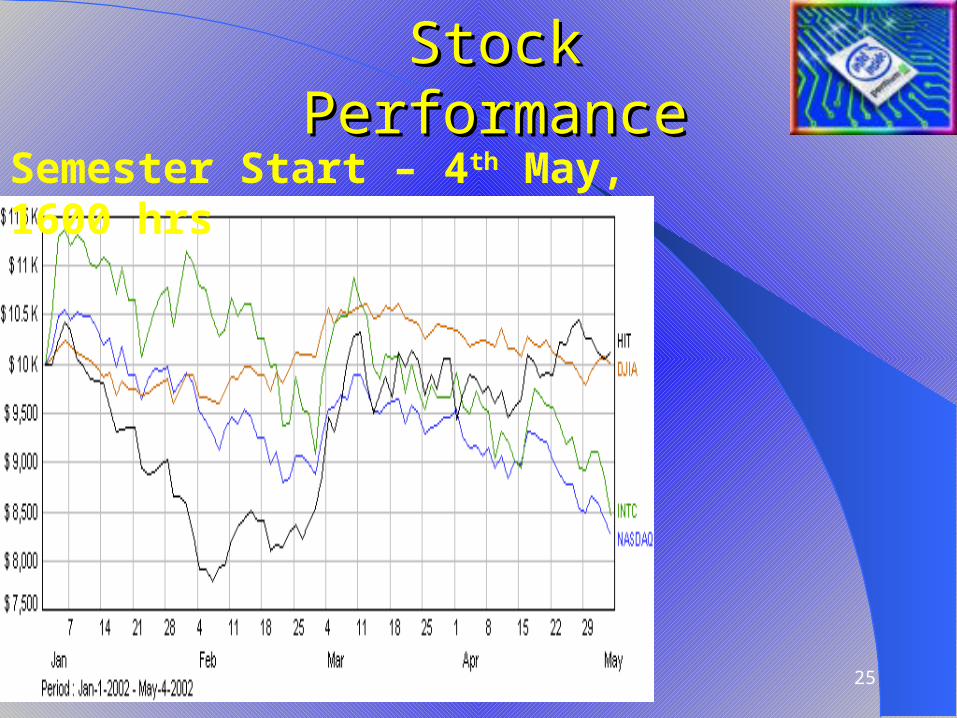
Semester Start – 4th May, 1600 hrs
StockStock PerformancePerformance
26
A FINANCIAL A FINANCIAL
COMPARISONCOMPARISON
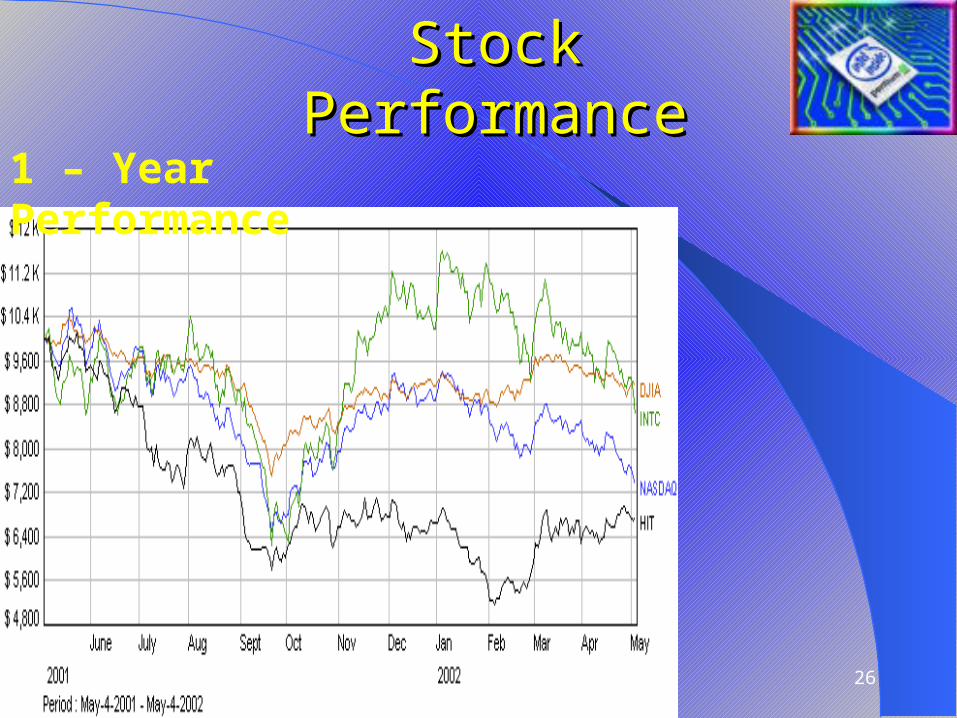
1 – Year Performance
StockStock PerformancePerformance

27
A FINANCIAL A FINANCIAL
COMPARISONCOMPARISON
5 – Year Performance
StockStock PerformancePerformance

28
A FINANCIAL A FINANCIAL
COMPARISONCOMPARISON
SummarySummaryParameters
HIT INTC
Growth 3 3Liquidity 2 3Gain 3 4Market Value
2 4
Risk Factors 3 3Future 4 4Stock Performance
3 3
Average 2.85 3.42

29
A FINANCIAL A FINANCIAL
COMPARISONCOMPARISON
What to Do?What to Do?
Look beyond numbers See as an opportunity to
buy low If you already have it,
hold it Good for long term
investment
30
A FINANCIAL A FINANCIAL
COMPARISONCOMPARISON
Risk is the Name of the Risk is the Name of the Game!Game!
Are You Willing to Take it?

31
A FINANCIAL A FINANCIAL
COMPARISONCOMPARISON