Embed Size (px)
Citation preview
vRealize Operations Manager UserGuide
vRealize Operations Manager 6.0.1
This document supports the version of each product listed andsupports all subsequent versions until the document isreplaced by a new edition. To check for more recent editionsof this document, see http://www.vmware.com/support/pubs.
EN-001600-01
vRealize Operations Manager User Guide
2 VMware, Inc.
You can find the most up-to-date technical documentation on the VMware Web site at:
http://www.vmware.com/support/
The VMware Web site also provides the latest product updates.
If you have comments about this documentation, submit your feedback to:
Copyright © 2015 VMware, Inc. All rights reserved. Copyright and trademark information.
VMware, Inc.3401 Hillview Ave.Palo Alto, CA 94304www.vmware.com
Contents
Updated Information 5
About This User Guide 7
1 Monitoring Objects in Your Managed Environment by Using
vRealize Operations Manager 9What to Do When... 9Monitoring and Responding to Alerts 34Monitoring and Responding to Problems 38Running Actions from vRealize Operations Manager 69Monitoring Objects in Your Storage Topology 82Viewing Your Inventory 86
2 Planning the Resources for Your Managed Environment by Using
vRealize Operations Manager 87User Scenario: Check the Impact of Future Capacity Needs 88Compare the Results of Projects 90Combine the Results of Projects 91Check the Details of an Existing Project 91Delete a Project or a Scenario 91Creating Hardware Projects 92Creating Virtual Machine Projects 93
Index 97
VMware, Inc. 3

vRealize Operations Manager User Guide
4 VMware, Inc.
Updated Information
This vRealize Operations Manager User Guide is updated with each release of the product or when necessary.
This table provides the update history of the vRealize Operations Manager User Guide .
Revision Description
EN-001600-01 n Added support for vRealize Operations Manager 6.0.1.
EN-001600-00 Initial release.
VMware, Inc. 5

vRealize Operations Manager User Guide
6 VMware, Inc.
About This User Guide
The VMware® vRealize Operations Manager User Guide describes what to do when users experienceperformance problems in your managed environment.
As a system administrator, you might become aware of a problem with an object in your environment whenvRealize Operations Manager generates an alert, or when a user contacts you. To help ensure optimalperformance, this information describes how you use vRealize Operations Manager to monitor,troubleshoot, and take action to address problems. It also provides information on how to assess whetherproblems due to over demand or lack of capacity require a system change or upgrade.
Intended AudienceThis information is intended for vRealize Operations Manager administrators, virtual infrastructureadministrators, and operations engineers who track and maintain object performance in your managedenvironment.
VMware Technical Publications GlossaryVMware Technical Publications provides a glossary of terms that might be unfamiliar to you. For definitionsof terms as they are used in VMware technical documentation, go to http://www.vmware.com/support/pubs.
VMware, Inc. 7

vRealize Operations Manager User Guide
8 VMware, Inc.
Monitoring Objects in Your ManagedEnvironment by UsingvRealize Operations Manager 1
You can use vRealize Operations Manager to resolve problems that your customers raise, respond to alertsthat identify problems before your customers report problems, and generally monitor your environment forproblems.
When your customers experience performance problems and call you to resolve the problem, the data thatvRealize Operations Manager collects and analyzes is presented to you in graphical forms so that you cancompare and contrast objects, understand the relationship between objects, and determine the root cause ofproblems.
To manage your environment as a proactive rather than reactive administrator, you monitor and respond toalerts. A generated alert notifies you when objects in your environment are experiencing problems. If youresolve the problem based on the alert before your customers notice, then you avoid service interruptions.
You can investigate the problems that generate alerts or that result in calls by using the Analysis,Troubleshooting, Details, and Environment tabs.
If you find the root cause of the problem, you might be able to resolve the problem by running an action.The actions make changes to objects in the target system, for example, vCenter Server, fromvRealize Operations Manager.
This chapter includes the following topics:
n “What to Do When...,” on page 9
n “Monitoring and Responding to Alerts,” on page 34
n “Monitoring and Responding to Problems,” on page 38
n “Running Actions from vRealize Operations Manager,” on page 69
n “Monitoring Objects in Your Storage Topology,” on page 82
n “Viewing Your Inventory,” on page 86
What to Do When...As a virtual infrastructure administrator, network operations center engineer, or other IT professional, youuse vRealize Operations Manager to monitor objects in your environment so that you can ensure service toyour customers and resolve any problems that occur.
Your vRealize Operations Manager administrator has configured vRealize Operations Manager to managetwo vCenter Server instances that manage multiple hosts and virtual machines. It is your first day usingvRealize Operations Manager to manage your environment.
VMware, Inc. 9
n User Scenario: A User Calls With a Problem on page 10The vice president of sales telephones the help desk reporting that her virtual machine, VPSALES4632,is running slow. She is working on sales reports for an upcoming meeting and is running behindschedule because of the slow performance of her virtual machine.
n User Scenario: An Alert Arrives in Your Inbox on page 14You return from lunch to find an alert notification in your inbox. You can usevRealize Operations Manager to investigate and resolve the alert.
n User Scenario: You See Problems as You Monitor the State of Your Objects on page 22As you investigate your objects in the context of this scenario, vRealize Operations Manager providesdetails to help you resolve the problems. You analyze the state of your environment, examine currentproblems, investigate solutions, and take action to resolve the problems.
User Scenario: A User Calls With a ProblemThe vice president of sales telephones the help desk reporting that her virtual machine, VPSALES4632, isrunning slow. She is working on sales reports for an upcoming meeting and is running behind schedulebecause of the slow performance of her virtual machine.
As a network operations engineer, you were just reviewing the morning alerts and did not see any problemswith her virtual machine, so you begin troubleshooting the problem.
Procedure
1 User Scenario: Search for a Specific Object on page 10As a network operations engineer, you must locate the customer's virtual machine invRealize Operations Manager so that you can begin troubleshooting the reported problem.
2 User Scenario: Review Alerts Related to Reported Problems on page 11To determine if the virtual machine about which the vice president of sales reported problems hasalerts that indicate the cause of the problem, you review the alerts in vRealize Operations Manager forthe object.
3 User Scenario: Use the Troubleshooting Tab Options to Investigate a Reported Problem on page 12To troubleshoot problems with the VPSALES4632 virtual machine, you evaluate the symptoms,examine time line information, consider events, and create metric charts to find the root cause of theproblem.
User Scenario: Search for a Specific ObjectAs a network operations engineer, you must locate the customer's virtual machine invRealize Operations Manager so that you can begin troubleshooting the reported problem.
You use vRealize Operations Manager to monitor three vCenter Server instances with a total of 360 hostsand 18,000 virtual machines. The easiest way to locate a particular virtual machine is to search for it.
Procedure
1 In the Search text box, located on the vRealize Operations Manager title bar, type the name of thevirtual machine.
The Search text box displays all the objects that contain the string you type in the text box. If yourcustomer knows that her virtual machine name contains SALES, you can type the string and the virtualmachine is included in the list.
2 Select the object in the list.
The left pane displays the object name and the related objects, including the host system and vCenter Serverinstance. The main pane displays the Summary tab.
vRealize Operations Manager User Guide
10 VMware, Inc.
What to do next
Look for alerts related to the reported problem for the object. See “User Scenario: Review Alerts Related toReported Problems,” on page 11.
User Scenario: Review Alerts Related to Reported ProblemsTo determine if the virtual machine about which the vice president of sales reported problems has alerts thatindicate the cause of the problem, you review the alerts in vRealize Operations Manager for the object.
Alerts on an object give you an insight into problems other than the one that the object user reports.
Prerequisites
Locate the customer's virtual machine so that you can review related alerts. See “User Scenario: Search for aSpecific Object,” on page 10.
Procedure
1 Click the Summary tab for the problematic object.
The Summary tab displays active alerts for the object and for any descendant objects that are classifiedat the top alerts.
2 Review the top alerts for Health, Risk, and Efficiency.
Top alerts are considered the primary contributors to the current state of the alert badges. Do any ofthem appear to contribute to the slow response problem? For example, any ballooning or swappingalerts, which indicates that you need to add memory to the virtual machine? Any alerts related tomemory contention, which indicates that you need to add memory to the host.
3 If the Summary tab does not include any top issues that appear to explain the reported problem, clickthe Alerts tab.
The Alerts tab displays all active alerts for the current object.
4 Review the alerts for problems that are similar to or contribute to the reported problem.
a To view the active and cancelled alerts, click Status: Active to clear the filter and display active andinactive alerts.
The cancelled alerts might provide information about the problem.
b Click the Created On column to sort the alerts so that you can locate alerts generated on or beforethe time when your customer reported the problem.
c To view alerts for the ancestor objects in the same list with the alert for the virtual machine, clickthe up arrow and select Host System and Cluster Compute Resources, if they are configured inyour environment.
Add these object types to the list so that you can determine if alerts among the parent objects arecontributing to the reported problem.
5 If you locate an alert that appears to explain the reported problem, click the alert name in the alerts list.
6 On the alert details Summary tab, review the triggered symptoms and recommendations to determineif the alert indicates the root cause of the reported problem.
What to do next
n If the alert appears to indicate the source of the problem, follow the recommendations and verify theresolution with your customer. For an example, see “User Scenario: Run a Recommendation On aDatastore to Resolve an Alert,” on page 21.
Chapter 1 Monitoring Objects in Your Managed Environment by Using vRealize Operations Manager
VMware, Inc. 11
n If you cannot locate the cause of the reported problem among the alerts, begin more in-depthtroubleshooting. See “User Scenario: Use the Troubleshooting Tab Options to Investigate a ReportedProblem,” on page 12.
User Scenario: Use the Troubleshooting Tab Options to Investigate a ReportedProblemTo troubleshoot problems with the VPSALES4632 virtual machine, you evaluate the symptoms, examinetime line information, consider events, and create metric charts to find the root cause of the problem.
If a review of the alerts did not help you identify the cause of the problem reported for the virtual machine,use the Troubleshooting tabs, Symptoms, Timeline, Events, and All Metrics, to troubleshoot the history andcurrent state of the virtual machine.
Prerequisites
n Locate the object for which the problem was reported. See “User Scenario: Search for a Specific Object,”on page 10.
n Review the alerts for the virtual machine to determine if the problem is already identified andrecommendations made. See “User Scenario: Review Alerts Related to Reported Problems,” on page 11.
Procedure
1 If you are viewing the Alert Details tabs, click Virtual Machine in the left pane and selectVPSALES4632 in the lower list.
The main pane updates to the display the object Summary tab.
2 Click the Troubleshooting tab, click the Symptoms tab, and review the symptoms to determine if oneof the symptoms is related to the reported problem.
Depending on how your alerts are configured, some symptoms might be triggered but not sufficient togenerate an alert.
a Review symptom names to determine if one or more symptoms are related to the reportedproblem.
The Information column provides the triggering condition, trend, and current value. What are themost common symptoms that affect response time? Do you see any symptoms related to CPU ormemory usage?
b Sort by the Created On date so that you can focus on the time frame in which your customerreported that the problem.
c Click the Status: Active filter button to disable the filter so that you can review active and inactivesymptoms.
Based on symptoms, you think the problem is related to CPU or memory use. But you do not know ifthe problem is with the virtual machine or with the host.
vRealize Operations Manager User Guide
12 VMware, Inc.
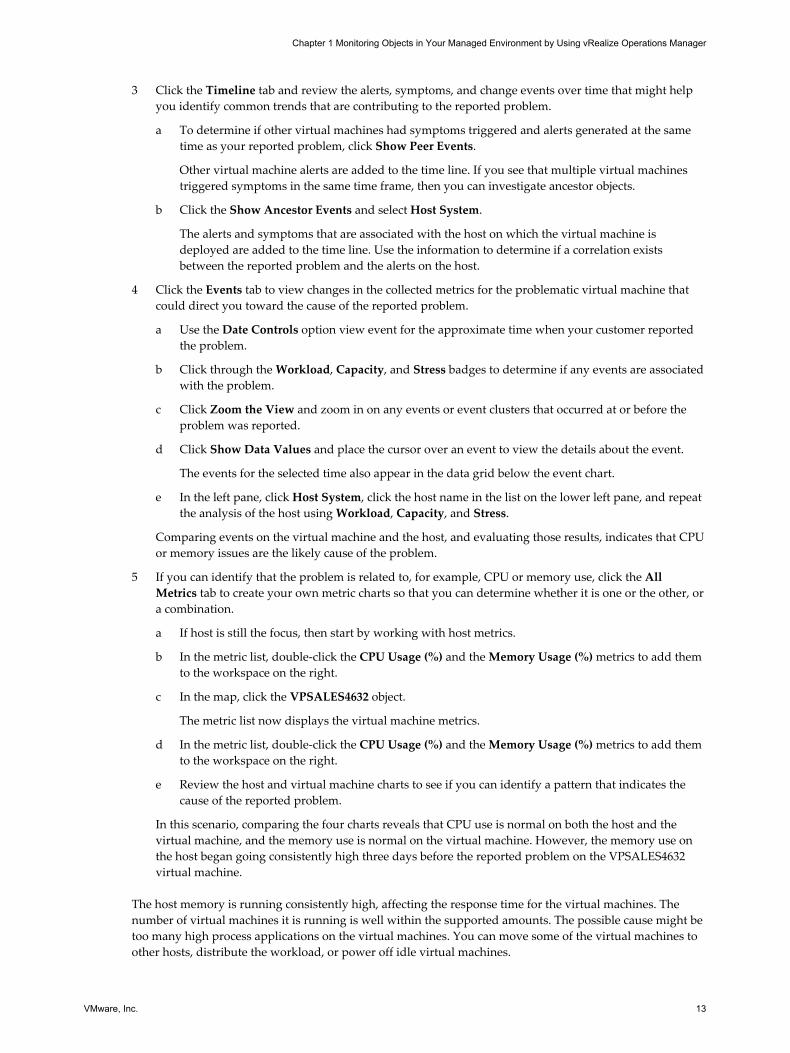
3 Click the Timeline tab and review the alerts, symptoms, and change events over time that might helpyou identify common trends that are contributing to the reported problem.
a To determine if other virtual machines had symptoms triggered and alerts generated at the sametime as your reported problem, click Show Peer Events.
Other virtual machine alerts are added to the time line. If you see that multiple virtual machinestriggered symptoms in the same time frame, then you can investigate ancestor objects.
b Click the Show Ancestor Events and select Host System.
The alerts and symptoms that are associated with the host on which the virtual machine isdeployed are added to the time line. Use the information to determine if a correlation existsbetween the reported problem and the alerts on the host.
4 Click the Events tab to view changes in the collected metrics for the problematic virtual machine thatcould direct you toward the cause of the reported problem.
a Use the Date Controls option view event for the approximate time when your customer reportedthe problem.
b Click through the Workload, Capacity, and Stress badges to determine if any events are associatedwith the problem.
c Click Zoom the View and zoom in on any events or event clusters that occurred at or before theproblem was reported.
d Click Show Data Values and place the cursor over an event to view the details about the event.
The events for the selected time also appear in the data grid below the event chart.
e In the left pane, click Host System, click the host name in the list on the lower left pane, and repeatthe analysis of the host using Workload, Capacity, and Stress.
Comparing events on the virtual machine and the host, and evaluating those results, indicates that CPUor memory issues are the likely cause of the problem.
5 If you can identify that the problem is related to, for example, CPU or memory use, click the AllMetrics tab to create your own metric charts so that you can determine whether it is one or the other, ora combination.
a If host is still the focus, then start by working with host metrics.
b In the metric list, double-click the CPU Usage (%) and the Memory Usage (%) metrics to add themto the workspace on the right.
c In the map, click the VPSALES4632 object.
The metric list now displays the virtual machine metrics.
d In the metric list, double-click the CPU Usage (%) and the Memory Usage (%) metrics to add themto the workspace on the right.
e Review the host and virtual machine charts to see if you can identify a pattern that indicates thecause of the reported problem.
In this scenario, comparing the four charts reveals that CPU use is normal on both the host and thevirtual machine, and the memory use is normal on the virtual machine. However, the memory use onthe host began going consistently high three days before the reported problem on the VPSALES4632virtual machine.
The host memory is running consistently high, affecting the response time for the virtual machines. Thenumber of virtual machines it is running is well within the supported amounts. The possible cause might betoo many high process applications on the virtual machines. You can move some of the virtual machines toother hosts, distribute the workload, or power off idle virtual machines.
Chapter 1 Monitoring Objects in Your Managed Environment by Using vRealize Operations Manager
VMware, Inc. 13
What to do next
n In this example, you can use vRealize Operations Manager to power off virtual machines on the host sothat you can improve the performance of the virtual machines that are in use. See “Run Actions FromToolbars in vRealize Operations Manager,” on page 73.
n If the combination of charts that you created on the All Metrics tab are something that you might wantto use again, click Generate Dashboard.
n If you did not resolve the problem, continue your investigation.
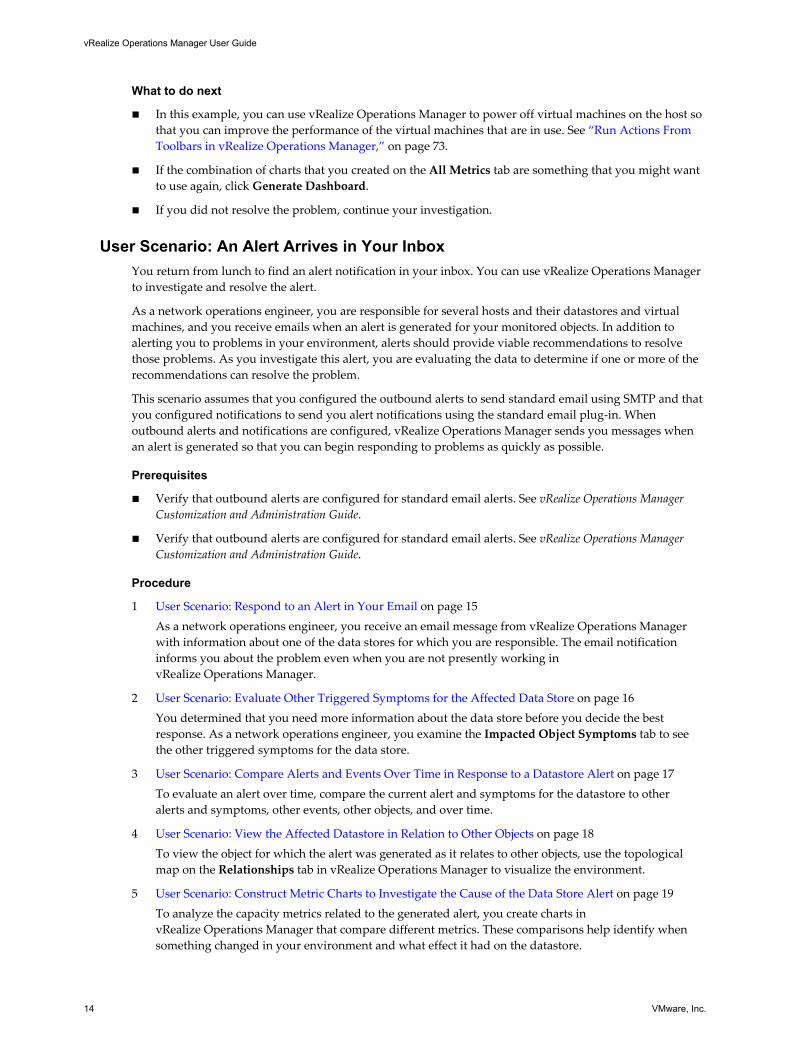
User Scenario: An Alert Arrives in Your InboxYou return from lunch to find an alert notification in your inbox. You can use vRealize Operations Managerto investigate and resolve the alert.
As a network operations engineer, you are responsible for several hosts and their datastores and virtualmachines, and you receive emails when an alert is generated for your monitored objects. In addition toalerting you to problems in your environment, alerts should provide viable recommendations to resolvethose problems. As you investigate this alert, you are evaluating the data to determine if one or more of therecommendations can resolve the problem.
This scenario assumes that you configured the outbound alerts to send standard email using SMTP and thatyou configured notifications to send you alert notifications using the standard email plug-in. Whenoutbound alerts and notifications are configured, vRealize Operations Manager sends you messages whenan alert is generated so that you can begin responding to problems as quickly as possible.
Prerequisites
n Verify that outbound alerts are configured for standard email alerts. See vRealize Operations ManagerCustomization and Administration Guide.
n Verify that outbound alerts are configured for standard email alerts. See vRealize Operations ManagerCustomization and Administration Guide.
Procedure
1 User Scenario: Respond to an Alert in Your Email on page 15As a network operations engineer, you receive an email message from vRealize Operations Managerwith information about one of the data stores for which you are responsible. The email notificationinforms you about the problem even when you are not presently working invRealize Operations Manager.
2 User Scenario: Evaluate Other Triggered Symptoms for the Affected Data Store on page 16You determined that you need more information about the data store before you decide the bestresponse. As a network operations engineer, you examine the Impacted Object Symptoms tab to seethe other triggered symptoms for the data store.
3 User Scenario: Compare Alerts and Events Over Time in Response to a Datastore Alert on page 17To evaluate an alert over time, compare the current alert and symptoms for the datastore to otheralerts and symptoms, other events, other objects, and over time.
4 User Scenario: View the Affected Datastore in Relation to Other Objects on page 18To view the object for which the alert was generated as it relates to other objects, use the topologicalmap on the Relationships tab in vRealize Operations Manager to visualize the environment.
5 User Scenario: Construct Metric Charts to Investigate the Cause of the Data Store Alert on page 19To analyze the capacity metrics related to the generated alert, you create charts invRealize Operations Manager that compare different metrics. These comparisons help identify whensomething changed in your environment and what effect it had on the datastore.
vRealize Operations Manager User Guide
14 VMware, Inc.
6 User Scenario: Run a Recommendation On a Datastore to Resolve an Alert on page 21As a network operations engineer, you investigated the alert regarding datastore disk space anddetermined that the provided recommendations will resolve the problem, particularly therecommendation to delete unused snapshots. You use vRealize Operations Manager to delete thesnapshots.
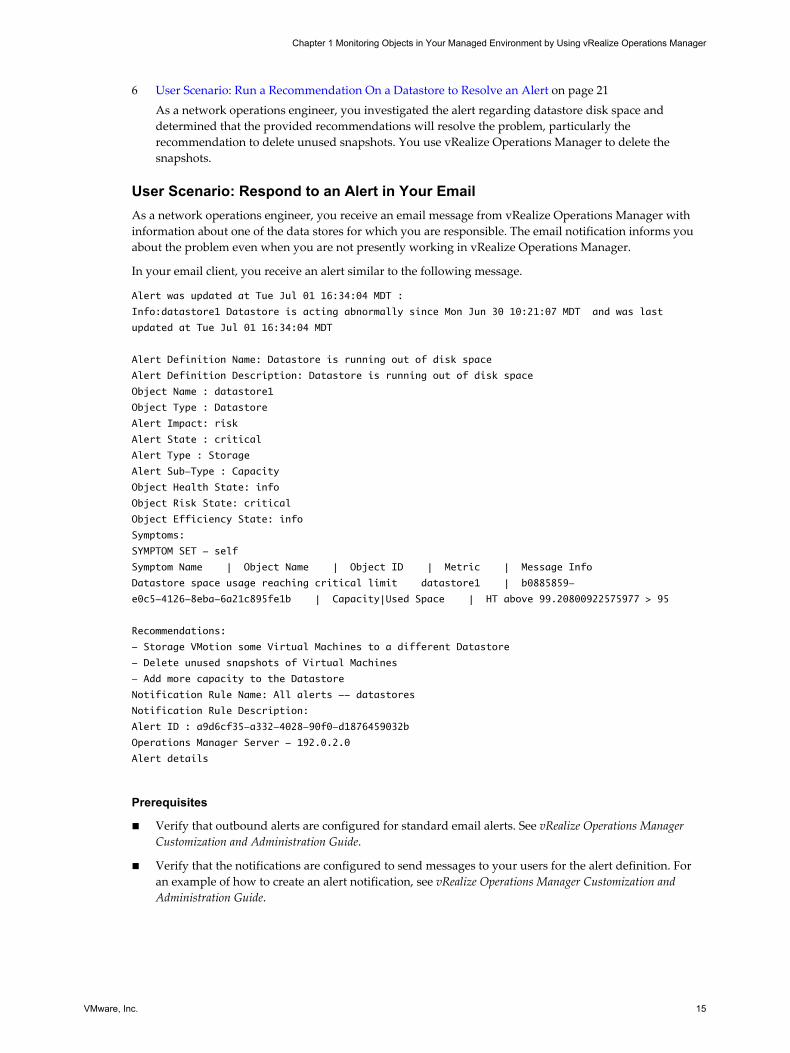
User Scenario: Respond to an Alert in Your EmailAs a network operations engineer, you receive an email message from vRealize Operations Manager withinformation about one of the data stores for which you are responsible. The email notification informs youabout the problem even when you are not presently working in vRealize Operations Manager.
In your email client, you receive an alert similar to the following message.
Alert was updated at Tue Jul 01 16:34:04 MDT :
Info:datastore1 Datastore is acting abnormally since Mon Jun 30 10:21:07 MDT and was last
updated at Tue Jul 01 16:34:04 MDT
Alert Definition Name: Datastore is running out of disk space
Alert Definition Description: Datastore is running out of disk space
Object Name : datastore1
Object Type : Datastore
Alert Impact: risk
Alert State : critical
Alert Type : Storage
Alert Sub-Type : Capacity
Object Health State: info
Object Risk State: critical
Object Efficiency State: info
Symptoms:
SYMPTOM SET - self
Symptom Name | Object Name | Object ID | Metric | Message Info
Datastore space usage reaching critical limit datastore1 | b0885859-
e0c5-4126-8eba-6a21c895fe1b | Capacity|Used Space | HT above 99.20800922575977 > 95
Recommendations:
- Storage VMotion some Virtual Machines to a different Datastore
- Delete unused snapshots of Virtual Machines
- Add more capacity to the Datastore
Notification Rule Name: All alerts -- datastores
Notification Rule Description:
Alert ID : a9d6cf35-a332-4028-90f0-d1876459032b
Operations Manager Server - 192.0.2.0
Alert details
Prerequisites
n Verify that outbound alerts are configured for standard email alerts. See vRealize Operations ManagerCustomization and Administration Guide.
n Verify that the notifications are configured to send messages to your users for the alert definition. Foran example of how to create an alert notification, see vRealize Operations Manager Customization andAdministration Guide.
Chapter 1 Monitoring Objects in Your Managed Environment by Using vRealize Operations Manager
VMware, Inc. 15
Procedure
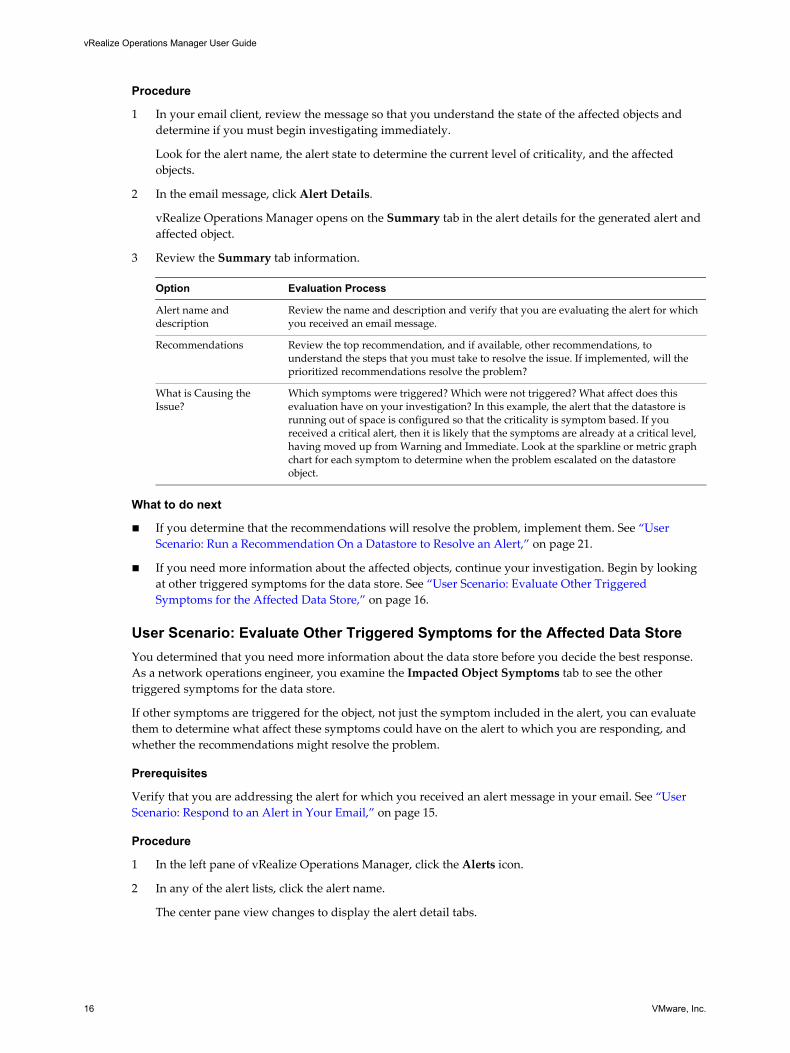
1 In your email client, review the message so that you understand the state of the affected objects anddetermine if you must begin investigating immediately.
Look for the alert name, the alert state to determine the current level of criticality, and the affectedobjects.
2 In the email message, click Alert Details.
vRealize Operations Manager opens on the Summary tab in the alert details for the generated alert andaffected object.
3 Review the Summary tab information.
Option Evaluation Process
Alert name anddescription
Review the name and description and verify that you are evaluating the alert for whichyou received an email message.
Recommendations Review the top recommendation, and if available, other recommendations, tounderstand the steps that you must take to resolve the issue. If implemented, will theprioritized recommendations resolve the problem?
What is Causing theIssue?
Which symptoms were triggered? Which were not triggered? What affect does thisevaluation have on your investigation? In this example, the alert that the datastore isrunning out of space is configured so that the criticality is symptom based. If youreceived a critical alert, then it is likely that the symptoms are already at a critical level,having moved up from Warning and Immediate. Look at the sparkline or metric graphchart for each symptom to determine when the problem escalated on the datastoreobject.
What to do next
n If you determine that the recommendations will resolve the problem, implement them. See “UserScenario: Run a Recommendation On a Datastore to Resolve an Alert,” on page 21.
n If you need more information about the affected objects, continue your investigation. Begin by lookingat other triggered symptoms for the data store. See “User Scenario: Evaluate Other TriggeredSymptoms for the Affected Data Store,” on page 16.
User Scenario: Evaluate Other Triggered Symptoms for the Affected Data StoreYou determined that you need more information about the data store before you decide the best response.As a network operations engineer, you examine the Impacted Object Symptoms tab to see the othertriggered symptoms for the data store.
If other symptoms are triggered for the object, not just the symptom included in the alert, you can evaluatethem to determine what affect these symptoms could have on the alert to which you are responding, andwhether the recommendations might resolve the problem.
Prerequisites
Verify that you are addressing the alert for which you received an alert message in your email. See “UserScenario: Respond to an Alert in Your Email,” on page 15.
Procedure
1 In the left pane of vRealize Operations Manager, click the Alerts icon.
2 In any of the alert lists, click the alert name.
The center pane view changes to display the alert detail tabs.
vRealize Operations Manager User Guide
16 VMware, Inc.
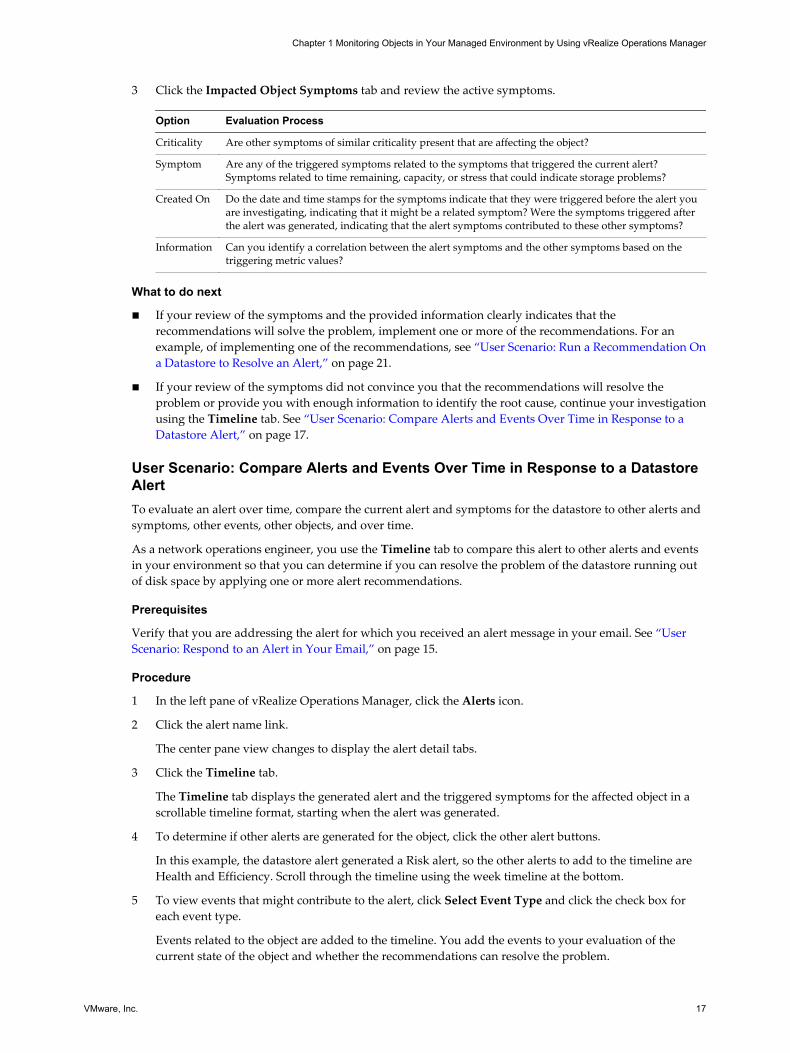
3 Click the Impacted Object Symptoms tab and review the active symptoms.
Option Evaluation Process
Criticality Are other symptoms of similar criticality present that are affecting the object?
Symptom Are any of the triggered symptoms related to the symptoms that triggered the current alert?Symptoms related to time remaining, capacity, or stress that could indicate storage problems?
Created On Do the date and time stamps for the symptoms indicate that they were triggered before the alert youare investigating, indicating that it might be a related symptom? Were the symptoms triggered afterthe alert was generated, indicating that the alert symptoms contributed to these other symptoms?
Information Can you identify a correlation between the alert symptoms and the other symptoms based on thetriggering metric values?
What to do next
n If your review of the symptoms and the provided information clearly indicates that therecommendations will solve the problem, implement one or more of the recommendations. For anexample, of implementing one of the recommendations, see “User Scenario: Run a Recommendation Ona Datastore to Resolve an Alert,” on page 21.
n If your review of the symptoms did not convince you that the recommendations will resolve theproblem or provide you with enough information to identify the root cause, continue your investigationusing the Timeline tab. See “User Scenario: Compare Alerts and Events Over Time in Response to aDatastore Alert,” on page 17.
User Scenario: Compare Alerts and Events Over Time in Response to a DatastoreAlertTo evaluate an alert over time, compare the current alert and symptoms for the datastore to other alerts andsymptoms, other events, other objects, and over time.
As a network operations engineer, you use the Timeline tab to compare this alert to other alerts and eventsin your environment so that you can determine if you can resolve the problem of the datastore running outof disk space by applying one or more alert recommendations.
Prerequisites
Verify that you are addressing the alert for which you received an alert message in your email. See “UserScenario: Respond to an Alert in Your Email,” on page 15.
Procedure
1 In the left pane of vRealize Operations Manager, click the Alerts icon.
2 Click the alert name link.
The center pane view changes to display the alert detail tabs.
3 Click the Timeline tab.
The Timeline tab displays the generated alert and the triggered symptoms for the affected object in ascrollable timeline format, starting when the alert was generated.
4 To determine if other alerts are generated for the object, click the other alert buttons.
In this example, the datastore alert generated a Risk alert, so the other alerts to add to the timeline areHealth and Efficiency. Scroll through the timeline using the week timeline at the bottom.
5 To view events that might contribute to the alert, click Select Event Type and click the check box foreach event type.
Events related to the object are added to the timeline. You add the events to your evaluation of thecurrent state of the object and whether the recommendations can resolve the problem.
Chapter 1 Monitoring Objects in Your Managed Environment by Using vRealize Operations Manager
VMware, Inc. 17
6 Click Show Ancestor Events and select Host.
Because the alert is related to disk space, adding the host to the timeline allows you to see what alertsand symptoms are generated for the host. As you scroll through the timeline, when did some of therelated alerts begin? When are they no longer on the timeline? What was the effect on the state of thedatastore object?
7 Click Show Peer Events.
If other datastores have alerts related to the alert you are currently investigating, seeing when the alertsfor the other datastores were generated can help you determine what resource problems you areexperiencing in your environment.
8 To remove canceled alerts from your timeline, click Select Status and deselect the Canceled check box.
Removing the canceled alerts and symptoms from the timeline clears the view and allows you to focuson current alerts.
What to do next
n If your evaluation of alert in the timeline provided enough information to indicate that one or more ofthe recommendations to resolve the alert are valid, implement the recommendations. See “UserScenario: Run a Recommendation On a Datastore to Resolve an Alert,” on page 21.
n If you need more information about the affected object, continue your investigation. See “User Scenario:View the Affected Datastore in Relation to Other Objects,” on page 18.
User Scenario: View the Affected Datastore in Relation to Other ObjectsTo view the object for which the alert was generated as it relates to other objects, use the topological map onthe Relationships tab in vRealize Operations Manager to visualize the environment.
As a network operations engineer, you view a datastore and the related objects in a map to further yourunderstanding of the problem, and to determine if implementing the alert recommendations will resolve theproblem that the alert identifies.
Prerequisites
Evaluate the alert over time and in comparison to related objects. See “User Scenario: Compare Alerts andEvents Over Time in Response to a Datastore Alert,” on page 17.
Procedure
1 In the left pane of vRealize Operations Manager, click the Alerts icon.
2 Click the alert name link.
The center pane view changes to display the alert detail tabs.
3 Click the Relationships tab.
The Relationships tab displays the datastore in a map with the related objects. By default, the badgethat this alert affects is selected only on the toolbar, and objects in the tree show a colored square toindicate the current state of the badge.
4 To view the alert status of the objects for the other badges, click the Health button and then theEfficiency button.
As you click each badge button, the squares on each object indicate whether an alert is generated andthe criticality of the alert.
5 To view alerts for an object, select the object and click Show alerts.
The alert list dialog box appears, allowing you to search and sort for alerts for the object.
vRealize Operations Manager User Guide
18 VMware, Inc.
6 To view a list of the child objects for an object in the map, click the object.
A list of the number of children by object type appears at the bottom of the center pane.
7 Use the options to evaluate the datastore.
For example, what does the map tell you about the number of virtual machines that are associated withthe datastore? If many virtual machines are associated with a datastore, moving them might freedatastore disk space.
What to do next
n If your review of the map provided enough information to indicate that one or more of therecommendations to resolve the alert are valid, implement the recommendations. See “User Scenario:Run a Recommendation On a Datastore to Resolve an Alert,” on page 21.
n If you need more information about the affected object, continue your investigation. See “User Scenario:Construct Metric Charts to Investigate the Cause of the Data Store Alert,” on page 19.
User Scenario: Construct Metric Charts to Investigate the Cause of the Data StoreAlertTo analyze the capacity metrics related to the generated alert, you create charts invRealize Operations Manager that compare different metrics. These comparisons help identify whensomething changed in your environment and what effect it had on the datastore.
As a network operations engineer, you create custom charts so that you can further investigate the problem,and to determine if implementing the alert recommendations will resolve the problem that the alertidentifies.
Prerequisites
View the topological map for the data store to determine if related objects are contributing to the alert or iftriggering symptoms indicate that the data store is contributing to other problems in your environment. See “User Scenario: View the Affected Datastore in Relation to Other Objects,” on page 18.
Procedure
1 In the left pane of vRealize Operations Manager, click the Alerts icon.
2 Click the alert name link.
The center pane view changes to display the alert detail tabs.
3 Click the Metric Charts tab.
The Metric Charts tab does not include charts. You must add the charts to compare.
Chapter 1 Monitoring Objects in Your Managed Environment by Using vRealize Operations Manager
VMware, Inc. 19
4 To analyze the first recommendation, Add more capacity to the Datastore Storage, add related charts tothe workspace.
a Enter capacity in the metric list search text box.
The list displays metrics that contain the search term.
b Double-click the following metrics to add the following charts to the workspace:
n Capacity | Used Space (GB)
n Disk Space | Capacity (GB)
n Summary | Number of Capacity Consumers
c Compare the charts.
For example, if the Capacity | Used Space (%) chart shows an increase in used space, but the DiskSpace | Capacity (GB) did not increase and the Summary | Number of Capacity Consumers didnot decrease, then adding capacity is a solution, but it does not address the root cause.
5 To analyze the second recommendation, vMotion some Virtual Machines to a different Datastore,add related charts to the workspace.
a Enter vm in the metric list search text box.
b Double-click the Summary | Total Number of VMs metric to add it to the workspace
c Compare the 4 charts.
For example, if the Summary | Total Number of VMs chart shows that the number of virtualmachines did not increase enough to negatively affect the data store, then moving some of thevirtual machines is a solution, but it does not address the root cause.
6 To analyze the third recommendation, Delete unused snapshots of virtual machines, add related chartsto the workspace.
a Enter snapshot in the metric list search text box.
b Double-click the following metrics to add the charts to the workspace:
n Disk Space | Snapshot Space (GB)
n Disk Space Reclaimable | Snapshot Space | Waste Value (GB)
c Compare the charts.
For example, if the amount of Disk Space | Snapshot Space (GB) increased and the Disk SpaceReclaimable | Snapshot Space | Waste Value (GB) indicates an area where space can be reclaimed,then deleting unused snapshots will positively affect the data store disk space problem and resolvethe alert.
7 If this is a problematic data store that you must continue to monitor, you can create a dashboard.
a Click the Generate Dashboard button on the workspace toolbar.
b Enter a name for the dashboard and click OK.
In this example, use a name like Datastore disk space.
The dashboard is added to your available dashboards.
You compared metric charts to determine if the recommendations are valid and which recommendation toimplement first. In this example, the Delete unused snapshots of Virtual Machines recommendation appearsto be the most likely way to resolve the alert.
vRealize Operations Manager User Guide
20 VMware, Inc.
What to do next
Implement the alert recommendations. See “User Scenario: Run a Recommendation On a Datastore toResolve an Alert,” on page 21.
User Scenario: Run a Recommendation On a Datastore to Resolve an AlertAs a network operations engineer, you investigated the alert regarding datastore disk space and determinedthat the provided recommendations will resolve the problem, particularly the recommendation to deleteunused snapshots. You use vRealize Operations Manager to delete the snapshots.
If you do not use the action adapter, you can manually delete the snapshots on your vCenter Serverinstance.
Prerequisites
n Compare the metric charts to identify the likely root cause of the alert. See “User Scenario: CompareAlerts and Events Over Time in Response to a Datastore Alert,” on page 17 .
n Verify that the vCenter Python Actions adapter is installed and configured to run on the samevCenter Server instance that includes the datastore for which the alert was generated. See vRealizeOperations Manager Customization and Administration Guide.
Procedure
1 In the left pane of vRealize Operations Manager, click the Alerts icon.
2 Click the alert name link.
3 Click the Summary tab.
4 Click the Other Recommendations arrow to expand the list.
Other recommendations include the Storage vMotion some virtual machines to a differentdatastore recommendation and the Delete unused snapshots for virtual machines recommendation.The delete unused snapshot recommendation includes an action button.
5 Click Delete Unused Snapshots for Datastore.
6 In the Days Old text box, select or enter the number of days old the snapshot must be to be retrieved fordeletions and click OK.
For example, enter 30 to retrieve all snapshots on the datastore that are 30 days old or older.
7 In the Delete Unused Snapshots for Datastore dialog box, review the Snapshot Space, Snapshot CreateTime, and the VM Name to determine which snapshots to delete, and select the check box for each oneto delete.
8 Click OK.
The dialog box that appears provides a link to Recent Tasks and a link to the task.
9 To verify that the task ran successfully, click Recent Tasks.
The Recent Tasks page appears. The Delete Unused Snapshots action include two tasks, one to retrievethe snapshots and one to delete the snapshots.
10 Select the Delete Unused Snapshot task that has the more recent completed time.
This is the delete task. The status should be Completed.
In this example, you ran an action on the datastore in vCenter Server. The other recommendations mightalso be valid.
Chapter 1 Monitoring Objects in Your Managed Environment by Using vRealize Operations Manager
VMware, Inc. 21
What to do next
n Verify that the recommendations resolve the alert. Allow a few collection cycles to run after you run theaction and verify that the alert is canceled. Alerts are canceled when the conditions that generated themare no longer true.
n Implement the other recommendations. The other recommendations for this alert require you to useother applications. You cannot implement the recommendations from vRealize Operations Manager.
n Use other options to investigate the root cause. See “User Scenario: Investigate the Root Cause of aProblem by Using the Troubleshooting Tab Options,” on page 59 for an alternative example forinvestigating the root cause of a problem.
User Scenario: You See Problems as You Monitor the State of Your ObjectsAs you investigate your objects in the context of this scenario, vRealize Operations Manager provides detailsto help you resolve the problems. You analyze the state of your environment, examine current problems,investigate solutions, and take action to resolve the problems.
As a virtual infrastructure administrator, you regularly browse through vRealize Operations Manager atvarious levels so that you know the general state of the objects in your managed environment. Although noone has called or complained, and you do not see any new alerts, you are starting to see that your cluster isrunning out of capacity.
This scenario refers to objects that are associated with the VMware vSphere Solution, which connectsvRealize Operations Manager to one or more vCenter Server instances. The objects in your environmentinclude multiple vCenter Server instances, data centers, clusters (cluster compute resources), host systems,resource pools, and virtual machines.
As you perform the steps in this scenario, and progress through the stages of troubleshooting, you learnhow to use vRealize Operations Manager to help you resolve problems. You will analyze the state of theobjects in your environment, examine current problems, investigate solutions, and take action to resolve theproblems.
This scenario shows you how to evaluate the problems that occur on your objects, and take action to resolveproblems.
n With the Analysis tab, you view the settings for object resources, click the links provided to furtheranalyze the problem, and examine the policy settings and thresholds.
n Using the Troubleshooting tab, you examine the symptoms that triggered on the objects, determinewhen the problems that triggered those symptoms occurred, identify the events associated with thoseproblems, and examine the metric values involved.
n On the Details tab, you investigate the metric activity as a graph, list, or distribution chart, and view theheat maps to examine the criticality levels of your objects.
n With the Environment tab, you evaluate the health, risk, and efficiency of various objects as they relateto your overall object hierarchy. You view the object relationships to determine how an object that is ina critical state might be affecting other objects.
To support future troubleshooting and ongoing maintenance, you can create a new alert definition, andcreate a dashboard and one or more views and reports. To plan for growth and account for newly approvedprojects, you can create and commit capacity projects. To enforce the rules used to monitor your objects, youcan create and customize operational policies.
Prerequisites
Verify that you are monitoring one or more vCenter Server instances. See the vRealize Operations ManagerCustomization and Administration Guide.
vRealize Operations Manager User Guide
22 VMware, Inc.
Procedure
1 User Scenario: Analyze the State of Your Environment on page 23The Analysis tabs help you analyze your objects in multiple ways. As a Virtual InfrastructureAdministrator, you use the Analysis tabs to evaluate the details about the state of your objects to helpyou resolve problems.
2 User Scenario: Troubleshoot Problems with a Host System on page 25You use the Troubleshooting tabs to identify the root cause of problems that are not resolved by alertrecommendations or simple analysis.
3 User Scenario: Examine the Environment Details on page 27Examine the status of your objects in the views and heatmaps so that you can identify the trends andspikes that are occurring with the resources on your cluster and objects. To determine whether anydeviations have occurred, you can display overall summaries for an object, such as for the cluster diskspace usage breakdown.
4 User Scenario: Examine the Environment Relationships on page 29You use the Environment Overview and List to examine the status of the badges as they relate to theobjects in your environment hierarchy, and determine which objects are in a critical state for aparticular badge. To view the relationships between your objects to determine whether an ancestorobject that has a critical problem might be causing problems with the descendants of the object, youuse the Environment Map.
5 User Scenario: Fix the Problem on page 30You use the analysis and troubleshooting features of vRealize Operations Manager to examineproblems that put your objects in a critical state, and identify solutions. To resolve the problems,where actions exist for the object type, you select an object and an available action that is specific to theobject. Or, you can open the object in the vSphere Web Client and modify the object settings to resolvethe problem.
6 User Scenario: Create a New Alert Definition on page 32Based on the root cause of the problem, and the solutions that you used to fix the problem, you cancreate a new alert definition for vRealize Operations Manager to alert you. When the alert is triggeredon your host system, vRealize Operations Manager alerts you and provides recommendations on howto solve the problem.
7 User Scenario: Create Dashboards and Views on page 33To help you investigate and troubleshoot problems with your cluster and host systems that mightoccur in the future, you can create dashboards and views that apply the troubleshooting tools andsolutions that you used to research and solve the problems with your host system, to make thosetroubleshooting tools and solutions available for future use.
User Scenario: Analyze the State of Your EnvironmentThe Analysis tabs help you analyze your objects in multiple ways. As a Virtual InfrastructureAdministrator, you use the Analysis tabs to evaluate the details about the state of your objects to help youresolve problems.
As you browse through the inventory tree, you notice that one of your clusters, named USA-Cluster, isexperiencing capacity problems. You use the Analysis tabs to begin to investigate the cause of the problemon USA-Cluster, and you start to see problems reported with the capacity on one of your host systems andother objects.
Prerequisites
Verify that you understand the context of this scenario. See “User Scenario: You See Problems as YouMonitor the State of Your Objects,” on page 22.
Chapter 1 Monitoring Objects in Your Managed Environment by Using vRealize Operations Manager
VMware, Inc. 23
Procedure
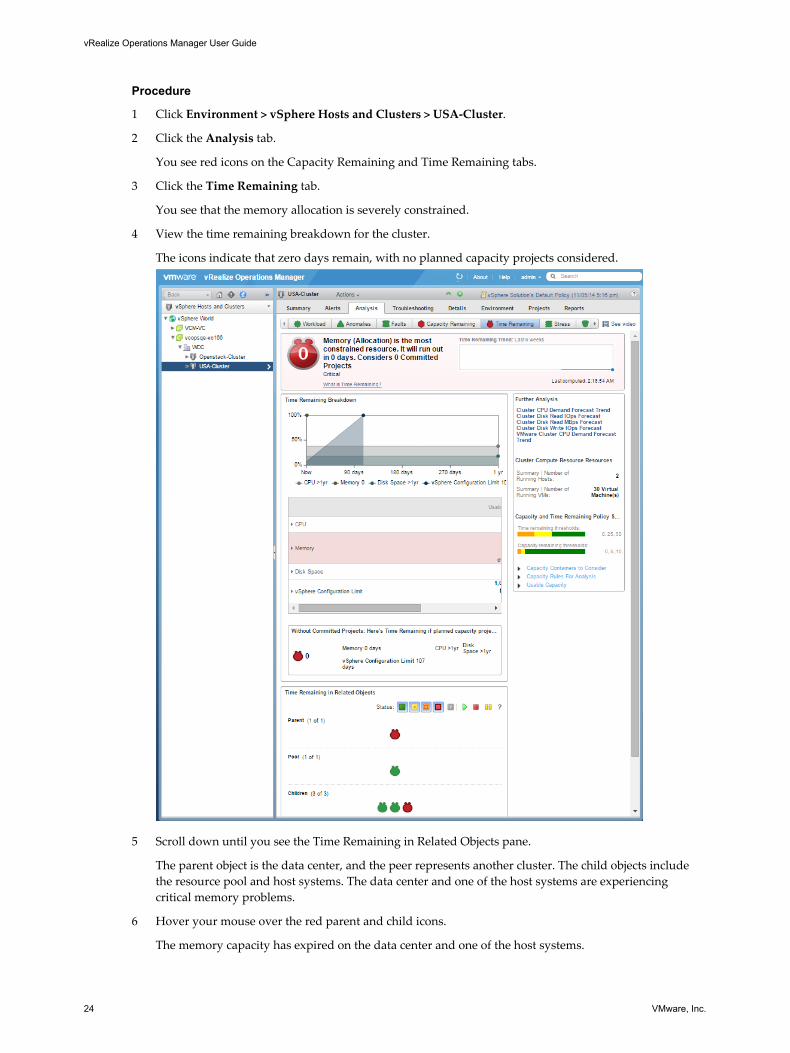
1 Click Environment > vSphere Hosts and Clusters > USA-Cluster.
2 Click the Analysis tab.
You see red icons on the Capacity Remaining and Time Remaining tabs.
3 Click the Time Remaining tab.
You see that the memory allocation is severely constrained.
4 View the time remaining breakdown for the cluster.
The icons indicate that zero days remain, with no planned capacity projects considered.
5 Scroll down until you see the Time Remaining in Related Objects pane.
The parent object is the data center, and the peer represents another cluster. The child objects includethe resource pool and host systems. The data center and one of the host systems are experiencingcritical memory problems.
6 Hover your mouse over the red parent and child icons.
The memory capacity has expired on the data center and one of the host systems.
vRealize Operations Manager User Guide
24 VMware, Inc.
The memory capacity problem on the cluster is affecting the memory capacity of the related objects.
What to do next
Use the Troubleshooting tab to further troubleshoot the capacity problems on your cluster and host system.See “User Scenario: Troubleshoot Problems with a Host System,” on page 25.
User Scenario: Troubleshoot Problems with a Host SystemYou use the Troubleshooting tabs to identify the root cause of problems that are not resolved by alertrecommendations or simple analysis.
To further troubleshoot the symptoms of the capacity problems that are occurring on the cluster and hostsystem, and determine when those problems occurred, you use the Troubleshooting tabs to continue toinvestigate the memory problem.
Prerequisites
Use the Analysis tabs to analyze your environment. See “User Scenario: Analyze the State of YourEnvironment,” on page 23.
Procedure
1 Click Environment > vSphere Hosts and Clusters > USA-Cluster.
2 Click the Troubleshooting tab and review the symptoms.
The Symptoms tab displays the symptoms that triggered on the selected cluster. You notice that severalcritical symptoms exist.
n Cluster Compute Resource Time Remaining with committed projects is critically low
n Cluster Compute Resource Time Remaining is critically low
n Capacity remaining is critically low
3 Analyze the critical symptoms.
a Hover your mouse over each critical symptom to identify the metric used.
b To view only the symptoms that affect the cluster, enter cluster in the quick filter text box.
When you hover over Cluster Compute Resource Time Remaining is critically low, the metricBadge|Time Remaining with committed projects (%) appears. You notice that its value is less thanor equal to zero, which caused the capacity symptom to trigger and generate an alert on USA-Cluster.
4 Click the Timeline tab to review the triggered symptoms, alerts, and events that occurred on USA-Cluster over time, and identify when the problems occurred.
a On the toolbar, click Select Event Type.
b Click Date Controls and select Last 7 Days.
Several events appear in red.
c Hover your mouse over each event to view the details.
d To display the events that occurred on the cluster's data center, click Show Ancestor Events, andselect Datacenter.
Warning events for the data center appear in yellow.
Chapter 1 Monitoring Objects in Your Managed Environment by Using vRealize Operations Manager
VMware, Inc. 25
e Hover your mouse over the warning events.
You notice that the density is starting to get low, and that a hard threshold violation occurred onthe data center late in the evening. The hard threshold violation shows that the Badge|Densitymetric value was under the acceptable value of 25, and that the violation triggered with a value of14.89.
f To view the affected child objects, click Show Descendant Events and select Host System.
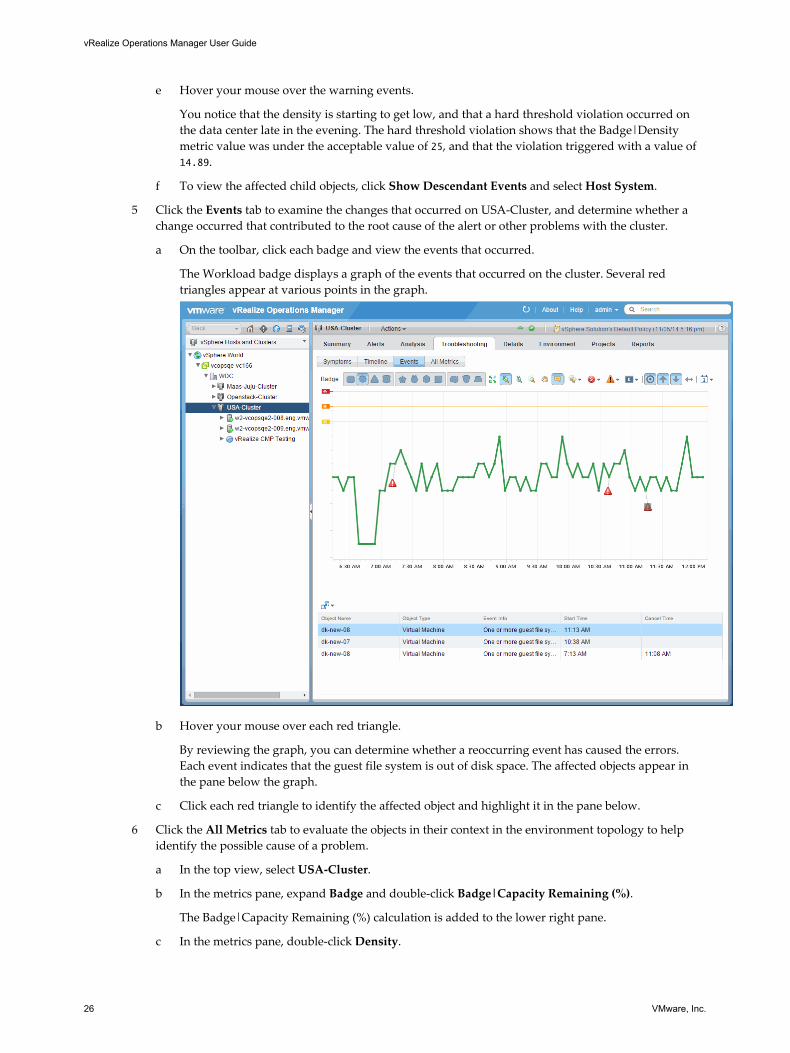
5 Click the Events tab to examine the changes that occurred on USA-Cluster, and determine whether achange occurred that contributed to the root cause of the alert or other problems with the cluster.
a On the toolbar, click each badge and view the events that occurred.
The Workload badge displays a graph of the events that occurred on the cluster. Several redtriangles appear at various points in the graph.
b Hover your mouse over each red triangle.
By reviewing the graph, you can determine whether a reoccurring event has caused the errors.Each event indicates that the guest file system is out of disk space. The affected objects appear inthe pane below the graph.
c Click each red triangle to identify the affected object and highlight it in the pane below.
6 Click the All Metrics tab to evaluate the objects in their context in the environment topology to helpidentify the possible cause of a problem.
a In the top view, select USA-Cluster.
b In the metrics pane, expand Badge and double-click Badge|Capacity Remaining (%).
The Badge|Capacity Remaining (%) calculation is added to the lower right pane.
c In the metrics pane, double-click Density.
vRealize Operations Manager User Guide
26 VMware, Inc.
d In the metrics pane, double-click Workload.
e On the toolbar, click Date Controls and select Last 7 Days.
The metric chart indicates that the capacity for the cluster remained at a steady level for the pastweek, but that the cluster density increased to its maximum value in the last several days. TheBadge|Workload (%) calculation displays the workload extremes that correspond to the densityproblem.
You have analyzed the symptoms, timeline, events, and metrics related to the problems on your cluster, anddetermined that the heavy workload on the cluster has decreased the cluster density in the last several days,which indicates that the cluster is starting to run out of capacity.
What to do next
Examine the Details views and heatmaps to interpret the properties, metrics, and alerts to look for trendsand spikes that occur in the resources for your objects, the distributions of resources across your objects, anddata maps to examine the use of various resource types across your objects. See “User Scenario: Examine theEnvironment Details,” on page 27.
User Scenario: Examine the Environment DetailsExamine the status of your objects in the views and heatmaps so that you can identify the trends and spikesthat are occurring with the resources on your cluster and objects. To determine whether any deviations haveoccurred, you can display overall summaries for an object, such as for the cluster disk space usagebreakdown.
To examine the problems with your USA-Cluster further, use the Details views to display the metrics andcollected capacity data for your cluster. Each view includes specific metrics data collected from your objects.For example, trend views use data collected from objects over time to generate trends and forecasts forresources such as memory, CPU, disk space, and so on.
Use the heatmaps to examine the capacity levels on the cluster, host systems, and virtual machines. Theblock sizes and colors are based on the metrics selected in the heatmap configuration. For example, theheatmap that shows the most abnormal workload for virtual machines is sized by the Badge|Workload (%)metric, and is colored by the Badge|Anomaly metric.
Prerequisites
Use the Troubleshooting tabs to look for root causes. See “User Scenario: Troubleshoot Problems with aHost System,” on page 25
Procedure
1 Click Environment > vSphere Hosts and Clusters > USA-Cluster.
2 Examine the detailed information about USA-Cluster in the views.
a Click the Details tab and click Views.
The views provide multiple ways to look at different types of collected data by using trends, lists,distributions, and summaries.
b In the search text box, enter capacity.
The list filters and displays the capacity views for clusters and other objects.
c Click the view named Cluster Capacity Risk Forecast, and examine the number of virtualmachines for USA-Cluster in the lower pane.
Even though the USA-Cluster has two host systems and 30 virtual machines, no capacity exists.
Chapter 1 Monitoring Objects in Your Managed Environment by Using vRealize Operations Manager
VMware, Inc. 27
3 Examine the host systems in the cluster, and reclaim capacity from the descendant virtual machines.
a Click the Analysis tab, and click Capacity Remaining.
b In the inventory tree, expand USA-Cluster, and click each of the host systems.
The host system named w2-vcopsqe2-009 is in a critical state, with no capacity remaining.
c In the lower pane, expand Memory, and expand Allocation.
The stress free value is zero, and the amount of memory available is zero, which indicates that thecapacity of the host system has been depleted.
d Click the Details tab, and click Views, and click the Virtual Machine Reclaimable Capacity view.
e In the lower pane, click the title of the Reclaimable Memory column to sort the list of virtualmachines so that the largest amount of reclaimable capacity is on top.
f To reclaim capacity from several virtual machines, click to the right of the first virtual machinename, then press Shift and click to the right of the last virtual machine that has capacity to reclaim.
The virtual machines that have reclaimable capacity are highlighted.
g Click the gear icon, and select Set CPU Count and Memory for VM.
h Click the Current CPU column title to sort the list according to the highest number of CPUs.
Based on the actual use of the virtual machines listed, the New CPU column recommends fewerCPUs for each virtual machine.
i Click the check box next to each virtual machine that has a recommended lower CPU count, andclick OK.
By reducing the number of CPUs for each virtual machine, you free up capacity on your hostsystem, and improve the USA-Cluster capacity and workload.
4 Examine the heatmaps for the host system and virtual machine objects in USA-Cluster.
a In the inventory tree, click USA-Cluster.
b Click Details, click Heatmaps, and click through the list of heatmap views.
c Click Which VMs currently have the highest CPU demand and contention?
The heatmap displays blocks that represent the objects in USA-Cluster. The block for a virtualmachine appears in red, which indicates that it has a critical problem.
d Hover over the red block and examine the details.
The cluster, host system, and virtual machine names appear, with links to more information aboutthe object.
e Click Show Sparkline to display the activity trend on the virtual machine.
f Click each of the Details links to display more information.
To verify that freeing up memory on the virtual machines has improved the workload of the host systemand the cluster, you can now examine the status of the host system and cluster.
You used views and heatmaps to evaluate the status of your objects and identify trends and spikes, and freeup capacity for your host system and USA-Cluster. To further narrow in on problems, you can examine theother views and heatmaps. You can also create your own views and heatmaps.
What to do next
Examine the badge status for the objects in your environment hierarchy to determine which objects are in acritical state, and examine the object relationships to determine whether a problem on one object is affectingone or more other objects. See “User Scenario: Examine the Environment Relationships,” on page 29.
vRealize Operations Manager User Guide
28 VMware, Inc.
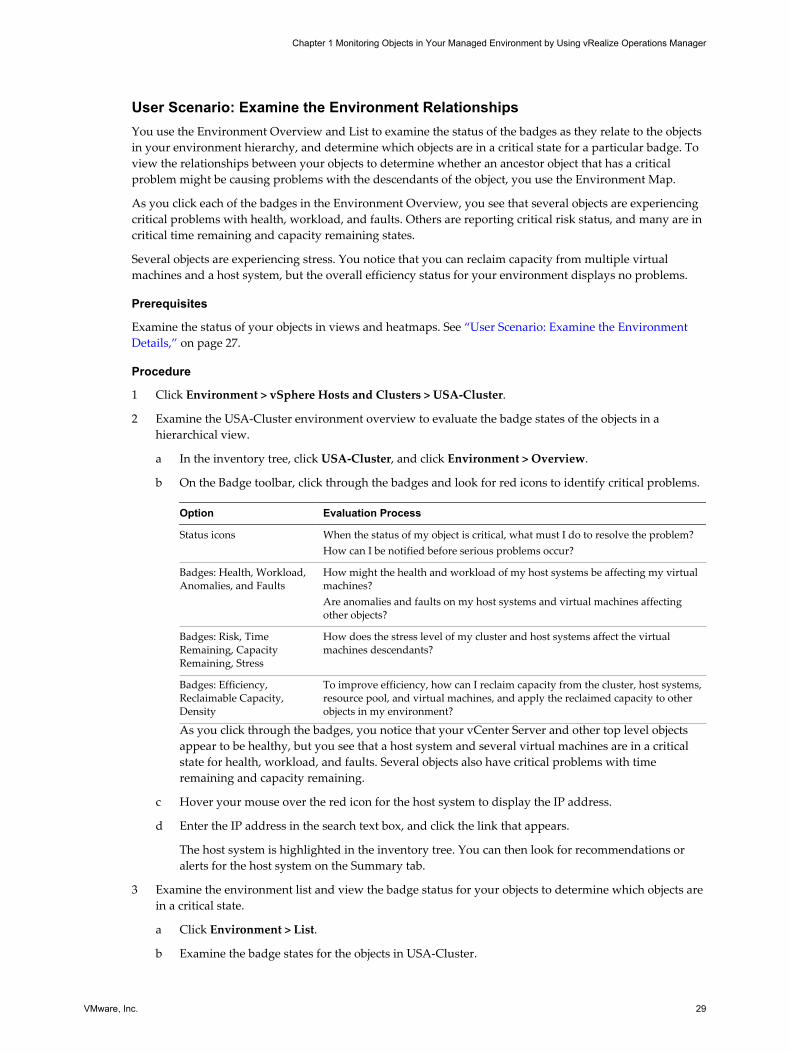
User Scenario: Examine the Environment RelationshipsYou use the Environment Overview and List to examine the status of the badges as they relate to the objectsin your environment hierarchy, and determine which objects are in a critical state for a particular badge. Toview the relationships between your objects to determine whether an ancestor object that has a criticalproblem might be causing problems with the descendants of the object, you use the Environment Map.
As you click each of the badges in the Environment Overview, you see that several objects are experiencingcritical problems with health, workload, and faults. Others are reporting critical risk status, and many are incritical time remaining and capacity remaining states.
Several objects are experiencing stress. You notice that you can reclaim capacity from multiple virtualmachines and a host system, but the overall efficiency status for your environment displays no problems.
Prerequisites
Examine the status of your objects in views and heatmaps. See “User Scenario: Examine the EnvironmentDetails,” on page 27.
Procedure
1 Click Environment > vSphere Hosts and Clusters > USA-Cluster.
2 Examine the USA-Cluster environment overview to evaluate the badge states of the objects in ahierarchical view.
a In the inventory tree, click USA-Cluster, and click Environment > Overview.
b On the Badge toolbar, click through the badges and look for red icons to identify critical problems.
Option Evaluation Process
Status icons When the status of my object is critical, what must I do to resolve the problem?How can I be notified before serious problems occur?
Badges: Health, Workload,Anomalies, and Faults
How might the health and workload of my host systems be affecting my virtualmachines?Are anomalies and faults on my host systems and virtual machines affectingother objects?
Badges: Risk, TimeRemaining, CapacityRemaining, Stress
How does the stress level of my cluster and host systems affect the virtualmachines descendants?
Badges: Efficiency,Reclaimable Capacity,Density
To improve efficiency, how can I reclaim capacity from the cluster, host systems,resource pool, and virtual machines, and apply the reclaimed capacity to otherobjects in my environment?
As you click through the badges, you notice that your vCenter Server and other top level objectsappear to be healthy, but you see that a host system and several virtual machines are in a criticalstate for health, workload, and faults. Several objects also have critical problems with timeremaining and capacity remaining.
c Hover your mouse over the red icon for the host system to display the IP address.
d Enter the IP address in the search text box, and click the link that appears.
The host system is highlighted in the inventory tree. You can then look for recommendations oralerts for the host system on the Summary tab.
3 Examine the environment list and view the badge status for your objects to determine which objects arein a critical state.
a Click Environment > List.
b Examine the badge states for the objects in USA-Cluster.
Chapter 1 Monitoring Objects in Your Managed Environment by Using vRealize Operations Manager
VMware, Inc. 29
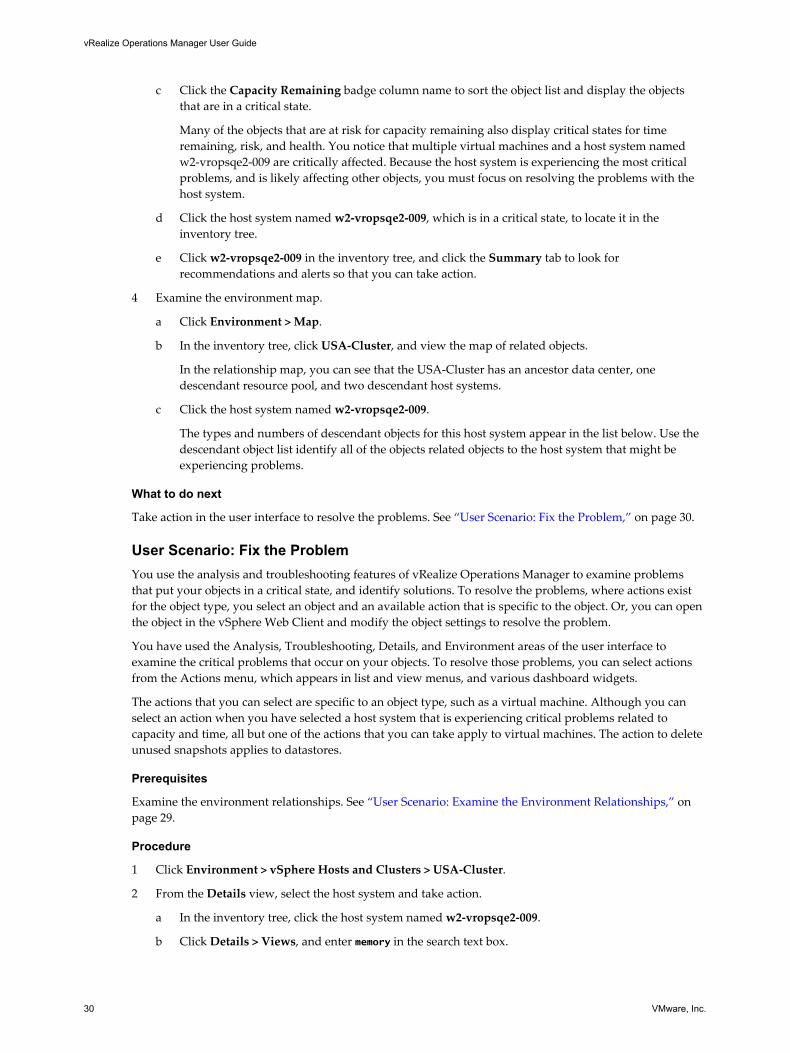
c Click the Capacity Remaining badge column name to sort the object list and display the objectsthat are in a critical state.
Many of the objects that are at risk for capacity remaining also display critical states for timeremaining, risk, and health. You notice that multiple virtual machines and a host system namedw2-vropsqe2-009 are critically affected. Because the host system is experiencing the most criticalproblems, and is likely affecting other objects, you must focus on resolving the problems with thehost system.
d Click the host system named w2-vropsqe2-009, which is in a critical state, to locate it in theinventory tree.
e Click w2-vropsqe2-009 in the inventory tree, and click the Summary tab to look forrecommendations and alerts so that you can take action.
4 Examine the environment map.
a Click Environment > Map.
b In the inventory tree, click USA-Cluster, and view the map of related objects.
In the relationship map, you can see that the USA-Cluster has an ancestor data center, onedescendant resource pool, and two descendant host systems.
c Click the host system named w2-vropsqe2-009.
The types and numbers of descendant objects for this host system appear in the list below. Use thedescendant object list identify all of the objects related objects to the host system that might beexperiencing problems.
What to do next
Take action in the user interface to resolve the problems. See “User Scenario: Fix the Problem,” on page 30.
User Scenario: Fix the ProblemYou use the analysis and troubleshooting features of vRealize Operations Manager to examine problemsthat put your objects in a critical state, and identify solutions. To resolve the problems, where actions existfor the object type, you select an object and an available action that is specific to the object. Or, you can openthe object in the vSphere Web Client and modify the object settings to resolve the problem.
You have used the Analysis, Troubleshooting, Details, and Environment areas of the user interface toexamine the critical problems that occur on your objects. To resolve those problems, you can select actionsfrom the Actions menu, which appears in list and view menus, and various dashboard widgets.
The actions that you can select are specific to an object type, such as a virtual machine. Although you canselect an action when you have selected a host system that is experiencing critical problems related tocapacity and time, all but one of the actions that you can take apply to virtual machines. The action to deleteunused snapshots applies to datastores.
Prerequisites
Examine the environment relationships. See “User Scenario: Examine the Environment Relationships,” onpage 29.
Procedure
1 Click Environment > vSphere Hosts and Clusters > USA-Cluster.
2 From the Details view, select the host system and take action.
a In the inventory tree, click the host system named w2-vropsqe2-009.
b Click Details > Views, and enter memory in the search text box.
vRealize Operations Manager User Guide
30 VMware, Inc.
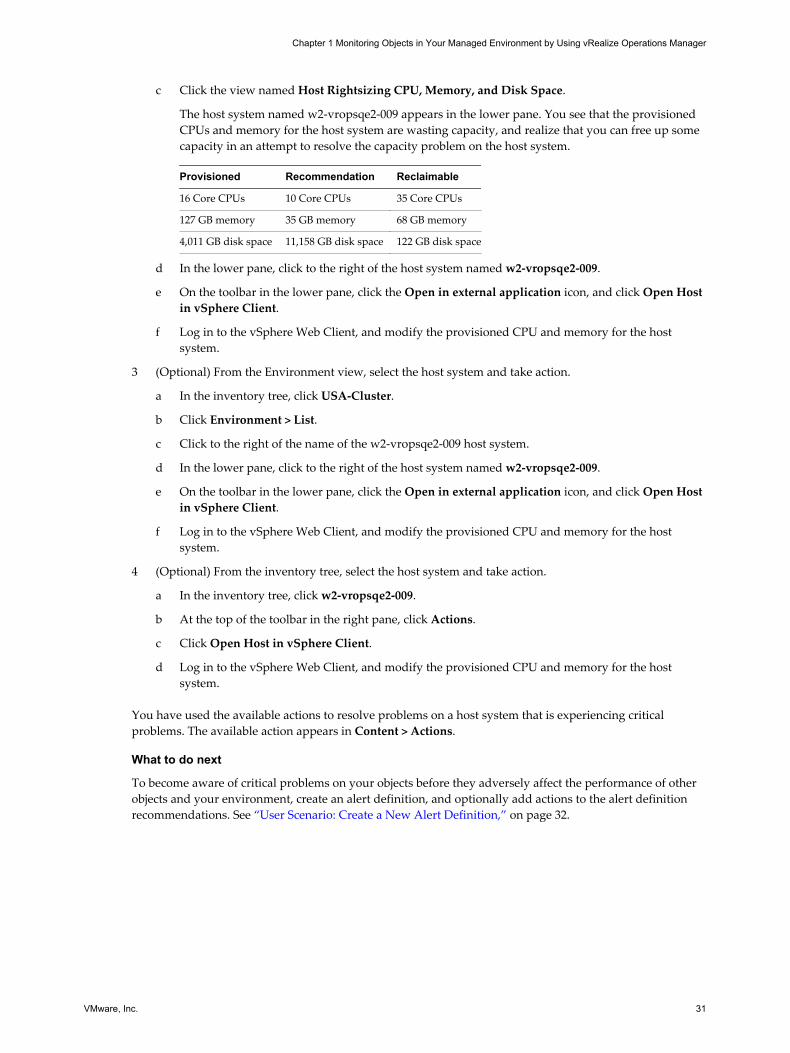
c Click the view named Host Rightsizing CPU, Memory, and Disk Space.
The host system named w2-vropsqe2-009 appears in the lower pane. You see that the provisionedCPUs and memory for the host system are wasting capacity, and realize that you can free up somecapacity in an attempt to resolve the capacity problem on the host system.
Provisioned Recommendation Reclaimable
16 Core CPUs 10 Core CPUs 35 Core CPUs
127 GB memory 35 GB memory 68 GB memory
4,011 GB disk space 11,158 GB disk space 122 GB disk space
d In the lower pane, click to the right of the host system named w2-vropsqe2-009.
e On the toolbar in the lower pane, click the Open in external application icon, and click Open Hostin vSphere Client.
f Log in to the vSphere Web Client, and modify the provisioned CPU and memory for the hostsystem.
3 (Optional) From the Environment view, select the host system and take action.
a In the inventory tree, click USA-Cluster.
b Click Environment > List.
c Click to the right of the name of the w2-vropsqe2-009 host system.
d In the lower pane, click to the right of the host system named w2-vropsqe2-009.
e On the toolbar in the lower pane, click the Open in external application icon, and click Open Hostin vSphere Client.
f Log in to the vSphere Web Client, and modify the provisioned CPU and memory for the hostsystem.
4 (Optional) From the inventory tree, select the host system and take action.
a In the inventory tree, click w2-vropsqe2-009.
b At the top of the toolbar in the right pane, click Actions.
c Click Open Host in vSphere Client.
d Log in to the vSphere Web Client, and modify the provisioned CPU and memory for the hostsystem.
You have used the available actions to resolve problems on a host system that is experiencing criticalproblems. The available action appears in Content > Actions.
What to do next
To become aware of critical problems on your objects before they adversely affect the performance of otherobjects and your environment, create an alert definition, and optionally add actions to the alert definitionrecommendations. See “User Scenario: Create a New Alert Definition,” on page 32.
Chapter 1 Monitoring Objects in Your Managed Environment by Using vRealize Operations Manager
VMware, Inc. 31
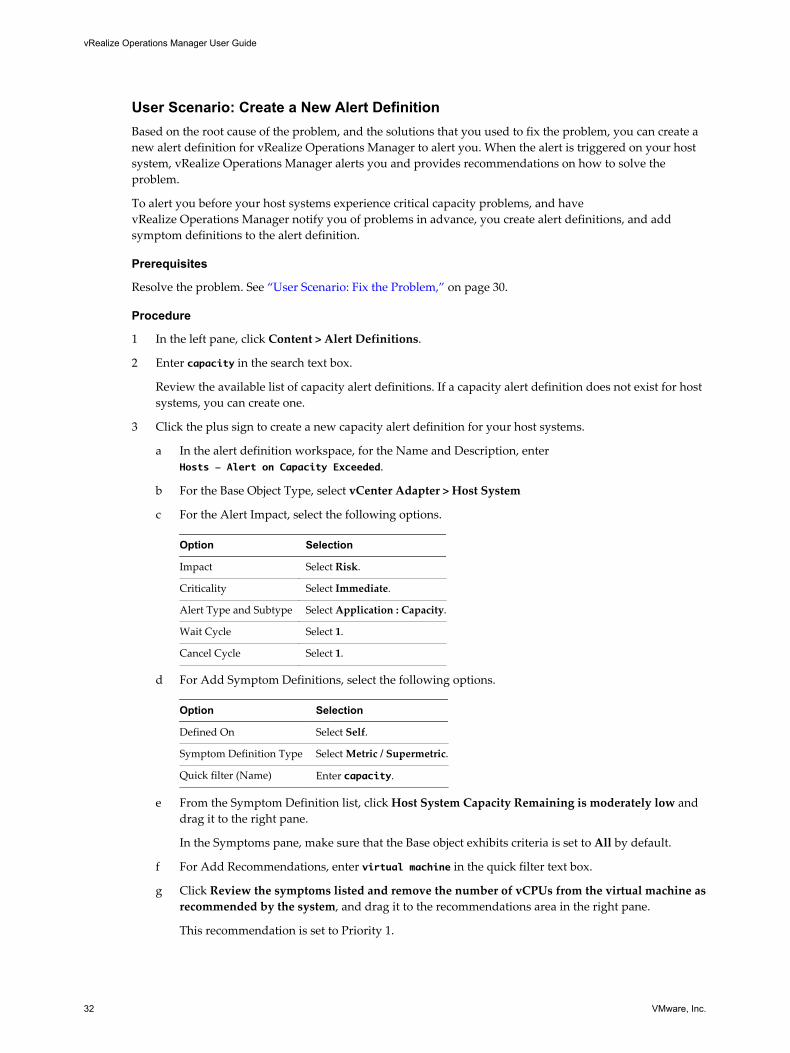
User Scenario: Create a New Alert DefinitionBased on the root cause of the problem, and the solutions that you used to fix the problem, you can create anew alert definition for vRealize Operations Manager to alert you. When the alert is triggered on your hostsystem, vRealize Operations Manager alerts you and provides recommendations on how to solve theproblem.
To alert you before your host systems experience critical capacity problems, and havevRealize Operations Manager notify you of problems in advance, you create alert definitions, and addsymptom definitions to the alert definition.
Prerequisites
Resolve the problem. See “User Scenario: Fix the Problem,” on page 30.
Procedure
1 In the left pane, click Content > Alert Definitions.
2 Enter capacity in the search text box.
Review the available list of capacity alert definitions. If a capacity alert definition does not exist for hostsystems, you can create one.
3 Click the plus sign to create a new capacity alert definition for your host systems.
a In the alert definition workspace, for the Name and Description, enterHosts - Alert on Capacity Exceeded.
b For the Base Object Type, select vCenter Adapter > Host System
c For the Alert Impact, select the following options.
Option Selection
Impact Select Risk.
Criticality Select Immediate.
Alert Type and Subtype Select Application : Capacity.
Wait Cycle Select 1.
Cancel Cycle Select 1.
d For Add Symptom Definitions, select the following options.
Option Selection
Defined On Select Self.
Symptom Definition Type Select Metric / Supermetric.
Quick filter (Name) Enter capacity.
e From the Symptom Definition list, click Host System Capacity Remaining is moderately low anddrag it to the right pane.
In the Symptoms pane, make sure that the Base object exhibits criteria is set to All by default.
f For Add Recommendations, enter virtual machine in the quick filter text box.
g Click Review the symptoms listed and remove the number of vCPUs from the virtual machine asrecommended by the system, and drag it to the recommendations area in the right pane.
This recommendation is set to Priority 1.
vRealize Operations Manager User Guide
32 VMware, Inc.
4 Click Save to save the alert definition.
Your new alert appears in the list of alert definitions.
You have added an alert definition to have vRealize Operations Manager alert you when the capacity ofyour host systems begins to run out.
What to do next
Create dashboards and views for future investigation. See “User Scenario: Create Dashboards and Views,”on page 33.
User Scenario: Create Dashboards and ViewsTo help you investigate and troubleshoot problems with your cluster and host systems that might occur inthe future, you can create dashboards and views that apply the troubleshooting tools and solutions that youused to research and solve the problems with your host system, to make those troubleshooting tools andsolutions available for future use.
To readily view the status of your cluster and host systems when your CIO asks you about their health, youcan use the decision support dashboards on the vRealize Operations Manager Home page. For example, youcan:
n Use the vSphere Clusters dashboard to view the utilization index, CPU demand, and memory use foryour clusters. This dashboard also tracks the net use and disk I/O operations.
n Use vSphere Cluster Configuration Summary dashboard to track the high availability status, and otherconfiguration items.
n Use the vSphere Hosts Overview to examine the capacity levels of your cluster, host systems, andvirtual machines.
n Use the Health of Host Systems dashboard to view the active alert list, capacity metric chart andheatmap for your host system.
Or, you might need to create your own dashboards to track the status of your clusters and host systems.
If you work in a Network Operations Center environment and have multiple monitors, you can runmultiple instances of vRealize Operations Manager, and dedicate a monitor to each specific dashboard sothat you can visually track the status of your objects.
Prerequisites
Create an alert definition to alert you when the capacity of your host system is getting low. See “UserScenario: Create a New Alert Definition,” on page 32.
Procedure
1 In the left pane, click Home.
2 Click Dashboard List, and look through the list of existing dashboards to determine whether you canuse the cluster and host system dashboards to track your clusters and host systems.
3 Click the Health of Host Systems dashboard, and review the widgets included on it.
The inclusion of the Object List, Alert List, Metric Picker, Metric Chart, Heatmap, and Top-N widgetswould allow you to easily peruse the status of the host systems that you select in the Object List widget.This dashboard has the widget interaction configured so that the object you select in the Object Listwidget is the object for which the other widgets display data.
Chapter 1 Monitoring Objects in Your Managed Environment by Using vRealize Operations Manager
VMware, Inc. 33
4 Create and configure a new dashboard that has widgets to monitor the health of your host systems andgenerate alerts.
a Above the dashboard view, click Actions and select Create Dashboard.
b In the New Dashboard workspace, for the Dashboard Name, enter Health of Host Systems, andleave the other default settings.
c In the Widget List workspace, add the Object List widget and configure it to display host systemobjects.
d Add the Alert List widget to the dashboard, and configure it to display capacity alerts when thecapacity of your host systems becomes an immediate risk.
e In the Widget Interactions workspace, for each widget listed, select the Object List widget as theprovider to drive the data to the other widgets, and click Apply Interactions.
f In the Dashboard Navigation workspace, select the dashboards that receive data from the selectedwidgets, and click Apply Navigations.
After vRealize Operations Manager collects data, if a problem occurs with the capacity of your hostsystems, the Alert List widget on your new dashboard displays the alerts that are configured for yourhost systems.
What to do next
Prepare to share information with others, plan for growth and new projects, and use policies tocontinuously monitor all of the objects in your environment. To plan for growth and new projects, see Chapter 2, “Planning the Resources for Your Managed Environment by Using vRealize OperationsManager,” on page 87. To generate reports, and create and customize policies, see thevRealize Operations Manager Customization and Administration Guide.
Monitoring and Responding to AlertsAlerts indicate a problem in your environment. Alerts are generated when the collected data for an object iscompared to alert definitions for that object type and the defined symptoms are true. When an alert isgenerated, you are presented with the triggering symptoms, so that you can evaluate the object in yourenvironment, and with recommendations for how to resolve the alert.
Alerts notify you when an object or group of objects are exhibiting symptoms that are unfavorable for yourenvironment. By monitoring and responding to alerts, you stay aware of problems and can react to them ina timely fashion.
Generated alerts drive the status of the top level badges, Health, Risk, and Efficiency.
In addition to responding to alerts, you can generally respond to the status of badges for objects in yourenvironment.
You cannot assign alerts to vRealize Operations Manager users. Your users must take ownership of an alert.
Monitoring Alerts in vRealize Operations ManagerYou can monitor your environment for generated alerts in several areas in vRealize Operations Manager.The alerts are generated when the symptoms in the alert definition are triggered, letting you know when theobjects in your environment are not operating within the parameters you defined as acceptable.
Generated alerts appear in many areas of vRealize Operations Manager so that you can monitor andrespond to problems in your environment.
vRealize Operations Manager User Guide
34 VMware, Inc.
AlertsAlerts are classified as Health, Risk, or Efficiency. Health alerts indicate problems that require immediateattention. Risk alerts indicate problems that must be addressed in the near future, before the problemsbecome immediate health problems. Efficiency alerts indicate areas where you can reclaim wasted space orimprove the performance of objects in your environment.
You can monitor the alerts for your environment in the following locations.
n Alerts
n Health
n Risk
n Efficiency
You can monitor alerts for a selected object in the following locations.
n Alert Details, including the Summary, Impacted Object Symptoms, Timeline, Relationships, andMetric Charts tabs
n Summary tab
n Alerts tab
n Troubleshooting tab
n Custom dashboards
n Alert notifications
Working with AlertsAlerts indicate a problems that must be resolved so that triggering conditions no longer exist and the alert iscanceled. Suggested resolutions are provided as recommendations so that you can approach the problemwith solutions.
As you monitor alerts, you can take ownership, suspend, or manually cancel alerts.
When you cancel an alert, the alert and any symptoms of type fault, message event, or metric event arecanceled. You cannot manually cancel other types of symptoms. If the alert was triggered by a faultsymptom, message event symptom or metric event symptom, then the alert is effectively canceled. If thealert was triggered by a metric symptom or property symptom, a new alert might be created for the sameconditions in the next few minutes.
The correct way to remove an alert is to address the underlying conditions that triggered the symptoms andgenerated the alert.
Migrated AlertsIf you migrated alerts from a previous version of vRealize Configuration Manager, the alerts are listed in theoverview with a cancelled status, but alert details are not available.
User Scenario: Monitor and Process Alerts in vRealize Operations ManagerAlerts in vRealize Operations Manager notify you when objects in your environment have a problem. Thisscenario illustrates one way that you can monitor and process alerts for the objects for which you areresponsible.
An alert is generated when one or more of the alert symptoms are triggered. Depending on how the alert isconfigured, the alert is generated when one symptom is triggered or when all of the symptoms aretriggered.
Chapter 1 Monitoring Objects in Your Managed Environment by Using vRealize Operations Manager
VMware, Inc. 35
As the alerts are generated, you must process the alerts based on the negative affect they have on objects inyour environment. To do this, you start with Health alerts, and process them based on criticality.
As a virtual infrastructure administrator, you review the alerts at least twice a day. As part of yourevaluation process in this scenario, you encounter the following alerts:
n Virtual machine has unexpected high CPU workload
n Host has memory contention that a few virtual machines cause
n Cluster has many virtual machines that have memory contention because of memory compression,ballooning, or swapping
Procedure
1 In the left pane of vRealize Operations Manager, click the Alerts icon.
2 In the left pane, click the Health alert lists.
Health alerts are alerts that require immediate attention.
3 Place your cursor in the Criticality column, click the down arrow, and select Sort Descending.
The list is now in order of criticality, with the Critical alerts at the top of the list, followed by Immediate,Warning, and Info alerts.
4 Review the alerts by name, the object on which it was triggered, the object type, and the time at whichthe alert was generated.
For example, do you recognize any of the objects as objects that you are responsible for managing? Doyou know that the fix that you will implement in the next hour will fix any of the alerts that areaffecting the Health status of the object? Do you know that some of your alerts cannot be resolved atthis time because of resource constraints?
5 To indicate to other administrators or engineers that you are taking ownership of the Virtual machinehas unexpected high CPU workload alerts, hold the Ctrl key, click the selected alerts, and click TakeOwnership.
The Owner column updates with your user name. You can only take ownership of alerts, you cannotassign them to other users.
6 To take ownership and temporarily exclude the alert from affecting the state of the object, select theHost has memory contention caused by a few virtual machines alert in the list and click Suspend.
a Enter 60 to suspend the alert of an hour.
b Click OK.
The alert is suspended for 60 minutes and you are listed as the owner in the alert list. If it is not resolvedin an hour, it returns to an active state.
7 Select the row that contains the Cluster has many Virtual Machines that have memory contentiondue to memory compression, ballooning or swapping alert and click Cancel to remove the alert fromthe list.
This alert is a known problem that you cannot resolve until the new hardware arrives.
The alert is removed from the alert list, but the underlying condition is not resolved by this action. Thesymptoms in this alert are based on metrics, so the alert will be generated during the next collection andanalysis cycle. This pattern continues until you resolve the underlying hardware and workloaddistribution issues.
You processed the critical health alerts and took ownership of the ones to resolve or troubleshoot further.
vRealize Operations Manager User Guide
36 VMware, Inc.
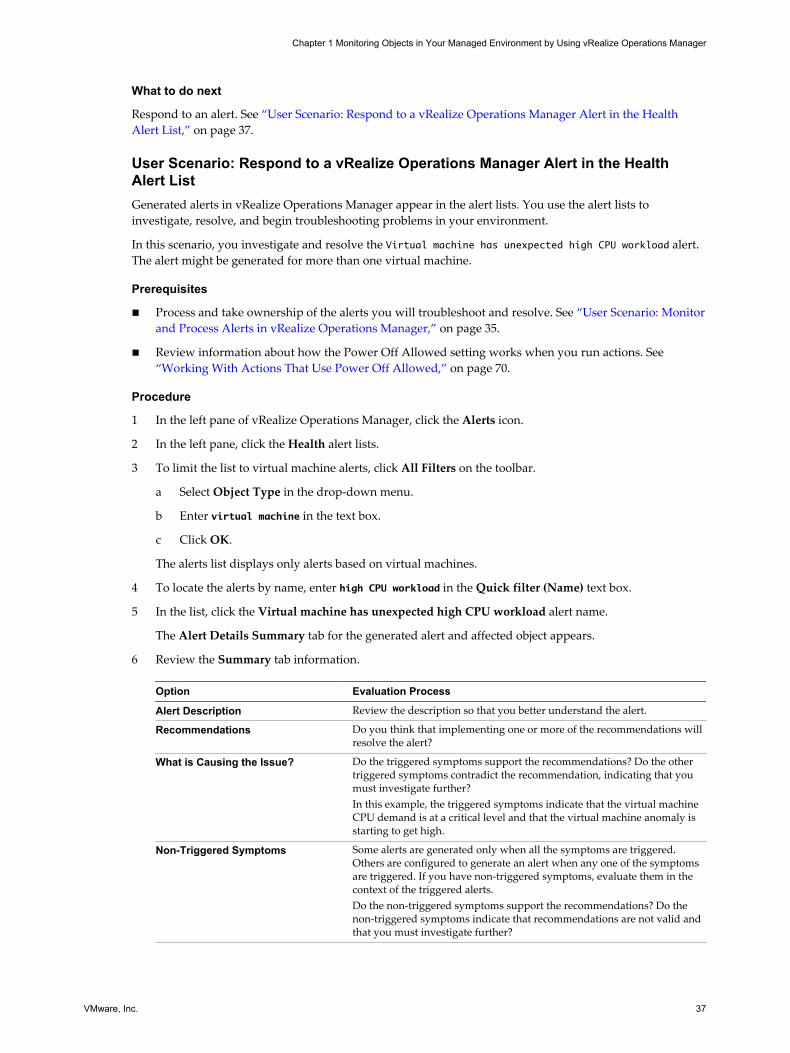
What to do next
Respond to an alert. See “User Scenario: Respond to a vRealize Operations Manager Alert in the HealthAlert List,” on page 37.
User Scenario: Respond to a vRealize Operations Manager Alert in the HealthAlert ListGenerated alerts in vRealize Operations Manager appear in the alert lists. You use the alert lists toinvestigate, resolve, and begin troubleshooting problems in your environment.
In this scenario, you investigate and resolve the Virtual machine has unexpected high CPU workload alert.The alert might be generated for more than one virtual machine.
Prerequisites
n Process and take ownership of the alerts you will troubleshoot and resolve. See “User Scenario: Monitorand Process Alerts in vRealize Operations Manager,” on page 35.
n Review information about how the Power Off Allowed setting works when you run actions. See “Working With Actions That Use Power Off Allowed,” on page 70.
Procedure
1 In the left pane of vRealize Operations Manager, click the Alerts icon.
2 In the left pane, click the Health alert lists.
3 To limit the list to virtual machine alerts, click All Filters on the toolbar.
a Select Object Type in the drop-down menu.
b Enter virtual machine in the text box.
c Click OK.
The alerts list displays only alerts based on virtual machines.
4 To locate the alerts by name, enter high CPU workload in the Quick filter (Name) text box.
5 In the list, click the Virtual machine has unexpected high CPU workload alert name.
The Alert Details Summary tab for the generated alert and affected object appears.
6 Review the Summary tab information.
Option Evaluation Process
Alert Description Review the description so that you better understand the alert.
Recommendations Do you think that implementing one or more of the recommendations willresolve the alert?
What is Causing the Issue? Do the triggered symptoms support the recommendations? Do the othertriggered symptoms contradict the recommendation, indicating that youmust investigate further?In this example, the triggered symptoms indicate that the virtual machineCPU demand is at a critical level and that the virtual machine anomaly isstarting to get high.
Non-Triggered Symptoms Some alerts are generated only when all the symptoms are triggered.Others are configured to generate an alert when any one of the symptomsare triggered. If you have non-triggered symptoms, evaluate them in thecontext of the triggered alerts.Do the non-triggered symptoms support the recommendations? Do thenon-triggered symptoms indicate that recommendations are not valid andthat you must investigate further?
Chapter 1 Monitoring Objects in Your Managed Environment by Using vRealize Operations Manager
VMware, Inc. 37
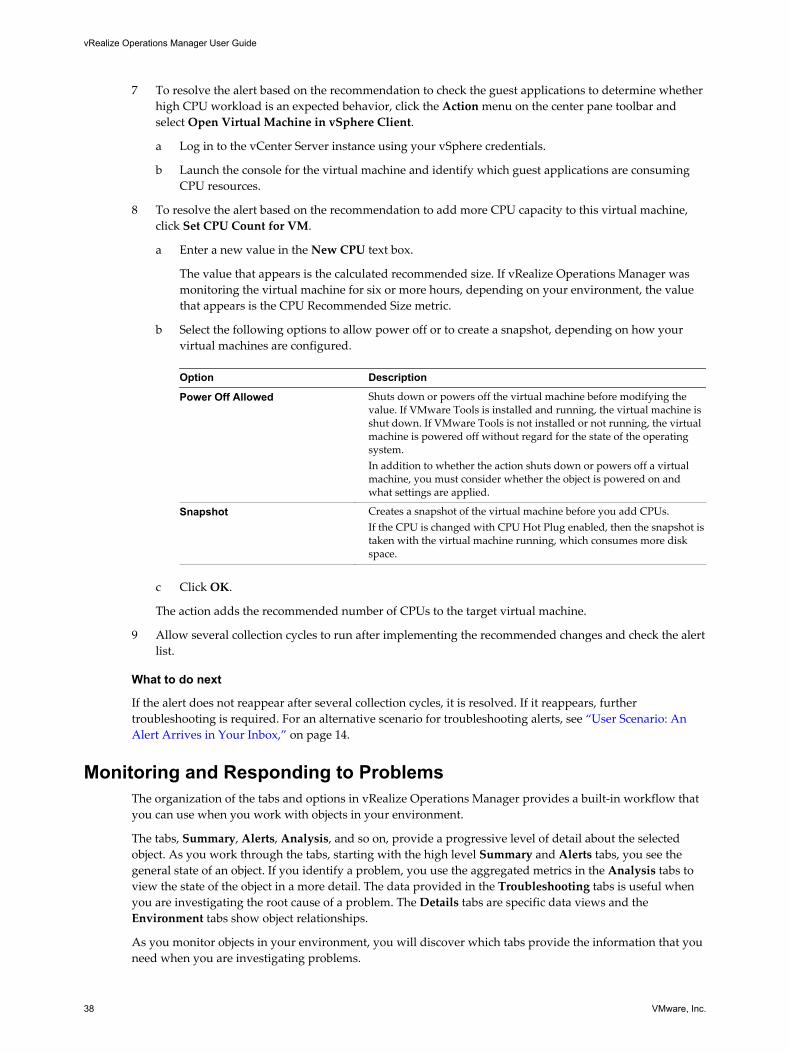
7 To resolve the alert based on the recommendation to check the guest applications to determine whetherhigh CPU workload is an expected behavior, click the Action menu on the center pane toolbar andselect Open Virtual Machine in vSphere Client.
a Log in to the vCenter Server instance using your vSphere credentials.
b Launch the console for the virtual machine and identify which guest applications are consumingCPU resources.
8 To resolve the alert based on the recommendation to add more CPU capacity to this virtual machine,click Set CPU Count for VM.
a Enter a new value in the New CPU text box.
The value that appears is the calculated recommended size. If vRealize Operations Manager wasmonitoring the virtual machine for six or more hours, depending on your environment, the valuethat appears is the CPU Recommended Size metric.
b Select the following options to allow power off or to create a snapshot, depending on how yourvirtual machines are configured.
Option Description
Power Off Allowed Shuts down or powers off the virtual machine before modifying thevalue. If VMware Tools is installed and running, the virtual machine isshut down. If VMware Tools is not installed or not running, the virtualmachine is powered off without regard for the state of the operatingsystem.In addition to whether the action shuts down or powers off a virtualmachine, you must consider whether the object is powered on andwhat settings are applied.
Snapshot Creates a snapshot of the virtual machine before you add CPUs.If the CPU is changed with CPU Hot Plug enabled, then the snapshot istaken with the virtual machine running, which consumes more diskspace.
c Click OK.
The action adds the recommended number of CPUs to the target virtual machine.
9 Allow several collection cycles to run after implementing the recommended changes and check the alertlist.
What to do next
If the alert does not reappear after several collection cycles, it is resolved. If it reappears, furthertroubleshooting is required. For an alternative scenario for troubleshooting alerts, see “User Scenario: AnAlert Arrives in Your Inbox,” on page 14.
Monitoring and Responding to ProblemsThe organization of the tabs and options in vRealize Operations Manager provides a built-in workflow thatyou can use when you work with objects in your environment.
The tabs, Summary, Alerts, Analysis, and so on, provide a progressive level of detail about the selectedobject. As you work through the tabs, starting with the high level Summary and Alerts tabs, you see thegeneral state of an object. If you identify a problem, you use the aggregated metrics in the Analysis tabs toview the state of the object in a more detail. The data provided in the Troubleshooting tabs is useful whenyou are investigating the root cause of a problem. The Details tabs are specific data views and theEnvironment tabs show object relationships.
As you monitor objects in your environment, you will discover which tabs provide the information that youneed when you are investigating problems.
vRealize Operations Manager User Guide
38 VMware, Inc.
Evaluating Object Summary InformationThe Summary tab that is associated with the other object tabs summarizes Heath, Risk, and Efficiency alertbadges for the selected object and displays the top alerts that lead to the current state. It also displays the topalerts for the descendants of the selected object in the current navigation hierarchy.
As an overview of alerts for an object, object group, or application, you use this tab to evaluate the affect thatalerts are having on an object and to begin troubleshooting problems.
Summary Tab Alert TypesThe Health, Risk, and Efficiency badge states are based on the number and criticality of the generated alertsfor the selected object.
n Health alerts indicate problems that affect the health of your environment and require immediateattention to ensure that service to your customers is not affected.
n Risk alerts indicate problems that are not immediate threats but should be addressed in the near future.
n Efficiency alerts tell you where you can improve performance or reclaim resources.
Summary Tab for an Object or an Object GroupWhen you are working with a single object, the Top Alerts are the alerts generated for the object and the TopAlerts for Descendants are the alerts generated for any child or other descendant objects in the currentlyselected navigation hierarchy. For example, if you are working with a host object in the vSphere Host andClusters navigation hierarchy, descendants can include virtual machines and datastores.
When you are working with object groups, which can include one object type, such as hosts, or multipleobjects types, such as hosts, virtual machines, and datastores, all the group member objects are descendantsof the group container. The most critical generated alerts for the member objects appear as Top Alerts forDescendants.
For an object group, the only Top Alerts that might be generated are the predefined group population alerts.A group population alert considers the health of all group members and is triggered if the average health isabove the Warning, Immediate, or Critical threshold. If a group population alert is generated, then thebadge score and color is affected by the alert. If a group population alert is not generated, then the badgesare green. This behavior is because an object group is a container for other objects.
Summary Tab and Related HierarchiesThe alerts that appear on the Summary tab for an object can vary depending on the currently selectedhierarchy in the Related Hierarchies in the left pane.
Depending on the selected hierarchy, you see different alerts and relationships on the Summary tab for anobject. The current focus object name is on the center pane title bar, but the descendent alerts depend on therelationships that the highlighted hierarchy defines in the Related Hierarchies list in the upper left pane. Forexample, if you are working with a host object relative to virtual machines in the vSphere Hosts andClusters hierarchy, then descendants commonly include virtual machines and datastores. But if you areworking with the same host as a member of an object group, then any alerts on virtual machines that arealso members of the group do not appear because the host and the virtual machines are considered childrenof the group and peers among each other. In this example, the focus of the Summary tab is the host in thecontext of the group, not the vSphere Hosts and Clusters hierarchy.
Chapter 1 Monitoring Objects in Your Managed Environment by Using vRealize Operations Manager
VMware, Inc. 39
Summary Tab Evaluation TechniquesYou can evaluate the state of objects, starting with the Summary tab, by using one or more of the followingtechniques.
n Select an object or object group, click on the alerts on the Summary tab, and resolve the problems thatthe alert indicates.
n Select an object and examine the information about the current object that is provided in the other tabs.For example, you start on the object Summary tab and compare the generated alerts to the analyticinformation about the object on the Analysis tabs.
n Select an object, review the alerts on the Summary tab, and select other objects, comparing the volumeand types of alerts generated for different objects.
User Scenario: Evaluate the Alert Badges for Objects for avRealize Operations Manager Object GroupIn vRealize Operations Manager, you use alerts on a group to review the summary alert information forhosts and virtual machine descendant objects so that you can see how the state of one object type can affectthe state of the other.
As a network operations center engineer, you are responsible for monitoring a group of hosts and virtualmachines for the sales department. As part of your daily tasks, you check the state of the objects in thegroup to determine if there are any immediate problems or any upcoming problems based on generatedalerts. To do this you start with your group of objects, particularly the host systems in the group, and reviewthe information in the Summary tab.
In this example, the group includes the following object alerts.
n Host has memory contention caused by a few virtual machines is a Health alert
n Virtual Machine has chronic high memory workload is a Risk alert
n Virtual Machine is demanding more CPU than the configured limit is a Risk alert
n Virtual Machine has large disk snapshots is an Efficiency alert
The following method of evaluating alerts on the Summary tab is provided as an example for usingvRealize Operations Manager and is not definitive. Your troubleshooting skills and your knowledge of theparticulars of your environment determine which methods work for you.
Prerequisites
n Create a group that includes virtual machines and the hosts on which they run. For example, Sales DeptVMs and Hosts. For an example of how to create a similar group, see vRealize Operations ManagerCustomization and Administration Guide.
n Review how the Summary tab works with object groups and related hierarchies. See “EvaluatingObject Summary Information,” on page 39.
Procedure
1 In the left pane of vRealize Operations Manager, click the Environment icon.
2 In the center pane, click the Groups tab and click your Sales Dept VMs and Hosts group.
3 To view the alerts for a host and the associated child virtual machines, in the left pane, click HostSystem and click the host name in the lower left pane.
The Summary tab displays the Health, Risk, and Efficiency badges, the top alerts for the host. Becausethe group is still the focus, the alerts for the child virtual machines do not appear in the Top Alerts forDescendants widgets.
vRealize Operations Manager User Guide
40 VMware, Inc.
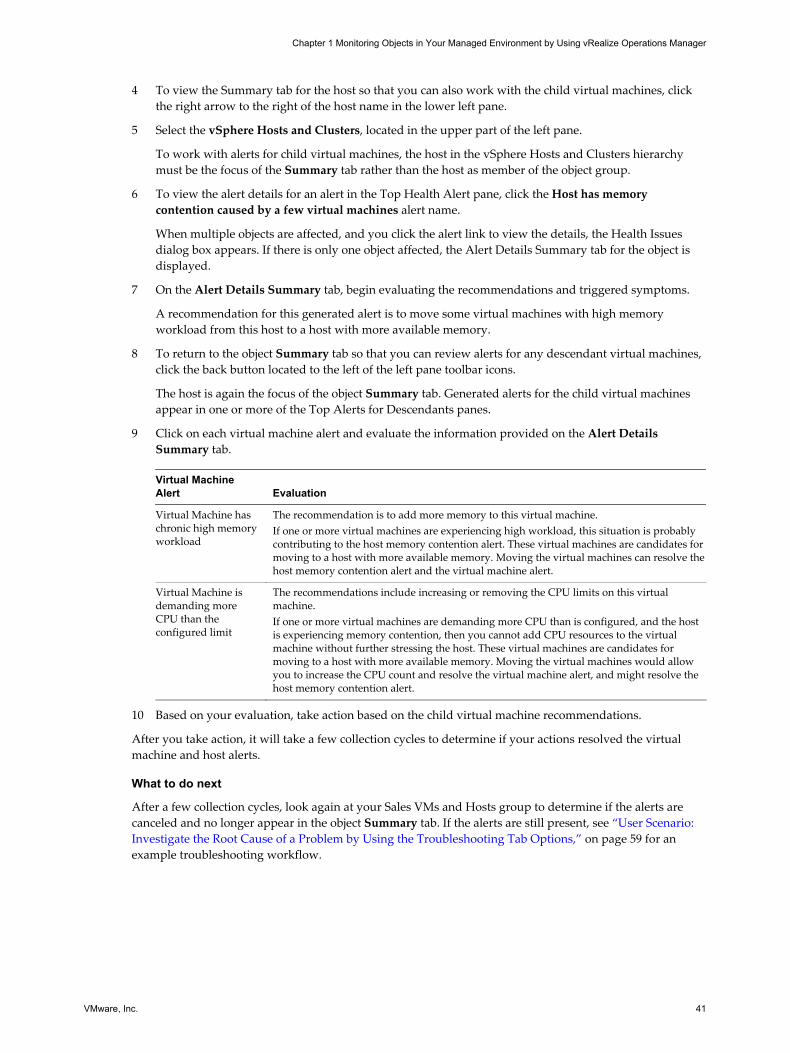
4 To view the Summary tab for the host so that you can also work with the child virtual machines, clickthe right arrow to the right of the host name in the lower left pane.
5 Select the vSphere Hosts and Clusters, located in the upper part of the left pane.
To work with alerts for child virtual machines, the host in the vSphere Hosts and Clusters hierarchymust be the focus of the Summary tab rather than the host as member of the object group.
6 To view the alert details for an alert in the Top Health Alert pane, click the Host has memorycontention caused by a few virtual machines alert name.
When multiple objects are affected, and you click the alert link to view the details, the Health Issuesdialog box appears. If there is only one object affected, the Alert Details Summary tab for the object isdisplayed.
7 On the Alert Details Summary tab, begin evaluating the recommendations and triggered symptoms.
A recommendation for this generated alert is to move some virtual machines with high memoryworkload from this host to a host with more available memory.
8 To return to the object Summary tab so that you can review alerts for any descendant virtual machines,click the back button located to the left of the left pane toolbar icons.
The host is again the focus of the object Summary tab. Generated alerts for the child virtual machinesappear in one or more of the Top Alerts for Descendants panes.
9 Click on each virtual machine alert and evaluate the information provided on the Alert DetailsSummary tab.
Virtual MachineAlert Evaluation
Virtual Machine haschronic high memoryworkload
The recommendation is to add more memory to this virtual machine.If one or more virtual machines are experiencing high workload, this situation is probablycontributing to the host memory contention alert. These virtual machines are candidates formoving to a host with more available memory. Moving the virtual machines can resolve thehost memory contention alert and the virtual machine alert.
Virtual Machine isdemanding moreCPU than theconfigured limit
The recommendations include increasing or removing the CPU limits on this virtualmachine.If one or more virtual machines are demanding more CPU than is configured, and the hostis experiencing memory contention, then you cannot add CPU resources to the virtualmachine without further stressing the host. These virtual machines are candidates formoving to a host with more available memory. Moving the virtual machines would allowyou to increase the CPU count and resolve the virtual machine alert, and might resolve thehost memory contention alert.
10 Based on your evaluation, take action based on the child virtual machine recommendations.
After you take action, it will take a few collection cycles to determine if your actions resolved the virtualmachine and host alerts.
What to do next
After a few collection cycles, look again at your Sales VMs and Hosts group to determine if the alerts arecanceled and no longer appear in the object Summary tab. If the alerts are still present, see “User Scenario:Investigate the Root Cause of a Problem by Using the Troubleshooting Tab Options,” on page 59 for anexample troubleshooting workflow.
Chapter 1 Monitoring Objects in Your Managed Environment by Using vRealize Operations Manager
VMware, Inc. 41
Investigating Object AlertsThe Alerts tab provides a list of generated alerts for the currently selected object. When you are workingwith objects, reviewing and responding to generated alerts on the Alert tab helps you manage problems inyour environment.
The alerts notify you when a problem occurs in your environment based on configured alert definitions.Object alerts are useful to you as an investigative tool in two ways. They can provide you with proactivenotification about problems in your environment before a user calls you to complain, and they provideinformation about the object that you can use when troubleshooting general or reported problems.
As you review the Alerts tab, you can add ancestors and descendants to the list to broaden your view of thealerts. You can see if alerts on the current object affect other objects or how the current object is affected bythe problems indicated by alerts on other objects.
Depending on the best practices and workflows of your infrastructure operations team, you can use theobject Alerts tab to manage generated alerts on individual objects.
n Take ownership of alerts so that your team knows that you are working to resolve the problem.
n Suspend an alert so that is temporarily excluded from affecting the Health, Risk, or Efficiency state ofthe object while you investigate the problem.
n Cancel alerts that you know are a result of a deliberate action, for example, a network card wasremoved from a host for replacement, or that are known issues that you cannot resolve at this timebecause of resource constraints. Canceling an alert that is generated because of only fault, messageevent, or metric event symptoms cancels the alert permanently. Canceling an alert that is generatedbecause of metric, super metric, or property symptoms can result in the alert being regenerated if theunderlying metric or property condition remains true. It is only effective to cancel alerts generatedbecause of fault, message event, or metric event symptoms.
Investigating and resolving alerts helps you provide the best possible environment to your customers.
User Scenario: Respond to Alerts on the Alerts Tab for Problem Virtual MachinesYou respond to alerts for objects so that you can bring the affected objects back to the required level ofconfiguration or performance. Based on the information in the alert and using other information provided invRealize Operations Manager, you evaluate the alert, identify the most likely solution, and resolve theproblem.
As a virtual infrastructure administrator or operations manager, you troubleshoot problems with objects.Reviewing and responding to the generated alerts for objects is part of any troubleshooting process. In thisexample, you want to resolve workload problems for a virtual machine. As part of that process, you reviewthe Alerts tab to determine what alerts might indicate or contribute to the identified problem.
The problem virtual machine is db-01-kyoto, which you use as a database server.
The following method of responding to alerts on the Alerts tab is provided as an example for usingvRealize Operations Manager and is not definitive. Your troubleshooting skills and your knowledge of theparticulars of your environment determine which methods work for you.
Prerequisites
n Verify that the Python Remediation vCenter Adapters are configured for the actions for eachvCenter Server instance. See the vRealize Operations Manager Customization and Administration Guide.
n Verify that you understand how to use the Power Off Allowed option if you are running Set CPUCount, Set Memory, and Set CPU Count and Memory actions. See “Working With Actions That UsePower Off Allowed,” on page 70.
vRealize Operations Manager User Guide
42 VMware, Inc.
Procedure
1 Enter the name of the object, db-01-kyoto, in the Search text box and select the virtual machine in thelist.
The object Summary tab appears. The Top Alerts panes display important active alerts for the object.
2 Click the Analysis tab.
The Workload tab is the first tab. This badge indicates that the workload is highest by CPU, butmemory is also above the configured limit.
3 Click the Alerts tab.
In this example, the alert list includes the follow alerts that might be related to the problem you areinvestigating.
n Virtual machine has unexpected high CPU workload.
n Virtual machine has unexpected high memory workload.
4 In the upper left pane, select the vSphere Hosts and Clusters related hierarchy and select ancestor ordescendant alerts to add to the list.
You want to check for possible alerts on ancestor or descendant objects in the context of the selectedhierarchy.
a On the toolbar, click Show Ancestor Alerts and select the Host System and Resource Pool checkboxes.
Any alerts for the host system or resource pool related to this virtual machine are added to the list.
b Click Show Descendant Alerts and select Datastore.
Any alerts for the datastore are added to the list.
In this example, there are no additional alerts for the host, resource pool, or datastore, so you beginaddressing the virtual machine alerts.
5 Click the Virtual machine has unexpected high CPU workload alert name.
The Alert Details Summary tab appears.
6 Review the recommendations to determine if one or more suggested recommendations can fix theproblem.
This example includes the following common recommendations:
n Check the guest applications to determine whether high CPU workload is expected behavior.
n Add more CPU capacity for this virtual machine.
7 To follow the Check the guest applications to determine whether high CPU workload is expectedbehavior recommendation, click Actions on the title bar and select Open Virtual Machine in vSphereClient.
The vSphere Web Client Summary tab appears so that you can open the virtual machine in the consoleand check which applications are are contributing to the reported high CPU workload.
8 To follow the Add more CPU Capacity for this virtual machine recommendation, click Set CPUCount for VM .
a Enter a value in the New CPU text box.
The default value that appears before you provide a value is a recommended value based onanalytics.
b To allow the action to power off the virtual machine before running the action if Hot Add for CPUis not enabled, select the Power Off Allowed check box.
Chapter 1 Monitoring Objects in Your Managed Environment by Using vRealize Operations Manager
VMware, Inc. 43
c To create a snapshot before changing the virtual machine CPU configuration, select the Snapshotcheck box.
d Click OK.
e Click the Task ID link and verify that the task ran successfully.
The specified number of CPUs are added to the virtual machine.
What to do next
After a few collection cycles, return to the object Alerts tab. If the alert no longer appears, then your actionsresolved the alert. If the problem is not resolved, see “User Scenario: Investigate the Root Cause of aProblem by Using the Troubleshooting Tab Options,” on page 59 for an example troubleshootingworkflow.
User Scenario: Respond to Alerts on a Custom DashboardYou can use a custom dashboard that includes widgets related to alerts to monitor whether alerts exist inyour environment. The custom dashboard provides a single interface where you can monitor the generalalert status for the objects and object groups, and begin processing the alerts so that you can resolve them.
As a virtual infrastructure administrator, you are responsible for the virtual machines and hosts that areused by the accounting department. You created alerts to manage the accounting department objects, andthen create a dashboard where the primary widget displays objects in the accounting object group. You nowwant to use the dashboard to manage the alerts for this group.
Prerequisites
n Create alerts to manage accounting department objects. See vRealize Operations Manager Customizationand Administration Guide.
n Create a custom dashboard to which you add the Alert List, Top Alerts, and alert widgets. The widgetsare configured to monitor objects in your environment. See vRealize Operations Manager Customizationand Administration Guide.
Procedure
1 In the left pane of vRealize Operations Manager, click the Home icon.
2 On the dashboard title bar, click Dashboard and select Accounting VMs and Hosts.
3 In the Acct Dept Alert List, click the Status column header to sort so that the active alerts are at the topof the list.
4 On the alert list toolbar, click Color Row by Alert Criticality.
The alerts are now highlighted by color so that you can address those with the highest criticality first.
5 Click the row for the object with the most critical alert to address first.
Because of the configured widget interactions, the Health, Risk, Efficiency, Symptom Volume, and TopAlerts widgets display data for the selected object.
a Review the Health, Risk, and Efficiency widgets so that you understand the general alert status ofthe object.
b Review the Top Alerts widget to determine the number of alerts for the object.
vRealize Operations Manager User Guide
44 VMware, Inc.
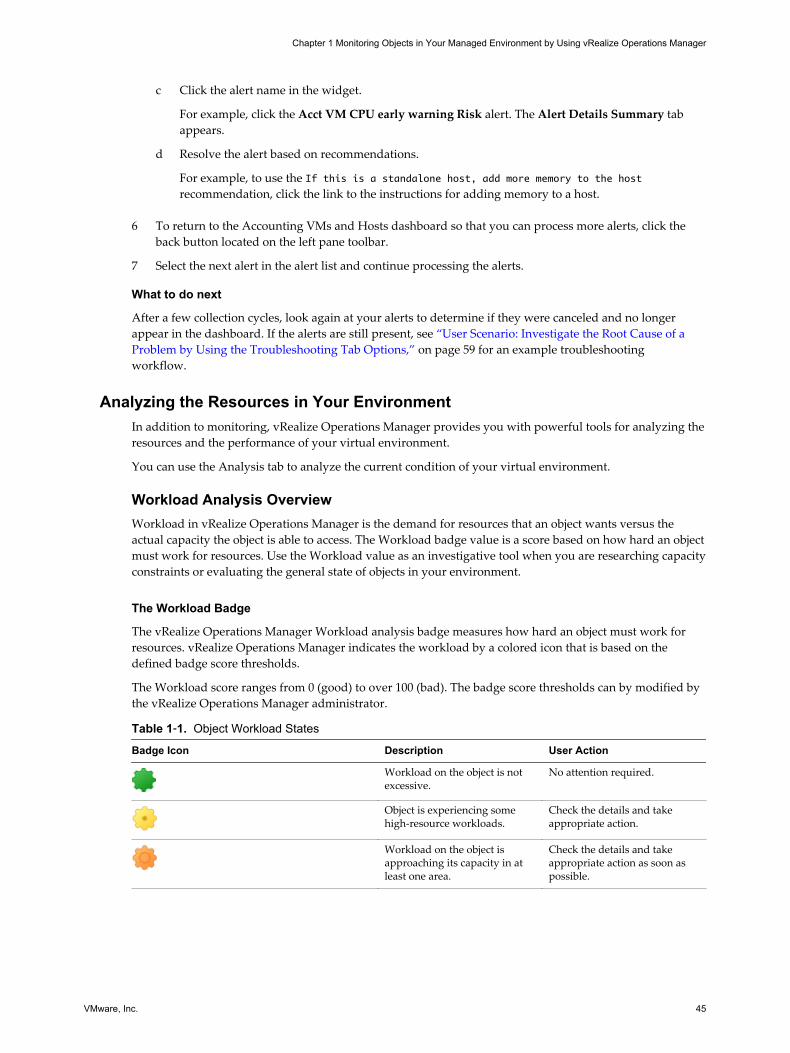
c Click the alert name in the widget.
For example, click the Acct VM CPU early warning Risk alert. The Alert Details Summary tabappears.
d Resolve the alert based on recommendations.
For example, to use the If this is a standalone host, add more memory to the hostrecommendation, click the link to the instructions for adding memory to a host.
6 To return to the Accounting VMs and Hosts dashboard so that you can process more alerts, click theback button located on the left pane toolbar.
7 Select the next alert in the alert list and continue processing the alerts.
What to do next
After a few collection cycles, look again at your alerts to determine if they were canceled and no longerappear in the dashboard. If the alerts are still present, see “User Scenario: Investigate the Root Cause of aProblem by Using the Troubleshooting Tab Options,” on page 59 for an example troubleshootingworkflow.
Analyzing the Resources in Your EnvironmentIn addition to monitoring, vRealize Operations Manager provides you with powerful tools for analyzing theresources and the performance of your virtual environment.
You can use the Analysis tab to analyze the current condition of your virtual environment.
Workload Analysis OverviewWorkload in vRealize Operations Manager is the demand for resources that an object wants versus theactual capacity the object is able to access. The Workload badge value is a score based on how hard an objectmust work for resources. Use the Workload value as an investigative tool when you are researching capacityconstraints or evaluating the general state of objects in your environment.
The Workload Badge
The vRealize Operations Manager Workload analysis badge measures how hard an object must work forresources. vRealize Operations Manager indicates the workload by a colored icon that is based on thedefined badge score thresholds.
The Workload score ranges from 0 (good) to over 100 (bad). The badge score thresholds can by modified bythe vRealize Operations Manager administrator.
Table 1‑1. Object Workload States
Badge Icon Description User Action
Workload on the object is notexcessive.
No attention required.
Object is experiencing somehigh-resource workloads.
Check the details and takeappropriate action.
Workload on the object isapproaching its capacity in atleast one area.
Check the details and takeappropriate action as soon aspossible.
Chapter 1 Monitoring Objects in Your Managed Environment by Using vRealize Operations Manager
VMware, Inc. 45
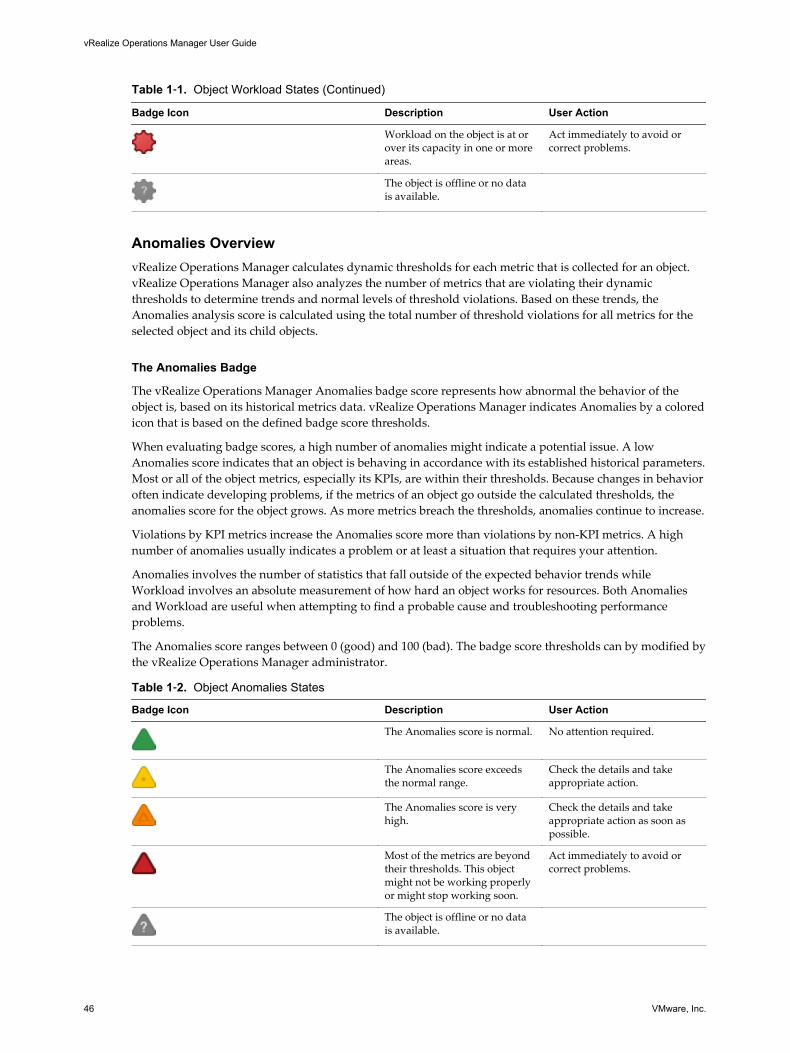
Table 1‑1. Object Workload States (Continued)
Badge Icon Description User Action
Workload on the object is at orover its capacity in one or moreareas.
Act immediately to avoid orcorrect problems.
The object is offline or no datais available.
Anomalies OverviewvRealize Operations Manager calculates dynamic thresholds for each metric that is collected for an object.vRealize Operations Manager also analyzes the number of metrics that are violating their dynamicthresholds to determine trends and normal levels of threshold violations. Based on these trends, theAnomalies analysis score is calculated using the total number of threshold violations for all metrics for theselected object and its child objects.
The Anomalies Badge
The vRealize Operations Manager Anomalies badge score represents how abnormal the behavior of theobject is, based on its historical metrics data. vRealize Operations Manager indicates Anomalies by a coloredicon that is based on the defined badge score thresholds.
When evaluating badge scores, a high number of anomalies might indicate a potential issue. A lowAnomalies score indicates that an object is behaving in accordance with its established historical parameters.Most or all of the object metrics, especially its KPIs, are within their thresholds. Because changes in behavioroften indicate developing problems, if the metrics of an object go outside the calculated thresholds, theanomalies score for the object grows. As more metrics breach the thresholds, anomalies continue to increase.
Violations by KPI metrics increase the Anomalies score more than violations by non-KPI metrics. A highnumber of anomalies usually indicates a problem or at least a situation that requires your attention.
Anomalies involves the number of statistics that fall outside of the expected behavior trends whileWorkload involves an absolute measurement of how hard an object works for resources. Both Anomaliesand Workload are useful when attempting to find a probable cause and troubleshooting performanceproblems.
The Anomalies score ranges between 0 (good) and 100 (bad). The badge score thresholds can by modified bythe vRealize Operations Manager administrator.
Table 1‑2. Object Anomalies States
Badge Icon Description User Action
The Anomalies score is normal. No attention required.
The Anomalies score exceedsthe normal range.
Check the details and takeappropriate action.
The Anomalies score is veryhigh.
Check the details and takeappropriate action as soon aspossible.
Most of the metrics are beyondtheir thresholds. This objectmight not be working properlyor might stop working soon.
Act immediately to avoid orcorrect problems.
The object is offline or no datais available.
vRealize Operations Manager User Guide
46 VMware, Inc.
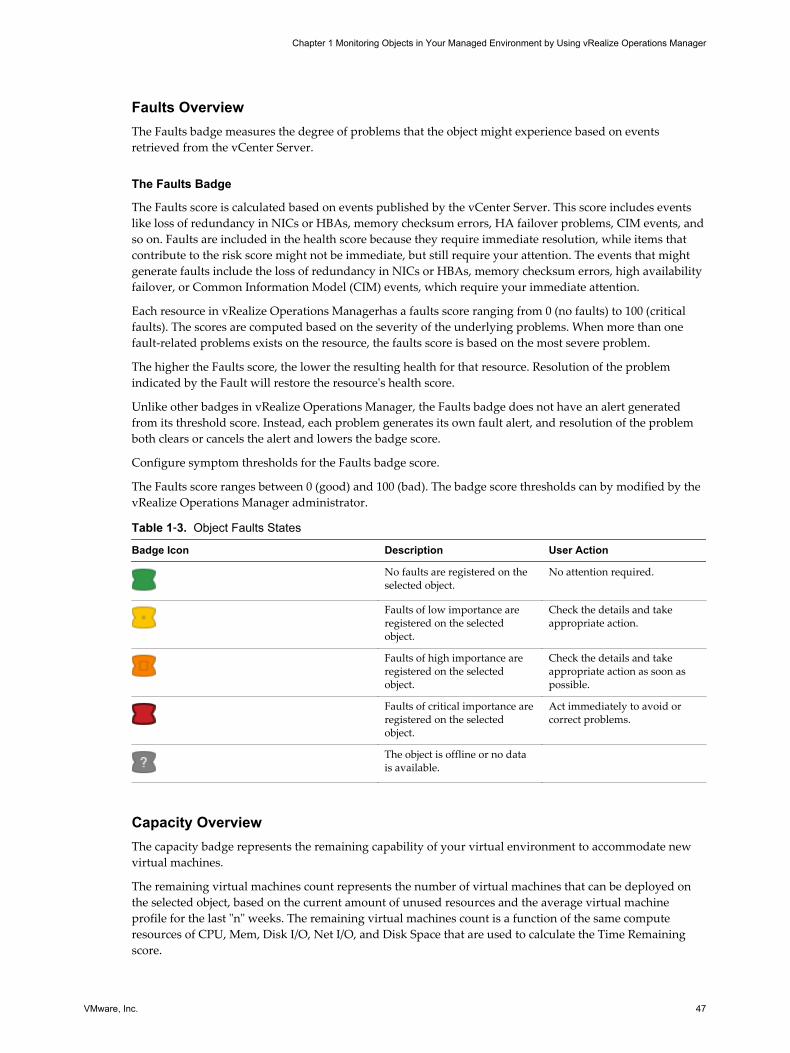
Faults OverviewThe Faults badge measures the degree of problems that the object might experience based on eventsretrieved from the vCenter Server.
The Faults Badge
The Faults score is calculated based on events published by the vCenter Server. This score includes eventslike loss of redundancy in NICs or HBAs, memory checksum errors, HA failover problems, CIM events, andso on. Faults are included in the health score because they require immediate resolution, while items thatcontribute to the risk score might not be immediate, but still require your attention. The events that mightgenerate faults include the loss of redundancy in NICs or HBAs, memory checksum errors, high availabilityfailover, or Common Information Model (CIM) events, which require your immediate attention.
Each resource in vRealize Operations Managerhas a faults score ranging from 0 (no faults) to 100 (criticalfaults). The scores are computed based on the severity of the underlying problems. When more than onefault-related problems exists on the resource, the faults score is based on the most severe problem.
The higher the Faults score, the lower the resulting health for that resource. Resolution of the problemindicated by the Fault will restore the resource's health score.
Unlike other badges in vRealize Operations Manager, the Faults badge does not have an alert generatedfrom its threshold score. Instead, each problem generates its own fault alert, and resolution of the problemboth clears or cancels the alert and lowers the badge score.
Configure symptom thresholds for the Faults badge score.
The Faults score ranges between 0 (good) and 100 (bad). The badge score thresholds can by modified by thevRealize Operations Manager administrator.
Table 1‑3. Object Faults States
Badge Icon Description User Action
No faults are registered on theselected object.
No attention required.
Faults of low importance areregistered on the selectedobject.
Check the details and takeappropriate action.
Faults of high importance areregistered on the selectedobject.
Check the details and takeappropriate action as soon aspossible.
Faults of critical importance areregistered on the selectedobject.
Act immediately to avoid orcorrect problems.
The object is offline or no datais available.
Capacity OverviewThe capacity badge represents the remaining capability of your virtual environment to accommodate newvirtual machines.
The remaining virtual machines count represents the number of virtual machines that can be deployed onthe selected object, based on the current amount of unused resources and the average virtual machineprofile for the last "n" weeks. The remaining virtual machines count is a function of the same computeresources of CPU, Mem, Disk I/O, Net I/O, and Disk Space that are used to calculate the Time Remainingscore.
Chapter 1 Monitoring Objects in Your Managed Environment by Using vRealize Operations Manager
VMware, Inc. 47
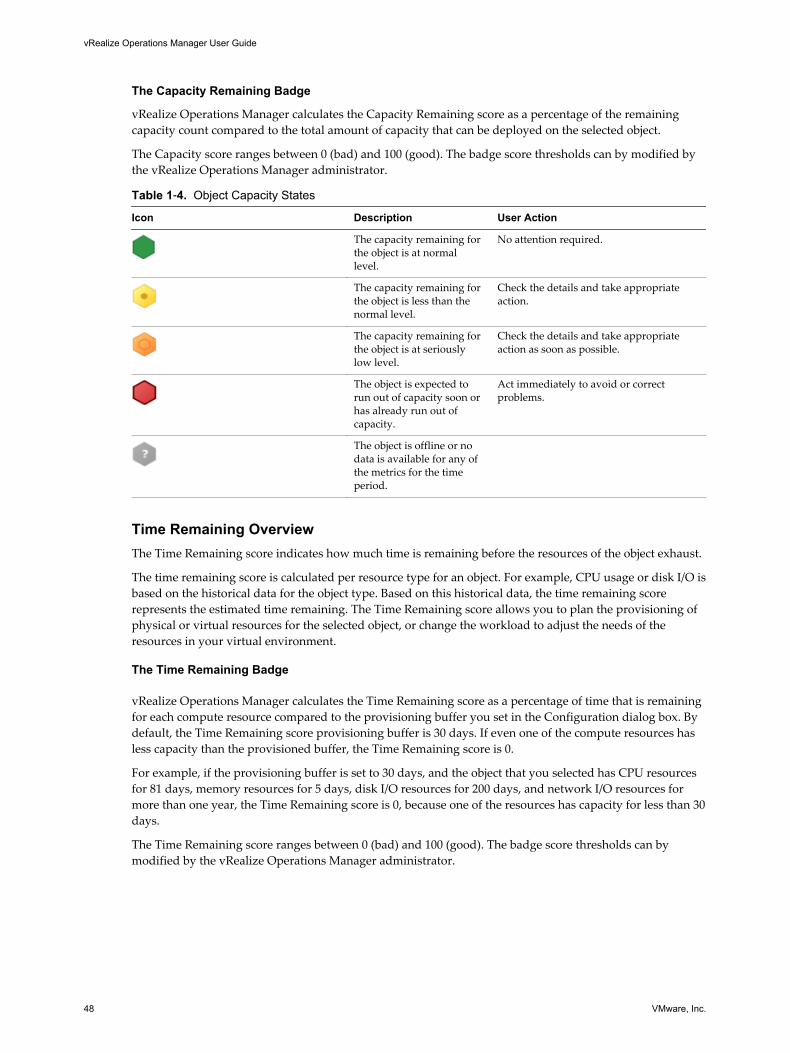
The Capacity Remaining Badge
vRealize Operations Manager calculates the Capacity Remaining score as a percentage of the remainingcapacity count compared to the total amount of capacity that can be deployed on the selected object.
The Capacity score ranges between 0 (bad) and 100 (good). The badge score thresholds can by modified bythe vRealize Operations Manager administrator.
Table 1‑4. Object Capacity States
Icon Description User Action
The capacity remaining forthe object is at normallevel.
No attention required.
The capacity remaining forthe object is less than thenormal level.
Check the details and take appropriateaction.
The capacity remaining forthe object is at seriouslylow level.
Check the details and take appropriateaction as soon as possible.
The object is expected torun out of capacity soon orhas already run out ofcapacity.
Act immediately to avoid or correctproblems.
The object is offline or nodata is available for any ofthe metrics for the timeperiod.
Time Remaining OverviewThe Time Remaining score indicates how much time is remaining before the resources of the object exhaust.
The time remaining score is calculated per resource type for an object. For example, CPU usage or disk I/O isbased on the historical data for the object type. Based on this historical data, the time remaining scorerepresents the estimated time remaining. The Time Remaining score allows you to plan the provisioning ofphysical or virtual resources for the selected object, or change the workload to adjust the needs of theresources in your virtual environment.
The Time Remaining Badge
vRealize Operations Manager calculates the Time Remaining score as a percentage of time that is remainingfor each compute resource compared to the provisioning buffer you set in the Configuration dialog box. Bydefault, the Time Remaining score provisioning buffer is 30 days. If even one of the compute resources hasless capacity than the provisioned buffer, the Time Remaining score is 0.
For example, if the provisioning buffer is set to 30 days, and the object that you selected has CPU resourcesfor 81 days, memory resources for 5 days, disk I/O resources for 200 days, and network I/O resources formore than one year, the Time Remaining score is 0, because one of the resources has capacity for less than 30days.
The Time Remaining score ranges between 0 (bad) and 100 (good). The badge score thresholds can bymodified by the vRealize Operations Manager administrator.
vRealize Operations Manager User Guide
48 VMware, Inc.
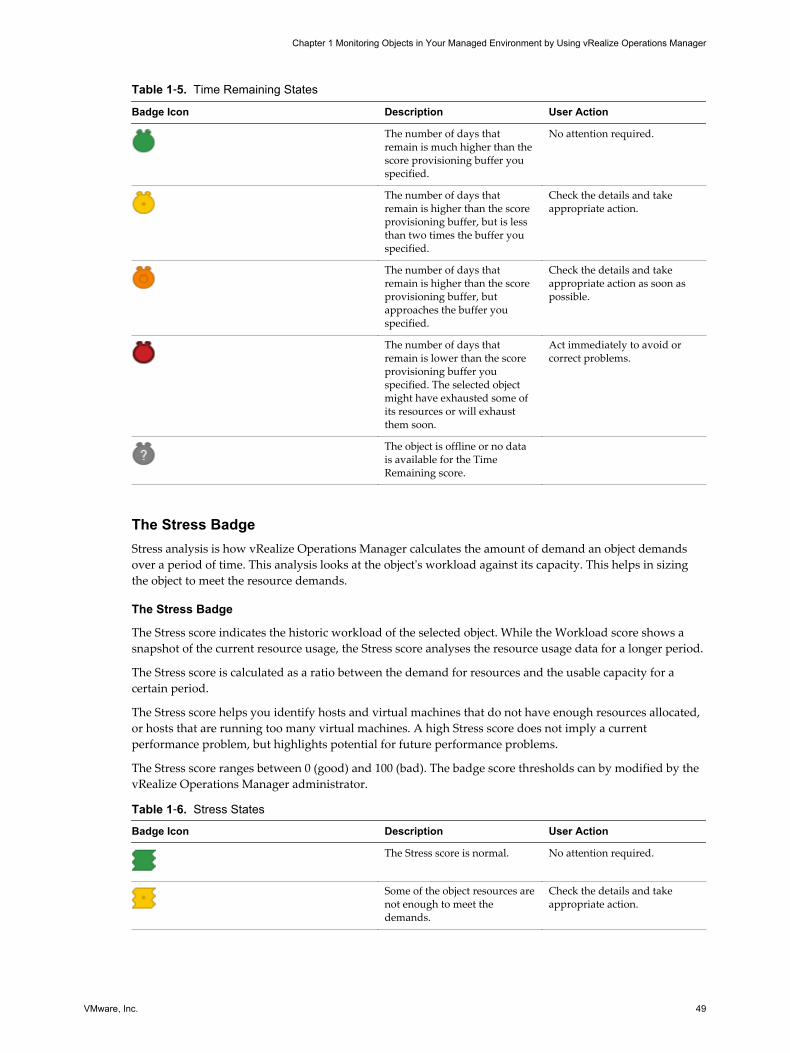
Table 1‑5. Time Remaining States
Badge Icon Description User Action
The number of days thatremain is much higher than thescore provisioning buffer youspecified.
No attention required.
The number of days thatremain is higher than the scoreprovisioning buffer, but is lessthan two times the buffer youspecified.
Check the details and takeappropriate action.
The number of days thatremain is higher than the scoreprovisioning buffer, butapproaches the buffer youspecified.
Check the details and takeappropriate action as soon aspossible.
The number of days thatremain is lower than the scoreprovisioning buffer youspecified. The selected objectmight have exhausted some ofits resources or will exhaustthem soon.
Act immediately to avoid orcorrect problems.
The object is offline or no datais available for the TimeRemaining score.
The Stress BadgeStress analysis is how vRealize Operations Manager calculates the amount of demand an object demandsover a period of time. This analysis looks at the object's workload against its capacity. This helps in sizingthe object to meet the resource demands.
The Stress Badge
The Stress score indicates the historic workload of the selected object. While the Workload score shows asnapshot of the current resource usage, the Stress score analyses the resource usage data for a longer period.
The Stress score is calculated as a ratio between the demand for resources and the usable capacity for acertain period.
The Stress score helps you identify hosts and virtual machines that do not have enough resources allocated,or hosts that are running too many virtual machines. A high Stress score does not imply a currentperformance problem, but highlights potential for future performance problems.
The Stress score ranges between 0 (good) and 100 (bad). The badge score thresholds can by modified by thevRealize Operations Manager administrator.
Table 1‑6. Stress States
Badge Icon Description User Action
The Stress score is normal. No attention required.
Some of the object resources arenot enough to meet thedemands.
Check the details and takeappropriate action.
Chapter 1 Monitoring Objects in Your Managed Environment by Using vRealize Operations Manager
VMware, Inc. 49
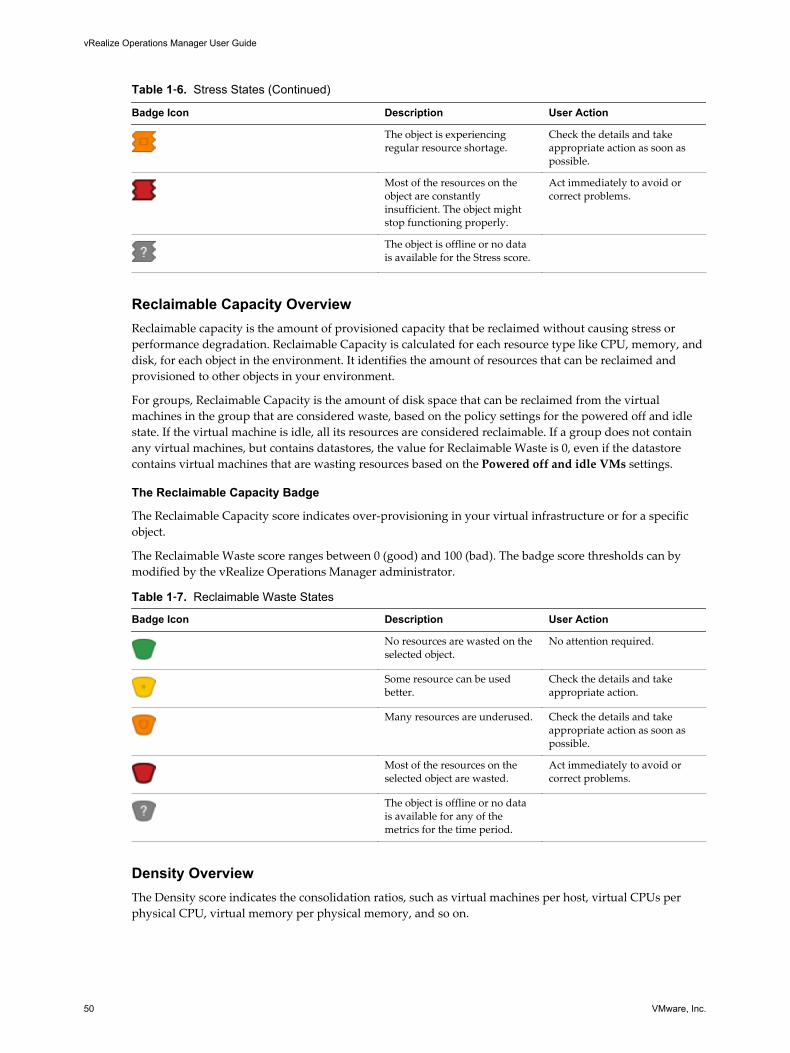
Table 1‑6. Stress States (Continued)
Badge Icon Description User Action
The object is experiencingregular resource shortage.
Check the details and takeappropriate action as soon aspossible.
Most of the resources on theobject are constantlyinsufficient. The object mightstop functioning properly.
Act immediately to avoid orcorrect problems.
The object is offline or no datais available for the Stress score.
Reclaimable Capacity OverviewReclaimable capacity is the amount of provisioned capacity that be reclaimed without causing stress orperformance degradation. Reclaimable Capacity is calculated for each resource type like CPU, memory, anddisk, for each object in the environment. It identifies the amount of resources that can be reclaimed andprovisioned to other objects in your environment.
For groups, Reclaimable Capacity is the amount of disk space that can be reclaimed from the virtualmachines in the group that are considered waste, based on the policy settings for the powered off and idlestate. If the virtual machine is idle, all its resources are considered reclaimable. If a group does not containany virtual machines, but contains datastores, the value for Reclaimable Waste is 0, even if the datastorecontains virtual machines that are wasting resources based on the Powered off and idle VMs settings.
The Reclaimable Capacity Badge
The Reclaimable Capacity score indicates over-provisioning in your virtual infrastructure or for a specificobject.
The Reclaimable Waste score ranges between 0 (good) and 100 (bad). The badge score thresholds can bymodified by the vRealize Operations Manager administrator.
Table 1‑7. Reclaimable Waste States
Badge Icon Description User Action
No resources are wasted on theselected object.
No attention required.
Some resource can be usedbetter.
Check the details and takeappropriate action.
Many resources are underused. Check the details and takeappropriate action as soon aspossible.
Most of the resources on theselected object are wasted.
Act immediately to avoid orcorrect problems.
The object is offline or no datais available for any of themetrics for the time period.
Density OverviewThe Density score indicates the consolidation ratios, such as virtual machines per host, virtual CPUs perphysical CPU, virtual memory per physical memory, and so on.
vRealize Operations Manager User Guide
50 VMware, Inc.
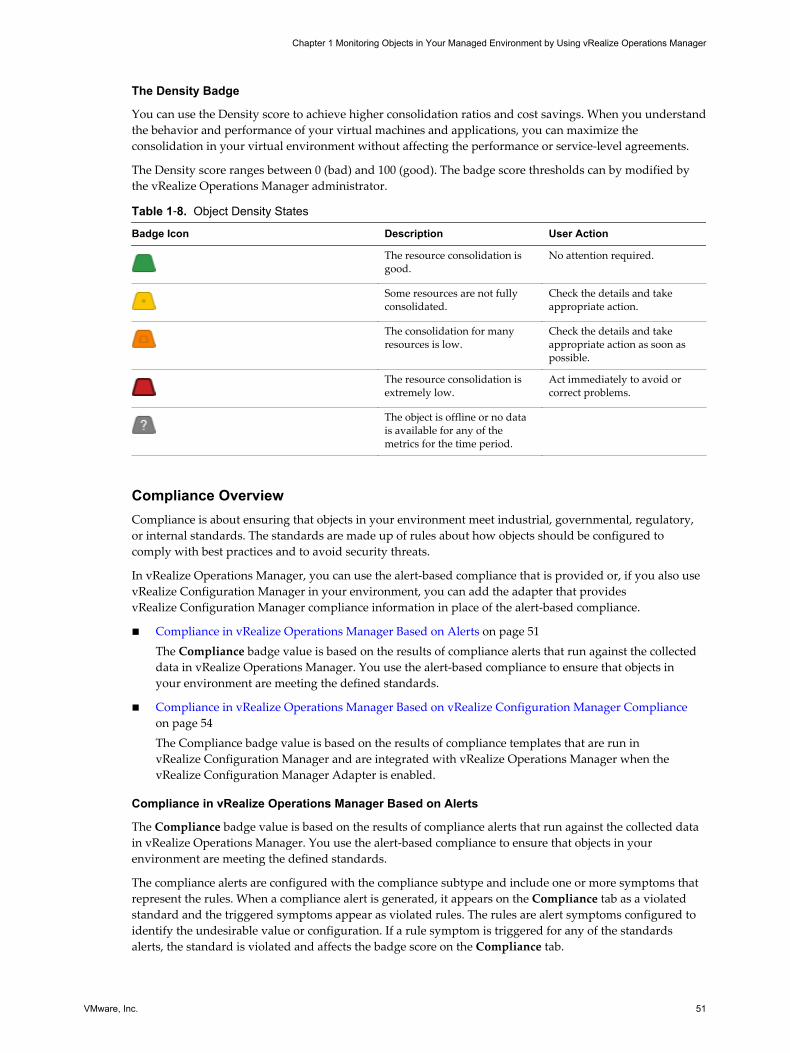
The Density Badge
You can use the Density score to achieve higher consolidation ratios and cost savings. When you understandthe behavior and performance of your virtual machines and applications, you can maximize theconsolidation in your virtual environment without affecting the performance or service-level agreements.
The Density score ranges between 0 (bad) and 100 (good). The badge score thresholds can by modified bythe vRealize Operations Manager administrator.
Table 1‑8. Object Density States
Badge Icon Description User Action
The resource consolidation isgood.
No attention required.
Some resources are not fullyconsolidated.
Check the details and takeappropriate action.
The consolidation for manyresources is low.
Check the details and takeappropriate action as soon aspossible.
The resource consolidation isextremely low.
Act immediately to avoid orcorrect problems.
The object is offline or no datais available for any of themetrics for the time period.
Compliance OverviewCompliance is about ensuring that objects in your environment meet industrial, governmental, regulatory,or internal standards. The standards are made up of rules about how objects should be configured tocomply with best practices and to avoid security threats.
In vRealize Operations Manager, you can use the alert-based compliance that is provided or, if you also usevRealize Configuration Manager in your environment, you can add the adapter that providesvRealize Configuration Manager compliance information in place of the alert-based compliance.
n Compliance in vRealize Operations Manager Based on Alerts on page 51The Compliance badge value is based on the results of compliance alerts that run against the collecteddata in vRealize Operations Manager. You use the alert-based compliance to ensure that objects inyour environment are meeting the defined standards.
n Compliance in vRealize Operations Manager Based on vRealize Configuration Manager Complianceon page 54The Compliance badge value is based on the results of compliance templates that are run invRealize Configuration Manager and are integrated with vRealize Operations Manager when thevRealize Configuration Manager Adapter is enabled.
Compliance in vRealize Operations Manager Based on Alerts
The Compliance badge value is based on the results of compliance alerts that run against the collected datain vRealize Operations Manager. You use the alert-based compliance to ensure that objects in yourenvironment are meeting the defined standards.
The compliance alerts are configured with the compliance subtype and include one or more symptoms thatrepresent the rules. When a compliance alert is generated, it appears on the Compliance tab as a violatedstandard and the triggered symptoms appear as violated rules. The rules are alert symptoms configured toidentify the undesirable value or configuration. If a rule symptom is triggered for any of the standardsalerts, the standard is violated and affects the badge score on the Compliance tab.
Chapter 1 Monitoring Objects in Your Managed Environment by Using vRealize Operations Manager
VMware, Inc. 51
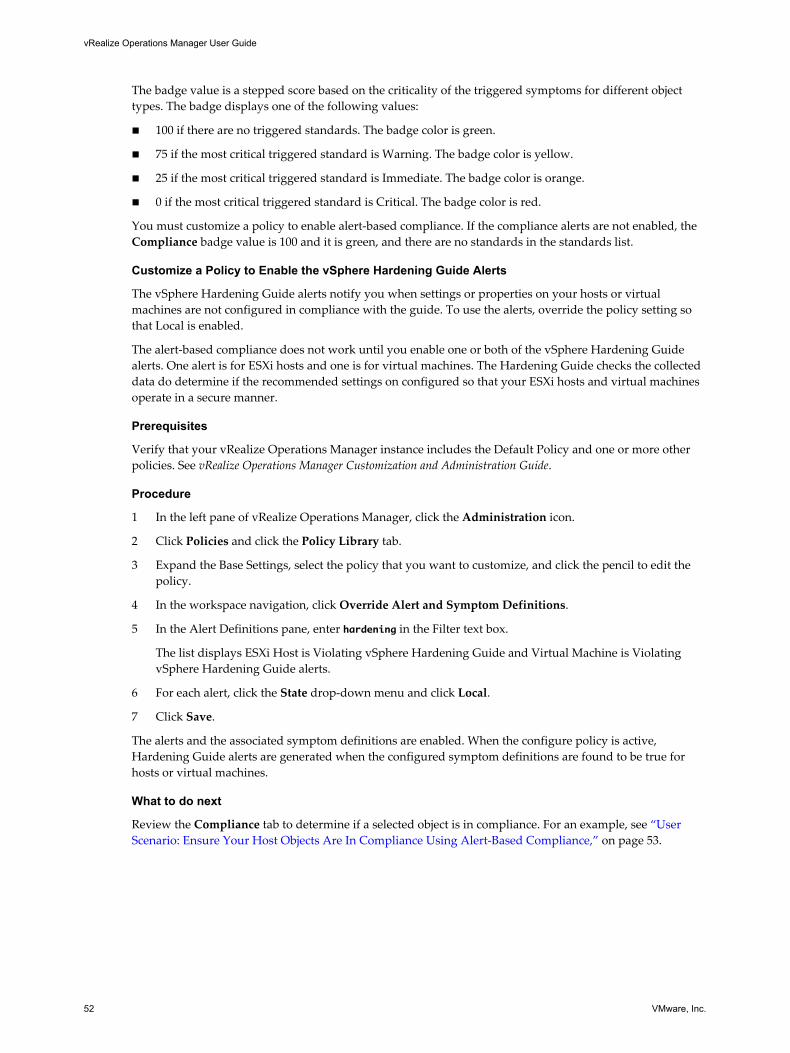
The badge value is a stepped score based on the criticality of the triggered symptoms for different objecttypes. The badge displays one of the following values:
n 100 if there are no triggered standards. The badge color is green.
n 75 if the most critical triggered standard is Warning. The badge color is yellow.
n 25 if the most critical triggered standard is Immediate. The badge color is orange.
n 0 if the most critical triggered standard is Critical. The badge color is red.
You must customize a policy to enable alert-based compliance. If the compliance alerts are not enabled, theCompliance badge value is 100 and it is green, and there are no standards in the standards list.
Customize a Policy to Enable the vSphere Hardening Guide Alerts
The vSphere Hardening Guide alerts notify you when settings or properties on your hosts or virtualmachines are not configured in compliance with the guide. To use the alerts, override the policy setting sothat Local is enabled.
The alert-based compliance does not work until you enable one or both of the vSphere Hardening Guidealerts. One alert is for ESXi hosts and one is for virtual machines. The Hardening Guide checks the collecteddata do determine if the recommended settings on configured so that your ESXi hosts and virtual machinesoperate in a secure manner.
Prerequisites
Verify that your vRealize Operations Manager instance includes the Default Policy and one or more otherpolicies. See vRealize Operations Manager Customization and Administration Guide.
Procedure
1 In the left pane of vRealize Operations Manager, click the Administration icon.
2 Click Policies and click the Policy Library tab.
3 Expand the Base Settings, select the policy that you want to customize, and click the pencil to edit thepolicy.
4 In the workspace navigation, click Override Alert and Symptom Definitions.
5 In the Alert Definitions pane, enter hardening in the Filter text box.
The list displays ESXi Host is Violating vSphere Hardening Guide and Virtual Machine is ViolatingvSphere Hardening Guide alerts.
6 For each alert, click the State drop-down menu and click Local.
7 Click Save.
The alerts and the associated symptom definitions are enabled. When the configure policy is active,Hardening Guide alerts are generated when the configured symptom definitions are found to be true forhosts or virtual machines.
What to do next
Review the Compliance tab to determine if a selected object is in compliance. For an example, see “UserScenario: Ensure Your Host Objects Are In Compliance Using Alert-Based Compliance,” on page 53.
vRealize Operations Manager User Guide
52 VMware, Inc.
User Scenario: Ensure Your Host Objects Are In Compliance Using Alert-Based Compliance
As a virtual infrastructure administrator, you use vRealize Configuration Manager to monitor the objects inyour environment, including ESXi hosts on which you run your companies virtual machines. You reviewthe Compliance tab for one or more of your hosts and discover that several of them are violating theVMware vSphere Hardening Guide standard, and you need to identify the problems and fix them.
The alert-based compliance for some of the rules in the VMware vSphere Hardening Guide are included invRealize Configuration Manager.
In this scenario, you resolve only one violated rule. Repeat the process for any other rules.
Prerequisites
n Verify that you can open an .XLSX file on the system you are using to accessvRealize Configuration Manager.
n Enable the Hardening Guide alerts so the alert-based compliance is active in your environment. See “Customize a Policy to Enable the vSphere Hardening Guide Alerts,” on page 52.
Procedure
1 In the left pane of vRealize Operations Manager, click the Environment icon.
2 Browse to a host object.
If you created an object group to manage your hosts, select a host in the group.
3 With the host as the focus of the center pane, click the Analysis tab and click the Compliance tab.
4 If the Compliance badge displays a value other than 100 or green, click the ESXi Host is ViolatingvSphere 5.5 Hardening Guide standard.
The Compliance Breakdown area expands to display all the violated rules.
5 Review the page to determine the criticality and pervasiveness of noncompliant standards for this hostand in your environment.
Option Evaluation
Compliance Breakdown What is the number and criticality of the violated rules for the host? Howmany of the violated rules are critical and should be addressed?
Compliance in Related Objects Are there other hosts that are in a similar compliance state? Are any childobjects out of compliance?
Host System Resources Is the host configured as you expect?
6 If your review of the page indicates that you need to resolve the Direct console UI service isrunning violated rule, click the Alerts tab.
These compliance standards are based on alerts. Alerts can include recommendations. In the example ofthe ESXi Host is Violating vSphere 5.5 Hardening Guide standards, the alert that is also generated forthis compliance alert, includes a recommendation with a link to the VMware vSphere HardeningGuide.
7 On the Alerts tab, locate and click the ESXi Host is Violating vSphere 5.5 Hardening Guide alert.
The Alert Details Summary tab appears. It includes the violated rules as symptoms and therecommendations to resolve the alert.
8 In the Recommendations area, click the link to the vSphere 5.5 Hardening Guide.
The hardening guide is downloaded to the system you are using to accessvRealize Configuration Manager.
Chapter 1 Monitoring Objects in Your Managed Environment by Using vRealize Operations Manager
VMware, Inc. 53
9 In the Hardening Guide workbook, click the ESXi tab and locate the Disable DCUI to prevent localadministrative control rule.
10 Review the information on the row and implement the appropriate remediation method.
For this rule, you can use the ESXi Shell Command, PowerCLI Command, or the steps provided in theVMware vSphere Documentation Center to change the setting.
You identified and resolved and out of compliance rule for you host object. Four or more collection cyclesafter you make the change to the host settings, the rule should no longer be included in the list of violatedrules for the host.
Compliance in vRealize Operations Manager Based on vRealize Configuration Manager Compliance
The Compliance badge value is based on the results of compliance templates that are run invRealize Configuration Manager and are integrated with vRealize Operations Manager when thevRealize Configuration Manager Adapter is enabled.
The Compliance badge value is a score based on one or more compliance templates that you run invRealize Configuration Manager against the data collected from vCenter Server, datacenter, cluster, hostsystem, virtual machine objects that are managed by vRealize Operations Manager and byvRealize Configuration Manager. The scores are calculated based on configuredvRealize Configuration Manager mapping settings.
A vRealize Configuration Manager compliance template comprises one or more rules that define theconfiguration standards for different object groups or all your objects. A rule is defined with one or moreconditions that are run against objects to determine if the configuration meets the required standards. Thesuccess or failure of the conditions determines whether the rule is successful or unsuccessful, and therefore,the level of object compliance. The compliance templates are not run against each object, but are run againstthe collected configuration data for each object.
The Compliance score reflects the average percentage of the templates included in the mappings. Theoverall score can range from 0 (completely noncompliant) to 100 (completely compliant). The color of thebadge changes based on the badge score thresholds that are set in a policy by thevRealize Operations Manager administrator.
User Scenario: Identify and Resolve Problems Based on Compliance FromvRealize Configuration Manager
As a virtual infrastructure administrator, you use vRealize Operations Manager to manage the objects inyour vCenter Server, including virtual machines that are used to run your company's customer paymentsystem and are required to be compliant with the Payment Card Industry DSS standards for virtualmachines. You receive an alert that compliance is critically low on several of your transaction servers, andyou need to identify the problems and fix them.
The Compliance badge is only available when the vRealize Configuration Manager Adapter is added, andonly reports compliance for objects that vRealize Operations Manager and vRealize Configuration Managermanage. See vRealize Operations Manager Customization and Administration Guide.
Procedure
1 Click the alert notification, which takes you to the alert so that you can identify the affected objects.
2 Working from the alerts list or working directly in the inventory, select the affected object.
You are now working with the object details.
3 Click the Analysis tab and click the Compliance tab.
4 In the standards list, locate the Payment Card Industry template and check the compliance level.
Does it require your attention? For example, is the percent compliance less than your triggeringpercentage.
vRealize Operations Manager User Guide
54 VMware, Inc.
5 If the compliance value for the object is below the accepted level, select the template row and selectOpen in vRealize Configuration Manager in the list toolbar menu.
6 Copy and paste the URL in an Internet Explorer browser address bar.
This URL takes you to the vRealize Configuration Manager login page where you log in using thevRealize Configuration Manager adapter credentials.
7 Click Login.
vRealize Configuration Manager opens on the Payment Card Industry template where you can seewhich rules failed and need your attention.
You identified objects that were out of compliance and you can now go to vRealize Configuration Managerto see which compliance template rules failed so that you can fix them.
What to do next
Open the compliance template in vRealize Configuration Manager and resolve noncompliant rules. See “Resolve Noncompliant Rules for vRealize Configuration Manager Compliance Templates,” on page 55.
Resolve Noncompliant Rules for vRealize Configuration Manager Compliance Templates
The Compliance score is a value based on template rules that are run in vRealize Configuration Manager. Toimprove the score, view the template results and determine how to resolve noncompliant rules for the targetobjects.
Prerequisites
n Select the template for which you are evaluating results. For example, see “User Scenario: Identify andResolve Problems Based on Compliance From vRealize Configuration Manager,” on page 54.
n If you do not see the name of the object for which you are resolving noncompliant results, correlate thename that appears in vRealize Operations Manager with the name used invRealize Configuration Manager. See “Correlate Compliance Object Names,” on page 56.
Procedure
1 On the VMware vRealize Configuration Manager page, click Login.
The selected template results appear in the vRealize Configuration Manager console.
2 Review the status column to identify the noncompliant rules that require your attention.
3 Resolve noncompliance results.
Click Help on the template results data grid for more information about the options for resolving non-compliant results.
4 Collect data from the machine groups and virtual object groups for which you resolved noncompliantresults.
5 Run the vRealize Operations Manager mappings in vRealize Configuration Manager.
When you run the mappings, the templates are run for the objects.
6 To review the badge scores in vRealize Configuration Manager, click Console and select Dashboard >Virtual Environments > vRealize Operations Manager Compliance Rollup.
7 Verify the scores to ensure that you resolved all the necessary noncompliant results
What to do next
In vRealize Operations Manager, review the Compliance badge scores to ensure that your scores are now atacceptable levels. You must allow approximately 5 minutes for vRealize Operations Manager to pull thenew scores from vRealize Configuration Manager.
Chapter 1 Monitoring Objects in Your Managed Environment by Using vRealize Operations Manager
VMware, Inc. 55
Differing Object Names for Compliance Objects
The virtual machine object name in vRealize Operations Manager might be different from the object name inthe vRealize Configuration Manager compliance templates. This difference is a result of howvRealize Operations Manager and vRealize Configuration Manager retrieve and collect data fromvCenter Server.
Some virtual objects in the templates might be managed in vRealize Configuration Manager as a virtualmachine with a guest operating system on which the vRealize Configuration Manager Agent is installed andas a virtual object that is managed through a vCenter Server instance using the Managing Agent. When theobject is managed as a virtual machine with a guest operating system and as a virtual object, the name thatappears in the template detail results might be different from the name that appears invRealize Operations Manager.
The name in the vRealize Configuration Manager template results is the object name that you assignedwhen the object was created, usually similar to the DNS name. The name in vRealize Operations Manager isbased on the vCenter Server object name unless you renamed the object in vCenter Server. If you renamedthe object, vRealize Operations Manager displays the user-assigned name. If the name is different from theoriginally assigned name, you see one name in vRealize Operations Manager and the DNS-derived name invRealize Configuration Manager.
To verify that you are working with the same object, use the data in vRealize Configuration Manager tocorrelate the object name, the guest object name, and the DNS name.
Correlate Compliance Object Names
If the object name in the vRealize Configuration Manager template results does not match the name of theobject in vRealize Operations Manager, use vRealize Operations Manager to correlate the object names andensure that you are evaluating and remediating the same object.
To verify that you are working with the same object, use the data in vRealize Configuration Manager tocorrelate the object name, the guest object name, and the DNS name.
Prerequisites
To determine if you must correlate the object names, see “Differing Object Names for Compliance Objects,”on page 56.
Procedure
1 In vRealize Configuration Manager, click Console and select Virtual Environments > vCenter > Guests> Summary.
2 In the Guest column, locate the name used in vRealize Operations Manager and identify the GuestMachine Name and the DNS Name that vRealize Configuration Manager uses.
The Guest Machine name and the DNS name are commonly the names used in the template results.
Using Troubleshooting Tools to Resolve ProblemsThe data provided in the Symptoms, Timeline, Events, and All Metrics tabs help you identify the rootcause of a problem that is not resolved by alert recommendations or simple analysis.
As you are troubleshooting problems with objects in your environment, you can use the troubleshootingtabs individually or as part of a workflow. Each of the tabs displays the collected data in a different way.Sometimes, as you are troubleshooting problems, you move directly from an analysis tab to the AllMetricsAll Metrics tab. Under other circumstances, you know that the Timeline tab might provide theinformation that you need.
vRealize Operations Manager User Guide
56 VMware, Inc.
Symptoms Tab OverviewYou can view a list of triggered symptoms for the selected object. You use the symptoms when you aretroubleshooting problems with an object.
The Symptoms tab displays all the triggered symptoms for the currently selected object. A review of thetriggered symptoms provides you with a list of the problems that the currently selected object isexperiencing. If you need to better understand which symptoms are associated with currently generatedalerts, go to the Alerts tab for the object.
As you evaluate the triggered symptoms, consider the time at which they were created and theconfiguration information and trend charts, where applicable.
Timeline Tab OverviewThe timeline provides a view of the triggered symptoms, generated alerts, and events for an object over aperiod of time. You use the timeline to identify common trends over time that are contributing to the currentstatus of objects in your environment.
The timeline provides a three-tier scrolling mechanism that you can use to move quickly through largespans of time, or slowly and minutely through individual hours when you are focusing on a particularperiod of time. To ensure that you have the data that you need, configure the Date Controls to encompassthe problem you are investigating.
It is not always effective to investigate a problem on an individual object by looking only at the object. Usethe ancestor, descendant, and peer options to examine the object in a broader environmental context. Thiscontext often reveals unexpected influences or consequences for the problem.
The timeline is a tool that provides you a graphical view of patterns. If a symptom is triggered and canceledby the system at various intervals over time, you can compare the event to other changes to the object or tothe related objects. These changes might be the root cause of the problem.
Events Tab OverviewEvents are changes in vRealize Operations Manager metrics that reflect changes that occurred on managedobjects because of user actions, system actions, triggered symptoms, or generated alerts on an object. Youuse the Events tab to compare the occurrence of events with the generated alerts to determine if a change onyour managed object contributed to the root cause of the alert or other problems with the object.
Events can occur on any object, not just the one listed.
The following vCenter Server activities are some of the activities that generate vRealize Operations Managerevents:
n Powering a virtual machine on or off
n Creating a virtual machine
n Installing VMware Tools on the guest OS of a virtual machine
n Adding a newly configured ESX/ESXi system to a vCenter Server system
Depending on alert definitions, these events might generate alerts.
If you monitor the same virtual machines with other applications that provide information tovRealize Operations Manager, and the adapters for those applications are configured to provide changeevents, the Events tab includes certain change events that occur on the monitored objects. These changeevents might provide further insight into the cause of problems that you are investigating.
Chapter 1 Monitoring Objects in Your Managed Environment by Using vRealize Operations Manager
VMware, Inc. 57
List of vRealize Configuration Manager Change Data Used by vRealize Operations Manager
To support the change events that appear in vRealize Operations Manager, thevRealize Configuration Manager adapter provides change data for Windows, Linux, and UNIX guestoperating systems running on virtual machines. If other adapters are configured to provide change events,other change events might be provided on the Events tab.
vRealize Configuration Manager Change Data
Configuration changes that are added to the vRealize Configuration Manager change log for the followingchanges will appear for the affected object on the Troubleshooting > Events tab.
Windows Change Events
n Device drivers
n IP information
n Patch assessments
n Registry
n Services
n Software inventory
n Windows machine memory, processors, or reboots
n Initiated reboots
Linux or UNIX Change Events
n Device drivers
n Dynamic services Cron
n Dynamic services Network
n Dynamic services RPC
n IP information
n Linux or UNIX machine memory, processors. or reboots
n Patch deployment
n Patch assessment
n Software inventory
All Metrics Tab OverviewThe All Metrics tab provides a relationship map and user-defined metric charts. The topological map helpsyou evaluate objects in the context of their place in your environment topology. The metric charts are basedon the metrics for the select object that you think will help you identify the possible cause of a problem inyour environment.
Although you might be investigating problems with a single object, for example, a host system, therelationship map allows you to see the host in the context of parent and child objects. It is also works as ahierarchical navigation system. If you double-click an object in the map, that object becomes the focus of themap and the available metrics for the object are active in the lower-left pane.
You can also build your own set of metric charts. You select the objects and metrics so that you can get amore detailed view of changes to different metrics for a single object or for related objects over time.
vRealize Operations Manager User Guide
58 VMware, Inc.
User Scenario: Investigate the Root Cause of a Problem by Using theTroubleshooting Tab OptionsOne of your customers reports poor performance for his virtual machine, including slowness and fails. Thisscenario provides one way that you can use vRealize Operations Manager to investigate the problem basedon information available in the Troubleshooting tabs.
As a virtual infrastructure administrator, you respond to a help ticket in which one of your customersreports problems with his virtual machine, sales-10-dk. The reported conditions are poor applicationperformance, including slow load times and slow boot, some of his programs are taking longer and longerto load, and his files are taking longer to save. Today his programs started to fail and an update failed toinstall.
When you look at the Alerts tab for the virtual machine you see an alert for chronic high memory workloadleading to memory stress, where the triggered symptoms indicate memory stress and the recommendationis to add memory.
Based on past experience, you are not convinced that this alert indicates the root cause, so you review theAnalysis tabs. All of the associated badges are green except for Capacity Remaining, which indicatesmemory and disk space problems, and Time Remaining, which has 0 days remaining for memory and diskspace.
From this initial review, you know that problems exist in addition to the memory alert, so you use theTroubleshooting tabs to do a more thorough investigation.
Procedure
1 User Scenario: Review the Triggered Symptoms When You Troubleshoot a Virtual Machine Problemon page 60As you respond to customer complaints and alerts, or when you notice problems in your environment,the information provided on the Symptoms tab in vRealize Operations Manager helps you determineif the triggered symptoms indicate conditions that contribute to the reported or identified problem.
2 User Scenario: Compare Symptoms on a Timeline When You Troubleshoot a Virtual Machine Problemon page 61Looking at the triggered symptoms for an object over time allows you to compare triggeredsymptoms, alerts, and events when you are troubleshooting problems with objects in yourenvironment. The Timeline tab in vRealize Operations Manager provides a visual chart on which tosee triggered symptoms that you can use to investigate problems in your environment.
3 User Scenario: Identify Influential Events When You Troubleshoot a Virtual Machine Problem onpage 62Events are changes to objects in your environment that are based on changes to metrics, properties, orinformation about the object. Examining the events for the problematic virtual machine in the contextof the analysis badges and alerts might provide visual clues to the root cause of a problem.
4 User Scenario: Create Metric Charts When You Troubleshoot a Virtual Machine Problem on page 63You create a custom group of metric charts when you troubleshoot a problem with a virtual machineso that you can compare different metrics. The level of detail that you can create using the All Metricstab in vRealize Operations Manager can contribute significantly to your effort to find the root cause ofa problem.
Chapter 1 Monitoring Objects in Your Managed Environment by Using vRealize Operations Manager
VMware, Inc. 59
User Scenario: Review the Triggered Symptoms When You Troubleshoot a Virtual Machine Problem
As you respond to customer complaints and alerts, or when you notice problems in your environment, theinformation provided on the Symptoms tab in vRealize Operations Manager helps you determine if thetriggered symptoms indicate conditions that contribute to the reported or identified problem.
As a network operations engineer, you are doing more research regarding a virtual machine about whichone of your customer reports poor performance. When you view the Alerts tab for the virtual machine, yousee only the Virtual Machine is Violating vSphere 5.5 Hardening Guide alert.
You identified problems with memory and disk space when you reviewed the Analysis tabs, so you focusyour review of the triggered symptoms on those items.
The following method of evaluating problems using the Symptoms tab is provided as an example for usingvRealize Operations Manager and is not definitive. Your troubleshooting skills and your knowledge of theparticulars of your environment determine which methods work for you.
Procedure
1 Enter the name of the virtual machine in the Search text box, located on the main title bar.
In this example, the virtual machine name is sales-10-dk.
2 Click the Troubleshooting tab and click the Symptoms tab.
3 Review the triggered symptoms.
Option Evaluation Process
Symptom Are any of the triggered symptoms related to the critical states you see for memory or disk space?
Status Are the symptoms active or inactive? Even inactive symptoms can provide information about the paststate of the object. To add the inactive symptoms, click Status: Active on the toolbar to remove thefilter.
Create On When was the symptoms triggered? How does the time that they were triggered compare with othersymptoms?
Information Can you identify a correlation between the triggered symptoms and the state of the Time Remainingand Capacity Remaining badges?
From your review of the symptoms you determine that most of the triggered symptoms are associated withthe Virtual Machine Hardening Guide alert, but some of the symptoms appear to be for memory and timeremaining, including the following symptoms:
n Guest file system overall disk space usage reaching critical limit
n Virtual machine disk space time remaining is low
n Virtual machine CPU time remaining is low
n Guest partition disk space usage
n Virtual machine memory time remaining is low
What to do next
Review the symptoms for the object on a timeline. See “User Scenario: Compare Symptoms on a TimelineWhen You Troubleshoot a Virtual Machine Problem,” on page 61.
vRealize Operations Manager User Guide
60 VMware, Inc.
User Scenario: Compare Symptoms on a Timeline When You Troubleshoot a Virtual MachineProblem
Looking at the triggered symptoms for an object over time allows you to compare triggered symptoms,alerts, and events when you are troubleshooting problems with objects in your environment. The Timelinetab in vRealize Operations Manager provides a visual chart on which to see triggered symptoms that youcan use to investigate problems in your environment.
After you identify the following symptoms as possible indicators of the root cause of the reportedperformance problems on the sales-10-dk virtual machine, you compare them to each other over time,looking for interesting or common patterns.
n Guest file system overall disk space use reaching critical limit
n Virtual machine disk space time remaining low
n Virtual machine CPU time remaining low
n Guest partition disk space use
n Virtual machine memory time remaining is low
The following method of evaluating problems using the Timeline tab is provided as an example for usingvRealize Operations Manager and is not definitive. Your troubleshooting skills and your knowledge of theparticulars of your environment determine which methods work for you.
Prerequisites
Review the triggered object symptoms. See “User Scenario: Review the Triggered Symptoms When YouTroubleshoot a Virtual Machine Problem,” on page 60.
Procedure
1 Enter the name of the virtual machine in the Search text box, located on the main title bar.
In this example, the virtual machine name is sales-10-dk.
2 Click the Troubleshooting tab and click the Timeline tab.
3 On the Timeline toolbar, click Date Control and select a time that is on or before the referencesymptoms were triggered.
The default time range is the last 6 hours. For a broader view of the virtual machine over time,configure a range that includes triggered symptoms and generated alerts.
4 To view the point at which the symptoms were triggered and to identify which line represents whichsymptom, drag the timeline week, day, or hour section left and right across the page.
5 Click Select Event Type and select all the event types.
Consider whether events correspond to triggered symptoms or generated alerts.
6 In the Related Hierarchies list in the upper left pane, click vSphere Hosts and Clusters.
The available ancestors and descendant objects depend on the selected hierarchy.
7 To see if the host is experiencing a contributing problems, click Show Ancestor Events.
Consider whether the host has symptoms, alerts, or events that provide you with more informationabout memory or disk space issues.
Comparing virtual machine symptoms to host symptoms, and looking at the symptoms over time indicatesthe following trends:
n The host resource usage, host disk usage, and host CPU usage symptoms are triggered for about 10minutes approximately every 4 hours.
Chapter 1 Monitoring Objects in Your Managed Environment by Using vRealize Operations Manager
VMware, Inc. 61
n The virtual machine guest file system out of space symptom is triggered and canceled over time.Sometimes the symptom is active for an hour and canceled. Sometimes it is active for two hours. But nomore than 30 minutes occur between cancellation and the next triggering of the symptom.
What to do next
Look at events in the context of the analysis badges and alerts. See “User Scenario: Identify InfluentialEvents When You Troubleshoot a Virtual Machine Problem,” on page 62.
User Scenario: Identify Influential Events When You Troubleshoot a Virtual Machine Problem
Events are changes to objects in your environment that are based on changes to metrics, properties, orinformation about the object. Examining the events for the problematic virtual machine in the context of theanalysis badges and alerts might provide visual clues to the root cause of a problem.
As a virtual infrastructure administrator investigating a reported performance problem with a virtualmachine, you compared symptoms on the timeline and identified interesting behavior around the guest filesystem that you want to examine in the context of other badge metrics to determine if you can find the rootcause of the problem.
The following method of evaluating problems using the Events tab is provided as an example for usingvRealize Operations Manager and is not definitive. Your troubleshooting skills and your knowledge of theparticulars of your environment determine which methods work for you.
Prerequisites
Examine triggered symptoms, alerts, and events over time. See “User Scenario: Compare Symptoms on aTimeline When You Troubleshoot a Virtual Machine Problem,” on page 61
Procedure
1 Enter the name of the virtual machine in the Search text box, located on the main title bar.
In this example, the virtual machine name is sales-10-dk.
2 Click the Troubleshooting tab and click the Events tab.
3 On the Events toolbar, click Date Control and select a time that is on or before the symptoms weretriggered.
4 Click Select Event Type and select all of the event types.
Consider whether any changes correspond to other events.
5 Click Show Parent Events and click through the badges on the toolbar to review the events.
Consider whether any of the events, which are listed in the data grid below the chart, correspond toproblems with the host that might contribute to the reported problem.
6 Click Show Child Events and click through the badges on the toolbar to review the events.
Consider whether any of the events show problems with the datastore.
Your evaluation shows no particular correlation between the workload or anomalies and the time at whichthe guest file system out of space symptom was triggered each time.
What to do next
To see metric level details for the virtual machine, you can build your own charts. See “User Scenario:Create Metric Charts When You Troubleshoot a Virtual Machine Problem,” on page 63.
vRealize Operations Manager User Guide
62 VMware, Inc.
User Scenario: Create Metric Charts When You Troubleshoot a Virtual Machine Problem
You create a custom group of metric charts when you troubleshoot a problem with a virtual machine so thatyou can compare different metrics. The level of detail that you can create using the All Metrics tab invRealize Operations Manager can contribute significantly to your effort to find the root cause of a problem.
As a virtual infrastructure administrator investigating a reported performance problem with a virtualmachine, you determined that you need to see detailed charts about the following reported symptoms.
n Guest file system overall disk space usage reaching critical limit
n Guest partition disk space usage
The following method of evaluating problems using the All Metrics tab is provided as an example for usingvRealize Operations Manager and is not definitive. Your troubleshooting skills and your knowledge of theparticulars of your environment determine which methods work for you.
Prerequisites
Compare events and badges metrics. See “User Scenario: Identify Influential Events When YouTroubleshoot a Virtual Machine Problem,” on page 62.
Procedure
1 Enter the name of the virtual machine in the Search text box, located on the main title bar.
In this example, the virtual machine name is sales-10-dk.
2 Click the Troubleshooting tab and click the All Metrics tab.
3 In the relationship topology map, click the virtual machine, dk-new-10.
The metrics list, located in the lower left of the center pane, displays virtual machine metrics.
4 On the chart toolbar, click Date Control and select a time that is on or before the symptoms weretriggered.
5 Add metric charts to the display area for the virtual machine.
a In the metric list, select Guest Files System Stats > Total Guest File System Free (GB) and double-click the metric name.
b To add the guest partition, for example, C:\, select Guest Files System Stats > C:\ > Guest FileSystem Free (GB) and double-click the metric name.
c To add disk space for comparison, select Disk Space > Capacity Remaining (%) and double-clickthe metric name.
6 Compare the charts.
A comparison of the charts shows a similar decrease in the file system free space, and that the virtualmachine disk space capacity remaining is decreasing at a steady rate. You determine that you must adddisk space to the virtual machine, but you do not know if the datastore can support the change to thevirtual machine.
7 Add the datastore capacity chart to the charts.
a In the topology map, double-click the host.
The topology map refreshes with the host as the focus object.
b Click the datastore.
c In the metric list, which is updated to display datastore metrics, select Capacity > Available Space(GB) and double-click the metric name.
Chapter 1 Monitoring Objects in Your Managed Environment by Using vRealize Operations Manager
VMware, Inc. 63
8 Review the datastore capacity chart to determine if sufficient capacity is available on the datastore tosupport increasing the disk space on the virtual machine.
You know that you need to increase the size of the virtual disk on the virtual machine.
What to do next
Expand the virtual disk on the virtual machine and assign it to stressed partitions. Click Actions, located onthe object title bar, and open the virtual machine in the vSphere Web Client.
Creating and Using Object DetailsThe views and heat map details provide you with specific data about the object. You use this information toevaluate problems in more detail. If the current views or heat maps do not provide the information that youneed, you can create one to use as tool as you investigate your specific problem.
Working with Heat MapsWith the vRealize Operations Manager heat map feature, you can locate trouble areas based on the metricvalues for objects in your virtual infrastructure. vRealize Operations Manager uses analytics algorithms thatyou can use to compare the performance of objects across the virtual infrastructure in real time using heatmaps.
You can use predefined heat maps or create your own custom heat maps to compare the metric values ofobjects in your virtual environment. vRealize Operations Manager has predefined heat maps on the Detailstab that you can use to compare commonly used metrics. You can use this data to plan to reduce waste andincrease capacity in the virtual infrastructure.
What a Heat Map Shows
A heat map contains rectangles of different sizes and colors, and each rectangle represents an object in yourvirtual environment. The color of the rectangle represents the value of one metric, and the size of therectangle represents the value of another metric. For example, one heat map shows the total memory andpercentage of memory use for each virtual machine. Larger rectangles are virtual machines with more totalmemory, green indicates low memory use, and red indicates high use.
vRealize Operations Manager updates the heat maps in real time as new values are collected for each objectand metric. The colored bar below the heat map is the legend. The legend identifies the values that theendpoints represent and the midpoint of the color range.
Heat map objects are grouped by parent. For example, a heat map that shows virtual machine performance,groups the virtual machines by the ESX hosts on which they run.
Create a Custom Heat Map
You can define an unlimited number of custom heat maps to analyze exactly the metrics that you need.
Procedure
1 In the left pane of vRealize Operations Manager, click Environment.
2 Select an object to inspect from an inventory tree.
3 Click the Heat Map tab under the Details tab.
4 Select the tag to use for first-level grouping of the objects from the Group By drop-down menu.
If a selected object does not have a value for this tag, it appears in a group called Other Groups.
5 Select the tag to use to separate the objects into subgroups from the Then By drop-down menu.
If a selected object does not have a value for this tag, it appears in a subgroup called Other Groups.
vRealize Operations Manager User Guide
64 VMware, Inc.
6 Select a Mode option.
Option Description
Instance Track all instances of a metric for an object with a separate rectangle foreach metric.
General Pick an specific instance of a metric for each object and track only thatmetric.
7 If you selected General mode, select the attribute to use to set the size of the rectangle for each resource
in the Size By list and the attribute to use to determine the color of the rectangle for each object in theColor By list.
Objects that have higher values for the Size By attribute have larger areas in the heat map display. Youcan also select fixed-size rectangles. The color varies between the colors you set based on the value ofthe Color By attribute.
In most cases, the attribute lists include only metrics that vRealize Operations Manager generates. Ifyou select an object type, the list shows all of the attributes that are defined for that object type.
a To track metrics only for objects of a particular kind, select the object type from the Object Typedrop-down menu.
8 If you selected Instance mode, select an attribute kind from the Attribute Kind list.
The attribute kind determines the color of the rectangle for each object.
9 Configure colors for the heat map.
a Click each of the small blocks under the color bar to set the color for low, middle, and high values.
The bar shows the color range for intermediate values. You can also set the values to match thehigh and low end of the color range.
b (Optional) Enter minimum and maximum color values in the Min Value and Max Value textboxes.
If you leave the text boxes blank, vRealize Operations Manager maps the highest and lowest valuesfor the Color By metric to the end colors. If you set a minimum or maximum value, any metric at orbeyond that value appears in the end color.
10 Click Save to save the configuration.
The custom heat map you created appears in the list of heat maps on the Heat Maps tab.
Find the Best or Worst Performing Objects for a Metric
You can use heat maps to find the objects with the highest or lowest values for a particular metric.
Prerequisites
If the combination of metrics that you want to compare is not available in the list of defined heat maps, youmust define a custom heat map first. See “Create a Custom Heat Map,” on page 64.
Procedure
1 In the left pane, click Environment and select an object from an inventory tree.
2 Click the Heat Map tab under the Details tab.
All metric heat maps related to the selected resource appear in the list of predefined heat maps.
3 In the list of heat maps, click the map to view.
The name and metrics values for each object shown on the heat map appear in the list below the heatmap.
Chapter 1 Monitoring Objects in Your Managed Environment by Using vRealize Operations Manager
VMware, Inc. 65
4 Click the column header for the metric you are interested in to change the sort order, so that the best orworst performing objects appear at the top of the column.
Compare Available Resources to Balance the Load Across the Infrastructure
A heat map can be used to compare the performance of selected metrics across the virtual infrastructure.You can use this information to balance the load across ESX hosts and virtual machines.
Prerequisites
If the combination of metrics to compare is not available in the list of defined heat maps, you must define acustom heat map first. See “Create a Custom Heat Map,” on page 64.
Procedure
1 In the left pane of vRealize Operations Manager, click Environment.
2 Select an object to inspect from an inventory tree.
3 Click the Heat Map tab under the Details tab.
4 In the list of heat maps, click the one to view.
The heat map of the selected metrics appears, sized and grouped according to your selection.
5 Use the heat map to compare objects and click resources and metric values for all objects in your virtualenvironment.
The list of names and metric values for all objects shown on the heat map appear in the list below theheat map. You can click column headers to sort the list by column. If you sort the list by a metriccolumn, you can see the highest or lowest values for that metric on top.
6 (Optional) To see more information about an object in the heat map, click the rectangle that representsthis object or click the pop-up window for more details.
What to do next
Based on your findings, you can reorganize the objects in your virtual environment to balance the loadbetween ESX hosts, clusters, or datastores.
Using Heat Maps to Analyze Data for Capacity Risk
Planning for capacity risk involves analyzing data to determine how much capacity is available and whetheryou make efficient use of the infrastructure.
Identify Clusters That Have Enough Space for Virtual Machines
Identify the clusters in a datacenter that have enough space for your next set of virtual machines.
Procedure
1 In the left pane of vRealize Operations Manager, click Environment.
2 Select vSphere World.
3 Click the Heat Map tab under the Details tab.
4 Select the Which clusters have the most free capacity and least stress? heat map.
5 In the heat map, point to each cluster area to view the percentage of remaining capacity.
A color other than green indicates a potential problem.
6 Click Details in the pop-up window to examine the resources for the cluster or datacenter.
What to do next
Identify the green clusters with the most capacity to store virtual machines.
vRealize Operations Manager User Guide
66 VMware, Inc.
Examine Abnormal Host Health
Identifying the source of a performance problem with a host involves examining its workload.
Procedure
1 In the left pane of vRealize Operations Manager, click Environment.
2 Select vSphere World.
3 Click the Heat Map tab under the Details tab.
4 Select the Which hosts currently have the most abnormal workload? heat map.
5 In the heat map, point to the cluster area to view the percentage of remaining capacity.
A color other than green indicates a potential problem.
6 Click Details for the ESX host in the pop-up window to examine the resources for the host.
What to do next
Adjust workloads to balance resources as necessary.
Identify Datastores with Enough Space for Virtual Machines
Identify the datastores that have the most space for your next set of virtual machines.
Procedure
1 In the left pane of vRealize Operations Manager, click Environment.
2 Select vSphere World.
3 Click the Heat Map tab under the Details tab.
4 Select the Which datastores have the highest disk space overcommitment and the lowest timeremaining? heat map.
5 In the heat map, point to each datacenter area to view the space statistics.
6 If a color other than green indicates a potential problem, click Details in the pop-up window toinvestigate the disk space and disk I/O resources.
What to do next
Identify the datastores with the largest amount of available space for virtual machines.
Identify Datastores with Wasted Space
To improve the efficiency of your virtual infrastructure, identify datastores with the highest amount ofwasted space that you can reclaim .
Procedure
1 In the left pane of vRealize Operations Manager, click Environment.
2 Select vSphere World.
3 Click the Heat Map tab under the Details tab.
4 Select the Which datastores have the most wasted space and total space storage? heat map.
5 In the heat map, point to each datacenter area to view the waste statistics.
6 If a color other than green indicates a potential problem, click Details in the pop-up window toinvestigate the disk space and disk I/O resources.
Chapter 1 Monitoring Objects in Your Managed Environment by Using vRealize Operations Manager
VMware, Inc. 67
What to do next
Identify the red, orange, or yellow datastores with the highest amount of wasted space.
Identify the Virtual Machines with Resource Waste Across Datastores
Identify the virtual machines that waste resources because of idle, oversized, or powered-off virtualmachine states or because of snapshots.
Procedure
1 In the left pane of vRealize Operations Manager, click Environment.
2 Select vSphere World.
3 Click the Heat Map tab under the Details tab.
4 Select the For each datastore, which VMs have the most wasted disk space? heat map.
5 In the heat map, point to each virtual machine to view the waste statistics.
6 If a color other than green indicates a potential problem, click Details for the virtual machine in thepop-up window and investigate the disk space and I/O resources.
What to do next
Identify the red, orange, or yellow virtual machines with the highest amount of wasted space.
Examining Relationships in Your EnvironmentMost objects in an environment are related to other objects in that environment. The Environment tab showshow objects in your environment are related. You use this display to troubleshoot problems that might notbe about the object that you originally chose to examine. For example, a problem alert on a host might bebecause a virtual machine related to the host lacks capacity.
Environment Tab SelectionsWhen you select an object from the inventory of your environment, you can display the related objects in anoverview, list, or map.
n The Overview shows all the objects in your environment with a status badge for each object. By clickinga badge, you can see which objects are related.
n The List shows only the objects related to your object selection. Depending on the object selected, youcan initiate an action or launch an external application.
n The Map shows the objects as icons in a hierarchical display. You select an icon to display the numberof related objects.
Use the Overview to identify objects in your environment with health, risk, or efficiency problems.Depending on the object type, you might be able to take action on the object from the List view.
Use the Environment Overview to Find ProblemsIf you are system administrator who is trying to investigate the reason for slow performance in yourenvironment, you can select key objects such as host systems to see if any related objects such as virtualmachines indicate problems.
Procedure
1 Select Environment > vSphere Hosts and Clusters and select the vSphere World object.
2 Select the Environment tab.
vRealize Operations Manager displays health badges for all objects in the vSphere World.
vRealize Operations Manager User Guide
68 VMware, Inc.
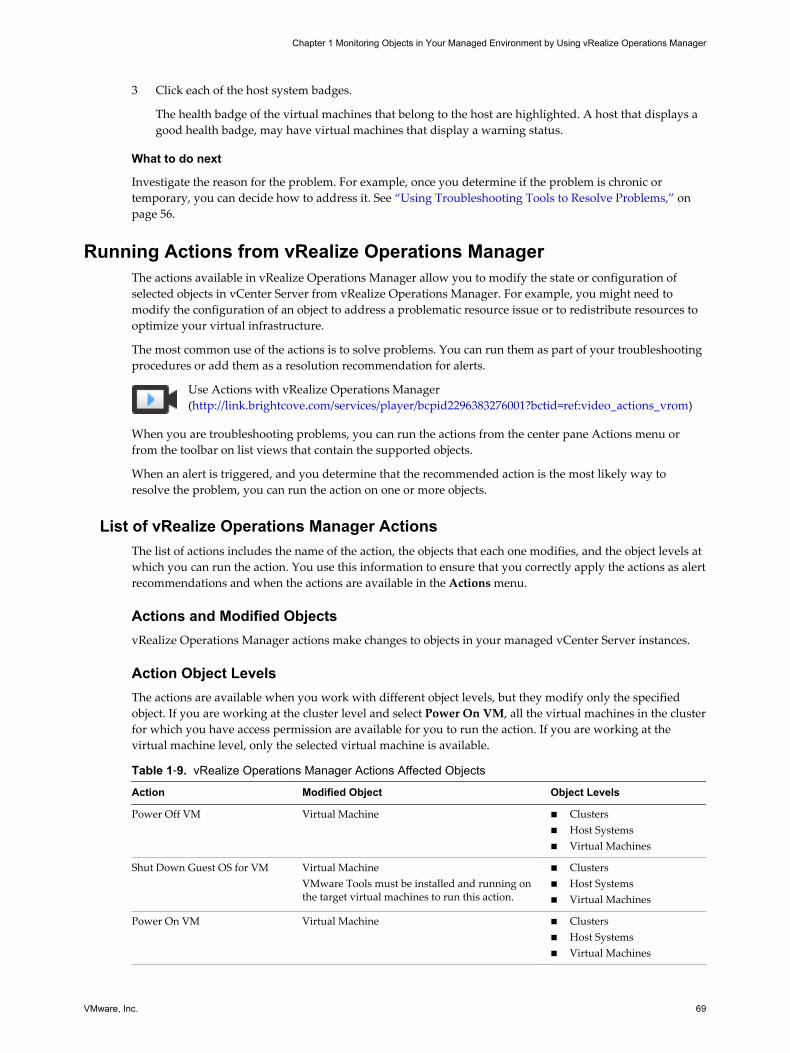
3 Click each of the host system badges.
The health badge of the virtual machines that belong to the host are highlighted. A host that displays agood health badge, may have virtual machines that display a warning status.
What to do next
Investigate the reason for the problem. For example, once you determine if the problem is chronic ortemporary, you can decide how to address it. See “Using Troubleshooting Tools to Resolve Problems,” onpage 56.
Running Actions from vRealize Operations ManagerThe actions available in vRealize Operations Manager allow you to modify the state or configuration ofselected objects in vCenter Server from vRealize Operations Manager. For example, you might need tomodify the configuration of an object to address a problematic resource issue or to redistribute resources tooptimize your virtual infrastructure.
The most common use of the actions is to solve problems. You can run them as part of your troubleshootingprocedures or add them as a resolution recommendation for alerts.
Use Actions with vRealize Operations Manager(http://link.brightcove.com/services/player/bcpid2296383276001?bctid=ref:video_actions_vrom)
When you are troubleshooting problems, you can run the actions from the center pane Actions menu orfrom the toolbar on list views that contain the supported objects.
When an alert is triggered, and you determine that the recommended action is the most likely way toresolve the problem, you can run the action on one or more objects.
List of vRealize Operations Manager ActionsThe list of actions includes the name of the action, the objects that each one modifies, and the object levels atwhich you can run the action. You use this information to ensure that you correctly apply the actions as alertrecommendations and when the actions are available in the Actions menu.
Actions and Modified ObjectsvRealize Operations Manager actions make changes to objects in your managed vCenter Server instances.
Action Object LevelsThe actions are available when you work with different object levels, but they modify only the specifiedobject. If you are working at the cluster level and select Power On VM, all the virtual machines in the clusterfor which you have access permission are available for you to run the action. If you are working at thevirtual machine level, only the selected virtual machine is available.
Table 1‑9. vRealize Operations Manager Actions Affected Objects
Action Modified Object Object Levels
Power Off VM Virtual Machine n Clustersn Host Systemsn Virtual Machines
Shut Down Guest OS for VM Virtual MachineVMware Tools must be installed and running onthe target virtual machines to run this action.
n Clustersn Host Systemsn Virtual Machines
Power On VM Virtual Machine n Clustersn Host Systemsn Virtual Machines
Chapter 1 Monitoring Objects in Your Managed Environment by Using vRealize Operations Manager
VMware, Inc. 69
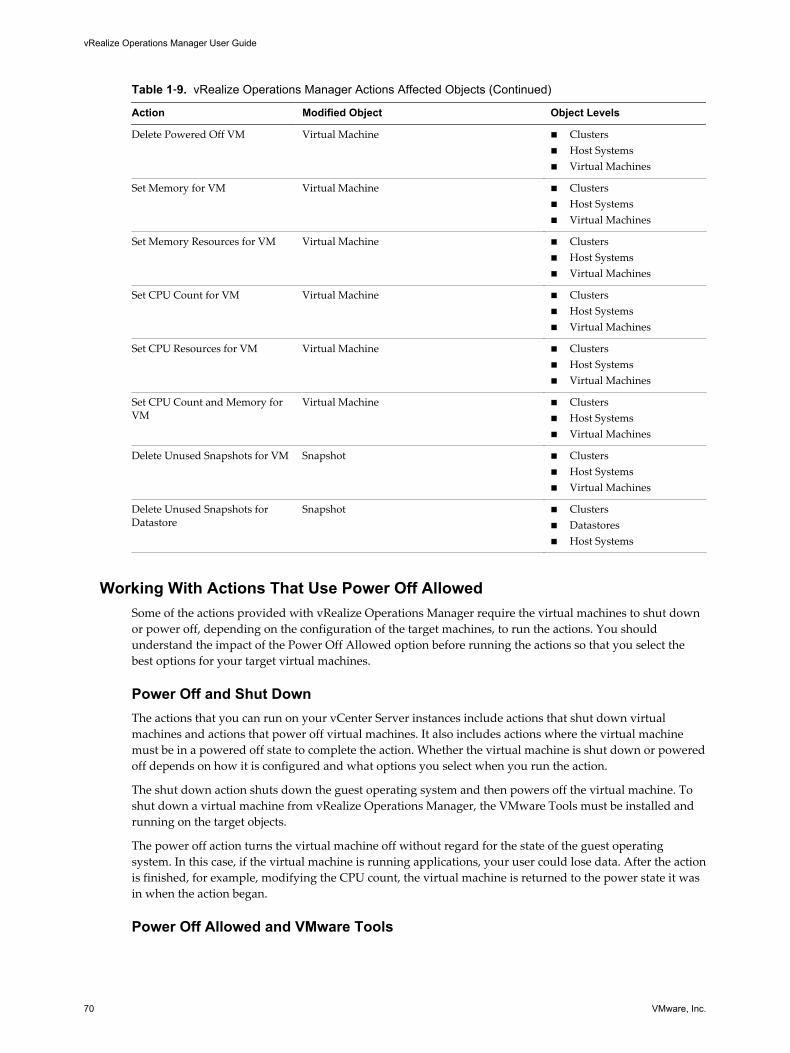
Table 1‑9. vRealize Operations Manager Actions Affected Objects (Continued)
Action Modified Object Object Levels
Delete Powered Off VM Virtual Machine n Clustersn Host Systemsn Virtual Machines
Set Memory for VM Virtual Machine n Clustersn Host Systemsn Virtual Machines
Set Memory Resources for VM Virtual Machine n Clustersn Host Systemsn Virtual Machines
Set CPU Count for VM Virtual Machine n Clustersn Host Systemsn Virtual Machines
Set CPU Resources for VM Virtual Machine n Clustersn Host Systemsn Virtual Machines
Set CPU Count and Memory forVM
Virtual Machine n Clustersn Host Systemsn Virtual Machines
Delete Unused Snapshots for VM Snapshot n Clustersn Host Systemsn Virtual Machines
Delete Unused Snapshots forDatastore
Snapshot n Clustersn Datastoresn Host Systems
Working With Actions That Use Power Off AllowedSome of the actions provided with vRealize Operations Manager require the virtual machines to shut downor power off, depending on the configuration of the target machines, to run the actions. You shouldunderstand the impact of the Power Off Allowed option before running the actions so that you select thebest options for your target virtual machines.
Power Off and Shut DownThe actions that you can run on your vCenter Server instances include actions that shut down virtualmachines and actions that power off virtual machines. It also includes actions where the virtual machinemust be in a powered off state to complete the action. Whether the virtual machine is shut down or poweredoff depends on how it is configured and what options you select when you run the action.
The shut down action shuts down the guest operating system and then powers off the virtual machine. Toshut down a virtual machine from vRealize Operations Manager, the VMware Tools must be installed andrunning on the target objects.
The power off action turns the virtual machine off without regard for the state of the guest operatingsystem. In this case, if the virtual machine is running applications, your user could lose data. After the actionis finished, for example, modifying the CPU count, the virtual machine is returned to the power state it wasin when the action began.
Power Off Allowed and VMware Tools
vRealize Operations Manager User Guide
70 VMware, Inc.
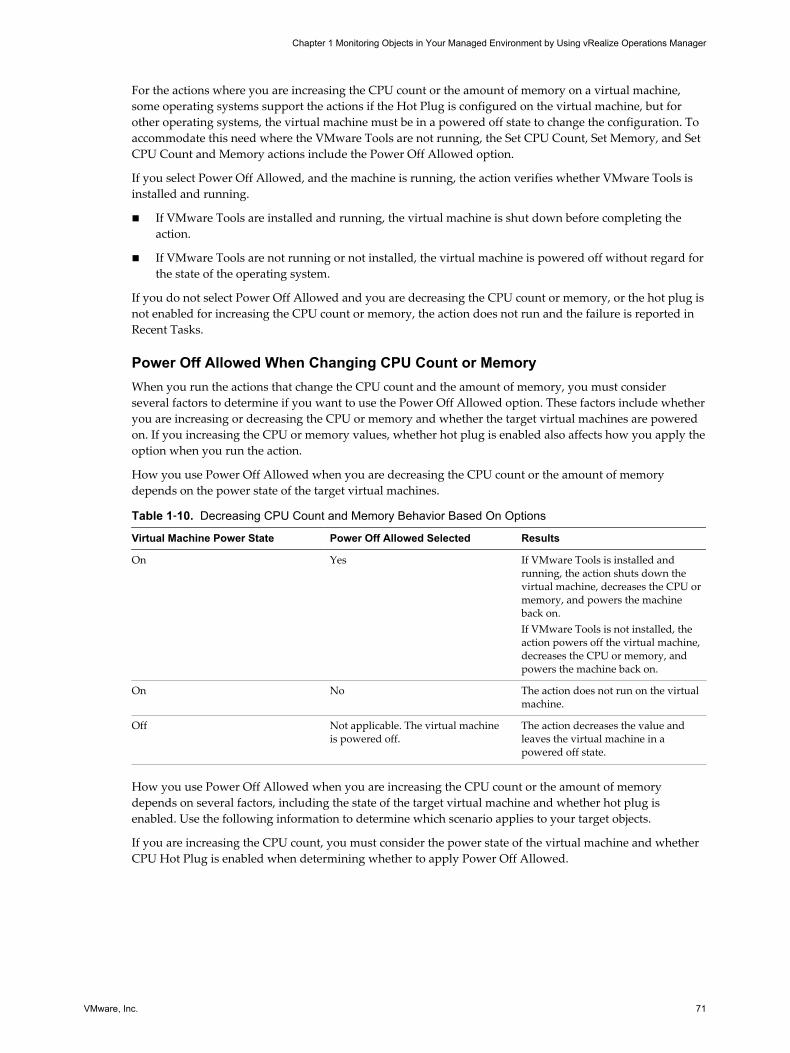
For the actions where you are increasing the CPU count or the amount of memory on a virtual machine,some operating systems support the actions if the Hot Plug is configured on the virtual machine, but forother operating systems, the virtual machine must be in a powered off state to change the configuration. Toaccommodate this need where the VMware Tools are not running, the Set CPU Count, Set Memory, and SetCPU Count and Memory actions include the Power Off Allowed option.
If you select Power Off Allowed, and the machine is running, the action verifies whether VMware Tools isinstalled and running.
n If VMware Tools are installed and running, the virtual machine is shut down before completing theaction.
n If VMware Tools are not running or not installed, the virtual machine is powered off without regard forthe state of the operating system.
If you do not select Power Off Allowed and you are decreasing the CPU count or memory, or the hot plug isnot enabled for increasing the CPU count or memory, the action does not run and the failure is reported inRecent Tasks.
Power Off Allowed When Changing CPU Count or MemoryWhen you run the actions that change the CPU count and the amount of memory, you must considerseveral factors to determine if you want to use the Power Off Allowed option. These factors include whetheryou are increasing or decreasing the CPU or memory and whether the target virtual machines are poweredon. If you increasing the CPU or memory values, whether hot plug is enabled also affects how you apply theoption when you run the action.
How you use Power Off Allowed when you are decreasing the CPU count or the amount of memorydepends on the power state of the target virtual machines.
Table 1‑10. Decreasing CPU Count and Memory Behavior Based On Options
Virtual Machine Power State Power Off Allowed Selected Results
On Yes If VMware Tools is installed andrunning, the action shuts down thevirtual machine, decreases the CPU ormemory, and powers the machineback on.If VMware Tools is not installed, theaction powers off the virtual machine,decreases the CPU or memory, andpowers the machine back on.
On No The action does not run on the virtualmachine.
Off Not applicable. The virtual machineis powered off.
The action decreases the value andleaves the virtual machine in apowered off state.
How you use Power Off Allowed when you are increasing the CPU count or the amount of memorydepends on several factors, including the state of the target virtual machine and whether hot plug isenabled. Use the following information to determine which scenario applies to your target objects.
If you are increasing the CPU count, you must consider the power state of the virtual machine and whetherCPU Hot Plug is enabled when determining whether to apply Power Off Allowed.
Chapter 1 Monitoring Objects in Your Managed Environment by Using vRealize Operations Manager
VMware, Inc. 71
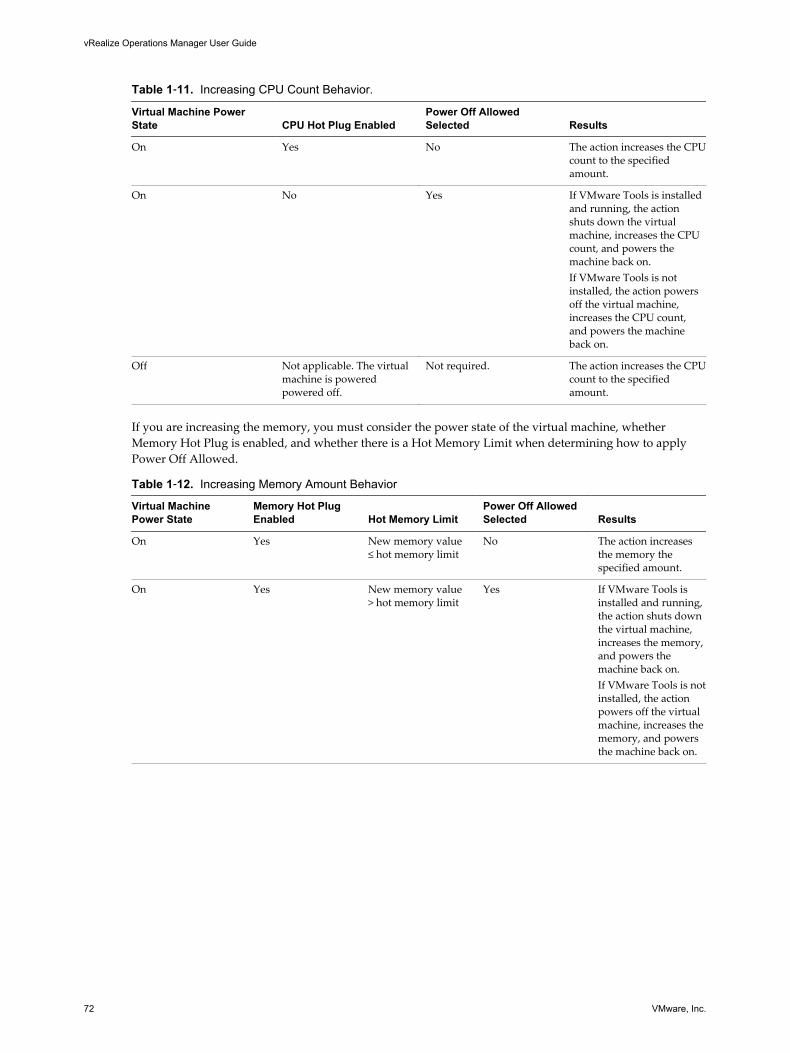
Table 1‑11. Increasing CPU Count Behavior.
Virtual Machine PowerState CPU Hot Plug Enabled
Power Off AllowedSelected Results
On Yes No The action increases the CPUcount to the specifiedamount.
On No Yes If VMware Tools is installedand running, the actionshuts down the virtualmachine, increases the CPUcount, and powers themachine back on.If VMware Tools is notinstalled, the action powersoff the virtual machine,increases the CPU count,and powers the machineback on.
Off Not applicable. The virtualmachine is poweredpowered off.
Not required. The action increases the CPUcount to the specifiedamount.
If you are increasing the memory, you must consider the power state of the virtual machine, whetherMemory Hot Plug is enabled, and whether there is a Hot Memory Limit when determining how to applyPower Off Allowed.
Table 1‑12. Increasing Memory Amount Behavior
Virtual MachinePower State
Memory Hot PlugEnabled Hot Memory Limit
Power Off AllowedSelected Results
On Yes New memory value≤ hot memory limit
No The action increasesthe memory thespecified amount.
On Yes New memory value> hot memory limit
Yes If VMware Tools isinstalled and running,the action shuts downthe virtual machine,increases the memory,and powers themachine back on.If VMware Tools is notinstalled, the actionpowers off the virtualmachine, increases thememory, and powersthe machine back on.
vRealize Operations Manager User Guide
72 VMware, Inc.
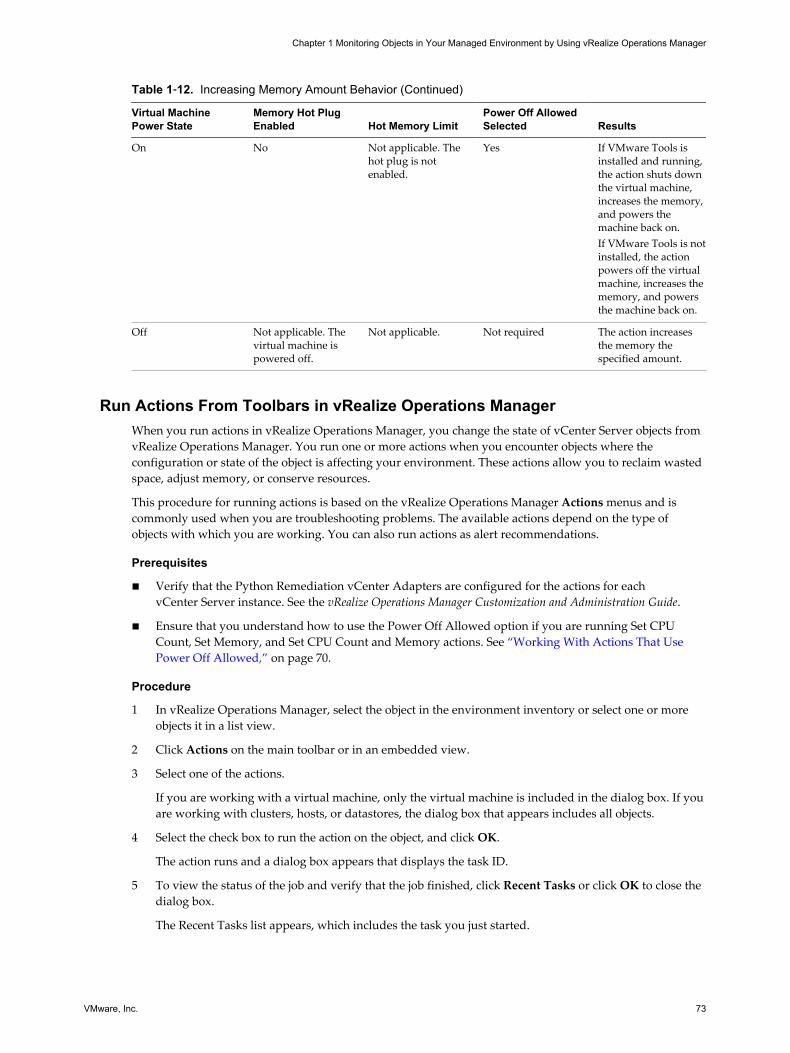
Table 1‑12. Increasing Memory Amount Behavior (Continued)
Virtual MachinePower State
Memory Hot PlugEnabled Hot Memory Limit
Power Off AllowedSelected Results
On No Not applicable. Thehot plug is notenabled.
Yes If VMware Tools isinstalled and running,the action shuts downthe virtual machine,increases the memory,and powers themachine back on.If VMware Tools is notinstalled, the actionpowers off the virtualmachine, increases thememory, and powersthe machine back on.
Off Not applicable. Thevirtual machine ispowered off.
Not applicable. Not required The action increasesthe memory thespecified amount.
Run Actions From Toolbars in vRealize Operations ManagerWhen you run actions in vRealize Operations Manager, you change the state of vCenter Server objects fromvRealize Operations Manager. You run one or more actions when you encounter objects where theconfiguration or state of the object is affecting your environment. These actions allow you to reclaim wastedspace, adjust memory, or conserve resources.
This procedure for running actions is based on the vRealize Operations Manager Actions menus and iscommonly used when you are troubleshooting problems. The available actions depend on the type ofobjects with which you are working. You can also run actions as alert recommendations.
Prerequisites
n Verify that the Python Remediation vCenter Adapters are configured for the actions for eachvCenter Server instance. See the vRealize Operations Manager Customization and Administration Guide.
n Ensure that you understand how to use the Power Off Allowed option if you are running Set CPUCount, Set Memory, and Set CPU Count and Memory actions. See “Working With Actions That UsePower Off Allowed,” on page 70.
Procedure
1 In vRealize Operations Manager, select the object in the environment inventory or select one or moreobjects it in a list view.
2 Click Actions on the main toolbar or in an embedded view.
3 Select one of the actions.
If you are working with a virtual machine, only the virtual machine is included in the dialog box. If youare working with clusters, hosts, or datastores, the dialog box that appears includes all objects.
4 Select the check box to run the action on the object, and click OK.
The action runs and a dialog box appears that displays the task ID.
5 To view the status of the job and verify that the job finished, click Recent Tasks or click OK to close thedialog box.
The Recent Tasks list appears, which includes the task you just started.
Chapter 1 Monitoring Objects in Your Managed Environment by Using vRealize Operations Manager
VMware, Inc. 73
What to do next
To verify that the job completed, click Administration in the left pane and click Recent Tasks. Find the taskname or task ID in the list and verify that the status is finished. See “Monitor Recent Task Status,” onpage 75.
Troubleshoot Actions in vRealize Operations ManagerIf you are missing data or cannot run actions from vRealize Operations Manager, review thetroubleshooting options.
Verify that your VMware Adapter is configured to connect to the correct vCenter Server instances. SeevRealize Operations Manager Customization and Administration Guide.
Verify that your Python Remediation vCenter Adapter is configured to connect to the correct vCenter Serverinstances. See vRealize Operations Manager Customization and Administration Guide.
n Missing Column Data in Actions Dialog Boxes on page 74Data is missing for one or more objects in an Actions dialog box, making it difficult to determine if youwant to run the action.
n Missing Column Data in the Set Memory for VM Dialog Box on page 74The read-only data columns do not display the current values, which makes it difficult to properlyspecify a new memory value.
n Host Name Does Not Appear in Action Dialog Box on page 75When you run an action on a virtual machine, the host name is blank in the action dialog box.
Missing Column Data in Actions Dialog BoxesData is missing for one or more objects in an Actions dialog box, making it difficult to determine if you wantto run the action.
Problem
When you run an action one or more objects, some of the fields are empty.
Cause
The VMware vSphere adapter has not collected the data from the vCenter Server instance that manages theobject or the current vRealize Operations Manager user does not have privileges to view the collected datafor the object.
Solution
1 Verify that vRealize Operations Manager is configured to collect the data.
2 Verify that you have the privileges necessary to view the data.
Missing Column Data in the Set Memory for VM Dialog BoxThe read-only data columns do not display the current values, which makes it difficult to properly specify anew memory value.
Problem
Current (MB) and Power State columns do not display the current values, which are collected for themanaged object.
vRealize Operations Manager User Guide
74 VMware, Inc.
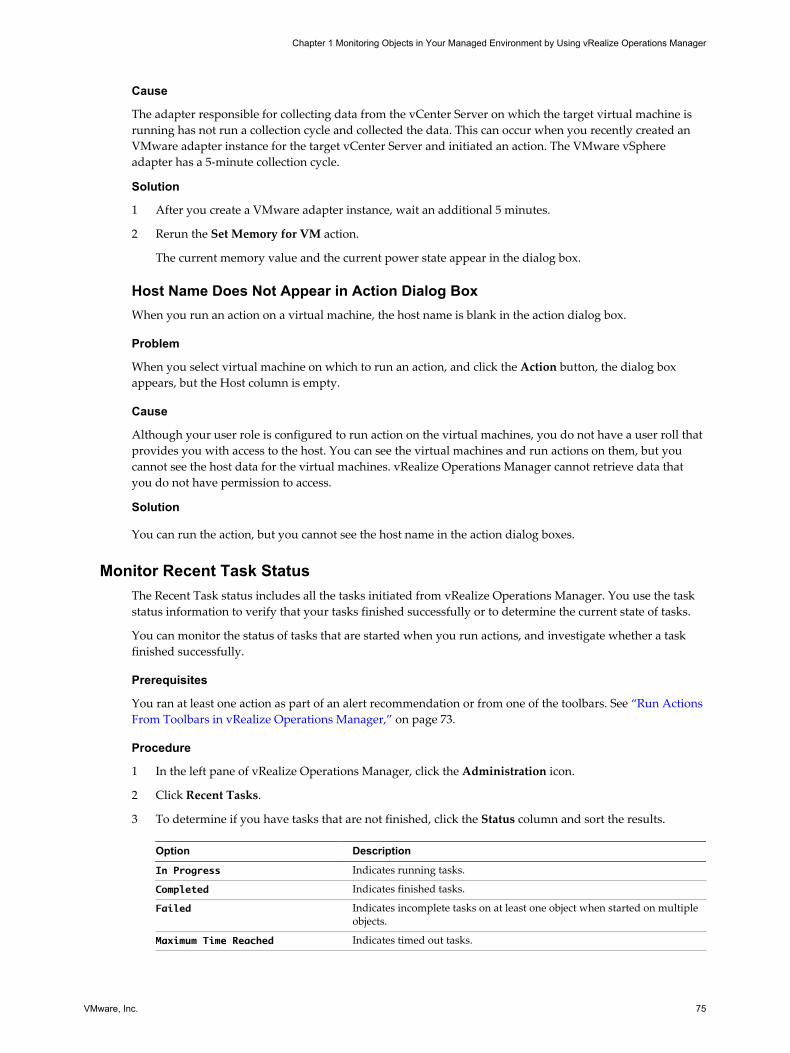
Cause
The adapter responsible for collecting data from the vCenter Server on which the target virtual machine isrunning has not run a collection cycle and collected the data. This can occur when you recently created anVMware adapter instance for the target vCenter Server and initiated an action. The VMware vSphereadapter has a 5-minute collection cycle.
Solution
1 After you create a VMware adapter instance, wait an additional 5 minutes.
2 Rerun the Set Memory for VM action.
The current memory value and the current power state appear in the dialog box.
Host Name Does Not Appear in Action Dialog BoxWhen you run an action on a virtual machine, the host name is blank in the action dialog box.
Problem
When you select virtual machine on which to run an action, and click the Action button, the dialog boxappears, but the Host column is empty.
Cause
Although your user role is configured to run action on the virtual machines, you do not have a user roll thatprovides you with access to the host. You can see the virtual machines and run actions on them, but youcannot see the host data for the virtual machines. vRealize Operations Manager cannot retrieve data thatyou do not have permission to access.
Solution
You can run the action, but you cannot see the host name in the action dialog boxes.
Monitor Recent Task StatusThe Recent Task status includes all the tasks initiated from vRealize Operations Manager. You use the taskstatus information to verify that your tasks finished successfully or to determine the current state of tasks.
You can monitor the status of tasks that are started when you run actions, and investigate whether a taskfinished successfully.
Prerequisites
You ran at least one action as part of an alert recommendation or from one of the toolbars. See “Run ActionsFrom Toolbars in vRealize Operations Manager,” on page 73.
Procedure
1 In the left pane of vRealize Operations Manager, click the Administration icon.
2 Click Recent Tasks.
3 To determine if you have tasks that are not finished, click the Status column and sort the results.
Option Description
In Progress Indicates running tasks.
Completed Indicates finished tasks.
Failed Indicates incomplete tasks on at least one object when started on multipleobjects.
Maximum Time Reached Indicates timed out tasks.
Chapter 1 Monitoring Objects in Your Managed Environment by Using vRealize Operations Manager
VMware, Inc. 75
4 To evaluate a task process, select the task in the list and review the information in the Details of TaskSelected pane.
The details appear in the Messages pane. If the information message includes No action taken, the taskfinished because the object was already in the requested state.
5 To view the messages for an object when the task included several objects, select the object in theAssociated Objects list.
To clear the object selection so that you can view all the messages, press the space bar.
What to do next
Troubleshoot tasks with a status of Maximum Time Reached or Failed to determine why a task did not runsuccessfully. See “Troubleshoot Failed Tasks,” on page 76.
Troubleshoot Failed TasksIf tasks fail to run in vRealize Operations Manager, review the Recent Tasks page and troubleshoot the taskto determine why it failed.
This information is a general procedure for using the information in Recent Tasks to troubleshoot problemsidentified in the tasks.
n Determine If a Recent Task Failed on page 77The Recent Tasks provide the status of action tasks initiated from vRealize Operations Manager. If youdo not see the expected results, review the tasks to determine if your task failed.
n Troubleshooting Maximum Time Reached Task Status on page 77An action task has a Maximum Time Reached status and you do not know the current status to the task.
n Troubleshooting Set CPU or Set Memory Failed Tasks on page 78An action task for Set CPU Count or Set Memory for VM has a Failed status in the recent task listbecause power off is not allowed.
n Troubleshooting Set CPU Count or Set Memory with Powered Off Allowed on page 78A Set CPU Count, Set Memory, or a Set CPU Count and Set Memory action indicates that the actionfailed in Recent Tasks.
n Troubleshooting Set CPU Count and Memory When Values Not Supported on page 79If you run the Set CPU Count or Set Memory actions with an unsupported value on a virtual machine,the virtual machine might be left in an unusable state and require you to resolve the problem invCenter Server.
n Troubleshooting Set CPU Resources or Set Memory Resources When the Value is Not Supported onpage 80If you run the Set CPU Resources action with an unsupported value on a virtual machine, the task failsand an error appears in the Recent Task messages.
n Troubleshooting Set CPU Resources or Set Memory Resources When the Value is Too High onpage 80If you run the Set CPU Resources or Set Memory Resources action with a value that is greater than thevalue that your vCenter Server instance supports, the task fails and an error appears in the RecentTasks messages.
n Troubleshooting Set Memory Resources When the Value is Not Evenly Divisible by 1024 on page 81If you run the Set Memory Resources action with a value that cannot convert from kilobytes tomegabytes, the task fails and an error appears in the Recent Task messages.
vRealize Operations Manager User Guide
76 VMware, Inc.
n Troubleshooting Failed Shut Down VM Action Status on page 81A shut down VM action task has a Failed status in the Recent Task list.
n Troubleshooting VMware Tools Not Running for a Shut Down VM Action Status on page 82A Shut down VM action task has a Failed status in the Recent Task list and the Message indicates thatVMware Tools were required.
n Troubleshooting Failed Delete Unused Snapshots Action Status on page 82A Delete Unused Snapshots action task has a Failed status in the Recent Task list.
Determine If a Recent Task FailedThe Recent Tasks provide the status of action tasks initiated from vRealize Operations Manager. If you donot see the expected results, review the tasks to determine if your task failed.
Procedure
1 In the left pane of vRealize Operations Manager, click the Administration icon.
2 Click Recent Tasks.
3 Select the failed task in the task list.
4 In the Messages list, locate the occurrences of Script Return Result: Failure and review theinformation between this value and <-- Executing:[script name] on {object type}.
Script Return Result is the end of action run and <-- Executing indicates the beginning. Theinformation provided includes the parameters that are passed, the target object, and unexpectedexceptions that you can use to identify the problem.
Troubleshooting Maximum Time Reached Task StatusAn action task has a Maximum Time Reached status and you do not know the current status to the task.
Problem
The Recent Tasks list indicates that a task had a status of Maximum Time Reached.
The task is running past the amount of time that is the default or configured value. To determine the currentstatus, you must troubleshoot the initiated action.
Cause
The task is running past the amount of time that is the default or configured value for one of the followingreasons:
n The action is exceptionally long running and did not finish before the threshold timeout was reached.
n The action adapter did not receive a response from the target system before reaching the timeout. Theaction might have completed successfully, but the completion status was not returned tovRealize Operations Manager.
n The action did not start correctly.
n The action adapter might have an error and be unable to report the status.
Solution
Check the state of the target object to determine whether the action completed successfully. If it did not,continue investigating to find the root cause.
Chapter 1 Monitoring Objects in Your Managed Environment by Using vRealize Operations Manager
VMware, Inc. 77
Troubleshooting Set CPU or Set Memory Failed TasksAn action task for Set CPU Count or Set Memory for VM has a Failed status in the recent task list becausepower off is not allowed.
Problem
The Recent Tasks list indicates that a Set CPU Count, Set Memory, or Set CPU and Memory task has a statusof Failed. When you evaluate the Messages list for the selected task, you see this message.
Unable to perform action. Virtual Machine found
powered on, power off not allowed
When you increase memory or CPU count, you see this message.
Virtual Machine found powered on, power off not allowed, if hot add is
enabled the hotPlugLimit is exceeded
Cause
You submitted the action to increase or decrease the CPU or memory value without selecting the AllowPower Off option. When you ran the action where a target object is currently powered on and whereMemory Hot Plug is not enabled for the target object in vCenter Server, the action fails.
Solution
1 Either enable Memory Hot Plug on your target virtual machines in vCenter Server or select AllowPower Off when you run the Set CPU Count, Set Memory, or Set CPU and Memory actions.
2 Check your hot plug limit in vCenter Server.
Troubleshooting Set CPU Count or Set Memory with Powered Off AllowedA Set CPU Count, Set Memory, or a Set CPU Count and Set Memory action indicates that the action failed inRecent Tasks.
Problem
When you run an action that changes the CPU count, the memory, or both, the action fails even though youknow that the Power Off Allowed was selected, the virtual machine is running, and the VMware Tools areinstalled and running.
Cause
The virtual machine should shut down the guest operating system before it powers off the virtual machineto make the requested changes. The shut down process waits 120 seconds for a response from the targetvirtual machine, and fails without making changes to the virtual machine.
Solution
1 Check the target virtual machine in vCenter Server to determine if it has jobs running that are delayingthe implementation of the action.
2 Retry the action from vRealize Operations Manager.
vRealize Operations Manager User Guide
78 VMware, Inc.
Troubleshooting Set CPU Count and Memory When Values Not SupportedIf you run the Set CPU Count or Set Memory actions with an unsupported value on a virtual machine, thevirtual machine might be left in an unusable state and require you to resolve the problem in vCenter Server.
Problem
You cannot power on a virtual machine after you successfully run the Set CPU Count or Set Memoryactions. When you review the messages in Recent Tasks for the failed Power On VM action, you seemessages stating that the host does not support the new CPU count or new memory value.
Cause
Because of the way that vCenter Server validates changes in the CPU and memory values, you can use thevRealize Operations Manager actions to change the value to an unsupported amount if you run the actionwhen the virtual machine is powered off.
If the object was powered on, the task fails, but rolls back any value changes and powers the machine backon. If the object was powered off, the task succeeds, the value is changed in vCenter Server, but the targetobject is left in a state where you cannot power it on using the actions or in vCenter Server withoutmanually changing the CPU or memory to a supported value.
Solution
1 In the left pane of vRealize Operations Manager, click the Administration icon.
2 Click Recent Tasks.
3 In the task list, locate your failed Power On VM action, and review the messages associated with thetask.
4 Look for a message that indicates why the task failed.
For example, if you ran a Set CPU Count action on a powered off virtual machine to increase the CPUcount from 2 to 4, but 4 CPUs is not supported by the host. The Set CPU tasks reported that itcompleted successfully in recent tasks. However, when you attempt to power on the virtual machine,the tasks fails. In this example the message is Virtual machine requires 4 CPUs to operate, but thehost hardware only provides 2.
5 Click the object name in the Recent Task list.
The main pane updates to display the object details for the selected object.
6 Click the Actions menu on the toolbar and click Open Virtual Machine in vSphere Client.
The vSphere Web Client opens with the virtual machine as the current object.
7 In the vSphere Web Client, click the Manage tab and click VM Hardware.
8 Click Edit.
9 In the Edit Settings dialog box, change the CPU count or memory to a supported value and click OK.
You can now power on the virtual machine from the Web client or from vRealize Operations Manager.
Chapter 1 Monitoring Objects in Your Managed Environment by Using vRealize Operations Manager
VMware, Inc. 79
Troubleshooting Set CPU Resources or Set Memory Resources When the Value isNot SupportedIf you run the Set CPU Resources action with an unsupported value on a virtual machine, the task fails andan error appears in the Recent Task messages.
Problem
The Recent Tasks list indicates that a Set CPU Resource or Set Memory Resource action has a state of Failed.When you evaluate the Messages list for the selected task, you see a message similar to the followingexamples.
RuntimeFault exception, message:[A specified parameter was not correct.
spec.cpuAllocation.reservation]
RuntimeFault exception, message:[A specified parameter was not correct.
spec.cpuAllocation.limits]
Cause
You submitted the action to increase or decrease the CPU or memory reservation or limit value with anunsupported value. For example, if you supplied a negative integer other than -1, which sets the value tounlimited, vCenter Server could not make the change and the action failed.
Solution
u Run the action with a supported value.
The supported values for reservation include 0 or a value greater than 0. The supported values for limitinclude -1, 0, or a value greater than 0.
Troubleshooting Set CPU Resources or Set Memory Resources When the Value isToo HighIf you run the Set CPU Resources or Set Memory Resources action with a value that is greater than the valuethat your vCenter Server instance supports, the task fails and an error appears in the Recent Tasks messages.
Problem
The Recent Tasks list indicates that a Set CPU Resource or Set Memory Resource action has a state of Failed.When you evaluate the Messages list for the selected task, you see messages similar to the followingexamples.
If you are working with Set CPU Resources, the information message is similar to the following example,where 1000000000 is the supplied reservation value.
Reconfiguring the Virtual Machine Reservation to:[1000000000] Mhz
The error message for this action is similar to this example.
RuntimeFault exception, message:[A specified parameter was not correct. reservation]
If you are working with Set Memory Resources, the information message is similar to the followingexample, where 1000000000 is the supplied reservation value.
Reconfiguring the Virtual Machine Reservation to:[1000000000] (MB)
The error message for this action is similar to this example.
RuntimeFault exception, message:[A specified parameter was not correct.
spec.memoryAllocation.reservation]
vRealize Operations Manager User Guide
80 VMware, Inc.
Cause
You submitted the action to change the CPU or memory reservation or limit value to a value greater thanthe value supported by vCenter Server, or the submitted reservation value is greater than the limit.
Solution
u Run the action using a lower value.
Troubleshooting Set Memory Resources When the Value is Not Evenly Divisibleby 1024If you run the Set Memory Resources action with a value that cannot convert from kilobytes to megabytes,the task fails and an error appears in the Recent Task messages.
Problem
The Recent Tasks list indicates that a Set Memory Resource action has a state of Failed. When you evaluatethe Messages list for the selected task, you see a message similar to the following example.
Parameter validation;[newLimitKB] failed conversion to (MB, (KB)[2000] not evenly divisible by
1024
Cause
Because vCenter Server manages memory reservations and limit values in megabytes, butvRealize Operations Manager calculates and reports on memory in kilobytes, you must provide a value inkilobytes that is directly convertible to megabytes. To do that, the value must be evenly divisible by 1024.
Solution
u Run the action where the reservation and limit values are configured with supported values.
The supported values for reservation include 0 or a value greater than 0 that is evenly divisible by 1024.The supported values for a limit include -1, 0, or a value greater than 0 that is evenly divisible by 1024.
Troubleshooting Failed Shut Down VM Action StatusA shut down VM action task has a Failed status in the Recent Task list.
Problem
The Shut Down VM action did not run successfully.
The Recent Tasks list indicates that a Shut Down VM action has a task status of Failed. When you evaluatethe Messages list for the selected job, you see Failure: Shut down confirmation timeout.
Cause
The shut down process involves shutting down the guest operating system and powering off the virtualmachine. The wait time is 120 seconds to shut down the guest operating system. If the guest operatingsystem does not shut down in this time, the action fails because the shut down action is not confirmed.
Solution
u Check the status of the guest operating system in vCenter Server to determine why is did not shutdown in the allotted time.
Chapter 1 Monitoring Objects in Your Managed Environment by Using vRealize Operations Manager
VMware, Inc. 81
Troubleshooting VMware Tools Not Running for a Shut Down VM Action StatusA Shut down VM action task has a Failed status in the Recent Task list and the Message indicates thatVMware Tools were required.
Problem
The Shutdown VM action did not run successfully.
The Recent Tasks list indicates that a Shutdown VM action has a tasks status of Failed. When you evaluatethe Messages list for the selected job, you see VMware Tools: Not running (Not installed).
Cause
The Shutdown VM action requires that VMware Tools be installed and running on the target virtualmachines. If you ran the action on more than one object, then VMware Tools was not installed, or installedbut not running, on at least one of the virtual machines.
Solution
u In the vCenter Server instance that manages the virtual machine that failed to run the action, install andstart VMware Tools on the affected virtual machines.
Troubleshooting Failed Delete Unused Snapshots Action StatusA Delete Unused Snapshots action task has a Failed status in the Recent Task list.
Problem
The Delete Unused Snapshots action did not run successfully.
The Recent Tasks list indicates that a Delete Unused Snapshots action has a tasks status of Failed. When youevaluate the Messages list for the selected job, you see this message.
Remove snapshot failed, response wait expired after:[120] seconds,
unable to confirm removal
Cause
The delete snapshot process involves waiting for access to datastores. The wait time is 600 seconds to accessthe datastore and delete the snapshot. If the delete request is not passed to the datastore in that time, theaction does not finish the delete snapshot action.
Solution
1 Check the status of the snapshot in vCenter Server to determine if it was deleted.
2 If it was not, submit the delete snapshot request at a different time.
Monitoring Objects in Your Storage TopologyThe Storage Devices adapter discovers and monitors the data in your storage topology as it travels from theESX host, through the storage switches, to the storage array and back. If you notice a problem in yourstorage topology, you can use information that the Storage Devices adapter collects forvRealize Operations Manager to help identify and resolve the problem.
vRealize Operations Manager User Guide
82 VMware, Inc.
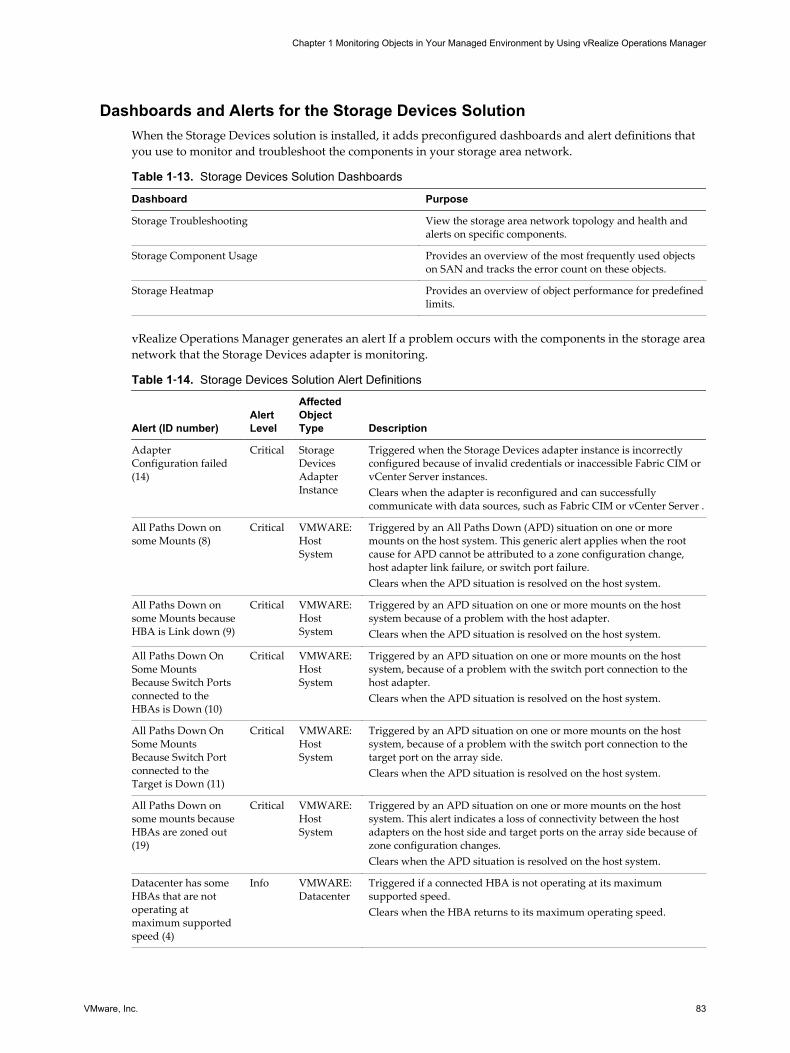
Dashboards and Alerts for the Storage Devices SolutionWhen the Storage Devices solution is installed, it adds preconfigured dashboards and alert definitions thatyou use to monitor and troubleshoot the components in your storage area network.
Table 1‑13. Storage Devices Solution Dashboards
Dashboard Purpose
Storage Troubleshooting View the storage area network topology and health andalerts on specific components.
Storage Component Usage Provides an overview of the most frequently used objectson SAN and tracks the error count on these objects.
Storage Heatmap Provides an overview of object performance for predefinedlimits.
vRealize Operations Manager generates an alert If a problem occurs with the components in the storage areanetwork that the Storage Devices adapter is monitoring.
Table 1‑14. Storage Devices Solution Alert Definitions
Alert (ID number)AlertLevel
AffectedObjectType Description
AdapterConfiguration failed(14)
Critical StorageDevicesAdapterInstance
Triggered when the Storage Devices adapter instance is incorrectlyconfigured because of invalid credentials or inaccessible Fabric CIM orvCenter Server instances.Clears when the adapter is reconfigured and can successfullycommunicate with data sources, such as Fabric CIM or vCenter Server .
All Paths Down onsome Mounts (8)
Critical VMWARE:HostSystem
Triggered by an All Paths Down (APD) situation on one or moremounts on the host system. This generic alert applies when the rootcause for APD cannot be attributed to a zone configuration change,host adapter link failure, or switch port failure.Clears when the APD situation is resolved on the host system.
All Paths Down onsome Mounts becauseHBA is Link down (9)
Critical VMWARE:HostSystem
Triggered by an APD situation on one or more mounts on the hostsystem because of a problem with the host adapter.Clears when the APD situation is resolved on the host system.
All Paths Down OnSome MountsBecause Switch Portsconnected to theHBAs is Down (10)
Critical VMWARE:HostSystem
Triggered by an APD situation on one or more mounts on the hostsystem, because of a problem with the switch port connection to thehost adapter.Clears when the APD situation is resolved on the host system.
All Paths Down OnSome MountsBecause Switch Portconnected to theTarget is Down (11)
Critical VMWARE:HostSystem
Triggered by an APD situation on one or more mounts on the hostsystem, because of a problem with the switch port connection to thetarget port on the array side.Clears when the APD situation is resolved on the host system.
All Paths Down onsome mounts becauseHBAs are zoned out(19)
Critical VMWARE:HostSystem
Triggered by an APD situation on one or more mounts on the hostsystem. This alert indicates a loss of connectivity between the hostadapters on the host side and target ports on the array side because ofzone configuration changes.Clears when the APD situation is resolved on the host system.
Datacenter has someHBAs that are notoperating atmaximum supportedspeed (4)
Info VMWARE:Datacenter
Triggered if a connected HBA is not operating at its maximumsupported speed.Clears when the HBA returns to its maximum operating speed.
Chapter 1 Monitoring Objects in Your Managed Environment by Using vRealize Operations Manager
VMware, Inc. 83
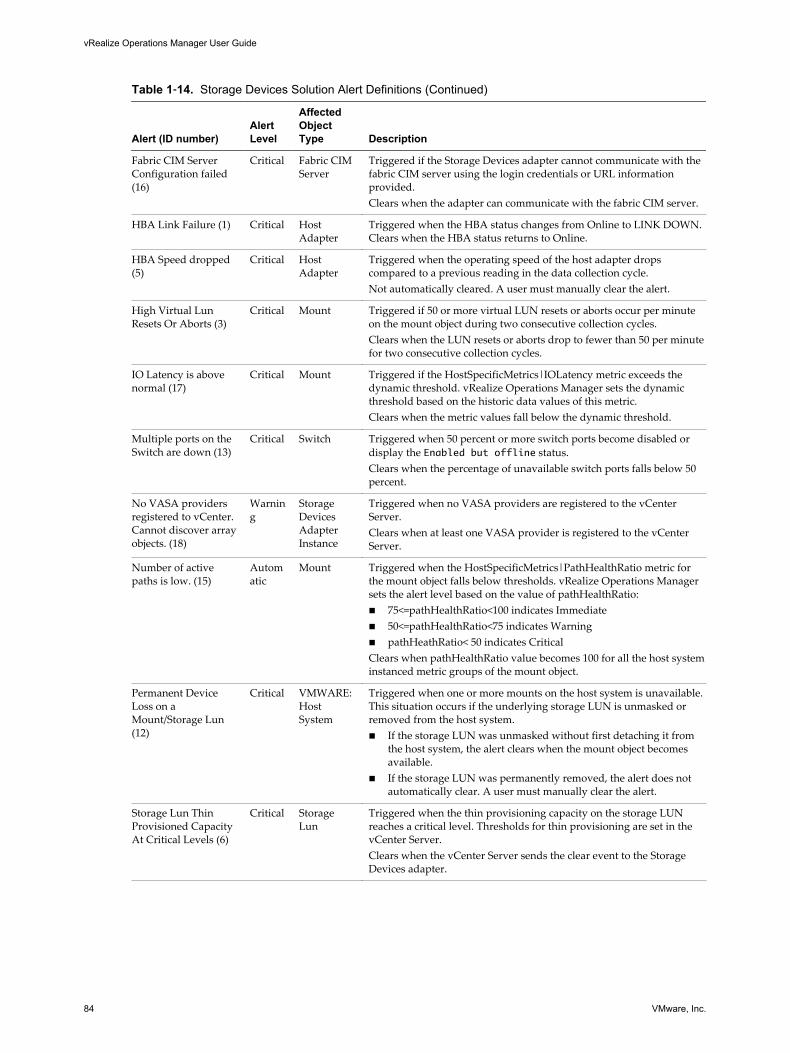
Table 1‑14. Storage Devices Solution Alert Definitions (Continued)
Alert (ID number)AlertLevel
AffectedObjectType Description
Fabric CIM ServerConfiguration failed(16)
Critical Fabric CIMServer
Triggered if the Storage Devices adapter cannot communicate with thefabric CIM server using the login credentials or URL informationprovided.Clears when the adapter can communicate with the fabric CIM server.
HBA Link Failure (1) Critical HostAdapter
Triggered when the HBA status changes from Online to LINK DOWN.Clears when the HBA status returns to Online.
HBA Speed dropped(5)
Critical HostAdapter
Triggered when the operating speed of the host adapter dropscompared to a previous reading in the data collection cycle.Not automatically cleared. A user must manually clear the alert.
High Virtual LunResets Or Aborts (3)
Critical Mount Triggered if 50 or more virtual LUN resets or aborts occur per minuteon the mount object during two consecutive collection cycles.Clears when the LUN resets or aborts drop to fewer than 50 per minutefor two consecutive collection cycles.
IO Latency is abovenormal (17)
Critical Mount Triggered if the HostSpecificMetrics|IOLatency metric exceeds thedynamic threshold. vRealize Operations Manager sets the dynamicthreshold based on the historic data values of this metric.Clears when the metric values fall below the dynamic threshold.
Multiple ports on theSwitch are down (13)
Critical Switch Triggered when 50 percent or more switch ports become disabled ordisplay the Enabled but offline status.Clears when the percentage of unavailable switch ports falls below 50percent.
No VASA providersregistered to vCenter.Cannot discover arrayobjects. (18)
Warning
StorageDevicesAdapterInstance
Triggered when no VASA providers are registered to the vCenterServer.Clears when at least one VASA provider is registered to the vCenterServer.
Number of activepaths is low. (15)
Automatic
Mount Triggered when the HostSpecificMetrics|PathHealthRatio metric forthe mount object falls below thresholds. vRealize Operations Managersets the alert level based on the value of pathHealthRatio:n 75<=pathHealthRatio<100 indicates Immediaten 50<=pathHealthRatio<75 indicates Warningn pathHeathRatio< 50 indicates CriticalClears when pathHealthRatio value becomes 100 for all the host systeminstanced metric groups of the mount object.
Permanent DeviceLoss on aMount/Storage Lun(12)
Critical VMWARE:HostSystem
Triggered when one or more mounts on the host system is unavailable.This situation occurs if the underlying storage LUN is unmasked orremoved from the host system.n If the storage LUN was unmasked without first detaching it from
the host system, the alert clears when the mount object becomesavailable.
n If the storage LUN was permanently removed, the alert does notautomatically clear. A user must manually clear the alert.
Storage Lun ThinProvisioned CapacityAt Critical Levels (6)
Critical StorageLun
Triggered when the thin provisioning capacity on the storage LUNreaches a critical level. Thresholds for thin provisioning are set in thevCenter Server.Clears when the vCenter Server sends the clear event to the StorageDevices adapter.
vRealize Operations Manager User Guide
84 VMware, Inc.
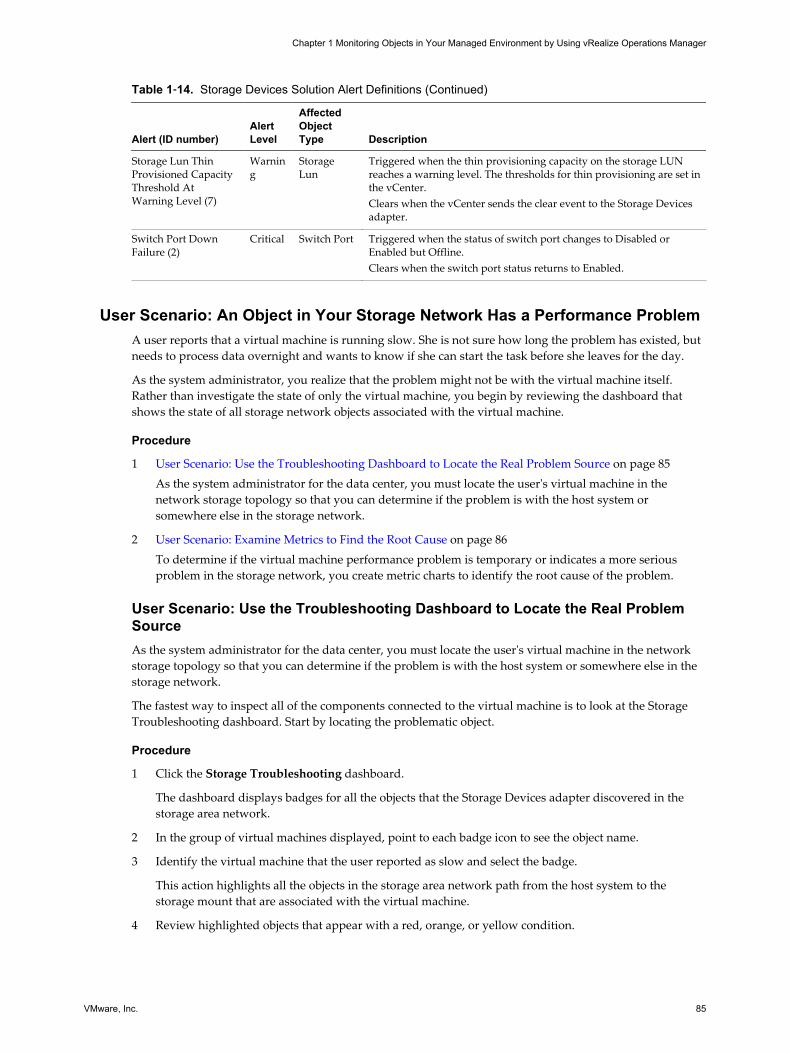
Table 1‑14. Storage Devices Solution Alert Definitions (Continued)
Alert (ID number)AlertLevel
AffectedObjectType Description
Storage Lun ThinProvisioned CapacityThreshold AtWarning Level (7)
Warning
StorageLun
Triggered when the thin provisioning capacity on the storage LUNreaches a warning level. The thresholds for thin provisioning are set inthe vCenter.Clears when the vCenter sends the clear event to the Storage Devicesadapter.
Switch Port DownFailure (2)
Critical Switch Port Triggered when the status of switch port changes to Disabled orEnabled but Offline.Clears when the switch port status returns to Enabled.
User Scenario: An Object in Your Storage Network Has a Performance ProblemA user reports that a virtual machine is running slow. She is not sure how long the problem has existed, butneeds to process data overnight and wants to know if she can start the task before she leaves for the day.
As the system administrator, you realize that the problem might not be with the virtual machine itself.Rather than investigate the state of only the virtual machine, you begin by reviewing the dashboard thatshows the state of all storage network objects associated with the virtual machine.
Procedure
1 User Scenario: Use the Troubleshooting Dashboard to Locate the Real Problem Source on page 85As the system administrator for the data center, you must locate the user's virtual machine in thenetwork storage topology so that you can determine if the problem is with the host system orsomewhere else in the storage network.
2 User Scenario: Examine Metrics to Find the Root Cause on page 86To determine if the virtual machine performance problem is temporary or indicates a more seriousproblem in the storage network, you create metric charts to identify the root cause of the problem.
User Scenario: Use the Troubleshooting Dashboard to Locate the Real ProblemSourceAs the system administrator for the data center, you must locate the user's virtual machine in the networkstorage topology so that you can determine if the problem is with the host system or somewhere else in thestorage network.
The fastest way to inspect all of the components connected to the virtual machine is to look at the StorageTroubleshooting dashboard. Start by locating the problematic object.
Procedure
1 Click the Storage Troubleshooting dashboard.
The dashboard displays badges for all the objects that the Storage Devices adapter discovered in thestorage area network.
2 In the group of virtual machines displayed, point to each badge icon to see the object name.
3 Identify the virtual machine that the user reported as slow and select the badge.
This action highlights all the objects in the storage area network path from the host system to thestorage mount that are associated with the virtual machine.
4 Review highlighted objects that appear with a red, orange, or yellow condition.
Chapter 1 Monitoring Objects in Your Managed Environment by Using vRealize Operations Manager
VMware, Inc. 85
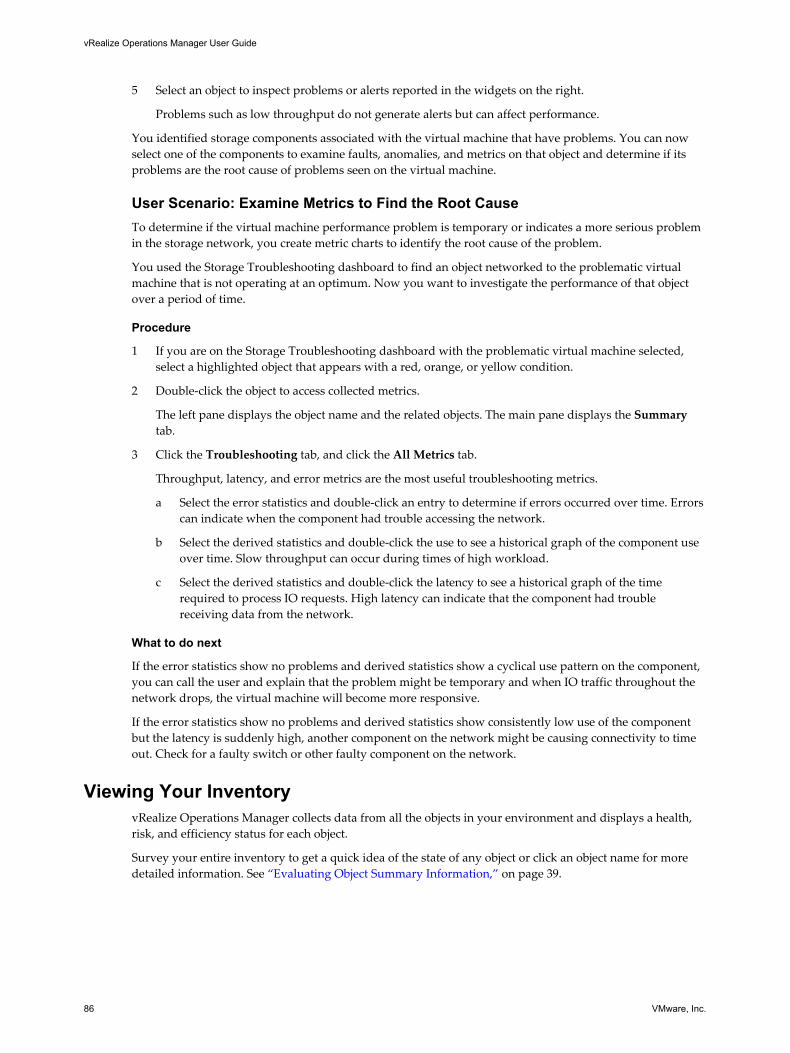
5 Select an object to inspect problems or alerts reported in the widgets on the right.
Problems such as low throughput do not generate alerts but can affect performance.
You identified storage components associated with the virtual machine that have problems. You can nowselect one of the components to examine faults, anomalies, and metrics on that object and determine if itsproblems are the root cause of problems seen on the virtual machine.
User Scenario: Examine Metrics to Find the Root CauseTo determine if the virtual machine performance problem is temporary or indicates a more serious problemin the storage network, you create metric charts to identify the root cause of the problem.
You used the Storage Troubleshooting dashboard to find an object networked to the problematic virtualmachine that is not operating at an optimum. Now you want to investigate the performance of that objectover a period of time.
Procedure
1 If you are on the Storage Troubleshooting dashboard with the problematic virtual machine selected,select a highlighted object that appears with a red, orange, or yellow condition.
2 Double-click the object to access collected metrics.
The left pane displays the object name and the related objects. The main pane displays the Summarytab.
3 Click the Troubleshooting tab, and click the All Metrics tab.
Throughput, latency, and error metrics are the most useful troubleshooting metrics.
a Select the error statistics and double-click an entry to determine if errors occurred over time. Errorscan indicate when the component had trouble accessing the network.
b Select the derived statistics and double-click the use to see a historical graph of the component useover time. Slow throughput can occur during times of high workload.
c Select the derived statistics and double-click the latency to see a historical graph of the timerequired to process IO requests. High latency can indicate that the component had troublereceiving data from the network.
What to do next
If the error statistics show no problems and derived statistics show a cyclical use pattern on the component,you can call the user and explain that the problem might be temporary and when IO traffic throughout thenetwork drops, the virtual machine will become more responsive.
If the error statistics show no problems and derived statistics show consistently low use of the componentbut the latency is suddenly high, another component on the network might be causing connectivity to timeout. Check for a faulty switch or other faulty component on the network.
Viewing Your InventoryvRealize Operations Manager collects data from all the objects in your environment and displays a health,risk, and efficiency status for each object.
Survey your entire inventory to get a quick idea of the state of any object or click an object name for moredetailed information. See “Evaluating Object Summary Information,” on page 39.
vRealize Operations Manager User Guide
86 VMware, Inc.
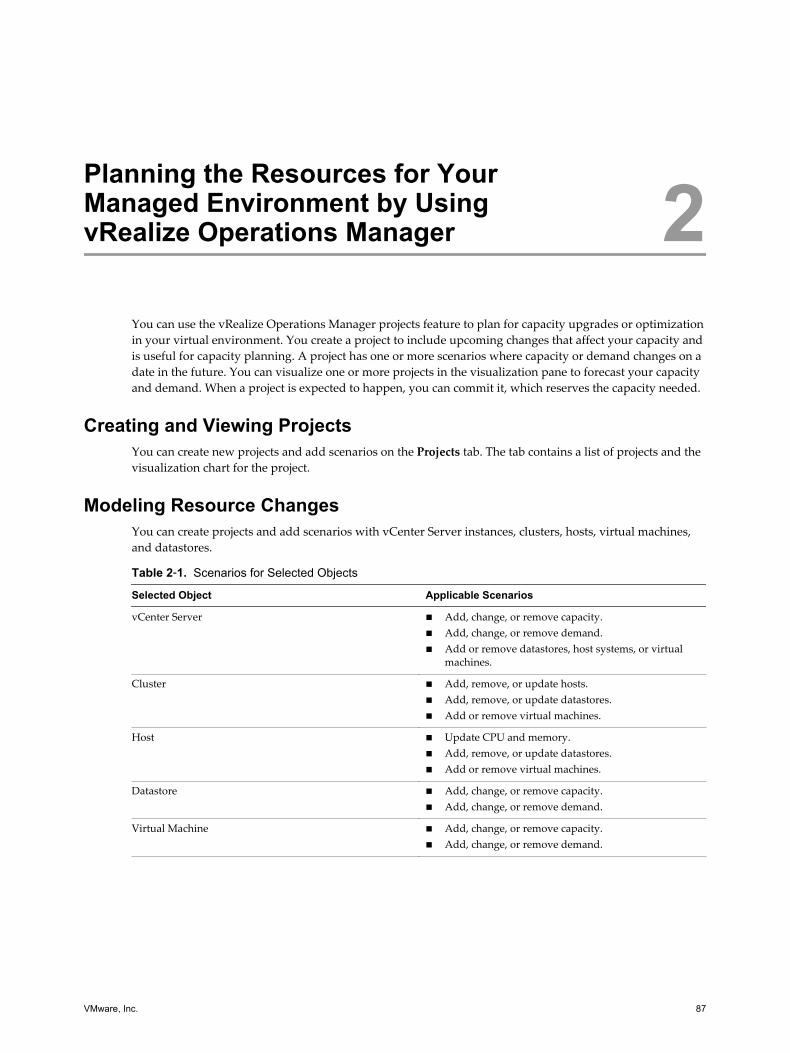
Planning the Resources for YourManaged Environment by UsingvRealize Operations Manager 2
You can use the vRealize Operations Manager projects feature to plan for capacity upgrades or optimizationin your virtual environment. You create a project to include upcoming changes that affect your capacity andis useful for capacity planning. A project has one or more scenarios where capacity or demand changes on adate in the future. You can visualize one or more projects in the visualization pane to forecast your capacityand demand. When a project is expected to happen, you can commit it, which reserves the capacity needed.
Creating and Viewing ProjectsYou can create new projects and add scenarios on the Projects tab. The tab contains a list of projects and thevisualization chart for the project.
Modeling Resource ChangesYou can create projects and add scenarios with vCenter Server instances, clusters, hosts, virtual machines,and datastores.
Table 2‑1. Scenarios for Selected Objects
Selected Object Applicable Scenarios
vCenter Server n Add, change, or remove capacity.n Add, change, or remove demand.n Add or remove datastores, host systems, or virtual
machines.
Cluster n Add, remove, or update hosts.n Add, remove, or update datastores.n Add or remove virtual machines.
Host n Update CPU and memory.n Add, remove, or update datastores.n Add or remove virtual machines.
Datastore n Add, change, or remove capacity.n Add, change, or remove demand.
Virtual Machine n Add, change, or remove capacity.n Add, change, or remove demand.
VMware, Inc. 87
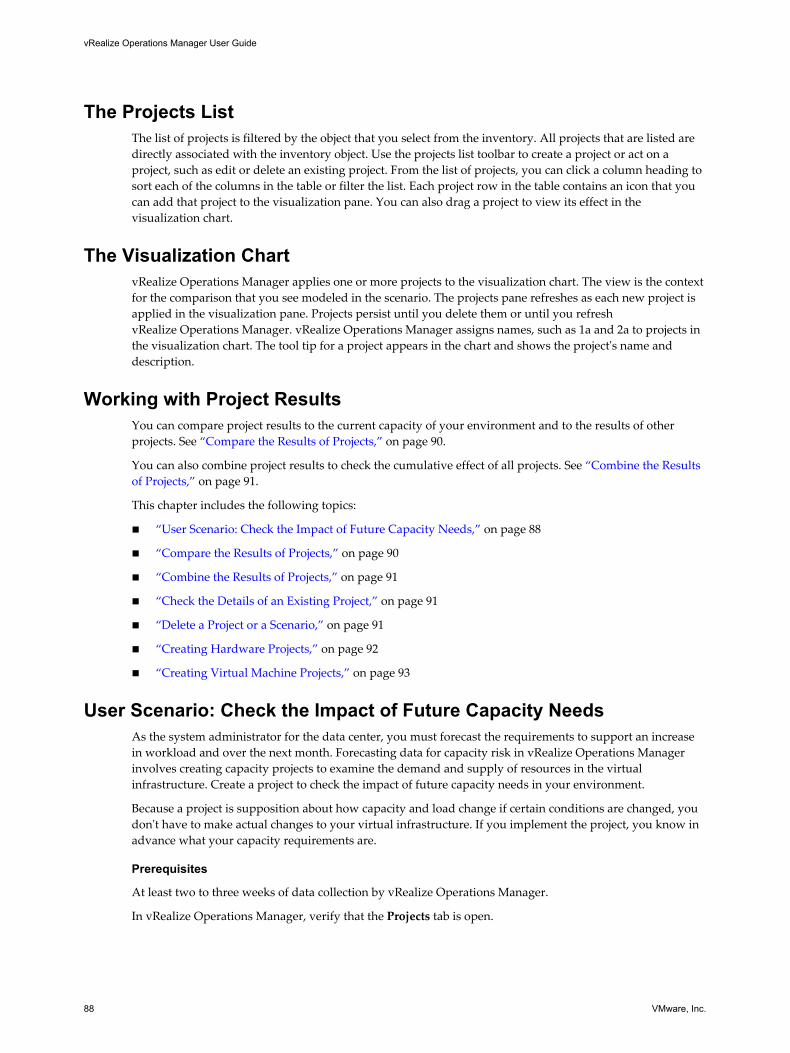
The Projects ListThe list of projects is filtered by the object that you select from the inventory. All projects that are listed aredirectly associated with the inventory object. Use the projects list toolbar to create a project or act on aproject, such as edit or delete an existing project. From the list of projects, you can click a column heading tosort each of the columns in the table or filter the list. Each project row in the table contains an icon that youcan add that project to the visualization pane. You can also drag a project to view its effect in thevisualization chart.
The Visualization ChartvRealize Operations Manager applies one or more projects to the visualization chart. The view is the contextfor the comparison that you see modeled in the scenario. The projects pane refreshes as each new project isapplied in the visualization pane. Projects persist until you delete them or until you refreshvRealize Operations Manager. vRealize Operations Manager assigns names, such as 1a and 2a to projects inthe visualization chart. The tool tip for a project appears in the chart and shows the project's name anddescription.
Working with Project ResultsYou can compare project results to the current capacity of your environment and to the results of otherprojects. See “Compare the Results of Projects,” on page 90.
You can also combine project results to check the cumulative effect of all projects. See “Combine the Resultsof Projects,” on page 91.
This chapter includes the following topics:
n “User Scenario: Check the Impact of Future Capacity Needs,” on page 88
n “Compare the Results of Projects,” on page 90
n “Combine the Results of Projects,” on page 91
n “Check the Details of an Existing Project,” on page 91
n “Delete a Project or a Scenario,” on page 91
n “Creating Hardware Projects,” on page 92
n “Creating Virtual Machine Projects,” on page 93
User Scenario: Check the Impact of Future Capacity NeedsAs the system administrator for the data center, you must forecast the requirements to support an increasein workload and over the next month. Forecasting data for capacity risk in vRealize Operations Managerinvolves creating capacity projects to examine the demand and supply of resources in the virtualinfrastructure. Create a project to check the impact of future capacity needs in your environment.
Because a project is supposition about how capacity and load change if certain conditions are changed, youdon't have to make actual changes to your virtual infrastructure. If you implement the project, you know inadvance what your capacity requirements are.
Prerequisites
At least two to three weeks of data collection by vRealize Operations Manager.
In vRealize Operations Manager, verify that the Projects tab is open.
vRealize Operations Manager User Guide
88 VMware, Inc.
User Scenario: Create a Project to Increase WorkloadYou can create a project by using a cluster configured with virtual machines. Create a scenario to increaseoverall workload by 50 percent in the following month.
In this project, you want to see what happens if you increase demand on a cluster.
Prerequisites
In vRealize Operations Manager, verify that the Projects tab is open.
Procedure
1 Select a target cluster in the inventory panel.
The target host is where you simulate changes to the environment to examine possible outcomes. Makesure that the target cluster includes many virtual machines.
2 Click the Projects tab and click the Add New Project icon.
3 From the Projects workspace, enter the name and a description of the project.
For example, name the project Cluster Load Increase.
4 Select Planned status.
5 Click Scenarios to add scenarios to this project.
6 Select the Add Demand: add percentage of demand scenario and drag it to the Scenarios pane.
7 In the Configuration pane, change the implementation date to be one month from today.
8 Change the global value to 50 percent
9 Click Save to add the scenario to the project.
10 Click Close to close the Project Workspace.
vRealize Operations Manager applies the scenario to the project.
What to do next
Create a project to add virtual machines and add ESX hosts to the cluster. See “User Scenario: Create aProject to Add VMs and Hosts,” on page 89.
User Scenario: Create a Project to Add VMs and HostsYou can create another Project for the same cluster. Create scenarios to add virtual machines and hosts.
In this project, you create another planned project for the same cluster. The visualization shows the effect ifyou add a new virtual machine and hosts to the cluster.
Prerequisites
vRealize Operations Manager, verify that the Projects tab is open.
Procedure
1 Select the target host in the inventory panel.
The target host is where you simulate changes to the environment to examine possible outcomes.
2 Click the Project tab and click the Add New Project icon.
3 On the Projects workspace, enter the name and a description of the project.
For example, New VMs and Hosts.
Chapter 2 Planning the Resources for Your Managed Environment by Using vRealize Operations Manager
VMware, Inc. 89
4 Select the Planned status.
5 Click Scenarios to add scenarios to this project.
6 Select the Add Demand: Add Virtual Machine scenario and drag it to the Scenarios pane.
7 In the Configuration pane, add ten virtual machines with 43 GB of memory and 2 CPU cores.
8 Select the Add Capacity: Add Host System scenario and drag it to the Scenarios pane.
9 Add two ESX hosts with 8 GB of memory and 4 CPU cores.
10 Click Save to add the scenario to the project.
11 Click Close to close the Project Workspace.
vRealize Operations Manager applies the scenarios to the project.
What to do next
Now, you can visualize the effect of two capacity planning project using the visualization chart. “UserScenario: Visualize the Effect of Two Capacity Planning Projects,” on page 90.
User Scenario: Visualize the Effect of Two Capacity Planning ProjectsNow you can add the project to increase capacity needs with the project to add virtual machines and hosts.
Verify that you created at least two projects.
Prerequisites
In vRealize Operations Manager, verify that the Projects tab is open.
Procedure
1 On the Projects tab, select the Cluster Load Increase project and the New VMs and Hosts project fromthe list of projects and add them to the visualization chart.
2 Select Combine projects in this visualization.
The combined values for all projects appear as dotted lines in the visualization chart.
What to do next
Determine whether to change the planned projects to committed projects based on the results in thevisualization chart.
Compare the Results of ProjectsYou can compare project results to the actual capacity of your environment and to other project results anddetermine the best course of action. The list of projects that you created appears in the list of projects on theProjects tab.
Verify that you created at least two projects.
Procedure
1 On the Projects tab, select one or more projects from the list of projects and add them to thevisualization chart.
2 Select Compare projects in this visualization.
Existing data and project data appear in different line styles in the visualization pane.
vRealize Operations Manager User Guide
90 VMware, Inc.
What to do next
You can combine project results to assess the cumulative effect of all projects.
Combine the Results of ProjectsYou can combine the results of all projects to assess their cumulative effect on your environment. The list ofprojects that you create appears in the list of projects pane on the Projects tab.
Verify that you created at least two projects.
Procedure
1 From the Projects tab, select one or more projects from the list of projects and add them to thevisualization chart.
2 Select Combine projects in this visualization.
The combined values for all projects appear as dotted lines in the visualization chart.
What to do next
You can compare the results of different projects to determine the best course of action.
Check the Details of an Existing ProjectYou can check the parameters of a project from the Projects tab.
Prerequisites
In vRealize Operations Manager, verify that the Project tab is open.
Procedure
1 On the Projects tab, click the link to the project in the Project Name column to view the parameters ofthat project.
An information dialog box displays the details of the selected scenario.
2 Click Close to return to the list view.
What to do next
To change to parameters of the project, select the project and click the Edit Selected Project icon.
Delete a Project or a ScenarioThe list of projects you created appears on the Projects tab in the projects list. You can delete a project orremove one or more scenarios from a project.
When you finish examining a project, you can delete it. You can also modify a project by deleting thescenarios configured with the project.
Prerequisites
In vRealize Operations Manager, verify that the Projects tab is open.
Procedure
1 To delete a project, select the project and click the X icon.
A confirmation dialog box appears.
2 Click Yes to confirm the deletion.
Chapter 2 Planning the Resources for Your Managed Environment by Using vRealize Operations Manager
VMware, Inc. 91
vRealize Operations Manager refreshes the view in the Projects pane to remove project.
Creating Hardware ProjectsCreating a capacity project for hardware involves changing the host hardware followed by the datastorehardware. Before you purchase new hardware, create some projects to determine if the purchase isnecessary.
If you implement a hardware change project, you know in advance what your capacity requirements are.You can use projects to plan for hardware changes in your environment for the following circumstances.
n If you implement a new application, do you have enough resources to support the disk space requiredfor the deployment?
n If you add three servers to an existing cluster, will that be enough to sustain the increase in bandwidththrough Q4?
n What would happen if you made a configuration change to your environment?
n Before you act on a vRealize Operations Manager recommendation, check what would happen if youimplemented the recommended change to your environment.
Create a Hardware Change ProjectBefore you purchase new hardware, you can create a hardware change project using scenarios to determineif the purchase is necessary. To determine the effect of adding, removing, or updating the hardware capacityin a cluster, create a project that models changes to hosts and datastores.
Prerequisites
In vRealize Operations Manager, verify that the Projects tab is open.
Procedure
1 Select the target host in the inventory panel.
The target host is where you simulate changes to the environment to examine possible outcomes.
2 Click the Projects tab and click the Add New Project icon.
3 From the Projects workspace, enter the name and a description of the project.
4 Select the Planned status.
5 Click Scenarios to add scenarios to this project.
6 Select the add Datastore scenario and drag it to the Scenarios pane.
7 In the Configuration pane, enter the general parameters for the scenario.
8 Click datastore options to modify the disk space use and disk space allocation.
9 Click Apply to see the effect in the project workspace when your configuration selections are complete.
10 Click Save to add the scenario to the project.
11 Click Close to close the Project Workspace.
vRealize Operations Manager applies the scenario to the view that you selected. The scenario forecastappears in the chart as a gray dotted line. You can compare the actual current capacity to the expectedcapacity if you apply the changes you specified in the hardware change scenario.
vRealize Operations Manager User Guide
92 VMware, Inc.
Creating Virtual Machine ProjectsBefore you apply changes to your virtual environment, you can create virtual machine projects to modeladding or removing virtual machines to a host or a cluster. Virtual machine projects help you assess theconsequences of changing virtual resources without applying actual changes to your virtual environment.
Create Capacity Scenarios for Virtual Machines That Have Existing ProfilesYou can create a scenario that uses profiles of existing virtual machines as models to simulate adding one ormore new virtual machines to a host or a cluster.
To help you make configuration selections for virtual machines, the scenarios workspace containspopulation information from pre-defined profiles. vRealize Operations Manager calculates virtual machinedata by partitioning the range of capacity for CPU, memory, and disk dimensions and creates a profile touse as an existing model.
For information about relevant CPU and memory maximums, see the VMware vSphere documentation.
Procedure
1 Select the destination object in the inventory pane.
The destination object is a cluster or host where you locate the new virtual machines if you implementyour scenario.
2 Click the Projects tab and click the Add New Project icon.
3 In the Projects workspace, enter the name and a description of the project.
4 Select Planned Status.
5 Click Scenarios to add scenarios to this project.
6 Select the add Virtual Machine scenario and drag it to the Scenarios pane.
7 Select Populate metrics from.
8 Select existing virtual machines from the list to use as profiles for the new virtual machine.
Option Description
Copy metric values from a pre-defined profile.
Select a predefined profile list to use as the profile for the new virtualmachine.
Copy metric values from an existingobject.
Select existing virtual machines from the list to use as profiles for the newvirtual machine. The list of the existing virtual machines applies to thedatacenter of the selected object. The Datacenter and the Cluster or Hostdrop-down menus narrow the scope of the virtual machine list.
9 Click OK.
10 To duplicate virtual machines, increase the virtual machine count and click Next.
11 Click Apply to see the effect in the visualization chart when your configuration selections are complete.
12 Click Save to add the scenario to the project.
13 Click Close to close the Project Workspace.
vRealize Operations Manager applies the scenario to the view you selected and shows current capacitycompared to the expected capacity if you add the virtual machines to the target object.
Chapter 2 Planning the Resources for Your Managed Environment by Using vRealize Operations Manager
VMware, Inc. 93
Create Capacity Projects for Virtual Machines That Have New ProfilesVirtual machine projects assess the consequences of adding a new virtual machine to a cluster or hostwithout applying actual changes to your virtual environment.
For information about relevant CPU and memory maximums, see the VMware vSphere documentation.
Procedure
1 Select the destination object in the inventory pane.
The destination object is a cluster or host where you locate the new virtual machines if you implementyour scenario.
2 Click the Projects tab and click the Add New Project icon.
3 From the Projects workspace, enter the name and a description of the project.
4 Select the Planned status.
5 Click Scenarios to add scenarios to this project.
6 Select the add Virtual Machine scenario and drag it to the Scenarios pane.
7 Set the virtual machine count and the configuration for the virtual machine.
vRealize Operations Manager does not require you to specify the disk I/O and network I/O use of thenew virtual machines. vRealize Operations Manager uses the average disk I/O and network I/O useacross virtual machines in the host or cluster as an estimation of the new virtual machine use.
8 Click Apply to see the effect in the visualization chart when your configuration selections are complete.
9 Click Save to add the scenario to the project.
10 Click Close to close the Project Workspace.
vRealize Operations Manager applies the project to the view you selected and shows current capacitycompared to the expected capacity if you add the virtual machines to the target object.
Create a Project to Simulate Removing Virtual MachinesYou can create a project that simulates removing a virtual machine or group of virtual machines from a hostor a cluster. You might want to remove virtual machines if you do not need them or if you want to movethem to another host or cluster.
Procedure
1 Select the target object in the inventory panel.
The target object identifies the host or the cluster from which the virtual machines are removed if youimplement your scenario.
2 Click the Projects tab and click the Add New Project icon.
3 From the Projects workspace, enter the name and a description of the project.
4 Select the Planned status.
5 Click Scenarios to add scenarios to this project.
6 Select the selected object scenario from the Remove Demand option and drag it to the Scenarios pane.
7 From the Object to delete pull-down menu, select Virtual machine.
8 Select and double-click the Remove virtual machine item to remove.
vRealize Operations Manager User Guide
94 VMware, Inc.
9 Click Apply to see the effect in the project visualization.
10 Click Save to add the scenario to the project.
11 Click Close to close the Project Workspace.
vRealize Operations Manager applies the scenario to the project. When you add the project to thevisualization chart, the forecasted capacity appears in the chart as a gray dotted line. You can compare thecurrent capacity to the expected capacity if you remove the virtual machines from the target object.
What to do next
If you have more than one project, you can combine or compare the project outcomes in the visualizationchart.
Chapter 2 Planning the Resources for Your Managed Environment by Using vRealize Operations Manager
VMware, Inc. 95

vRealize Operations Manager User Guide
96 VMware, Inc.
Index
Aaction
power off allowed 70shut down virtual machine 69shut down guest operating system 69shutdown virtual machine 73VMware Tools 70
actionsrecent tasks 75run 73troubleshooting 74–82vCenter Server 69
add VMs and hosts, new project 89alert
cancel 34, 35monitor 34, 35ownership 35recommendation 37resolve 37respond 14–19, 21, 34suspend 35
alert definitions, Storage Devices solution 83alert list
filter 37sort 35
alert tab 42alerts
custom dashboard 44object group 40object alerts tab 42object summary tab 39respond 42
alerts tabrespond 42using 11
all metrics tabtroubleshooting 58, 63using 12
analyze data for capacity risk 66analyzing resources 45anomalies analysis, defined 46anomalies badge, defined 46
Bbadge, Compliance 51, 54badges
anomalies 46capacity 48capacity remaining 47Compliance 56density 50, 51faults 47Reclaimable Capacity 50reclaimable waste 50stress 49time remaining 48workload 45
best performance 65
Ccancel, alert 34, 35capacity
defined 48in datastores for virtual machines 67planning 88remaining in clusters for virtual machines 66
capacity remaining, defined 47clusters, remaining capacity 66compliance
alert-based 51, 53customize policy 52resolve non-compliant rules 55vRealize Configuration Manager 51, 54
Compliance badgealert-based 53vRealize Configuration Manager 54
compliance results, correlate object name 56correlate compliance object names 56CPU count, power off allowed 70creating custom, create custom 64custom dashboard
alerts 44using 44
Ddashboard, custom 44dashboards, Storage Devices solution 83datastore projects 92datastore scenarios 92
VMware, Inc. 97
datastoresspace for virtual machines 67wasted space 67
density, defined 50, 51details view
resource comparison 66worst performance 65
Eemail alert, respond 14–19, 21environment
inventory 86object relationships 68
environment overview 68events, user scenario 62events tab
troubleshooting 57troubleshooting tab 62using 12vRealize Configuration Manager data 58
Ffaults badge, defined 47filter, alert list 37
Gglossary 7
Hhardware projects 92hardware scenarios 92heat map colors 64heat map details, best performance 65heat maps 64, 66host, workload 67host scenarios 92
Iincrease workload, new project 89intended audience 7inventory
environment overview 86viewing 86
investigate details, storage networkcomponent 86
Mmemory, power off allowed 70metric chart, user scenario 63metrics charts tab, user scenario 19monitor
alert 34, 35recent tasks 75
monitor objects 9
monitoring, storage objects 82
Oobject
monitor 9searching 10
object alerts tab 42object group, manage alerts 40object relationships, environment 68object symptoms tab, user scenario 16objects comparison 66ownership, alert 35
Pplanning, future capacity needs 88policy, customize for compliance 52power off allowed
action 70CPU count 70memory 70
problemsUser Scenario:Analyze the State of Your
Environment 23User Scenario:Create a New Alert
Definition 32User Scenario:Create Dashboards and
Views 33User Scenario:Examine the Environment
Details 27User Scenario:Examine the Environment
Relationships 29User Scenario:Fix the Problem 30User Scenario:Troubleshoot Problems 25User Scenario:You See Problems as You
Monitor the State of Your Objects 22project parameters 91project scenarios, viewing details 91projects
adding new virtual machines from existingmachines 93
combine results 90, 91hardware 92, 93overview 87planning resources 87removing virtual machines 94
Rreading heat maps 64recent tasks
actions 75monitor 75troubleshooting 76–82
Reclaimable Capacity badge, defined 50reclaimable waste, defined 50recommendation, alert 37
vRealize Operations Manager User Guide
98 VMware, Inc.
recommendations, respond to alert 21relationships tab, user scenario 18resolve, alert 37resource comparison 66respond
alert 14–19, 21alerts 42email alert 14–19, 21
respond to alert, user scenario 14–19, 21respond to problems
User Scenario:Analyze the State of YourEnvironment 23
User Scenario:Create Dashboards andViews 33
User Scenario:Create a New AlertDefinition 32
User Scenario:Examine the EnvironmentDetails 27
User Scenario:Examine the EnvironmentRelationships 29
User Scenario:Fix the Problem 30User Scenario:Troubleshoot Problems 25User Scenario:You See Problems as You
Monitor the State of Your Objects 22
Sscenarios
deleting 91hardware 92user calls with a problem 10–12
you browse the environmentUser Scenario:Analyze the State of
Your Environment 23User Scenario:Create a New Alert
Definition 32User Scenario:Create Dashboards
and Views 33User Scenario:Examine the
Environment Details 27User Scenario:Examine the
EnvironmentRelationships 29
User Scenario:Fix the Problem 30User Scenario:Troubleshoot
Problems 25User Scenario:You See Problems as
You Monitor the State ofYour Objects 22
search for object 10shut down guest operating system, action 69shut down virtual machine, action 69snapshots
delete unused action 69run delete unused action 73
sort, alert list 35
storage objects 82Storage Devices solution
alert definitions 83dashboards 83
storage network componentinvestigate details 86troubleshoot 85troubleshooting dashboard 85
stress, defined 49summary tab, using 11, 40suspend, alert 35symptoms tab
troubleshooting 57, 60using 12
symptoms list, user scenario 60
Ttabs, about 38tasks, monitor 75time remaining, defined 48timeline, user scenario 61timeline tab
troubleshooting 57, 61user scenario 17using 12
troubleshoot, storage network component 85troubleshooting
actions 74–82all metrics 56, 58, 63events 56, 57recent tasks 76–82symptoms 56, 57timeline 56, 57
User ScenarioTroubleshoot Problems 25Create Dashboards and Views 33Fix the Problem 30Analyze the State of Your
Environment 23Create a New Alert Definition 32Examine the Environment Details 27Examine the Environment
Relationships 29You See Problems as You Monitor
the State of YourObjects 22
troubleshooting dashboard, storage networkcomponent 85
troubleshooting taball metrics tab 12events tab 12symptoms tab 12timeline tab 12user scenario 59using 12
Index
VMware, Inc. 99
Uupdated information 5use 7user scenario
events 62metric chart 63respond to alert 14–19, 21symptoms list 60timeline 61troubleshooting problems 9troubleshooting tab 59User Scenario:Analyze the State of Your
Environment 23User Scenario:Create a New Alert
Definition 32User Scenario:Create Dashboards and
Views 33User Scenario:Examine the Environment
Details 27User Scenario:Examine the Environment
Relationships 29User Scenario:Fix the Problem 30User Scenario:Troubleshoot Problems 25User Scenario:You See Problems as You
Monitor the State of Your Objects 22
Vvirtual machine
delete powered off action 69power off action 69power on action 69projects 94run delete powered off action 73run power off action 73run power on action 73run set memory action 73run set CPU action 73set memory action 69set CPU action 69shutdown action 73
virtual machines, waste 68virtual machine projects, adding new virtual
machines from existing machines 93virtual machine scenarios, removing virtual
machines 94VMware Tools, action 70vRealize Configuration Manager
compliance 51, 54–56correlate compliance object name 56
Wwaste
across datastores 68
in virtual machines 68reclaim datastores 67
what-if scenarios, adding new virtualmachines 94
workloaddefined 45host 67
workload analysis, defined 45worst performance 65
vRealize Operations Manager User Guide
100 VMware, Inc.