Embed Size (px)
Citation preview
vRealize Operations Manager UserGuide
Modified on 17 AUG 2017vRealize Operations Manager 6.6
vRealize Operations Manager User Guide
2 VMware, Inc.
You can find the most up-to-date technical documentation on the VMware Web site at:
https://docs.vmware.com/
The VMware Web site also provides the latest product updates.
If you have comments about this documentation, submit your feedback to:
Copyright © 2017 VMware, Inc. All rights reserved. Copyright and trademark information.
VMware, Inc.3401 Hillview Ave.Palo Alto, CA 94304www.vmware.com
Contents
About This User Guide 5
1 Monitoring Objects in Your Managed Environment by Using
vRealize Operations Manager 7What to Do When... 7
User Scenario: A User Calls With a Problem 8User Scenario: An Alert Arrives in Your Inbox 12User Scenario: You See Problems as You Monitor the State of Your Objects 19
Monitoring and Responding to Alerts 31Monitoring Alerts in vRealize Operations Manager 31
Monitoring and Responding to Problems 35Evaluating Object Information Using Badge Alerts and the Summary Tab 35Investigating Object Alerts 38Evaluating Metric Information 40Analyzing the Resources in Your Environment 46Using Troubleshooting Tools to Resolve Problems 46Creating and Using Object Details 47Examining Relationships in Your Environment 52User Scenario: Investigate the Root Cause of a Problem by Using the Troubleshooting Tab
Options 53Running Actions from vRealize Operations Manager 56
Run Actions From Toolbars in vRealize Operations Manager 57Troubleshoot Actions in vRealize Operations Manager 57Monitor Recent Task Status 59Troubleshoot Failed Tasks 60
Viewing Your Inventory 66
2 Planning the Capacity for Your Managed Environment Using
vRealize Operations Manager 67Right-Sizing Capacity for Stress-Free Demand and Value 70User Scenario: Planning Capacity for an Increase in Workload 74
Create a Sample Project to Increase Workload Capacity 74Create a Sample Project to Add a Host and Virtual Machines 75View the Result of Your Capacity Projects 76
Planning Hardware Projects in vRealize Operations Manager 77Create a Project to Plan for Hardware Changes 77
Planning Virtual Machine Projects and Scenarios 78Create a Virtual Machine Project Using Populated Metrics 79Create a Sample Project for a New Virtual Machine 80Create a Sample Project to Simulate Removing a Virtual Machine 80
Custom Profiles in VMware vRealize Operations Manager 81Custom Datacenters in VMware vRealize Operations Manager 81
VMware, Inc. 3

Index 83
vRealize Operations Manager User Guide
4 VMware, Inc.

About This User Guide
The VMware® vRealize Operations Manager User Guide describes what to do when users experienceperformance problems in your managed environment.
As a system administrator, you might become aware of a problem with an object in your environment whenvRealize Operations Manager generates an alert, or when a user contacts you. To help ensure optimalperformance, this information describes how you use vRealize Operations Manager to monitor,troubleshoot, and take action to address problems. It also provides information on how to assess whetherproblems due to over demand or lack of capacity require a system change or upgrade.
Intended AudienceThis information is intended for vRealize Operations Manager administrators, virtual infrastructureadministrators, and operations engineers who track and maintain object performance in your managedenvironment.
VMware Technical Publications GlossaryVMware Technical Publications provides a glossary of terms that might be unfamiliar to you. For definitionsof terms as they are used in VMware technical documentation, go to http://www.vmware.com/support/pubs.
VMware, Inc. 5

vRealize Operations Manager User Guide
6 VMware, Inc.
Monitoring Objects in Your ManagedEnvironment by UsingvRealize Operations Manager 1
You can use vRealize Operations Manager to resolve problems that your customers raise, respond to alertsthat identify problems before your customers report problems, and generally monitor your environment forproblems.
When your customers experience performance problems and call you to resolve the problem, the data thatvRealize Operations Manager collects and analyzes is presented to you in graphical forms so that you cancompare and contrast objects, understand the relationship between objects, and determine the root cause ofproblems.
To manage your environment as a proactive rather than reactive administrator, you monitor and respond toalerts. A generated alert notifies you when objects in your environment are experiencing problems. If youresolve the problem based on the alert before your customers notice, then you avoid service interruptions.
You can investigate the problems that generate alerts or that result in calls by using the Alerts, Events,Details, and Environment tabs.
If you find the root cause of the problem, you might be able to resolve the problem by running an action.The actions make changes to objects in the target system, for example, the VMware vCenter Server® system,from vRealize Operations Manager.
This chapter includes the following topics:
n “What to Do When...,” on page 7
n “Monitoring and Responding to Alerts,” on page 31
n “Monitoring and Responding to Problems,” on page 35
n “Running Actions from vRealize Operations Manager,” on page 56
n “Viewing Your Inventory,” on page 66
What to Do When...As a virtual infrastructure administrator, network operations center engineer, or other IT professional, youuse vRealize Operations Manager to monitor objects in your environment so that you can ensure service toyour customers and resolve any problems that occur.
Your vRealize Operations Manager administrator has configured vRealize Operations Manager to managetwo vCenter Server instances that manage multiple hosts and virtual machines. It is your first day usingvRealize Operations Manager to manage your environment.
n User Scenario: A User Calls With a Problem on page 8The vice president of sales telephones the help desk reporting that her virtual machine, VPSALES4632,is running slow. She is working on sales reports for an upcoming meeting and is running behindschedule because of the slow performance of her virtual machine.
VMware, Inc. 7
n User Scenario: An Alert Arrives in Your Inbox on page 12You return from lunch to find an alert notification in your inbox. You can usevRealize Operations Manager to investigate and resolve the alert.
n User Scenario: You See Problems as You Monitor the State of Your Objects on page 19As you investigate your objects in the context of this scenario, vRealize Operations Manager providesdetails to help you resolve the problems. You analyze the state of your environment, examine currentproblems, investigate solutions, and take action to resolve the problems.
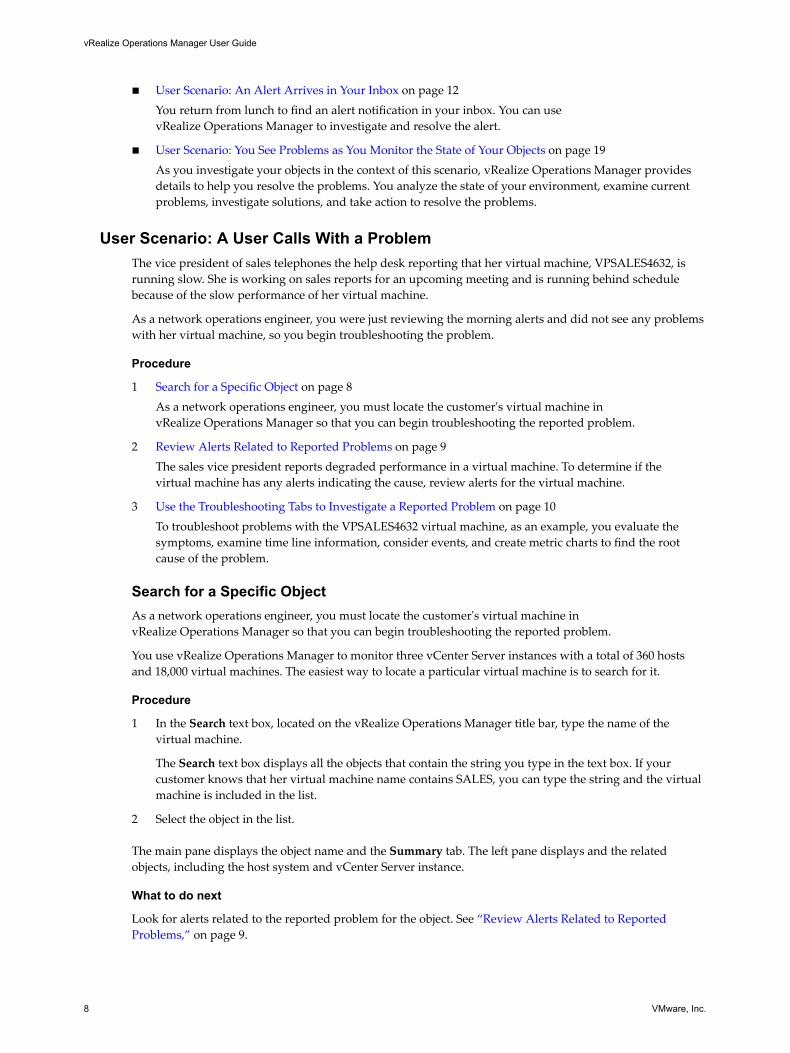
User Scenario: A User Calls With a ProblemThe vice president of sales telephones the help desk reporting that her virtual machine, VPSALES4632, isrunning slow. She is working on sales reports for an upcoming meeting and is running behind schedulebecause of the slow performance of her virtual machine.
As a network operations engineer, you were just reviewing the morning alerts and did not see any problemswith her virtual machine, so you begin troubleshooting the problem.
Procedure
1 Search for a Specific Object on page 8As a network operations engineer, you must locate the customer's virtual machine invRealize Operations Manager so that you can begin troubleshooting the reported problem.
2 Review Alerts Related to Reported Problems on page 9The sales vice president reports degraded performance in a virtual machine. To determine if thevirtual machine has any alerts indicating the cause, review alerts for the virtual machine.
3 Use the Troubleshooting Tabs to Investigate a Reported Problem on page 10To troubleshoot problems with the VPSALES4632 virtual machine, as an example, you evaluate thesymptoms, examine time line information, consider events, and create metric charts to find the rootcause of the problem.
Search for a Specific ObjectAs a network operations engineer, you must locate the customer's virtual machine invRealize Operations Manager so that you can begin troubleshooting the reported problem.
You use vRealize Operations Manager to monitor three vCenter Server instances with a total of 360 hostsand 18,000 virtual machines. The easiest way to locate a particular virtual machine is to search for it.
Procedure
1 In the Search text box, located on the vRealize Operations Manager title bar, type the name of thevirtual machine.
The Search text box displays all the objects that contain the string you type in the text box. If yourcustomer knows that her virtual machine name contains SALES, you can type the string and the virtualmachine is included in the list.
2 Select the object in the list.
The main pane displays the object name and the Summary tab. The left pane displays and the relatedobjects, including the host system and vCenter Server instance.
What to do next
Look for alerts related to the reported problem for the object. See “Review Alerts Related to ReportedProblems,” on page 9.
vRealize Operations Manager User Guide
8 VMware, Inc.
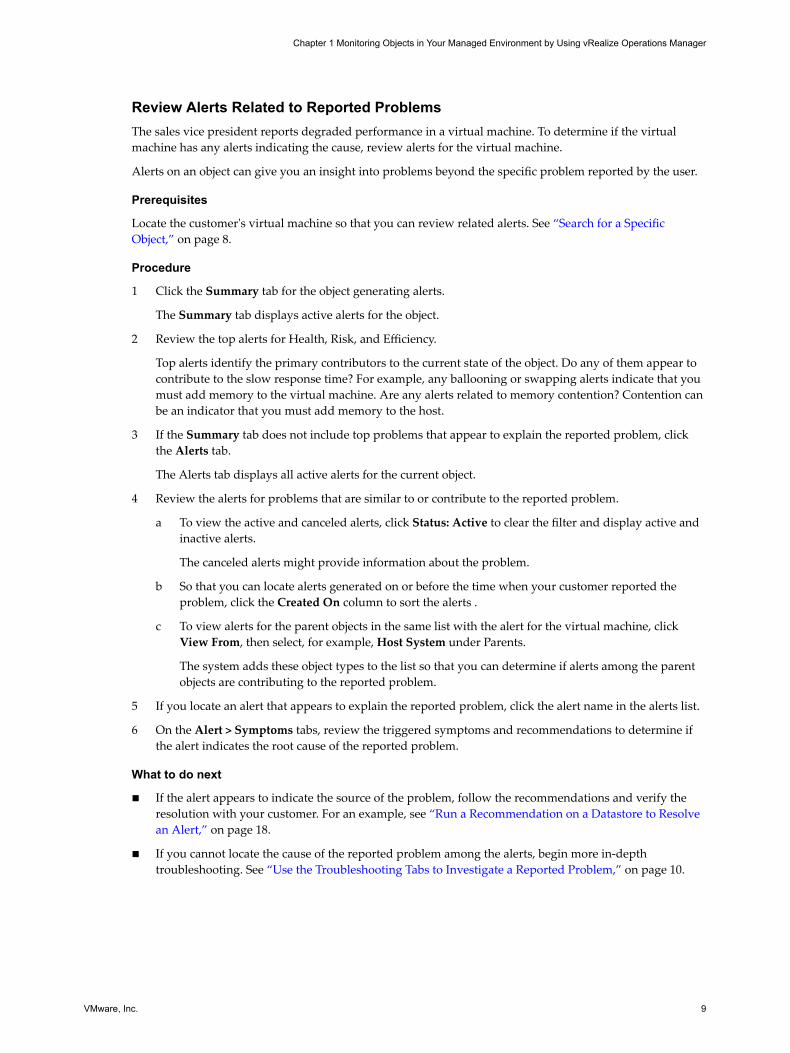
Review Alerts Related to Reported ProblemsThe sales vice president reports degraded performance in a virtual machine. To determine if the virtualmachine has any alerts indicating the cause, review alerts for the virtual machine.
Alerts on an object can give you an insight into problems beyond the specific problem reported by the user.
Prerequisites
Locate the customer's virtual machine so that you can review related alerts. See “Search for a SpecificObject,” on page 8.
Procedure
1 Click the Summary tab for the object generating alerts.
The Summary tab displays active alerts for the object.
2 Review the top alerts for Health, Risk, and Efficiency.
Top alerts identify the primary contributors to the current state of the object. Do any of them appear tocontribute to the slow response time? For example, any ballooning or swapping alerts indicate that youmust add memory to the virtual machine. Are any alerts related to memory contention? Contention canbe an indicator that you must add memory to the host.
3 If the Summary tab does not include top problems that appear to explain the reported problem, clickthe Alerts tab.
The Alerts tab displays all active alerts for the current object.
4 Review the alerts for problems that are similar to or contribute to the reported problem.
a To view the active and canceled alerts, click Status: Active to clear the filter and display active andinactive alerts.
The canceled alerts might provide information about the problem.
b So that you can locate alerts generated on or before the time when your customer reported theproblem, click the Created On column to sort the alerts .
c To view alerts for the parent objects in the same list with the alert for the virtual machine, clickView From, then select, for example, Host System under Parents.
The system adds these object types to the list so that you can determine if alerts among the parentobjects are contributing to the reported problem.
5 If you locate an alert that appears to explain the reported problem, click the alert name in the alerts list.
6 On the Alert > Symptoms tabs, review the triggered symptoms and recommendations to determine ifthe alert indicates the root cause of the reported problem.
What to do next
n If the alert appears to indicate the source of the problem, follow the recommendations and verify theresolution with your customer. For an example, see “Run a Recommendation on a Datastore to Resolvean Alert,” on page 18.
n If you cannot locate the cause of the reported problem among the alerts, begin more in-depthtroubleshooting. See “Use the Troubleshooting Tabs to Investigate a Reported Problem,” on page 10.
Chapter 1 Monitoring Objects in Your Managed Environment by Using vRealize Operations Manager
VMware, Inc. 9

Use the Troubleshooting Tabs to Investigate a Reported ProblemTo troubleshoot problems with the VPSALES4632 virtual machine, as an example, you evaluate thesymptoms, examine time line information, consider events, and create metric charts to find the root cause ofthe problem.
If a review of the alerts did not help you identify the cause of the problem reported for the virtual machine,use the Troubleshooting tabs: Alert > Symptoms, Event > Timeline, and All Metrics to troubleshoot thehistory and current state of the virtual machine.
Prerequisites
n Locate the object for which the problem was reported. See “Search for a Specific Object,” on page 8.
n Review the alerts for the virtual machine to determine if the problem is already identified andrecommendations made. See “Review Alerts Related to Reported Problems,” on page 9.
Procedure
1 In the menu, click Environment, then click Inventory and select VPSALES4632 from the tree.
The main pane updates to display the object Summary tab.
2 Click the Alerts tab, click the Symptoms tab, and review the symptoms to determine if one of thesymptoms is related to the reported problem.
Depending on how your alerts are configured, some symptoms might be triggered but not sufficient togenerate an alert.
a Review symptom names to determine if one or more symptoms are related to the reportedproblem.
The Information column provides the triggering condition, trend, and current value. What are themost common symptoms that affect response time? Do you see any symptoms related to CPU ormemory usage?
b Sort by the Created On date so that you can focus on the time frame in which your customerreported that the problem.
c Click the Status: Active filter button to disable the filter so that you can review active and inactivesymptoms.
Based on symptoms, you think the problem is related to CPU or memory use. But you do not know ifthe problem is with the virtual machine or with the host.
3 Click the Events > Timeline tabs and review the alerts, symptoms, and change events over time thatmight help you identify common trends that are contributing to the reported problem.
a To determine if other virtual machines had symptoms triggered and alerts generated at the sametime as your reported problem, click View From > Peer.
Other virtual machine alerts are added to the time line. If you see that multiple virtual machinestriggered symptoms in the same time frame, then you can investigate parent objects.
b Click View From and select Host System from the Parent list.
The alerts and symptoms that are associated with the host on which the virtual machine isdeployed are added to the time line. Use the information to determine if a correlation existsbetween the reported problem and the alerts on the host.
vRealize Operations Manager User Guide
10 VMware, Inc.
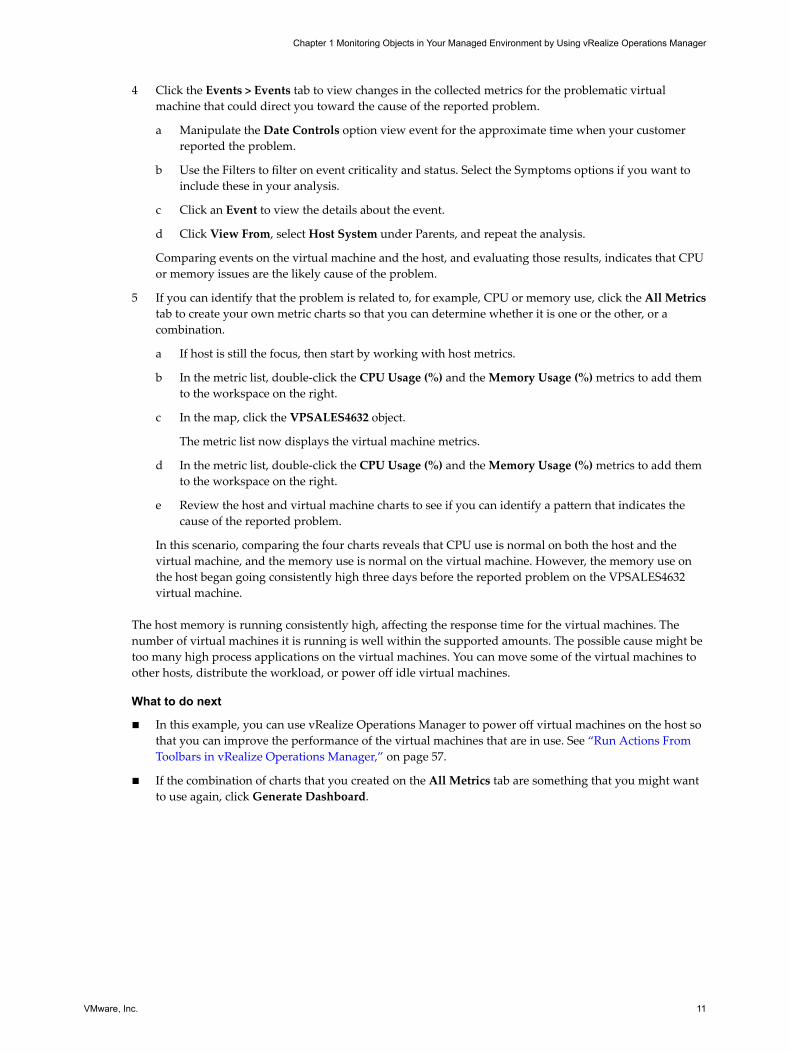
4 Click the Events > Events tab to view changes in the collected metrics for the problematic virtualmachine that could direct you toward the cause of the reported problem.
a Manipulate the Date Controls option view event for the approximate time when your customerreported the problem.
b Use the Filters to filter on event criticality and status. Select the Symptoms options if you want toinclude these in your analysis.
c Click an Event to view the details about the event.
d Click View From, select Host System under Parents, and repeat the analysis.
Comparing events on the virtual machine and the host, and evaluating those results, indicates that CPUor memory issues are the likely cause of the problem.
5 If you can identify that the problem is related to, for example, CPU or memory use, click the All Metricstab to create your own metric charts so that you can determine whether it is one or the other, or acombination.
a If host is still the focus, then start by working with host metrics.
b In the metric list, double-click the CPU Usage (%) and the Memory Usage (%) metrics to add themto the workspace on the right.
c In the map, click the VPSALES4632 object.
The metric list now displays the virtual machine metrics.
d In the metric list, double-click the CPU Usage (%) and the Memory Usage (%) metrics to add themto the workspace on the right.
e Review the host and virtual machine charts to see if you can identify a pattern that indicates thecause of the reported problem.
In this scenario, comparing the four charts reveals that CPU use is normal on both the host and thevirtual machine, and the memory use is normal on the virtual machine. However, the memory use onthe host began going consistently high three days before the reported problem on the VPSALES4632virtual machine.
The host memory is running consistently high, affecting the response time for the virtual machines. Thenumber of virtual machines it is running is well within the supported amounts. The possible cause might betoo many high process applications on the virtual machines. You can move some of the virtual machines toother hosts, distribute the workload, or power off idle virtual machines.
What to do next
n In this example, you can use vRealize Operations Manager to power off virtual machines on the host sothat you can improve the performance of the virtual machines that are in use. See “Run Actions FromToolbars in vRealize Operations Manager,” on page 57.
n If the combination of charts that you created on the All Metrics tab are something that you might wantto use again, click Generate Dashboard.
Chapter 1 Monitoring Objects in Your Managed Environment by Using vRealize Operations Manager
VMware, Inc. 11
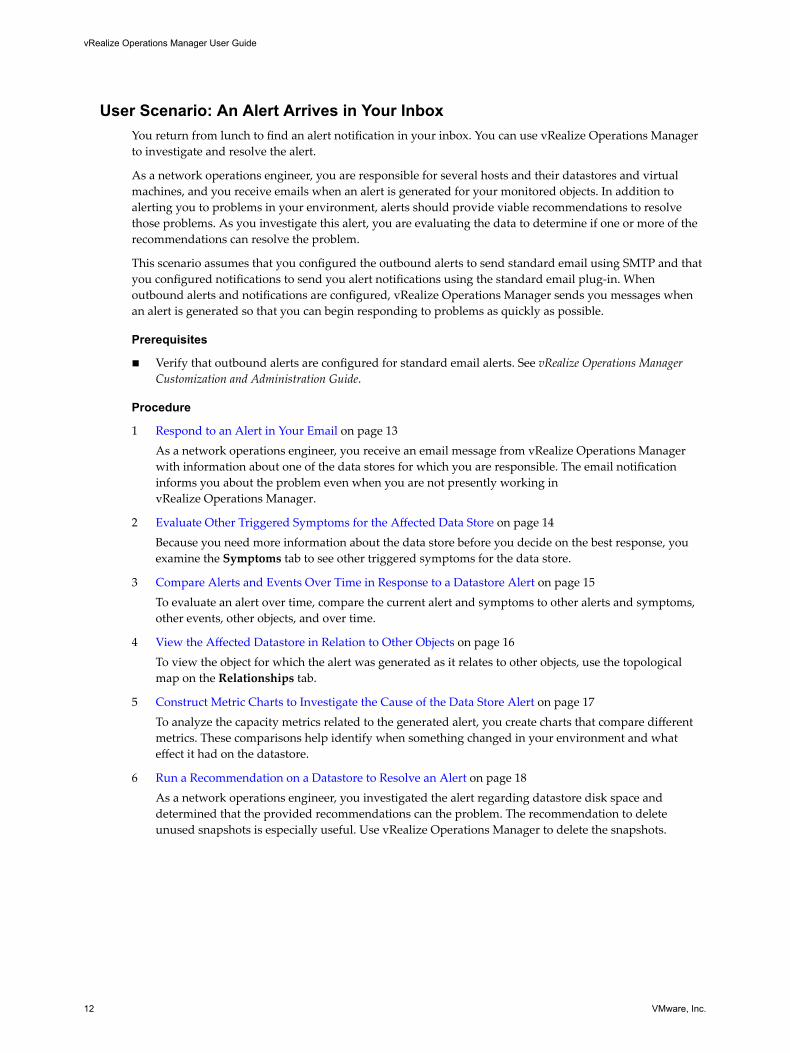
User Scenario: An Alert Arrives in Your InboxYou return from lunch to find an alert notification in your inbox. You can use vRealize Operations Managerto investigate and resolve the alert.
As a network operations engineer, you are responsible for several hosts and their datastores and virtualmachines, and you receive emails when an alert is generated for your monitored objects. In addition toalerting you to problems in your environment, alerts should provide viable recommendations to resolvethose problems. As you investigate this alert, you are evaluating the data to determine if one or more of therecommendations can resolve the problem.
This scenario assumes that you configured the outbound alerts to send standard email using SMTP and thatyou configured notifications to send you alert notifications using the standard email plug-in. Whenoutbound alerts and notifications are configured, vRealize Operations Manager sends you messages whenan alert is generated so that you can begin responding to problems as quickly as possible.
Prerequisites
n Verify that outbound alerts are configured for standard email alerts. See vRealize Operations ManagerCustomization and Administration Guide.
Procedure
1 Respond to an Alert in Your Email on page 13As a network operations engineer, you receive an email message from vRealize Operations Managerwith information about one of the data stores for which you are responsible. The email notificationinforms you about the problem even when you are not presently working invRealize Operations Manager.
2 Evaluate Other Triggered Symptoms for the Affected Data Store on page 14Because you need more information about the data store before you decide on the best response, youexamine the Symptoms tab to see other triggered symptoms for the data store.
3 Compare Alerts and Events Over Time in Response to a Datastore Alert on page 15To evaluate an alert over time, compare the current alert and symptoms to other alerts and symptoms,other events, other objects, and over time.
4 View the Affected Datastore in Relation to Other Objects on page 16To view the object for which the alert was generated as it relates to other objects, use the topologicalmap on the Relationships tab.
5 Construct Metric Charts to Investigate the Cause of the Data Store Alert on page 17To analyze the capacity metrics related to the generated alert, you create charts that compare differentmetrics. These comparisons help identify when something changed in your environment and whateffect it had on the datastore.
6 Run a Recommendation on a Datastore to Resolve an Alert on page 18As a network operations engineer, you investigated the alert regarding datastore disk space anddetermined that the provided recommendations can the problem. The recommendation to deleteunused snapshots is especially useful. Use vRealize Operations Manager to delete the snapshots.
vRealize Operations Manager User Guide
12 VMware, Inc.

Respond to an Alert in Your EmailAs a network operations engineer, you receive an email message from vRealize Operations Manager withinformation about one of the data stores for which you are responsible. The email notification informs youabout the problem even when you are not presently working in vRealize Operations Manager.
In your email client, you receive an alert similar to the following message.
Alert was updated at Tue Jul 01 16:34:04 MDT :
Info:datastore1 Datastore is acting abnormally since Mon Jun 30 10:21:07 MDT and was last
updated at Tue Jul 01 16:34:04 MDT
Alert Definition Name: Datastore is running out of disk space
Alert Definition Description: Datastore is running out of disk space
Object Name : datastore1
Object Type : Datastore
Alert Impact: risk
Alert State : critical
Alert Type : Storage
Alert Sub-Type : Capacity
Object Health State: info
Object Risk State: critical
Object Efficiency State: info
Symptoms:
SYMPTOM SET - self
Symptom Name | Object Name | Object ID | Metric | Message Info
Datastore space usage reaching critical limit datastore1 | b0885859-
e0c5-4126-8eba-6a21c895fe1b | Capacity|Used Space | HT above 99.20800922575977 > 95
Recommendations:
- Storage VMotion some Virtual Machines to a different Datastore
- Delete unused snapshots of Virtual Machines
- Add more capacity to the Datastore
Notification Rule Name: All alerts -- datastores
Notification Rule Description:
Alert ID : a9d6cf35-a332-4028-90f0-d1876459032b
Operations Manager Server - 192.0.2.0
Alert details
Prerequisites
n Verify that outbound alerts are configured for standard email alerts. See vRealize Operations ManagerCustomization and Administration Guide.
n Verify that the notifications are configured to send messages to your users for the alert definition. For anexample of how to create an alert notification, see vRealize Operations Manager Customization andAdministration Guide.
Procedure
1 In your email client, review the message so that you understand the state of the affected objects anddetermine if you must begin investigating immediately.
Look for the alert name, the alert state to determine the current level of criticality, and the affectedobjects.
Chapter 1 Monitoring Objects in Your Managed Environment by Using vRealize Operations Manager
VMware, Inc. 13

2 In the email message, click Alert Details.
vRealize Operations Manager opens on the Summary tab in the alert details for the generated alert andaffected object.
3 Review the Summary tab information.
Option Evaluation Process
Alert name anddescription
Review the name and description and verify that you are evaluating the alert for whichyou received an email message.
Recommendations Review the top recommendation, and if available, other recommendations, tounderstand the steps that you must take to resolve the issue. If implemented, will theprioritized recommendations resolve the problem?
What is Causing theIssue?
Which symptoms were triggered? Which were not triggered? What affect does thisevaluation have on your investigation? In this example, the alert that the datastore isrunning out of space is configured so that the criticality is symptom based. If youreceived a critical alert, then it is likely that the symptoms are already at a critical level,having moved up from Warning and Immediate. Look at the sparkline or metric graphchart for each symptom to determine when the problem escalated on the datastoreobject.
What to do next
n If you determine that the recommendations will resolve the problem, implement them. See “Run aRecommendation on a Datastore to Resolve an Alert,” on page 18.
n If you need more information about the affected objects, continue your investigation. Begin by lookingat other triggered symptoms for the data store. See “Evaluate Other Triggered Symptoms for theAffected Data Store,” on page 14.
Evaluate Other Triggered Symptoms for the Affected Data StoreBecause you need more information about the data store before you decide on the best response, youexamine the Symptoms tab to see other triggered symptoms for the data store.
If other symptoms are triggered for the object besides the symptom included in the alert, evaluate them todetermine what the symptoms reflect about the state of the object, and to decide whether the relatedrecommendations might resolve the problem.
Prerequisites
Verify that you are addressing the alert for which you received an alert message in your email. See “Respond to an Alert in Your Email,” on page 13.
Procedure
1 In the menu, click Alerts and select the alert name in the data grid.
The center pane view changes to display the alert detail tabs.
2 Click View additional metrics > Alerts > Symptoms and review the active symptoms.
Option Evaluation Process
Criticality Are other symptoms of similar criticality present that are affecting the object?
Symptom Are any of the triggered symptoms related to the symptoms that triggered the current alert?Symptoms related to time remaining, capacity, or stress that could indicate storage problems?
vRealize Operations Manager User Guide
14 VMware, Inc.
Option Evaluation Process
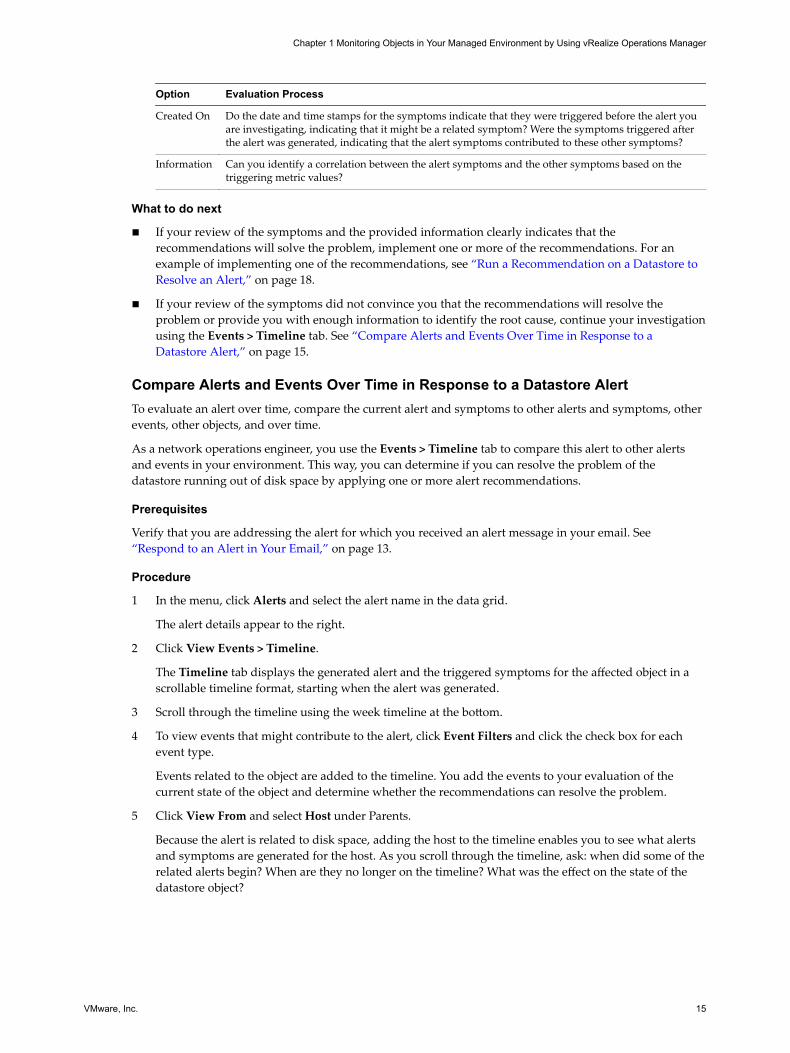
Created On Do the date and time stamps for the symptoms indicate that they were triggered before the alert youare investigating, indicating that it might be a related symptom? Were the symptoms triggered afterthe alert was generated, indicating that the alert symptoms contributed to these other symptoms?
Information Can you identify a correlation between the alert symptoms and the other symptoms based on thetriggering metric values?
What to do next
n If your review of the symptoms and the provided information clearly indicates that therecommendations will solve the problem, implement one or more of the recommendations. For anexample of implementing one of the recommendations, see “Run a Recommendation on a Datastore toResolve an Alert,” on page 18.
n If your review of the symptoms did not convince you that the recommendations will resolve theproblem or provide you with enough information to identify the root cause, continue your investigationusing the Events > Timeline tab. See “Compare Alerts and Events Over Time in Response to aDatastore Alert,” on page 15.
Compare Alerts and Events Over Time in Response to a Datastore AlertTo evaluate an alert over time, compare the current alert and symptoms to other alerts and symptoms, otherevents, other objects, and over time.
As a network operations engineer, you use the Events > Timeline tab to compare this alert to other alertsand events in your environment. This way, you can determine if you can resolve the problem of thedatastore running out of disk space by applying one or more alert recommendations.
Prerequisites
Verify that you are addressing the alert for which you received an alert message in your email. See “Respond to an Alert in Your Email,” on page 13.
Procedure
1 In the menu, click Alerts and select the alert name in the data grid.
The alert details appear to the right.
2 Click View Events > Timeline.
The Timeline tab displays the generated alert and the triggered symptoms for the affected object in ascrollable timeline format, starting when the alert was generated.
3 Scroll through the timeline using the week timeline at the bottom.
4 To view events that might contribute to the alert, click Event Filters and click the check box for eachevent type.
Events related to the object are added to the timeline. You add the events to your evaluation of thecurrent state of the object and determine whether the recommendations can resolve the problem.
5 Click View From and select Host under Parents.
Because the alert is related to disk space, adding the host to the timeline enables you to see what alertsand symptoms are generated for the host. As you scroll through the timeline, ask: when did some of therelated alerts begin? When are they no longer on the timeline? What was the effect on the state of thedatastore object?
Chapter 1 Monitoring Objects in Your Managed Environment by Using vRealize Operations Manager
VMware, Inc. 15
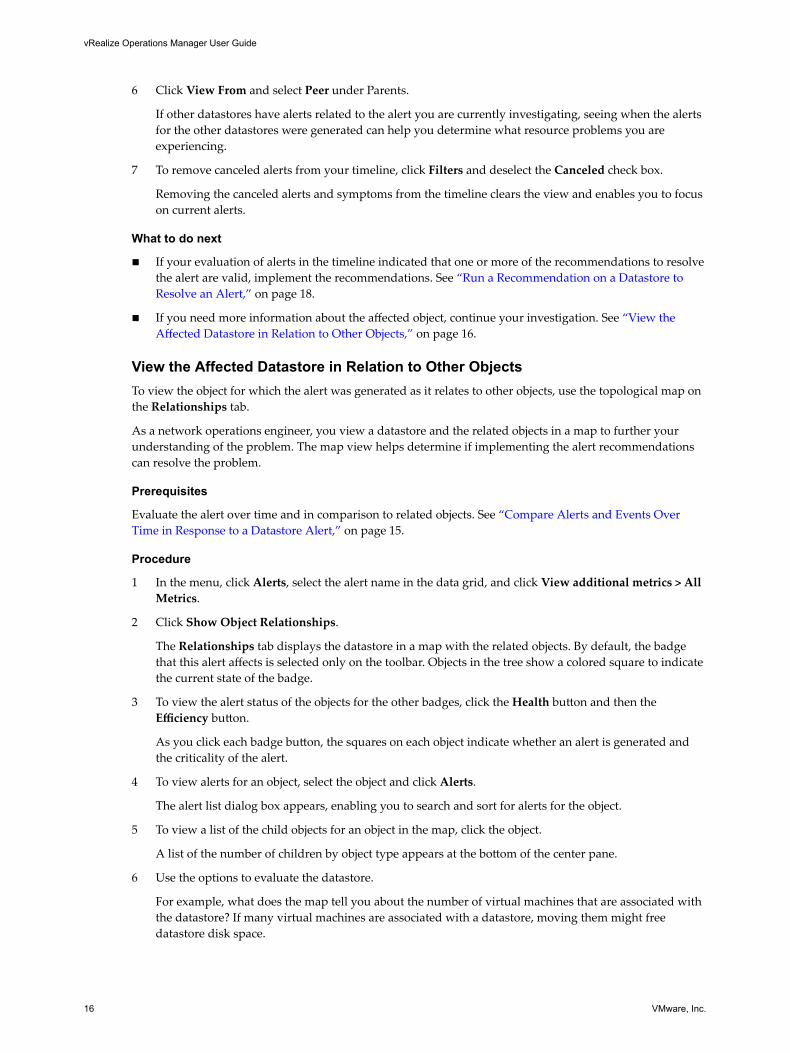
6 Click View From and select Peer under Parents.
If other datastores have alerts related to the alert you are currently investigating, seeing when the alertsfor the other datastores were generated can help you determine what resource problems you areexperiencing.
7 To remove canceled alerts from your timeline, click Filters and deselect the Canceled check box.
Removing the canceled alerts and symptoms from the timeline clears the view and enables you to focuson current alerts.
What to do next
n If your evaluation of alerts in the timeline indicated that one or more of the recommendations to resolvethe alert are valid, implement the recommendations. See “Run a Recommendation on a Datastore toResolve an Alert,” on page 18.
n If you need more information about the affected object, continue your investigation. See “View theAffected Datastore in Relation to Other Objects,” on page 16.
View the Affected Datastore in Relation to Other ObjectsTo view the object for which the alert was generated as it relates to other objects, use the topological map onthe Relationships tab.
As a network operations engineer, you view a datastore and the related objects in a map to further yourunderstanding of the problem. The map view helps determine if implementing the alert recommendationscan resolve the problem.
Prerequisites
Evaluate the alert over time and in comparison to related objects. See “Compare Alerts and Events OverTime in Response to a Datastore Alert,” on page 15.
Procedure
1 In the menu, click Alerts, select the alert name in the data grid, and click View additional metrics > AllMetrics.
2 Click Show Object Relationships.
The Relationships tab displays the datastore in a map with the related objects. By default, the badgethat this alert affects is selected only on the toolbar. Objects in the tree show a colored square to indicatethe current state of the badge.
3 To view the alert status of the objects for the other badges, click the Health button and then theEfficiency button.
As you click each badge button, the squares on each object indicate whether an alert is generated andthe criticality of the alert.
4 To view alerts for an object, select the object and click Alerts.
The alert list dialog box appears, enabling you to search and sort for alerts for the object.
5 To view a list of the child objects for an object in the map, click the object.
A list of the number of children by object type appears at the bottom of the center pane.
6 Use the options to evaluate the datastore.
For example, what does the map tell you about the number of virtual machines that are associated withthe datastore? If many virtual machines are associated with a datastore, moving them might freedatastore disk space.
vRealize Operations Manager User Guide
16 VMware, Inc.
What to do next
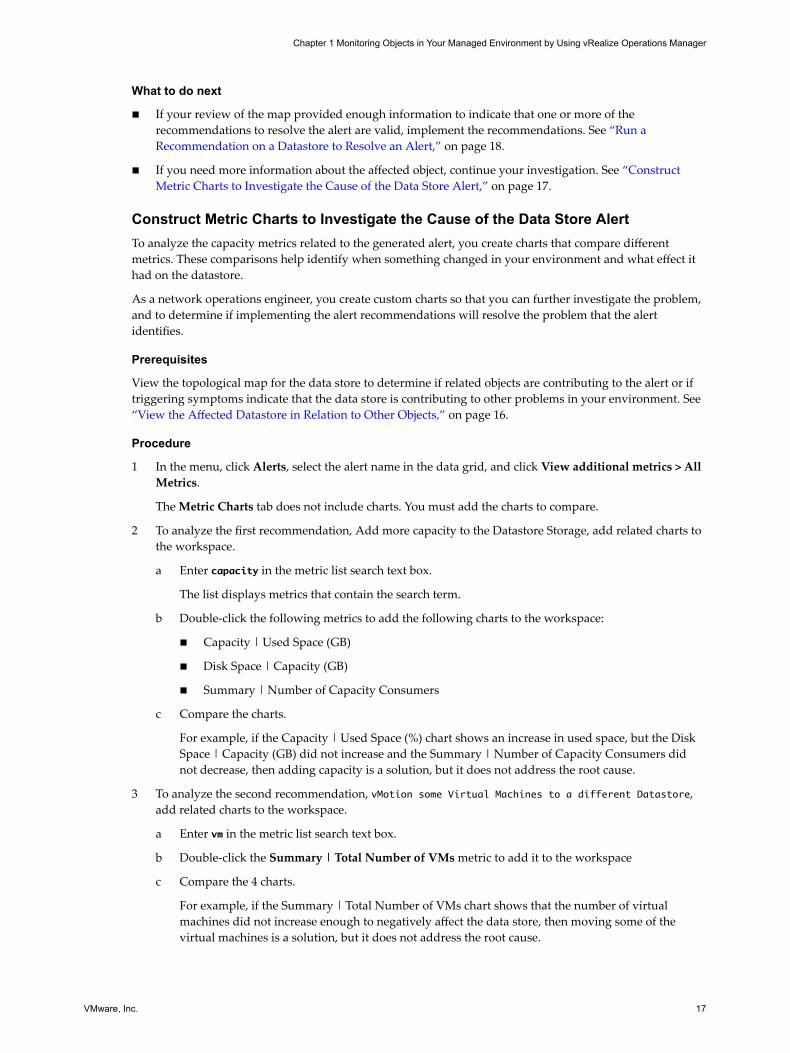
n If your review of the map provided enough information to indicate that one or more of therecommendations to resolve the alert are valid, implement the recommendations. See “Run aRecommendation on a Datastore to Resolve an Alert,” on page 18.
n If you need more information about the affected object, continue your investigation. See “ConstructMetric Charts to Investigate the Cause of the Data Store Alert,” on page 17.
Construct Metric Charts to Investigate the Cause of the Data Store AlertTo analyze the capacity metrics related to the generated alert, you create charts that compare differentmetrics. These comparisons help identify when something changed in your environment and what effect ithad on the datastore.
As a network operations engineer, you create custom charts so that you can further investigate the problem,and to determine if implementing the alert recommendations will resolve the problem that the alertidentifies.
Prerequisites
View the topological map for the data store to determine if related objects are contributing to the alert or iftriggering symptoms indicate that the data store is contributing to other problems in your environment. See “View the Affected Datastore in Relation to Other Objects,” on page 16.
Procedure
1 In the menu, click Alerts, select the alert name in the data grid, and click View additional metrics > AllMetrics.
The Metric Charts tab does not include charts. You must add the charts to compare.
2 To analyze the first recommendation, Add more capacity to the Datastore Storage, add related charts tothe workspace.
a Enter capacity in the metric list search text box.
The list displays metrics that contain the search term.
b Double-click the following metrics to add the following charts to the workspace:
n Capacity | Used Space (GB)
n Disk Space | Capacity (GB)
n Summary | Number of Capacity Consumers
c Compare the charts.
For example, if the Capacity | Used Space (%) chart shows an increase in used space, but the DiskSpace | Capacity (GB) did not increase and the Summary | Number of Capacity Consumers didnot decrease, then adding capacity is a solution, but it does not address the root cause.
3 To analyze the second recommendation, vMotion some Virtual Machines to a different Datastore,add related charts to the workspace.
a Enter vm in the metric list search text box.
b Double-click the Summary | Total Number of VMs metric to add it to the workspace
c Compare the 4 charts.
For example, if the Summary | Total Number of VMs chart shows that the number of virtualmachines did not increase enough to negatively affect the data store, then moving some of thevirtual machines is a solution, but it does not address the root cause.
Chapter 1 Monitoring Objects in Your Managed Environment by Using vRealize Operations Manager
VMware, Inc. 17

4 To analyze the third recommendation, Delete unused snapshots of virtual machines, add related chartsto the workspace.
a Enter snapshot in the metric list search text box.
b Double-click the following metrics to add the charts to the workspace:
n Disk Space | Snapshot Space (GB)
n Disk Space Reclaimable | Snapshot Space | Waste Value (GB)
c Compare the charts.
For example, if the amount of Disk Space | Snapshot Space (GB) increased and the Disk SpaceReclaimable | Snapshot Space | Waste Value (GB) indicates an area where space can be reclaimed,then deleting unused snapshots will positively affect the data store disk space problem and resolvethe alert.
5 If this is a problematic data store that you must continue to monitor, you can create a dashboard.
a Click the Generate Dashboard button on the workspace toolbar.
b Enter a name for the dashboard and click OK.
In this example, use a name like Datastore disk space.
The dashboard is added to your available dashboards.
You compared metric charts to determine if the recommendations are valid and which recommendation toimplement first. In this example, the Delete unused snapshots of Virtual Machines recommendation appearsto be the most likely way to resolve the alert.
What to do next
Implement the alert recommendations. See “Run a Recommendation on a Datastore to Resolve an Alert,” onpage 18.
Run a Recommendation on a Datastore to Resolve an AlertAs a network operations engineer, you investigated the alert regarding datastore disk space and determinedthat the provided recommendations can the problem. The recommendation to delete unused snapshots isespecially useful. Use vRealize Operations Manager to delete the snapshots.
If you have not enabled actions in the vCenter adapter, you can manually delete the snapshots on yourvCenter Server instance.
Prerequisites
n Compare the metric charts to identify the likely root cause of the alert. See “Compare Alerts and EventsOver Time in Response to a Datastore Alert,” on page 15 .
Procedure
1 In the menu, click Alerts and select the alert name in the data grid. The alerts detail informationappears on the right.
2 Review the Recommendations.
Recommendations include the Storage vMotion some virtual machines to a different datastorerecommendation and the Delete unused snapshots for virtual machines recommendation. The deleteunused snapshot recommendation includes an action button.
3 Click Delete Unused Snapshots for Datastore.
vRealize Operations Manager User Guide
18 VMware, Inc.
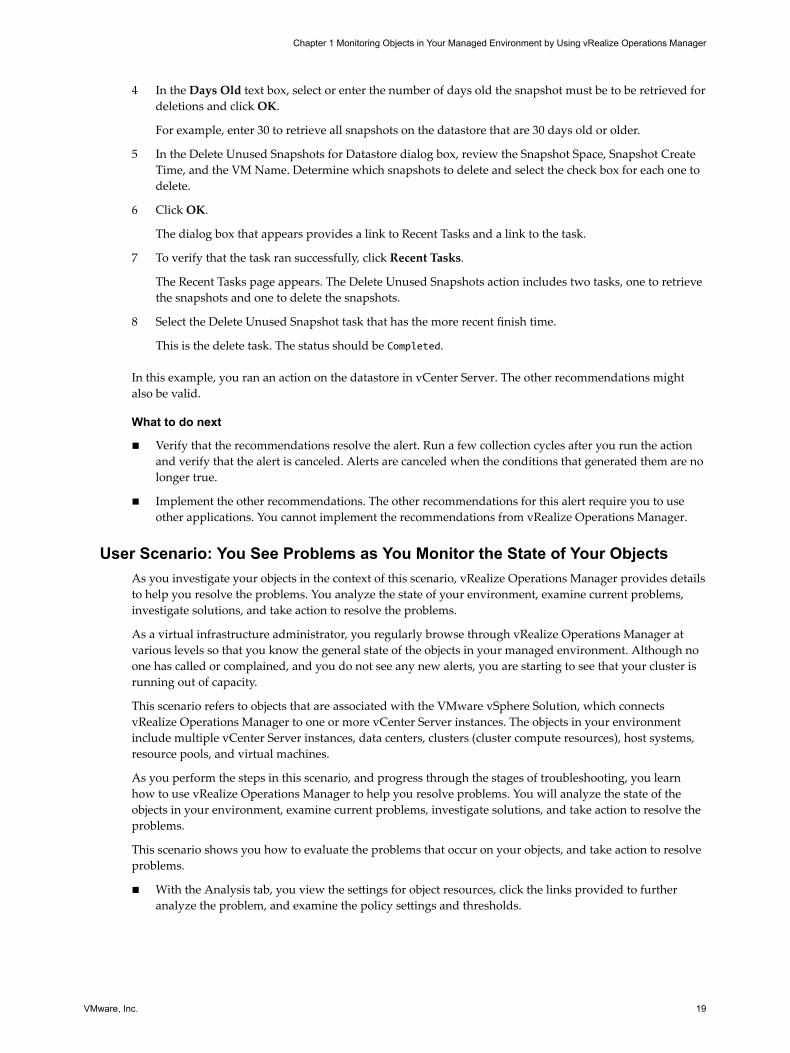
4 In the Days Old text box, select or enter the number of days old the snapshot must be to be retrieved fordeletions and click OK.
For example, enter 30 to retrieve all snapshots on the datastore that are 30 days old or older.
5 In the Delete Unused Snapshots for Datastore dialog box, review the Snapshot Space, Snapshot CreateTime, and the VM Name. Determine which snapshots to delete and select the check box for each one todelete.
6 Click OK.
The dialog box that appears provides a link to Recent Tasks and a link to the task.
7 To verify that the task ran successfully, click Recent Tasks.
The Recent Tasks page appears. The Delete Unused Snapshots action includes two tasks, one to retrievethe snapshots and one to delete the snapshots.
8 Select the Delete Unused Snapshot task that has the more recent finish time.
This is the delete task. The status should be Completed.
In this example, you ran an action on the datastore in vCenter Server. The other recommendations mightalso be valid.
What to do next
n Verify that the recommendations resolve the alert. Run a few collection cycles after you run the actionand verify that the alert is canceled. Alerts are canceled when the conditions that generated them are nolonger true.
n Implement the other recommendations. The other recommendations for this alert require you to useother applications. You cannot implement the recommendations from vRealize Operations Manager.
User Scenario: You See Problems as You Monitor the State of Your ObjectsAs you investigate your objects in the context of this scenario, vRealize Operations Manager provides detailsto help you resolve the problems. You analyze the state of your environment, examine current problems,investigate solutions, and take action to resolve the problems.
As a virtual infrastructure administrator, you regularly browse through vRealize Operations Manager atvarious levels so that you know the general state of the objects in your managed environment. Although noone has called or complained, and you do not see any new alerts, you are starting to see that your cluster isrunning out of capacity.
This scenario refers to objects that are associated with the VMware vSphere Solution, which connectsvRealize Operations Manager to one or more vCenter Server instances. The objects in your environmentinclude multiple vCenter Server instances, data centers, clusters (cluster compute resources), host systems,resource pools, and virtual machines.
As you perform the steps in this scenario, and progress through the stages of troubleshooting, you learnhow to use vRealize Operations Manager to help you resolve problems. You will analyze the state of theobjects in your environment, examine current problems, investigate solutions, and take action to resolve theproblems.
This scenario shows you how to evaluate the problems that occur on your objects, and take action to resolveproblems.
n With the Analysis tab, you view the settings for object resources, click the links provided to furtheranalyze the problem, and examine the policy settings and thresholds.
Chapter 1 Monitoring Objects in Your Managed Environment by Using vRealize Operations Manager
VMware, Inc. 19

n Using the Events tab, you examine the symptoms that triggered on the objects, determine when theproblems that triggered those symptoms occurred, identify the events associated with those problems,and examine the metric values involved.
n On the Details tab, you investigate the metric activity as a graph, list, or distribution chart, and view theheat maps to examine the criticality levels of your objects.
n With the Environment tab, you evaluate the health, risk, and efficiency of various objects as they relateto your overall object hierarchy. You view the object relationships to determine how an object that is in acritical state might be affecting other objects.
To support future troubleshooting and ongoing maintenance, you can create a new alert definition, andcreate a dashboard and one or more views and reports. To plan for growth and account for newly approvedprojects, you can create and commit capacity projects. To enforce the rules used to monitor your objects, youcan create and customize operational policies.
Prerequisites
Verify that you are monitoring one or more vCenter Server instances. See the vRealize Operations ManagerCustomization and Administration Guide.
Procedure
1 Analyze the State of Your Environment on page 21The Analysis tabs help you analyze your objects in multiple ways. As a Virtual InfrastructureAdministrator, you use the Analysis tabs to evaluate the details about the state of your objects to helpyou resolve problems.
2 Troubleshoot Problems with a Host System on page 21You use the Troubleshooting tabs to identify the root cause of problems that are not resolved by alertrecommendations or simple analysis.
3 Examine the Environment Details on page 23Examine the status of your objects in the views and heatmaps so that you can identify the trends andspikes that are occurring with the resources on your cluster and objects. To determine whether anydeviations have occurred, you can display overall summaries for an object, such as for the cluster diskspace usage breakdown.
4 Examine the Environment Relationships on page 25You use the Environment Overview and List to examine the status of the badges as they relate to theobjects in your environment hierarchy, and determine which objects are in a critical state for aparticular badge. To view the relationships between your objects to determine whether an ancestorobject that has a critical problem might be causing problems with the descendants of the object, youuse the Environment Map.
5 Fix the Problem on page 27You use the analysis and troubleshooting features of vRealize Operations Manager to examineproblems that put your objects in a critical state, and identify solutions. To resolve the problems,where actions exist for the object type, you select an object and an available action that is specific to theobject. Or, you can open the object in the vSphere Web Client and modify the object settings to resolvethe problem.
6 Create a New Alert Definition on page 28Based on the root cause of the problem, and the solutions that you used to fix the problem, you cancreate a new alert definition for vRealize Operations Manager to alert you. When the alert is triggeredon your host system, vRealize Operations Manager alerts you and provides recommendations on howto solve the problem.
vRealize Operations Manager User Guide
20 VMware, Inc.
7 Create Dashboards and Views on page 29To help you investigate and troubleshoot problems with your cluster and host systems that mightoccur in the future, you can create dashboards and views that apply the troubleshooting tools andsolutions that you used to research and solve the problems with your host system, to make thosetroubleshooting tools and solutions available for future use.
Analyze the State of Your EnvironmentThe Analysis tabs help you analyze your objects in multiple ways. As a Virtual Infrastructure Administrator,you use the Analysis tabs to evaluate the details about the state of your objects to help you resolve problems.
As you browse through the inventory tree, you notice that one of your clusters, named USA-Cluster, isexperiencing capacity problems. You use the Analysis tabs to begin to investigate the cause of the problemon USA-Cluster, and you start to see problems reported with the capacity on one of your host systems andother objects.
Prerequisites
Verify that you understand the context of this scenario. See “User Scenario: You See Problems as YouMonitor the State of Your Objects,” on page 19.
Procedure
1 In the menu, click Environment, then in the left pane click vSphere Hosts and Clustersand select theobject.
2 Click the Analysis tab.
You see red icons on the Capacity Remaining and Time Remaining tabs.
3 Click the Time Remaining tab.
You see that the memory allocation is severely constrained.
4 View the time remaining breakdown for the cluster.
The icons indicate that zero days remain, with no planned capacity projects considered.
5 Scroll down until you see the Time Remaining in Related Objects pane.
The parent object is the data center, and the peer represents another cluster. The child objects includethe resource pool and host systems. The data center and one of the host systems are experiencingcritical memory problems.
6 Hover your mouse over the red parent and child icons.
The memory capacity has expired on the data center and one of the host systems.
The memory capacity problem on the cluster is affecting the memory capacity of the related objects.
What to do next
Use the Troubleshooting tab to further troubleshoot the capacity problems on your cluster and host system.See “Troubleshoot Problems with a Host System,” on page 21.
Troubleshoot Problems with a Host SystemYou use the Troubleshooting tabs to identify the root cause of problems that are not resolved by alertrecommendations or simple analysis.
To further troubleshoot the symptoms of the capacity problems that are occurring on the cluster and hostsystem, and determine when those problems occurred, you use the Troubleshooting tabs to continue toinvestigate the memory problem.
Chapter 1 Monitoring Objects in Your Managed Environment by Using vRealize Operations Manager
VMware, Inc. 21
Prerequisites
Use the Analysis tabs to analyze your environment. See “Analyze the State of Your Environment,” onpage 21.
Procedure
1 In the menu, click Environment, then in the left pane click vSphere Hosts and Clusters and select theobject. For example, USA-Cluster.
2 Click the Alerts tab and review the symptoms.
The Symptoms tab displays the symptoms that triggered on the selected cluster. You notice that severalcritical symptoms exist.
n Cluster Compute Resource Time Remaining with committed projects is critically low
n Cluster Compute Resource Time Remaining is critically low
n Capacity remaining is critically low
3 Analyze the critical symptoms.
a Hover your mouse over each critical symptom to identify the metric used.
b To view only the symptoms that affect the cluster, enter cluster in the quick filter text box.
When you hover over Cluster Compute Resource Time Remaining is critically low, the metricBadge|Time Remaining with committed projects (%) appears. You notice that its value is less thanor equal to zero, which caused the capacity symptom to trigger and generate an alert on USA-Cluster.
4 Click the Events > Timeline tab to review the triggered symptoms, alerts, and events that occurred onUSA-Cluster over time, and identify when the problems occurred.
a Click the calendar and select Last 7 Days as the range.
Several events appear in red.
b Hover your mouse over each event to view the details.
c To display the events that occurred on the cluster's data center, click View From, and selectDatacenter.
Warning events for the data center appear in yellow.
d Hover your mouse over the warning events.
You notice that the density is starting to get low, and that a hard threshold violation occurred onthe data center late in the evening. The hard threshold violation shows that the Badge|Densitymetric value was under the acceptable value of 25, and that the violation triggered with a value of14.89.
e To view the affected child objects, click View From and select Host System.
5 Click the Events tab to examine the changes that occurred on USA-Cluster, and determine whether achange occurred that contributed to the root cause of the alert or other problems with the cluster.
a Review the graph.
By reviewing the graph, you can determine whether a reoccurring event has caused the errors.Each event indicates that the guest file system is out of disk space. The affected objects appear inthe pane below the graph.
b Click each red triangle to identify the affected object and highlight it in the pane below.
vRealize Operations Manager User Guide
22 VMware, Inc.
6 Click the All Metrics tab to evaluate the objects in their context in the environment topology to helpidentify the possible cause of a problem.
a In the top view, select USA-Cluster.
b In the metrics pane, expand Badge and double-click Badge|Capacity Remaining (%).
The Badge|Capacity Remaining (%) calculation is added to the lower right pane.
c In the metrics pane, double-click Density.
d In the metrics pane, double-click Workload.
e On the toolbar, click Date Controls and select Last 7 Days.
The metric chart indicates that the capacity for the cluster remained at a steady level for the pastweek, but that the cluster density increased to its maximum value in the last several days. TheBadge|Workload (%) calculation displays the workload extremes that correspond to the densityproblem.
You have analyzed the symptoms, timeline, events, and metrics related to the problems on your cluster, anddetermined that the heavy workload on the cluster has decreased the cluster density in the last several days,which indicates that the cluster is starting to run out of capacity.
What to do next
Examine the Details views and heatmaps to interpret the properties, metrics, and alerts to look for trendsand spikes that occur in the resources for your objects, the distributions of resources across your objects, anddata maps to examine the use of various resource types across your objects. See “Examine the EnvironmentDetails,” on page 23.
Examine the Environment DetailsExamine the status of your objects in the views and heatmaps so that you can identify the trends and spikesthat are occurring with the resources on your cluster and objects. To determine whether any deviations haveoccurred, you can display overall summaries for an object, such as for the cluster disk space usagebreakdown.
To examine the problems with your USA-Cluster further, use the Details views to display the metrics andcollected capacity data for your cluster. Each view includes specific metrics data collected from your objects.For example, trend views use data collected from objects over time to generate trends and forecasts forresources such as memory, CPU, disk space, and so on.
Use the heatmaps to examine the capacity levels on the cluster, host systems, and virtual machines. Theblock sizes and colors are based on the metrics selected in the heatmap configuration. For example, theheatmap that shows the most abnormal workload for virtual machines is sized by the Badge|Workload (%)metric, and is colored by the Badge|Anomaly metric.
Prerequisites
Use the Troubleshooting tabs to look for root causes. See “Troubleshoot Problems with a Host System,” onpage 21
Procedure
1 Click Environment > vSphere Hosts and Clusters > USA-Cluster.
Chapter 1 Monitoring Objects in Your Managed Environment by Using vRealize Operations Manager
VMware, Inc. 23
2 Examine the detailed information about USA-Cluster in the views.
a Click the Details tab and click Views.
The views provide multiple ways to look at different types of collected data by using trends, lists,distributions, and summaries.
b In the search text box, enter capacity.
The list filters and displays the capacity views for clusters and other objects.
c Click the view named Cluster Capacity Risk Forecast, and examine the number of virtualmachines for USA-Cluster in the lower pane.
Even though the USA-Cluster has two host systems and 30 virtual machines, no capacity exists.
3 Examine the host systems in the cluster, and reclaim capacity from the descendant virtual machines.
a Click the Analysis tab, and click Capacity Remaining.
b In the inventory tree, expand USA-Cluster, and click each of the host systems.
The host system named w2-vcopsqe2-009 is in a critical state, with no capacity remaining.
c In the lower pane, expand Memory, and expand Allocation.
The stress free value is zero, and the amount of memory available is zero, which indicates that thecapacity of the host system has been depleted.
d Click the Details tab, and click Views, and click the Virtual Machine Reclaimable Capacity view.
e In the lower pane, click the title of the Reclaimable Memory column to sort the list of virtualmachines so that the largest amount of reclaimable capacity is on top.
f To reclaim capacity from several virtual machines, click to the right of the first virtual machinename, then press Shift and click to the right of the last virtual machine that has capacity to reclaim.
The virtual machines that have reclaimable capacity are highlighted.
g Click the gear icon, and select Set CPU Count and Memory for VM.
h Click the Current CPU column title to sort the list according to the highest number of CPUs.
Based on the actual use of the virtual machines listed, the New CPU column recommends fewerCPUs for each virtual machine.
i Click the check box next to each virtual machine that has a recommended lower CPU count, andclick OK.
By reducing the number of CPUs for each virtual machine, you free up capacity on your hostsystem, and improve the USA-Cluster capacity and workload.
4 Examine the heatmaps for the host system and virtual machine objects in USA-Cluster.
a In the inventory tree, click USA-Cluster.
b Click Details, click Heatmaps, and click through the list of heatmap views.
c Click Which VMs currently have the highest CPU demand and contention?
The heatmap displays blocks that represent the objects in USA-Cluster. The block for a virtualmachine appears in red, which indicates that it has a critical problem.
d Hover over the red block and examine the details.
The cluster, host system, and virtual machine names appear, with links to more information aboutthe object.
vRealize Operations Manager User Guide
24 VMware, Inc.
e Click Show Sparkline to display the activity trend on the virtual machine.
f Click each of the Details links to display more information.
To verify that freeing up memory on the virtual machines has improved the workload of the host systemand the cluster, you can now examine the status of the host system and cluster.
You used views and heatmaps to evaluate the status of your objects and identify trends and spikes, and freeup capacity for your host system and USA-Cluster. To further narrow in on problems, you can examine theother views and heatmaps. You can also create your own views and heatmaps.
What to do next
Examine the badge status for the objects in your environment hierarchy to determine which objects are in acritical state, and examine the object relationships to determine whether a problem on one object is affectingone or more other objects. See “Examine the Environment Relationships,” on page 25.
Examine the Environment RelationshipsYou use the Environment Overview and List to examine the status of the badges as they relate to the objectsin your environment hierarchy, and determine which objects are in a critical state for a particular badge. Toview the relationships between your objects to determine whether an ancestor object that has a criticalproblem might be causing problems with the descendants of the object, you use the Environment Map.
As you click each of the badges in the Environment Overview, you see that several objects are experiencingcritical problems with health, workload, and faults. Others are reporting critical risk status, and many are incritical time remaining and capacity remaining states.
Several objects are experiencing stress. You notice that you can reclaim capacity from multiple virtualmachines and a host system, but the overall efficiency status for your environment displays no problems.
Prerequisites
Examine the status of your objects in views and heatmaps. See “Examine the Environment Details,” onpage 23.
Procedure
1 Click Environment > vSphere Hosts and Clusters > USA-Cluster.
Chapter 1 Monitoring Objects in Your Managed Environment by Using vRealize Operations Manager
VMware, Inc. 25
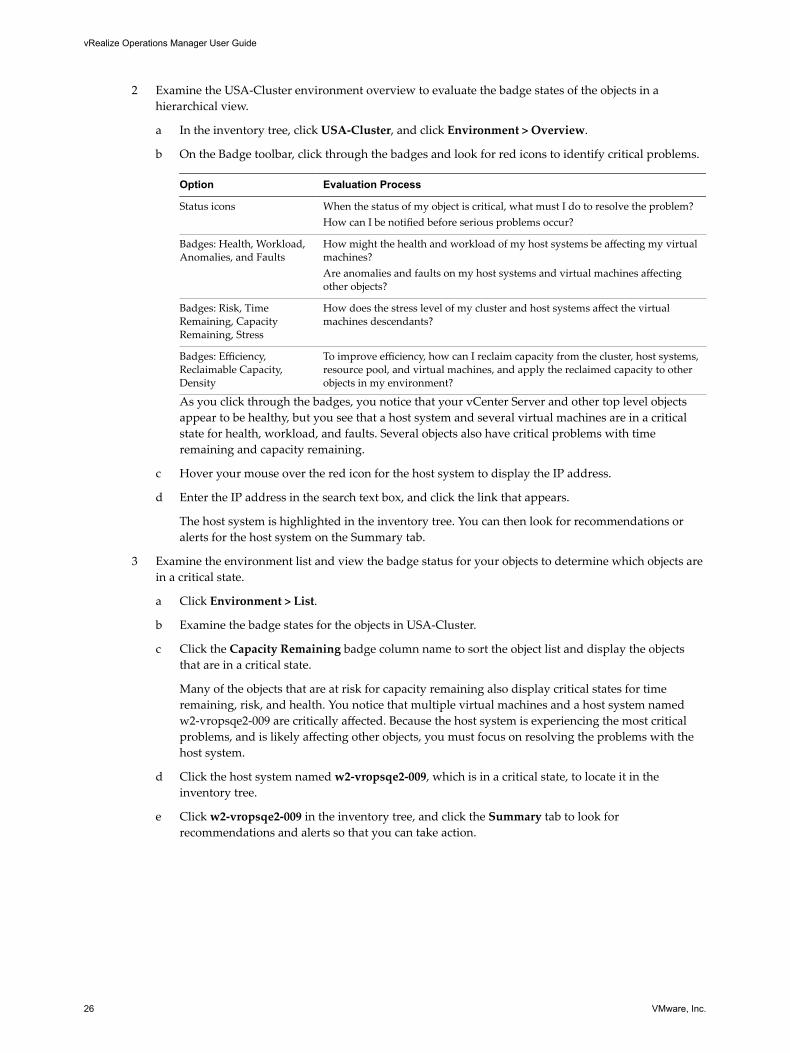
2 Examine the USA-Cluster environment overview to evaluate the badge states of the objects in ahierarchical view.
a In the inventory tree, click USA-Cluster, and click Environment > Overview.
b On the Badge toolbar, click through the badges and look for red icons to identify critical problems.
Option Evaluation Process
Status icons When the status of my object is critical, what must I do to resolve the problem?How can I be notified before serious problems occur?
Badges: Health, Workload,Anomalies, and Faults
How might the health and workload of my host systems be affecting my virtualmachines?Are anomalies and faults on my host systems and virtual machines affectingother objects?
Badges: Risk, TimeRemaining, CapacityRemaining, Stress
How does the stress level of my cluster and host systems affect the virtualmachines descendants?
Badges: Efficiency,Reclaimable Capacity,Density
To improve efficiency, how can I reclaim capacity from the cluster, host systems,resource pool, and virtual machines, and apply the reclaimed capacity to otherobjects in my environment?
As you click through the badges, you notice that your vCenter Server and other top level objectsappear to be healthy, but you see that a host system and several virtual machines are in a criticalstate for health, workload, and faults. Several objects also have critical problems with timeremaining and capacity remaining.
c Hover your mouse over the red icon for the host system to display the IP address.
d Enter the IP address in the search text box, and click the link that appears.
The host system is highlighted in the inventory tree. You can then look for recommendations oralerts for the host system on the Summary tab.
3 Examine the environment list and view the badge status for your objects to determine which objects arein a critical state.
a Click Environment > List.
b Examine the badge states for the objects in USA-Cluster.
c Click the Capacity Remaining badge column name to sort the object list and display the objectsthat are in a critical state.
Many of the objects that are at risk for capacity remaining also display critical states for timeremaining, risk, and health. You notice that multiple virtual machines and a host system namedw2-vropsqe2-009 are critically affected. Because the host system is experiencing the most criticalproblems, and is likely affecting other objects, you must focus on resolving the problems with thehost system.
d Click the host system named w2-vropsqe2-009, which is in a critical state, to locate it in theinventory tree.
e Click w2-vropsqe2-009 in the inventory tree, and click the Summary tab to look forrecommendations and alerts so that you can take action.
vRealize Operations Manager User Guide
26 VMware, Inc.
4 Examine the environment map.
a Click Environment > Map.
b In the inventory tree, click USA-Cluster, and view the map of related objects.
In the relationship map, you can see that the USA-Cluster has an ancestor data center, onedescendant resource pool, and two descendant host systems.
c Click the host system named w2-vropsqe2-009.
The types and numbers of descendant objects for this host system appear in the list below. Use thedescendant object list identify all of the objects related objects to the host system that might beexperiencing problems.
What to do next
Take action in the user interface to resolve the problems. See “Fix the Problem,” on page 27.
Fix the ProblemYou use the analysis and troubleshooting features of vRealize Operations Manager to examine problemsthat put your objects in a critical state, and identify solutions. To resolve the problems, where actions existfor the object type, you select an object and an available action that is specific to the object. Or, you can openthe object in the vSphere Web Client and modify the object settings to resolve the problem.
You have used the Analysis, Troubleshooting, Details, and Environment areas of the user interface toexamine the critical problems that occur on your objects. To resolve those problems, you can select actionsfrom the Actions menu, which appears in list and view menus, and various dashboard widgets.
The actions that you can select are specific to an object type, such as a virtual machine. Although you canselect an action when you have selected a host system that is experiencing critical problems related tocapacity and time, all but one of the actions that you can take apply to virtual machines. The action to deleteunused snapshots applies to datastores.
Prerequisites
Examine the environment relationships. See “Examine the Environment Relationships,” on page 25.
Procedure
1 In the menu, click Environment, then click vSphere Hosts and Clusters > vSphere World in the leftpane.
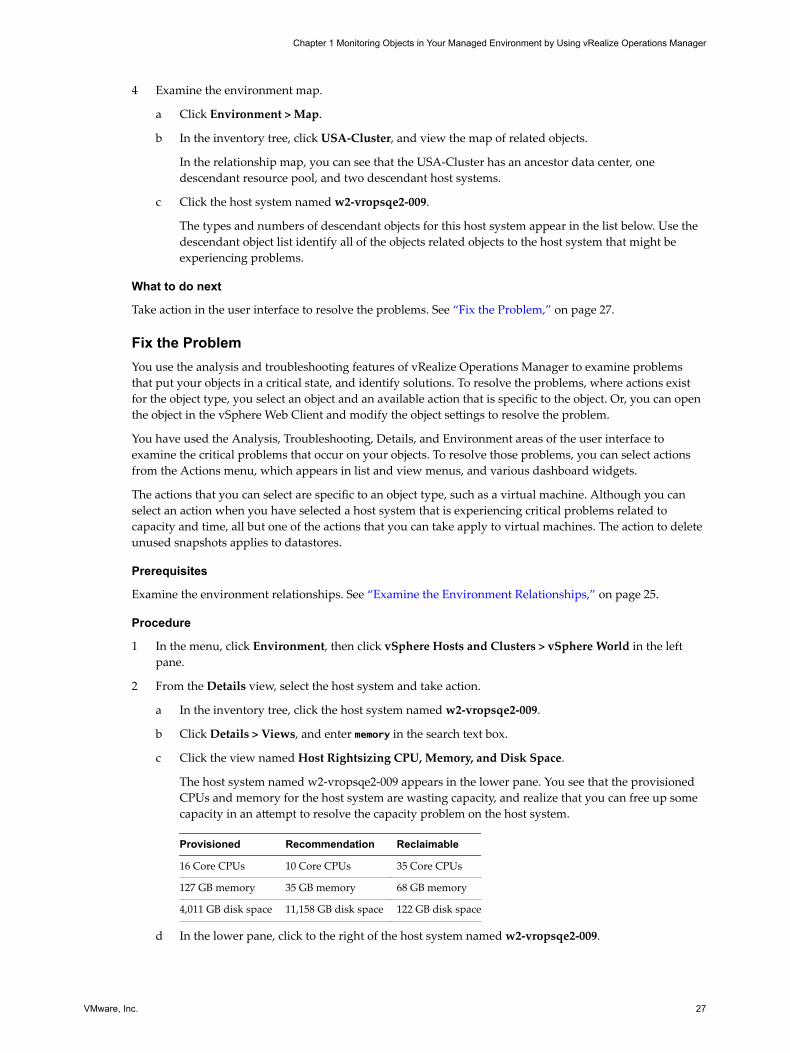
2 From the Details view, select the host system and take action.
a In the inventory tree, click the host system named w2-vropsqe2-009.
b Click Details > Views, and enter memory in the search text box.
c Click the view named Host Rightsizing CPU, Memory, and Disk Space.
The host system named w2-vropsqe2-009 appears in the lower pane. You see that the provisionedCPUs and memory for the host system are wasting capacity, and realize that you can free up somecapacity in an attempt to resolve the capacity problem on the host system.
Provisioned Recommendation Reclaimable
16 Core CPUs 10 Core CPUs 35 Core CPUs
127 GB memory 35 GB memory 68 GB memory
4,011 GB disk space 11,158 GB disk space 122 GB disk space
d In the lower pane, click to the right of the host system named w2-vropsqe2-009.
Chapter 1 Monitoring Objects in Your Managed Environment by Using vRealize Operations Manager
VMware, Inc. 27
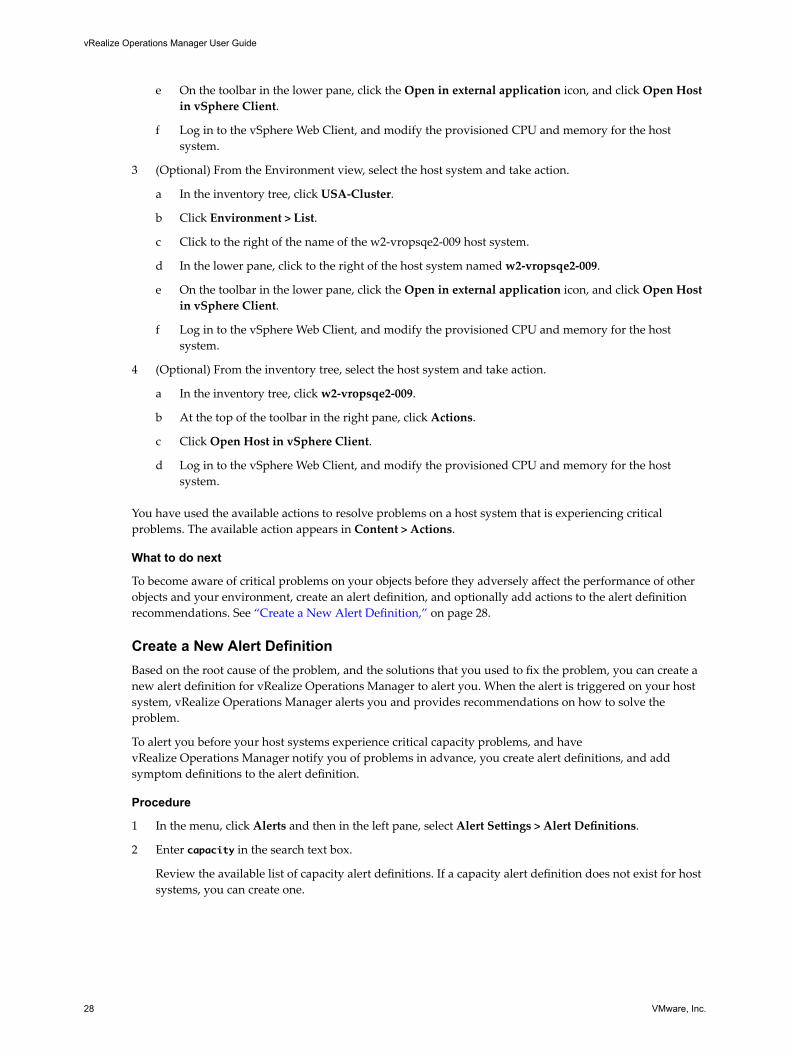
e On the toolbar in the lower pane, click the Open in external application icon, and click Open Hostin vSphere Client.
f Log in to the vSphere Web Client, and modify the provisioned CPU and memory for the hostsystem.
3 (Optional) From the Environment view, select the host system and take action.
a In the inventory tree, click USA-Cluster.
b Click Environment > List.
c Click to the right of the name of the w2-vropsqe2-009 host system.
d In the lower pane, click to the right of the host system named w2-vropsqe2-009.
e On the toolbar in the lower pane, click the Open in external application icon, and click Open Hostin vSphere Client.
f Log in to the vSphere Web Client, and modify the provisioned CPU and memory for the hostsystem.
4 (Optional) From the inventory tree, select the host system and take action.
a In the inventory tree, click w2-vropsqe2-009.
b At the top of the toolbar in the right pane, click Actions.
c Click Open Host in vSphere Client.
d Log in to the vSphere Web Client, and modify the provisioned CPU and memory for the hostsystem.
You have used the available actions to resolve problems on a host system that is experiencing criticalproblems. The available action appears in Content > Actions.
What to do next
To become aware of critical problems on your objects before they adversely affect the performance of otherobjects and your environment, create an alert definition, and optionally add actions to the alert definitionrecommendations. See “Create a New Alert Definition,” on page 28.
Create a New Alert DefinitionBased on the root cause of the problem, and the solutions that you used to fix the problem, you can create anew alert definition for vRealize Operations Manager to alert you. When the alert is triggered on your hostsystem, vRealize Operations Manager alerts you and provides recommendations on how to solve theproblem.
To alert you before your host systems experience critical capacity problems, and havevRealize Operations Manager notify you of problems in advance, you create alert definitions, and addsymptom definitions to the alert definition.
Procedure
1 In the menu, click Alerts and then in the left pane, select Alert Settings > Alert Definitions.
2 Enter capacity in the search text box.
Review the available list of capacity alert definitions. If a capacity alert definition does not exist for hostsystems, you can create one.
vRealize Operations Manager User Guide
28 VMware, Inc.

3 Click the plus sign to create a new capacity alert definition for your host systems.
a In the alert definition workspace, for the Name and Description, enterHosts - Alert on Capacity Exceeded.
b For the Base Object Type, select vCenter Adapter > Host System
c For the Alert Impact, select the following options.
Option Selection
Impact Select Risk.
Criticality Select Immediate.
Alert Type and Subtype Select Application : Capacity.
Wait Cycle Select 1.
Cancel Cycle Select 1.
d For Add Symptom Definitions, select the following options.
Option Selection
Defined On Select Self.
Symptom Definition Type Select Metric / Supermetric.
Quick filter (Name) Enter capacity.
e From the Symptom Definition list, click Host System Capacity Remaining is moderately low anddrag it to the right pane.
In the Symptoms pane, make sure that the Base object exhibits criteria is set to All by default.
f For Add Recommendations, enter virtual machine in the quick filter text box.
g Click Review the symptoms listed and remove the number of vCPUs from the virtual machine asrecommended by the system, and drag it to the recommendations area in the right pane.
This recommendation is set to Priority 1.
4 Click Save to save the alert definition.
Your new alert appears in the list of alert definitions.
You have added an alert definition to have vRealize Operations Manager alert you when the capacity ofyour host systems begins to run out.
Create Dashboards and ViewsTo help you investigate and troubleshoot problems with your cluster and host systems that might occur inthe future, you can create dashboards and views that apply the troubleshooting tools and solutions that youused to research and solve the problems with your host system, to make those troubleshooting tools andsolutions available for future use.
To readily view the status of your cluster and host systems when your CIO asks you about their health, youcan use the decision support dashboards on the vRealize Operations Manager Home page. For example, youcan:
n Use the vSphere Clusters dashboard to view the utilization index, CPU demand, and memory use foryour clusters. This dashboard also tracks the net use and disk I/O operations.
n Use vSphere Cluster Configuration Summary dashboard to track the high availability status, and otherconfiguration items.
Chapter 1 Monitoring Objects in Your Managed Environment by Using vRealize Operations Manager
VMware, Inc. 29

n Use the vSphere Hosts Overview to examine the capacity levels of your cluster, host systems, andvirtual machines.
n Use the Health of Host Systems dashboard to view the active alert list, capacity metric chart andheatmap for your host system.
Or, you might need to create your own dashboards to track the status of your clusters and host systems.
If you work in a Network Operations Center environment and have multiple monitors, you can run multipleinstances of vRealize Operations Manager, and dedicate a monitor to each specific dashboard so that youcan visually track the status of your objects.
Prerequisites
Create an alert definition to alert you when the capacity of your host system is getting low. See “Create aNew Alert Definition,” on page 28.
Procedure
1 In the menu, click Dashboards and look through the list of existing dashboards to determine whetheryou can use the cluster and host system dashboards to track your clusters and host systems.
2 Click the Health of Host Systems dashboard, and review the widgets included on it.
The inclusion of the Object List, Alert List, Metric Picker, Metric Chart, Heatmap, and Top-N widgetswould allow you to easily peruse the status of the host systems that you select in the Object List widget.This dashboard has the widget interaction configured so that the object you select in the Object Listwidget is the object for which the other widgets display data.
3 Create and configure a new dashboard that has widgets to monitor the health of your host systems andgenerate alerts.
a Above the dashboard view, click Actions and select Create Dashboard.
b In the New Dashboard workspace, for the Dashboard Name, enter Health of Host Systems, andleave the other default settings.
c In the Widget List workspace, add the Object List widget and configure it to display host systemobjects.
d Add the Alert List widget to the dashboard, and configure it to display capacity alerts when thecapacity of your host systems becomes an immediate risk.
e In the Widget Interactions workspace, for each widget listed, select the Object List widget as theprovider to drive the data to the other widgets, and click Apply Interactions.
f In the Dashboard Navigation workspace, select the dashboards that receive data from the selectedwidgets, and click Apply Navigations.
After vRealize Operations Manager collects data, if a problem occurs with the capacity of your hostsystems, the Alert List widget on your new dashboard displays the alerts that are configured for yourhost systems.
What to do next
Prepare to share information with others, plan for growth and new projects, and use policies tocontinuously monitor all of the objects in your environment. To plan for growth and new projects, see Chapter 2, “Planning the Capacity for Your Managed Environment Using vRealize Operations Manager,” onpage 67. To generate reports, and create and customize policies, see the vRealize Operations ManagerCustomization and Administration Guide.
vRealize Operations Manager User Guide
30 VMware, Inc.
Monitoring and Responding to AlertsAlerts indicate a problem in your environment. Alerts are generated when the collected data for an object iscompared to alert definitions for that object type and the defined symptoms are true. When an alert isgenerated, you are presented with the triggering symptoms, so that you can evaluate the object in yourenvironment, and with recommendations for how to resolve the alert.
Alerts notify you when an object or group of objects are exhibiting symptoms that are unfavorable for yourenvironment. By monitoring and responding to alerts, you stay aware of problems and can react to them ina timely fashion.
Generated alerts drive the status of the top level badges, Health, Risk, and Efficiency.
In addition to responding to alerts, you can generally respond to the status of badges for objects in yourenvironment.
You cannot assign alerts to vRealize Operations Manager users. Your users must take ownership of an alert.
Monitoring Alerts in vRealize Operations ManagerYou can monitor your environment for generated alerts in several areas in vRealize Operations Manager.The alerts are generated when the symptoms in the alert definition are triggered, letting you know when theobjects in your environment are not operating within the parameters you defined as acceptable.
Generated alerts appear in many areas of vRealize Operations Manager so that you can monitor andrespond to problems in your environment.
AlertsAlerts are classified as Health, Risk, or Efficiency. Health alerts indicate problems that require immediateattention. Risk alerts indicate problems that must be addressed in the near future, before the problemsbecome immediate health problems. Efficiency alerts indicate areas where you can reclaim wasted space orimprove the performance of objects in your environment.
You can monitor the alerts for your environment in the following locations.
n Alerts
n Health
n Risk
n Efficiency
You can monitor alerts for a selected object in the following locations.n Alert Details, including the Summary, Timeline, and Metric Charts tabs
n Summary tab
n Alerts tab
n Events tab
n Custom dashboards
n Alert notifications
Working with AlertsAlerts indicate a problems that must be resolved so that triggering conditions no longer exist and the alert iscanceled. Suggested resolutions are provided as recommendations so that you can approach the problemwith solutions.
As you monitor alerts, you can take ownership, suspend, or manually cancel alerts.
Chapter 1 Monitoring Objects in Your Managed Environment by Using vRealize Operations Manager
VMware, Inc. 31
When you cancel an alert, the alert and any symptoms of type fault, message event, or metric event arecanceled. You cannot manually cancel other types of symptoms. If the alert was triggered by a faultsymptom, message event symptom or metric event symptom, then the alert is effectively canceled. If thealert was triggered by a metric symptom or property symptom, a new alert might be created for the sameconditions in the next few minutes.
The correct way to remove an alert is to address the underlying conditions that triggered the symptoms andgenerated the alert.
Migrated AlertsIf you migrated alerts from a previous version of vRealize Operations Manager, the alerts are listed in theoverview with a cancelled status, but alert details are not available.
User Scenario: Monitor and Process Alerts in vRealize Operations ManagerAlerts in vRealize Operations Manager notify you when objects in your environment have a problem. Thisscenario illustrates one way that you can monitor and process alerts for the objects for which you areresponsible.
An alert is generated when one or more of the alert symptoms are triggered. Depending on how the alert isconfigured, the alert is generated when one symptom is triggered or when all of the symptoms aretriggered.
As the alerts are generated, you must process the alerts based on the negative affect they have on objects inyour environment. To do this, you start with Health alerts, and process them based on criticality.
As a virtual infrastructure administrator, you review the alerts at least twice a day. As part of yourevaluation process in this scenario, you encounter the following alerts:
n Virtual machine has unexpected high CPU workload
n Host has memory contention that a few virtual machines cause
n Cluster has many virtual machines that have memory contention because of memory compression,ballooning, or swapping
Procedure
1 In the menu, click Alerts.
2 Select Time in the Group By filter and the click the down arrow in the Created On column, so the mostrecent alerts are listed first .
3 In All Filters, select Criticality > Warning
You have listed all the Warning alerts in order of when they fired, with the most recent alerts appearingfirst.
4 Review the alerts by name, the object on which it was triggered, the object type, and the time at whichthe alert was generated.
For example, do you recognize any of the objects as objects that you are responsible for managing? Doyou know that the fix that you will implement in the next hour will fix any of the alerts that areaffecting the Health status of the object? Do you know that some of your alerts cannot be resolved atthis time because of resource constraints?
5 To indicate to other administrators or engineers that you are taking ownership of the Virtual machinehas unexpected high CPU workload alerts, click the selected alerts, click Actions on the menu bar, andclick Take Ownership.
The Assigned to: field in Alert Details updates with your user name. You can only take ownership ofalerts, you cannot assign them to other users.
vRealize Operations Manager User Guide
32 VMware, Inc.
6 To take ownership and temporarily exclude the alert from affecting the state of the object, select theHost has memory contention caused by a few virtual machines alert in the list, click Actions on themenu bar, and click Suspend.
a Enter 60 to suspend the alert of an hour.
b Click OK.
The alert is suspended for 60 minutes and you are listed as the owner in the alert list. If it is not resolvedin an hour, it returns to an active state.
7 Select the row that contains the Cluster has many Virtual Machines that have memory contentiondue to memory compression, ballooning or swapping alert, click Actions on the menu bar, and clickCancel Alert to remove the alert from the list.
This alert is a known problem that you cannot resolve until the new hardware arrives.
The alert is removed from the alert list, but the underlying condition is not resolved by this action. Thesymptoms in this alert are based on metrics, so the alert will be generated during the next collection andanalysis cycle. This pattern continues until you resolve the underlying hardware and workloaddistribution issues.
You processed the critical health alerts and took ownership of the ones to resolve or troubleshoot further.
What to do next
Respond to an alert. See “User Scenario: Respond to a vRealize Operations Manager Alert in the HealthAlert List,” on page 33.
User Scenario: Respond to a vRealize Operations Manager Alert in the HealthAlert ListGenerated alerts in vRealize Operations Manager appear in the alert lists. You use the alert lists toinvestigate, resolve, and begin troubleshooting problems in your environment.
In this scenario, you investigate and resolve the Virtual machine has unexpected high CPU workload alert.The alert might be generated for more than one virtual machine.
Prerequisites
n Process and take ownership of the alerts you will troubleshoot and resolve. See “User Scenario: Monitorand Process Alerts in vRealize Operations Manager,” on page 32.
n Review information about how the Power Off Allowed setting works when you run actions. See thesection Working with Actions That Use Power Off Allowed in the vRealize Operations ManagerInformation Center.
Procedure
1 In the menu, click Alerts.
2 To limit the list to virtual machine alerts, click All Filters on the toolbar.
a Select Object Type in the drop-down menu.
b Enter virtual machine in the text box.
c Click Enter.
The alerts list displays only alerts based on virtual machines.
3 To locate the alerts by name, enter high CPU workload in the Quick filter (Alert) text box.
4 In the list, click the Virtual machine has unexpected high CPU workload alert name.
Chapter 1 Monitoring Objects in Your Managed Environment by Using vRealize Operations Manager
VMware, Inc. 33

5 Review the information. Click Alert Settings > Recommendations in the left pane to show therecommendations.
Option Evaluation Process
Alert Description Review the description so that you better understand the alert.
Recommendations Do you think that implementing one or more of the recommendations willresolve the alert?
What is Causing the Issue? Do the triggered symptoms support the recommendations? Do the othertriggered symptoms contradict the recommendation, indicating that youmust investigate further?In this example, the triggered symptoms indicate that the virtual machineCPU demand is at a critical level and that the virtual machine anomaly isstarting to get high.
Non-Triggered Symptoms Some alerts are generated only when all the symptoms are triggered.Others are configured to generate an alert when any one of the symptomsare triggered. If you have non-triggered symptoms, evaluate them in thecontext of the triggered alerts.Do the non-triggered symptoms support the recommendations? Do thenon-triggered symptoms indicate that recommendations are not valid andthat you must investigate further?
6 To resolve the alert based on the recommendation to check the guest applications to determine whether
high CPU workload is an expected behavior, click the Action menu on the center pane toolbar andselect Open Virtual Machine in vSphere Client.
a Log in to the vCenter Server instance using your vSphere credentials.
b Launch the console for the virtual machine and identify which guest applications are consumingCPU resources.
7 To resolve the alert based on the recommendation to add more CPU capacity to this virtual machine,click Set CPU Count for VM.
a Enter a new value in the New CPU text box.
The value that appears is the calculated recommended size. If vRealize Operations Manager wasmonitoring the virtual machine for six or more hours, depending on your environment, the valuethat appears is the CPU Recommended Size metric.
b Select the following options to allow power off or to create a snapshot, depending on how yourvirtual machines are configured.
Option Description
Power Off Allowed Shuts down or powers off the virtual machine before modifying thevalue. If VMware Tools is installed and running, the virtual machine isshut down. If VMware Tools is not installed or not running, the virtualmachine is powered off without regard for the state of the operatingsystem.In addition to whether the action shuts down or powers off a virtualmachine, you must consider whether the object is powered on andwhat settings are applied.
Snapshot Creates a snapshot of the virtual machine before you add CPUs.If the CPU is changed with CPU Hot Plug enabled, then the snapshot istaken with the virtual machine running, which consumes more diskspace.
c Click OK.
The action adds the recommended number of CPUs to the target virtual machine.
vRealize Operations Manager User Guide
34 VMware, Inc.
8 Allow several collection cycles to run after implementing the recommended changes and check the alertlist.
What to do next
If the alert does not reappear after several collection cycles, it is resolved. If it reappears, furthertroubleshooting is required. For an alternative scenario for troubleshooting alerts, see “User Scenario: AnAlert Arrives in Your Inbox,” on page 12.
Monitoring and Responding to ProblemsThe organization of the tabs and options in vRealize Operations Manager provides a built-in workflow thatyou can use when you work with objects in your environment.
The tabs, Summary, Alerts, Analysis, and so on, provide a progressive level of detail about the selectedobject. As you work through the tabs, starting with the high level Summary and Alerts tabs, you see thegeneral state of an object. If you identify a problem, you use the aggregated metrics in the Analysis tabs toview the state of the object in a more detail. The data provided in the Events tabs is useful when you areinvestigating the root cause of a problem. The Details tabs are specific data views and the Environment tabsshow object relationships.
As you monitor objects in your environment, you will discover which tabs provide the information that youneed when you are investigating problems.
Evaluating Object Information Using Badge Alerts and the Summary TabThe Summary tab that is associated with the other object tabs summarizes Heath, Risk, and Efficiency badgealerts for the selected object and displays the top alerts that lead to the current state.
Use this tab as an overview of alerts for an object, object group, or application - to evaluate the affect thatalerts are having on an object and to begin troubleshooting problems. For more detail on the badge Alerts,click Badge Alerts, further to the right on the tool bar.
Badge Alert TypesThe Health, Risk, and Efficiency badge states are based on the number and criticality of the generated alertsfor the selected object.
n Health alerts indicate problems that affect the health of your environment and require immediateattention to ensure that service to your customers is not affected.
n Risk alerts indicate problems that are not immediate threats but should be addressed in the near future.
n Efficiency alerts tell you where you can improve performance or reclaim resources.
Alerts for an Object or an Object GroupWhen you are working with a single object, the Top alerts are the alerts generated for the object and the TopAlerts for Children are the alerts generated for any child or other descendant objects in the currentlyselected navigation hierarchy. For example, if you are working with a host object in the vSphere Host andClusters navigation hierarchy, children can include virtual machines and datastores.
When you are working with object groups, which can include one object type, such as hosts, or multipleobjects types, such as hosts, virtual machines, and datastores, all the group member objects are children ofthe group container. The most critical generated alerts for the member objects appear as Top Alerts forChildren.
Chapter 1 Monitoring Objects in Your Managed Environment by Using vRealize Operations Manager
VMware, Inc. 35
For an object group, the only Top Alerts that might be generated are the predefined group population alerts.A group population alert considers the health of all group members and is triggered if the average health isabove the Warning, Immediate, or Critical threshold. If a group population alert is generated, then the badgescore and color is affected by the alert. If a group population alert is not generated, then the badges aregreen. This behavior is because an object group is a container for other objects.
Summary Tab and Related HierarchiesThe alerts that appear on the Summary tab for an object can vary depending on the currently selectedhierarchy in the Related Hierarchies in the left pane.
Depending on the selected hierarchy, you see different alerts and relationships on the Summary tab for anobject. The current focus object name is on the center pane title bar, but the children alerts depend on therelationships that the highlighted hierarchy defined in the Related Hierarchies list in the upper left pane. Forexample, if you are working with a host object relative to virtual machines in the vSphere Hosts andClusters hierarchy, then children commonly include virtual machines and datastores. But if you are workingwith the same host as a member of an object group, then any alerts on virtual machines that are alsomembers of the group do not appear because the host and the virtual machines are considered children ofthe group and peers among each other. In this example, the focus of the Summary tab is the host in thecontext of the group, not the vSphere Hosts and Clusters hierarchy.
Summary Tab Evaluation TechniquesYou can evaluate the state of objects, starting with the Summary tab, by using one or more of the followingtechniques.
n Select an object or object group, click on the alerts on the Summary tab, and resolve the problems thatthe alert indicates.
n Select an object and examine the information about the current object that is provided in the other tabs.For example, you start on the object Summary tab and compare the generated alerts to the analyticinformation about the object on the Analysis tabs.
n Select an object, review the alerts on the Summary > Alerts tab, and select other objects, comparing thevolume and types of alerts generated for different objects.
User Scenario: Evaluate the Badge Alerts for Objects for avRealize Operations Manager Object GroupIn vRealize Operations Manager, you use alerts on a group to review the summary alert information forhosts and virtual machine descendant objects so that you can see how the state of one object type can affectthe state of the other.
As a network operations center engineer, you are responsible for monitoring a group of hosts and virtualmachines for the sales department. As part of your daily tasks, you check the state of the objects in the groupto determine if there are any immediate problems or any upcoming problems based on generated alerts. Todo this you start with your group of objects, particularly the host systems in the group, and review theinformation in the Summary tab.
In this example, the group includes the following object alerts.
n Host has memory contention caused by a few virtual machines is a Health alert
n Virtual Machine has chronic high memory workload is a Risk alert
n Virtual Machine is demanding more CPU than the configured limit is a Risk alert
n Virtual Machine has large disk snapshots is an Efficiency alert
The following method of evaluating alerts on the Summary tab is provided as an example for usingvRealize Operations Manager and is not definitive. Your troubleshooting skills and your knowledge of theparticulars of your environment determine which methods work for you.
vRealize Operations Manager User Guide
36 VMware, Inc.
Prerequisites
n Create a group that includes virtual machines and the hosts on which they run. For example, Sales DeptVMs and Hosts. For an example of how to create a similar group, see vRealize Operations ManagerCustomization and Administration Guide.
n Review how the Summary tab works with object groups and related hierarchies. See “Evaluating ObjectInformation Using Badge Alerts and the Summary Tab,” on page 35.
Procedure
1 In the menu, click Environment .
2 Click the Custom Groups tab and click, for example, your Sales Dept VMs and Hosts group.
3 To view the alerts for a host and the associated child virtual machines, in the left pane, click, forexample, Host System and click the host name in the lower left pane.
The Summary tab displays the Health, Risk, and Efficiency badges, the top alerts for the host. (Becausethe group is still the focus, the alerts for the child virtual machines do not appear in the Top Alerts forDescendants widgets at the Badge Alerts tab.)
4 To view the Summary tab for the host so that you can also work with the child virtual machines, clickthe right arrow to the right of the host name in the lower left pane.
5 Select the vSphere Hosts and Clusters, located in the upper part of the left pane.
To work with alerts for child virtual machines, the host in the vSphere Hosts and Clusters hierarchymust be the focus of the Summary tab rather than the host as member of the object group.
6 To view the alert details for an alert in the list, click the alert name.
When multiple objects are affected, and you click the alert link to view the details, the Health Issuesdialog box appears. If there is only one object affected, the Alerts tab for the object is displayed.
7 On the Alerts tab, begin evaluating the recommendations and triggered symptoms.
In this scenario, a recommendation for this generated alert is to move some virtual machines with highmemory workload from this host to a host with more available memory.
8 To return to the object Summary tab so that you can review alerts for any child virtual machines, clickthe back button located in the left pane.
The host is again the focus of the object Summary tab. Generated alerts for the child virtual machinesappear below.
9 Click on each virtual machine alert and evaluate the information provided on the Alerts tab.
Virtual MachineAlert Evaluation
Virtual Machine haschronic high memoryworkload
The recommendation is to add more memory to this virtual machine.If one or more virtual machines are experiencing high workload, this situation is probablycontributing to the host memory contention alert. These virtual machines are candidates formoving to a host with more available memory. Moving the virtual machines can resolve thehost memory contention alert and the virtual machine alert.
Virtual Machine isdemanding moreCPU than theconfigured limit
The recommendations include increasing or removing the CPU limits on this virtualmachine.If one or more virtual machines are demanding more CPU than is configured, and the hostis experiencing memory contention, then you cannot add CPU resources to the virtualmachine without further stressing the host. These virtual machines are candidates formoving to a host with more available memory. Moving the virtual machines would allowyou to increase the CPU count and resolve the virtual machine alert, and might resolve thehost memory contention alert.
10 Based on your evaluation, take action based on the child virtual machine recommendations.
Chapter 1 Monitoring Objects in Your Managed Environment by Using vRealize Operations Manager
VMware, Inc. 37

After you take action, it will take a few collection cycles to determine if your actions resolved the virtualmachine and host alerts.
What to do next
After a few collection cycles, look again at your Sales VMs and Hosts group to determine if the alerts arecanceled and no longer appear in the object Summary tab. If the alerts are still present, see “User Scenario:Investigate the Root Cause of a Problem by Using the Troubleshooting Tab Options,” on page 53 for anexample troubleshooting workflow.
Investigating Object AlertsThe Alerts tab provides a list of generated alerts for the currently selected object. When you are workingwith objects, reviewing and responding to generated alerts on the Alert tab helps you manage problems inyour environment.
The alerts notify you when a problem occurs in your environment based on configured alert definitions.Object alerts are useful to you as an investigative tool in two ways. They can provide you with proactivenotification about problems in your environment before a user calls you to complain, and they provideinformation about the object that you can use when troubleshooting general or reported problems.
As you review the Alerts tab, you can add ancestors and descendants to the list to broaden your view of thealerts. You can see if alerts on the current object affect other objects or how the current object is affected bythe problems indicated by alerts on other objects.
Depending on the best practices and workflows of your infrastructure operations team, you can use theobject Alerts tab to manage generated alerts on individual objects.
n Take ownership of alerts so that your team knows that you are working to resolve the problem.
n Suspend an alert so that is temporarily excluded from affecting the Health, Risk, or Efficiency state ofthe object while you investigate the problem.
n Cancel alerts that you know are a result of a deliberate action, for example, a network card wasremoved from a host for replacement, or that are known issues that you cannot resolve at this timebecause of resource constraints. Canceling an alert that is generated because of only fault, messageevent, or metric event symptoms cancels the alert permanently. Canceling an alert that is generatedbecause of metric, super metric, or property symptoms can result in the alert being regenerated if theunderlying metric or property condition remains true. It is only effective to cancel alerts generatedbecause of fault, message event, or metric event symptoms.
Investigating and resolving alerts helps you provide the best possible environment to your customers.
User Scenario: Respond to Alerts on the Alerts Tab for Problem Virtual MachinesYou respond to alerts for objects so that you can bring the affected objects back to the required level ofconfiguration or performance. Based on the information in the alert and using other information provided invRealize Operations Manager, you evaluate the alert, identify the most likely solution, and resolve theproblem.
As a virtual infrastructure administrator or operations manager, you troubleshoot problems with objects.Reviewing and responding to the generated alerts for objects is part of any troubleshooting process. In thisexample, you want to resolve workload problems for a virtual machine. As part of that process, you reviewthe Alerts tab to determine what alerts might indicate or contribute to the identified problem.
The problem virtual machine is db-01-kyoto, which you use as a database server.
The following method of responding to alerts is provided as an example for usingvRealize Operations Manager and is not definitive. Your troubleshooting skills and your knowledge of theparticulars of your environment determine which methods work for you.
vRealize Operations Manager User Guide
38 VMware, Inc.

Prerequisites
n Verify that the vCenter Adapter has been configured for the actions in each vCenter Server instance.
n Verify that you understand how to use the Power Off Allowed option if you are running Set CPUCount, Set Memory, and Set CPU Count and Memory actions. See the section on Working With ActionsThat Use Power Off Allowed in the vRealize Operations Manager Information Center.
Procedure
1 Enter the name of the object, db-01-kyoto, in the Search text box and select the virtual machine in thelist.
The object Summary tab appears. The Top Alerts panes display important active alerts for the object.
2 Click the Analysis tab.
The Workload tab is the first tab. This badge indicates that the workload is highest by CPU, butmemory is also above the configured limit.
3 Click the Alerts tab.
In this example, the alert list includes the follow alerts that might be related to the problem you areinvestigating.
n Virtual machine has unexpected high CPU workload.
n Virtual machine has unexpected high memory workload.
4 In the upper left pane, select the vSphere Hosts and Clusters related hierarchy and select ancestor ordescendant alerts to add to the list.
You want to check for possible alerts on ancestor or descendant objects in the context of the selectedhierarchy.
a On the toolbar, click Show Ancestor Alerts and select the Host System and Resource Pool checkboxes.
Any alerts for the host system or resource pool related to this virtual machine are added to the list.
b Click Show Descendant Alerts and select Datastore.
Any alerts for the datastore are added to the list.
In this example, there are no additional alerts for the host, resource pool, or datastore, so you beginaddressing the virtual machine alerts.
5 Click the Virtual machine has unexpected high CPU workload alert name.
The Alert Details Summary tab appears.
6 Review the recommendations to determine if one or more suggested recommendations can fix theproblem.
This example includes the following common recommendations:
n Check the guest applications to determine whether high CPU workload is expected behavior.
n Add more CPU capacity for this virtual machine.
7 To follow the Check the guest applications to determine whether high CPU workload is expectedbehavior recommendation, click Actions on the title bar and select Open Virtual Machine in vSphereClient.
The vSphere Web Client Summary tab appears so that you can open the virtual machine in the consoleand check which applications are are contributing to the reported high CPU workload.
Chapter 1 Monitoring Objects in Your Managed Environment by Using vRealize Operations Manager
VMware, Inc. 39
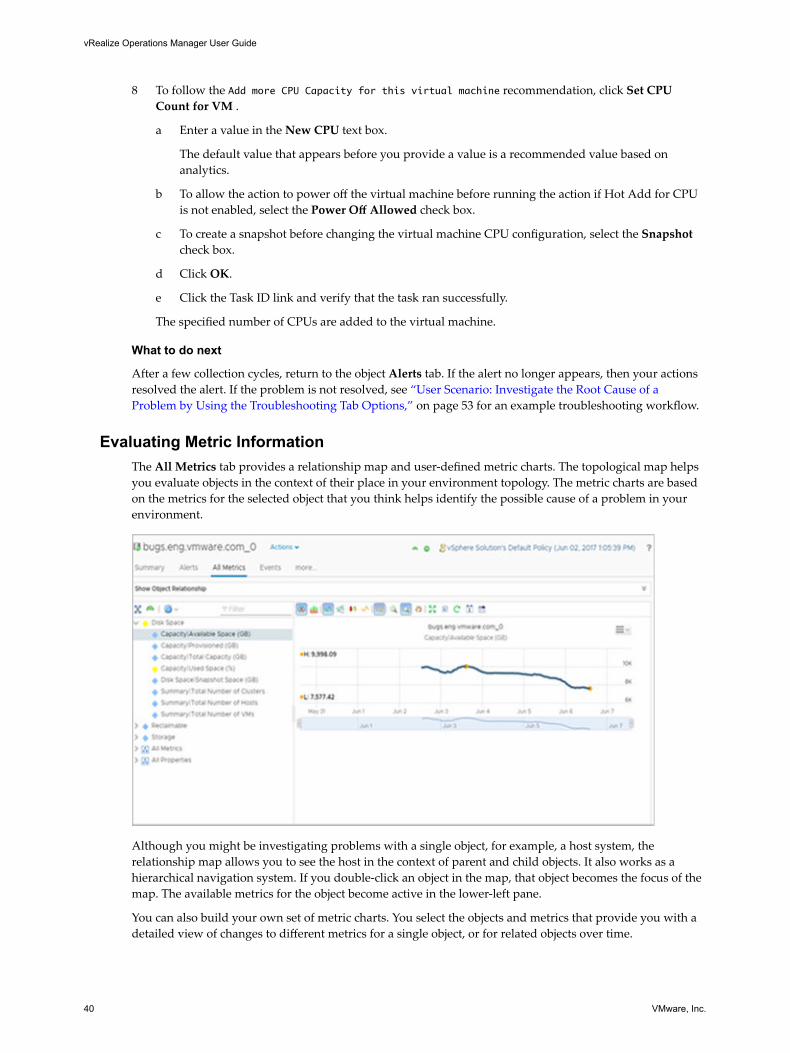
8 To follow the Add more CPU Capacity for this virtual machine recommendation, click Set CPUCount for VM .
a Enter a value in the New CPU text box.
The default value that appears before you provide a value is a recommended value based onanalytics.
b To allow the action to power off the virtual machine before running the action if Hot Add for CPUis not enabled, select the Power Off Allowed check box.
c To create a snapshot before changing the virtual machine CPU configuration, select the Snapshotcheck box.
d Click OK.
e Click the Task ID link and verify that the task ran successfully.
The specified number of CPUs are added to the virtual machine.
What to do next
After a few collection cycles, return to the object Alerts tab. If the alert no longer appears, then your actionsresolved the alert. If the problem is not resolved, see “User Scenario: Investigate the Root Cause of aProblem by Using the Troubleshooting Tab Options,” on page 53 for an example troubleshooting workflow.
Evaluating Metric InformationThe All Metrics tab provides a relationship map and user-defined metric charts. The topological map helpsyou evaluate objects in the context of their place in your environment topology. The metric charts are basedon the metrics for the selected object that you think helps identify the possible cause of a problem in yourenvironment.
Although you might be investigating problems with a single object, for example, a host system, therelationship map allows you to see the host in the context of parent and child objects. It also works as ahierarchical navigation system. If you double-click an object in the map, that object becomes the focus of themap. The available metrics for the object become active in the lower-left pane.
You can also build your own set of metric charts. You select the objects and metrics that provide you with adetailed view of changes to different metrics for a single object, or for related objects over time.
vRealize Operations Manager User Guide
40 VMware, Inc.

Where available, the All Metrics tab provides pre-defined sets of metrics to help you when looking at aspecific aspect of an object. For example, if you have a problem with a host, access the most relevantinformation about the host by looking at the metrics displayed in the pre-defined lists. You can edit thesegroups of metrics, and create additional groups, by dragging and dropping metrics and properties from theAll Metrics and All Properties lists.
For more information about the metrics, refer to the Definitions for Metrics, Properties, and Alerts Guide.
Where You Find the All Metrics Tabn In the menu, click Environment, then select a group, custom data center, application, or inventory
object.
n Alternatively, click Environment, then use the hierarchies in the left pane to quickly drill down to theobjects that you want.
Create Metric Charts When You Troubleshoot a Virtual Machine ProblemYou create a custom group of metric charts when you troubleshoot a problem with a virtual machine so thatyou can compare different metrics. The level of detail that you can create using the All Metrics tab, cancontribute significantly to your effort to find the root cause of a problem.
As an administrator investigating a performance problem with a virtual machine, you determined that youmust see detailed charts about the following reported symptoms.
n Guest file system overall disk space usage reaching critical limit
n Guest partition disk space usage
The following method of evaluating problems using the All Metrics tab is provided as an example for usingvRealize Operations Manager and is not definitive. Your troubleshooting skills and your knowledge of theparticulars of your environment determine which methods work for you.
Procedure
1 Enter the name of the virtual machine in the Search text box on the menu bar.
In this example, the virtual machine name is sales-10-dk.
2 Click the All Metrics tab.
3 In the relationship topology map, click the virtual machine, dk-new-10.
The metrics list, located in the left of the center pane, displays virtual machine metrics.
4 On the chart toolbar, click Date Control and select a time that is on or before the symptoms weretriggered.
5 Add metric charts to the display area for the virtual machine.
a In the metric list, select Guest Files System Stats > Total Guest File System Free (GB) and double-click the metric name.
b To add the guest partition, for example, C:\, select Guest Files System Stats > C:\ > Guest FileSystem Free (GB) and double-click the metric name.
c To add disk space for comparison, select Disk Space > Capacity Remaining (%) and double-clickthe metric name.
6 Compare the charts.
You can see a decrease in the file system free space, and that the virtual machine disk space capacityremaining is decreasing at a steady rate. You determine that you must add disk space to the virtualmachine. However, you do not know if the datastore can support the change to the virtual machine.
Chapter 1 Monitoring Objects in Your Managed Environment by Using vRealize Operations Manager
VMware, Inc. 41

7 Add the datastore capacity chart to the charts.
a In the topology map, double-click the host.
The topology map refreshes with the host as the focus object.
b Click the datastore.
c In the metric list, which is updated to display datastore metrics, select Capacity > Available Space(GB) and double-click the metric name.
8 To determine if sufficient capacity is available on the datastore to support increasing the disk space onthe virtual machine, review the datastore capacity chart.
You know that you must increase the size of the virtual disk on the virtual machine.
What to do next
Expand the virtual disk on the virtual machine and assign it to stressed partitions. Click Actions, on theobject title bar, and view the virtual machine in the vSphere Web Client.
Host-Related MetricsvRealize Operations Manager provides groups of metrics for selected hosts. Each group displays the mostrelevant metrics for the host to help you monitor your environment.
To display metric groups, select a host in the Environment Overview, and then select the All Metrics tab.
vRealize Operations Manager User Guide
42 VMware, Inc.
To display the metrics contained within a group, click the plus sign next to the group. You can double-click agroup to populate the chart window with a separate chart for each of the metrics in the group. In thescreenshot above, the metrics of the memory group populate the chart window.
Table 1‑1. CPU Metric Group
Metric Description
CPU|CPU contention (%) This metric shows the percentage of time the VMs in theESXi hosts are unable to run because they are contendingfor access to the physical CPUs. The number shown is theaverage number for all VMs. The number will be lowerthan the highest number experienced by the VM that ismost impacted by CPU contention.Use this metric to verify if the host can serve all its VMsefficiently. Low contention means that the VM can accesseverything it demands to run smoothly. It means that theinfrastructure is providing good service to the applicationteam.When using this metric, ensure that the number is withinyour expectation. Look at both the relative number and theabsolute number. Relative means a drastic change in value,meaning that the ESXi is unable to serve the VMs. Absolutemeans that the real value itself is high. Investigate why thenumber is high. One factor that impacts this metric is CPUPower Management. If CPU Power Management clocksdown the CPU speed from 3 GHz to 2 GHz, the reductionin speed is accounted for because it shows that the VM isnot running at full speed.This metric is calculated in the following way:cpu|capacity_contention / (200 * summary|number_running_vcpus)
CPU|Demand (%) This metric shows the amount of CPU resources a VMwould use if there were no CPU contention or CPU limit.This metric represents the average active CPU load for thepast five minutes.Keep this number below 100% if you set the powermanagement to maximum.This metric is calculated in the following way:( cpu.demandmhz /cpu.capacity_provisioned)*100 .
Chapter 1 Monitoring Objects in Your Managed Environment by Using vRealize Operations Manager
VMware, Inc. 43

Table 1‑1. CPU Metric Group (Continued)
Metric Description
Summary|Number of running VMs This metric shows the number of running VMs at a givenpoint in time. The data is sampled every five minutes.A large number of running VMs might be a reason for CPUor memory spikes because more resources are used in thehost. The number of running VMs gives you a goodindicator of how many requests the ESXi host must juggle.Powered off VMs are not included because they do notimpact ESXi performance. A change in the number ofrunning VMs can contribute to performance problems. Ahigh number of running VMs in a host also means a higherconcentration risk, because all the VMs will fail if the ESXicrashes.Use this metric to look for a correlation between spikes inthe running VMs and spikes in other metrics such as CPUcontention, or memory contention.
Summary|Number of vMotions This metric shows the number of times a live migration(vMotion) with no VM downtime or service disruptiontook place in a host in the last (x) minutes.The number of vMotions is a good indicator of stability. Ina healthy environment, this number is stable and relativelylow.When using this metric, look for a correlation betweenvMotions and spikes in other metrics such as CPUcontention and memory contention. Although the vMotionshould not create any spikes, it is highly likely that somespikes in memory usage contention, and CPU demand andcontention are experienced.
vRealize Operations Manager User Guide
44 VMware, Inc.

Table 1‑2. Memory Metric Group
Metric Description
Memory|Balloon (KB) This metric shows the total amount of memory currentlyused by the VM memory control.Use this metric to monitor how much VM memory theESXi has reclaimed through memory ballooning.The presence of ballooning indicates that the ESXi has beenunder memory pressure. ESXi activates ballooning whenits consumed memory reaches a specific threshold. Forexample, in vRealize Operations Manager 6.0, thethreshold is >98%.When using this metric, verify if the size of the ballooningis increasing. An increase in ballooning indicates that thelack of memory is not a one time occurrence, and that thememory shortage is worsening. Look for memoryfluctuations which indicate that the VM required theballooned out page. If the VM requests a ballooned outpage, this translates into a memory performance problemfor the VM because the page has to be returned from thedisk.When the balloon target value is greater than the valueshown by the metric, it means that there is more availablememory that can be reclaimed.
Memory|Contention (%) This metric shows the percentage of time VMs are waitingto access swapped memory.Use this metric to monitor ESXi memory swapping. A highvalue indicates that the ESXi is running low on memory,and a large amount of memory is being swapped.
Memory|Usage (%) This metric shows the amount of physical memory activelyused. The memory usage is displayed as a percentage ofthe total configured or available memory. This metric mapsto the Consumed counter in vCenter.When the metric displays a high value, it indicates that theESXi is using a large percentage of available memory.Check other memory-related metrics to see if the ESXirequires more memory.
Table 1‑3. Network Metric Group
Metric Description
Network I/O | Aggregate of all instances | Packet Dropped(%)
This metric shows the percentage of received andtransmitted packets dropped in the collection interval.Use this metric to monitor the reliability and performanceof the ESXi network. A high value indicates that thenetwork is not reliable and performance decreases.
Network I/O | Aggregate of all instances | Packet Receivedper second
This metric shows the number of packets received in thecollection interval.Use this metric to monitor the network usage of the ESXi.
Network I/O | Aggregate of all instances | PacketTransmitted per second
This metric shows the number of packets transmittedduring the collection interval.Use this metric to monitor the network usage of the ESXi.
Chapter 1 Monitoring Objects in Your Managed Environment by Using vRealize Operations Manager
VMware, Inc. 45

Table 1‑4. Storage Metric Group
Metric Description
Datastore I/O|Average observed virtual machine disk I/Oworkload
Storage adapter|Aggregate of all instances|Read latency(ms)
This metric shows the average amount of time required fora read operation by all the storage adapters.Use this metric to monitor the read operation of the storageadapter. A high value indicates that the ESXi isexperiencing storage read operation slowness.The total latency is the sum of kernel latency and devicelatency.
Storage adapter|Aggregate of all instances|Write latency(ms)
This metric shows the average amount of time required fora write operation by all the storage adapters.Use this metric to monitor the write operation performanceof the storage adapter. A high value indicates that the ESXiis experiencing storage write operation slowness.The total latency is the sum of the kernel latency anddevice latency.
Analyzing the Resources in Your EnvironmentIn addition to monitoring, vRealize Operations Manager provides you with powerful tools for analyzing theresources and the performance of your virtual environment.
You can use the Analysis tab to analyze the current condition of your virtual environment.
Using Troubleshooting Tools to Resolve ProblemsThe data provided in the Alerts, Symptoms, Timeline, Events, and All Metrics tabs help you identify theroot cause of a complex problem.
You can use the troubleshooting tabs individually or as part of a workflow to resolve problems. Each of thetabs displays the collected data in a different way. Sometimes, as you are troubleshooting problems, youmove directly from an analysis tab to the All Metrics tab. Under other circumstances, the Timeline tabmight provide the information that you need.
Symptoms Tab OverviewYou can view a list of triggered symptoms for the selected object. You use the symptoms when you aretroubleshooting problems with an object.
The Symptoms tab displays all the triggered symptoms for the currently selected object. A review of thetriggered symptoms provides you with a list of the problems that the currently selected object isexperiencing. If you need to better understand which symptoms are associated with currently generatedalerts, go to the Alerts tab for the object.
As you evaluate the triggered symptoms, consider the time at which they were created and theconfiguration information and trend charts, where applicable.
vRealize Operations Manager User Guide
46 VMware, Inc.
Timeline Tab OverviewThe timeline provides a view of the triggered symptoms, generated alerts, and events for an object over aperiod of time. You use the timeline to identify common trends over time that are contributing to the currentstatus of objects in your environment.
The timeline provides a three-tier scrolling mechanism that you can use to move quickly through largespans of time, or slowly and minutely through individual hours when you are focusing on a particularperiod of time. To ensure that you have the data that you need, configure the Date Controls to encompassthe problem you are investigating.
It is not always effective to investigate a problem on an individual object by looking only at the object. Usethe parent, children, and peer options to examine the object in a broader environmental context. This contextoften reveals unexpected influences or consequences for the problem.
The timeline is a tool that provides you a graphical view of patterns. If a symptom is triggered and canceledby the system at various intervals over time, you can compare the event to other changes to the object or tothe related objects. These changes might be the root cause of the problem.
Events Tab OverviewEvents are changes in vRealize Operations Manager metrics that reflect changes that occurred on managedobjects because of user actions, system actions, triggered symptoms, or generated alerts on an object. Youuse the Events tab to compare the occurrence of events with the generated alerts to determine if a change onyour managed object contributed to the root cause of the alert or other problems with the object.
Events can occur on any object, not just the one listed.
The following vCenter Server activities are some of the activities that generate vRealize Operations Managerevents:
n Powering a virtual machine on or off
n Creating a virtual machine
n Installing VMware Tools on the guest OS of a virtual machine
n Adding a newly configured ESX/ESXi system to a vCenter Server system
Depending on alert definitions, these events might generate alerts.
If you monitor the same virtual machines with other applications that provide information tovRealize Operations Manager, and the adapters for those applications are configured to provide changeevents, the Events tab includes certain change events that occur on the monitored objects. These changeevents might provide further insight into the cause of problems that you are investigating.
Creating and Using Object DetailsThe views and heat map details provide you with specific data about the object. You use this information toevaluate problems in more detail. If the current views or heat maps do not provide the information that youneed, you can create one to use as tool as you investigate your specific problem.
Chapter 1 Monitoring Objects in Your Managed Environment by Using vRealize Operations Manager
VMware, Inc. 47
Working with Heat MapsWith the vRealize Operations Manager heat map feature, you can locate trouble areas based on the metricvalues for objects in your virtual infrastructure. vRealize Operations Manager uses analytics algorithms thatyou can use to compare the performance of objects across the virtual infrastructure in real time using heatmaps.
You can use predefined heat maps or create your own custom heat maps to compare the metric values ofobjects in your virtual environment. vRealize Operations Manager has predefined heat maps on the Detailstab that you can use to compare commonly used metrics. You can use this data to plan to reduce waste andincrease capacity in the virtual infrastructure.
What a Heat Map Shows
A heat map contains rectangles of different sizes and colors, and each rectangle represents an object in yourvirtual environment. The color of the rectangle represents the value of one metric, and the size of therectangle represents the value of another metric. For example, one heat map shows the total memory andpercentage of memory use for each virtual machine. Larger rectangles are virtual machines with more totalmemory, green indicates low memory use, and red indicates high use.
vRealize Operations Manager updates the heat maps in real time as new values are collected for each objectand metric. The colored bar below the heat map is the legend. The legend identifies the values that theendpoints represent and the midpoint of the color range.
Heat map objects are grouped by parent. For example, a heat map that shows virtual machine performance,groups the virtual machines by the ESX hosts on which they run.
Create a Custom Heat Map
You can define an unlimited number of custom heat maps to analyze exactly the metrics that you need.
Procedure
1 In the menu, click Environment.
2 Select an object to inspect from an inventory tree.
3 Click the Heat Maps tab under the Details tab.
4 Select the tag to use for first-level grouping of the objects from the Group By drop-down menu.
If a selected object does not have a value for this tag, it appears in a group called Other Groups.
5 Select the tag to use to separate the objects into subgroups from the Then By drop-down menu.
If a selected object does not have a value for this tag, it appears in a subgroup called Other Groups.
6 Select a Mode option.
Option Description
Instance Track all instances of a metric for an object with a separate rectangle foreach metric.
General Pick an specific instance of a metric for each object and track only thatmetric.
7 If you selected General mode, select the attribute to use to set the size of the rectangle for each resource
in the Size By list and the attribute to use to determine the color of the rectangle for each object in theColor By list.
Objects that have higher values for the Size By attribute have larger areas in the heat map display. Youcan also select fixed-size rectangles. The color varies between the colors you set based on the value ofthe Color By attribute.
vRealize Operations Manager User Guide
48 VMware, Inc.
In most cases, the attribute lists include only metrics that vRealize Operations Manager generates. Ifyou select an object type, the list shows all of the attributes that are defined for that object type.
a To track metrics only for objects of a particular kind, select the object type from the Object Typedrop-down menu.
8 If you selected Instance mode, select an attribute kind from the Attribute Kind list.
The attribute kind determines the color of the rectangle for each object.
9 Configure colors for the heat map.
a Click each of the small blocks under the color bar to set the color for low, middle, and high values.
The bar shows the color range for intermediate values. You can also set the values to match thehigh and low end of the color range.
b (Optional) Enter minimum and maximum color values in the Min Value and Max Value text boxes.
If you leave the text boxes blank, vRealize Operations Manager maps the highest and lowest valuesfor the Color By metric to the end colors. If you set a minimum or maximum value, any metric at orbeyond that value appears in the end color.
10 Click Save to save the configuration.
The custom heat map you created appears in the list of heat maps on the Heat Maps tab.
Find the Best or Worst Performing Objects for a Metric
You can use heat maps to find the objects with the highest or lowest values for a particular metric.
Prerequisites
If the combination of metrics that you want to compare is not available in the list of defined heat maps, youmust define a custom heat map first. See “Create a Custom Heat Map,” on page 48.
Procedure
1 In the menu, click Environment and select an object from an inventory tree.
2 Click the Heat Maps tab under the Details tab.
All metric heat maps related to the selected resource appear in the list of predefined heat maps.
3 In the list of heat maps, click the map to view.
The name and metrics values for each object shown on the heat map appear in the list below the heatmap.
4 Click the column header for the metric you are interested in to change the sort order, so that the best orworst performing objects appear at the top of the column.
Compare Available Resources to Balance the Load Across the Infrastructure
A heat map can be used to compare the performance of selected metrics across the virtual infrastructure.You can use this information to balance the load across ESX hosts and virtual machines.
Prerequisites
If the combination of metrics to compare is not available in the list of defined heat maps, you must define acustom heat map first. See “Create a Custom Heat Map,” on page 48.
Procedure
1 In the menu, click Environment.
2 Select an object to inspect from an inventory tree.
Chapter 1 Monitoring Objects in Your Managed Environment by Using vRealize Operations Manager
VMware, Inc. 49

3 Click the Heat Maps tab under the Details tab.
4 In the list of heat maps, click the one to view.
The heat map of the selected metrics appears, sized and grouped according to your selection.
5 Use the heat map to compare objects and click resources and metric values for all objects in your virtualenvironment.
The list of names and metric values for all objects shown on the heat map appear in the list below theheat map. You can click column headers to sort the list by column. If you sort the list by a metriccolumn, you can see the highest or lowest values for that metric on top.
6 (Optional) To see more information about an object in the heat map, click the rectangle that representsthis object or click the pop-up window for more details.
What to do next
Based on your findings, you can reorganize the objects in your virtual environment to balance the loadbetween ESX hosts, clusters or datastores.
Using Heat Maps to Analyze Data for Capacity Risk
Planning for capacity risk involves analyzing data to determine how much capacity is available and whetheryou make efficient use of the infrastructure.
Identify Clusters That Have Enough Space for Virtual Machines
Identify the clusters in a datacenter that have enough space for your next set of virtual machines.
Procedure
1 In the left pane of vRealize Operations Manager, click Environment.
2 Select vSphere World.
3 Click the Heat Map tab under the Details tab.
4 Select the Which clusters have the most free capacity and least stress? heat map.
5 In the heat map, point to each cluster area to view the percentage of remaining capacity.
A color other than green indicates a potential problem.
6 Click Details in the pop-up window to examine the resources for the cluster or datacenter.
What to do next
Identify the green clusters with the most capacity to store virtual machines.
Examine Abnormal Host Health
Identifying the source of a performance problem with a host involves examining its workload.
Procedure
1 In the left pane of vRealize Operations Manager, click Environment.
2 Select vSphere World.
3 Click the Heat Map tab under the Details tab.
4 Select the Which hosts currently have the most abnormal workload? heat map.
5 In the heat map, point to the cluster area to view the percentage of remaining capacity.
A color other than green indicates a potential problem.
6 Click Details for the ESX host in the pop-up window to examine the resources for the host.
vRealize Operations Manager User Guide
50 VMware, Inc.

What to do next
Adjust workloads to balance resources as necessary.
Identify Datastores with Enough Space for Virtual Machines
Identify the datastores that have the most space for your next set of virtual machines.
Procedure
1 In the left pane of vRealize Operations Manager, click Environment.
2 Select vSphere World.
3 Click the Heat Map tab under the Details tab.
4 Select the Which datastores have the highest disk space overcommitment and the lowest timeremaining? heat map.
5 In the heat map, point to each datacenter area to view the space statistics.
6 If a color other than green indicates a potential problem, click Details in the pop-up window toinvestigate the disk space and disk I/O resources.
What to do next
Identify the datastores with the largest amount of available space for virtual machines.
Identify Datastores with Wasted Space
To improve the efficiency of your virtual infrastructure, identify datastores with the highest amount ofwasted space that you can reclaim .
Procedure
1 In the left pane of vRealize Operations Manager, click Environment.
2 Select vSphere World.
3 Click the Heat Map tab under the Details tab.
4 Select the Which datastores have the most wasted space and total space storage? heat map.
5 In the heat map, point to each datacenter area to view the waste statistics.
6 If a color other than green indicates a potential problem, click Details in the pop-up window toinvestigate the disk space and disk I/O resources.
What to do next
Identify the red, orange, or yellow datastores with the highest amount of wasted space.
Identify the Virtual Machines with Resource Waste Across Datastores
Identify the virtual machines that waste resources because of idle, oversized, or powered-off virtual machinestates or because of snapshots.
Procedure
1 In the left pane of vRealize Operations Manager, click Environment.
2 Select vSphere World.
3 Click the Heat Map tab under the Details tab.
4 Select the For each datastore, which VMs have the most wasted disk space? heat map.
5 In the heat map, point to each virtual machine to view the waste statistics.
Chapter 1 Monitoring Objects in Your Managed Environment by Using vRealize Operations Manager
VMware, Inc. 51
6 If a color other than green indicates a potential problem, click Details for the virtual machine in thepop-up window and investigate the disk space and I/O resources.
What to do next
Identify the red, orange, or yellow virtual machines with the highest amount of wasted space.
Examining Relationships in Your EnvironmentMost objects in an environment are related to other objects in that environment. The Environment tab showshow objects in your environment are related. You use this display to troubleshoot problems that might notbe about the object that you originally chose to examine. For example, a problem alert on a host might bebecause a virtual machine related to the host lacks capacity.
Environment Tab SelectionsWhen you select an object from the inventory of your environment, you can display the related objects in anoverview, list, or map.
n The Overview shows all the objects in your environment with a status badge for each object. By clickinga badge, you can see which objects are related.
n The List shows only the objects related to your object selection. Depending on the object selected, youcan initiate an action or launch an external application.
n The Map shows the objects as icons in a hierarchical display. You select an icon to display the number ofrelated objects.
Use the Overview to identify objects in your environment with health, risk, or efficiency problems.Depending on the object type, you might be able to take action on the object from the List view.
Use the Environment Overview to Find ProblemsIf you are system administrator who is trying to investigate the reason for slow performance in yourenvironment, you can select key objects such as host systems to see if any related objects such as virtualmachines indicate problems.
Procedure
1 In the menu, click Environment, then click vSphere Hosts and Clusters in the left pane and select thevSphere World object.
2 Select the Environment tab.
The system displays health badges for all objects in the vSphere World.
3 Click each of the host system badges.
The health badge of the virtual machines that belong to the host are highlighted. A host that displays agood health badge, may have virtual machines that display a warning status.
What to do next
Investigate the reason for the problem. For example, once you determine if the problem is chronic ortemporary, you can decide how to address it. See “Using Troubleshooting Tools to Resolve Problems,” onpage 46.
vRealize Operations Manager User Guide
52 VMware, Inc.
User Scenario: Investigate the Root Cause of a Problem by Using theTroubleshooting Tab Options
One of your customers reports poor performance for his virtual machine, including slowness and fails. Thisscenario provides one way that you can use vRealize Operations Manager to investigate the problem basedon information available in the Troubleshooting tabs.
As a virtual infrastructure administrator, you respond to a help ticket in which one of your customersreports problems with his virtual machine, sales-10-dk. The reported conditions are poor applicationperformance, including slow load times and slow boot, some of his programs are taking longer and longerto load, and his files are taking longer to save. Today his programs started to fail and an update failed toinstall.
When you look at the Alerts tab for the virtual machine you see an alert for chronic high memory workloadleading to memory stress, where the triggered symptoms indicate memory stress and the recommendationis to add memory.
Based on past experience, you are not convinced that this alert indicates the root cause, so you review theAnalysis tabs. All of the associated badges are green except for Capacity Remaining, which indicatesmemory and disk space problems, and Time Remaining, which has 0 days remaining for memory and diskspace.
From this initial review, you know that problems exist in addition to the memory alert, so you use theEvents tabs to do a more thorough investigation.
Review the Triggered Symptoms When You Troubleshoot a Virtual MachineProblemAs a virtual infrastructure administrator, you respond to customer complaints and alerts, and identifyproblems that occur on the objects in your environment. You use the information on the Symptoms tab tohelp determine whether the triggered symptoms indicate conditions that contribute to the reported oridentified problem.
You must research a problem of poor performance on one of your virtual machines, as reported by one ofyour customers. When you view the Alerts tab for the virtual machine, the only alert that appears is namedVirtual Machine is Violating Risk Profile 1 in vSphere Hardening Guide.
When you reviewed the Analysis tabs for the virtual machine, you identified that problems were occurringwith memory and disk space. Now, you focus your attention to the triggered symptoms on the virtualmachine.
The following method of using the Symptoms tab to evaluate problems is provided as an example for usingvRealize Operations Manager, and is not definitive. Your troubleshooting skills and your knowledge of theparticular aspects of your environment determine which methods work for you.
Procedure
1 In the menu, click Dashboards, then click Troubleshoot a VM in the left pane, .
2 Search for a virtual machine to troubleshoot.
In this example, the virtual machine name is named sales-10-dk.
3 With the virtual machine selected, click the Alerts tab, and click the Symptoms tab.
Chapter 1 Monitoring Objects in Your Managed Environment by Using vRealize Operations Manager
VMware, Inc. 53
4 Review and evaluate the triggered symptoms.
Option Evaluation Process
Symptom Are any of the triggered symptoms related to the critical states you see for memory or disk space?
Status Are the symptoms active or inactive? Even inactive symptoms can provide information about the paststate of the object. To add any inactive symptoms, click Status: Active on the toolbar to remove thefilter.
Created On When did the symptoms trigger? How does the time of the triggered symptom compare with theother symptoms?
Information Can you identify a correlation between the triggered symptoms and the state of the Time Remainingand Capacity Remaining badges?
From your review, you determine that some of the triggered symptoms are associated with compliancealerts for the virtual machine as defined in the vSphere Hardening Guide. The violated symptoms triggered forthe alert named vSphere Hardening Guide, which is one of several compliance risk profiles provided withvRealize Operations Manager.
The following symptoms triggered in the compliance alert named Virtual Machine is Violating RiskProfile 1 in vSphere Hardening Guide:
n Independent nonpersistent disks are being used
n Autologon feature is enabled
n Copy/paste operations are enabled
n Users and processes without privileges can remove, connect and modify devices
n Guests can receive host information
Other symptoms also triggered, which are related to memory and time remaining.
n Guest file system overall disk space usage reaching critical limit
n Virtual machine disk space time remaining is low
n Virtual machine CPU time remaining is low
n Guest partition disk space usage
n Virtual machine memory time remaining is low
What to do next
Review the symptoms for the object on a timeline. See “Compare Symptoms on a Timeline When YouTroubleshoot a Virtual Machine Problem,” on page 54.
You can find the vSphere Hardening Guides at http://www.vmware.com/security/hardening-guides.html.
Compare Symptoms on a Timeline When You Troubleshoot a Virtual MachineProblemLooking at the triggered symptoms for an object over time enables you to compare triggered symptoms,alerts, and events when you are troubleshooting problems with objects in your environment. The Timelinetab in vRealize Operations Manager provides a visual chart on which to see triggered symptoms that youcan use to investigate problems in your environment.
After you identify the following symptoms as possible indicators of the root cause of the reportedperformance problems on the sales-10-dk virtual machine, you compare them to each other over time. Lookfor unusual or common patterns.
n Guest file system overall disk space use reaching critical limit
n Virtual machine disk space time remaining low
vRealize Operations Manager User Guide
54 VMware, Inc.
n Virtual machine CPU time remaining low
n Guest partition disk space use
n Virtual machine memory time remaining is low
The following method of evaluating problems using the Timeline tab is provided as an example for usingvRealize Operations Manager and only one method. Your troubleshooting skills and your knowledge of thespecifics of your environment determine which methods work for you.
Prerequisites
Review the triggered object symptoms. See “Review the Triggered Symptoms When You Troubleshoot aVirtual Machine Problem,” on page 53.
Procedure
1 Enter the name of the virtual machine in the Search text box on the main title bar.
In this example, the virtual machine name is sales-10-dk.
2 Click the Events tab and click the Timeline tab.
3 On the Timeline toolbar, click Date Controls and select a time that is on or before the referencesymptoms were triggered.
The default time range is the last 6 hours. For a broader view of the virtual machine over time,configure a range that includes triggered symptoms and generated alerts.
4 To view the point at which the symptoms were triggered and to identify which line represents whichsymptom, drag the timeline week, day, or hour section left and right across the page.
5 Click Event Filters and select all the event types.
Consider whether events correspond to triggered symptoms or generated alerts.
6 In the Related Hierarchies list in the upper left pane, click vSphere Hosts and Clusters.
The available ancestors and descendant objects depend on the selected hierarchy.
7 To see if the host is experiencing a contributing problems, click View From and select Host Systemunder Parent.
Consider whether the host has symptoms, alerts, or events that provide you with more informationabout memory or disk space problems.
Comparing virtual machine symptoms to host symptoms, and looking at the symptoms over time indicatesthe following trends:
n The host resource use, host disk use, and host CPU use symptoms are triggered for about 10 minutesapproximately every 4 hours.
n The virtual machine guest file system out of space symptom is triggered and canceled over time.Sometimes the symptom is active for an hour and canceled. Sometimes it is active for two hours. But nomore than 30 minutes occur between cancellation and the next triggering of the symptom.
What to do next
Look at events in the context of the analysis badges and alerts. See “Identify Influential Events When YouTroubleshoot a Virtual Machine Problem,” on page 56.
Chapter 1 Monitoring Objects in Your Managed Environment by Using vRealize Operations Manager
VMware, Inc. 55
Identify Influential Events When You Troubleshoot a Virtual Machine ProblemEvents are changes to objects in your environment that are based on changes to metrics, properties, orinformation about the object. Examining the events for the problematic virtual machine in the context of theanalysis badges and alerts might provide visual clues to the root cause of a problem.
As a virtual infrastructure administrator investigating a reported performance problem with a virtualmachine, you compared symptoms on the timeline and identified interesting behavior around the guest filesystem that you want to examine in the context of other badge metrics to determine if you can find the rootcause of the problem.
The following method of evaluating problems using the Events tab is provided as an example for usingvRealize Operations Manager and is not definitive. Your troubleshooting skills and your knowledge of theparticulars of your environment determine which methods work for you.
Prerequisites
Examine triggered symptoms, alerts, and events over time. See “Compare Symptoms on a Timeline WhenYou Troubleshoot a Virtual Machine Problem,” on page 54
Procedure
1 Enter the name of the virtual machine in the Search text box, located on the main title bar.
In this example, the virtual machine name is sales-10-dk.
2 Click the Events tab and select the Events button.
3 On the Events toolbar, click Date Controls and select a time that is on or before the symptoms weretriggered.
4 Click Event Filters and select all of the event types.
Consider whether any changes correspond to other events.
5 Click View From > Parent > > Select All and click through the badges in the timeline to review events.
Consider whether any of the events, which are listed in the data grid below the chart, correspond toproblems with the host that might contribute to the reported problem.
6 Click View From > Child > > Select All and click through the badges on the toolbar to review theevents.
Consider whether any of the events show problems with the datastore.
Your evaluation shows no particular correlation between the workload or anomalies and the time at whichthe guest file system out of space symptom was triggered each time.
Running Actions from vRealize Operations ManagerThe actions available in vRealize Operations Manager allow you to modify the state or configuration ofselected objects in vCenter Server from vRealize Operations Manager. For example, you might need tomodify the configuration of an object to address a problematic resource issue or to redistribute resources tooptimize your virtual infrastructure.
The most common use of the actions is to solve problems. You can run them as part of your troubleshootingprocedures or add them as a resolution recommendation for alerts.
When you grant a user access to actions in vRealize Operations Manager, that user can take the grantedaction on any object that vRealize Operations Manager manages, and not only on objects that the user canaccess outside of vRealize Operations Manager.
vRealize Operations Manager User Guide
56 VMware, Inc.
When you are troubleshooting problems, you can run the actions from the center pane Actions menu orfrom the toolbar on list views that contain the supported objects.
When an alert is triggered, and you determine that the recommended action is the most likely way toresolve the problem, you can run the action on one or more objects.
Run Actions From Toolbars in vRealize Operations ManagerWhen you run actions in vRealize Operations Manager, you change the state of vCenter Server objects. Yourun one or more actions when you encounter objects where the configuration or state of the object isaffecting your environment. These actions allow you to reclaim wasted space, adjust memory, or conserveresources.
This procedure for running actions is based on the vRealize Operations Manager Actions menus and iscommonly used when you are troubleshooting problems. The available actions depend on the type ofobjects with which you are working. You can also run actions as alert recommendations.
Prerequisites
n Verify that the vCenter Adapter is configured to run actions for each vCenter Server instance. See thevRealize Operations Manager Customization and Administration Guide.
n Ensure that you understand how to use the Power Off Allowed option if you are running Set CPUCount, Set Memory, and Set CPU Count and Memory actions. See the section Working With ActionsThat Use Power Off Allowed in the vRealize Operations Manager Information Center.
Procedure
1 Select the object in the Environment page inventory trees or select one or more objects it in a list view.
2 Click Actions on the main toolbar or in an embedded view.
3 Select one of the actions.
If you are working with a virtual machine, only the virtual machine is included in the dialog box. If youare working with clusters, hosts, or datastores, the dialog box that appears includes all objects.
4 Select the check box to run the action on the object, and click OK.
The action runs and a dialog box appears that displays the task ID.
5 To view the status of the job and verify that the job finished, click Recent Tasks or click OK to close thedialog box.
The Recent Tasks list appears, which includes the task you just started.
What to do next
To verify that the job completed, click Environment in the menu and click History >Recent Tasks. Find thetask name or task ID in the list and verify that the status is finished. See “Monitor Recent Task Status,” onpage 59.
Troubleshoot Actions in vRealize Operations ManagerIf you are missing data or cannot run actions from vRealize Operations Manager, review thetroubleshooting options.
Verify that your vCenter Adapter is configured to connect to the correct vCenter Server instances, andconfigured to run actions. See vRealize Operations Manager Customization and Administration Guide.
n Actions Do Not Appear on Object on page 58An action might not appear on an object, such as a host or virtual machine, because that object is beingmanaged by vRealize Automation.
Chapter 1 Monitoring Objects in Your Managed Environment by Using vRealize Operations Manager
VMware, Inc. 57

n Missing Column Data in Actions Dialog Boxes on page 58Data is missing for one or more objects in an Actions dialog box, making it difficult to determine if youwant to run the action.
n Missing Column Data in the Set Memory for VM Dialog Box on page 59The read-only data columns do not display the current values, which makes it difficult to properlyspecify a new memory value.
n Host Name Does Not Appear in Action Dialog Box on page 59When you run an action on a virtual machine, the host name is blank in the action dialog box.
Actions Do Not Appear on ObjectAn action might not appear on an object, such as a host or virtual machine, because that object is beingmanaged by vRealize Automation.
Problem
Actions such as Rebalance Container might not appear in the drop-down menu when you view the actionsfor your data center.
n If a data center is managed by vRealize Automation, actions do not appear.
n If a data center is not managed by vRealize Automation, you can take action on the virtual machinesthat are not being managed by vRealize Automation.
Cause
When vRealize Automation manages the child objects of a data center or custom data center container, theactions that are normally available on those objects do not appear, because the action framework excludesactions on objects that vRealize Automation manages. You cannot turn on or turn off the exclusion of actionson vRealize Automation managed objects. This behavior is normal.
If you removed the vRealize Automation adapter instance, but did not select the Remove related objectscheck box, the actions are still disabled.
To make actions available on the objects in your data center or custom data center, either confirm thatvRealize Automation is not managing the objects, or perform the steps in this procedure to remove thevRealize Automation adapter instance.
Solution
1 To allow actions on an object, go to your vRealize Automation instance.
2 Make the change in vRealize Automation, such as to move a virtual machine.
Missing Column Data in Actions Dialog BoxesData is missing for one or more objects in an Actions dialog box, making it difficult to determine if you wantto run the action.
Problem
When you run an action one or more objects, some of the fields are empty.
Cause
The VMware vSphere adapter has not collected the data from the vCenter Server instance that manages theobject or the current vRealize Operations Manager user does not have privileges to view the collected datafor the object.
Solution
1 Verify that vRealize Operations Manager is configured to collect the data.
vRealize Operations Manager User Guide
58 VMware, Inc.

2 Verify that you have the privileges necessary to view the data.
Missing Column Data in the Set Memory for VM Dialog BoxThe read-only data columns do not display the current values, which makes it difficult to properly specify anew memory value.
Problem
Current (MB) and Power State columns do not display the current values, which are collected for themanaged object.
Cause
The adapter responsible for collecting data from the vCenter Server on which the target virtual machine isrunning has not run a collection cycle and collected the data. This can occur when you recently created anVMware adapter instance for the target vCenter Server and initiated an action. The VMware vSphereadapter has a 5-minute collection cycle.
Solution
1 After you create a VMware adapter instance, wait an additional 5 minutes.
2 Rerun the Set Memory for VM action.
The current memory value and the current power state appear in the dialog box.
Host Name Does Not Appear in Action Dialog BoxWhen you run an action on a virtual machine, the host name is blank in the action dialog box.
Problem
When you select virtual machine on which to run an action, and click the Action button, the dialog boxappears, but the Host column is empty.
Cause
Although your user role is configured to run action on the virtual machines, you do not have a user roll thatprovides you with access to the host. You can see the virtual machines and run actions on them, but youcannot see the host data for the virtual machines. vRealize Operations Manager cannot retrieve data thatyou do not have permission to access.
Solution
You can run the action, but you cannot see the host name in the action dialog boxes.
Monitor Recent Task StatusThe Recent Task status includes all the tasks initiated from vRealize Operations Manager. You use the taskstatus information to verify that your tasks finished successfully or to determine the current state of tasks.
You can monitor the status of tasks that are started when you run actions, and investigate whether a taskfinished successfully.
Prerequisites
You ran at least one action as part of an alert recommendation or from one of the toolbars. See “Run ActionsFrom Toolbars in vRealize Operations Manager,” on page 57.
Procedure
1 In the menu, click Administration, then select History from the left pane.
Chapter 1 Monitoring Objects in Your Managed Environment by Using vRealize Operations Manager
VMware, Inc. 59
2 Click Recent Tasks.
3 To determine if you have tasks that are not finished, click the Status column and sort the results.
Option Description
In Progress Indicates running tasks.
Completed Indicates finished tasks.
Failed Indicates incomplete tasks on at least one object when started on multipleobjects.
Maximum Time Reached Indicates timed out tasks.
4 To evaluate a task process, select the task in the list and review the information in the Details of TaskSelected pane.
The details appear in the Messages pane. If the information message includes No action taken, the taskfinished because the object was already in the requested state.
5 To view the messages for an object when the task included several objects, select the object in theAssociated Objects list.
To clear the object selection so that you can view all the messages, press the space bar.
What to do next
Troubleshoot tasks with a status of Maximum Time Reached or Failed to determine why a task did not runsuccessfully. See “Troubleshoot Failed Tasks,” on page 60.
Troubleshoot Failed TasksIf tasks fail to run in vRealize Operations Manager, review the Recent Tasks page and troubleshoot the taskto determine why it failed.
This information is a general procedure for using the information in Recent Tasks to troubleshoot problemsidentified in the tasks.
n Determine If a Recent Task Failed on page 61The Recent Tasks provide the status of action tasks initiated from vRealize Operations Manager. If youdo not see the expected results, review the tasks to determine if your task failed.
n Troubleshooting Maximum Time Reached Task Status on page 61An action task has a Maximum Time Reached status and you do not know the current status to the task.
n Troubleshooting Set CPU or Set Memory Failed Tasks on page 62An action task for Set CPU Count or Set Memory for VM has a Failed status in the recent task listbecause power off is not allowed.
n Troubleshooting Set CPU Count or Set Memory with Powered Off Allowed on page 62A Set CPU Count, Set Memory, or a Set CPU Count and Set Memory action indicates that the actionfailed in Recent Tasks.
n Troubleshooting Set CPU Count and Memory When Values Not Supported on page 63If you run the Set CPU Count or Set Memory actions with an unsupported value on a virtual machine,the virtual machine might be left in an unusable state and require you to resolve the problem invCenter Server.
n Troubleshooting Set CPU Resources or Set Memory Resources When the Value is Not Supported onpage 64If you run the Set CPU Resources action with an unsupported value on a virtual machine, the task failsand an error appears in the Recent Task messages.
vRealize Operations Manager User Guide
60 VMware, Inc.

n Troubleshooting Set CPU Resources or Set Memory Resources When the Value is Too High onpage 64If you run the Set CPU Resources or Set Memory Resources action with a value that is greater than thevalue that your vCenter Server instance supports, the task fails and an error appears in the RecentTasks messages.
n Troubleshooting Set Memory Resources When the Value is Not Evenly Divisible by 1024 on page 65If you run the Set Memory Resources action with a value that cannot convert from kilobytes tomegabytes, the task fails and an error appears in the Recent Task messages.
n Troubleshooting Failed Shut Down VM Action Status on page 65A shut down VM action task has a Failed status in the Recent Task list.
n Troubleshooting VMware Tools Not Running for a Shut Down VM Action Status on page 66A Shut down VM action task has a Failed status in the Recent Task list and the Message indicates thatVMware Tools were required.
n Troubleshooting Failed Delete Unused Snapshots Action Status on page 66A Delete Unused Snapshots action task has a Failed status in the Recent Task list.
Determine If a Recent Task FailedThe Recent Tasks provide the status of action tasks initiated from vRealize Operations Manager. If you donot see the expected results, review the tasks to determine if your task failed.
Procedure
1 In the menu, click Administration, then click History in the left pane
2 Click Recent Tasks.
3 Select the failed task in the task list.
4 In the Messages list, locate the occurrences of Script Return Result: Failure and review theinformation between this value and <-- Executing:[script name] on {object type}.
Script Return Result is the end of action run and <-- Executing indicates the beginning. Theinformation provided includes the parameters that are passed, the target object, and unexpectedexceptions that you can use to identify the problem.
Troubleshooting Maximum Time Reached Task StatusAn action task has a Maximum Time Reached status and you do not know the current status to the task.
Problem
The Recent Tasks list indicates that a task had a status of Maximum Time Reached.
The task is running past the amount of time that is the default or configured value. To determine the currentstatus, you must troubleshoot the initiated action.
Cause
The task is running past the amount of time that is the default or configured value for one of the followingreasons:
n The action is exceptionally long running and did not finish before the threshold timeout was reached.
n The action adapter did not receive a response from the target system before reaching the timeout. Theaction might have completed successfully, but the completion status was not returned tovRealize Operations Manager.
n The action did not start correctly.
Chapter 1 Monitoring Objects in Your Managed Environment by Using vRealize Operations Manager
VMware, Inc. 61

n The action adapter might have an error and be unable to report the status.
Solution
Check the state of the target object to determine whether the action completed successfully. If it did not,continue investigating to find the root cause.
Troubleshooting Set CPU or Set Memory Failed TasksAn action task for Set CPU Count or Set Memory for VM has a Failed status in the recent task list becausepower off is not allowed.
Problem
The Recent Tasks list indicates that a Set CPU Count, Set Memory, or Set CPU and Memory task has a statusof Failed. When you evaluate the Messages list for the selected task, you see this message.
Unable to perform action. Virtual Machine found
powered on, power off not allowed
When you increase memory or CPU count, you see this message.
Virtual Machine found powered on, power off not allowed, if hot add is
enabled the hotPlugLimit is exceeded
Cause
You submitted the action to increase or decrease the CPU or memory value without selecting the AllowPower Off option. When you ran the action where a target object is currently powered on and whereMemory Hot Plug is not enabled for the target object in vCenter Server, the action fails.
Solution
1 Either enable Memory Hot Plug on your target virtual machines in vCenter Server or select AllowPower Off when you run the Set CPU Count, Set Memory, or Set CPU and Memory actions.
2 Check your hot plug limit in vCenter Server.
Troubleshooting Set CPU Count or Set Memory with Powered Off AllowedA Set CPU Count, Set Memory, or a Set CPU Count and Set Memory action indicates that the action failed inRecent Tasks.
Problem
When you run an action that changes the CPU count, the memory, or both, the action fails even though youknow that the Power Off Allowed was selected, the virtual machine is running, and the VMware Tools areinstalled and running.
Cause
The virtual machine should shut down the guest operating system before it powers off the virtual machineto make the requested changes. The shut down process waits 120 seconds for a response from the targetvirtual machine, and fails without making changes to the virtual machine.
Solution
1 Check the target virtual machine in vCenter Server to determine if it has jobs running that are delayingthe implementation of the action.
2 Retry the action from vRealize Operations Manager.
vRealize Operations Manager User Guide
62 VMware, Inc.

Troubleshooting Set CPU Count and Memory When Values Not SupportedIf you run the Set CPU Count or Set Memory actions with an unsupported value on a virtual machine, thevirtual machine might be left in an unusable state and require you to resolve the problem in vCenter Server.
Problem
You cannot power on a virtual machine after you successfully run the Set CPU Count or Set Memoryactions. When you review the messages in Recent Tasks for the failed Power On VM action, you seemessages stating that the host does not support the new CPU count or new memory value.
Cause
Because of the way that vCenter Server validates changes in the CPU and memory values, you can use thevRealize Operations Manager actions to change the value to an unsupported amount if you run the actionwhen the virtual machine is powered off.
If the object was powered on, the task fails, but rolls back any value changes and powers the machine backon. If the object was powered off, the task succeeds, the value is changed in vCenter Server, but the targetobject is left in a state where you cannot power it on using the actions or in vCenter Server withoutmanually changing the CPU or memory to a supported value.
Solution
1 In the menu, click Administration, then select History from the left pane.
2 Click Recent Tasks.
3 In the task list, locate your failed Power On VM action, and review the messages associated with thetask.
4 Look for a message that indicates why the task failed.
For example, if you ran a Set CPU Count action on a powered off virtual machine to increase the CPUcount from 2 to 4, but 4 CPUs is not supported by the host. The Set CPU tasks reported that itcompleted successfully in recent tasks. However, when you attempt to power on the virtual machine,the tasks fails. In this example the message is Virtual machine requires 4 CPUs to operate, but thehost hardware only provides 2.
5 Click the object name in the Recent Task list.
The main pane updates to display the object details for the selected object.
6 Click the Actions menu on the toolbar and click Open Virtual Machine in vSphere Client.
The vSphere Web Client opens with the virtual machine as the current object.
7 In the vSphere Web Client, click the Manage tab and click VM Hardware.
8 Click Edit.
9 In the Edit Settings dialog box, change the CPU count or memory to a supported value and click OK.
You can now power on the virtual machine from the Web client or from vRealize Operations Manager.
Chapter 1 Monitoring Objects in Your Managed Environment by Using vRealize Operations Manager
VMware, Inc. 63
Troubleshooting Set CPU Resources or Set Memory Resources When the Value isNot SupportedIf you run the Set CPU Resources action with an unsupported value on a virtual machine, the task fails andan error appears in the Recent Task messages.
Problem
The Recent Tasks list indicates that a Set CPU Resource or Set Memory Resource action has a state of Failed.When you evaluate the Messages list for the selected task, you see a message similar to the followingexamples.
RuntimeFault exception, message:[A specified parameter was not correct.
spec.cpuAllocation.reservation]
RuntimeFault exception, message:[A specified parameter was not correct.
spec.cpuAllocation.limits]
Cause
You submitted the action to increase or decrease the CPU or memory reservation or limit value with anunsupported value. For example, if you supplied a negative integer other than -1, which sets the value tounlimited, vCenter Server could not make the change and the action failed.
Solution
u Run the action with a supported value.
The supported values for reservation include 0 or a value greater than 0. The supported values for limitinclude -1, 0, or a value greater than 0.
Troubleshooting Set CPU Resources or Set Memory Resources When the Value isToo HighIf you run the Set CPU Resources or Set Memory Resources action with a value that is greater than the valuethat your vCenter Server instance supports, the task fails and an error appears in the Recent Tasks messages.
Problem
The Recent Tasks list indicates that a Set CPU Resource or Set Memory Resource action has a state of Failed.When you evaluate the Messages list for the selected task, you see messages similar to the followingexamples.
If you are working with Set CPU Resources, the information message is similar to the following example,where 1000000000 is the supplied reservation value.
Reconfiguring the Virtual Machine Reservation to:[1000000000] Mhz
The error message for this action is similar to this example.
RuntimeFault exception, message:[A specified parameter was not correct. reservation]
If you are working with Set Memory Resources, the information message is similar to the followingexample, where 1000000000 is the supplied reservation value.
Reconfiguring the Virtual Machine Reservation to:[1000000000] (MB)
The error message for this action is similar to this example.
RuntimeFault exception, message:[A specified parameter was not correct.
spec.memoryAllocation.reservation]
vRealize Operations Manager User Guide
64 VMware, Inc.
Cause
You submitted the action to change the CPU or memory reservation or limit value to a value greater than thevalue supported by vCenter Server, or the submitted reservation value is greater than the limit.
Solution
u Run the action using a lower value.
Troubleshooting Set Memory Resources When the Value is Not Evenly Divisible by1024If you run the Set Memory Resources action with a value that cannot convert from kilobytes to megabytes,the task fails and an error appears in the Recent Task messages.
Problem
The Recent Tasks list indicates that a Set Memory Resource action has a state of Failed. When you evaluatethe Messages list for the selected task, you see a message similar to the following example.
Parameter validation;[newLimitKB] failed conversion to (MB, (KB)[2000] not evenly divisible by
1024
Cause
Because vCenter Server manages memory reservations and limit values in megabytes, butvRealize Operations Manager calculates and reports on memory in kilobytes, you must provide a value inkilobytes that is directly convertible to megabytes. To do that, the value must be evenly divisible by 1024.
Solution
u Run the action where the reservation and limit values are configured with supported values.
The supported values for reservation include 0 or a value greater than 0 that is evenly divisible by 1024.The supported values for a limit include -1, 0, or a value greater than 0 that is evenly divisible by 1024.
Troubleshooting Failed Shut Down VM Action StatusA shut down VM action task has a Failed status in the Recent Task list.
Problem
The Shut Down VM action did not run successfully.
The Recent Tasks list indicates that a Shut Down VM action has a task status of Failed. When you evaluatethe Messages list for the selected job, you see Failure: Shut down confirmation timeout.
Cause
The shut down process involves shutting down the guest operating system and powering off the virtualmachine. The wait time is 120 seconds to shut down the guest operating system. If the guest operatingsystem does not shut down in this time, the action fails because the shut down action is not confirmed.
Solution
u Check the status of the guest operating system in vCenter Server to determine why is did not shutdown in the allotted time.
Chapter 1 Monitoring Objects in Your Managed Environment by Using vRealize Operations Manager
VMware, Inc. 65

Troubleshooting VMware Tools Not Running for a Shut Down VM Action StatusA Shut down VM action task has a Failed status in the Recent Task list and the Message indicates thatVMware Tools were required.
Problem
The Shutdown VM action did not run successfully.
The Recent Tasks list indicates that a Shutdown VM action has a tasks status of Failed. When you evaluatethe Messages list for the selected job, you see VMware Tools: Not running (Not installed).
Cause
The Shutdown VM action requires that VMware Tools be installed and running on the target virtualmachines. If you ran the action on more than one object, then VMware Tools was not installed, or installedbut not running, on at least one of the virtual machines.
Solution
u In the vCenter Server instance that manages the virtual machine that failed to run the action, install andstart VMware Tools on the affected virtual machines.
Troubleshooting Failed Delete Unused Snapshots Action StatusA Delete Unused Snapshots action task has a Failed status in the Recent Task list.
Problem
The Delete Unused Snapshots action did not run successfully.
The Recent Tasks list indicates that a Delete Unused Snapshots action has a tasks status of Failed. When youevaluate the Messages list for the selected job, you see this message.
Remove snapshot failed, response wait expired after:[120] seconds,
unable to confirm removal
Cause
The delete snapshot process involves waiting for access to datastores. The wait time is 600 seconds to accessthe datastore and delete the snapshot. If the delete request is not passed to the datastore in that time, theaction does not finish the delete snapshot action.
Solution
1 Check the status of the snapshot in vCenter Server to determine if it was deleted.
2 If it was not, submit the delete snapshot request at a different time.
Viewing Your InventoryvRealize Operations Manager collects data from all the objects in your environment and displays a health,risk, and efficiency status for each object.
Survey your entire inventory to get a quick idea of the state of any object or click an object name for moredetailed information. See “Evaluating Object Information Using Badge Alerts and the Summary Tab,” onpage 35.
vRealize Operations Manager User Guide
66 VMware, Inc.
Planning the Capacity for YourManaged Environment UsingvRealize Operations Manager 2
You can use the Projects feature in vRealize Operations Manager to plan for capacity allocations andupgrades in your virtual environment, or to optimize your existing resources. To plan your upcomingcapacity needs, you create a project that anticipates forthcoming changes that affect the capacity of yourobjects.
In addition to creating projects to plan for hardware changes or virtual infrastructure changes, you cancreate custom profiles and custom data centers to help forecast your capacity needs. With custom profiles,you can determine how many instances of an object can fit in your environment depending on the availablecapacity and configuration. With custom data centers, you can see capacity analytics and badgecomputations based on the objects contained in the custom data center.
How Projects WorkA project is a detailed estimation of the capacity that you must have available in your environment based onupcoming changes. You can define projects to add or remove resources from objects such as yourvCenter Server instance, clusters, data centers, hosts, virtual machines, and datastores.
With projects, you plan for changes in capacity, and examine the possible outcomes. You can plan forincreases or decreases in the demand for capacity on your objects.
For example, if you plan to hire more staff in the next month, you must increase the capacity on the objectsthat they will use. To plan for this upcoming demand, you can create projects. In your projects, you addhosts to a data center, add memory and CPUs to a host, and increase the capacity of your virtual machines.
VMware, Inc. 67

When you create a project, you add one or more capacity scenarios to the project to determine your futureneeds. Project scenarios anticipate the changes to capacity or demand that affect the object at an upcomingtime and date. After you save each project, you drag the project to the visualization pane to chart thecapacity forecast. You can see the anticipated capacity needs in the chart based on the values that youdefined in your project scenarios. The visual representation shows how the needs for planned capacitycompare to the resources that you currently have on those objects.
When you are sure that the objects require the planned capacity, you can commit the project to havevRealize Operations Manager reserve the capacity on those objects.
A project is a supposition about how the capacity and load change on your objects when you change theconditions in your virtual infrastructure environment. You do not have to implement the changes that yourproject represents. By creating the project, you can determine your capacity requirements before youimplement the actual changes.
Projects ListThe defined projects appear in a list below the visualization chart. vRealize Operations Manager filters thelist according to the object that you select in the inventory tree. Use the toolbar to create, edit, or delete aproject. To sort by columns in the list, click a column heading. To add a project to the visualization pane,click the plus icon, or drag the project to the pane between the list and the chart.
Visualization ChartWhen you drag one or more projects into the visualization pane, the visualization chart displays eachscenario that you defined in the projects.
The chart displays a numeric value for each scenario that you added to the project. For example, in a projectfor a host machine, the scenario named Add Capacity: Percentage is numbered 1.1, and the scenario namedAdd Demand: Percentage is 1.2.
To plan another host for your data center, you might also have a second project that includes a scenarionamed Add Capacity: Add Host System. The scenario in your second project is 2.1.
vRealize Operations Manager User Guide
68 VMware, Inc.
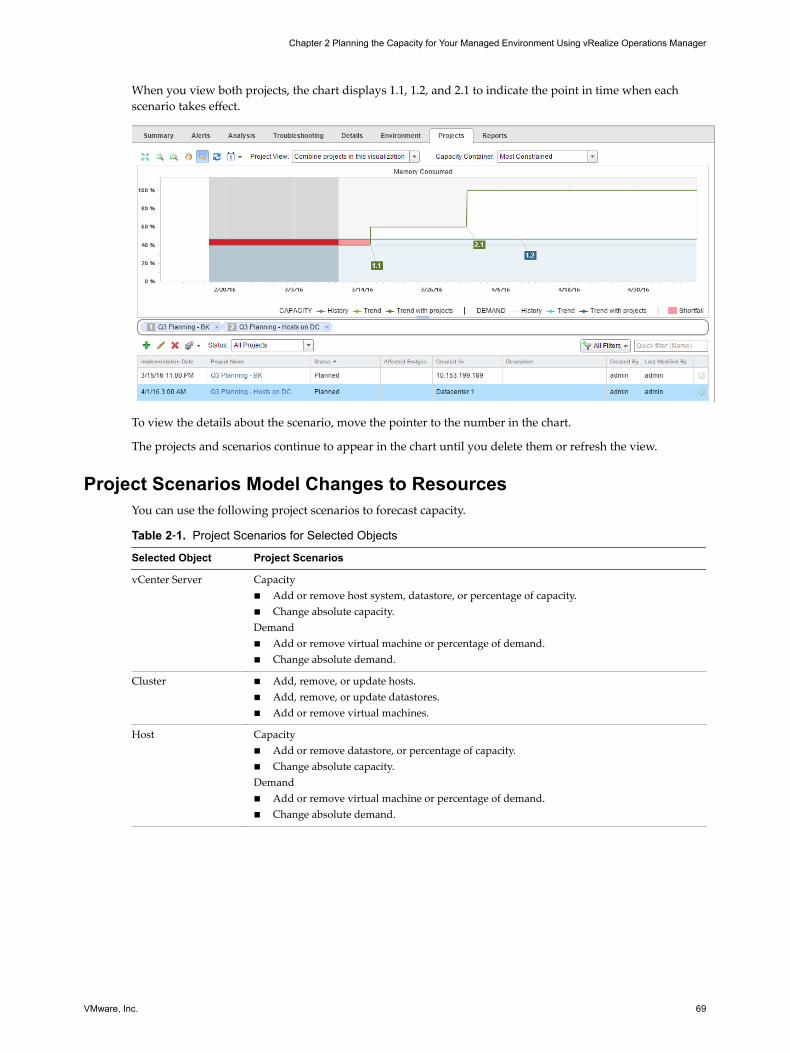
When you view both projects, the chart displays 1.1, 1.2, and 2.1 to indicate the point in time when eachscenario takes effect.
To view the details about the scenario, move the pointer to the number in the chart.
The projects and scenarios continue to appear in the chart until you delete them or refresh the view.
Project Scenarios Model Changes to ResourcesYou can use the following project scenarios to forecast capacity.
Table 2‑1. Project Scenarios for Selected Objects
Selected Object Project Scenarios
vCenter Server Capacityn Add or remove host system, datastore, or percentage of capacity.n Change absolute capacity.Demandn Add or remove virtual machine or percentage of demand.n Change absolute demand.
Cluster n Add, remove, or update hosts.n Add, remove, or update datastores.n Add or remove virtual machines.
Host Capacityn Add or remove datastore, or percentage of capacity.n Change absolute capacity.Demandn Add or remove virtual machine or percentage of demand.n Change absolute demand.
Chapter 2 Planning the Capacity for Your Managed Environment Using vRealize Operations Manager
VMware, Inc. 69
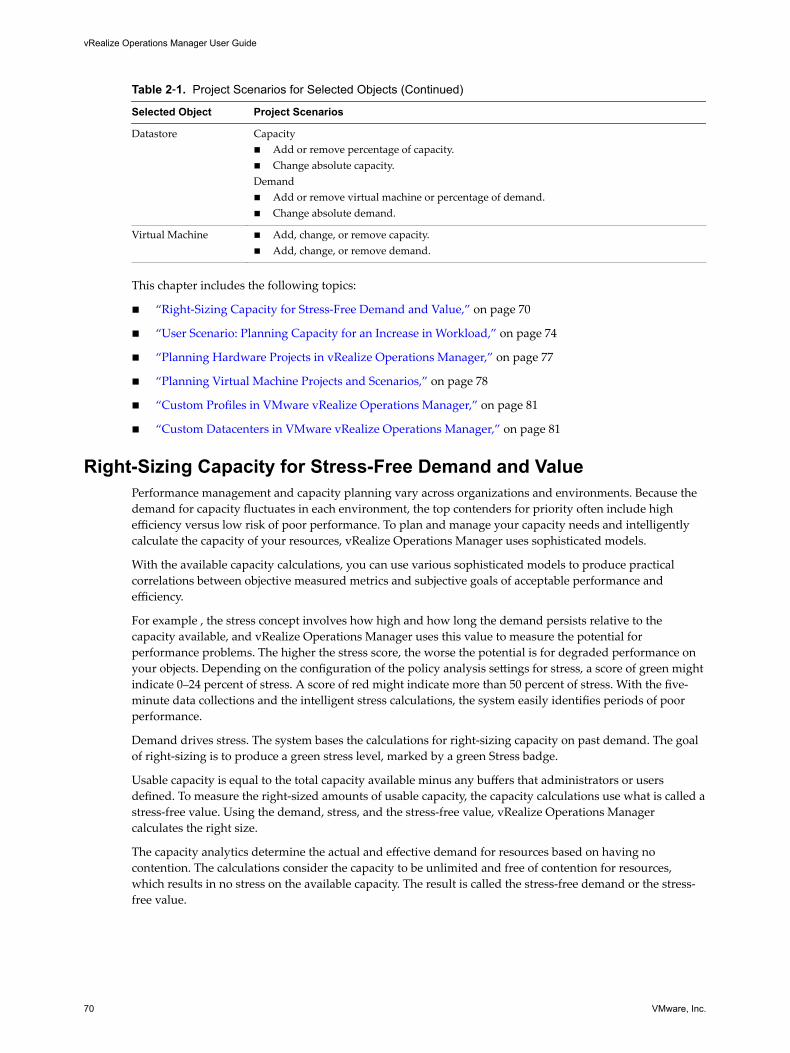
Table 2‑1. Project Scenarios for Selected Objects (Continued)
Selected Object Project Scenarios
Datastore Capacityn Add or remove percentage of capacity.n Change absolute capacity.Demandn Add or remove virtual machine or percentage of demand.n Change absolute demand.
Virtual Machine n Add, change, or remove capacity.n Add, change, or remove demand.
This chapter includes the following topics:
n “Right-Sizing Capacity for Stress-Free Demand and Value,” on page 70
n “User Scenario: Planning Capacity for an Increase in Workload,” on page 74
n “Planning Hardware Projects in vRealize Operations Manager,” on page 77
n “Planning Virtual Machine Projects and Scenarios,” on page 78
n “Custom Profiles in VMware vRealize Operations Manager,” on page 81
n “Custom Datacenters in VMware vRealize Operations Manager,” on page 81
Right-Sizing Capacity for Stress-Free Demand and ValuePerformance management and capacity planning vary across organizations and environments. Because thedemand for capacity fluctuates in each environment, the top contenders for priority often include highefficiency versus low risk of poor performance. To plan and manage your capacity needs and intelligentlycalculate the capacity of your resources, vRealize Operations Manager uses sophisticated models.
With the available capacity calculations, you can use various sophisticated models to produce practicalcorrelations between objective measured metrics and subjective goals of acceptable performance andefficiency.
For example , the stress concept involves how high and how long the demand persists relative to thecapacity available, and vRealize Operations Manager uses this value to measure the potential forperformance problems. The higher the stress score, the worse the potential is for degraded performance onyour objects. Depending on the configuration of the policy analysis settings for stress, a score of green mightindicate 0–24 percent of stress. A score of red might indicate more than 50 percent of stress. With the five-minute data collections and the intelligent stress calculations, the system easily identifies periods of poorperformance.
Demand drives stress. The system bases the calculations for right-sizing capacity on past demand. The goalof right-sizing is to produce a green stress level, marked by a green Stress badge.
Usable capacity is equal to the total capacity available minus any buffers that administrators or usersdefined. To measure the right-sized amounts of usable capacity, the capacity calculations use what is called astress-free value. Using the demand, stress, and the stress-free value, vRealize Operations Managercalculates the right size.
The capacity analytics determine the actual and effective demand for resources based on having nocontention. The calculations consider the capacity to be unlimited and free of contention for resources,which results in no stress on the available capacity. The result is called the stress-free demand or the stress-free value.
vRealize Operations Manager User Guide
70 VMware, Inc.

Where to Find Stress-Free Demand and Stress-Free ValueIn some areas of the user interface, vRealize Operations Manager identifies capacity as Stress Free Demand,and in other areas it is identified as Stress Free Value. Both terms mean that the calculated capacity for anobject is free from unacceptable levels of contention and stress, as defined in the policy for the Stress score.
Stress Free Demand appears in All Metrics, Views, and Reports.
n In All Metrics, you can use the metric named Stress Free Demand to examine the CPU demand, diskspace allocation and demand, memory consumed, and the vSphere configuration limit on an object.When you apply this metric to these resources, you can build a metric graph to display the stress-freedemand for an object. The graph displays the high and low stress-free capacity values over time.
n In Reports, you can use a view that includes the metric named Stress Free Demand to generate a report.The table in the report displays Stress Free Demand as the label. For example, this metric appears in thereport named Cluster CPU Demand (%) Trend View.
Stress Free Value appears on the Object > Analysis > Time Remaining tab, and on the Object > Analysis >Stress tab.
n On the Object > Analysis > Time Remaining tab, you can view the time remaining for CPU demand,memory consumed, disk space demand and allocation, and the vSphere configuration limit. In thisview, the table column name is Stress Free Value.
n On the Object > Analysis > Stress tab, the table column name is Stress Free Value. The tables displayStress Free Value as the calculated values for CPU demand, memory consumed, and the vSphereconfiguration limit.
Setting the Thresholds for the Stress ScoreThe analysis settings in the policy that you apply to your objects defines the thresholds for the stress score.The policy includes default settings for the stress score to be green, yellow, orange, or red. If the settings aretoo strict or loose for your environment, you can modify them.
To modify the stress score thresholds, edit the policy that applies to your objects, and click AnalysisSettings. Select an object type and click the filter icon to display the policy analysis settings. In the Stressarea, click the lock icon, expand Stress, and modify the stress thresholds.
In the analysis stress settings, vRealize Operations Manager uses the selected resources, such as MemoryDemand, CPU Demand, and vSphere Configuration Limit to calculate the stress score.
You can set the stress thresholds to your own values, or turn them off. To change a stress score threshold,click and drag an icon along the slider. To remove a scoring range, such as the default range of 35–49identified by orange, double-click an icon to disable the range.
Chapter 2 Planning the Capacity for Your Managed Environment Using vRealize Operations Manager
VMware, Inc. 71

Demand Exceeds is a percentage of capacity. Capacity is also called provisioned capacity. To change thestress threshold for a resource, double-click the Demand Exceeds percentage, and enter the desired value.This value defines the point at which vRealize Operations Manager considers the percentage of demand tobe stress. For example, to change the stress threshold for Memory Demand, double-click the currentpercentage, such as 70.0 % of capacity, and enter the new percentage of demand to exceed forvRealize Operations Manager to identify stress.
For each resource, you can change the sliding analysis window value to include the entire range, and set thepeak value to a different time depending on how you need vRealize Operations Manager to derive the stressscore.
More About the Stress ScorevRealize Operations Manager calculates the stress zone and stress score for you. The following explanationscover typical scenarios where Demand does not exceed Capacity.
To determine the stress on an object for a specific time period, you can examine the demand curve todetermine how much of the stress zone the demand occupies. The stress zone is typically where demandexceeds 70 percent of the total capacity. For example, stress occurs when CPU demand, memory demand, ormemory consumed exceeds 70 percent of the capacity.
In a 60-minute peak period, vRealize Operations Manager bases the Stress score calculation on the followingvariables:
n Stress threshold, which is the Demand Exceeds setting
n Stress score threshold, which determines the color of the Stress badge
n Time range, as in 30 days of analysis
n Peak detection window, which is the 60-minute peak setting that you can adjust to either a non-zeronumber of minutes or the entire range.
When the demand exceeds 70 percent, that data point in time is in the Stress zone.
In the policy stress analysis settings, to examine an example graph used to calculate stress, click What isstress?.
Another example to explain the calculation used for CPU stress is shown here.
vRealize Operations Manager User Guide
72 VMware, Inc.

With a peak detection window size of 60 minutes, vRealize Operations Manager calculates the CPU stressscore. It uses the area under the demand curve and above the stress threshold line as a percentage of thearea covered by the total capacity curve.
Using time stamps of t1 and t2 to identify a 60-minute window in the last 30 days, the stress score dependson demand, stress threshold, and total capacity over time.
Maximum((Demand - Stress Threshold) ÷ (Total Capacity - Stress Threshold))
This equation applies to the stress calculations for each resource, such as memory demand, memoryconsumed, and CPU demand.
If Total Capacity varies during the time range being considered, Stress Threshold must also becomevariable, because (Stress Threshold) = (Stress Threshold in %) × (Total Capacity).
Since (Total Capacity) can be a different value at a different time, as identified by t, then “StressThreshold”(t) = “Stress Threshold in %” × “Total Capacity”(t).
As a result, the Stress score is the highest aggregate of demand that exceeds 70 percent of capacity, as apercentage of the aggregate of capacity within any contiguous interval of 60 minutes in the last 30 days. Theformula for the score is as follows:
Maximum((Demand(t1, t2) - “Stress Threshold”(t1, t2)) ÷ (“Total Capacity”(t1, t2) – “Stress
Threshold”(t1, t2)))
Where:
n t1 and t2 are time stamps in the time continuum within the last 30 days.
n t1 < t2
n t2 - t1 = 60 minutes
n Demand(t1, t2) is the demand curve between time t1 and t2.
n “Stress Threshold”(t1, t2) is the stress threshold curve (as absolute values) between time t1 and t2.
n “Total Capacity”(t1, t2) is the capacity threshold curve between time t1 and t2.
vRealize Operations Manager calculates the aggregate during a contiguous time interval of 60 minutes inthe last 30 days. The Stress score is the percentage of aggregate capacity in the same contiguous time intervalof 60 minutes. An acceptable score yields a green Stress badge.
To view the Stress zone for an object, click Object > Analysis > Stress. Then, examine the Stress breakdownareas for CPU and memory, the Stress Zone column in the table, and the graph of actual demand.
By calculating the stress score, vRealize Operations Manager provides an intelligent way to evaluate peaksand fluctuations of the capacity of your objects over time.
Chapter 2 Planning the Capacity for Your Managed Environment Using vRealize Operations Manager
VMware, Inc. 73

User Scenario: Planning Capacity for an Increase in WorkloadYou are an IT administrator for one of your financial data centers. You must forecast the capacityrequirements for your virtual infrastructure to plan for an increase in the workload of your cluster and datacenter over the next month. To evaluate the demand and supply for capacity on your objects, and forecastthe risk to your current capacity, you create projects and scenarios.
Your data center is named Fina_RDDC-01, and includes a cluster named Fina_RDCL-01. You plan to increasethe overall workload on the cluster in this data center by 50 percent in the next month. You must also plan toadd virtual machines and add one or more hosts to this cluster.
In this example, you create a project that includes scenarios to determine the impact of future capacity needson your cluster objects. You then create a second project to plan for more capacity needs. Finally, youexamine these projects together in the context of your current capacity so that you can understand theprojected impact of these projects on your future capacity needs.
Prerequisites
Verify that vRealize Operations Manager has collected data for the last several weeks. For information aboutconnecting vRealize Operations Manager to data sources, see the vRealize Operations Manager InformationCenter.
Procedure
1 Create a Sample Project to Increase Workload Capacity on page 74You are the IT administrator for the financial data center named Fina_RDDC-01 in your company. Createa project to plan for an increase in the workload on the cluster named Fina_RDCL-01 by 50 percent inthe next month. In the project, you create scenarios that anticipate the effect of the capacity needs onthe hosts, virtual machines, and cluster in the data center.
2 Create a Sample Project to Add a Host and Virtual Machines on page 75You are the IT administrator for the financial data center in your company. To plan for capacity needson the cluster named Fina_RDCL-01 in the data center named Fina_RDDC-01, you create another project.In your project, you add virtual machines and a host to the cluster.
3 View the Result of Your Capacity Projects on page 76You are the IT administrator responsible for the data center named Fina_RDDC-01. You view the effectsof the projects and scenarios that you created on the overall capacity of the cluster in your data center.
Create a Sample Project to Increase Workload CapacityYou are the IT administrator for the financial data center named Fina_RDDC-01 in your company. Create aproject to plan for an increase in the workload on the cluster named Fina_RDCL-01 by 50 percent in the nextmonth. In the project, you create scenarios that anticipate the effect of the capacity needs on the hosts,virtual machines, and cluster in the data center.
Use your new project and scenario to determine what happens to the capacity of the objects in yourenvironment when you plan for an increase in demand.
Prerequisites
n Understand the scope of this sample workflow. See “User Scenario: Planning Capacity for an Increase inWorkload,” on page 74.
n Verify that the cluster named Fina_RDCL-01 in your data center named Fina_RDDC-01 includes multiplehosts and virtual machines.
vRealize Operations Manager User Guide
74 VMware, Inc.
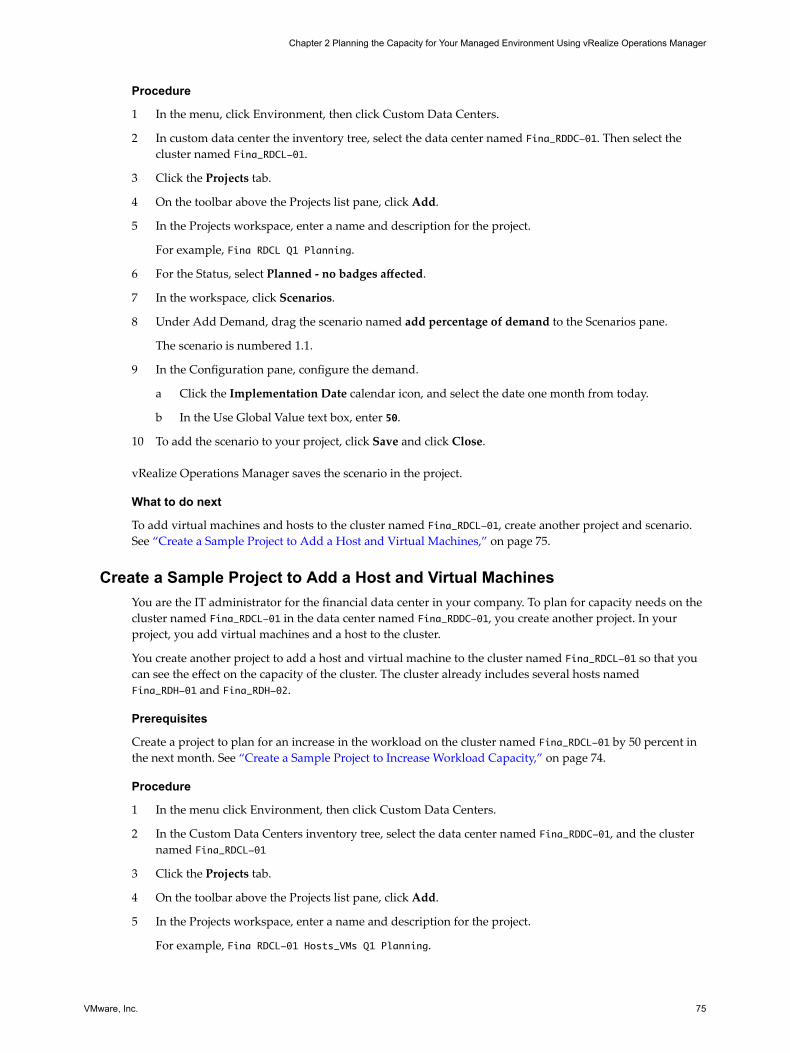
Procedure
1 In the menu, click Environment, then click Custom Data Centers.
2 In custom data center the inventory tree, select the data center named Fina_RDDC-01. Then select thecluster named Fina_RDCL-01.
3 Click the Projects tab.
4 On the toolbar above the Projects list pane, click Add.
5 In the Projects workspace, enter a name and description for the project.
For example, Fina RDCL Q1 Planning.
6 For the Status, select Planned - no badges affected.
7 In the workspace, click Scenarios.
8 Under Add Demand, drag the scenario named add percentage of demand to the Scenarios pane.
The scenario is numbered 1.1.
9 In the Configuration pane, configure the demand.
a Click the Implementation Date calendar icon, and select the date one month from today.
b In the Use Global Value text box, enter 50.
10 To add the scenario to your project, click Save and click Close.
vRealize Operations Manager saves the scenario in the project.
What to do next
To add virtual machines and hosts to the cluster named Fina_RDCL-01, create another project and scenario.See “Create a Sample Project to Add a Host and Virtual Machines,” on page 75.
Create a Sample Project to Add a Host and Virtual MachinesYou are the IT administrator for the financial data center in your company. To plan for capacity needs on thecluster named Fina_RDCL-01 in the data center named Fina_RDDC-01, you create another project. In yourproject, you add virtual machines and a host to the cluster.
You create another project to add a host and virtual machine to the cluster named Fina_RDCL-01 so that youcan see the effect on the capacity of the cluster. The cluster already includes several hosts namedFina_RDH-01 and Fina_RDH-02.
Prerequisites
Create a project to plan for an increase in the workload on the cluster named Fina_RDCL-01 by 50 percent inthe next month. See “Create a Sample Project to Increase Workload Capacity,” on page 74.
Procedure
1 In the menu click Environment, then click Custom Data Centers.
2 In the Custom Data Centers inventory tree, select the data center named Fina_RDDC-01, and the clusternamed Fina_RDCL-01
3 Click the Projects tab.
4 On the toolbar above the Projects list pane, click Add.
5 In the Projects workspace, enter a name and description for the project.
For example, Fina RDCL-01 Hosts_VMs Q1 Planning.
Chapter 2 Planning the Capacity for Your Managed Environment Using vRealize Operations Manager
VMware, Inc. 75
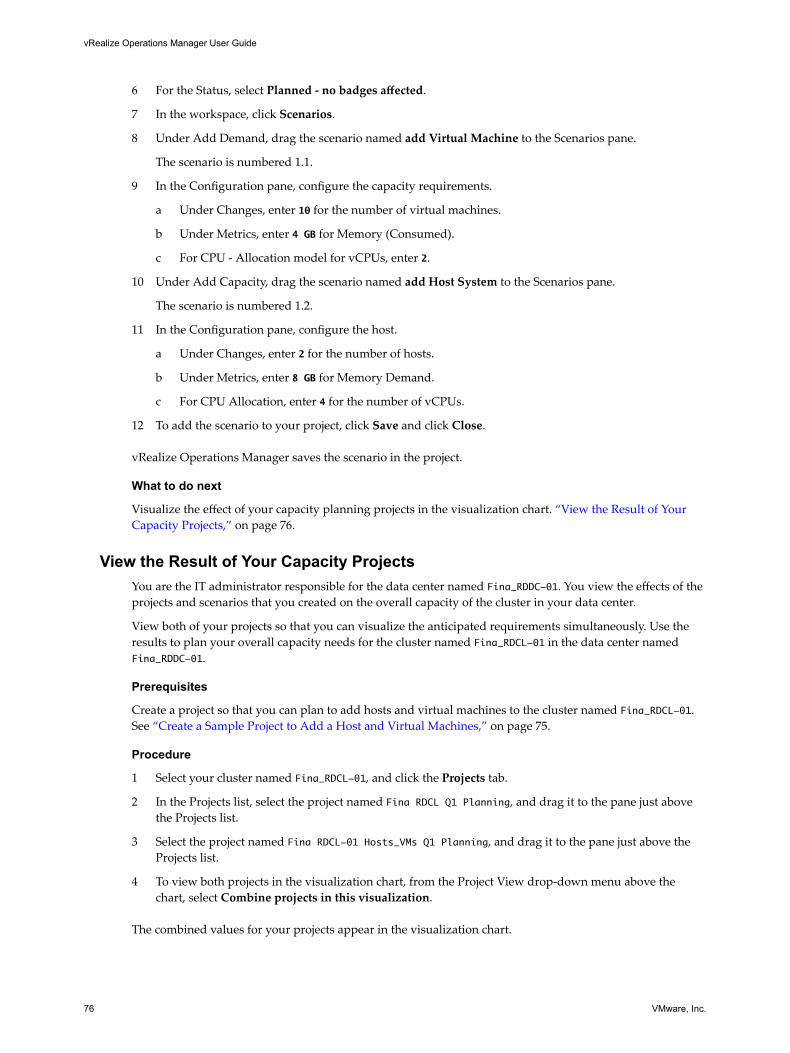
6 For the Status, select Planned - no badges affected.
7 In the workspace, click Scenarios.
8 Under Add Demand, drag the scenario named add Virtual Machine to the Scenarios pane.
The scenario is numbered 1.1.
9 In the Configuration pane, configure the capacity requirements.
a Under Changes, enter 10 for the number of virtual machines.
b Under Metrics, enter 4 GB for Memory (Consumed).
c For CPU - Allocation model for vCPUs, enter 2.
10 Under Add Capacity, drag the scenario named add Host System to the Scenarios pane.
The scenario is numbered 1.2.
11 In the Configuration pane, configure the host.
a Under Changes, enter 2 for the number of hosts.
b Under Metrics, enter 8 GB for Memory Demand.
c For CPU Allocation, enter 4 for the number of vCPUs.
12 To add the scenario to your project, click Save and click Close.
vRealize Operations Manager saves the scenario in the project.
What to do next
Visualize the effect of your capacity planning projects in the visualization chart. “View the Result of YourCapacity Projects,” on page 76.
View the Result of Your Capacity ProjectsYou are the IT administrator responsible for the data center named Fina_RDDC-01. You view the effects of theprojects and scenarios that you created on the overall capacity of the cluster in your data center.
View both of your projects so that you can visualize the anticipated requirements simultaneously. Use theresults to plan your overall capacity needs for the cluster named Fina_RDCL-01 in the data center namedFina_RDDC-01.
Prerequisites
Create a project so that you can plan to add hosts and virtual machines to the cluster named Fina_RDCL-01.See “Create a Sample Project to Add a Host and Virtual Machines,” on page 75.
Procedure
1 Select your cluster named Fina_RDCL-01, and click the Projects tab.
2 In the Projects list, select the project named Fina RDCL Q1 Planning, and drag it to the pane just abovethe Projects list.
3 Select the project named Fina RDCL-01 Hosts_VMs Q1 Planning, and drag it to the pane just above theProjects list.
4 To view both projects in the visualization chart, from the Project View drop-down menu above thechart, select Combine projects in this visualization.
The combined values for your projects appear in the visualization chart.
vRealize Operations Manager User Guide
76 VMware, Inc.
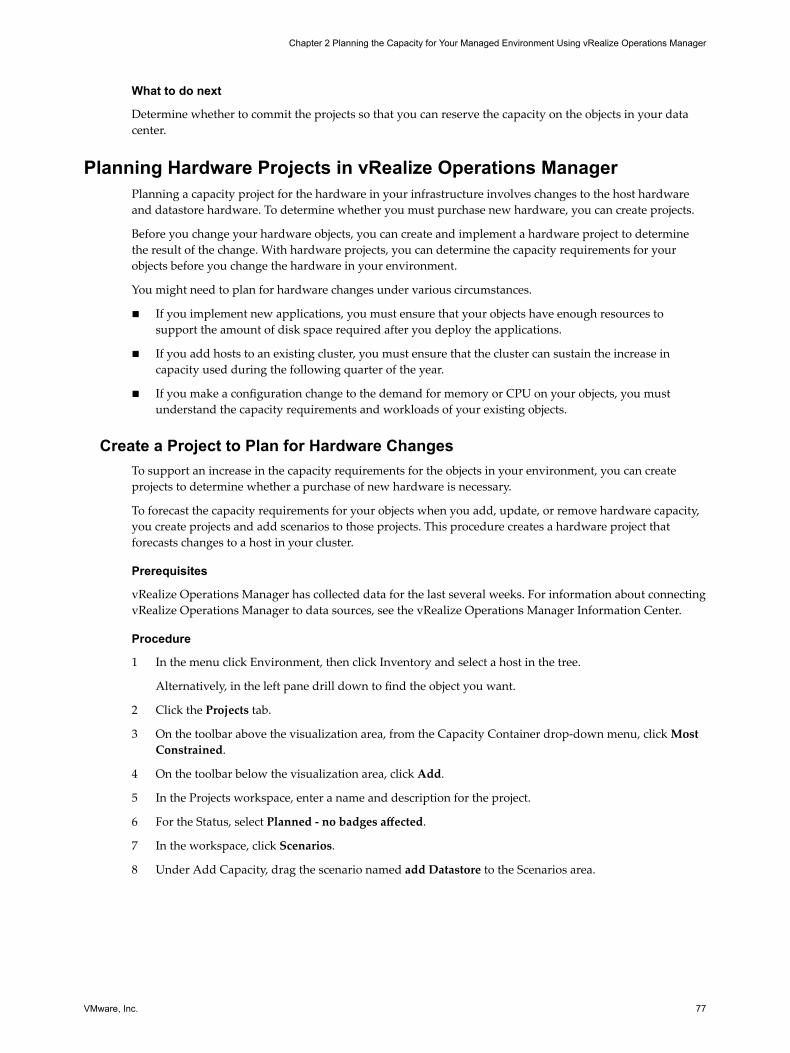
What to do next
Determine whether to commit the projects so that you can reserve the capacity on the objects in your datacenter.
Planning Hardware Projects in vRealize Operations ManagerPlanning a capacity project for the hardware in your infrastructure involves changes to the host hardwareand datastore hardware. To determine whether you must purchase new hardware, you can create projects.
Before you change your hardware objects, you can create and implement a hardware project to determinethe result of the change. With hardware projects, you can determine the capacity requirements for yourobjects before you change the hardware in your environment.
You might need to plan for hardware changes under various circumstances.
n If you implement new applications, you must ensure that your objects have enough resources tosupport the amount of disk space required after you deploy the applications.
n If you add hosts to an existing cluster, you must ensure that the cluster can sustain the increase incapacity used during the following quarter of the year.
n If you make a configuration change to the demand for memory or CPU on your objects, you mustunderstand the capacity requirements and workloads of your existing objects.
Create a Project to Plan for Hardware ChangesTo support an increase in the capacity requirements for the objects in your environment, you can createprojects to determine whether a purchase of new hardware is necessary.
To forecast the capacity requirements for your objects when you add, update, or remove hardware capacity,you create projects and add scenarios to those projects. This procedure creates a hardware project thatforecasts changes to a host in your cluster.
Prerequisites
vRealize Operations Manager has collected data for the last several weeks. For information about connectingvRealize Operations Manager to data sources, see the vRealize Operations Manager Information Center.
Procedure
1 In the menu click Environment, then click Inventory and select a host in the tree.
Alternatively, in the left pane drill down to find the object you want.
2 Click the Projects tab.
3 On the toolbar above the visualization area, from the Capacity Container drop-down menu, click MostConstrained.
4 On the toolbar below the visualization area, click Add.
5 In the Projects workspace, enter a name and description for the project.
6 For the Status, select Planned - no badges affected.
7 In the workspace, click Scenarios.
8 Under Add Capacity, drag the scenario named add Datastore to the Scenarios area.
Chapter 2 Planning the Capacity for Your Managed Environment Using vRealize Operations Manager
VMware, Inc. 77

9 In the Configuration area, enter the general parameters for the project scenario.
Option Description
Implementation Date Set the date and time to implement the project scenario.
Changes Set the number of datastores to add.
Populate metrics from Copy the disk space use and allocation metrics from an existing datastore,and select an existing datastore.
Metrics Set the amount of disk space use and allocation.
10 To view the effect of your selections in the visualization chart, click Save project and continue editing.
With the Capacity Container set to Most Constrained, the visualization chart might indicate a CPUshortfall when you implement the project scenario. This shortfall might occur because the CPUallocation might be greater than the available capacity. In this case, you might need to add CPU capacitybefore you implement the project scenario.
11 When you are satisfied with the capacity forecast based on your settings, click Save to add the scenarioto the project.
12 On the Projects tab, click your project in the list and drag it to the area above the project list.
vRealize Operations Manager applies your project and scenario to the visualization chart. The capacityforecasted in the project appears as a gray line in the chart.
What to do next
Add the scenario named Add Demand: add percentage of demand to the project, and set the CapacityContainer to Disk Space Allocation. The visualization chart might indicate that when you implement theproject scenario, you have a disk space shortfall. In this case, you might need to add disk space capacitybefore you implement the project scenario.
In the visualization chart, evaluate the current available capacity with the actual capacity required if youchange your environment as defined in your project. Determine whether to commit the project so that itreserves the capacity required for the hardware change.
Planning Virtual Machine Projects and ScenariosVirtual machine projects help you assess the consequences of changing resources on virtual machineswithout applying the changes to your virtual environment. Before you apply changes to your virtualenvironment, you can create sample virtual machine projects to model adding or removing virtual machinesto a host or a cluster.
n Create a Virtual Machine Project Using Populated Metrics on page 79You can create a project scenario that uses an existing virtual machine profile as a model. The projectscenario simulates the resource requirements when you add one or more virtual machines to a host orcluster.
n Create a Sample Project for a New Virtual Machine on page 80Virtual machine projects assess the consequences of adding a new virtual machine to a cluster or host,without applying the actual changes to your virtual environment.
n Create a Sample Project to Simulate Removing a Virtual Machine on page 80You can create a project that simulates removing one or more virtual machines from a host or a cluster.You might remove virtual machines when you no longer need them, or when you must move them.
vRealize Operations Manager User Guide
78 VMware, Inc.

Create a Virtual Machine Project Using Populated MetricsYou can create a project scenario that uses an existing virtual machine profile as a model. The projectscenario simulates the resource requirements when you add one or more virtual machines to a host orcluster.
When you configure the settings in a project scenario to add virtual machines, you can populate the resourcevalues for the planned virtual machine from an existing profile. Or, you can copy the values from an existingvirtual machine.
To calculate the capacity metrics values for the virtual machine, vRealize Operations Manager partitions thecapacity for CPU, memory, and disk dimensions, according to the profile that you select.
For information about CPU and memory maximums, see the VMware vSphere documentation.
Procedure
1 In the menu click Environment, then click Inventory.
Alternatively, in the left pane drill down to find the object you want.
2 Click the host or cluster that contains the planned virtual machine reside.
3 Click Projects.
4 Click Add New Project.
5 In the Projects workspace, enter a name and description for the project.
6 For the Status, select Planned - no badges affected.
7 In the workspace, click Scenarios.
8 Under Add Demand, drag the scenario named add Virtual Machine to the Scenarios area.
9 In the Configuration area, enter the general parameters for the project scenario.
a Select the date and time to implement the project scenario.
b Click Populate metrics from, select an existing profile or an existing virtual machine, and click OK.
Option Action
Copy metric values from a pre-defined profile.
From the Profile drop-down menu, select an existing profile topopulate the metrics values for the planned virtual machine.
Copy metric values from anexisting object.
From the Existing Virtual Machine drop-down menu, select a virtualmachine to populate the metrics values for the planned virtualmachine. The list displays the virtual machines that reside on theselected object.
c (Optional) To duplicate virtual machines, increase the virtual machine count.
d To see the effect of the planned virtual machines in the visualization chart, click Save project andcontinue editing.
With the Capacity Container set to Most Constrained, the visualization chart might indicate thatyou have a CPU shortfall when you implement the project scenario. The shortfall might occurbecause the CPU allocation might be greater than the available capacity. In this case, you mightneed to add CPU capacity before you implement the project scenario.
10 When you are satisfied with the capacity forecast based on your settings, click Save to add the scenarioto the project.
11 On the Projects tab, click your project in the list and drag it to the area above the project list.
Chapter 2 Planning the Capacity for Your Managed Environment Using vRealize Operations Manager
VMware, Inc. 79

vRealize Operations Manager applies your project and scenario to the visualization chart. The capacityforecasted in the project appears as a gray line in the chart.
What to do next
In the visualization chart, evaluate the current available capacity with the actual capacity required if youchange your environment as defined in your project. Determine whether to commit the project so that itreserves the capacity required for the new virtual machines.
Create a Sample Project for a New Virtual MachineVirtual machine projects assess the consequences of adding a new virtual machine to a cluster or host,without applying the actual changes to your virtual environment.
For information about relevant CPU and memory maximums, see the VMware vSphere documentation.
Procedure
1 In the menu click Environment, then click Inventory and select a destination object in the tree.
Alternatively, in the left pane drill down to find the object you want.
If you implement your scenario, the destination object is a cluster or host where you locate the newvirtual machines.
2 Click the Projects tab and click the Add New Project icon.
3 From the Projects workspace, enter the name and a description of the project.
4 Select the Planned status.
5 To add scenarios to this project, click Scenarios.
6 Select the add Virtual Machine scenario and drag it to the Scenarios area.
7 Set the virtual machine count and the configuration for the virtual machine.
vRealize Operations Manager does not require you to set the disk I/O and network I/O use of the newvirtual machines. vRealize Operations Manager uses the average disk I/O and network I/O use acrossvirtual machines in the host or cluster as an estimation of the new virtual machine use.
8 To see the effect in the visualization chart when your configuration selections are finished, click Saveproject and continue editing.
9 To add the scenario to the project, click Save.
10 To close the Project workspace, click Close.
Clicking Close discards all changes. Clicking Save project and continue editing persists any changesthat were not previously saved.
vRealize Operations Manager applies the project to the object you selected. The project shows the currentcapacity compared to the expected capacity when you add the virtual machines to the target object.
Create a Sample Project to Simulate Removing a Virtual MachineYou can create a project that simulates removing one or more virtual machines from a host or a cluster. Youmight remove virtual machines when you no longer need them, or when you must move them.
Procedure
1 In the menu, click Environment, then click Inventory and select a host or cluster from the tree.
2 Click the Projects tab.
vRealize Operations Manager User Guide
80 VMware, Inc.
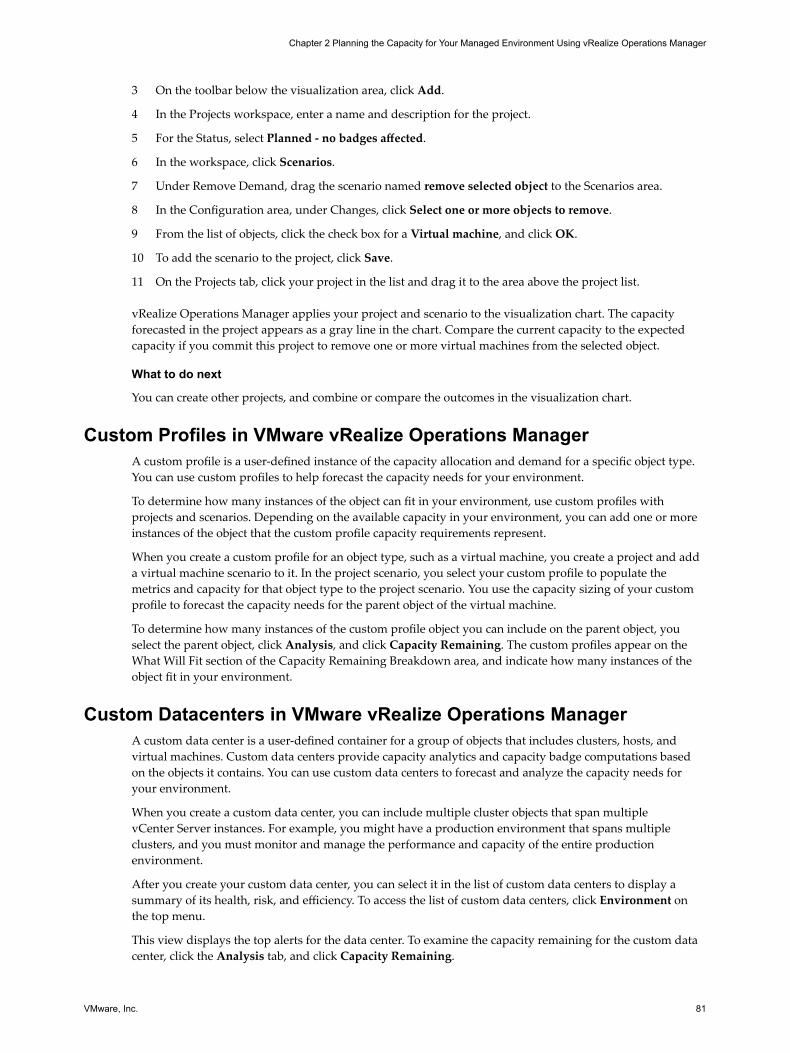
3 On the toolbar below the visualization area, click Add.
4 In the Projects workspace, enter a name and description for the project.
5 For the Status, select Planned - no badges affected.
6 In the workspace, click Scenarios.
7 Under Remove Demand, drag the scenario named remove selected object to the Scenarios area.
8 In the Configuration area, under Changes, click Select one or more objects to remove.
9 From the list of objects, click the check box for a Virtual machine, and click OK.
10 To add the scenario to the project, click Save.
11 On the Projects tab, click your project in the list and drag it to the area above the project list.
vRealize Operations Manager applies your project and scenario to the visualization chart. The capacityforecasted in the project appears as a gray line in the chart. Compare the current capacity to the expectedcapacity if you commit this project to remove one or more virtual machines from the selected object.
What to do next
You can create other projects, and combine or compare the outcomes in the visualization chart.
Custom Profiles in VMware vRealize Operations ManagerA custom profile is a user-defined instance of the capacity allocation and demand for a specific object type.You can use custom profiles to help forecast the capacity needs for your environment.
To determine how many instances of the object can fit in your environment, use custom profiles withprojects and scenarios. Depending on the available capacity in your environment, you can add one or moreinstances of the object that the custom profile capacity requirements represent.
When you create a custom profile for an object type, such as a virtual machine, you create a project and adda virtual machine scenario to it. In the project scenario, you select your custom profile to populate themetrics and capacity for that object type to the project scenario. You use the capacity sizing of your customprofile to forecast the capacity needs for the parent object of the virtual machine.
To determine how many instances of the custom profile object you can include on the parent object, youselect the parent object, click Analysis, and click Capacity Remaining. The custom profiles appear on theWhat Will Fit section of the Capacity Remaining Breakdown area, and indicate how many instances of theobject fit in your environment.
Custom Datacenters in VMware vRealize Operations ManagerA custom data center is a user-defined container for a group of objects that includes clusters, hosts, andvirtual machines. Custom data centers provide capacity analytics and capacity badge computations basedon the objects it contains. You can use custom data centers to forecast and analyze the capacity needs foryour environment.
When you create a custom data center, you can include multiple cluster objects that span multiplevCenter Server instances. For example, you might have a production environment that spans multipleclusters, and you must monitor and manage the performance and capacity of the entire productionenvironment.
After you create your custom data center, you can select it in the list of custom data centers to display asummary of its health, risk, and efficiency. To access the list of custom data centers, click Environment onthe top menu.
This view displays the top alerts for the data center. To examine the capacity remaining for the custom datacenter, click the Analysis tab, and click Capacity Remaining.
Chapter 2 Planning the Capacity for Your Managed Environment Using vRealize Operations Manager
VMware, Inc. 81

You can use your custom data center objects to balance the workload across the clusters in yourenvironment. Click Home, click Dashboard List, click the dashboard named Workload Distribution, andview the use of your custom data center in the dashboard.
Click the icon for your data center to view its workload trend, CPU and memory workload measurements,and the vSphere configuration limit.
vRealize Operations Manager User Guide
82 VMware, Inc.
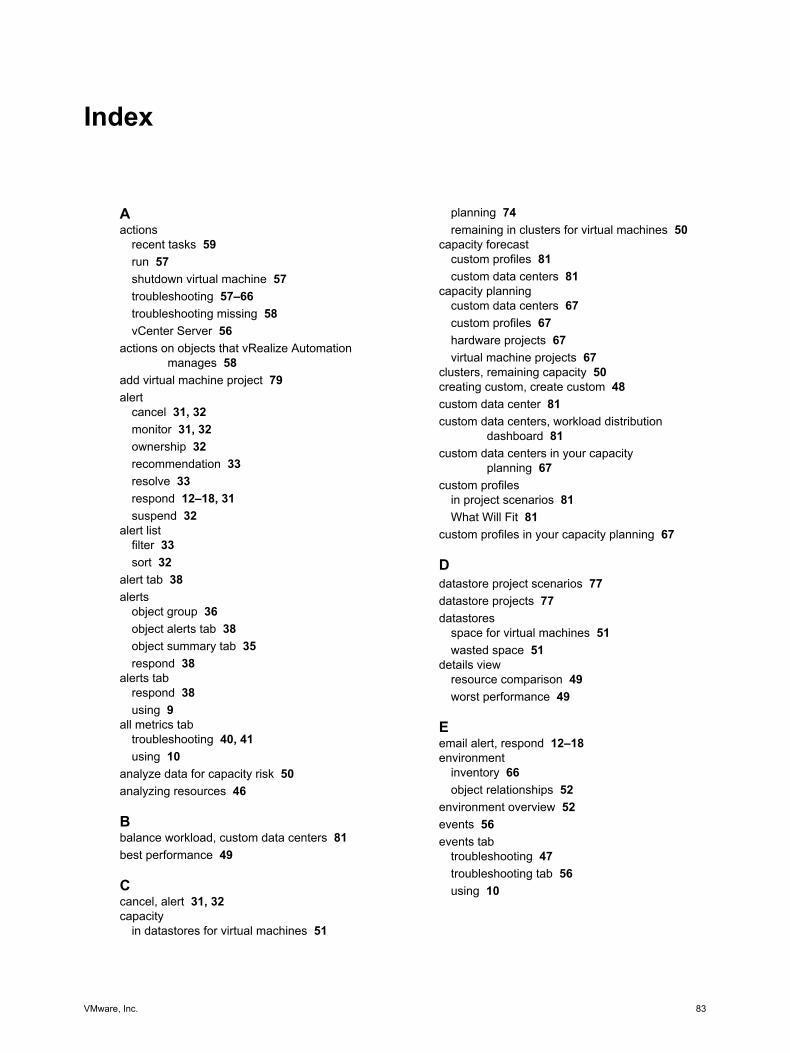
Index
Aactions
recent tasks 59run 57shutdown virtual machine 57troubleshooting 57–66troubleshooting missing 58vCenter Server 56
actions on objects that vRealize Automationmanages 58
add virtual machine project 79alert
cancel 31, 32monitor 31, 32ownership 32recommendation 33resolve 33respond 12–18, 31suspend 32
alert listfilter 33sort 32
alert tab 38alerts
object group 36object alerts tab 38object summary tab 35respond 38
alerts tabrespond 38using 9
all metrics tabtroubleshooting 40, 41using 10
analyze data for capacity risk 50analyzing resources 46
Bbalance workload, custom data centers 81best performance 49
Ccancel, alert 31, 32capacity
in datastores for virtual machines 51
planning 74remaining in clusters for virtual machines 50
capacity forecastcustom profiles 81custom data centers 81
capacity planningcustom data centers 67custom profiles 67hardware projects 67virtual machine projects 67
clusters, remaining capacity 50creating custom, create custom 48custom data center 81custom data centers, workload distribution
dashboard 81custom data centers in your capacity
planning 67custom profiles
in project scenarios 81What Will Fit 81
custom profiles in your capacity planning 67
Ddatastore project scenarios 77datastore projects 77datastores
space for virtual machines 51wasted space 51
details viewresource comparison 49worst performance 49
Eemail alert, respond 12–18environment
inventory 66object relationships 52
environment overview 52events 56events tab
troubleshooting 47troubleshooting tab 56using 10
VMware, Inc. 83
Ffilter, alert list 33forecast capacity
custom data centers 81custom profiles 81
forecast hardware capacity 77
Gglossary 5
Hhardware project scenarios 77hardware projects 77hardware projects in your capacity planning 67heat map colors 48heat map details, best performance 49heat maps 48, 50host, workload 50host project scenarios 77host projects 77
Iincrease workload with projects 74intended audience 5inventory
environment overview 66viewing 66
Mmetric groups, host 42metric chart 41metrics charts tab, user scenario 17missing actions 58monitor
alert 31, 32recent tasks 59
monitor objects 7
Oobject
monitor 7searching 8
object alerts tab 38object group, manage alerts 36object relationships, environment 52object symptoms tab, user scenario 14objects comparison 49objects that vRealize Automation manages 58ownership, alert 32
Pplanning, capacity needs 74planning capacity with projects 67
populated metrics for projects 79problems
User Scenario:Analyze the State of YourEnvironment 21
User Scenario:Create a New AlertDefinition 28
User Scenario:Create Dashboards andViews 29
User Scenario:Examine the EnvironmentDetails 23
User Scenario:Examine the EnvironmentRelationships 25
User Scenario:Fix the Problem 27User Scenario:Troubleshoot Problems 21User Scenario:You See Problems as You
Monitor the State of Your Objects 19profiles, for projects 79project, increase workload 74project scenarios
add virtual machines and host 75custom profiles 81hardware 77
project profiles 79projects
add virtual machines and host 75add virtual machine from a profile 79combine results 76hardware 77, 78overview 67planning capacity 67populated metrics 79removing virtual machines 80
Rreading heat maps 48recent tasks
actions 59monitor 59troubleshooting 60–66
recommendation, alert 33recommendations, respond to alert 18relationships tab, user scenario 16resolve, alert 33resource comparison 49respond
alert 12–18alerts 38email alert 12–18
respond to alert, user scenario 12–18respond to problems
User Scenario:Analyze the State of YourEnvironment 21
User Scenario:Create Dashboards andViews 29
vRealize Operations Manager User Guide
84 VMware, Inc.
User Scenario:Create a New AlertDefinition 28
User Scenario:Examine the EnvironmentDetails 23
User Scenario:Examine the EnvironmentRelationships 25
User Scenario:Fix the Problem 27User Scenario:Troubleshoot Problems 21User Scenario:You See Problems as You
Monitor the State of Your Objects 19right-sizing capacity 70
Sscenarios
user calls with a problem 8–10you browse the environment
User Scenario:Analyze the State ofYour Environment 21
User Scenario:Create a New AlertDefinition 28
User Scenario:Create Dashboardsand Views 29
User Scenario:Examine theEnvironment Details 23
User Scenario:Examine theEnvironmentRelationships 25
User Scenario:Fix the Problem 27User Scenario:Troubleshoot
Problems 21User Scenario:You See Problems as
You Monitor the State ofYour Objects 19
scoring stress 70search for object 8setting stress score thresholds 70snapshots, run delete unused action 57sort, alert list 32stress calculations 70stress scoring 70stress-free demand 70stress-free value 70summary tab, using 9, 36suspend, alert 32symptoms tab
troubleshooting 46, 53using 10
symptoms list 53
Ttabs, about 35tasks, monitor 59thresholds for stress score 70timeline 54
timeline tabtroubleshooting 47, 54user scenario 15using 10
troubleshootingactions 57–66all metrics 40, 41, 46events 46, 47recent tasks 60–66symptoms 46timeline 46, 47
User ScenarioTroubleshoot Problems 21Create Dashboards and Views 29Fix the Problem 27Analyze the State of Your
Environment 21Create a New Alert Definition 28Examine the Environment Details 23Examine the Environment
Relationships 25You See Problems as You Monitor
the State of Your Objects 19troubleshooting tab
all metrics tab 10events tab 10symptoms tab 10timeline tab 10user scenario 53using 10
troubleshooting missing actionsactions 58missing actions 58
Uuse 5user scenario
respond to alert 12–18troubleshooting problems 7troubleshooting tab 53User Scenario:Analyze the State of Your
Environment 21User Scenario:Create a New Alert
Definition 28User Scenario:Create Dashboards and
Views 29User Scenario:Examine the Environment
Details 23User Scenario:Examine the Environment
Relationships 25User Scenario:Fix the Problem 27User Scenario:Troubleshoot Problems 21User Scenario:You See Problems as You
Monitor the State of Your Objects 19
Index
VMware, Inc. 85

Vvirtual machine
projects 80shutdown vm action 57
virtual machinesrun delete powered off action 57run power off action 57run set memory action 57run power on action 57run set CPU action 57waste 51
virtual machine projects 78virtual machine sample project, removing virtual
machines sample project 80vRealize Automation and actions 58
Wwaste
across datastores 51in virtual machines 51reclaim datastores 51
What Will Fit, custom profiles 81what-if scenarios, adding new virtual
machines 80workload, host 50workload distribution dashboard, custom data
centers 81worst performance 49
vRealize Operations Manager User Guide
86 VMware, Inc.