Embed Size (px)
Citation preview
METHOD FOR THE DETERMINATION OF
VOLATILE PETROLEUM HYDROCARBONS (VPH)
BY GAS CHROMATOGRAPHY/PHOTOIONIZATION
DETECTOR/FLAME IONIZATION DETECTOR
Massachusetts Department of Environmental Protection
Bureau of Waste Site Cleanup
Commonwealth of Massachusetts
Executive Office of Energy and Environmental Affairs
Matthew A. Beaton
Secretary
Department of Environmental Protection
Martin Suuberg
Commissioner
February 2018
Revision 2.1
Important Notice!
The purpose of this method is to provide data to help characterize the risks posed by petroleum-contaminated media.
Innovative provisions and data adjustment steps are incorporated into the method to ensure that, in most cases, the resultant
data will be moderately (but not overly) conservative (i.e., health protective). It is essential that all of the provisions and
unique procedures in this method are understood and carefully implemented as written. Of particular note are the
following:
Peak Integration Techniques:
For individual Target VPH Analytes, the peaks from the PID are individually integrated (valley to valley). This
applies to samples and standards.
For the collective ranges of aliphatic hydrocarbons (i.e., C5-C8 and C9-C12), the chromatogram from the FID is
continuously integrated (to baseline) between specified range “marker” compounds (e.g., n-pentane to n-nonane for
C5-C8 aliphatic hydrocarbons). This applies to samples only; see Calibration Approach for peak integration
techniques associated with calibration standards.
For the collective range of C9-C10 Aromatic Hydrocarbons, the chromatogram from the PID is continuously
integrated (to baseline) between specified range “marker” compounds (i.e., o-xylene to naphthalene). This
applies to samples only; see Calibration Approach for peak integration techniques associated with calibration
standards.
For the surrogate standard, the peak is individually integrated (valley to valley), so that the area can be subtracted
from the collective areas of the hydrocarbon ranges discussed above. NOTE: if the method recommended
surrogate (2,5-dibromotoluene) is utilized, this subtraction will not be required since this surrogate elutes after all
aliphatic and aromatic compounds of interest.
Calibration Approach:
The calibration factors (CFs) for the aliphatic hydrocarbon ranges are based on the correlation of collective FID
area counts to the collective concentration values of a specified mixture of aliphatic hydrocarbon standards, in
which the collective FID area count is determined via the summation of individual valley-to-valley peaks for the
individual standards.
For the aromatic range (i.e., C9-C10 Aromatic Hydrocarbons), the CF is based on the correlation of the PID area
count of one compound (1,2,4-trimethylbenzene) to the concentration value of this compound, in which the area
count is determined via the individual valley-to-valley peak for this one compound.
As such, the integration procedure for calibration (i.e., valley-to-valley of individual calibration standards) is
different from the integration procedure for samples (i.e., integration to baseline across a specified range of the
FID or PID chromatogram). This is necessary to ensure a conservative bias (i.e., an integration-to-baseline
approach for the calibration standards would incorporate baseline “noise” which could lead to inappropriately
elevated CF values resulting in inappropriately lower sample concentration levels which would not be health-
protective).
Data Adjustments:
A series of steps are specified to calculate the final sample data results, to ensure that these values are not overly
conservative, due to the addition of surrogate standards, and/or the “double counting” of analytes. This involves the
subtraction of area counts and/or the subtraction of media concentration values (i.e., µg/L for aqueous samples or µg/kg for
soil/sediment samples):
When determining the collective area count for a specified hydrocarbon range (i.e., C5-C8 or C9-C12 Aliphatic
Hydrocarbons or C9-C10 Aromatic Hydrocarbons), it is necessary to subtract the individual (valley-to-valley) peak
area of any surrogate standards that elute within that range, if applicable.
The individual PID concentrations of the Target VPH Analytes must be subtracted from the C5 to C8 and C9 to C12
Aliphatic Hydrocarbon FID concentrations, and the PID concentration of C9-C10 Aromatic Hydrocarbons must be
subtracted from the FID concentration of C9-C12 Aliphatic Hydrocarbons.
Significant Updates/Changes in Method Revision 2.1
This method revision (2.1) replaces revision 1.1 of the MassDEP VPH by GC/PID/FID test method, which was issued in
May 2004. These updates and changes are relatively minor in nature, and are summarized below
Technical Revisions:
Section 6.1.1.2: Recommended traps are provided and a requirement has been added to specify the trap used in the
data package. If a different trap is used, the laboratory must perform a trap desorption efficiency study using a neat
gasoline standard and the RPDs of each hydrocarbon range and Target VPH Analyte between the recommended
trap and the trap utilized must be ≤25.
Section 7.5.1: More flexibility was added for the volume of surrogate to be added to aqueous and solid samples.
Section 9.1.2: MassDEP has added in a preference for the use of purge-and-trap autosamplers over manual load
purge-and trap systems.
Section 9.1.2.2: Details regarding the procedures for spiking of surrogates and matrix spike solutions in aqueous
and solid samples prior to purge-and-trap have been added to the method.
Section 9.1.3.7: A caution from the VPH PID/FID CAM Protocol (2010, et seq.) was added to the method
regarding the amount of methanol extract to be added to reagent water. Section 9.3.6 and Table 5: The retention
time windows were updated slightly to be consistent with the new VPH by GC/MS method and the APH method.
o The ending marker for C5-C8 aliphatics is 0.01 minutes before nonane instead of 0.1 minutes.
o The beginning marker for C9-C12 aliphatics is 0.01 minutes before nonane instead of 0.1 minutes.
Section 9.4.2.12: The %RSD for Target VPH Analytes and the surrogate in the initial calibration must be ≤20
(previously was ≤25).
Section 9.4.2.13: A requirement from the VPH PID/FID CAM Protocol (2010, et seq.) was added to the method
regarding the evaluation of the low standard when linear regression is used.
Sections 9.4.2.15 and 10.2.2:
o A requirement from the VPH PID/FID CAM Protocol (2010, et seq.) was added to the method regarding
the analysis of an ICV.
o The ICV acceptance criteria are 70-130% for each Target VPH Analyte and hydrocarbon range (was 80-
120% in the 2010 CAM protocol).
Section 9.4.3.5: The %D for Target VPH Analytes and the surrogate in the continuing calibration must be ≤20
(previously was ≤25).
Section 10.2.6: Details were added regarding appropriate corrective actions when the LCS recoveries are outside
of the acceptance criteria.
Section 10.3.1: Details were added regarding appropriate corrective actions when the matrix duplicate RPDs are
outside of the acceptance criteria.
Section 11.3.1.4: A new significant modification was added regarding the use of non-linear regression during
calibration.
Section 11.3.3: The laboratory is required to include information on the column and trap used in the CAM
deliverable.
Clarifications:
“Important Notice” added at the beginning of the method to clarify proper peak integration during calibration and
sample quantitation and data adjustment steps during sample quantitation.
Sections 9.4.2.7 – 9.4.2.9: clarified that individual peak areas should be utilized for integration during calibration
of the hydrocarbon ranges.
Section 9.6.2: More details were added regarding the quantitation of the hydrocarbon ranges in samples.
Section 11.3.3: Clarification on reporting of re-analyses and dilutions was added.
Appendix 2: Updated chromatograms were added.
Appendix 3:
o Required VPH Data Report form updated to include prompts for the column and trap information.
o MassDEP Analytical Protocol Certification Form updated to include both VPH method options (GC/MS
and PID/FID).
MassDEP VPH by GC/MS
MassDEP has developed and published two analytical testing methods to quantify the concentrations of Volatile Petroleum
Hydrocarbons (VPH) in aqueous and solid matrices. The first VPH method was issued in 1998 and involves the use of in-
series photoionization and flame ionization detectors (PID and FID). This document constitutes the second revision of that
method, which is now referred to as the “VPH by GC/PID/FID” method.
In January 2017, MassDEP issued a second VPH method that involves the use of a mass spectrometer, which s referred to
as the “VPH by GC/MS” method. It is available at https://www.mass.gov/guides/compendium-of-analytical-methods-cam-
massdep-bwsc
For additional information and insights on the origin and implications of the various requirements and biases within these
methods, see “Evaluation of MassDEP Volatile Petroleum Hydrocarbon (VPH) Methods” at http://www.mass.gov/
eea/docs/dep/cleanup/evaluation-of-vph-methods-june-2016.pdf.
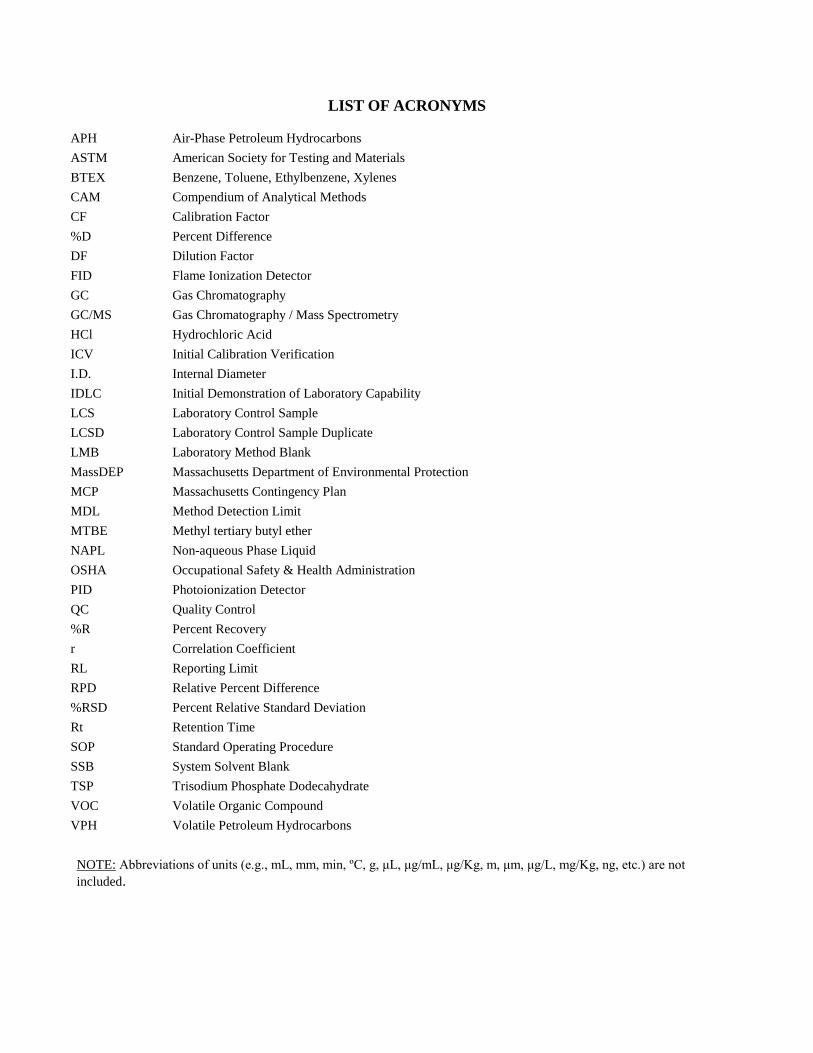
LIST OF ACRONYMS
APH Air-Phase Petroleum Hydrocarbons
ASTM American Society for Testing and Materials
BTEX Benzene, Toluene, Ethylbenzene, Xylenes
CAM Compendium of Analytical Methods
CF Calibration Factor
%D Percent Difference
DF Dilution Factor
FID Flame Ionization Detector
GC Gas Chromatography
GC/MS Gas Chromatography / Mass Spectrometry
HCl Hydrochloric Acid
ICV Initial Calibration Verification
I.D. Internal Diameter
IDLC Initial Demonstration of Laboratory Capability
LCS Laboratory Control Sample
LCSD Laboratory Control Sample Duplicate
LMB Laboratory Method Blank
MassDEP Massachusetts Department of Environmental Protection
MCP Massachusetts Contingency Plan
MDL Method Detection Limit
MTBE Methyl tertiary butyl ether
NAPL Non-aqueous Phase Liquid
OSHA Occupational Safety & Health Administration
PID Photoionization Detector
QC Quality Control
%R Percent Recovery
r Correlation Coefficient
RL Reporting Limit
RPD Relative Percent Difference
%RSD Percent Relative Standard Deviation
Rt Retention Time
SOP Standard Operating Procedure
SSB System Solvent Blank
TSP Trisodium Phosphate Dodecahydrate
VOC Volatile Organic Compound
VPH Volatile Petroleum Hydrocarbons
NOTE: Abbreviations of units (e.g., mL, mm, min, ºC, g, μL, μg/mL, μg/Kg, m, μm, μg/L, mg/Kg, ng, etc.) are not
included.
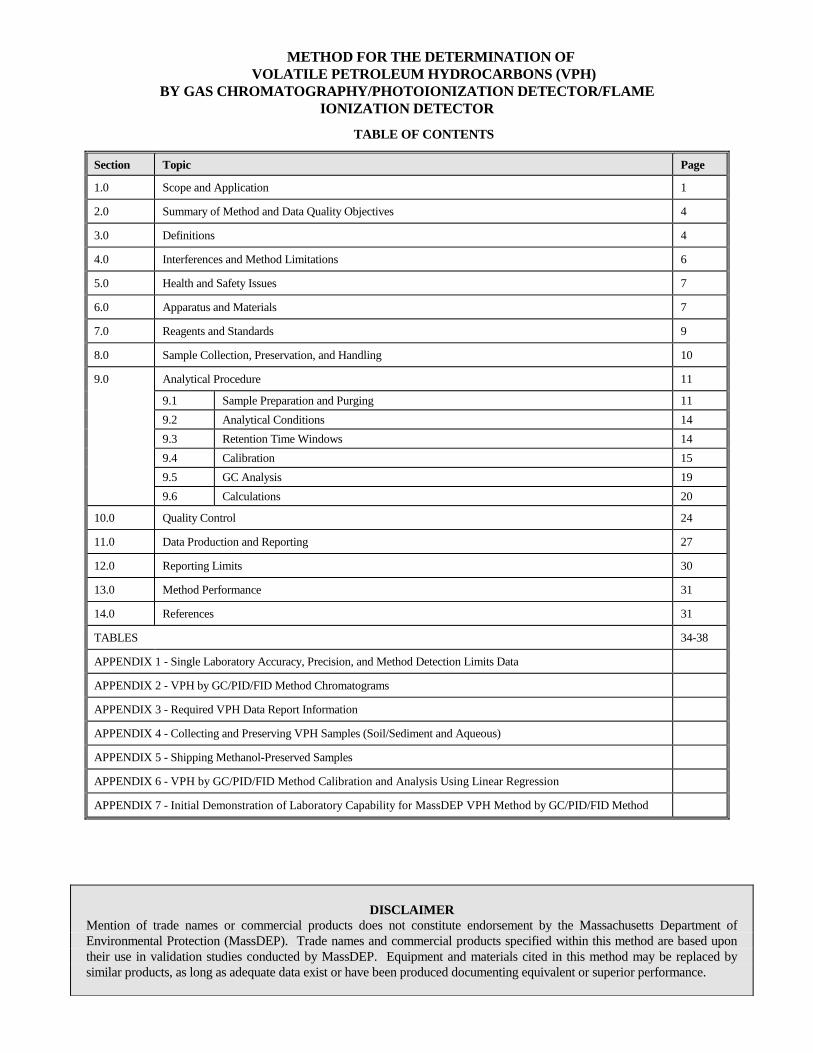
METHOD FOR THE DETERMINATION OF
VOLATILE PETROLEUM HYDROCARBONS (VPH)
BY GAS CHROMATOGRAPHY/PHOTOIONIZATION DETECTOR/FLAME
IONIZATION DETECTOR
TABLE OF CONTENTS
Section Topic Page
1.0 Scope and Application 1
2.0 Summary of Method and Data Quality Objectives 4
3.0 Definitions 4
4.0 Interferences and Method Limitations 6
5.0 Health and Safety Issues 7
6.0 Apparatus and Materials 7
7.0 Reagents and Standards 9
8.0 Sample Collection, Preservation, and Handling 10
9.0 Analytical Procedure 11
9.1 Sample Preparation and Purging 11
9.2 Analytical Conditions 14
9.3 Retention Time Windows 14
9.4 Calibration 15
9.5 GC Analysis 19
9.6 Calculations 20
10.0 Quality Control 24
11.0 Data Production and Reporting 27
12.0 Reporting Limits 30
13.0 Method Performance 31
14.0 References 31
TABLES 34-38
APPENDIX 1 - Single Laboratory Accuracy, Precision, and Method Detection Limits Data
APPENDIX 2 - VPH by GC/PID/FID Method Chromatograms
APPENDIX 3 - Required VPH Data Report Information
APPENDIX 4 - Collecting and Preserving VPH Samples (Soil/Sediment and Aqueous)
APPENDIX 5 - Shipping Methanol-Preserved Samples
APPENDIX 6 - VPH by GC/PID/FID Method Calibration and Analysis Using Linear Regression
APPENDIX 7 - Initial Demonstration of Laboratory Capability for MassDEP VPH Method by GC/PID/FID Method
DISCLAIMER
Mention of trade names or commercial products does not constitute endorsement by the Massachusetts Department of
Environmental Protection (MassDEP). Trade names and commercial products specified within this method are based upon
their use in validation studies conducted by MassDEP. Equipment and materials cited in this method may be replaced by
similar products, as long as adequate data exist or have been produced documenting equivalent or superior performance.
Volatile Petroleum Hydrocarbons by GC/PID/FID Revision 2.1
MassDEP-VPH-18-2.1 Page 1 February 2018
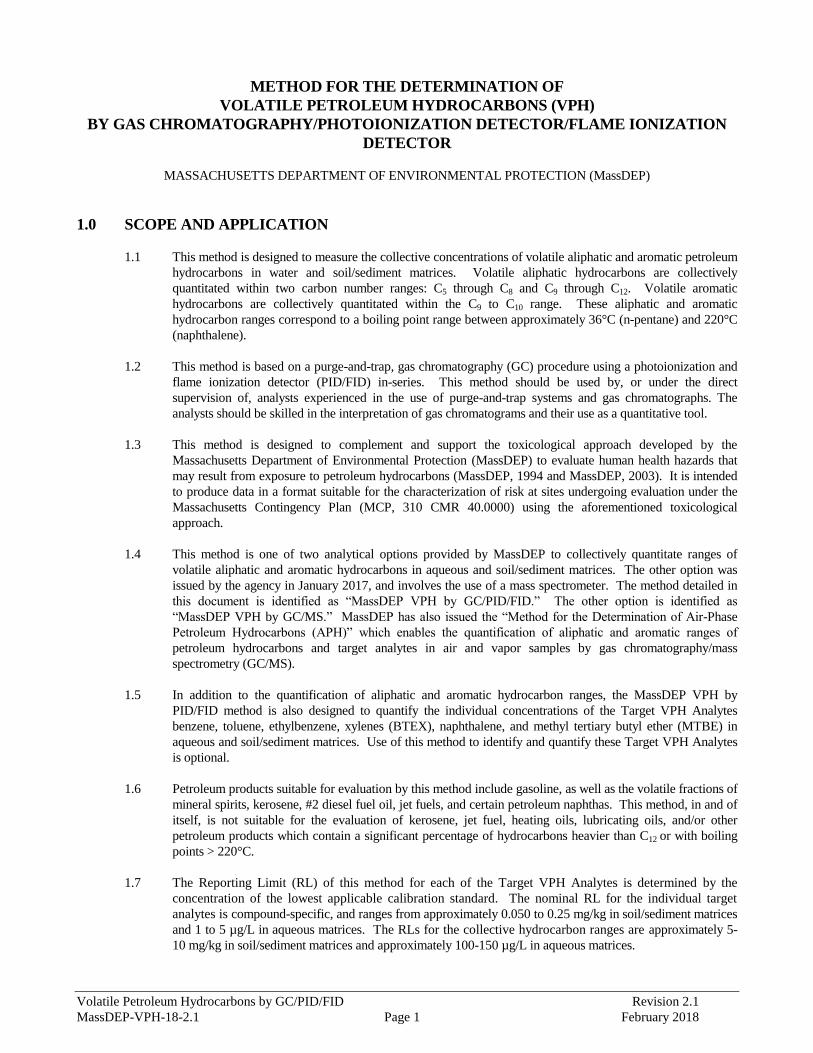
METHOD FOR THE DETERMINATION OF
VOLATILE PETROLEUM HYDROCARBONS (VPH)
BY GAS CHROMATOGRAPHY/PHOTOIONIZATION DETECTOR/FLAME IONIZATION
DETECTOR
MASSACHUSETTS DEPARTMENT OF ENVIRONMENTAL PROTECTION (MassDEP)
1.0 SCOPE AND APPLICATION
1.1 This method is designed to measure the collective concentrations of volatile aliphatic and aromatic petroleum
hydrocarbons in water and soil/sediment matrices. Volatile aliphatic hydrocarbons are collectively
quantitated within two carbon number ranges: C5 through C8 and C9 through C12. Volatile aromatic
hydrocarbons are collectively quantitated within the C9 to C10 range. These aliphatic and aromatic
hydrocarbon ranges correspond to a boiling point range between approximately 36°C (n-pentane) and 220°C
(naphthalene).
1.2 This method is based on a purge-and-trap, gas chromatography (GC) procedure using a photoionization and
flame ionization detector (PID/FID) in-series. This method should be used by, or under the direct
supervision of, analysts experienced in the use of purge-and-trap systems and gas chromatographs. The
analysts should be skilled in the interpretation of gas chromatograms and their use as a quantitative tool.
1.3 This method is designed to complement and support the toxicological approach developed by the
Massachusetts Department of Environmental Protection (MassDEP) to evaluate human health hazards that
may result from exposure to petroleum hydrocarbons (MassDEP, 1994 and MassDEP, 2003). It is intended
to produce data in a format suitable for the characterization of risk at sites undergoing evaluation under the
Massachusetts Contingency Plan (MCP, 310 CMR 40.0000) using the aforementioned toxicological
approach.
1.4 This method is one of two analytical options provided by MassDEP to collectively quantitate ranges of
volatile aliphatic and aromatic hydrocarbons in aqueous and soil/sediment matrices. The other option was
issued by the agency in January 2017, and involves the use of a mass spectrometer. The method detailed in
this document is identified as “MassDEP VPH by GC/PID/FID.” The other option is identified as
“MassDEP VPH by GC/MS.” MassDEP has also issued the “Method for the Determination of Air-Phase
Petroleum Hydrocarbons (APH)” which enables the quantification of aliphatic and aromatic ranges of
petroleum hydrocarbons and target analytes in air and vapor samples by gas chromatography/mass
spectrometry (GC/MS).
1.5 In addition to the quantification of aliphatic and aromatic hydrocarbon ranges, the MassDEP VPH by
PID/FID method is also designed to quantify the individual concentrations of the Target VPH Analytes
benzene, toluene, ethylbenzene, xylenes (BTEX), naphthalene, and methyl tertiary butyl ether (MTBE) in
aqueous and soil/sediment matrices. Use of this method to identify and quantify these Target VPH Analytes
is optional.
1.6 Petroleum products suitable for evaluation by this method include gasoline, as well as the volatile fractions of
mineral spirits, kerosene, #2 diesel fuel oil, jet fuels, and certain petroleum naphthas. This method, in and of
itself, is not suitable for the evaluation of kerosene, jet fuel, heating oils, lubricating oils, and/or other
petroleum products which contain a significant percentage of hydrocarbons heavier than C12 or with boiling
points > 220°C.
1.7 The Reporting Limit (RL) of this method for each of the Target VPH Analytes is determined by the
concentration of the lowest applicable calibration standard. The nominal RL for the individual target
analytes is compound-specific, and ranges from approximately 0.050 to 0.25 mg/kg in soil/sediment matrices
and 1 to 5 µg/L in aqueous matrices. The RLs for the collective hydrocarbon ranges are approximately 5-
10 mg/kg in soil/sediment matrices and approximately 100-150 µg/L in aqueous matrices.
Volatile Petroleum Hydrocarbons by GC/PID/FID Revision 2.1
MassDEP-VPH-18-2.1 Page 2 February 2018
1.8 This method includes a series of data adjustment steps to determine the concentrations of the collective
aliphatic and aromatic hydrocarbon ranges of interest. These steps may be taken by the laboratory or by
the data user.
1.9 Data reports produced using this method must contain all of the information presented in Appendix 3.
The format of these reports is left to the discretion of the individual laboratories (but must include the
same certification statement presented in the aforementioned Appendix and must be provided in a clear,
concise, and succinct manner). However, the format of the Laboratory Certification must follow the
format presented in Appendix 3.
1.10 Like all GC procedures, this method is subject to a "false positive" bias in the reporting of Target VPH
Analytes, in that non-targeted hydrocarbon compounds eluting or co-eluting within a specified retention
time window may be falsely identified and/or quantified as a Target VPH Analyte. Confirmatory analysis
by a GC/MS procedure or other suitable method is recommended in cases where a Target VPH Analyte
reported by this method exceeds an applicable reporting or cleanup standard, and/or where co-elution of a
non-targeted hydrocarbon compound is suspected.
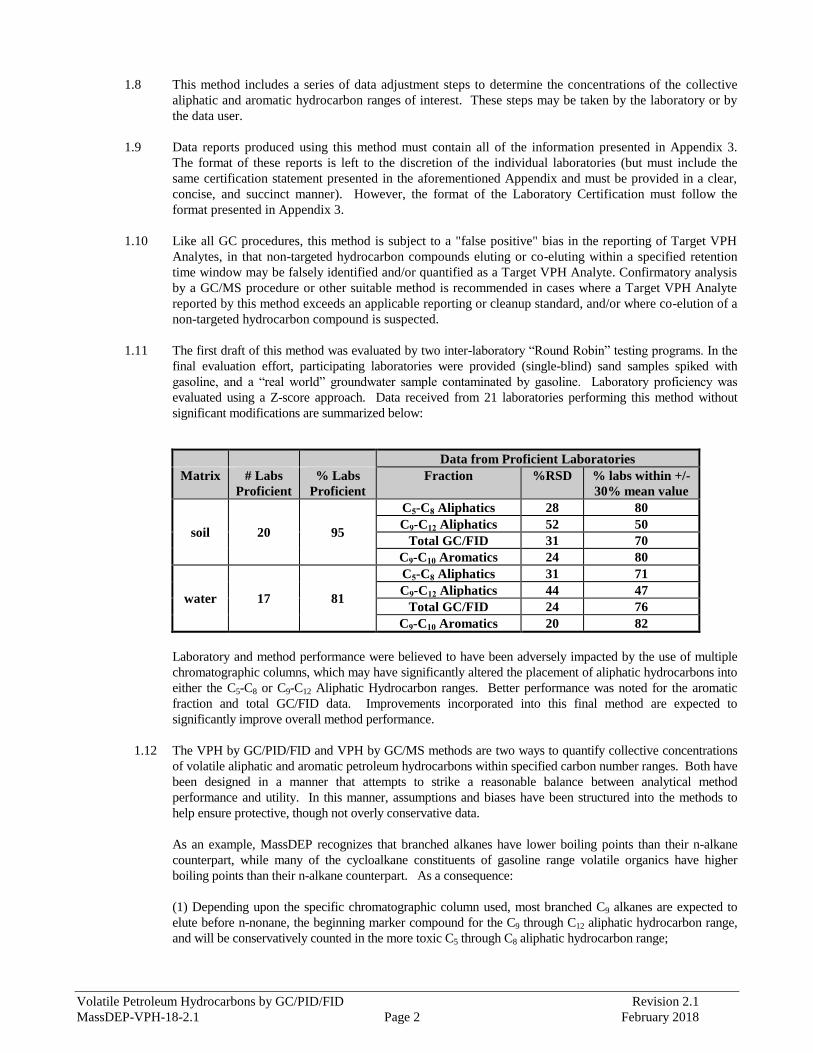
1.11 The first draft of this method was evaluated by two inter-laboratory “Round Robin” testing programs. In the
final evaluation effort, participating laboratories were provided (single-blind) sand samples spiked with
gasoline, and a “real world” groundwater sample contaminated by gasoline. Laboratory proficiency was
evaluated using a Z-score approach. Data received from 21 laboratories performing this method without
significant modifications are summarized below:
Data from Proficient Laboratories
Matrix # Labs
Proficient
% Labs
Proficient
Fraction %RSD % labs within +/-
30% mean value
soil 20 95
C5-C8 Aliphatics 28 80
C9-C12 Aliphatics 52 50
Total GC/FID 31 70
C9-C10 Aromatics 24 80
water 17 81
C5-C8 Aliphatics 31 71
C9-C12 Aliphatics 44 47
Total GC/FID 24 76
C9-C10 Aromatics 20 82
Laboratory and method performance were believed to have been adversely impacted by the use of multiple
chromatographic columns, which may have significantly altered the placement of aliphatic hydrocarbons into
either the C5-C8 or C9-C12 Aliphatic Hydrocarbon ranges. Better performance was noted for the aromatic
fraction and total GC/FID data. Improvements incorporated into this final method are expected to
significantly improve overall method performance.
1.12 The VPH by GC/PID/FID and VPH by GC/MS methods are two ways to quantify collective concentrations
of volatile aliphatic and aromatic petroleum hydrocarbons within specified carbon number ranges. Both have
been designed in a manner that attempts to strike a reasonable balance between analytical method
performance and utility. In this manner, assumptions and biases have been structured into the methods to
help ensure protective, though not overly conservative data.
As an example, MassDEP recognizes that branched alkanes have lower boiling points than their n-alkane
counterpart, while many of the cycloalkane constituents of gasoline range volatile organics have higher
boiling points than their n-alkane counterpart. As a consequence:
(1) Depending upon the specific chromatographic column used, most branched C9 alkanes are expected to
elute before n-nonane, the beginning marker compound for the C9 through C12 aliphatic hydrocarbon range,
and will be conservatively counted in the more toxic C5 through C8 aliphatic hydrocarbon range;
Volatile Petroleum Hydrocarbons by GC/PID/FID Revision 2.1
MassDEP-VPH-18-2.1 Page 3 February 2018
(2) Depending upon the specific chromatographic column used, most branched C5 alkanes will elute before
n-pentane, the beginning marker compound for the C5 through C8 aliphatic hydrocarbon range, and will
therefore not be counted in the C5 through C8 aliphatic hydrocarbon range; and
(3) Depending upon the specific chromatographic column used, most cycloalkanes within the C5 through C8
and C9 through C12 aliphatic hydrocarbon ranges will be counted within their proper range with the exception
of some C12 cycloalkanes which will elute after naphthalene, the end marker compound for the C9 through
C12 aliphatic hydrocarbon range.
Based on the nature of petroleum releases encountered in the environment, the collective concentrations of
the volatile aliphatic ranges as measured by the VPH Methods are considered to be suitable for the evaluation
of the risks posed by these releases, consistent with the toxicological approach developed by MassDEP to
evaluate human health hazards that may result from exposure to petroleum hydrocarbons (MassDEP, 1994
and MassDEP, 2003).
1.13 There may be better, more accurate, and/or less conservative ways to produce Target VPH Analyte and
hydrocarbon range data. MassDEP encourages methodological innovations that (a) better achieve method
and/or data quality objectives, (b) increase analytical precision and accuracy, (c) reduce analytical
uncertainties and expenses, and/or (d) reduce the use of toxic solvents and generation of hazardous wastes.
All significant modifications to this method, however, must be disclosed and described on the data report
form, as detailed in Section 11.3 and the MassDEP Analytical Protocol Certification Form (See Appendix 3,
Exhibit 2, Question E). Laboratories that make such modifications, and/or develop and utilize alternative
approaches and methods, are further required to demonstrate that:
Such modifications or methodologies adequately quantify the petroleum hydrocarbon ranges, as defined
in Sections 3.6 through 3.8 of this document, ensuring that any methodological uncertainties or biases
are addressed in a manner that ensures protective (i.e., conservative) results and data (e.g., over, not
under-quantification of the more toxic ranges);
Such modifications and/or methodologies employ and document initial method demonstration and
ongoing quality control (QC) procedures consistent with approaches detailed in the MassDEP
Compendium of Analytical Methods (CAM); and
Such methods and procedural modifications are fully documented in a detailed standard operating
procedure (SOP).
1.14 Additional information and details on the MassDEP VPH approach are available at
http://www.mass.gov/dep/cleanup/laws/policies.htm#vph.
1.15 This method should be used in conjunction with the current version of CAM IV A, “Quality Control
Requirements and Performance Standards for the Analysis of Volatile Petroleum Hydrocarbons (VPH) by
Gas Chromatography/Photoionization Detector/Flame Ionization Detector in Support of Response Actions
Under the Massachusetts Contingency Plan (MCP)”. WSC-CAM-IV A was developed by MassDEP to
complement this MassDEP VPH by GC/PID/FID Method and to provide more detailed guidance
regarding compliance with the QC requirements and performance standards of the MassDEP VPH by
GC/PID/FID Method.
Volatile Petroleum Hydrocarbons by GC/PID/FID Revision 2.1
MassDEP-VPH-18-2.1 Page 4 February 2018
2.0 SUMMARY OF METHOD AND DATA QUALITY OBJECTIVES
2.1 Samples are analyzed using purge-and-trap sample concentration. The GC is temperature programmed to
facilitate separation of the individual compounds and hydrocarbon ranges of interest on a capillary column.
All compounds are detected using a PID and FID in series. Quantitation is based on comparing the PID and
FID response of a sample to a standard comprised of aromatic and aliphatic hydrocarbons. The PID
chromatogram is used to determine the individual concentrations of Target VPH Analytes
(BTEX/MTBE/naphthalene) and collective concentration of aromatic hydrocarbons within the C9 through
C10 range. The FID chromatogram is used to determine the collective concentration of aliphatic
hydrocarbons within the C5 through C8 and C9 through C12 ranges.
2.2 This method is suitable for the analysis of aqueous samples, soils, sediments, wastes, sludges, and non-
aqueous phase liquid (NAPL) samples. However, it should be noted that the method was validated only for
soil and aqueous matrices. Aqueous samples may be analyzed directly for VPH by purge-and-trap
concentration and GC/PID/FID. Soil/sediment samples are dispersed in methanol to dissolve the volatile
organic constituents. An aliquot of the methanol extract is then analyzed by purge-and-trap concentration
and GC/PID/FID.
2.3 This method is based on (1) USEPA Methods 5030B, 5035A, 8000D, 8015C, and 8021B, SW-846, "Test
Methods for Evaluating Solid Wastes," (2) Draft "Method for Determination of Gasoline Range Organics,"
EPA UST Workgroup, November, 1990; and (3) "Modified GRO Method for Determining Gasoline Range
Organics," Wisconsin Department of Natural Resources, PUBL-SW-140, 1992.
2.4 Data Quality Objectives should be developed and applied for sampling and analytical efforts involving the
use of this method. Key parameters of interest include: (a) the acceptability of RLs achievable by the
laboratory for the contaminants of interest and (b) the identification and reporting of target analytes.
3.0 DEFINITIONS
3.1 Aliphatic Hydrocarbons are defined as acyclic or cyclic, saturated or unsaturated compounds that
contain only carbon and hydrogen atoms, excluding aromatic compounds.
3.2 Aromatic Hydrocarbons are defined as compounds whose structures include a cyclic structure and a
closed conjugated system of double bonds containing only carbon and hydrogen atoms.
3.3 Analytical Batch is defined as a group of field samples with similar matrices which are processed as a unit.
For QC purposes, if the number of samples in such a group is greater than 20, then each group of 20 samples
or less is defined as a separate analytical batch.
3.4 Calibration Standards are defined as a series of standard solutions prepared from dilutions of a stock
standard solution, containing known concentrations of each analyte and surrogate compound of interest.
3.5 Continuing Calibration Standard is defined as a calibration standard used to periodically check the
calibration state of an instrument. The continuing calibration standard is prepared from the same stock
solution as calibration standards, and is generally one of the mid-level range calibration standard dilutions.
3.6 C5 through C8 Aliphatic Hydrocarbons are defined as all aliphatic petroleum hydrocarbon compounds that
elute from just before n-pentane (C5) to just before n-nonane (C9). C5 through C8 aliphatic hydrocarbons are
determined using the FID.
3.7 C9 through C12 Aliphatic Hydrocarbons are defined as all aliphatic petroleum hydrocarbon compounds
that elute from just before n-nonane (C9) to just before naphthalene. C9 through C12 aliphatic hydrocarbons
are determined using the FID.
3.8 C9 through C10 Aromatic Hydrocarbons are defined as all aromatic petroleum hydrocarbon compounds
that elute from just after o-xylene to just before naphthalene; therefore this range will include any unsaturated
hydrocarbons (e.g., alkenes, alkynes, carbonyls, ethers, etc.). Although naphthalene is an aromatic compound
Volatile Petroleum Hydrocarbons by GC/PID/FID Revision 2.1
MassDEP-VPH-18-2.1 Page 5 February 2018
with 10 carbon atoms, it is excluded from this range because it is evaluated as a separate Target VPH
Analyte. C9 through C10 aromatic hydrocarbons are determined using the PID.
3.9 Field Duplicates are defined as two separate samples collected at the same time and place under identical
circumstances and managed the same throughout field and laboratory procedures. Analyses of field
duplicates give a measure of the precision associated with sample collection, preservation, and storage, as
well as laboratory procedures.
3.10 Laboratory Control Sample (LCS) is defined as a reagent water blank (when associated with aqueous
samples) or clean methanol blank (when associated with soil/sediment samples) fortified with the matrix
spiking solution. The LCS is prepared and analyzed in the same manner as a sample and its purpose is to
determine the bias of the analytical method.
3.11 Laboratory Control Sample Duplicate (LCSD) is defined as a reagent water blank (when associated with
aqueous samples) or clean methanol blank (when associated with soil/sediment samples) fortified with the
matrix spiking solution. The LCSD is prepared separately from the LCS but is prepared and analyzed in the
same manner as the LCS. The purpose of LCS duplicates is to determine the bias and precision of the
analytical method.
3.12 Laboratory Method Blank (LMB) is defined as an aliquot of reagent water (when associated with aqueous
samples) or clean methanol (when associated with soil/sediment samples) spiked with a surrogate standard.
The laboratory method blank is prepared and analyzed in the same manner as a sample, exposed to all
glassware, solvents, reagents, and equipment. A laboratory method blank is analyzed with every batch of
samples, to determine if method analytes or other interferences are present in the laboratory environment,
reagents, or equipment.
3.13 Matrix Duplicates are defined as split samples prepared and analyzed separately with identical procedures.
For soil/sediment samples, matrix duplicate samples are taken from the same sampling container. For
aqueous samples, a separate container is used for the matrix duplicate sample. The analysis of matrix
duplicates gives a measure of the precision associated with laboratory procedures, but not with sample
collection, preservation, or storage procedures.
3.14 Matrix Spike Sample is defined as an environmental sample which has been spiked with a matrix spiking
solution containing known concentrations of method analytes. The purpose of the matrix spike sample is to
determine whether the sample matrix contributes bias to the analytical results. The background
concentrations of the analytes in the sample matrix must be determined through the separate analysis of an
unspiked sample aliquot. The measured values in the matrix spike sample must be corrected for background
concentrations when calculating recoveries of spiked analytes.
3.15 Matrix Spiking Solution is defined as a solution prepared from a separate source than used for the
calibration standards, containing known concentrations of method analytes.
3.16 System Solvent Blank (SSB) is defined as an aliquot of organic-free water (American Society for Testing
and Materials [ASTM] Type I reagent grade) and purge-and-trap grade, or equivalent, methanol. For
aqueous samples 4.0 uL of methanol is mixed with 5.0 mL of water and for soil/sediment samples 100 uL
of methanol is mixed with 4.9 mL of water. The SSB is analyzed in the same manner as a sample, exposed
to all glassware, solvents, reagents, and equipment. Surrogates must not be spiked into SSBs. An SSB
provides one way of determining the level of noise and baseline rise attributable solely to the analytical
system, in the absence of any other analytes or non-analytical related contaminants.
3.17 Target VPH Analytes are defined as benzene, toluene, ethylbenzene, m-xylene, p-xylene, o-xylene,
naphthalene, and MTBE.
3.18 Unadjusted C5 through C8 Aliphatic Hydrocarbons are defined as all petroleum hydrocarbon compounds
which elute on the FID chromatogram from n-pentane (C5) to just before n-nonane (C9).
Volatile Petroleum Hydrocarbons by GC/PID/FID Revision 2.1
MassDEP-VPH-18-2.1 Page 6 February 2018
3.19 Unadjusted C9 through C12 Aliphatic Hydrocarbons are defined as all petroleum hydrocarbon compounds
which elute on the FID chromatogram from just before n-nonane (C9) to just before naphthalene.
3.20 Volatile Petroleum Hydrocarbons (VPH) are defined as collective fractions of hydrocarbon compounds
eluting from n-pentane to just before naphthalene, excluding Target VPH Analytes. VPH is comprised of C5
through C8 Aliphatic Hydrocarbons, C9 through C12 Aliphatic Hydrocarbons, and C9 through C10 Aromatic
Hydrocarbons.
3.21 Volatile Petroleum Hydrocarbon (VPH) Component Standard is defined as a 15 component mixture of
the aliphatic and aromatic compounds and one surrogate listed in Table 1. The compounds comprising the
VPH Component Standard are used to (a) define the individual retention times and calibration factors for
each of the Target VPH Analytes, (b) define and establish the retention time windows for the collective
aliphatic and aromatic hydrocarbon ranges of interest, and (c) determine average calibration factors or
generate calibration curves that can in turn be used to calculate the collective concentrations of hydrocarbons
within these ranges.
3.22 All other terms are as defined in the most current version of SW-846, "Test Method for Evaluating Solid
Waste," USEPA.
4.0 INTERFERENCES AND METHOD LIMITATIONS
4.1 Samples can become contaminated by diffusion of volatile organics through the sample container septum
during shipment and storage or by dissolution of volatiles into the methanol used for preservation. Trip
blanks prepared from both reagent water (when associated with aqueous samples) and methanol (when
associated with soil/sediment samples) should be carried through sampling and subsequent storage and
handling to serve as a check on such contamination.
4.2 Cross-contamination can occur whenever a low-concentration sample is analyzed immediately after a high-
concentration sample. To reduce carryover, the sample syringe and/or purging device must be rinsed
between samples with reagent water or solvent. For volatile samples containing high concentrations of water-
soluble materials, suspended solids, high boiling-point compounds or organohalides, it may be necessary to
wash the syringe or purging device with a detergent solution, rinse with distilled water, and then dry in an
oven at 105°C between analyses. The trap and other parts of the system are also subject to contamination;
therefore, frequent bake-out and purging of the entire system may be required. A screening step is
recommended to protect analytical instrumentation. Whenever an unusually concentrated sample is
encountered, it must be followed by the analysis of an SSB or LMB to check for cross-contamination.
However, due to the potential for samples to be analyzed using an autosampler, the ability to perform this
blank analysis may not always be possible. If the sample analyzed immediately after the unusually
concentrated sample is free from contamination, then the assumption can be made that carryover or cross-
contamination is not an issue. However, if this sample did detect analytes which were present in the
unusually concentrated sample, reanalysis is required for all samples analyzed after this highly concentrated
sample which detected similar analytes.
4.3 The response selectivity of a PID is used in this method to differentiate aromatic hydrocarbons from aliphatic
hydrocarbons. All compounds eluting on the PID chromatogram after o-xylene are identified by the method
as aromatic hydrocarbons. This will lead to an overestimation of aromatic hydrocarbons within samples, as
certain aliphatic compounds will elicit a response on the PID, particularly unsaturated compounds such as
alkenes. The significance and implications of this overestimation will vary from sample to sample; where
less conservative data are desired, additional actions should be considered to minimize the detection of non-
aromatic compounds, including the use of a lower energy PID lamp and/or an alternative chromatographic
column.
4.4 Certain organic compounds not associated with the release of petroleum products including chlorinated
solvents, ketones, and ethers may be detected by this method and may contribute to the collective response
quantified within an aliphatic or aromatic hydrocarbon range.
Volatile Petroleum Hydrocarbons by GC/PID/FID Revision 2.1
MassDEP-VPH-18-2.1 Page 7 February 2018
5.0 HEALTH AND SAFETY ISSUES
The toxicity and carcinogenicity of each reagent used in this method have not been precisely defined. However, each
chemical compound should be treated as a potential health hazard. From this viewpoint, exposure to these chemicals
must be reduced to the lowest possible level by whatever means available. The laboratory is responsible for
maintaining a current file of Occupational Safety & Health Administration (OSHA) regulations regarding the safe
handling of the chemicals specified in this method. A reference file of safety data sheets should also be made available
to all personnel involved in the chemical analysis.
6.0 APPARATUS AND MATERIALS
6.1 Purge-and-Trap System
6.1.1 The purge-and-trap system consists of a sample purging chamber, a concentrating trap, and a
thermal desorber. Complete systems are available commercially.
6.1.1.1 The purging chamber must be designed to accept 5 mL samples with a water column at
least 3 cm deep. Purging devices larger than 5 mL have a reduced purging efficiency
and should not be used. The gaseous headspace between the water column and the trap
must have a total volume of less than 15 mL. The purge gas must pass through the
water column as finely divided bubbles with a diameter of less than 3 mm at the origin.
Fritted glass or needle sparge cells may be used. If needle sparge cells are used, the
purge gas must be introduced no more than 5 mm from the base of the water column.
Alternate sample purging devices may be used, provided an equivalent performance is
demonstrated.
6.1.1.2 The recommended trap should be at least 25 cm long and have an inside diameter of at
least 0.105 inches. The trap should be packed with 400 mg of Carbopack B (Supelco
Cat. No. 2-0273). Alternative trap packing materials include: 7.6 cm Carbopack B and
1.3 cm Carbosieve S-III (Supelco Cat No. 2-0321); or 7.7 cm Carbopack C and 1.2 cm
Carbopack B (Supelco Cat No. 2-1064). In general, Carbopack trap packing materials
are recommended because they have less of a tendency to retain methanol, which could
interfere with the elution of pentane and quench the FID flame. The recommended trap
length and packing materials may be varied as long as equivalent performance (i.e.,
meeting QC criteria of method) has been verified.
NOTE: Based upon data obtained from the MassDEP VPH by GC/MS Method
Round Robin testing program, the choice of traps may have a significant impact on
the quantification of aliphatic and aromatic compounds within the collective
hydrocarbon ranges specified in the method, specifically the heavier boiling point
components. It must be demonstrated that the selected trap has equivalent properties
for the efficient desorption of the aliphatic and aromatic compounds and ranges of
interest. In all cases, the laboratory must specify the trap used in the data package
(see Appendix 3).
To demonstrate equivalency of trap desorption efficiency, a neat gasoline standard
must be analyzed using a trap with the recommended packing materials and the proposed
substitute trap, with all other run and system parameters held constant. The concentrations
of C5-C8 and C9-C12 aliphatic hydrocarbons, C9-C10 aromatic hydrocarbon ranges, and
Target VPH Analytes must be determined for each trap. The relative percent differences
(RPDs) between the concentrations of each hydrocarbon range and Target VPH Analyte
obtained from each trap must be < 25.
6.1.1.3 The traps should be conditioned and desorbed according to the manufacturer’s guidelines.
The trap may be vented to the analytical column during daily conditioning; however, the
column must be run through the temperature program prior to analysis of samples.
Volatile Petroleum Hydrocarbons by GC/PID/FID Revision 2.1
MassDEP-VPH-18-2.1 Page 8 February 2018
6.1.1.4 The desorber should be capable of rapidly heating the trap to the temperature
recommended by the trap manufacturer prior to the beginning of the flow of desorption
gas.
6.2 Gas Chromatograph System
6.2.1 An analytical system complete with a temperature programmable GC for use with a capillary
column is required.
6.2.2 Chromatographic Column: The required column is: 105 m x 0.53 mm internal diameter (I.D.)
Restek RTX-502.2 with 3 micron film thickness, or column with equivalent chromatographic
properties.
NOTE: Based upon data obtained from the MassDEP VPH by GC/PID/FID Method Round
Robin testing programs, the choice of chromatographic column may have a significant impact
on the apportionment and quantitation of aliphatic and aromatic compounds within the
collective hydrocarbon ranges specified in this method. Substitution of the required column is
not allowed, unless it can be demonstrated that the selected column has equivalent
chromatographic properties and elution order for the aliphatic and aromatic compounds and
ranges of interest. In all cases the laboratory must specify the column used in the data
package (see Appendix 3).
To demonstrate equivalency of column chromatography, a neat gasoline standard must be
analyzed on both the required column and the proposed substitute column, with all other run and
system parameters held constant. The concentrations of C5-C8 and C9-C12 aliphatic hydrocarbons,
C9-C10 aromatic hydrocarbons, and Target VPH Analytes must be determined for each column (in
which the PID concentrations of the Target VPH Analytes have been subtracted from the FID
concentrations of the aliphatic hydrocarbon ranges). The RPDs between the concentrations of each
hydrocarbon range and Target VPH Analyte obtained from each column must be < 25. The elution
order of VPH components on the proposed substitute column must be equivalent to the elution
order on the required column.
6.3 Detectors
6.3.1 The method requires the use of a PID in series with a FID; the PID first in the series. The method is
based upon the use of a 10.0 +/- eV PID lamp, although lower energy lamps are permissible in order
to minimize PID response to aliphatic compounds. In lieu of an in-series arrangement, in-parallel
PID and FID units may be also used if the RL for the method is not adversely affected.
6.3.2 A data station is required that is capable of storing and reintegrating chromatographic data and
capable of determining peak areas using a forced baseline projection.
6.4 The following glassware is used in this method:
6.4.1 VOC Vials: Wide mouth 60-mL VOC vials or 40-mL VOC vials with Teflon/silicone septa for
soil/sediment matrices; 40-mL VOC vials with Teflon/silicone septa for aqueous matrices.
6.4.2 Class “A” Volumetric flasks: 10-mL, 50-mL, 100-mL, and 1,000-mL with ground-glass stoppers.
6.5 Analytical balance: An analytical balance capable of accurately weighing 0.0001 g must be used for
weighing standards, if required. A top-loading balance capable of weighing to the nearest 0.1 g must be used
for weighing soil/sediment samples.
6.6 Ultrasonic bath.
6.7 Disposable pipets: Pasteur.
Volatile Petroleum Hydrocarbons by GC/PID/FID Revision 2.1
MassDEP-VPH-18-2.1 Page 9 February 2018
6.8 Syringes: 5-mL Luerlock glass hypodermic and 5-mL gas-tight syringe with shutoff valve.
6.9 Syringe valve: Two-way, with luer-lock connections.
6.10 Microsyringes: 1-µL, 5-µL, 10-µL, 25-µL, 100-µL, 250-µL, 500-µL, and 1,000-µL.
6.11 Spatula: Stainless steel.
6.12 Drying oven.
6.13 Dessicator.
7.0 REAGENTS AND STANDARDS
7.1 Reagents
7.1.1 Reagent Water: organic-free water (ASTM Type I reagent grade water).
7.1.2 Solvent: methanol; purge-and-trap grade or equivalent. Store away from other solvents.
7.2 Stock Standard Solution
Prepare stock standard solutions in methanol at approximately 10 micrograms per microliter (µg/µL), or
purchase certified solutions. Preparation of stock standards and component standards should be done
using volumetric glassware. The stock standard solution consists of the aliphatic and aromatic range
calibration compounds and Target VPH Analytes listed in Table 1. A separate stock standard solution
containing only the surrogate must be prepared. Transfer the stock standard solution into a Teflon-lined
screw-cap or crimp cap bottle. Store, with minimal headspace, at -10°C to -20°C and protect from light.
Stock standard solutions must be replaced after 6 months, or sooner if comparison with check standards
indicates a problem.
7.3 Primary Dilution Standard
Using the stock standard solutions, prepare primary dilution standards in methanol, as needed. The primary
dilution standards should be prepared at 100 µg/mL. These standards should be stored with minimal
headspace, at -10°C to -20°, and should be checked frequently for signs of degradation or evaporation. The
primary dilution standards should be replaced at least monthly.
7.4 VPH Calibration Standards
Prepare VPH Calibration standards in reagent water from the primary dilution standards (in methanol). At a
minimum, five different concentrations are required for a valid calibration curve. The calibration
concentrations must be evenly dispersed over the full working range of the detector with the lowest
calibration point corresponding to the RL. The highest concentration defines the maximum upper working
range of the calibration curve. Target VPH analytes may not be reported above this concentration without
sample dilution. Tables 2a and 2b provide recommended concentrations for each calibration standard for a
5-point initial calibration of hydrocarbon ranges, Target VPH Analytes, and the surrogate.
Aqueous standards are not stable and should be discarded after one hour.
7.5 Surrogate Standard
The analyst must monitor both the performance of the analytical system and the effectiveness of the method
in dealing with sample matrices by spiking each sample, LMB, LCS, LCSD, and matrix spike with a
surrogate standard. The surrogate standard is included in the VPH calibration standards. The recommended
surrogate standard is 2,5-dibromotoluene, which elutes after all aliphatic and aromatic compounds of interest.
Volatile Petroleum Hydrocarbons by GC/PID/FID Revision 2.1
MassDEP-VPH-18-2.1 Page 10 February 2018
However, other surrogates may be used as long as they are adequately resolved from the components of
interest.
7.5.1 Recommended Surrogate Spiking Solution: From a stock standard solution, prepare a surrogate
spiking solution in methanol. Add a specified volume (recommended 5-10 µl) of this surrogate
spiking solution directly into the 5-mL syringe with every aqueous sample, LMB, LCS, LCSD, and
matrix spike in order to yield a final concentration of 50 µg/L. Add a specified volume
(recommended not to exceed 1.0 mL) of the surrogate spiking solution to soil/sediment samples
during the extraction step (See Section 9.1.3.2) in order to yield a final concentration of 2.5 mg/kg
(or 50 µg/L on column). The use of higher concentrations is permissible and advisable when
spiking highly contaminated samples.
7.6 Matrix Spiking Solution
The recommended matrix spiking solution, consisting of the full analyte list (VPH Component Standard),
is prepared in methanol at a nominal concentration of 50 µg/mL.
7.7 Petroleum Reference Standard (To demonstrate equivalency of column chromatography and trap desorption
efficiency)
The Petroleum Reference Standard consists of an API or commercial gasoline standard. Prepare Petroleum
Reference Standard spiking solutions by accurately weighing approximately 0.0100 g of neat product.
Dissolve the neat product in methanol and dilute to volume in a 100-mL volumetric flask.
8.0 SAMPLE COLLECTION, PRESERVATION, AND HANDLING
8.1 Aqueous Samples
8.1.1 Aqueous samples should be collected in triplicate (or the number of vials directed by the laboratory)
without agitation and without headspace in contaminant-free 40 mL glass VOC vials with Teflon-
lined septa screw caps. The Teflon liner must contact the sample. All samples must be chemically
preserved as follows (based on the laboratory’s purge-and-trap system setup).
a. Samples analyzed with ambient purge temperature: Samples must be acidified to a pH of 2.0 or
less at the time of collection. This can generally be accomplished by adding 3 or 4 drops (0.1
to 0.2 mL) of 1:1 hydrochloric acid (HCl) (1 part reagent water and 1 part concentrated HCl) to
a 40-mL sample vial prior to collection. Samples must be cooled to 0-6°C immediately after
collection.
b. Samples analyzed with heated purge temperature: Samples must be treated to a pH of 11.0 or
greater at the time of collection. This can be accomplished by adding 0.40 to 0.44 grams of
trisodium phosphate dodecahydrate (TSP) to a 40-mL sample vial prior to collection. Samples
must be cooled to 0-6°C immediately after collection.
8.1.2 A chain-of-custody form must accompany all sampling vials and must document the date and time
of sample collection and preservation method used. The pH of all water samples must be
determined by the laboratory after sample analysis has been completed. The pH measurement may
be performed on leftover sample. Any acid-preserved sample found to contain a pH above 2 must
be so noted on the laboratory/data report sheet. Any TSP-preserved sample found to contain a pH
<11 must be so noted on the laboratory data report sheet. Additional details and recommendations
on aqueous sample preservation are provided in Appendix 4.
8.1.3 A reagent water trip blank, preserved in the same manner as the samples, should accompany each
batch of water samples. Refer to WSC-CAM-VII A for the required frequency of trip blanks.
8.1.4 Any sample received by the laboratory that is not packed in ice or cooled to 0-6°C must be so noted
on the laboratory/data report sheet. The temperature of the cooler must be recorded by the
laboratory upon receipt.
Volatile Petroleum Hydrocarbons by GC/PID/FID Revision 2.1
MassDEP-VPH-18-2.1 Page 11 February 2018
8.1.5 Aqueous samples must be analyzed within 14 days of collection.
8.2 Soil/Sediment Samples
8.2.1 Soil/sediment samples must be collected in a manner that minimizes sample handling,
environmental exposure and/or aeration. The use of specially designed air-tight collection samplers
or a 30-mL plastic syringe with the end sliced off is recommended. All soil/sediment must be
removed from the glass threads of the vial to ensure an adequate seal. Samples must be cooled to 0-
6°C immediately after collection.
8.2.2 Methanol preservation of soil/sediment samples is mandatory. Methanol (purge-and-trap grade)
must be added to the sample vial before or immediately after sample collection. In lieu of the in-
field preservation of samples with methanol, soil samples may be obtained in specially-designed air
tight sampling devices, provided that the samples are extruded and preserved in methanol within 48
hours of collection. Additional details and recommendations on soil/sediment sampling are
provided in Appendix 4.
8.2.3 The desired ratio of methanol-to-soil/sediment is 1 mL methanol/1 gram soil/sediment, +/- 25%.
The exact weight of the soil/sediment sample and volume of methanol must be known or ascertained
by the laboratory when calculating and reporting soil/sediment concentration data. A recommended
practice is for a laboratory to provide labeled, pre-weighed sampling vials with the measured
volume of methanol clearly indicated to the field sampling technician. The laboratory “fill line”
indicating the height of the methanol meniscus should be permanently marked on the side of the
sampling container. After the soil/sediment sample is added to the methanol in the sampling
container, the sample “fill line” indicating the height of the sample-displaced (increased) methanol
level should also be marked by the field sampling technician. In all cases, the soil/sediment
sample in the vial must be completely covered by methanol.
8.2.4 Samples for VPH analysis should be collected in duplicate 60-mL or 40-mL VOC vials with
Teflon-lined septa screw caps. An additional sample of the soil/sediment must also be obtained
(without methanol) to allow for a determination of moisture content and VPH dry weight correction
factors. Refer to Appendix 5 for details on shipping methanol-preserved samples.
8.2.5 A methanol trip blank should accompany each batch of soil/sediment samples.
8.2.6 A chain-of-custody form must accompany all sampling vials and must document the date and time
of sample collection and, where appropriate, the volume of methanol added. Observations of vial
leakage must be so noted on the laboratory/data report sheet.
8.2.7 Any sample received by the laboratory that is not packed in ice or cooled to 0-6°C must be so noted
on the laboratory/data report sheet. The temperature of the cooler must be recorded by the
laboratory upon receipt.
8.2.8 Soil/sediment samples must be analyzed within 28 days of collection.
8.3 A summary of sample collection containers, preservation, and holding times is provided in Table 3.
9.0 ANALYTICAL PROCEDURE
9.1 Sample Preparation and Purging
9.1.1 It is highly recommended that all samples be screened prior to analysis. This screening step may be
analysis of a soil/sediment sample's methanol extract (diluted), the headspace method (SW-846
method 3815), or the hexadecane extraction and screening method (SW-846 Method 3820). For
soil/sediment samples, headspace screening of the unpreserved vial (obtained for the purposes of
determining soil/sediment moisture content) is also an option.
Volatile Petroleum Hydrocarbons by GC/PID/FID Revision 2.1
MassDEP-VPH-18-2.1 Page 12 February 2018
9.1.2 Aqueous Samples
Introduce volatile compounds into the GC using a purge-and-trap concentrator.
Note: Although procedures for manual purge-and-trap load systems are provided below,
MassDEP prefers the use of purge-and-trap autosamplers to reduce variability and to
minimize the handling of samples for VPH analysis.
9.1.2.1 For a manual load system, remove the plunger from a 5-mL syringe and attach a closed
syringe valve. Open the sample or standard bottle, which has been allowed to come to
ambient temperature, and carefully pour the sample into the syringe barrel to just short of
overflowing. Replace the syringe plunger and compress the sample. Open the syringe
valve and vent any residual air while adjusting the sample volume to 5.0 mL. This process
of taking an aliquot destroys the validity of the liquid sample for future analysis; therefore,
if there is only one 40-mL vial, the analyst should fill a second syringe at this time to
protect against possible loss of sample integrity. This second sample is maintained only
until such time when the analyst has determined that the first sample has been analyzed
properly. Filling one 20-mL syringe would allow the use of only one syringe. If a second
analysis is needed from a syringe, it must be analyzed within 24 hours. Care must be taken
to prevent air from leaking into the syringe.
Alternatively, commercially-available autosamplers may be used to automatically
introduce a 5.0 mL sample aliquot directly from a 40 mL sampling vial to the system for
purging. The addition of surrogates may also be performed automatically by the
autosampler. Follow manufacturer’s instructions for operation. In some cases,
concentrations of surrogates and/or matrix spikes may need to be modified to
accommodate the fixed injection volumes associated with automated sample introduction
systems.
If necessary, samples should be diluted prior to injection into the purge chamber. In such
cases, all steps must be performed without delay. If using an autosampler, sufficient
volume of the diluted sample should be prepared to fill a 40 mL sampling vial. Analyze
the diluted sample as described above.
9.1.2.2 Spiking Samples.
If the purge-and-trap manual load system is utilized:
Add a specified volume (recommended 5-10 µL) of the surrogate spiking solution
through the valve bore of the syringe to yield a final concentration of 50 µg/L. Close
the valve.
If matrix spike analysis is to be performed, add a specified volume (recommended 5-
10 µL) of the matrix spiking solution through the valve bore of the syringe to yield a
nominal concentration of 50 µg/L. Close the valve.
Attach the syringe valve assembly to the syringe valve on the purging device. Open
the syringe valve and inject the sample into the purging chamber. Close the valve.
If the purge-and trap autosampler is utilized:
The addition of surrogates may be performed automatically by the autosampler.
If matrix spike analysis is to be performed, add a specified volume (recommended 5-
10 µL) of the matrix spiking solution through the Teflon-lined septa screw cap of the
VOC vial.
Volatile Petroleum Hydrocarbons by GC/PID/FID Revision 2.1
MassDEP-VPH-18-2.1 Page 13 February 2018
9.1.2.3 Regardless if manual load or autosampler is used, purge the sample for 11 minutes.
Recommended purge-and-trap operating parameters are provided in Table 4. At the
conclusion of the purge time, attach the trap to the GC (if necessary), adjust the device to
the desorb mode, and begin the GC temperature program and GC data acquisition.
Concurrently, introduce the trapped materials to the GC column by rapidly heating the trap
to 260°C (desorb temperature) and backflushing the trap with inert gas between 15 and 20
mL/min for 4 minutes.
9.1.2.4 While the trap is desorbing into the GC, empty the purging chamber. Wash the chamber
with a minimum of two 5 mL flushes of reagent water (or methanol followed by reagent
water) to avoid carryover of compounds into subsequent analyses.
9.1.2.5 After desorbing the sample, recondition the trap by returning the purge-and-trap device to
the purge mode. Wait 15 seconds, then close the syringe valve on the purging device to
begin gas flow through the trap. The trap temperature should be maintained at 260°C.
After approximately 7 to 15 min, turn off the trap heater and open the syringe valve to stop
the gas flow through the trap. After a highly concentrated sample, a longer baking time
may be necessary. When cool, the trap is ready for the next sample.
9.1.2.6 Following sample analysis, measure and record the pH of the remaining sample.
9.1.3 Soil/Sediment/Samples
Soil and sediment samples are extracted with methanol. An aliquot of the methanol extract is added
to reagent water and volatile compounds are introduced into the GC using a purge-and-trap
concentrator.
9.1.3.1 Weigh the sample vial to 0.1 g on a top-loading balance and determine the weight of the
soil/sediment sample; this determination requires knowledge of the empty/tared weight of
the sample vial and volume/weight of methanol preservative that was added to the sample
vial.
9.1.3.2 Add a specified volume (recommended not to exceed 1.0 mL) of the surrogate spiking
solution through the septum of the sample vial. The concentration and/or volume of the
surrogate spiking solution may need to be increased for samples that are highly
contaminated (based upon screening and/or field notes), to prevent dilution to below
detectable limits. The amount of surrogate added should yield a final concentration of 2.5
mg/kg.
9.1.3.3 If matrix spike analysis is to be performed, add a specified volume (recommended not to
exceed 1.0 mL) of the matrix spiking solution through the septum of a separate sample vial
to yield a nominal concentration of 2.5 mg/kg.
9.1.3.4 Agitate sample to facilitate adequate mixing of spiking solution(s).
9.1.3.5 Allow soil/sediment to settle until a layer of methanol is apparent.
9.1.3.6 Using a microliter syringe, withdraw an appropriate aliquot of the methanol extract for
sparging through the septum of the container. Sample screening data can be used to
determine the volume of methanol extract to add to the 5 mL of reagent water for analysis.
9.1.3.7 Remove the plunger from one 5.0-mL Luerlock type syringe equipped with a syringe valve
and fill until overflowing with reagent water. Replace the plunger and compress the water
to vent trapped air. Adjust the volume to allow for addition of the extract (e.g., for 100 µL
of extract adjust to 4.9 mL). Pull the plunger to 5.0 mL for addition of the sample extract.
Add the volume of methanol extract determined from screening (recommended 100 µL if
dilution not required). Be advised that the volume of methanol aliquot added to the
Volatile Petroleum Hydrocarbons by GC/PID/FID Revision 2.1
MassDEP-VPH-18-2.1 Page 14 February 2018
reagent water should not exceed 200 µL to preclude adverse solvent front and trap
breakthrough difficulties. Alternatively, the addition of methanol extracts to reagent
water can be performed in 40 mL VOC vials when an autosampler is used keeping
similar methanol to water ratios.
9.1.3.8 If using a manual load purge-and-trap system, attach the syringe valve assembly to the
syringe valve on the purging device. Open the syringe valve and inject the sample into the
purging chamber. Close the valve.
9.1.3.9 Complete operations as specified in Sections 9.1.2.3 through 9.1.2.5.
9.1.4 Determination of Percent Moisture
9.1.4.1 Soil and sediment results must be reported on a dry-weight basis.
Transfer 5 to 10 g of sample into a tared ( ± 0.1 g) crucible. This sample must be obtained
from a vial or container that does not contain methanol. Dry this 5 to 10 g sample
overnight at 105°C, and reweigh (± 0.1 g). Allow to cool in a desiccator before
reweighing. Calculate the percent moisture of the sample using the equation provided in
Section 9.6.3 (Equation 10). Refer to ASTM Method D2216, Determination of Moisture
Content of Soils and Sediments, for more detailed analytical and equipment specifications.
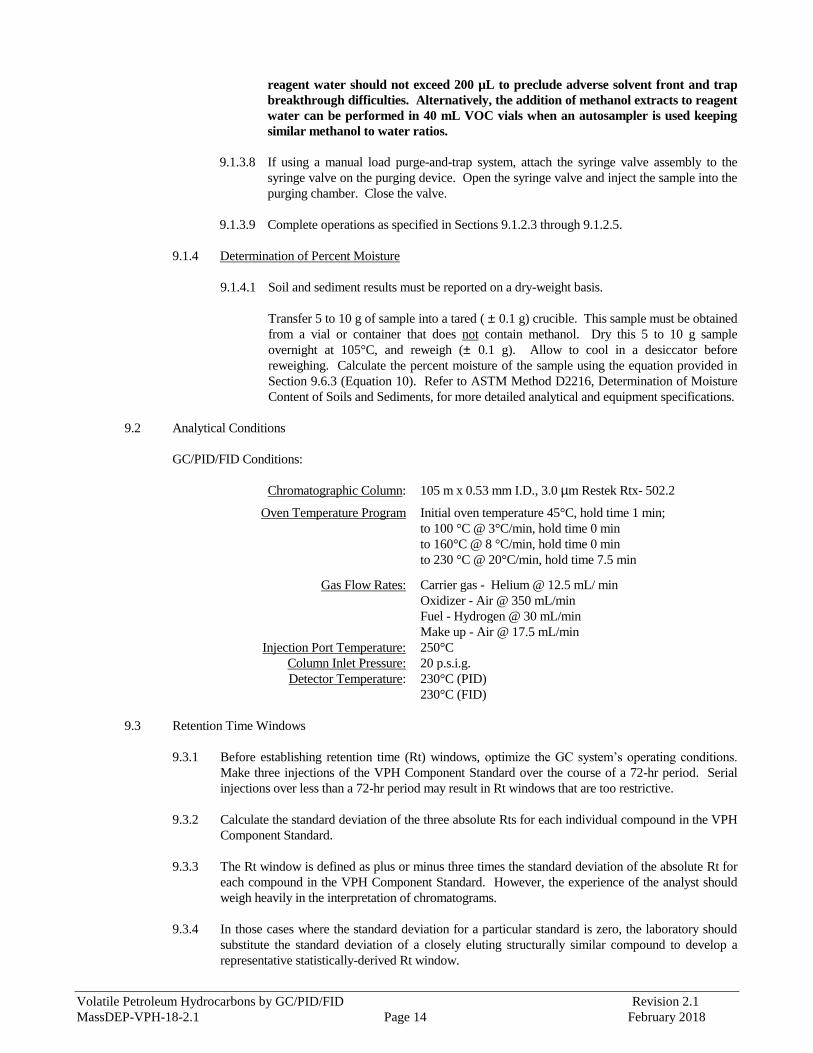
9.2 Analytical Conditions
GC/PID/FID Conditions:
Chromatographic Column: 105 m x 0.53 mm I.D., 3.0 µm Restek Rtx- 502.2
Oven Temperature Program Initial oven temperature 45°C, hold time 1 min;
to 100 °C @ 3°C/min, hold time 0 min
to 160°C @ 8 °C/min, hold time 0 min
to 230 °C @ 20°C/min, hold time 7.5 min
Gas Flow Rates: Carrier gas - Helium @ 12.5 mL/ min
Oxidizer - Air @ 350 mL/min
Fuel - Hydrogen @ 30 mL/min
Make up - Air @ 17.5 mL/min
Injection Port Temperature: 250°C
Column Inlet Pressure: 20 p.s.i.g.
Detector Temperature: 230°C (PID)
230°C (FID)
9.3 Retention Time Windows
9.3.1 Before establishing retention time (Rt) windows, optimize the GC system’s operating conditions.
Make three injections of the VPH Component Standard over the course of a 72-hr period. Serial
injections over less than a 72-hr period may result in Rt windows that are too restrictive.
9.3.2 Calculate the standard deviation of the three absolute Rts for each individual compound in the VPH
Component Standard.
9.3.3 The Rt window is defined as plus or minus three times the standard deviation of the absolute Rt for
each compound in the VPH Component Standard. However, the experience of the analyst should
weigh heavily in the interpretation of chromatograms.
9.3.4 In those cases where the standard deviation for a particular standard is zero, the laboratory should
substitute the standard deviation of a closely eluting structurally similar compound to develop a
representative statistically-derived Rt window.
Volatile Petroleum Hydrocarbons by GC/PID/FID Revision 2.1
MassDEP-VPH-18-2.1 Page 15 February 2018
9.3.5 The laboratory must calculate Rt windows for each compound in the VPH Component Standard on
each GC column and whenever a new GC column is installed. These data must be retained by the
lab.
9.3.6 The Rt window of the C5-C8 aliphatic hydrocarbons is defined as beginning 0.1 minutes before the
elution of n-pentane and ending 0.01 minutes before the elution of nonane. The C9-C12 aliphatic
hydrocarbon range begins 0.01 minutes before the elution of nonane; therefore there is no overlap of
the two ranges and the nonane peak is only included in the C9-C12 aliphatic hydrocarbon range. The
C9-C12 aliphatic hydrocarbon range ends 0.1 minutes before the elution of naphthalene.
The Rt window for the C9-C10 aromatic hydrocarbons is defined as beginning 0.1 minutes after the
elution of o-xylene and ending 0.1 before the elution of naphthalene.
VPH marker compounds and windows are summarized in Table 5.
9.4 Calibration
9.4.1 The VPH calibration standards are used to calibrate the GC/PID/FID system. Two distinct
calibration operations are necessary.
9.4.1.1 Target VPH Analytes and Surrogate: Calibration Factors (CFs) are calculated for the
Target VPH Analytes and surrogate standard, based upon a correlation between the
concentration of analyte/surrogate and PID area counts for the analyte/surrogate peaks.
This allows for the individual identification and quantitation of these specific
compounds. It is not necessary to develop CFs for any other individual VPH
Components.
9.4.1.2 Collective Aliphatic/Aromatic Hydrocarbon Ranges: CFs are calculated for C5-C8
aliphatic hydrocarbons and C9-C12 aliphatic hydrocarbons based upon a correlation
between the TOTAL concentration of aliphatic VPH Components eluting within the
range of interest and the total FID area count of the applicable VPH component peaks.
A CF is calculated for C9-C10 aromatic hydrocarbons based upon a correlation between
the concentration of the one aromatic VPH Component used to calibrate this range and
the PID area count of this VPH component. Specified VPH Components are designated
marker compounds to define the beginning and end of the hydrocarbon ranges (see
Table 5). A listing of the hydrocarbon range compounds used to establish CFs for each
hydrocarbon range of interest and their individual component concentration (µg/L) is
provided in Table 2b.
9.4.2 Initial Calibration
9.4.2.1 Initial calibration is performed at instrument set-up and at any time recalibration is
required or performed.
9.4.2.2 The use of CFs is the preferred approach to determine the relationship between the
detector response and the Target VPH Analyte and hydrocarbon range concentrations. It
is also permissible to utilize linear regression (see Sections 9.4.2.12 and 9.4.2.13). The
linear regression approach for Target VPH Analytes and hydrocarbon ranges is described
in Appendix 6. The use of non-linear regression is not allowed in this method and is
considered a significant modification as discussed in Section 11.3.1.
9.4.2.3 An initial calibration is performed using a minimum of five different concentrations of
VPH calibration standards as per Section 7.4. Recommended Target VPH Analyte and
hydrocarbon range calibration standard concentrations are provided in Tables 2a and 2b,
respectively. The calibration concentrations must be evenly dispersed over the full
working range of the detector with the lowest calibration point corresponding to the target
Volatile Petroleum Hydrocarbons by GC/PID/FID Revision 2.1
MassDEP-VPH-18-2.1 Page 16 February 2018
RL for the Target VPH Analytes (see Section 12.0). NOTE: If an autosampler is used to
spike the surrogate in calibration standards, five standards with the same concentration
of surrogate are acceptable for determination of a CF for the surrogate.
9.4.2.4 Analyze each VPH Calibration standard according to the procedures specified in Sections
9.1 and 9.2.
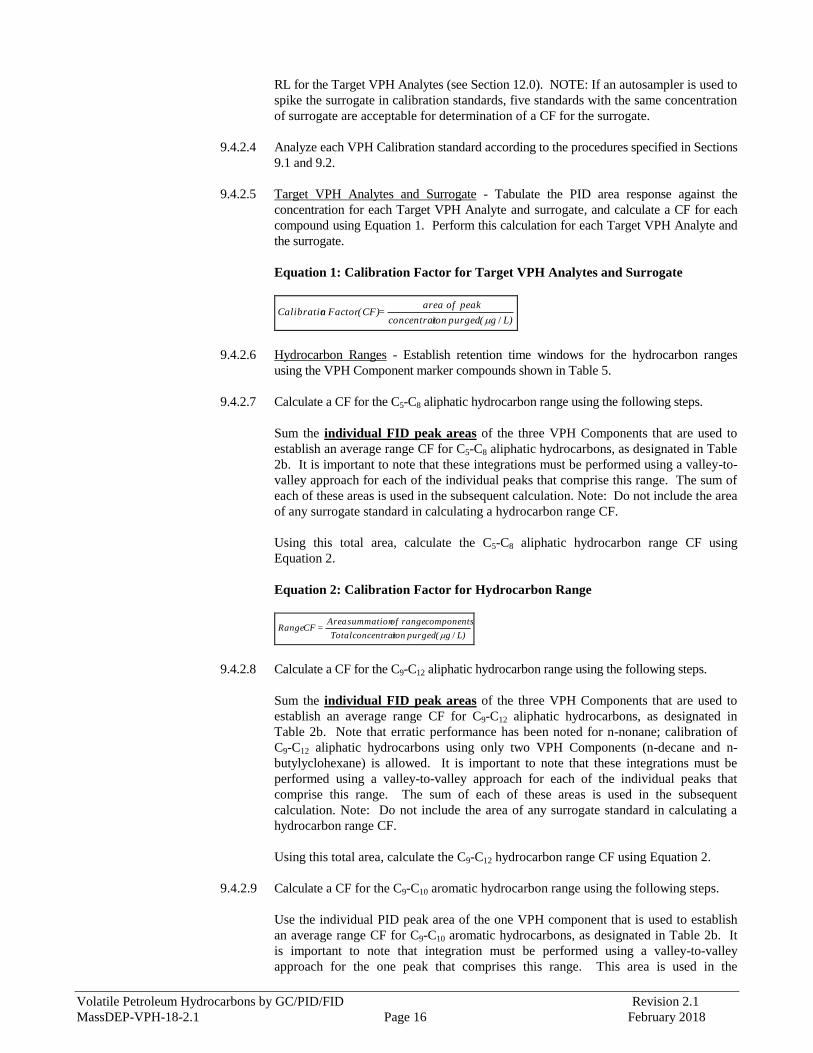
9.4.2.5 Target VPH Analytes and Surrogate - Tabulate the PID area response against the
concentration for each Target VPH Analyte and surrogate, and calculate a CF for each
compound using Equation 1. Perform this calculation for each Target VPH Analyte and
the surrogate.
Equation 1: Calibration Factor for Target VPH Analytes and Surrogate
L)g( purged ionconcentrat
peakof area = (CF) Factor nCalibratio
/
9.4.2.6 Hydrocarbon Ranges - Establish retention time windows for the hydrocarbon ranges
using the VPH Component marker compounds shown in Table 5.
9.4.2.7 Calculate a CF for the C5-C8 aliphatic hydrocarbon range using the following steps.
Sum the individual FID peak areas of the three VPH Components that are used to
establish an average range CF for C5-C8 aliphatic hydrocarbons, as designated in Table
2b. It is important to note that these integrations must be performed using a valley-to-
valley approach for each of the individual peaks that comprise this range. The sum of
each of these areas is used in the subsequent calculation. Note: Do not include the area
of any surrogate standard in calculating a hydrocarbon range CF.
Using this total area, calculate the C5-C8 aliphatic hydrocarbon range CF using
Equation 2.
Equation 2: Calibration Factor for Hydrocarbon Range
L)g( purged ionconcentrat Total
componentsrangeofsummationArea = CF Range
/
9.4.2.8 Calculate a CF for the C9-C12 aliphatic hydrocarbon range using the following steps.
Sum the individual FID peak areas of the three VPH Components that are used to
establish an average range CF for C9-C12 aliphatic hydrocarbons, as designated in
Table 2b. Note that erratic performance has been noted for n-nonane; calibration of
C9-C12 aliphatic hydrocarbons using only two VPH Components (n-decane and n-
butylyclohexane) is allowed. It is important to note that these integrations must be
performed using a valley-to-valley approach for each of the individual peaks that
comprise this range. The sum of each of these areas is used in the subsequent
calculation. Note: Do not include the area of any surrogate standard in calculating a
hydrocarbon range CF.
Using this total area, calculate the C9-C12 hydrocarbon range CF using Equation 2.
9.4.2.9 Calculate a CF for the C9-C10 aromatic hydrocarbon range using the following steps.
Use the individual PID peak area of the one VPH component that is used to establish
an average range CF for C9-C10 aromatic hydrocarbons, as designated in Table 2b. It
is important to note that integration must be performed using a valley-to-valley
approach for the one peak that comprises this range. This area is used in the
Volatile Petroleum Hydrocarbons by GC/PID/FID Revision 2.1
MassDEP-VPH-18-2.1 Page 17 February 2018
subsequent calculation. Note: Do not include the area of any surrogate standard in
calculating a hydrocarbon range CF. Do not include the area of naphthalene when
determining the CF for C9-C10 aromatic hydrocarbons
Using this area, calculate the C9-C10 aromatic range CF using Equation 2.
9.4.2.10 Calculate the average CF for each of the Target VPH Analytes, the surrogate, and each
hydrocarbon range.
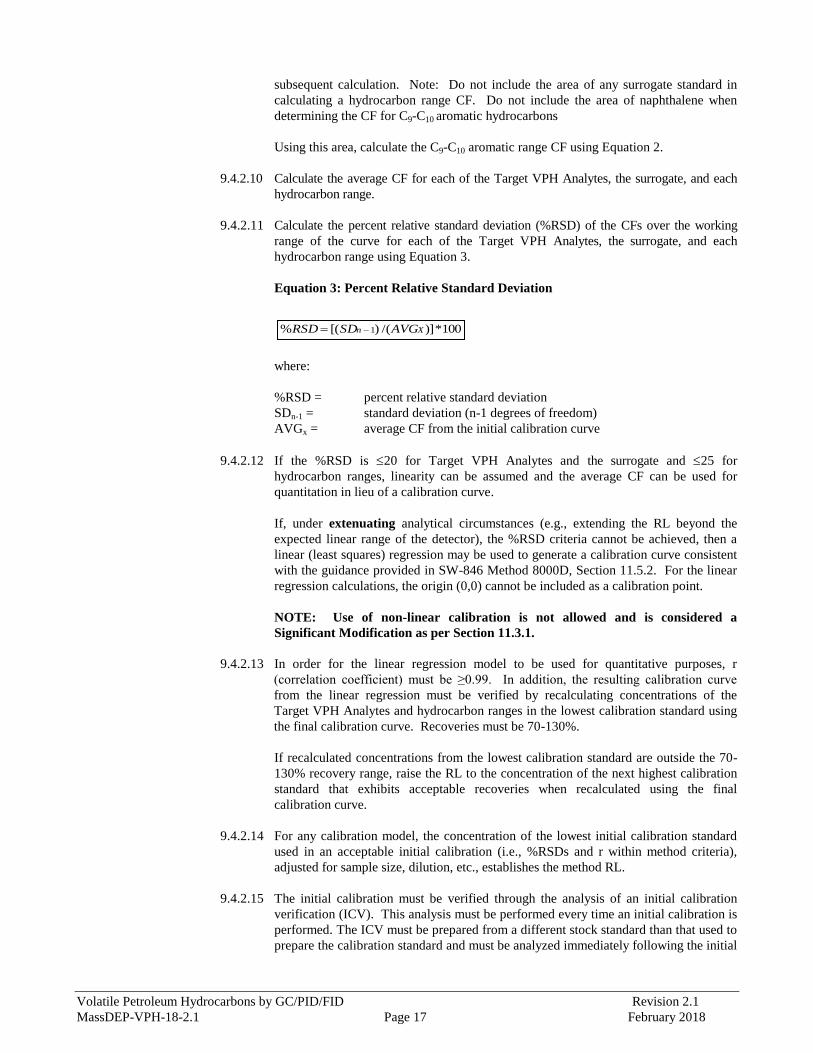
9.4.2.11 Calculate the percent relative standard deviation (%RSD) of the CFs over the working
range of the curve for each of the Target VPH Analytes, the surrogate, and each
hydrocarbon range using Equation 3.
Equation 3: Percent Relative Standard Deviation
where:
%RSD = percent relative standard deviation
SDn-1 = standard deviation (n-1 degrees of freedom)
AVGx = average CF from the initial calibration curve
9.4.2.12 If the %RSD is 20 for Target VPH Analytes and the surrogate and 25 for
hydrocarbon ranges, linearity can be assumed and the average CF can be used for
quantitation in lieu of a calibration curve.
If, under extenuating analytical circumstances (e.g., extending the RL beyond the
expected linear range of the detector), the %RSD criteria cannot be achieved, then a
linear (least squares) regression may be used to generate a calibration curve consistent
with the guidance provided in SW-846 Method 8000D, Section 11.5.2. For the linear
regression calculations, the origin (0,0) cannot be included as a calibration point.
NOTE: Use of non-linear calibration is not allowed and is considered a
Significant Modification as per Section 11.3.1.
9.4.2.13 In order for the linear regression model to be used for quantitative purposes, r
(correlation coefficient) must be ≥0.99. In addition, the resulting calibration curve
from the linear regression must be verified by recalculating concentrations of the
Target VPH Analytes and hydrocarbon ranges in the lowest calibration standard using
the final calibration curve. Recoveries must be 70-130%.
If recalculated concentrations from the lowest calibration standard are outside the 70-
130% recovery range, raise the RL to the concentration of the next highest calibration
standard that exhibits acceptable recoveries when recalculated using the final
calibration curve.
9.4.2.14 For any calibration model, the concentration of the lowest initial calibration standard
used in an acceptable initial calibration (i.e., %RSDs and r within method criteria),
adjusted for sample size, dilution, etc., establishes the method RL.
9.4.2.15 The initial calibration must be verified through the analysis of an initial calibration
verification (ICV). This analysis must be performed every time an initial calibration is
performed. The ICV must be prepared from a different stock standard than that used to
prepare the calibration standard and must be analyzed immediately following the initial
100*)]/()[(% 1 Xn AVGSDRSD
Volatile Petroleum Hydrocarbons by GC/PID/FID Revision 2.1
MassDEP-VPH-18-2.1 Page 18 February 2018
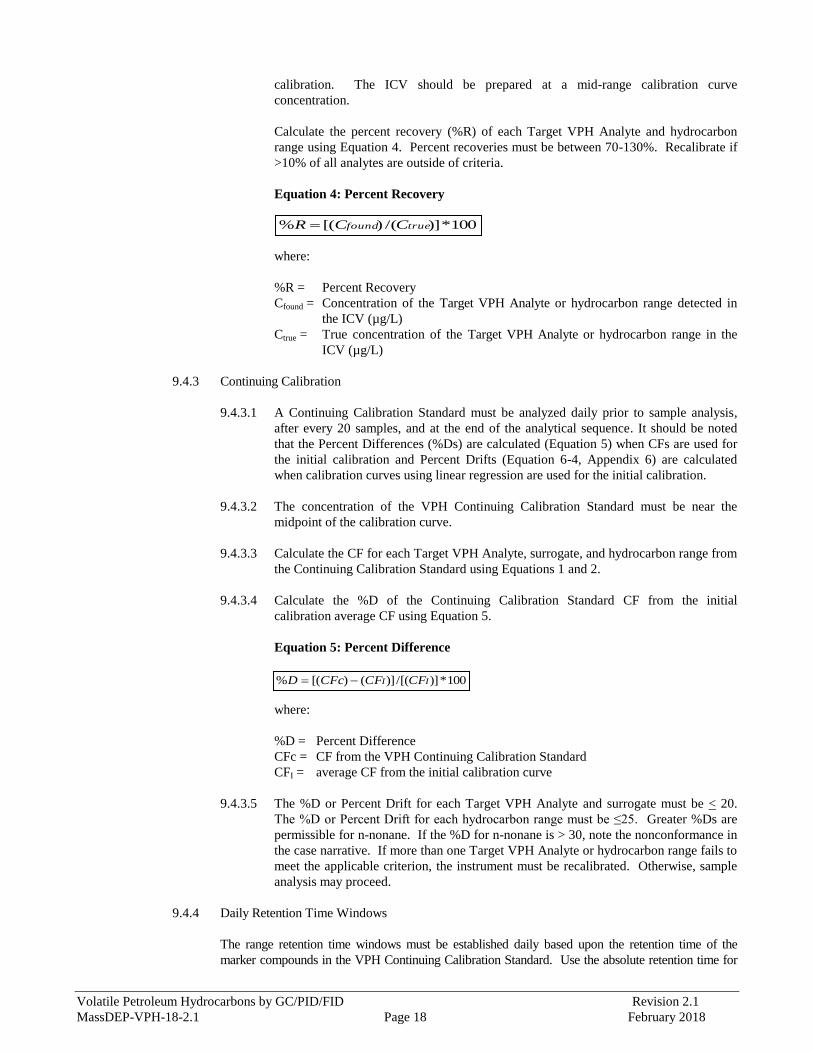
calibration. The ICV should be prepared at a mid-range calibration curve
concentration.
Calculate the percent recovery (%R) of each Target VPH Analyte and hydrocarbon
range using Equation 4. Percent recoveries must be between 70-130%. Recalibrate if
>10% of all analytes are outside of criteria.
Equation 4: Percent Recovery
where:
%R = Percent Recovery
Cfound = Concentration of the Target VPH Analyte or hydrocarbon range detected in
the ICV (µg/L)
Ctrue = True concentration of the Target VPH Analyte or hydrocarbon range in the
ICV (µg/L)
9.4.3 Continuing Calibration
9.4.3.1 A Continuing Calibration Standard must be analyzed daily prior to sample analysis,
after every 20 samples, and at the end of the analytical sequence. It should be noted
that the Percent Differences (%Ds) are calculated (Equation 5) when CFs are used for
the initial calibration and Percent Drifts (Equation 6-4, Appendix 6) are calculated
when calibration curves using linear regression are used for the initial calibration.
9.4.3.2 The concentration of the VPH Continuing Calibration Standard must be near the
midpoint of the calibration curve.
9.4.3.3 Calculate the CF for each Target VPH Analyte, surrogate, and hydrocarbon range from
the Continuing Calibration Standard using Equations 1 and 2.
9.4.3.4 Calculate the %D of the Continuing Calibration Standard CF from the initial
calibration average CF using Equation 5.
Equation 5: Percent Difference
where:
%D = Percent Difference
CFc = CF from the VPH Continuing Calibration Standard
CFI = average CF from the initial calibration curve
9.4.3.5 The %D or Percent Drift for each Target VPH Analyte and surrogate must be < 20.
The %D or Percent Drift for each hydrocarbon range must be ≤25. Greater %Ds are
permissible for n-nonane. If the %D for n-nonane is > 30, note the nonconformance in
the case narrative. If more than one Target VPH Analyte or hydrocarbon range fails to
meet the applicable criterion, the instrument must be recalibrated. Otherwise, sample
analysis may proceed.
9.4.4 Daily Retention Time Windows
The range retention time windows must be established daily based upon the retention time of the
marker compounds in the VPH Continuing Calibration Standard. Use the absolute retention time for
100*)]/[()]()[(% II CFCFCFcD
100*)]/()[(% truefound CCR
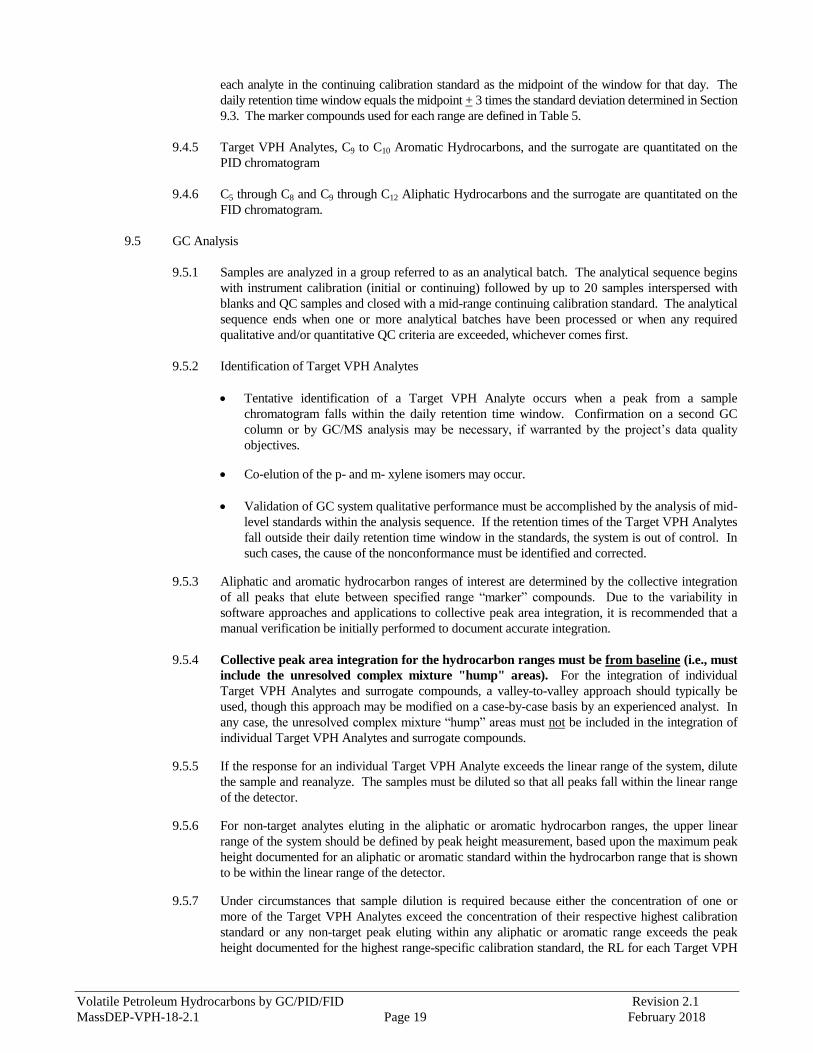
Volatile Petroleum Hydrocarbons by GC/PID/FID Revision 2.1
MassDEP-VPH-18-2.1 Page 19 February 2018
each analyte in the continuing calibration standard as the midpoint of the window for that day. The
daily retention time window equals the midpoint + 3 times the standard deviation determined in Section
9.3. The marker compounds used for each range are defined in Table 5.
9.4.5 Target VPH Analytes, C9 to C10 Aromatic Hydrocarbons, and the surrogate are quantitated on the
PID chromatogram
9.4.6 C5 through C8 and C9 through C12 Aliphatic Hydrocarbons and the surrogate are quantitated on the
FID chromatogram.
9.5 GC Analysis
9.5.1 Samples are analyzed in a group referred to as an analytical batch. The analytical sequence begins
with instrument calibration (initial or continuing) followed by up to 20 samples interspersed with
blanks and QC samples and closed with a mid-range continuing calibration standard. The analytical
sequence ends when one or more analytical batches have been processed or when any required
qualitative and/or quantitative QC criteria are exceeded, whichever comes first.
9.5.2 Identification of Target VPH Analytes
Tentative identification of a Target VPH Analyte occurs when a peak from a sample
chromatogram falls within the daily retention time window. Confirmation on a second GC
column or by GC/MS analysis may be necessary, if warranted by the project’s data quality
objectives.
Co-elution of the p- and m- xylene isomers may occur.
Validation of GC system qualitative performance must be accomplished by the analysis of mid-
level standards within the analysis sequence. If the retention times of the Target VPH Analytes
fall outside their daily retention time window in the standards, the system is out of control. In
such cases, the cause of the nonconformance must be identified and corrected.
9.5.3 Aliphatic and aromatic hydrocarbon ranges of interest are determined by the collective integration
of all peaks that elute between specified range “marker” compounds. Due to the variability in
software approaches and applications to collective peak area integration, it is recommended that a
manual verification be initially performed to document accurate integration.
9.5.4 Collective peak area integration for the hydrocarbon ranges must be from baseline (i.e., must
include the unresolved complex mixture "hump" areas). For the integration of individual
Target VPH Analytes and surrogate compounds, a valley-to-valley approach should typically be
used, though this approach may be modified on a case-by-case basis by an experienced analyst. In
any case, the unresolved complex mixture “hump” areas must not be included in the integration of
individual Target VPH Analytes and surrogate compounds.
9.5.5 If the response for an individual Target VPH Analyte exceeds the linear range of the system, dilute
the sample and reanalyze. The samples must be diluted so that all peaks fall within the linear range
of the detector.
9.5.6 For non-target analytes eluting in the aliphatic or aromatic hydrocarbon ranges, the upper linear
range of the system should be defined by peak height measurement, based upon the maximum peak
height documented for an aliphatic or aromatic standard within the hydrocarbon range that is shown
to be within the linear range of the detector.
9.5.7 Under circumstances that sample dilution is required because either the concentration of one or
more of the Target VPH Analytes exceed the concentration of their respective highest calibration
standard or any non-target peak eluting within any aliphatic or aromatic range exceeds the peak
height documented for the highest range-specific calibration standard, the RL for each Target VPH
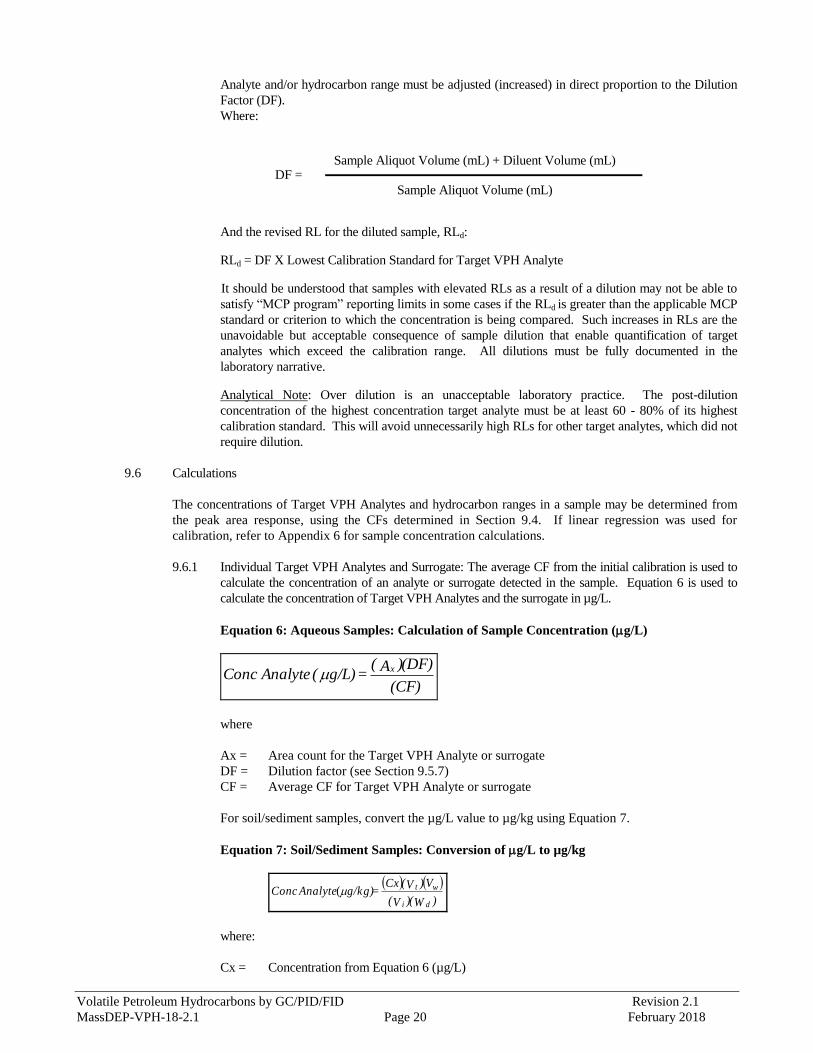
Volatile Petroleum Hydrocarbons by GC/PID/FID Revision 2.1
MassDEP-VPH-18-2.1 Page 20 February 2018
Analyte and/or hydrocarbon range must be adjusted (increased) in direct proportion to the Dilution
Factor (DF).
Where:
And the revised RL for the diluted sample, RLd:
RLd = DF X Lowest Calibration Standard for Target VPH Analyte
It should be understood that samples with elevated RLs as a result of a dilution may not be able to
satisfy “MCP program” reporting limits in some cases if the RLd is greater than the applicable MCP
standard or criterion to which the concentration is being compared. Such increases in RLs are the
unavoidable but acceptable consequence of sample dilution that enable quantification of target
analytes which exceed the calibration range. All dilutions must be fully documented in the
laboratory narrative.
Analytical Note: Over dilution is an unacceptable laboratory practice. The post-dilution
concentration of the highest concentration target analyte must be at least 60 - 80% of its highest
calibration standard. This will avoid unnecessarily high RLs for other target analytes, which did not
require dilution.
9.6 Calculations
The concentrations of Target VPH Analytes and hydrocarbon ranges in a sample may be determined from
the peak area response, using the CFs determined in Section 9.4. If linear regression was used for
calibration, refer to Appendix 6 for sample concentration calculations.
9.6.1 Individual Target VPH Analytes and Surrogate: The average CF from the initial calibration is used to
calculate the concentration of an analyte or surrogate detected in the sample. Equation 6 is used to
calculate the concentration of Target VPH Analytes and the surrogate in µg/L.
Equation 6: Aqueous Samples: Calculation of Sample Concentration (g/L)
(CF)
(DF))A( = g/L)( Analyte Conc
x
where
Ax = Area count for the Target VPH Analyte or surrogate
DF = Dilution factor (see Section 9.5.7)
CF = Average CF for Target VPH Analyte or surrogate
For soil/sediment samples, convert the µg/L value to µg/kg using Equation 7.
Equation 7: Soil/Sediment Samples: Conversion of g/L to µg/kg
)W()V(
V)V(Cx = g/kg) Analyte Conc
di
wt(
where:
Cx = Concentration from Equation 6 (µg/L)
DF = Sample Aliquot Volume (mL) + Diluent Volume (mL)
Sample Aliquot Volume (mL)
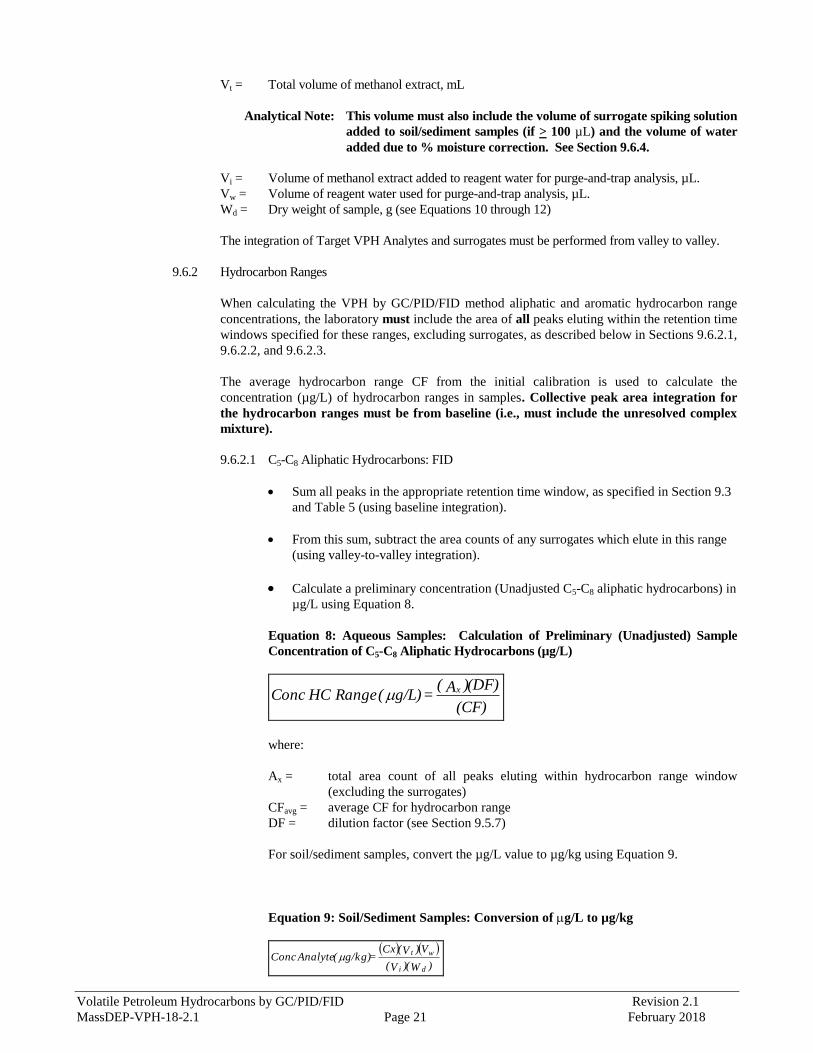
Volatile Petroleum Hydrocarbons by GC/PID/FID Revision 2.1
MassDEP-VPH-18-2.1 Page 21 February 2018
Vt = Total volume of methanol extract, mL
Analytical Note: This volume must also include the volume of surrogate spiking solution
added to soil/sediment samples (if > 100 µL) and the volume of water
added due to % moisture correction. See Section 9.6.4.
Vi = Volume of methanol extract added to reagent water for purge-and-trap analysis, µL.
Vw = Volume of reagent water used for purge-and-trap analysis, µL.
Wd = Dry weight of sample, g (see Equations 10 through 12)
The integration of Target VPH Analytes and surrogates must be performed from valley to valley.
9.6.2 Hydrocarbon Ranges
When calculating the VPH by GC/PID/FID method aliphatic and aromatic hydrocarbon range
concentrations, the laboratory must include the area of all peaks eluting within the retention time
windows specified for these ranges, excluding surrogates, as described below in Sections 9.6.2.1,
9.6.2.2, and 9.6.2.3.
The average hydrocarbon range CF from the initial calibration is used to calculate the
concentration (µg/L) of hydrocarbon ranges in samples. Collective peak area integration for
the hydrocarbon ranges must be from baseline (i.e., must include the unresolved complex
mixture).
9.6.2.1 C5-C8 Aliphatic Hydrocarbons: FID
Sum all peaks in the appropriate retention time window, as specified in Section 9.3
and Table 5 (using baseline integration).
From this sum, subtract the area counts of any surrogates which elute in this range
(using valley-to-valley integration).
Calculate a preliminary concentration (Unadjusted C5-C8 aliphatic hydrocarbons) in
µg/L using Equation 8.
Equation 8: Aqueous Samples: Calculation of Preliminary (Unadjusted) Sample
Concentration of C5-C8 Aliphatic Hydrocarbons (µg/L)
(CF)
(DF))A( = g/L)( Range HC Conc
x
where:
Ax = total area count of all peaks eluting within hydrocarbon range window
(excluding the surrogates)
CFavg = average CF for hydrocarbon range
DF = dilution factor (see Section 9.5.7)
For soil/sediment samples, convert the µg/L value to µg/kg using Equation 9.
Equation 9: Soil/Sediment Samples: Conversion of g/L to µg/kg
)W()V(
V)V(Cx = g/kg)( Analyte Conc
di
wt
Volatile Petroleum Hydrocarbons by GC/PID/FID Revision 2.1
MassDEP-VPH-18-2.1 Page 22 February 2018
where:
Cx = Concentration from Equation 8 (µg/L)
Vt = Total volume of methanol extract, mL
Analytical Note: This volume must also include the volume of surrogate spiking
solution added to soil/sediment samples (if ≥ 100 µL) and the
volume of water added due to % moisture correction. See Section
9.6.4.
Vi = Volume of methanol extract added to reagent water for purge-and-trap analysis, µL
Vw = Volume of reagent water used for purge-and-trap analysis, µL
Wd = Dry weight of sample, g (see Equations 10 through 12)
NOTE: These values are reported as the “Unadjusted C5-C8 aliphatics” as shown in
Appendix 3, Exhibit 1.
From the Unadjusted concentration (µg/L or µg/kg), calculate the concentration of
C5-C8 aliphatic hydrocarbons by subtracting the concentrations of Target VPH
Analytes (which are quantified using the PID) which elute in this range (typically
MTBE, benzene, and toluene for the C5-C8 aliphatic hydrocarbons). This is the
final concentration reported as the “C5-C8 Aliphatic Hydrocarbons” on the data
report form in Appendix 3, Exhibit 1.
9.6.2.2 C9-C10 Aromatic Hydrocarbons: PID
Sum all peaks in the appropriate retention time window, as specified in Section 9.3
and Table 5 (using baseline integration).
From this sum, subtract the area counts of any surrogates which elute in this range
(using valley-to-valley integration).
Calculate the concentration in µg/L using Equation 8.
For soil/sediment samples, convert the µg/L value to µg/kg using Equation 9.
9.6.2.3 C9-C12 Aliphatic Hydrocarbons: FID
Sum all peaks in the appropriate retention time window, as specified in Section 9.3
and Table 5 (using baseline integration).
From this sum, subtract the area counts of any surrogates which elute in this range
(using valley-to-valley integration).
Calculate a preliminary concentration (Unadjusted C9-C12 aliphatic hydrocarbons)
in µg/L using Equation 8.
For soil/sediment samples, convert the µg/L value to µg/kg using Equation 9.
NOTE: These values are reported as the “Unadjusted C9-C12 aliphatics” as shown
in Appendix 3, Exhibit 1.
From the Unadjusted concentration (µg/L or µg/kg), calculate the concentration of
C9-C12 aliphatic hydrocarbons by subtracting the concentrations of C9-C10 aromatic
hydrocarbons (from the PID) and the Target VPH Analytes (which are quantified
using the PID) which elute in this range (typically ethylbenzene, m & p-xylenes,
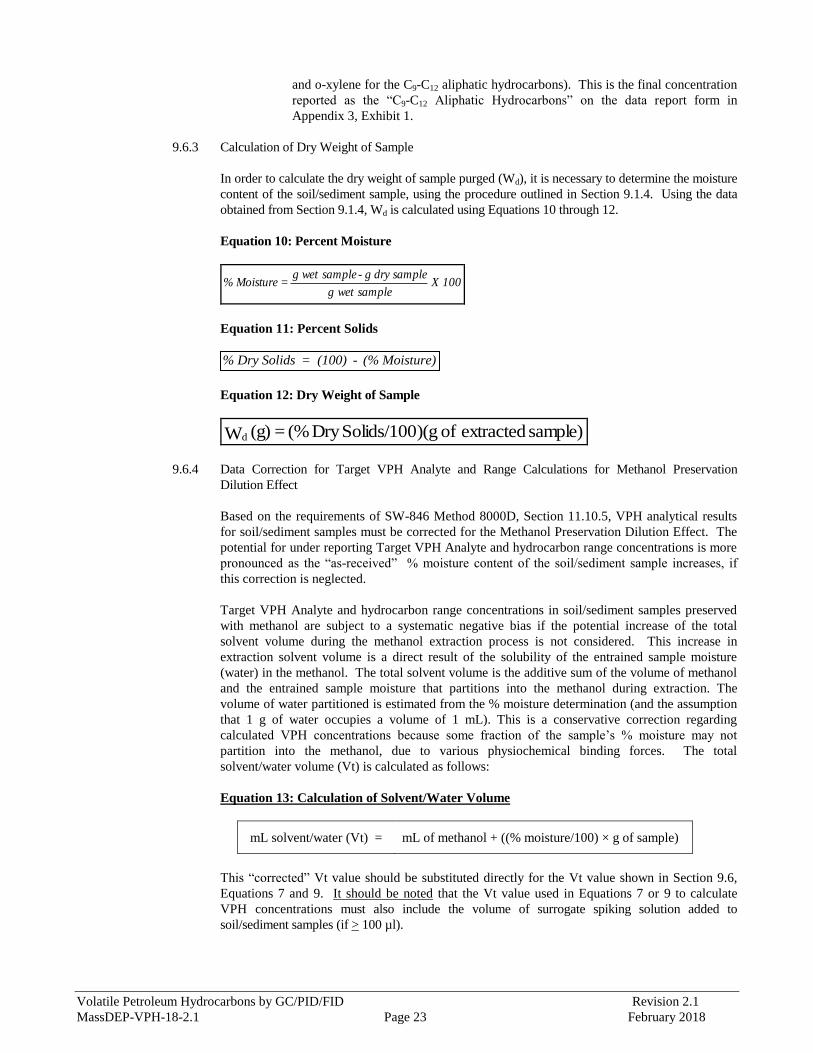
Volatile Petroleum Hydrocarbons by GC/PID/FID Revision 2.1
MassDEP-VPH-18-2.1 Page 23 February 2018
and o-xylene for the C9-C12 aliphatic hydrocarbons). This is the final concentration
reported as the “C9-C12 Aliphatic Hydrocarbons” on the data report form in
Appendix 3, Exhibit 1.
9.6.3 Calculation of Dry Weight of Sample
In order to calculate the dry weight of sample purged (Wd), it is necessary to determine the moisture
content of the soil/sediment sample, using the procedure outlined in Section 9.1.4. Using the data
obtained from Section 9.1.4, Wd is calculated using Equations 10 through 12.
Equation 10: Percent Moisture
100 X samplewetg
dry sample g-sample wetg = Moisture%
Equation 11: Percent Solids
Equation 12: Dry Weight of Sample
sample) extracted of )(gSolids/100Dry (% = (g) Wd
9.6.4 Data Correction for Target VPH Analyte and Range Calculations for Methanol Preservation
Dilution Effect
Based on the requirements of SW-846 Method 8000D, Section 11.10.5, VPH analytical results
for soil/sediment samples must be corrected for the Methanol Preservation Dilution Effect. The
potential for under reporting Target VPH Analyte and hydrocarbon range concentrations is more
pronounced as the “as-received” % moisture content of the soil/sediment sample increases, if
this correction is neglected.
Target VPH Analyte and hydrocarbon range concentrations in soil/sediment samples preserved
with methanol are subject to a systematic negative bias if the potential increase of the total
solvent volume during the methanol extraction process is not considered. This increase in
extraction solvent volume is a direct result of the solubility of the entrained sample moisture
(water) in the methanol. The total solvent volume is the additive sum of the volume of methanol
and the entrained sample moisture that partitions into the methanol during extraction. The
volume of water partitioned is estimated from the % moisture determination (and the assumption
that 1 g of water occupies a volume of 1 mL). This is a conservative correction regarding
calculated VPH concentrations because some fraction of the sample’s % moisture may not
partition into the methanol, due to various physiochemical binding forces. The total
solvent/water volume (Vt) is calculated as follows:
Equation 13: Calculation of Solvent/Water Volume
mL solvent/water (Vt) = mL of methanol + ((% moisture/100) × g of sample)
This “corrected” Vt value should be substituted directly for the Vt value shown in Section 9.6,
Equations 7 and 9. It should be noted that the Vt value used in Equations 7 or 9 to calculate
VPH concentrations must also include the volume of surrogate spiking solution added to
soil/sediment samples (if > 100 µl).
% Dry Solids = (100) - (% Moisture)
Volatile Petroleum Hydrocarbons by GC/PID/FID Revision 2.1
MassDEP-VPH-18-2.1 Page 24 February 2018
10.0 QUALITY CONTROL
10.1 General Requirements and Recommendations
10.1.1 Each laboratory that uses this method is required to operate a formal quality control program. The
minimum requirements of this program consist of an Initial Demonstration of Laboratory Capability
(IDLC) and an ongoing analysis of prepared QC samples to evaluate and document the quality of
data. The laboratory must maintain records to document the quality of the data produced. Ongoing
data quality checks are compared with established performance criteria to determine if the results of
analyses meet the performance standards for the method.
10.1.2 At a minimum, for each analytical batch (up to 20 samples of similar matrix), a beginning Initial
Calibration or Opening mid-range Continuing Calibration Standard, Closing mid-range Continuing
Calibration Standard, LMB, LCS and LCSD must be analyzed. The Initial Calibration or
Continuing Calibration Standard, LMB, and LCS must be analyzed prior to samples. Matrix
duplicates, matrix spike and/or matrix spike duplicates should be analyzed, at the request of the data
user, based upon the nature of the sample. For analytical batches with more than 10 samples, the
analysis of an additional mid-range Continuing Calibration Standard should also be considered.
However, it should be noted that the analysis of the Continuing Calibration Standard is required
prior to sample analysis, after every 20 samples, and at the end of an analytical sequence, at a
minimum.
10.1.3 The recommended sequence of analysis is as follows:
(1) Analytical Batch Calibration Standards (initial) or mid-range Continuing Calibration Standard
(daily check of initial calibration). [REQUIRED]
(2) Initial Calibration Verification. [REQUIRED only after initial calibration]
(3) Analytical batch LCS. [REQUIRED]
(4) Analytical batch LCSD. [REQUIRED; can instead be analyzed at end of sequence]
(5) Analytical batch LMB. [REQUIRED]
(6) Batch samples. (up to 20 samples).
(7) Matrix duplicate. [As requested by data user]
(8) Matrix Spike/Matrix Spike Duplicate. [As requested by data user]
(9) Optional mid-range Continuing Calibration Standard. (consider after 10 samples)
(10) Analytical Batch LCS Duplicate. a [REQUIRED]
(11) Closing mid-range Continuing Calibration Standard b after 20 samples and at end of analytical
batch. [REQUIRED]
a May be used as the analytical batch LCS for the next analytical batch if batches are
processed continuously. b May be used as analytical batch opening Continuing Calibration Standard for the next
analytical batch if batches are processed continuously.
All analytical sequences and data must be recorded in a daily run log.
10.2 Minimum Instrument QC
10.2.1 The n-pentane (C5) and MTBE peaks must be adequately resolved from any solvent front that may
be present on the FID and PID chromatograms, respectively. This is achievable using the
recommended chromatographic column and purge-and-trap procedures. Coelution of the m- and p-
Volatile Petroleum Hydrocarbons by GC/PID/FID Revision 2.1
MassDEP-VPH-18-2.1 Page 25 February 2018
xylene isomers is permissible. All surrogates must be adequately resolved from individual Target
VPH Analytes included in the VPH Component Standard. For the purposes of this method,
adequate resolution is assumed to be achieved if the height of the valley between two peaks is less
than 25% of the average height of the two peaks.
10.2.2 Initial Calibration Verification – An ICV standard, prepared from a separate source standard
than used for initial and continuing calibrations must be analyzed immediately following the
initial calibration. The recoveries of all Target VPH Analytes and hydrocarbon ranges must be
between 70-130%. A new five-point calibration must be performed if >10% of all analytes are
outside of criteria.
10.2.3 Laboratory Method Blank – A water or soil LMB is prepared by fortifying a reagent water blank
(for aqueous samples), or 25 ml of methanol (for soil/sediment samples) with the surrogate
spiking solution (using same volume of surrogate as samples). Peaks must not be detected above
the RL within the retention time window of any analyte of interest. The hydrocarbon ranges
must not be detected at a concentration greater than 10% of the most stringent applicable MCP
cleanup standard for soil/sediment samples and 50% of the most stringent applicable MCP
cleanup standard for aqueous samples.
10.2.4 Relative Retention Times must be established for each Target VPH Analyte and hydrocarbon
range of interest each time a new GC column is installed and must be verified and/or adjusted on
a daily basis. (See Sections 9.3 and 9.4.4).
10.2.5 Calibration
10.2.5.1 Initial Calibration: CFs must be calculated for each Target VPH Analyte and
hydrocarbon range based upon the analysis of a minimum of 5 calibration standards.
The linearity of CFs may be assumed if the %RSD over the working range of the
calibration curve is ≤20 for Target VPH Analytes and the surrogate and ≤25 for
hydrocarbon ranges. (See Section 9.4). For linear regression, r must be > 0.99.
10.2.5.2 Continuing Calibration Standard: The Continuing Calibration Standard must be
analyzed daily prior to sample analysis, every 20 samples, and at the end of an
analytical sequence to verify the accuracy of the calibration of the instrument. For
Target VPH Analytes and the surrogate, the %D or Percent Drift must be ≤20. For
hydrocarbon ranges, the %D or Percent Drift must be ≤ 25. Greater %Ds or Percent
Drifts are permissible for n-nonane (if included in the calibration of the C9 – C12
aliphatic range). If the %D or Percent Drift is > 30 for n-nonane, note the
nonconformance in the laboratory narrative. If more than one Target VPH Analyte or
hydrocarbon range fails to meet this criterion, the instrument must be recalibrated.
Otherwise, sample analysis may proceed.
10.2.6 Laboratory Control Sample – An LCS is prepared by fortifying a reagent water blank (for
aqueous samples) or 25 mL of methanol (for soil/sediment samples) with the matrix spiking solution
for a final concentration of 50 µg/L (2.5 mg/kg). The spike recoveries for the Target VPH Analytes
and the hydrocarbon ranges must be between 70% and 130%.
If the recoveries are low and outside of the acceptance limits, reanalyze the LCS and
associated samples. If still outside of the acceptance limits, recalibrate.
If the recoveries are high and outside of the acceptance limits and the affected compound
was detected in the associated samples, reanalyze the LCS and the associated samples. If
recoveries are still outside of the acceptance limits, recalibrate.
If the recoveries are high and sample results were nondetect, data can be reported without
qualification; however, the high recoveries should be noted in the laboratory narrative.
Volatile Petroleum Hydrocarbons by GC/PID/FID Revision 2.1
MassDEP-VPH-18-2.1 Page 26 February 2018
10.2.7 LCS Duplicate – The LCSD is prepared separately from the LCS but prepared and analyzed in the
same manner as the LCS and is used as the data quality indicator of precision. The analytical batch
precision is determined from the RPD of the concentrations (not recoveries) of the LCS/LCSD pair.
The RPD for Target VPH Analytes and aliphatic and aromatic hydrocarbon range concentrations
must be < 25. See Section 10.2.6 for corrective actions associated with recoveries outside of
acceptance limits.
10.2.8 Surrogate Spike Recoveries
10.2.8.1 Each sample, LMB, LCS, LCSD, matrix spike, and matrix duplicate must be fortified
with the surrogate spiking solution. Required surrogate recovery is 70% to 130% from
each detector. At a minimum, when surrogate recovery from a sample, blank, or QC
sample is less than 70% or more than 130%, check calculations to locate possible
errors, check the fortifying solution for degradation, and check for changes in
instrument performance. If the cause cannot be determined, reanalyze the sample unless
one of the following exceptions applies:
(1) Obvious interference is present on the chromatogram (e.g., unresolved complex
mixture);
(2) Percent moisture of associated soil/sediment sample is > 25% and surrogate recovery
is > 10%; or
(3) The surrogate exhibits high recovery and associated target analytes or hydrocarbon
ranges are not detected in sample.
If a sample with a surrogate recovery outside of the acceptable range is not reanalyzed
based on any of these aforementioned exceptions, this information must be noted on the
data report form and discussed in the laboratory narrative.
Analysis of the sample on dilution may diminish matrix-related surrogate recovery
problems. This approach can be used as long as the RL for the applicable MCP standards
will still be achieved with the dilution. If not, reanalysis without dilution must be
performed unless the concentrations of target analytes do not allow an undiluted run.
Recoveries of surrogates outside of the acceptable range after reanalysis must also be
noted on the data report form and discussed in the laboratory narrative.
10.3 At the request of the data user, and in consideration of sample matrices and data quality objectives, matrix
spikes and matrix duplicates may be analyzed with every batch of 20 samples or less per matrix.
10.3.1 Matrix Duplicate – Matrix duplicates are prepared by analyzing one sample in duplicate. The
purpose of the matrix duplicates is to determine the homogeneity of the sample matrix as well as
analytical precision. The RPD of detected results in the matrix duplicate samples must not exceed
50 when the results are greater than 5x the RL. Refer to Equation 14 for the RPD calculation. If
the RPD exceeds 50 and both results are > 5x the RL, the sample analysis must be repeated.
If an analyte is detected in one analysis at > 5x the RL and not detected in the duplicate
analysis, the analysis must be repeated.
If an analyte is detected in one analysis at < 5x the RL and not detected in the duplicate
analysis, the RPD is not calculable and the analysis does not have to be repeated.
If an analyte is not detected in both the original and duplicate analyses, the RPD is not
calculable. No further action is required.
Equation 14. Relative Percent Difference Calculation
100*]]2/)/[()[( dsds CCCCRPD
Volatile Petroleum Hydrocarbons by GC/PID/FID Revision 2.1
MassDEP-VPH-18-2.1 Page 27 February 2018
where:
Cs = concentration in original sample analysis
Cd = concentration in duplicate sample analysis
10.3.2 Matrix Spike/Matrix Spike Duplicate – The aqueous or soil/sediment matrix spike is prepared by
fortifying an actual aqueous sample or soil/sediment sample with a specified volume (5-10 µl for
aqueous samples and not to exceed 1.0 ml for soil/sediment samples) of the matrix spiking
solution (see Section 7.6). The desired spiking level is 50% of the highest calibration standard.
However, the total concentration in the matrix spike (including the matrix spike and native
concentration in the unspiked sample) should not exceed 75% of the highest calibration standard in
order for a proper evaluation to be performed. The purpose of the matrix spike is to determine
whether the sample matrix contributes bias to the analytical results. The background concentrations
of the analytes in the sample matrix must be determined in a separate unspiked aliquot and the
measured values in the matrix spike corrected for background concentrations. The corrected
concentrations of each analyte within the matrix spiking solution must be within 70-130% of the
true value.
10.4 If any of the performance standards specified in Section 10.2 are not met, the cause of the non-
conformance must be identified and corrected before any additional samples may be analyzed. Any
samples run between the last QC samples that met the criteria and those that are fallen out must be
reanalyzed, as noted in Section 10.2. These QC samples include the Continuing Calibration Standard,
LMB, LCS, and LCSD. If this is not possible, the data must be reported as suspect.
10.5 Initial and Periodic Method Demonstration of Laboratory Capability (IDLC)
The QC procedures described in Appendix 7 and described in SW-846 Method 8000D, Section 9.3 must be
conducted, successfully completed, and documented as an initial demonstration of laboratory capability, prior
to the analysis of any samples by the VPH by GC/PID/FID Method. Subsequent to this initial demonstration,
additional evaluations of this nature should be conducted on a periodic basis, in response to changes in
instrumentation or operations, training new analysts and/or in response to confirmed or suspected systems,
method, or operational problems. Elements of the IDLC include:
Demonstration of Acceptable System Background, see Appendix 7, Section 2.0 (Optional);
Initial Demonstration of Accuracy, see Appendix 7, Section 3.0;
Initial Demonstration of Precision, see Appendix 7, Section 4.0; and
Method Detection Limit (MDL), see Appendix 7, Section 5.0 (Optional).
11.0 DATA PRODUCTION AND REPORTING
11.1 Calibration
Using the external calibration procedure (See Section 9.4.2) calibrate the GC/PID/FID as follows:
11.1.1 Using the PID chromatogram, calculate an average CF or linear regression calibration curve for the
Target VPH Analytes (benzene, toluene, ethylbenzene, m,p,o-xylenes, naphthalene, and MTBE).
This step is not necessary if these Target VPH Analytes will not be individually identified and
quantitated by the VPH method (i.e., if unadjusted values only will be reported for the hydrocarbon
ranges or if reporting concentrations of Target VPH Analytes via another method).
11.1.2 Using both the FID and PID chromatograms, calculate an average CF for the surrogate 2,5-
dibromotoluene.
Volatile Petroleum Hydrocarbons by GC/PID/FID Revision 2.1
MassDEP-VPH-18-2.1 Page 28 February 2018
11.1.3 Using the FID chromatogram, calculate an average collective CF for the total concentration of the
C5-C8 Aliphatic Hydrocarbons. Tabulate the collective peak area response of the 3 components (n-
pentane, 2-methylpentane, 2,2,4-trimethylpentane) against the collective concentration injected.
11.1.4 Using the FID chromatogram, calculate an average collective CF for the total concentration of C9-
C12 Aliphatic Hydrocarbons. Tabulate the collective peak area response of the 2 components (n-
decane and n-butylcyclohexane) against the collective concentration injected. Alternatively, the CF
for C9-C12 Aliphatic Hydrocarbons can be calculated using the collective area response of 3
components (n-nonane, n-decane and n-butylcyclohexane).
11.1.5 Using the PID chromatogram, calculate an average collective CF for the total concentration of C9-
C10 Aromatic Hydrocarbons. This value is the value for 1,2,4-trimethylbenzene, the only aromatic
standard within this range.
11.2 Sample Analysis
11.2.1 PID Chromatogram
11.2.1.1 If desired, determine the peak area counts for the Target VPH Analytes (using valley-to-
valley integration).
11.2.1.2 Determine the peak area count for the surrogate 2,5-dibromotoluene (using valley-to-
valley integration).
11.2.1.3 Determine the total area count for all peaks eluting 0.1 minutes after the Rt for o-xylene
and 0.1 minutes before the Rt for naphthalene (using baseline integration).
11.2.1.4 Using the equations contained in Section 9.6, calculate the concentrations of the surrogate
standard 2,5-dibromotoluene and C9 through C10 Aromatic Hydrocarbons. Optionally,
calculate the concentrations of the individual Target VPH Analytes.
11.2.2 FID Chromatogram
11.2.2.1 Determine the total area count for all peaks eluting 0.1 minutes before the Rt for n-pentane
and 0.01 minutes before the Rt for n-nonane (using baseline integration). It is not
necessary to identify or quantitate individual aliphatic compounds within this range.
11.2.2.2 Determine the total area count for all peaks eluting 0.01 minutes before the Rt for n-
nonane and 0.1 before the Rt for naphthalene (using baseline integration). It is not
necessary to identify or quantitate individual aliphatic compounds within this range.
11.2.2.3 Determine the peak area count for the surrogate standard 2,5-dibromotoluene (using
valley-to-valley integration).
11.2.2.4 Using the equations contained in Section 9.6, calculate the concentrations of C5 through C8
Aliphatic Hydrocarbons, C9 through C12 Aliphatic Hydrocarbons, and the surrogate
standard 2,5-dibromotoluene.
11.2.3 Data Adjustments
11.2.3.1 By definition, the collective concentrations of aliphatic and aromatic fractions of interest
exclude the individual concentrations of Target VPH Analytes. Accordingly, a series of
data adjustment steps are necessary to adjust the collective hydrocarbon range
concentrations calculated in Section 11.2.2.4, to eliminate “double counting” of analytes.
Volatile Petroleum Hydrocarbons by GC/PID/FID Revision 2.1
MassDEP-VPH-18-2.1 Page 29 February 2018
11.2.3.2 The necessary data adjustment steps may be taken by the laboratory reporting the range
concentration data, or by the data user. The extent of data adjustments taken by the
laboratory must be noted on the data report form.
11.2.3.2.1 Subtract the area counts of the surrogate compound(s) from the collective area
count of any range in which they elute. If the recommended surrogate 2,5-
dibromotoluene is used, no correction is necessary, as this compound elutes after
all ranges of interest.
11.2.3.2.2 Subtract the collective concentration of C9-C10 Aromatic Hydrocarbons from
the collective concentration of C9-C12 Aliphatic Hydrocarbons. Do not subtract
the C9-C10 Aromatic Hydrocarbon concentration if this concentration is less than
the RL. If the resulting C9–C12 Aliphatic Hydrocarbon value is less than the RL,
report “< RL” or “RL U”, with a specific value replacing “RL” (e.g., “< 10” or
“10 U”).
11.2.3.2.3 Subtract the individual concentrations of the Target VPH Analytes from the
appropriate aliphatic range (i.e., C5-C8 or C9-C12 Aliphatic Hydrocarbons) in
which they elute. Do not subtract any Target VPH Analyte concentration if this
concentration is less than the RL (lowest calibration standard). If the individual
concentrations of Target VPH Analytes have been quantitated using another
method (e.g., by using an MS detector), note this on the data report form. If the
individual concentrations of Target VPH Analytes have not been quantitated,
report the values as Unadjusted C5-C8 Aliphatic Hydrocarbons and Unadjusted
C9-C12 Aliphatic Hydrocarbons, and indicate “Not Determined” for C5-C8
Aliphatic Hydrocarbons and C9-C12 Aliphatic Hydrocarbons.
11.2.3.3 For purposes of compliance with the reporting and cleanup standards specified in the
MCP, the concentration of Unadjusted C5-C8 Aliphatic Hydrocarbons and Unadjusted C9-
C12 Aliphatic Hydrocarbons may be conservatively deemed to be equivalent to the
concentration of C5-C8 Aliphatic Hydrocarbons and C9-C12 Aliphatic Hydrocarbons.
11.3 Data Reporting Content
The required content for VPH Method by GC/PID/FID data is presented in Appendix 3. This information
provides data users with a succinct and complete summary of pertinent information and data, as well as a
clear affirmation that the QC procedures and standards specified in this method were evaluated and achieved.
Any significant modification to the MassDEP VPH by GC/PID/FID Method, as described in Section
11.3.1, and indicated by a negative response to Question E on the MassDEP Analytical Protocol
Certification Form (also included in Appendix 3) precludes the affected data from achieving “Presumptive
Certainty” status. If a significant modification to the VPH by GC/PID/FID Method is utilized, an
attachment to the analytical report must be included to demonstrate compliance with the method
performance requirements of Section 1.13 on a matrix- and petroleum product-specific basis.
While it is permissible to modify the reporting format, all of the data and information specified in Appendix 3
for these reports must be provided in a clear, concise, and succinct manner.
11.3.1 “Significant Modifications” to this method are defined as any deviations from “required,” “shall,” or
“must” provisions of this document, or any change or modification that will or could substantively
change the accuracy or precision of analytical results. Such modifications include, but are not
limited to, any of the following:
11.3.1.1 The use of alternative detectors other than GC/PID/FID to quantitate hydrocarbon range
concentrations;
11.3.1.2 The use of other than a purge-and-trap sample preparation procedure;
11.3.1.3 The use of a heated purge;
Volatile Petroleum Hydrocarbons by GC/PID/FID Revision 2.1
MassDEP-VPH-18-2.1 Page 30 February 2018
11.3.1.4 The use of non-linear repression (i.e., quadratic equations) for the calculation of Target
VPH Analytes and/or hydrocarbon ranges; or
11.3.1.5 Failure to provide all of the data and information presented in Appendix 3 as well as the
required method deliverables discussed in Section 11.3.3.
11.3.2 Positive affirmation that all required QC procedures and performance standards were followed and
achieved means that all of the required steps and procedures detailed in Sections 9.0 and 10.0 have
been followed, and that all data obtained from these steps and procedures were within the
acceptance limits specified for these steps and procedures.
11.3.3 In addition to sample results, the VPH data report must contain the following items:
LMB Results
LCS Results
LCSD Results
Matrix spike and/or matrix spike duplicate results (only if requested by data user)
Matrix duplicate results (only if requested by data user)
Surrogate spike recoveries (for all field samples and QC samples from each detector)
Summary of column used (manufacturer, column name, length, ID, film thickness)
Summary of trap used (manufacturer, trap contents)
Results of reanalyses or dilutions, reported as follows:
1. If reanalysis due to surrogate issues yields similar non-conformances, the laboratory
must report results of both analyses.
2. If reanalysis due to surrogate issues is performed outside of holding time and yields
acceptable surrogate recoveries, the laboratory must report results of both analyses.
3. If sample is not reanalyzed for surrogate issues due to obvious interference, the
laboratory must provide the chromatogram in the data report.
4. If diluted and undiluted analyses are performed, the laboratory must report results for
the lowest dilution within the valid calibration range for each analyte. The associated
QC (e.g., LMBs, LCS, etc.) for each analysis must be reported. This may result in
more than one analysis per sample being reported.
11.3.4 General laboratory reporting requirements are outlined in WSC-CAM-VII A, Quality Assurance
and Quality Control Guidelines for the Acquisition and Reporting of Analytical Data. A copy of
the required MassDEP MCP Analytical Protocol Certification Form is included in Appendix 3 of
this method.
12.0 REPORTING LIMITS
The RLs for Target VPH Analytes shall be based upon the concentration of the lowest calibration standard for the
analyte of interest. The RL must be greater than or equal to the concentration of the lowest calibration standard.
The RLs for hydrocarbon ranges shall be based upon the concentration of the lowest calibration standard for an
individual analyte within the range of interest. The RL will be set at 100x the concentration of the lowest calibration
standard for the associated analyte.
Based on a concentration of 1 µg/L for the lowest calibration standard for all analytes, the following RLs would be
generated for the hydrocarbon ranges:
Aqueous Samples: Hydrocarbon range RLs would be equivalent to 100 µg/L.
Volatile Petroleum Hydrocarbons by GC/PID/FID Revision 2.1
MassDEP-VPH-18-2.1 Page 31 February 2018
Soil/Sediment Samples: Hydrocarbon range RLs would be equivalent to 5 mg/kg based on a 1:1 ratio of methanol: soil
and analysis of a 100 µL aliquot of the methanol extract in 5 mL water.
13.0 METHOD PERFORMANCE
Single laboratory accuracy, precision and MDL data for method analytes are provided in Tables 1-1 through 1-2 in
Appendix 1. Chromatograms are provided in Appendix 2. For an evaluation of method performance, refer to
Evaluation of MassDEP Volatile Petroleum Hydrocarbon (VPH) Methods, Massachusetts Department of
Environmental Protection, June 2016.
14.0 REFERENCES
1. American Petroleum Institute Laboratory Study on Solubilities of Petroleum Hydrocarbons in Groundwater,
August 1985, API Publ. 4395.
2. ASTM Standard Practice for Sampling Waste and Soils for Volatile Organics Draft #1, 2/16/87.
3. ASTM Method D2216-92, Determination of Moisture Content of Soils and Sediments.
4. Fitzgerald, John Onsite Analytical Screening of Gasoline Contaminated Media Using a Jar Headspace
Procedure in Petroleum Contaminated Soils, Vol. 2, 1989.
5. Hughes, B. M., D. E. McKenzie, C. K. Trang, L. S. R. Minor, Examples of the Use of an Advances Mass
Spectrometric Data Processing Environment for the Determination of Sources of Wastes in Fifth Annual Waste
Testing and Quality Assurance Symposium; USEPA, July 24-28, 1989.
6. Leaking Underground Fuel Tank (LUFT) Field Manual, State Water Resources Control Board, State of
California, Sacramento, CA, May 1988.
7. MassDEP, 1994: Interim Final Petroleum Report: Development of Health-Based Alternative to the Total
Petroleum Hydrocarbon (TPH) Parameter, Massachusetts Department of Environmental Protection, August
1994.
8. MassDEP, 1998: Report on Results of the Fall 1997 VPH/EPH Round Robin Testing Program, Massachusetts
Department of Environmental Protection, January 12, 1998.
9. MassDEP, 2002: Characterizing Risks Posed by Petroleum Contaminated Sites: Implementation of the
MADEP VPH/EPH Approach, Massachusetts Department of Environmental Protection, WSC Policy # 02-
411, October 31, 2002.
10. MassDEP, 2003: Updated Petroleum Hydrocarbon Fraction Toxicity Values For VPH/EPH/APH
Methodology, Massachusetts Department of Environmental Protection, November 2003.
11. MassDEP, 2016: Evaluation of MassDEP Volatile Petroleum Hydrocarbon (VPH) Methods, Massachusetts
Department of Environmental Protection, June 2016.
12. Parr, J. L., G. Walters, and M. Hoffman, Sampling and Analysis of Soils for Gasoline Range Organics presented
at First Annual West Coast Conference Hydrocarbon Contaminated Soils and Groundwater, 2/21/90.
13. Senn, R. B., and M. S. Johnson, Interpretation of Gas Chromatographic Data in Subsurface Hydrocarbon
Investigations, Ground Water Monitoring Review, 1987.
14. Siegrist, R. L. and P.D. Jenssen, Evaluation of Sampling Method Effects on Volatile Organic Compound
Measurements in Contaminated Soils, Environmental Science and Technology, Vol. 24, November 9, 1990.
15. Urban, M. J., J. S. Smith, E. K/ Schultz, R. K. Dickson, Volatile Organic Analysis for a Soil Sediment or Waste
Sample in Fifth Annual Waste Testing and Quality Assurance Symposium; USEPA, July 24-28, 1989.
Volatile Petroleum Hydrocarbons by GC/PID/FID Revision 2.1
MassDEP-VPH-18-2.1 Page 32 February 2018
16. USEPA UST Workgroup, Draft Method for Determination of Gasoline Range Organics, November, 1990.
17. USEPA, Measurements of Petroleum Hydrocarbons: Report on Activities to Develop a Manual; Prepared by
Midwest Research Institute, Falls Church, VA under EPA Contract No. 68-WO-0015, WA No. 4; Submitted to
USEPA Office of Underground Storage Tanks; Washington, DC; November 20, 1990.
18. USEPA, Guidance on Evaluation, Resolution, and Documentation of Analytical Problems Associated with
Compliance Monitoring, EPA 821-B-93-001; U.S. Government Printing Office, Washington D.C., June, 1993.
19. USEPA: SW-846 Test Methods for Evaluating Solid Waste, 3rd Edition; Methods 5030B, 5035A, 8000D,
8015C, and 8021B.
20. Wisconsin DNR, Modified GRO Method for Determining Gasoline Range Organics, PUBL-SW-140, 1992.
Volatile Petroleum Hydrocarbons by GC/PID/FID Revision 2.1
MassDEP-VPH-18-2.1 Page 33 February 2018
TABLES
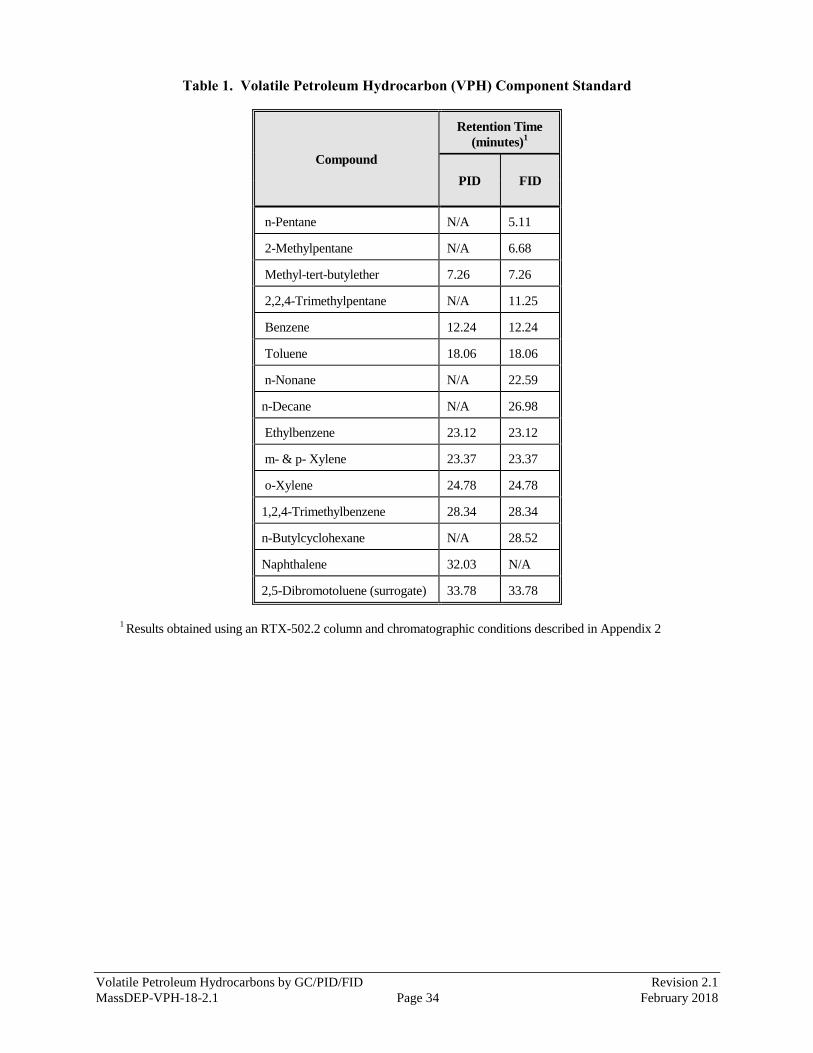
Volatile Petroleum Hydrocarbons by GC/PID/FID Revision 2.1
MassDEP-VPH-18-2.1 Page 34 February 2018
Table 1. Volatile Petroleum Hydrocarbon (VPH) Component Standard
Compound
Retention Time
(minutes)1
PID FID
n-Pentane N/A 5.11
2-Methylpentane N/A 6.68
Methyl-tert-butylether 7.26 7.26
2,2,4-Trimethylpentane N/A 11.25
Benzene 12.24 12.24
Toluene 18.06 18.06
n-Nonane N/A 22.59
n-Decane N/A 26.98
Ethylbenzene 23.12 23.12
m- & p- Xylene 23.37 23.37
o-Xylene 24.78 24.78
1,2,4-Trimethylbenzene 28.34 28.34
n-Butylcyclohexane N/A 28.52
Naphthalene 32.03 N/A
2,5-Dibromotoluene (surrogate) 33.78 33.78
1 Results obtained using an RTX-502.2 column and chromatographic conditions described in Appendix 2
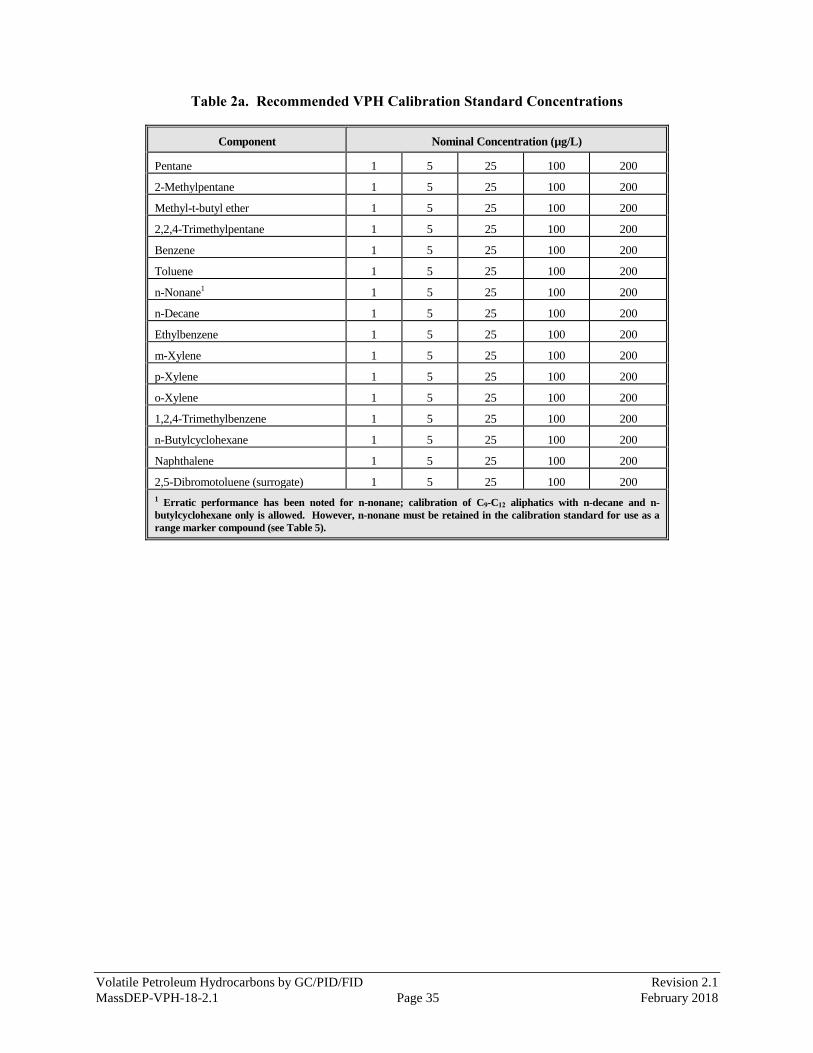
Volatile Petroleum Hydrocarbons by GC/PID/FID Revision 2.1
MassDEP-VPH-18-2.1 Page 35 February 2018
Table 2a. Recommended VPH Calibration Standard Concentrations
Component Nominal Concentration (µg/L)
Pentane 1 5 25 100 200
2-Methylpentane 1 5 25 100 200
Methyl-t-butyl ether 1 5 25 100 200
2,2,4-Trimethylpentane 1 5 25 100 200
Benzene 1 5 25 100 200
Toluene 1 5 25 100 200
n-Nonane1 1 5 25 100 200
n-Decane 1 5 25 100 200
Ethylbenzene 1 5 25 100 200
m-Xylene 1 5 25 100 200
p-Xylene 1 5 25 100 200
o-Xylene 1 5 25 100 200
1,2,4-Trimethylbenzene 1 5 25 100 200
n-Butylcyclohexane 1 5 25 100 200
Naphthalene 1 5 25 100 200
2,5-Dibromotoluene (surrogate) 1 5 25 100 200
1 Erratic performance has been noted for n-nonane; calibration of C9-C12 aliphatics with n-decane and n-
butylcyclohexane only is allowed. However, n-nonane must be retained in the calibration standard for use as a
range marker compound (see Table 5).
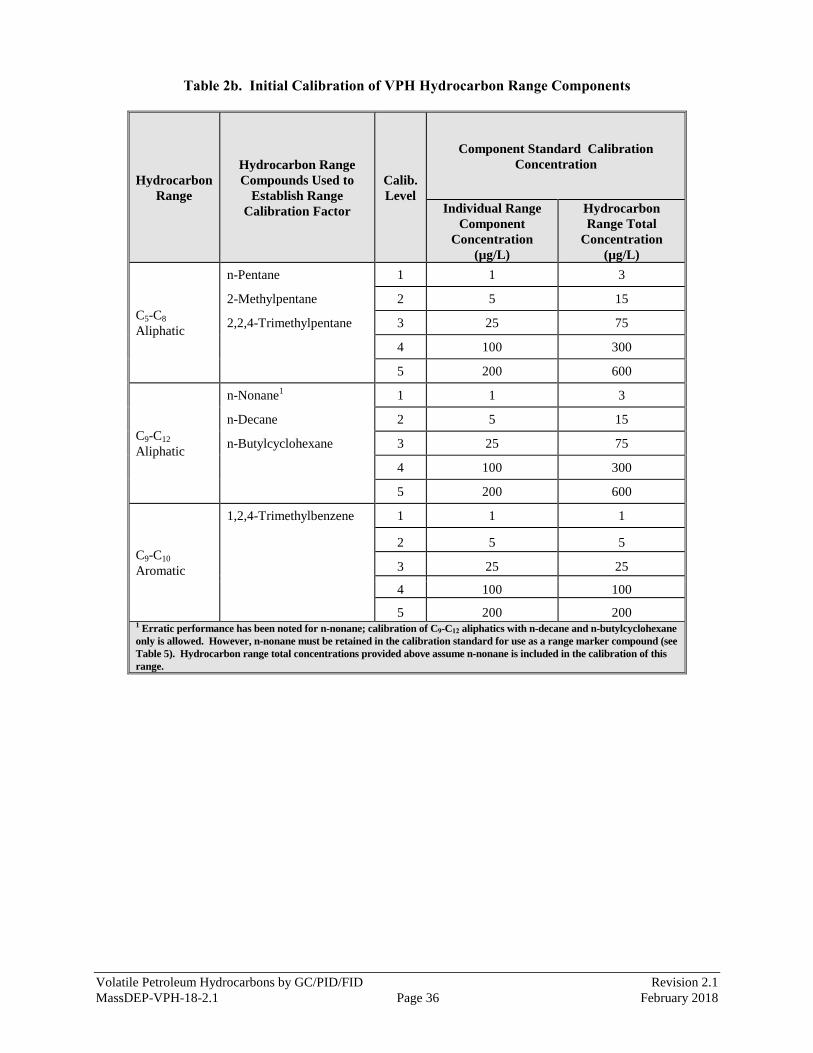
Volatile Petroleum Hydrocarbons by GC/PID/FID Revision 2.1
MassDEP-VPH-18-2.1 Page 36 February 2018
Table 2b. Initial Calibration of VPH Hydrocarbon Range Components
Hydrocarbon
Range
Hydrocarbon Range
Compounds Used to
Establish Range
Calibration Factor
Calib.
Level
Component Standard Calibration
Concentration
Individual Range
Component
Concentration
(µg/L)
Hydrocarbon
Range Total
Concentration
(µg/L)
C5-C8
Aliphatic
n-Pentane 1 1 3
2-Methylpentane 2 5 15
2,2,4-Trimethylpentane 3 25 75
4 100 300
5 200 600
C9-C12
Aliphatic
n-Nonane1 1 1 3
n-Decane 2 5 15
n-Butylcyclohexane 3 25 75
4 100 300
5 200 600
C9-C10
Aromatic
1,2,4-Trimethylbenzene 1 1 1
2 5 5
3 25 25
4 100 100
5 200 200 1 Erratic performance has been noted for n-nonane; calibration of C9-C12 aliphatics with n-decane and n-butylcyclohexane
only is allowed. However, n-nonane must be retained in the calibration standard for use as a range marker compound (see
Table 5). Hydrocarbon range total concentrations provided above assume n-nonane is included in the calibration of this
range.
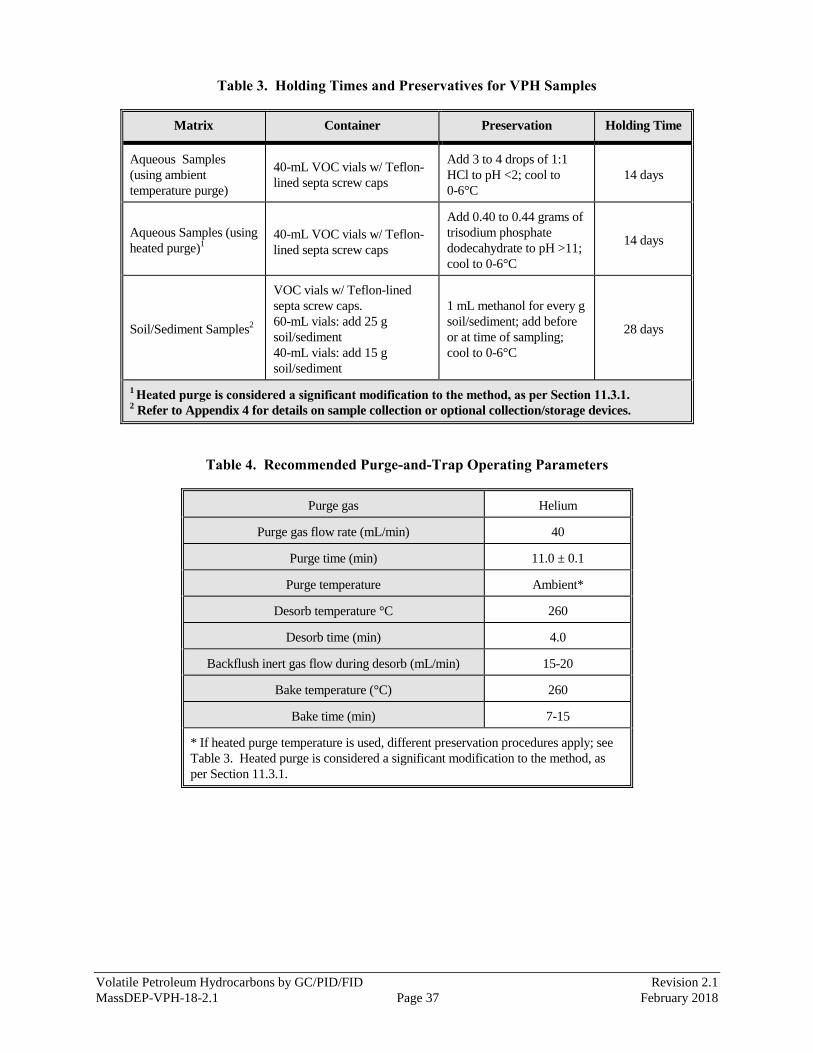
Volatile Petroleum Hydrocarbons by GC/PID/FID Revision 2.1
MassDEP-VPH-18-2.1 Page 37 February 2018
Table 3. Holding Times and Preservatives for VPH Samples
Matrix Container Preservation Holding Time
Aqueous Samples
(using ambient
temperature purge)
40-mL VOC vials w/ Teflon-
lined septa screw caps
Add 3 to 4 drops of 1:1
HCl to pH <2; cool to
0-6°C
14 days
Aqueous Samples (using
heated purge)1
40-mL VOC vials w/ Teflon-
lined septa screw caps
Add 0.40 to 0.44 grams of
trisodium phosphate
dodecahydrate to pH >11;
cool to 0-6°C
14 days
Soil/Sediment Samples2
VOC vials w/ Teflon-lined
septa screw caps.
60-mL vials: add 25 g
soil/sediment
40-mL vials: add 15 g
soil/sediment
1 mL methanol for every g
soil/sediment; add before
or at time of sampling;
cool to 0-6°C
28 days
1 Heated purge is considered a significant modification to the method, as per Section 11.3.1.
2 Refer to Appendix 4 for details on sample collection or optional collection/storage devices.
Table 4. Recommended Purge-and-Trap Operating Parameters
Purge gas Helium
Purge gas flow rate (mL/min) 40
Purge time (min) 11.0 ± 0.1
Purge temperature Ambient*
Desorb temperature °C 260
Desorb time (min) 4.0
Backflush inert gas flow during desorb (mL/min) 15-20
Bake temperature (°C) 260
Bake time (min) 7-15
* If heated purge temperature is used, different preservation procedures apply; see
Table 3. Heated purge is considered a significant modification to the method, as
per Section 11.3.1.
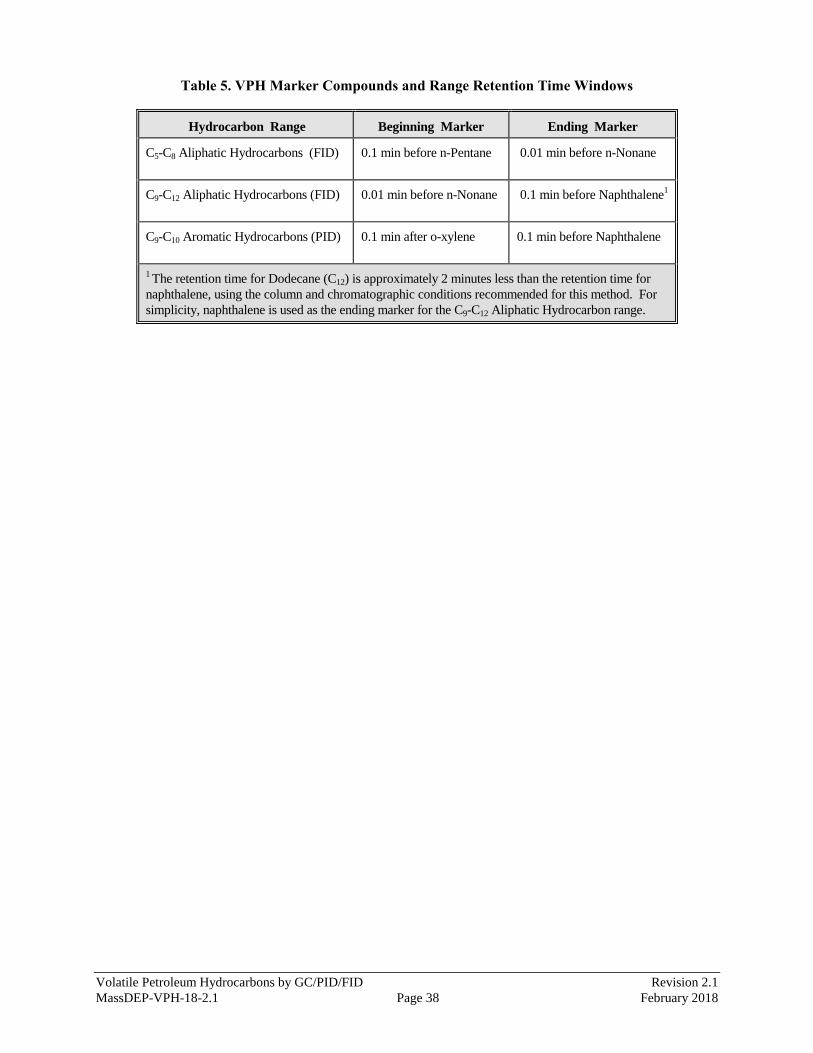
Volatile Petroleum Hydrocarbons by GC/PID/FID Revision 2.1
MassDEP-VPH-18-2.1 Page 38 February 2018
Table 5. VPH Marker Compounds and Range Retention Time Windows
Hydrocarbon Range Beginning Marker Ending Marker
C5-C8 Aliphatic Hydrocarbons (FID) 0.1 min before n-Pentane
0.01 min before n-Nonane
C9-C12 Aliphatic Hydrocarbons (FID) 0.01 min before n-Nonane
0.1 min before Naphthalene1
C9-C10 Aromatic Hydrocarbons (PID) 0.1 min after o-xylene
0.1 min before Naphthalene
1 The retention time for Dodecane (C12) is approximately 2 minutes less than the retention time for
naphthalene, using the column and chromatographic conditions recommended for this method. For
simplicity, naphthalene is used as the ending marker for the C9-C12 Aliphatic Hydrocarbon range.
Volatile Petroleum Hydrocarbons by GC/PID/FID Revision 2.1
MassDEP-VPH-18-2.1 1-1 February 2018
APPENDIX 1
SINGLE LABORATORY ACCURACY, PRECISION, AND
METHOD DETECTION LIMITS (MDL) DATA
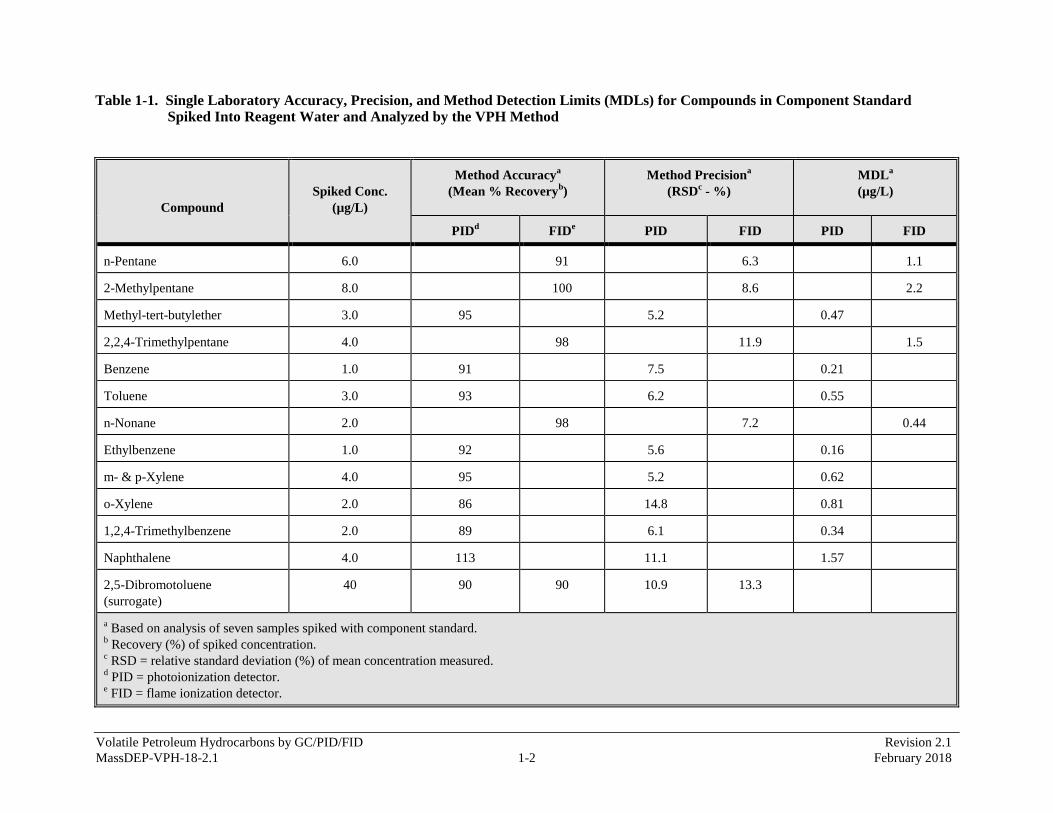
Volatile Petroleum Hydrocarbons by GC/PID/FID Revision 2.1
MassDEP-VPH-18-2.1 1-2 February 2018
Table 1-1. Single Laboratory Accuracy, Precision, and Method Detection Limits (MDLs) for Compounds in Component Standard Spiked Into Reagent Water and Analyzed by the VPH Method
Compound
Spiked Conc.
(µg/L)
Method Accuracya
(Mean % Recoveryb)
Method Precisiona
(RSDc - %)
MDLa
(µg/L)
PIDd FID
e PID FID PID FID
n-Pentane 6.0 91 6.3 1.1
2-Methylpentane 8.0 100 8.6 2.2
Methyl-tert-butylether 3.0 95 5.2 0.47
2,2,4-Trimethylpentane 4.0 98 11.9 1.5
Benzene 1.0 91 7.5 0.21
Toluene 3.0 93 6.2 0.55
n-Nonane 2.0 98 7.2 0.44
Ethylbenzene 1.0 92 5.6 0.16
m- & p-Xylene 4.0 95 5.2 0.62
o-Xylene 2.0 86 14.8 0.81
1,2,4-Trimethylbenzene 2.0 89 6.1 0.34
Naphthalene 4.0 113 11.1 1.57
2,5-Dibromotoluene
(surrogate)
40 90 90 10.9 13.3
a Based on analysis of seven samples spiked with component standard.
b Recovery (%) of spiked concentration.
c RSD = relative standard deviation (%) of mean concentration measured.
d PID = photoionization detector.
e FID = flame ionization detector.
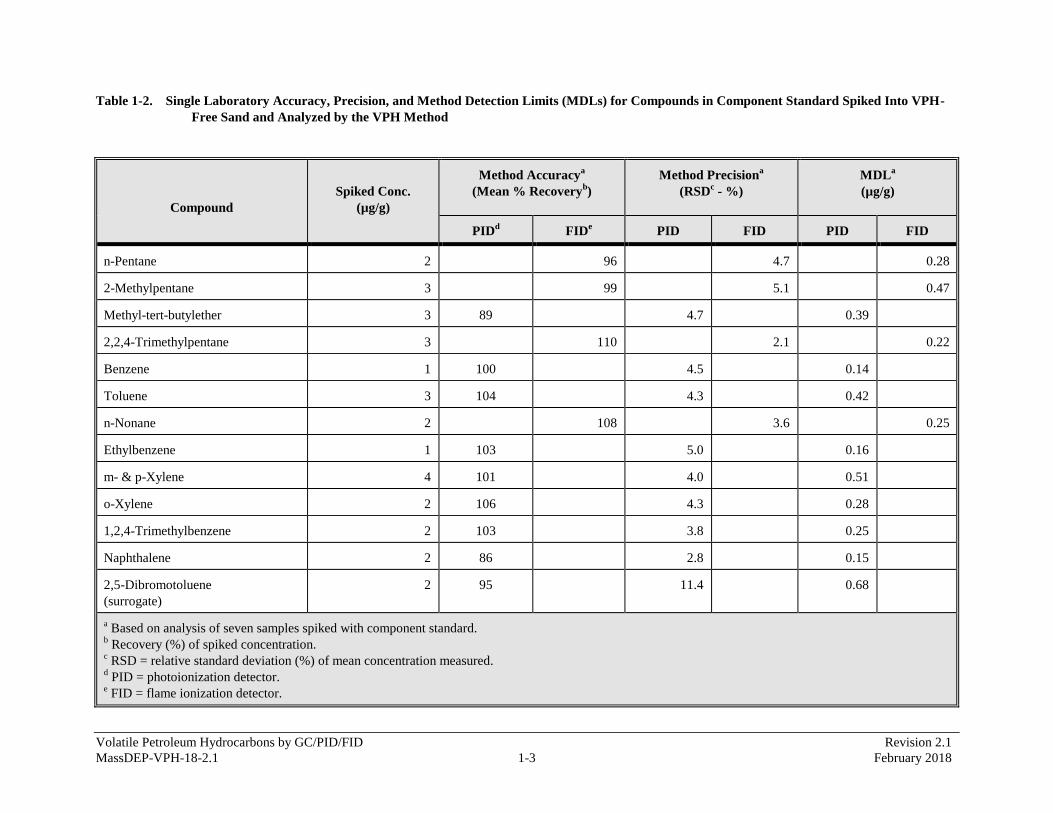
Volatile Petroleum Hydrocarbons by GC/PID/FID Revision 2.1
MassDEP-VPH-18-2.1 1-3 February 2018
Table 1-2. Single Laboratory Accuracy, Precision, and Method Detection Limits (MDLs) for Compounds in Component Standard Spiked Into VPH-
Free Sand and Analyzed by the VPH Method
Compound
Spiked Conc.
(µg/g)
Method Accuracya
(Mean % Recoveryb)
Method Precisiona
(RSDc - %)
MDLa
(µg/g)
PIDd FID
e PID FID PID FID
n-Pentane 2 96 4.7 0.28
2-Methylpentane 3 99 5.1 0.47
Methyl-tert-butylether 3 89 4.7 0.39
2,2,4-Trimethylpentane 3 110 2.1 0.22
Benzene 1 100 4.5 0.14
Toluene 3 104 4.3 0.42
n-Nonane 2 108 3.6 0.25
Ethylbenzene 1 103 5.0 0.16
m- & p-Xylene 4 101 4.0 0.51
o-Xylene 2 106 4.3 0.28
1,2,4-Trimethylbenzene 2 103 3.8 0.25
Naphthalene 2 86 2.8 0.15
2,5-Dibromotoluene
(surrogate)
2 95 11.4 0.68
a Based on analysis of seven samples spiked with component standard.
b Recovery (%) of spiked concentration.
c RSD = relative standard deviation (%) of mean concentration measured.
d PID = photoionization detector.
e FID = flame ionization detector.
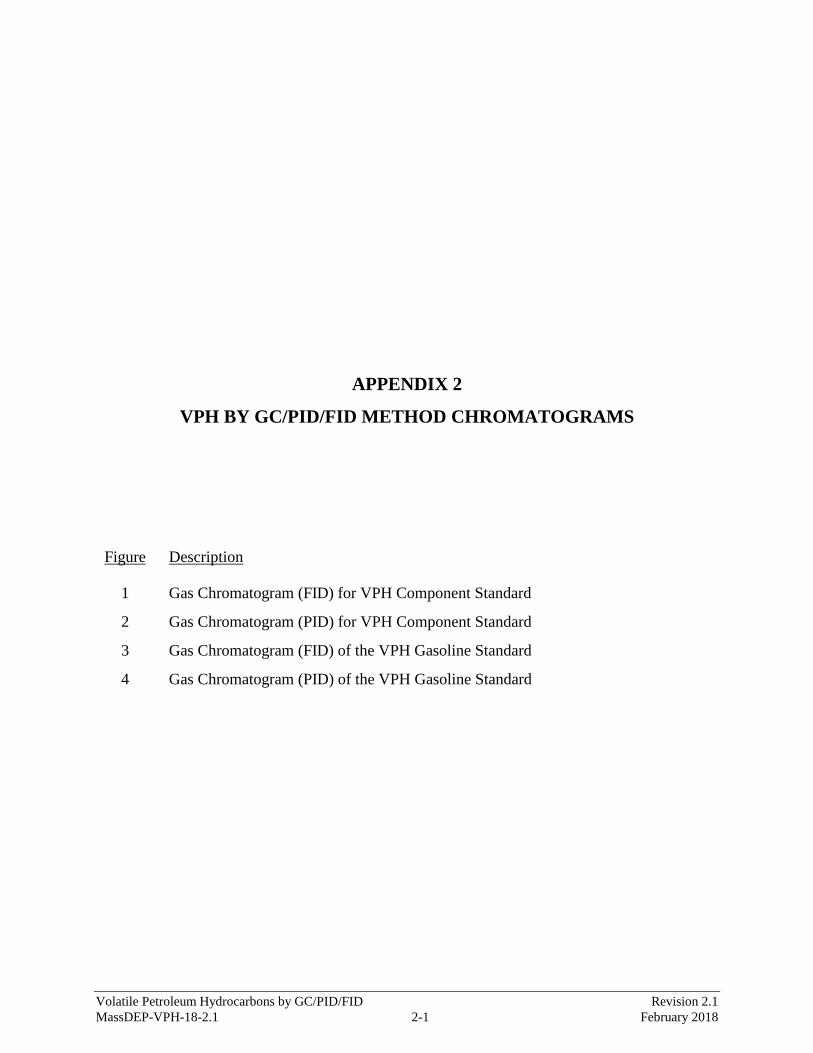
Volatile Petroleum Hydrocarbons by GC/PID/FID Revision 2.1
MassDEP-VPH-18-2.1 2-1 February 2018
APPENDIX 2 VPH BY GC/PID/FID METHOD CHROMATOGRAMS
Figure Description
1 Gas Chromatogram (FID) for VPH Component Standard
2 Gas Chromatogram (PID) for VPH Component Standard
3 Gas Chromatogram (FID) of the VPH Gasoline Standard
4 Gas Chromatogram (PID) of the VPH Gasoline Standard
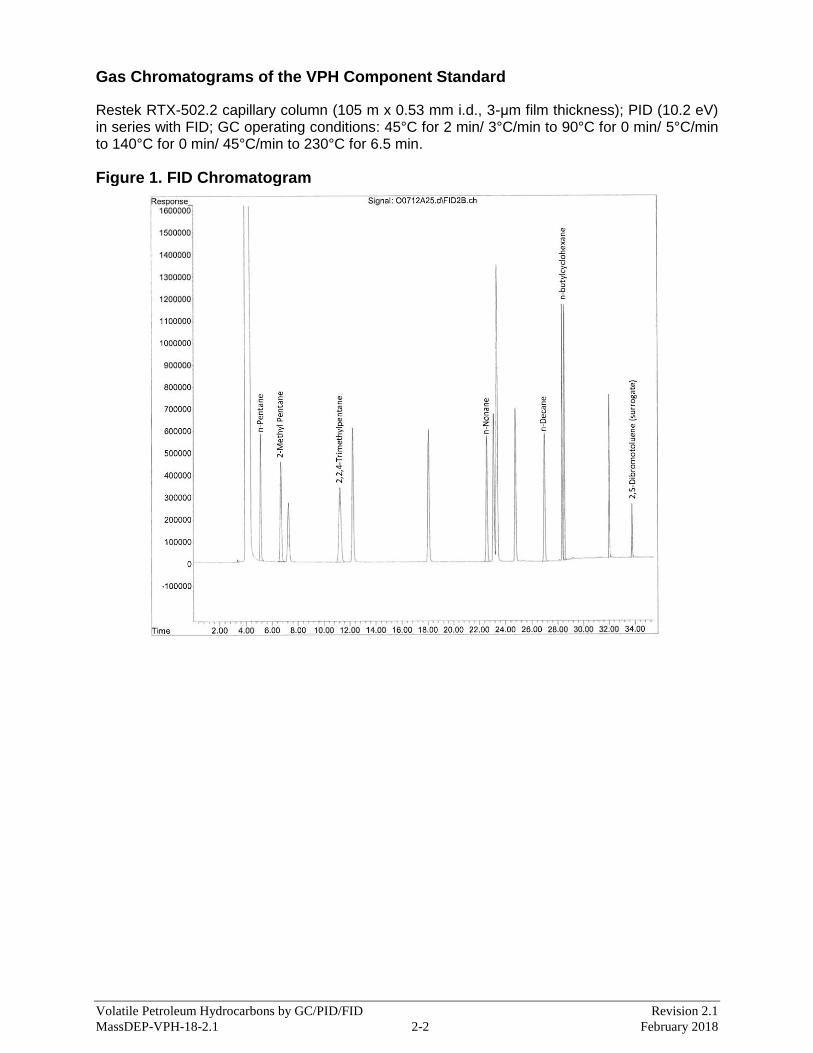
Volatile Petroleum Hydrocarbons by GC/PID/FID Revision 2.1
MassDEP-VPH-18-2.1 2-2 February 2018
Gas Chromatograms of the VPH Component Standard
Restek RTX-502.2 capillary column (105 m x 0.53 mm i.d., 3-μm film thickness); PID (10.2 eV) in series with FID; GC operating conditions: 45°C for 2 min/ 3°C/min to 90°C for 0 min/ 5°C/min to 140°C for 0 min/ 45°C/min to 230°C for 6.5 min.
Figure 1. FID Chromatogram
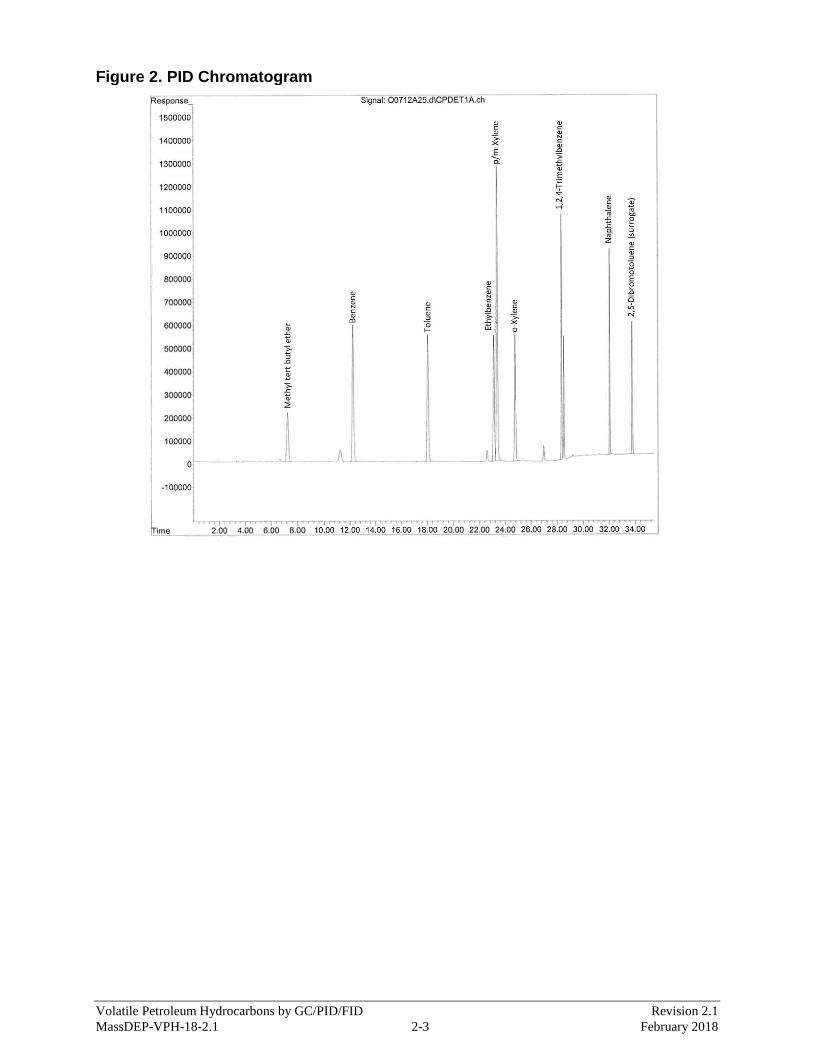
Volatile Petroleum Hydrocarbons by GC/PID/FID Revision 2.1
MassDEP-VPH-18-2.1 2-3 February 2018
Figure 2. PID Chromatogram
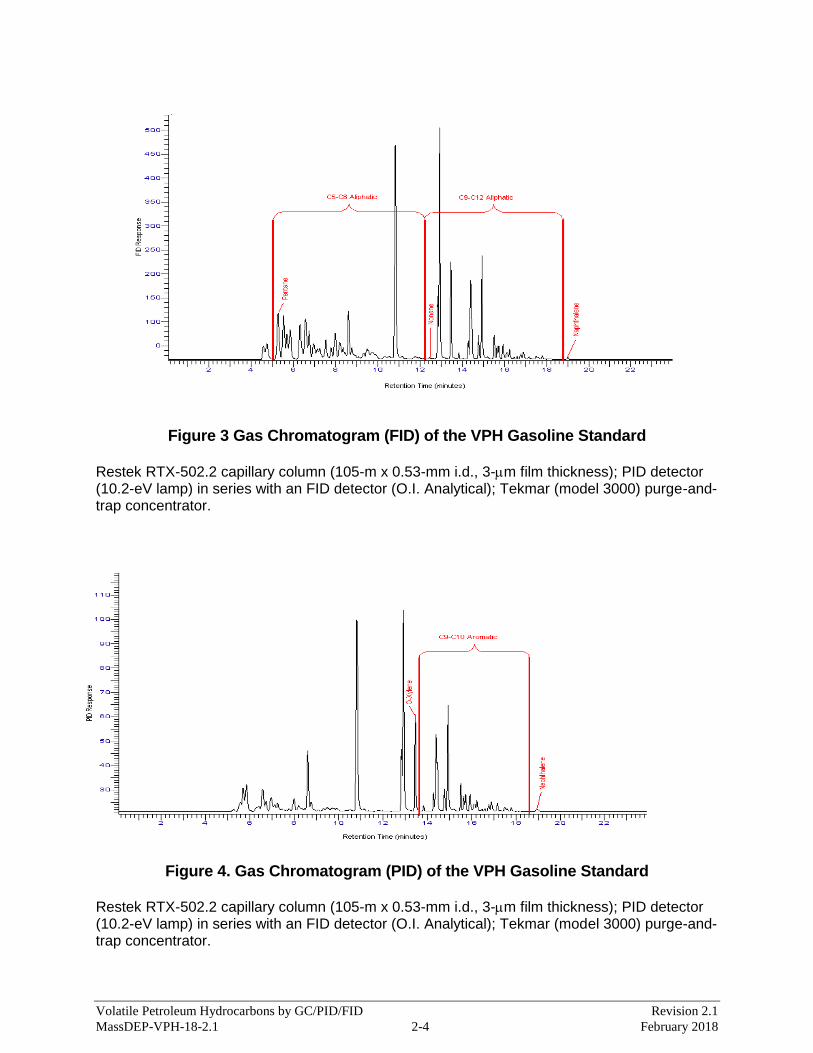
Volatile Petroleum Hydrocarbons by GC/PID/FID Revision 2.1
MassDEP-VPH-18-2.1 2-4 February 2018
Figure 3 Gas Chromatogram (FID) of the VPH Gasoline Standard
Restek RTX-502.2 capillary column (105-m x 0.53-mm i.d., 3-m film thickness); PID detector (10.2-eV lamp) in series with an FID detector (O.I. Analytical); Tekmar (model 3000) purge-and-trap concentrator.
Figure 4. Gas Chromatogram (PID) of the VPH Gasoline Standard
Restek RTX-502.2 capillary column (105-m x 0.53-mm i.d., 3-m film thickness); PID detector (10.2-eV lamp) in series with an FID detector (O.I. Analytical); Tekmar (model 3000) purge-and-trap concentrator.
Volatile Petroleum Hydrocarbons by GC/PID/FID Revision 2.1
MassDEP-VPH-18-2.1 3-1 February 2018
APPENDIX 3
REQUIRED VPH DATA REPORT INFORMATION
Exhibit 1 Required VPH Data Report Information
Exhibit 2 MassDEP Analytical Protocol Certification Form
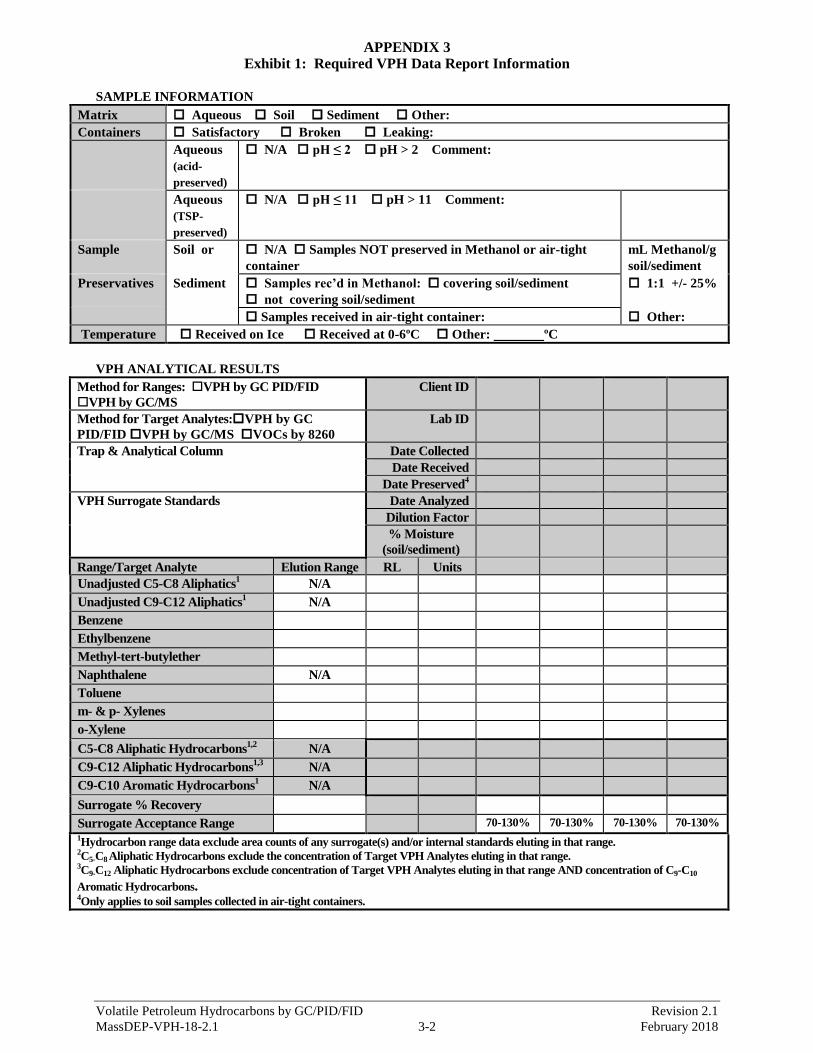
Volatile Petroleum Hydrocarbons by GC/PID/FID Revision 2.1
MassDEP-VPH-18-2.1 3-2 February 2018
APPENDIX 3 Exhibit 1: Required VPH Data Report Information
SAMPLE INFORMATION
Matrix Aqueous Soil Sediment Other:
Containers Satisfactory Broken Leaking:
Aqueous
(acid-
preserved)
N/A pH ≤ 2 pH > 2 Comment:
Aqueous
(TSP-
preserved)
N/A pH ≤ 11 pH > 11 Comment:
Sample Soil or N/A Samples NOT preserved in Methanol or air-tight
container
mL Methanol/g
soil/sediment
Preservatives Sediment Samples rec’d in Methanol: covering soil/sediment
not covering soil/sediment
1:1 +/- 25%
Samples received in air-tight container: Other:
Temperature Received on Ice Received at 0-6ºC Other: ºC
VPH ANALYTICAL RESULTS
Method for Ranges: VPH by GC PID/FID
VPH by GC/MS
Client ID
Method for Target Analytes:VPH by GC
PID/FID VPH by GC/MS VOCs by 8260
Lab ID
Trap & Analytical Column Date Collected
Date Received
Date Preserved4
VPH Surrogate Standards Date Analyzed
Dilution Factor
% Moisture
(soil/sediment)
Range/Target Analyte Elution Range RL Units
Unadjusted C5-C8 Aliphatics1 N/A
Unadjusted C9-C12 Aliphatics1 N/A
Benzene
Ethylbenzene
Methyl-tert-butylether
Naphthalene N/A
Toluene
m- & p- Xylenes
o-Xylene
C5-C8 Aliphatic Hydrocarbons1,2
N/A
C9-C12 Aliphatic Hydrocarbons1,3
N/A
C9-C10 Aromatic Hydrocarbons1 N/A
Surrogate % Recovery
Surrogate Acceptance Range 70-130% 70-130% 70-130% 70-130%
1Hydrocarbon range data exclude area counts of any surrogate(s) and/or internal standards eluting in that range. 2C5-C8 Aliphatic Hydrocarbons exclude the concentration of Target VPH Analytes eluting in that range. 3C9-C12 Aliphatic Hydrocarbons exclude concentration of Target VPH Analytes eluting in that range AND concentration of C9-C10
Aromatic Hydrocarbons. 4Only applies to soil samples collected in air-tight containers.
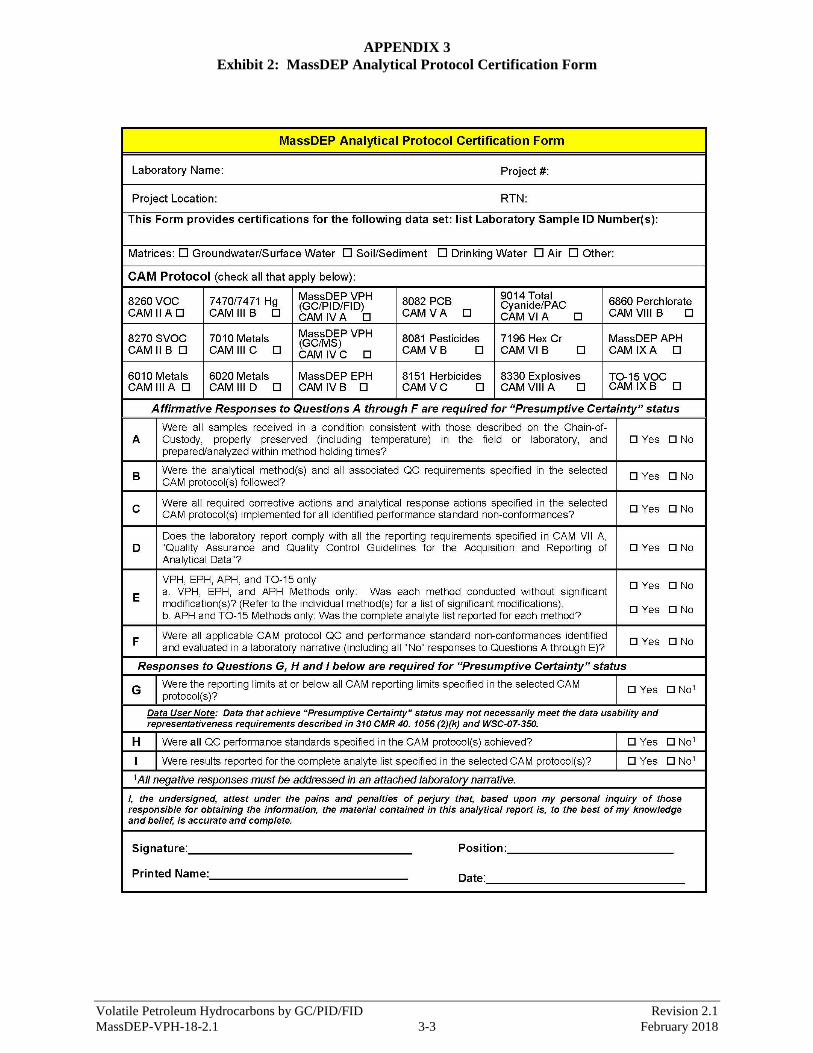
Volatile Petroleum Hydrocarbons by GC/PID/FID Revision 2.1
MassDEP-VPH-18-2.1 3-3 February 2018
APPENDIX 3
Exhibit 2: MassDEP Analytical Protocol Certification Form
Volatile Petroleum Hydrocarbons by GC/PID/FID Revision 2.1
MassDEP-VPH-18-2.1 4-1 February 2018
APPENDIX 4
1. Collecting and Preserving VPH Soil/Sediment Samples
2. Collecting and Preserving VPH Aqueous Samples
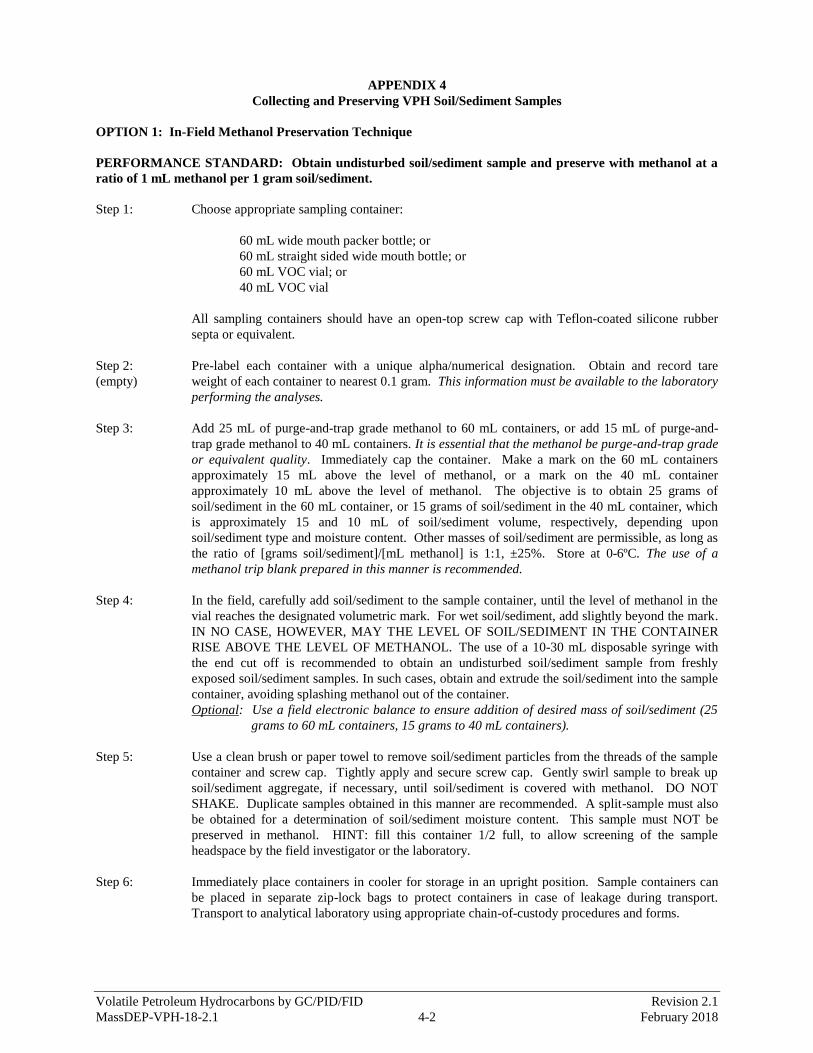
Volatile Petroleum Hydrocarbons by GC/PID/FID Revision 2.1
MassDEP-VPH-18-2.1 4-2 February 2018
APPENDIX 4
Collecting and Preserving VPH Soil/Sediment Samples
OPTION 1: In-Field Methanol Preservation Technique
PERFORMANCE STANDARD: Obtain undisturbed soil/sediment sample and preserve with methanol at a
ratio of 1 mL methanol per 1 gram soil/sediment.
Step 1: Choose appropriate sampling container:
60 mL wide mouth packer bottle; or
60 mL straight sided wide mouth bottle; or
60 mL VOC vial; or
40 mL VOC vial
All sampling containers should have an open-top screw cap with Teflon-coated silicone rubber
septa or equivalent.
Step 2: Pre-label each container with a unique alpha/numerical designation. Obtain and record tare
(empty) weight of each container to nearest 0.1 gram. This information must be available to the laboratory
performing the analyses.
Step 3: Add 25 mL of purge-and-trap grade methanol to 60 mL containers, or add 15 mL of purge-and-
trap grade methanol to 40 mL containers. It is essential that the methanol be purge-and-trap grade
or equivalent quality. Immediately cap the container. Make a mark on the 60 mL containers
approximately 15 mL above the level of methanol, or a mark on the 40 mL container
approximately 10 mL above the level of methanol. The objective is to obtain 25 grams of
soil/sediment in the 60 mL container, or 15 grams of soil/sediment in the 40 mL container, which
is approximately 15 and 10 mL of soil/sediment volume, respectively, depending upon
soil/sediment type and moisture content. Other masses of soil/sediment are permissible, as long as
the ratio of [grams soil/sediment]/[mL methanol] is 1:1, ±25%. Store at 0-6ºC. The use of a
methanol trip blank prepared in this manner is recommended.
Step 4: In the field, carefully add soil/sediment to the sample container, until the level of methanol in the
vial reaches the designated volumetric mark. For wet soil/sediment, add slightly beyond the mark.
IN NO CASE, HOWEVER, MAY THE LEVEL OF SOIL/SEDIMENT IN THE CONTAINER
RISE ABOVE THE LEVEL OF METHANOL. The use of a 10-30 mL disposable syringe with
the end cut off is recommended to obtain an undisturbed soil/sediment sample from freshly
exposed soil/sediment samples. In such cases, obtain and extrude the soil/sediment into the sample
container, avoiding splashing methanol out of the container.
Optional: Use a field electronic balance to ensure addition of desired mass of soil/sediment (25
grams to 60 mL containers, 15 grams to 40 mL containers).
Step 5: Use a clean brush or paper towel to remove soil/sediment particles from the threads of the sample
container and screw cap. Tightly apply and secure screw cap. Gently swirl sample to break up
soil/sediment aggregate, if necessary, until soil/sediment is covered with methanol. DO NOT
SHAKE. Duplicate samples obtained in this manner are recommended. A split-sample must also
be obtained for a determination of soil/sediment moisture content. This sample must NOT be
preserved in methanol. HINT: fill this container 1/2 full, to allow screening of the sample
headspace by the field investigator or the laboratory.
Step 6: Immediately place containers in cooler for storage in an upright position. Sample containers can
be placed in separate zip-lock bags to protect containers in case of leakage during transport.
Transport to analytical laboratory using appropriate chain-of-custody procedures and forms.
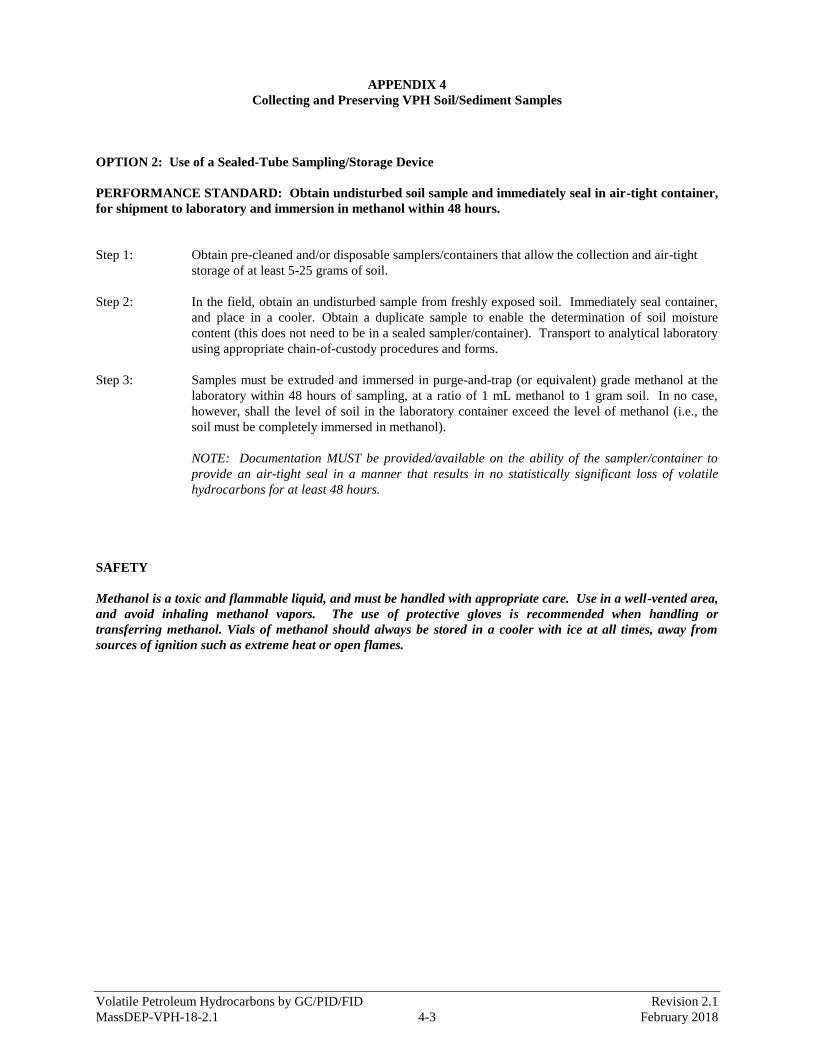
Volatile Petroleum Hydrocarbons by GC/PID/FID Revision 2.1
MassDEP-VPH-18-2.1 4-3 February 2018
APPENDIX 4
Collecting and Preserving VPH Soil/Sediment Samples
OPTION 2: Use of a Sealed-Tube Sampling/Storage Device
PERFORMANCE STANDARD: Obtain undisturbed soil sample and immediately seal in air-tight container,
for shipment to laboratory and immersion in methanol within 48 hours.
Step 1: Obtain pre-cleaned and/or disposable samplers/containers that allow the collection and air-tight
storage of at least 5-25 grams of soil.
Step 2: In the field, obtain an undisturbed sample from freshly exposed soil. Immediately seal container,
and place in a cooler. Obtain a duplicate sample to enable the determination of soil moisture
content (this does not need to be in a sealed sampler/container). Transport to analytical laboratory
using appropriate chain-of-custody procedures and forms.
Step 3: Samples must be extruded and immersed in purge-and-trap (or equivalent) grade methanol at the
laboratory within 48 hours of sampling, at a ratio of 1 mL methanol to 1 gram soil. In no case,
however, shall the level of soil in the laboratory container exceed the level of methanol (i.e., the
soil must be completely immersed in methanol).
NOTE: Documentation MUST be provided/available on the ability of the sampler/container to
provide an air-tight seal in a manner that results in no statistically significant loss of volatile
hydrocarbons for at least 48 hours.
SAFETY
Methanol is a toxic and flammable liquid, and must be handled with appropriate care. Use in a well-vented area,
and avoid inhaling methanol vapors. The use of protective gloves is recommended when handling or
transferring methanol. Vials of methanol should always be stored in a cooler with ice at all times, away from
sources of ignition such as extreme heat or open flames.
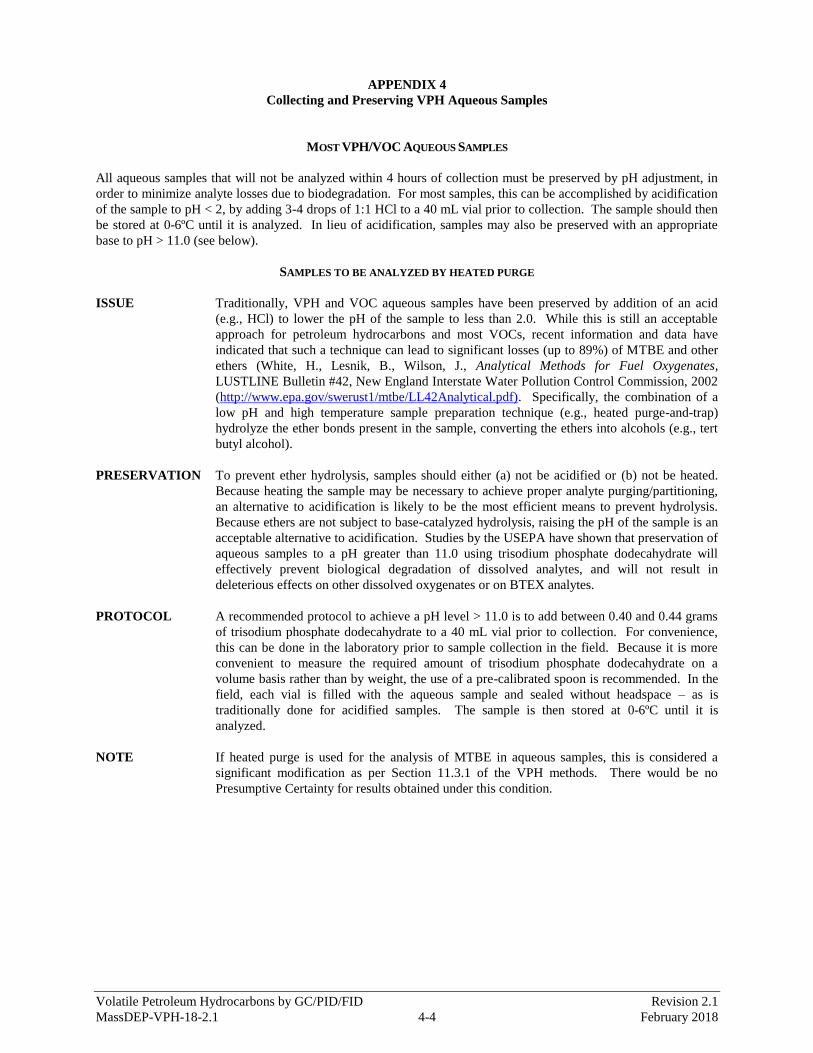
Volatile Petroleum Hydrocarbons by GC/PID/FID Revision 2.1
MassDEP-VPH-18-2.1 4-4 February 2018
APPENDIX 4
Collecting and Preserving VPH Aqueous Samples
MOST VPH/VOC AQUEOUS SAMPLES
All aqueous samples that will not be analyzed within 4 hours of collection must be preserved by pH adjustment, in
order to minimize analyte losses due to biodegradation. For most samples, this can be accomplished by acidification
of the sample to pH < 2, by adding 3-4 drops of 1:1 HCl to a 40 mL vial prior to collection. The sample should then
be stored at 0-6ºC until it is analyzed. In lieu of acidification, samples may also be preserved with an appropriate
base to pH > 11.0 (see below).
SAMPLES TO BE ANALYZED BY HEATED PURGE
ISSUE Traditionally, VPH and VOC aqueous samples have been preserved by addition of an acid
(e.g., HCl) to lower the pH of the sample to less than 2.0. While this is still an acceptable
approach for petroleum hydrocarbons and most VOCs, recent information and data have
indicated that such a technique can lead to significant losses (up to 89%) of MTBE and other
ethers (White, H., Lesnik, B., Wilson, J., Analytical Methods for Fuel Oxygenates,
LUSTLINE Bulletin #42, New England Interstate Water Pollution Control Commission, 2002
(http://www.epa.gov/swerust1/mtbe/LL42Analytical.pdf). Specifically, the combination of a
low pH and high temperature sample preparation technique (e.g., heated purge-and-trap)
hydrolyze the ether bonds present in the sample, converting the ethers into alcohols (e.g., tert
butyl alcohol).
PRESERVATION To prevent ether hydrolysis, samples should either (a) not be acidified or (b) not be heated.
Because heating the sample may be necessary to achieve proper analyte purging/partitioning,
an alternative to acidification is likely to be the most efficient means to prevent hydrolysis.
Because ethers are not subject to base-catalyzed hydrolysis, raising the pH of the sample is an
acceptable alternative to acidification. Studies by the USEPA have shown that preservation of
aqueous samples to a pH greater than 11.0 using trisodium phosphate dodecahydrate will
effectively prevent biological degradation of dissolved analytes, and will not result in
deleterious effects on other dissolved oxygenates or on BTEX analytes.
PROTOCOL A recommended protocol to achieve a pH level > 11.0 is to add between 0.40 and 0.44 grams
of trisodium phosphate dodecahydrate to a 40 mL vial prior to collection. For convenience,
this can be done in the laboratory prior to sample collection in the field. Because it is more
convenient to measure the required amount of trisodium phosphate dodecahydrate on a
volume basis rather than by weight, the use of a pre-calibrated spoon is recommended. In the
field, each vial is filled with the aqueous sample and sealed without headspace – as is
traditionally done for acidified samples. The sample is then stored at 0-6ºC until it is
analyzed.
NOTE If heated purge is used for the analysis of MTBE in aqueous samples, this is considered a
significant modification as per Section 11.3.1 of the VPH methods. There would be no
Presumptive Certainty for results obtained under this condition.
Volatile Petroleum Hydrocarbons by GC/PID/FID Revision 2.1
MassDEP-VPH-18-2.1 5-1 February 2018
APPENDIX 5
SHIPPING METHANOL-PRESERVED SAMPLES
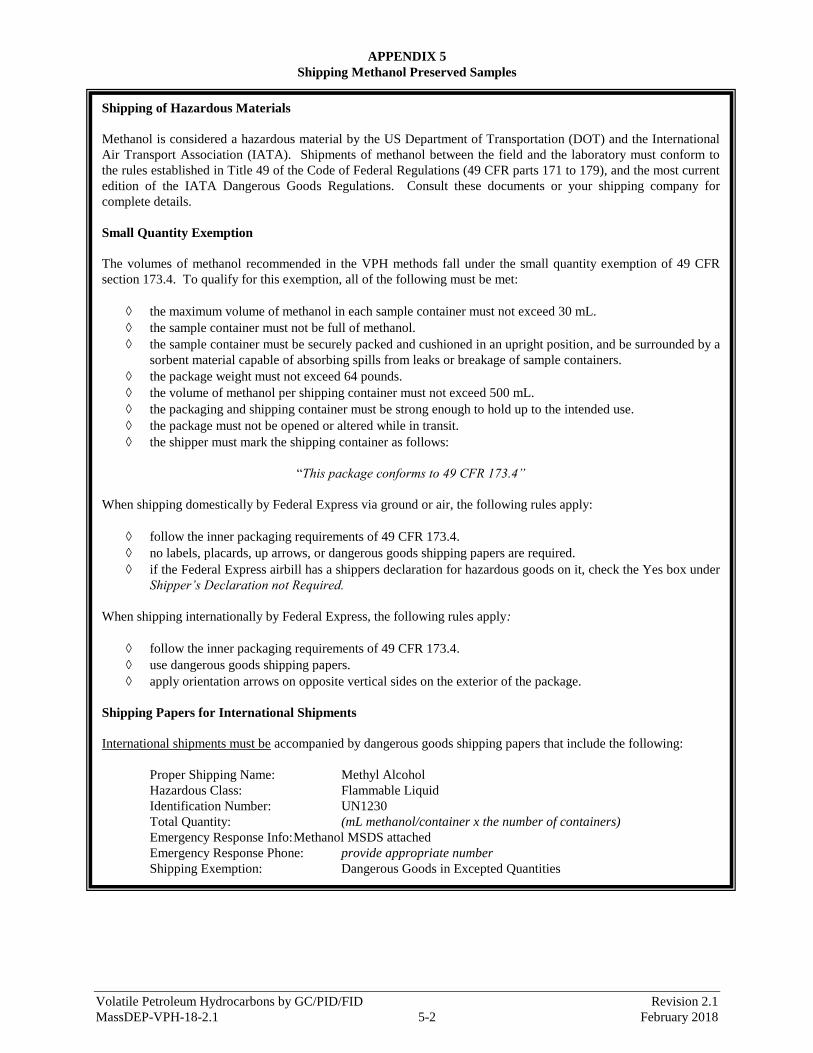
Volatile Petroleum Hydrocarbons by GC/PID/FID Revision 2.1
MassDEP-VPH-18-2.1 5-2 February 2018
APPENDIX 5
Shipping Methanol Preserved Samples
Shipping of Hazardous Materials
Methanol is considered a hazardous material by the US Department of Transportation (DOT) and the International
Air Transport Association (IATA). Shipments of methanol between the field and the laboratory must conform to
the rules established in Title 49 of the Code of Federal Regulations (49 CFR parts 171 to 179), and the most current
edition of the IATA Dangerous Goods Regulations. Consult these documents or your shipping company for
complete details.
Small Quantity Exemption
The volumes of methanol recommended in the VPH methods fall under the small quantity exemption of 49 CFR
section 173.4. To qualify for this exemption, all of the following must be met:
the maximum volume of methanol in each sample container must not exceed 30 mL.
the sample container must not be full of methanol.
the sample container must be securely packed and cushioned in an upright position, and be surrounded by a
sorbent material capable of absorbing spills from leaks or breakage of sample containers.
the package weight must not exceed 64 pounds.
the volume of methanol per shipping container must not exceed 500 mL.
the packaging and shipping container must be strong enough to hold up to the intended use.
the package must not be opened or altered while in transit.
the shipper must mark the shipping container as follows:
“This package conforms to 49 CFR 173.4”
When shipping domestically by Federal Express via ground or air, the following rules apply:
follow the inner packaging requirements of 49 CFR 173.4.
no labels, placards, up arrows, or dangerous goods shipping papers are required.
if the Federal Express airbill has a shippers declaration for hazardous goods on it, check the Yes box under
Shipper’s Declaration not Required.
When shipping internationally by Federal Express, the following rules apply:
follow the inner packaging requirements of 49 CFR 173.4.
use dangerous goods shipping papers.
apply orientation arrows on opposite vertical sides on the exterior of the package.
Shipping Papers for International Shipments
International shipments must be accompanied by dangerous goods shipping papers that include the following:
Proper Shipping Name: Methyl Alcohol
Hazardous Class: Flammable Liquid
Identification Number: UN1230
Total Quantity: (mL methanol/container x the number of containers)
Emergency Response Info: Methanol MSDS attached
Emergency Response Phone: provide appropriate number
Shipping Exemption: Dangerous Goods in Excepted Quantities
Volatile Petroleum Hydrocarbons by GC/PID/FID Revision 2.1
MassDEP-VPH-18-2.1 6-1 February 2018
APPENDIX 6
VPH BY GC/PID/FID METHOD CALIBRATION AND ANALYSIS USING
LINEAR REGRESSION
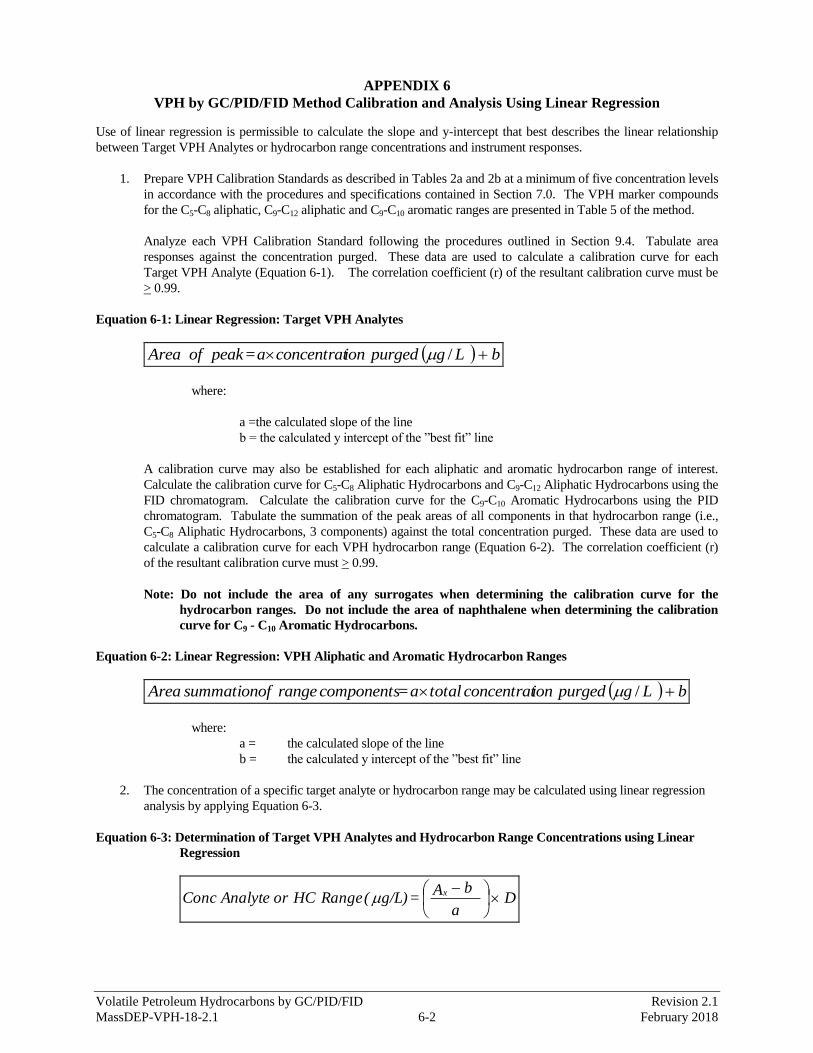
Volatile Petroleum Hydrocarbons by GC/PID/FID Revision 2.1
MassDEP-VPH-18-2.1 6-2 February 2018
APPENDIX 6 VPH by GC/PID/FID Method Calibration and Analysis Using Linear Regression
Use of linear regression is permissible to calculate the slope and y-intercept that best describes the linear relationship
between Target VPH Analytes or hydrocarbon range concentrations and instrument responses.
1. Prepare VPH Calibration Standards as described in Tables 2a and 2b at a minimum of five concentration levels
in accordance with the procedures and specifications contained in Section 7.0. The VPH marker compounds
for the C5-C8 aliphatic, C9-C12 aliphatic and C9-C10 aromatic ranges are presented in Table 5 of the method.
Analyze each VPH Calibration Standard following the procedures outlined in Section 9.4. Tabulate area
responses against the concentration purged. These data are used to calculate a calibration curve for each
Target VPH Analyte (Equation 6-1). The correlation coefficient (r) of the resultant calibration curve must be
> 0.99.
Equation 6-1: Linear Regression: Target VPH Analytes
bLgpurgedionconcentrata= peakofArea /
where:
a =the calculated slope of the line
b = the calculated y intercept of the ”best fit” line
A calibration curve may also be established for each aliphatic and aromatic hydrocarbon range of interest.
Calculate the calibration curve for C5-C8 Aliphatic Hydrocarbons and C9-C12 Aliphatic Hydrocarbons using the
FID chromatogram. Calculate the calibration curve for the C9-C10 Aromatic Hydrocarbons using the PID
chromatogram. Tabulate the summation of the peak areas of all components in that hydrocarbon range (i.e.,
C5-C8 Aliphatic Hydrocarbons, 3 components) against the total concentration purged. These data are used to
calculate a calibration curve for each VPH hydrocarbon range (Equation 6-2). The correlation coefficient (r)
of the resultant calibration curve must > 0.99.
Note: Do not include the area of any surrogates when determining the calibration curve for the
hydrocarbon ranges. Do not include the area of naphthalene when determining the calibration
curve for C9 - C10 Aromatic Hydrocarbons.
Equation 6-2: Linear Regression: VPH Aliphatic and Aromatic Hydrocarbon Ranges
bLgpurgedionconcentrattotala= componentsrangeofsummationArea /
where:
a = the calculated slope of the line
b = the calculated y intercept of the ”best fit” line
2. The concentration of a specific target analyte or hydrocarbon range may be calculated using linear regression
analysis by applying Equation 6-3.
Equation 6-3: Determination of Target VPH Analytes and Hydrocarbon Range Concentrations using Linear
Regression
Da
bA = g/L)( RangeHCorAnalyte Conc
x
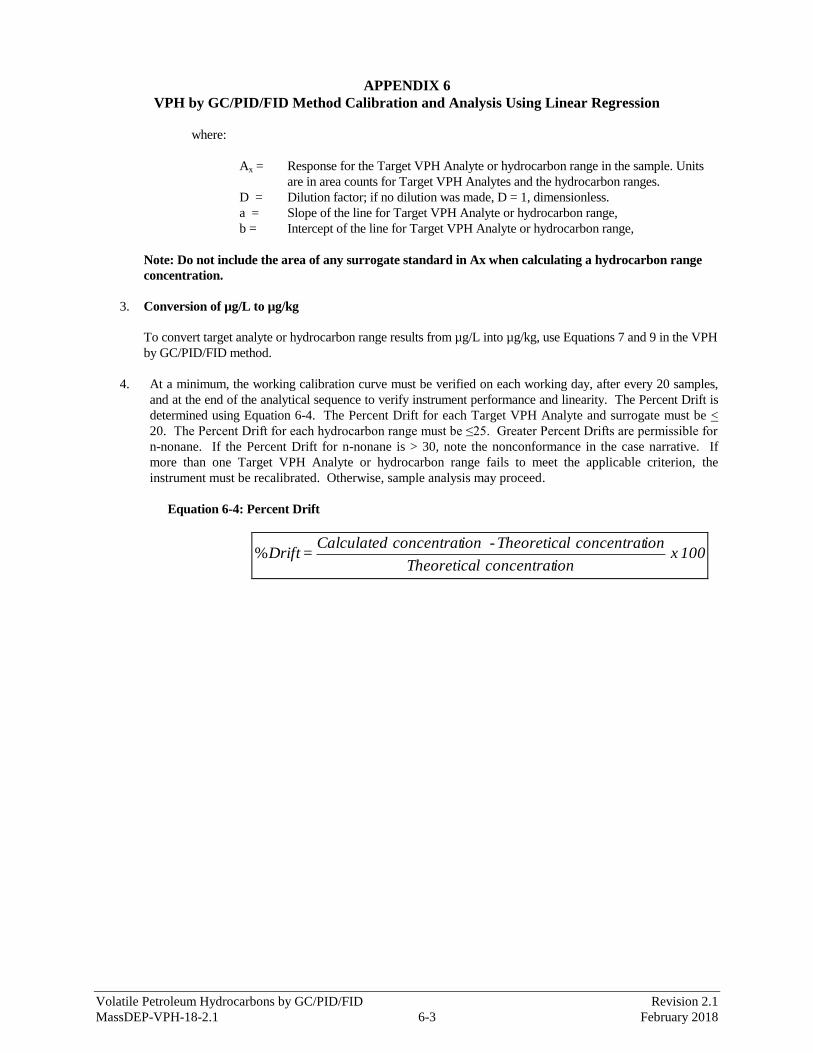
Volatile Petroleum Hydrocarbons by GC/PID/FID Revision 2.1
MassDEP-VPH-18-2.1 6-3 February 2018
APPENDIX 6 VPH by GC/PID/FID Method Calibration and Analysis Using Linear Regression
where:
Ax = Response for the Target VPH Analyte or hydrocarbon range in the sample. Units
are in area counts for Target VPH Analytes and the hydrocarbon ranges.
D = Dilution factor; if no dilution was made, D = 1, dimensionless.
a = Slope of the line for Target VPH Analyte or hydrocarbon range,
b = Intercept of the line for Target VPH Analyte or hydrocarbon range,
Note: Do not include the area of any surrogate standard in Ax when calculating a hydrocarbon range
concentration.
3. Conversion of µg/L to µg/kg
To convert target analyte or hydrocarbon range results from µg/L into µg/kg, use Equations 7 and 9 in the VPH
by GC/PID/FID method.
4. At a minimum, the working calibration curve must be verified on each working day, after every 20 samples,
and at the end of the analytical sequence to verify instrument performance and linearity. The Percent Drift is
determined using Equation 6-4. The Percent Drift for each Target VPH Analyte and surrogate must be <
20. The Percent Drift for each hydrocarbon range must be ≤25. Greater Percent Drifts are permissible for
n-nonane. If the Percent Drift for n-nonane is > 30, note the nonconformance in the case narrative. If
more than one Target VPH Analyte or hydrocarbon range fails to meet the applicable criterion, the
instrument must be recalibrated. Otherwise, sample analysis may proceed.
Equation 6-4: Percent Drift
100 x ionconcentratlTheoretica
ionconcentratlTheoretica - ionconcentratCalculated = Drift%
Volatile Petroleum Hydrocarbons by GC/PID/FID Revision 2.1
MassDEP-VPH-18-2.1 7-1 February 2018
APPENDIX 7
INITIAL DEMONSTRATION OF LABORATORY CAPABILITY
FOR THE MassDEP VPH by GC/PID/FID METHOD
1.0 Overview of the Initial Demonstration of Laboratory Capability (IDLC) Approach
2.0 Demonstration of Acceptable System Background
3.0 Initial Demonstration of Accuracy (IDA)
4.0 Initial Demonstration of Precision (IDP)
5.0 Method Detection Limit (MDL)
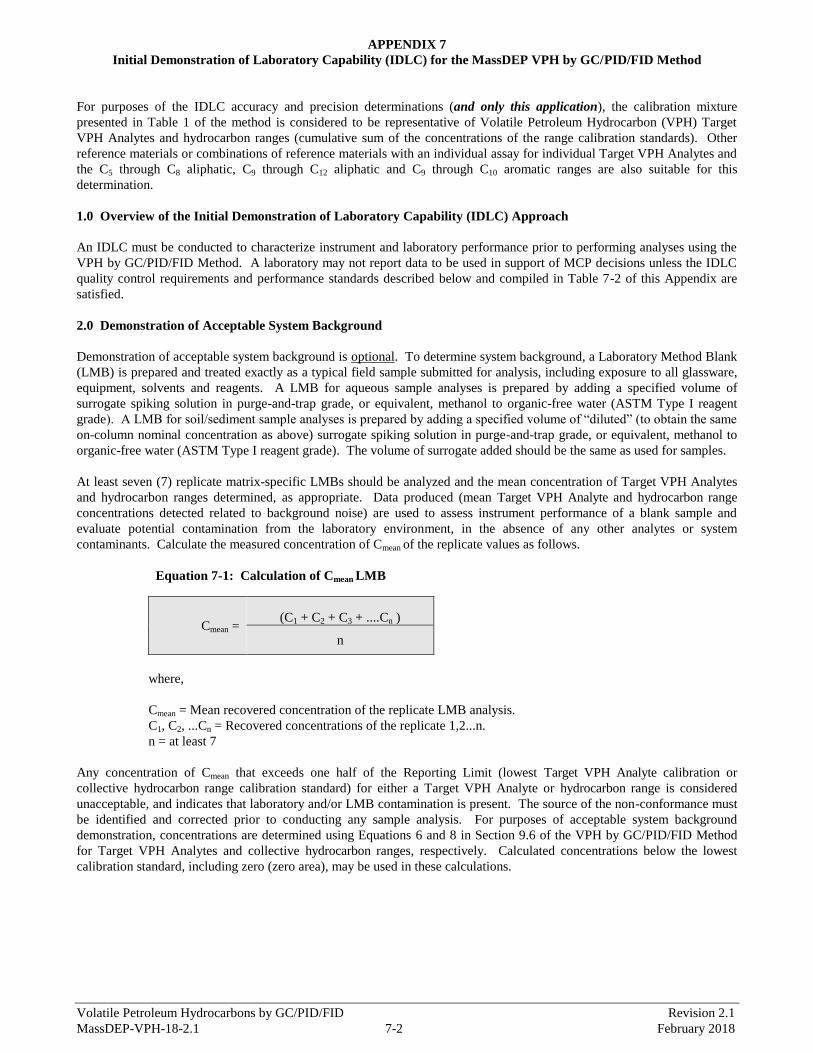
Volatile Petroleum Hydrocarbons by GC/PID/FID Revision 2.1
MassDEP-VPH-18-2.1 7-2 February 2018
APPENDIX 7
Initial Demonstration of Laboratory Capability (IDLC) for the MassDEP VPH by GC/PID/FID Method
For purposes of the IDLC accuracy and precision determinations (and only this application), the calibration mixture
presented in Table 1 of the method is considered to be representative of Volatile Petroleum Hydrocarbon (VPH) Target
VPH Analytes and hydrocarbon ranges (cumulative sum of the concentrations of the range calibration standards). Other
reference materials or combinations of reference materials with an individual assay for individual Target VPH Analytes and
the C5 through C8 aliphatic, C9 through C12 aliphatic and C9 through C10 aromatic ranges are also suitable for this
determination.
1.0 Overview of the Initial Demonstration of Laboratory Capability (IDLC) Approach
An IDLC must be conducted to characterize instrument and laboratory performance prior to performing analyses using the
VPH by GC/PID/FID Method. A laboratory may not report data to be used in support of MCP decisions unless the IDLC
quality control requirements and performance standards described below and compiled in Table 7-2 of this Appendix are
satisfied.
2.0 Demonstration of Acceptable System Background
Demonstration of acceptable system background is optional. To determine system background, a Laboratory Method Blank
(LMB) is prepared and treated exactly as a typical field sample submitted for analysis, including exposure to all glassware,
equipment, solvents and reagents. A LMB for aqueous sample analyses is prepared by adding a specified volume of
surrogate spiking solution in purge-and-trap grade, or equivalent, methanol to organic-free water (ASTM Type I reagent
grade). A LMB for soil/sediment sample analyses is prepared by adding a specified volume of “diluted” (to obtain the same
on-column nominal concentration as above) surrogate spiking solution in purge-and-trap grade, or equivalent, methanol to
organic-free water (ASTM Type I reagent grade). The volume of surrogate added should be the same as used for samples.
At least seven (7) replicate matrix-specific LMBs should be analyzed and the mean concentration of Target VPH Analytes
and hydrocarbon ranges determined, as appropriate. Data produced (mean Target VPH Analyte and hydrocarbon range
concentrations detected related to background noise) are used to assess instrument performance of a blank sample and
evaluate potential contamination from the laboratory environment, in the absence of any other analytes or system
contaminants. Calculate the measured concentration of Cmean of the replicate values as follows.
Equation 7-1: Calculation of Cmean LMB
Cmean = (C1 + C2 + C3 + ....Cn )
n
where,
Cmean = Mean recovered concentration of the replicate LMB analysis.
C1, C2, ...Cn = Recovered concentrations of the replicate 1,2...n.
n = at least 7
Any concentration of Cmean that exceeds one half of the Reporting Limit (lowest Target VPH Analyte calibration or
collective hydrocarbon range calibration standard) for either a Target VPH Analyte or hydrocarbon range is considered
unacceptable, and indicates that laboratory and/or LMB contamination is present. The source of the non-conformance must
be identified and corrected prior to conducting any sample analysis. For purposes of acceptable system background
demonstration, concentrations are determined using Equations 6 and 8 in Section 9.6 of the VPH by GC/PID/FID Method
for Target VPH Analytes and collective hydrocarbon ranges, respectively. Calculated concentrations below the lowest
calibration standard, including zero (zero area), may be used in these calculations.
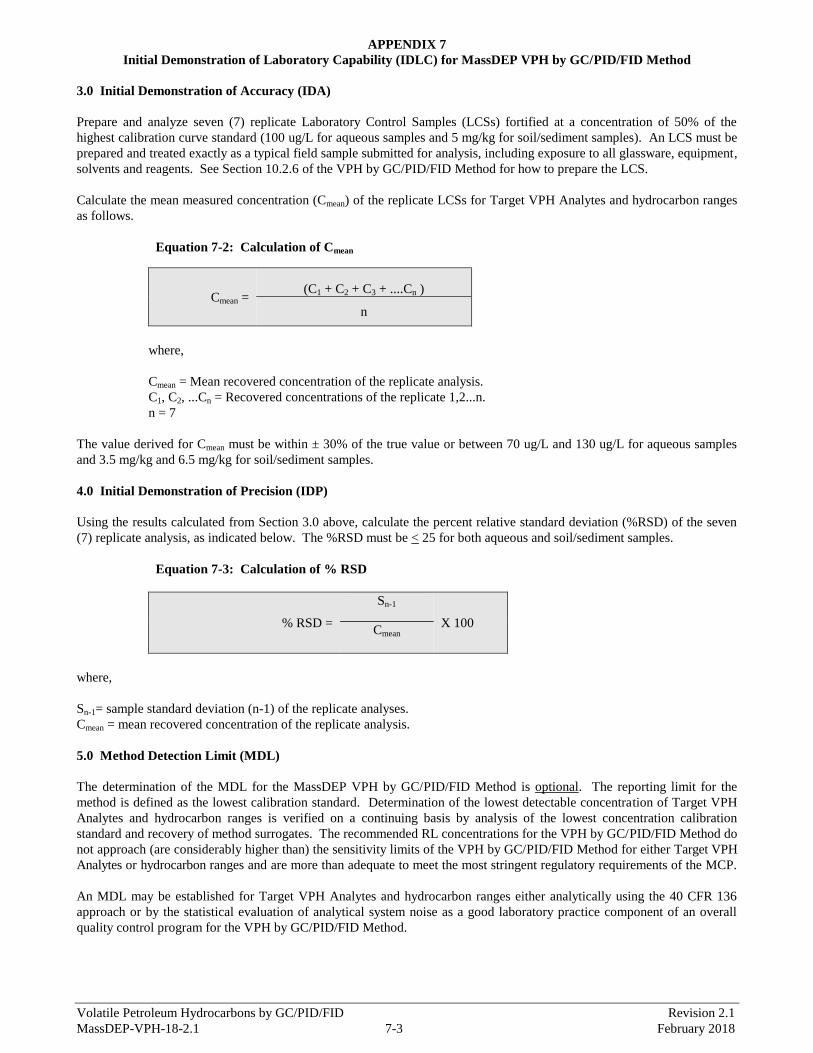
Volatile Petroleum Hydrocarbons by GC/PID/FID Revision 2.1
MassDEP-VPH-18-2.1 7-3 February 2018
APPENDIX 7
Initial Demonstration of Laboratory Capability (IDLC) for MassDEP VPH by GC/PID/FID Method
3.0 Initial Demonstration of Accuracy (IDA)
Prepare and analyze seven (7) replicate Laboratory Control Samples (LCSs) fortified at a concentration of 50% of the
highest calibration curve standard (100 ug/L for aqueous samples and 5 mg/kg for soil/sediment samples). An LCS must be
prepared and treated exactly as a typical field sample submitted for analysis, including exposure to all glassware, equipment,
solvents and reagents. See Section 10.2.6 of the VPH by GC/PID/FID Method for how to prepare the LCS.
Calculate the mean measured concentration (Cmean) of the replicate LCSs for Target VPH Analytes and hydrocarbon ranges
as follows.
Equation 7-2: Calculation of Cmean
Cmean = (C1 + C2 + C3 + ....Cn )
n
where,
Cmean = Mean recovered concentration of the replicate analysis.
C1, C2, ...Cn = Recovered concentrations of the replicate 1,2...n.
n = 7
The value derived for Cmean must be within ± 30% of the true value or between 70 ug/L and 130 ug/L for aqueous samples
and 3.5 mg/kg and 6.5 mg/kg for soil/sediment samples.
4.0 Initial Demonstration of Precision (IDP)
Using the results calculated from Section 3.0 above, calculate the percent relative standard deviation (%RSD) of the seven
(7) replicate analysis, as indicated below. The %RSD must be < 25 for both aqueous and soil/sediment samples.
Equation 7-3: Calculation of % RSD
% RSD =
Sn-1
X 100 Cmean
where,
Sn-1= sample standard deviation (n-1) of the replicate analyses.
Cmean = mean recovered concentration of the replicate analysis.
5.0 Method Detection Limit (MDL)
The determination of the MDL for the MassDEP VPH by GC/PID/FID Method is optional. The reporting limit for the
method is defined as the lowest calibration standard. Determination of the lowest detectable concentration of Target VPH
Analytes and hydrocarbon ranges is verified on a continuing basis by analysis of the lowest concentration calibration
standard and recovery of method surrogates. The recommended RL concentrations for the VPH by GC/PID/FID Method do
not approach (are considerably higher than) the sensitivity limits of the VPH by GC/PID/FID Method for either Target VPH
Analytes or hydrocarbon ranges and are more than adequate to meet the most stringent regulatory requirements of the MCP.
An MDL may be established for Target VPH Analytes and hydrocarbon ranges either analytically using the 40 CFR 136
approach or by the statistical evaluation of analytical system noise as a good laboratory practice component of an overall
quality control program for the VPH by GC/PID/FID Method.
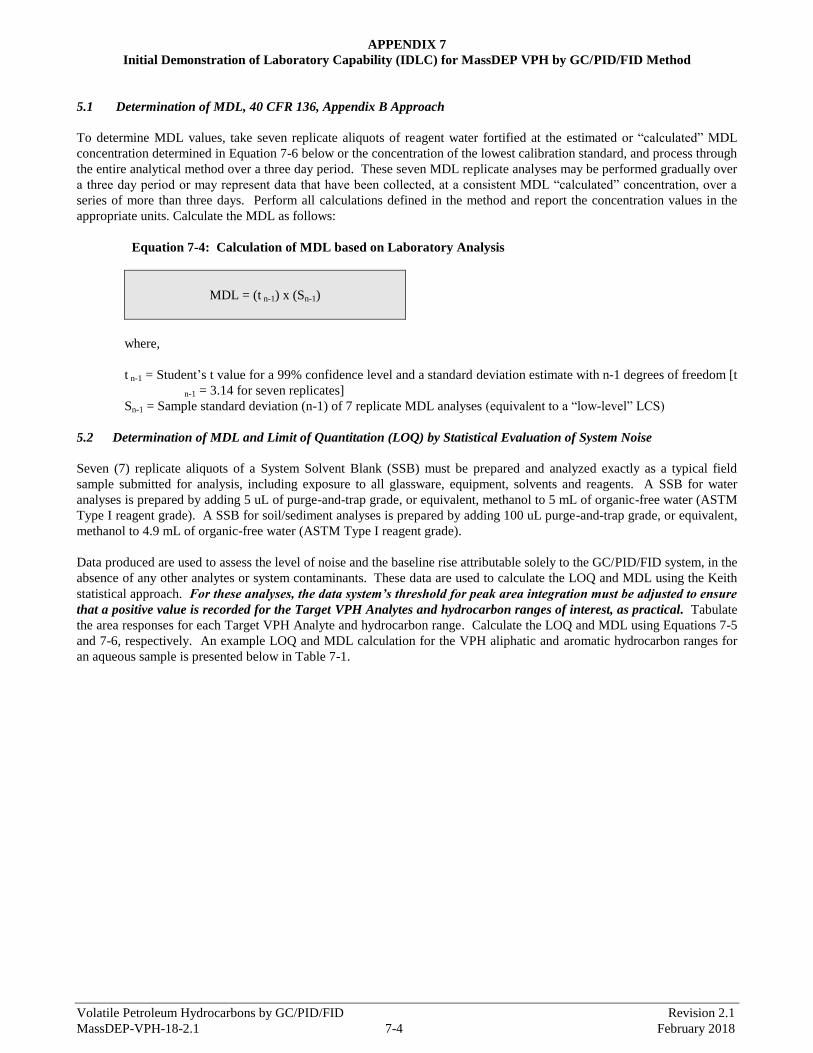
Volatile Petroleum Hydrocarbons by GC/PID/FID Revision 2.1
MassDEP-VPH-18-2.1 7-4 February 2018
APPENDIX 7
Initial Demonstration of Laboratory Capability (IDLC) for MassDEP VPH by GC/PID/FID Method
5.1 Determination of MDL, 40 CFR 136, Appendix B Approach
To determine MDL values, take seven replicate aliquots of reagent water fortified at the estimated or “calculated” MDL
concentration determined in Equation 7-6 below or the concentration of the lowest calibration standard, and process through
the entire analytical method over a three day period. These seven MDL replicate analyses may be performed gradually over
a three day period or may represent data that have been collected, at a consistent MDL “calculated” concentration, over a
series of more than three days. Perform all calculations defined in the method and report the concentration values in the
appropriate units. Calculate the MDL as follows:
Equation 7-4: Calculation of MDL based on Laboratory Analysis
MDL = (t n-1) x (Sn-1)
where,
t n-1 = Student’s t value for a 99% confidence level and a standard deviation estimate with n-1 degrees of freedom [t
n-1 = 3.14 for seven replicates]
Sn-1 = Sample standard deviation (n-1) of 7 replicate MDL analyses (equivalent to a “low-level” LCS)
5.2 Determination of MDL and Limit of Quantitation (LOQ) by Statistical Evaluation of System Noise
Seven (7) replicate aliquots of a System Solvent Blank (SSB) must be prepared and analyzed exactly as a typical field
sample submitted for analysis, including exposure to all glassware, equipment, solvents and reagents. A SSB for water
analyses is prepared by adding 5 uL of purge-and-trap grade, or equivalent, methanol to 5 mL of organic-free water (ASTM
Type I reagent grade). A SSB for soil/sediment analyses is prepared by adding 100 uL purge-and-trap grade, or equivalent,
methanol to 4.9 mL of organic-free water (ASTM Type I reagent grade).
Data produced are used to assess the level of noise and the baseline rise attributable solely to the GC/PID/FID system, in the
absence of any other analytes or system contaminants. These data are used to calculate the LOQ and MDL using the Keith
statistical approach. For these analyses, the data system’s threshold for peak area integration must be adjusted to ensure
that a positive value is recorded for the Target VPH Analytes and hydrocarbon ranges of interest, as practical. Tabulate
the area responses for each Target VPH Analyte and hydrocarbon range. Calculate the LOQ and MDL using Equations 7-5
and 7-6, respectively. An example LOQ and MDL calculation for the VPH aliphatic and aromatic hydrocarbon ranges for
an aqueous sample is presented below in Table 7-1.
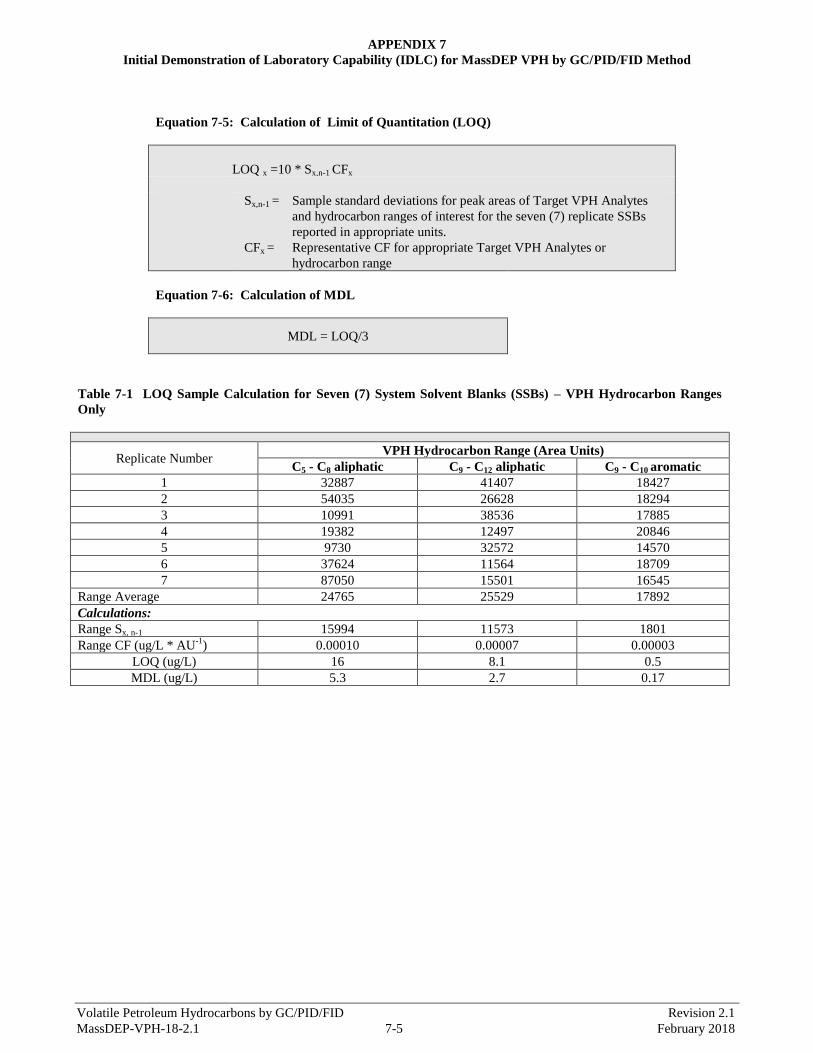
Volatile Petroleum Hydrocarbons by GC/PID/FID Revision 2.1
MassDEP-VPH-18-2.1 7-5 February 2018
APPENDIX 7
Initial Demonstration of Laboratory Capability (IDLC) for MassDEP VPH by GC/PID/FID Method
Equation 7-5: Calculation of Limit of Quantitation (LOQ)
LOQ x =10 * Sx,n-1 CFx
Sx,n-1 = Sample standard deviations for peak areas of Target VPH Analytes
and hydrocarbon ranges of interest for the seven (7) replicate SSBs
reported in appropriate units.
CFx = Representative CF for appropriate Target VPH Analytes or
hydrocarbon range
Equation 7-6: Calculation of MDL
MDL = LOQ/3
Table 7-1 LOQ Sample Calculation for Seven (7) System Solvent Blanks (SSBs) – VPH Hydrocarbon Ranges
Only
Replicate Number VPH Hydrocarbon Range (Area Units)
C5 - C8 aliphatic C9 - C12 aliphatic C9 - C10 aromatic
1 32887 41407 18427
2 54035 26628 18294
3 10991 38536 17885
4 19382 12497 20846
5 9730 32572 14570
6 37624 11564 18709
7 87050 15501 16545
Range Average 24765 25529 17892
Calculations:
Range Sx, n-1 15994 11573 1801
Range CF (ug/L * AU-1
) 0.00010 0.00007 0.00003
LOQ (ug/L) 16 8.1 0.5
MDL (ug/L) 5.3 2.7 0.17
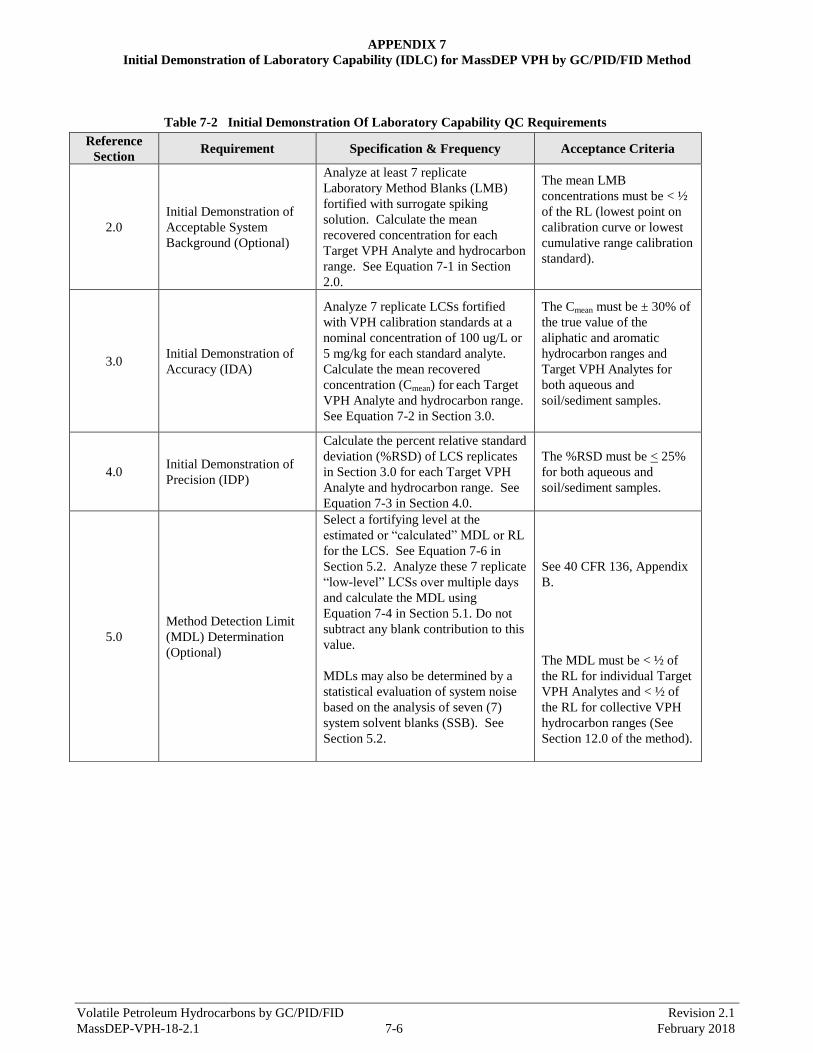
Volatile Petroleum Hydrocarbons by GC/PID/FID Revision 2.1
MassDEP-VPH-18-2.1 7-6 February 2018
APPENDIX 7
Initial Demonstration of Laboratory Capability (IDLC) for MassDEP VPH by GC/PID/FID Method
Table 7-2 Initial Demonstration Of Laboratory Capability QC Requirements
Reference
Section Requirement Specification & Frequency Acceptance Criteria
2.0
Initial Demonstration of
Acceptable System
Background (Optional)
Analyze at least 7 replicate
Laboratory Method Blanks (LMB)
fortified with surrogate spiking
solution. Calculate the mean
recovered concentration for each
Target VPH Analyte and hydrocarbon
range. See Equation 7-1 in Section
2.0.
The mean LMB
concentrations must be < ½
of the RL (lowest point on
calibration curve or lowest
cumulative range calibration
standard).
3.0 Initial Demonstration of
Accuracy (IDA)
Analyze 7 replicate LCSs fortified
with VPH calibration standards at a
nominal concentration of 100 ug/L or
5 mg/kg for each standard analyte.
Calculate the mean recovered
concentration (Cmean) for each Target
VPH Analyte and hydrocarbon range.
See Equation 7-2 in Section 3.0.
The Cmean must be ± 30% of
the true value of the
aliphatic and aromatic
hydrocarbon ranges and
Target VPH Analytes for
both aqueous and
soil/sediment samples.
4.0 Initial Demonstration of
Precision (IDP)
Calculate the percent relative standard
deviation (%RSD) of LCS replicates
in Section 3.0 for each Target VPH
Analyte and hydrocarbon range. See
Equation 7-3 in Section 4.0.
The %RSD must be < 25%
for both aqueous and
soil/sediment samples.
5.0
Method Detection Limit
(MDL) Determination
(Optional)
Select a fortifying level at the
estimated or “calculated” MDL or RL
for the LCS. See Equation 7-6 in
Section 5.2. Analyze these 7 replicate
“low-level” LCSs over multiple days
and calculate the MDL using
Equation 7-4 in Section 5.1. Do not
subtract any blank contribution to this
value.
MDLs may also be determined by a
statistical evaluation of system noise
based on the analysis of seven (7)
system solvent blanks (SSB). See
Section 5.2.
See 40 CFR 136, Appendix
B.
The MDL must be < ½ of
the RL for individual Target
VPH Analytes and < ½ of
the RL for collective VPH
hydrocarbon ranges (See
Section 12.0 of the method).