Embed Size (px)
Citation preview
11
Vote 3 Communications Budget summary
2018/19 2019/20 2020/21
R million Total Current
paymentsTransfers and
subsidiesPayments for capital assets Total Total
MTEF allocation Administration 64.6 64.6 – – 70.8 74.2Communications Policy, Research and Development
11.5 11.5 – – 13.5 15.4
Industry and Capacity Development 53.3 53.3 – 0.0 53.0 55.5Entity Oversight 1 383.7 6.1 1 377.5 – 1 451.8 1 538.5Total expenditure estimates 1 513.1 135.6 1 377.5 0.0 1 589.1 1 683.6Executive authority Minister of Communications Accounting officer Director General of Communications Website address www.doc.gov.za The Estimates of National Expenditure e-publications for individual votes are available on www.treasury.gov.za. These publications provide more comprehensive coverage of vote specific information, particularly about goods and services, transfers and subsidies, personnel, entities, donor funding, public private partnerships, conditional grants to provinces and municipalities, and expenditure information at the level of service delivery, where appropriate.
Vote purpose Create an enabling environment for the provision of inclusive communication services to all South Africans in a manner that promotes socioeconomic development and investment through broadcasting, new media, print media and other new technologies, and brand the country locally and internationally.
Mandate The Department of Communications is responsible for the national communications policy and strategy; information dissemination and publicity; and the branding of South Africa. Improved communication and marketing will promote an informed citizenry and assist the country in promoting investments, economic growth and job creation. The department’s mandate is derived from section 192 of the Constitution, which provides for the independence of broadcasting regulation in the public interest, the International Telecommunications Union and the World Intellectual Property Organisation.
The department is responsible for the administration and implementation of:
• the Films and Publications Act (1996) • the Broadcasting Act (1999) • the Media Development and Diversity Agency Act (2002) • the Independent Communications Authority of South Africa Act (2000), a joint responsibility with the
Minister of Telecommunications and Postal Services • the Electronic Communications and Transactions Act (2002), a joint responsibility with the Minister of
Telecommunications and Postal Services • the Electronic Communications and Transactions Act (2005), a joint responsibility with the Minister of
Telecommunications and Postal Services.
2018 Estimates of National Expenditure
12
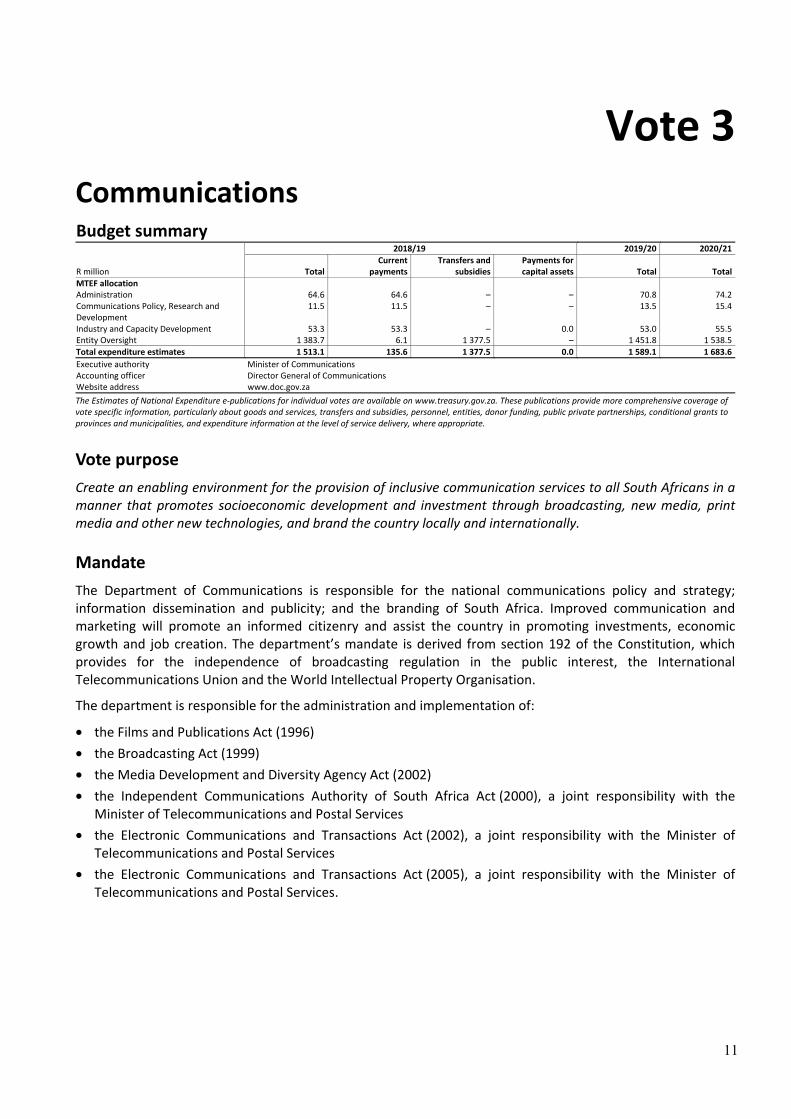
Selected performance indicators Table 3.1 Performance indicators by programme and related outcome Indicator Programme MTSF outcome Past Current Projections 2014/15 2015/16 2016/17 2017/18 2018/19 2019/20 2020/21Number of digital broadcasting awareness campaigns hosted per year
Industry and Capacity Development
Outcome 14: Nation building and social cohesion
–¹ –¹ 59² 10 10 10 10
Number of reports showing consumer access to digital broadcasting, particularly those supported with set-top boxes per year
Industry and Capacity Development
–¹ 4 4 4 4 4 4
Number of position papers tabled at multilateral engagements per year
Industry and Capacity Development
–¹ –¹ 2 2 2 2 2
Number of stakeholder engagements coordinated per year
Industry and Capacity Development
–¹ –¹ 10 10 10 10 10
Number of shareholder compact accountability instruments signed per year
Entity Oversight –¹ 4 4 4 5 5 5
1. No historical data available. 2. Increase due to additional funds allocated for the digital migration project during the 2016/17 adjusted budget process.
Expenditure analysis The National Development Plan (NDP) envisages an active citizenry that participates in the social, economic and political life of the country. This is given expression by outcome 14 (nation building and social cohesion) of government’s 2014-2019 medium-term strategic framework, which is closely aligned with the work of the Department of Communications. Over the medium term, the department will continue to focus on transforming the communications sector through the rollout of the digital terrestrial television project, developing responsive communications policies and regulatory frameworks, and effectively overseeing public entity within the communications sector.
The number of personnel in the department is expected to increase by 22 over the medium term, mainly to provide capacity for the digital terrestrial television project, the implementation of communications policies such as the media transformation and diversity policy and the audiovisual and digital content policy, and the Research and Development and Entity Oversight programmes. As a result, spending on compensation of employees is set to increase at an average annual rate of 13.5 per cent, from R64.5 million in 2017/18 to R94.3 million in 2020/21. An estimated 9 per cent (R432.3 million) of the department’s total budget over the MTEF period will be used for operational costs, of which R263.3 million is to be spent on compensation of employees, and 39.7 per cent on goods and services. An estimated 91 per cent (R4.4 billion) of the department’s total budget over the same period is expected to be transferred to entities for the implementation of communications and broadcasting policies, and 27.9 per cent (R1.3 billion) will be transferred to the Government Communication and Information System to carry out its functions.
Cabinet has approved budget reductions of R36.3 million in 2018/19, R53.5 million in 2019/20 and R57.1 million in 2020/21, particularly on transfers to public entities, as well as the Administration programme, in line with government’s fiscal consolidation objectives. These reductions will not negatively affect the department’s planned outputs over the medium term.
Rolling out digital terrestrial television Migration to digital terrestrial broadcasting is expected to have a positive impact on South African society as it will provide for an informed citizenry that is responsive to the needs, challenges and opportunities of the country. Once the migration is complete, high definition television telecast facilities will be available, along with expanded community, FM and satellite radio services to the entire population. In this regard, the implementation of the department’s digital terrestrial migration project will be monitored to ensure that 1.5 million set-top boxes and other devices related to digital terrestrial television are installed over the MTEF period. To eliminate cross border interference during the migration process, provinces that border neighbouring countries (Mpumalanga, Limpopo, KwaZulu-Natal, Eastern Cape, Free State, Northern Cape and North West) will be targeted first. Over the medium term, the department plans to compile 12 reports on consumer access to digital broadcasting; coordinate 30 public awareness and registration campaigns in provinces; target non-subsidised households that rely on the retail market to acquire digital terrestrial devices;

Vote 3: Communications
13
and conduct national, provincial and regional road shows to raise awareness and communicate timelines associated with the rollout process.
To roll out the digital terrestrial television project, Cabinet has approved an additional allocation of R91.7 million over the medium term for these activities in the Broadcasting Digital Migration subprogramme in the Industry and Capacity Development programme. Spending is mainly on travel, accommodation, advertising and catering in relation to project management, awareness campaigns, media engagements, technology and engineering support, and performance monitoring and evaluation.
Developing a responsive communications policy and regulatory framework Over the medium term, the department will continue to develop policies that improve government communications and the communications sector as a whole. It is within this context that the department plans to develop a media transformation and diversity charter that aims to transform the media sector and set equity targets. As such, over the MTEF period, the department will continue to develop and implement several policies and regulations to address transformation in the media industry, citizen participation and access, and new developments in the sector.
The media transformation and diversity policy is informed by the Media Development and Diversity Agency Act (2002), and aims to encourage diversity in media content and the transformation of media ownership. The audiovisual and digital content policy aims to maintain and strengthen citizen participation and access to the community media sector. The department has successfully submitted the White Paper on Audiovisual and Digital Content for South Africa to Cabinet for approval towards the development of a draft audiovisual and digital content bill over the medium term. Once Cabinet approves the White Paper on Audiovisual and Digital Content for South Africa, the department will amend the Independent Communications Authority of South Africa Act (2000) to align it with the white paper, which outlines a new mandate for the authority. The department will commence with the implementation of the Independent Communications Authority of South Africa Amendment Bill in 2020/21.
In promoting the growth and development of creative industries, the department plans to develop an audiovisual content strategy over the medium term to ensure that the sector has adequate content for a multiplatform digital environment. This will inform the implementation of the audiovisual and digital content policy. The department also plans to continue to support parliamentary processes on the finalisation and implementation of the Films and Publications Amendment Bill, and the Broadcasting Amendment Bill.
Over the MTEF period, the department plans to continue strengthening and supporting the South African Broadcast Production Advisory Body, the function of which is to advise the Minister of Communications on how the development, production and display of local television and radio content can be supported. The board will produce 2 reports on policies related to children’s content and funding for sport development. Other policy work relates to the regulation of broadcasting and content services such as audio, video and other, mainly internet, media products without specific broadcast operators.
Spending on activities related to the development of regulatory frameworks is projected to be R2.8 million in 2018/19, R2.9 million in 2019/20 and R3 million in 2020/21 in the Broadcasting Policy subprogramme in the Communications Policy, Research and Development programme.
Driving effective entity oversight The department is required to oversee planning, budgeting and reporting processes in the public entities within its portfolio to enable them to meet government’s policy objectives in a financially sustainable manner. To ensure that the department’s entities are well managed, the entity oversight unit plans to compile 30 annual reviews of these entities’ corporate plans, and 60 quarterly reports over the medium term to assess their compliance with the Public Finance Management Act (1999), the Companies Act (2008) and National Treasury Regulations on public entities. Funding for these activities is provided through the Entity Oversight programme, which has an allocation of R4.4 billion over the medium term.
2018 Estimates of National Expenditure
14
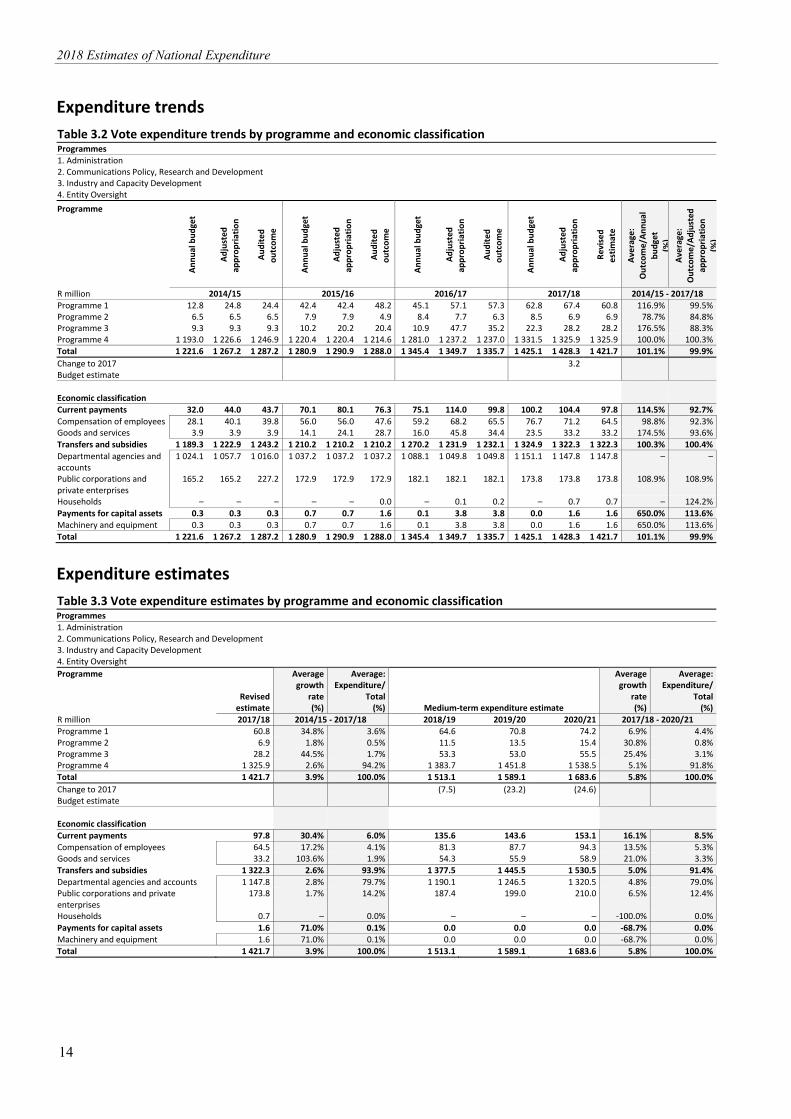
Expenditure trends Table 3.2 Vote expenditure trends by programme and economic classification Programmes 1. Administration 2. Communications Policy, Research and Development 3. Industry and Capacity Development 4. Entity Oversight Programme
Ann
ual b
udge
t
Adj
uste
d
appr
opria
tion
Aud
ited
ou
tcom
e
Ann
ual b
udge
t
Adj
uste
d
appr
opria
tion
Aud
ited
ou
tcom
e
Ann
ual b
udge
t
Adj
uste
d
appr
opria
tion
Aud
ited
ou
tcom
e
Ann
ual b
udge
t
Adj
uste
d
appr
opria
tion
Rev
ised
es
timat
e
Aver
age:
O
utco
me/
Annu
al
budg
et
(%)
Aver
age:
O
utco
me/
Adju
sted
ap
prop
riatio
n (%
)
R million 2014/15 2015/16 2016/17 2017/18 2014/15 - 2017/18 Programme 1 12.8 24.8 24.4 42.4 42.4 48.2 45.1 57.1 57.3 62.8 67.4 60.8 116.9% 99.5%Programme 2 6.5 6.5 6.5 7.9 7.9 4.9 8.4 7.7 6.3 8.5 6.9 6.9 78.7% 84.8%Programme 3 9.3 9.3 9.3 10.2 20.2 20.4 10.9 47.7 35.2 22.3 28.2 28.2 176.5% 88.3%Programme 4 1 193.0 1 226.6 1 246.9 1 220.4 1 220.4 1 214.6 1 281.0 1 237.2 1 237.0 1 331.5 1 325.9 1 325.9 100.0% 100.3%Total 1 221.6 1 267.2 1 287.2 1 280.9 1 290.9 1 288.0 1 345.4 1 349.7 1 335.7 1 425.1 1 428.3 1 421.7 101.1% 99.9%Change to 2017 Budget estimate
3.2
Economic classification Current payments 32.0 44.0 43.7 70.1 80.1 76.3 75.1 114.0 99.8 100.2 104.4 97.8 114.5% 92.7%Compensation of employees 28.1 40.1 39.8 56.0 56.0 47.6 59.2 68.2 65.5 76.7 71.2 64.5 98.8% 92.3%Goods and services 3.9 3.9 3.9 14.1 24.1 28.7 16.0 45.8 34.4 23.5 33.2 33.2 174.5% 93.6%Transfers and subsidies 1 189.3 1 222.9 1 243.2 1 210.2 1 210.2 1 210.2 1 270.2 1 231.9 1 232.1 1 324.9 1 322.3 1 322.3 100.3% 100.4%Departmental agencies and accounts
1 024.1 1 057.7 1 016.0 1 037.2 1 037.2 1 037.2 1 088.1 1 049.8 1 049.8 1 151.1 1 147.8 1 147.8 – –
Public corporations and private enterprises
165.2 165.2 227.2 172.9 172.9 172.9 182.1 182.1 182.1 173.8 173.8 173.8 108.9% 108.9%
Households – – – – – 0.0 – 0.1 0.2 – 0.7 0.7 – 124.2%Payments for capital assets 0.3 0.3 0.3 0.7 0.7 1.6 0.1 3.8 3.8 0.0 1.6 1.6 650.0% 113.6%Machinery and equipment 0.3 0.3 0.3 0.7 0.7 1.6 0.1 3.8 3.8 0.0 1.6 1.6 650.0% 113.6%Total 1 221.6 1 267.2 1 287.2 1 280.9 1 290.9 1 288.0 1 345.4 1 349.7 1 335.7 1 425.1 1 428.3 1 421.7 101.1% 99.9%
Expenditure estimates Table 3.3 Vote expenditure estimates by programme and economic classificationProgrammes 1. Administration 2. Communications Policy, Research and Development 3. Industry and Capacity Development 4. Entity Oversight Programme
Revised estimate
Average growth
rate (%)
Average:Expenditure/
Total(%) Medium-term expenditure estimate
Average growth
rate (%)
Average:Expenditure/
Total(%)
R million 2017/18 2014/15 - 2017/18 2018/19 2019/20 2020/21 2017/18 - 2020/21 Programme 1 60.8 34.8% 3.6% 64.6 70.8 74.2 6.9% 4.4%Programme 2 6.9 1.8% 0.5% 11.5 13.5 15.4 30.8% 0.8%Programme 3 28.2 44.5% 1.7% 53.3 53.0 55.5 25.4% 3.1%Programme 4 1 325.9 2.6% 94.2% 1 383.7 1 451.8 1 538.5 5.1% 91.8%Total 1 421.7 3.9% 100.0% 1 513.1 1 589.1 1 683.6 5.8% 100.0%Change to 2017 Budget estimate
(7.5) (23.2) (24.6)
Economic classification Current payments 97.8 30.4% 6.0% 135.6 143.6 153.1 16.1% 8.5%Compensation of employees 64.5 17.2% 4.1% 81.3 87.7 94.3 13.5% 5.3%Goods and services 33.2 103.6% 1.9% 54.3 55.9 58.9 21.0% 3.3%Transfers and subsidies 1 322.3 2.6% 93.9% 1 377.5 1 445.5 1 530.5 5.0% 91.4%Departmental agencies and accounts 1 147.8 2.8% 79.7% 1 190.1 1 246.5 1 320.5 4.8% 79.0%Public corporations and private enterprises
173.8 1.7% 14.2% 187.4 199.0 210.0 6.5% 12.4%
Households 0.7 – 0.0% – – – -100.0% 0.0%Payments for capital assets 1.6 71.0% 0.1% 0.0 0.0 0.0 -68.7% 0.0%Machinery and equipment 1.6 71.0% 0.1% 0.0 0.0 0.0 -68.7% 0.0%Total 1 421.7 3.9% 100.0% 1 513.1 1 589.1 1 683.6 5.8% 100.0%
Vote 3: Communications
15
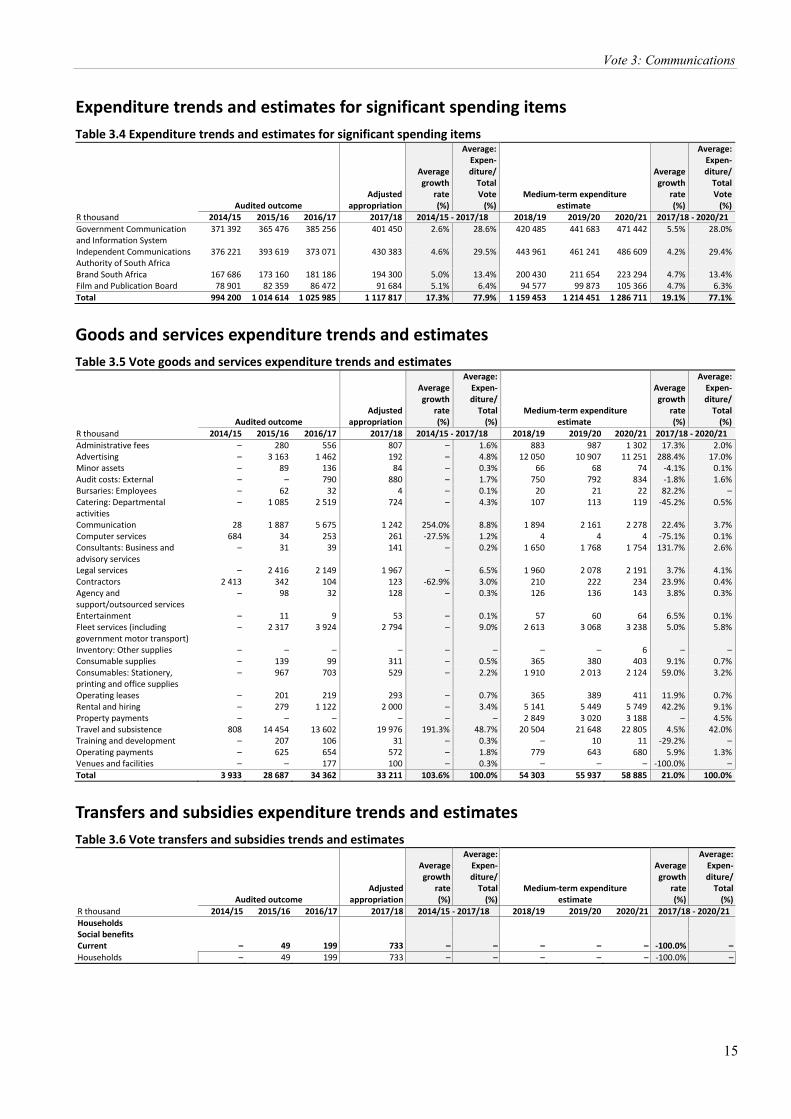
Expenditure trends and estimates for significant spending items Table 3.4 Expenditure trends and estimates for significant spending items
Audited outcome Adjusted
appropriation
Averagegrowth
rate(%)
Average: Expen-diture/
Total Vote
(%) Medium-term expenditure
estimate
Averagegrowth
rate(%)
Average:Expen-diture/
Total Vote
(%)R thousand 2014/15 2015/16 2016/17 2017/18 2014/15 - 2017/18 2018/19 2019/20 2020/21 2017/18 - 2020/21 Government Communication and Information System
371 392 365 476 385 256 401 450 2.6% 28.6% 420 485 441 683 471 442 5.5% 28.0%
Independent Communications Authority of South Africa
376 221 393 619 373 071 430 383 4.6% 29.5% 443 961 461 241 486 609 4.2% 29.4%
Brand South Africa 167 686 173 160 181 186 194 300 5.0% 13.4% 200 430 211 654 223 294 4.7% 13.4%Film and Publication Board 78 901 82 359 86 472 91 684 5.1% 6.4% 94 577 99 873 105 366 4.7% 6.3%Total 994 200 1 014 614 1 025 985 1 117 817 17.3% 77.9% 1 159 453 1 214 451 1 286 711 19.1% 77.1%
Goods and services expenditure trends and estimates Table 3.5 Vote goods and services expenditure trends and estimates
Audited outcome Adjusted
appropriation
Averagegrowth
rate(%)
Average: Expen-diture/
Total(%)
Medium-term expenditure estimate
Averagegrowth
rate(%)
Average:Expen-diture/
Total(%)
R thousand 2014/15 2015/16 2016/17 2017/18 2014/15 - 2017/18 2018/19 2019/20 2020/21 2017/18 - 2020/21 Administrative fees – 280 556 807 – 1.6% 883 987 1 302 17.3% 2.0%Advertising – 3 163 1 462 192 – 4.8% 12 050 10 907 11 251 288.4% 17.0%Minor assets – 89 136 84 – 0.3% 66 68 74 -4.1% 0.1%Audit costs: External – – 790 880 – 1.7% 750 792 834 -1.8% 1.6%Bursaries: Employees – 62 32 4 – 0.1% 20 21 22 82.2% –Catering: Departmental activities
– 1 085 2 519 724 – 4.3% 107 113 119 -45.2% 0.5%
Communication 28 1 887 5 675 1 242 254.0% 8.8% 1 894 2 161 2 278 22.4% 3.7%Computer services 684 34 253 261 -27.5% 1.2% 4 4 4 -75.1% 0.1%Consultants: Business and advisory services
– 31 39 141 – 0.2% 1 650 1 768 1 754 131.7% 2.6%
Legal services – 2 416 2 149 1 967 – 6.5% 1 960 2 078 2 191 3.7% 4.1%Contractors 2 413 342 104 123 -62.9% 3.0% 210 222 234 23.9% 0.4%Agency and support/outsourced services
– 98 32 128 – 0.3% 126 136 143 3.8% 0.3%
Entertainment – 11 9 53 – 0.1% 57 60 64 6.5% 0.1%Fleet services (including government motor transport)
– 2 317 3 924 2 794 – 9.0% 2 613 3 068 3 238 5.0% 5.8%
Inventory: Other supplies – – – – – – – – 6 – –Consumable supplies – 139 99 311 – 0.5% 365 380 403 9.1% 0.7%Consumables: Stationery, printing and office supplies
– 967 703 529 – 2.2% 1 910 2 013 2 124 59.0% 3.2%
Operating leases – 201 219 293 – 0.7% 365 389 411 11.9% 0.7%Rental and hiring – 279 1 122 2 000 – 3.4% 5 141 5 449 5 749 42.2% 9.1%Property payments – – – – – – 2 849 3 020 3 188 – 4.5%Travel and subsistence 808 14 454 13 602 19 976 191.3% 48.7% 20 504 21 648 22 805 4.5% 42.0%Training and development – 207 106 31 – 0.3% – 10 11 -29.2% –Operating payments – 625 654 572 – 1.8% 779 643 680 5.9% 1.3%Venues and facilities – – 177 100 – 0.3% – – – -100.0% –Total 3 933 28 687 34 362 33 211 103.6% 100.0% 54 303 55 937 58 885 21.0% 100.0%
Transfers and subsidies expenditure trends and estimates Table 3.6 Vote transfers and subsidies trends and estimates
Audited outcome Adjusted
appropriation
Averagegrowth
rate(%)
Average: Expen-diture/
Total(%)
Medium-term expenditure estimate
Averagegrowth
rate(%)
Average: Expen-diture/
Total(%)
R thousand 2014/15 2015/16 2016/17 2017/18 2014/15 - 2017/18 2018/19 2019/20 2020/21 2017/18 - 2020/21 Households Social benefits Current – 49 199 733 – – – – – -100.0% –Households – 49 199 733 – – – – – -100.0% –

2018 Estimates of National Expenditure
16
Table 3.6 Vote transfers and subsidies trends and estimates
Audited outcome Adjusted
appropriation
Averagegrowth
rate(%)
Average: Expen-diture/
Total(%)
Medium-term expenditure estimate
Averagegrowth
rate(%)
Average: Expen-diture/
Total(%)
R thousand 2014/15 2015/16 2016/17 2017/18 2014/15 - 2017/18 2018/19 2019/20 2020/21 2017/18 - 2020/21 Public corporations and private enterprises
Other transfers to public corporations Current 227 168 172 927 182 093 173 766 -8.5% 15.1% 187 421 199 016 209 963 6.5% 13.6%South African Broadcasting Corporation: Channel Africa
47 413 49 640 52 271 54 885 5.0% 4.1% 58 068 61 320 64 693 5.6% 4.2%
South African Broadcasting Corporation: Public broadcaster
97 199 101 785 107 180 105 947 2.9% 8.2% 115 669 123 246 130 025 7.1% 8.4%
South African Broadcasting Corporation: Community radio stations
9 373 9 804 10 324 – -100.0% 0.6% – – – – –
South African Broadcasting Corporation: Programme productions
11 183 11 698 12 318 12 934 5.0% 1.0% 13 684 14 450 15 245 5.6% 1.0%
South African Broadcasting Corporation: Broadcasting digital migration
62 000 – – – -100.0% 1.2% – – – – –
Departmental agencies and accounts Departmental agencies (non-business entities)
Current 1 016 015 1 037 229 1 049 799 1 147 822 4.1% 84.9% 1 190 122 1 246 466 1 320 487 4.8% 86.4%Media Development and Diversity Agency
21 815 22 615 23 814 30 005 11.2% 2.0% 30 669 32 015 33 776 4.0% 2.2%
Brand South Africa 167 686 173 160 181 186 194 300 5.0% 14.3% 200 430 211 654 223 294 4.7% 14.6%Government Communication and Information System
371 392 365 476 385 256 401 450 2.6% 30.4% 420 485 441 683 471 442 5.5% 30.6%
Independent Communications Authority of South Africa
376 221 393 619 373 071 430 383 4.6% 31.4% 443 961 461 241 486 609 4.2% 32.1%
Film and Publication Board 78 901 82 359 86 472 91 684 5.1% 6.8% 94 577 99 873 105 366 4.7% 6.9%Total 1 243 183 1 210 205 1 232 091 1 322 321 2.1% 100.0% 1 377 543 1 445 482 1 530 450 5.0% 100.0%
Personnel information Table 3.7 Vote personnel numbers and cost by salary level and programme¹ Programmes 1. Administration 2. Communications Policy, Research and Development 3. Industry and Capacity Development 4. Entity Oversight
Number of posts estimated for
31 March 2018 Number and cost2 of personnel posts filled / planned for on funded establishment Number
Number of
funded posts
Number of posts
additional to the
establishment Actual Revised estimate Medium-term expenditure estimate
Average growth
rate(%)
Average: Salary
level/Total(%)
2016/17 2017/18 2018/19 2019/20 2020/21 2017/18 - 2020/21
Communications Number Cost Unit cost Number Cost
Unitcost Number Cost
Unitcost Number Cost
Unitcost Number Cost
Unit cost
Salary level 70 26 100 65.5 0.7 89 64.5 0.7 107 81.3 0.8 108 87.7 0.8 111 94.3 0.8 7.6% 100.0%1 – 6 13 11 27 5.9 0.2 16 4.3 0.3 21 5.7 0.3 21 5.9 0.3 23 7.0 0.3 12.9% 19.5%7 – 10 23 – 23 8.4 0.4 21 8.8 0.4 25 11.6 0.5 27 13.3 0.5 29 15.3 0.5 11.4% 24.6%11 – 12 15 3 19 11.4 0.6 19 10.8 0.6 24 14.8 0.6 23 15.7 0.7 23 16.9 0.7 6.6% 21.4%13 – 16 17 12 29 35.7 1.2 31 36.6 1.2 35 44.7 1.3 35 48.0 1.4 34 49.9 1.5 3.1% 32.5%Other 2 – 2 4.2 2.1 2 4.2 2.1 2 4.5 2.2 2 4.8 2.4 2 5.1 2.5 – 1.9%Programme 70 26 100 65.5 0.7 89 64.5 0.7 107 81.3 0.8 108 87.7 0.8 111 94.3 0.8 7.6% 100.0%Programme 1 55 5 64 42.6 0.7 67 40.0 0.6 81 49.9 0.6 81 53.0 0.7 81 55.4 0.7 6.5% 74.7%Programme 2 6 – 7 4.8 0.7 6 5.2 0.9 9 8.5 0.9 10 10.4 1.0 11 11.6 1.1 22.4% 8.7%Programme 3 5 20 24 13.4 0.6 11 15.5 1.4 12 18.9 1.6 12 20.2 1.7 12 21.6 1.8 2.9% 11.3%Programme 4 4 1 5 4.7 0.9 5 3.8 0.8 5 4.0 0.8 5 4.1 0.8 7 5.7 0.8 11.9% 5.3%1. Data has been provided by the department and may not necessarily reconcile with official government personnel data. 2. Rand million.
Vote 3: Communications
17
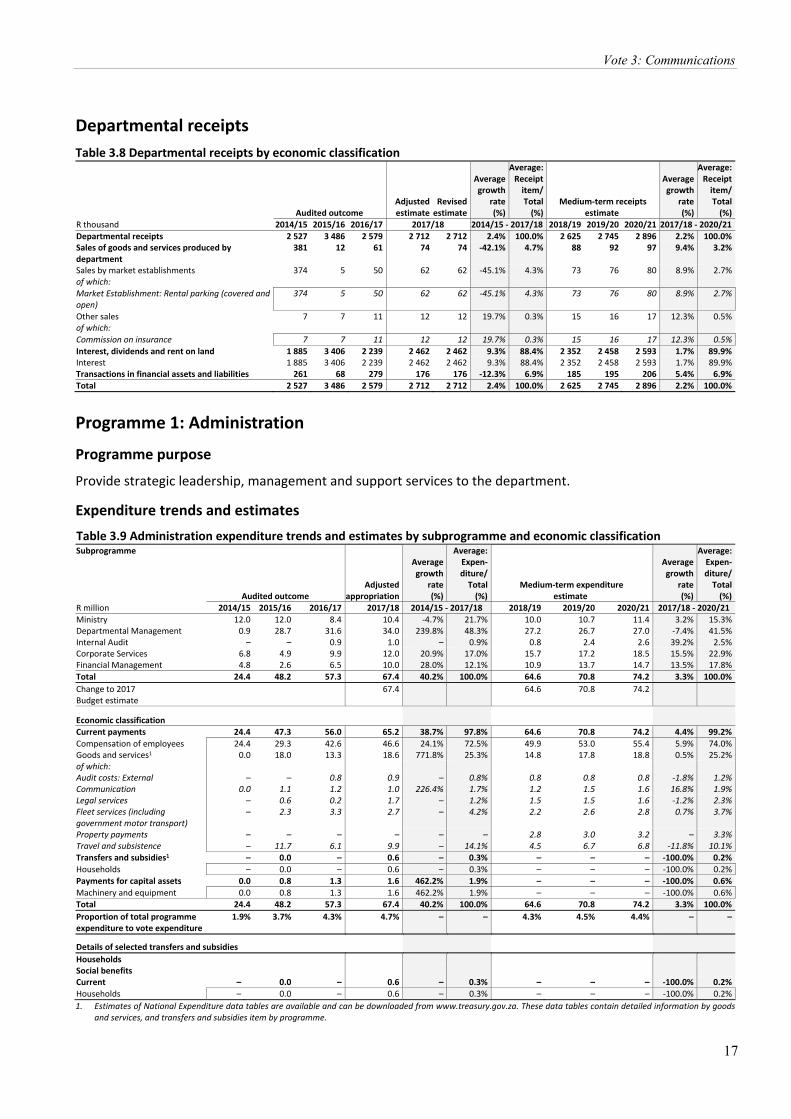
Departmental receipts Table 3.8 Departmental receipts by economic classification
Audited outcome Adjusted estimate
Revised estimate
Averagegrowth
rate (%)
Average: Receipt
item/Total
(%) Medium-term receipts
estimate
Averagegrowth
rate (%)
Average: Receipt
item/Total
(%) R thousand 2014/15 2015/16 2016/17 2017/18 2014/15 - 2017/18 2018/19 2019/20 2020/21 2017/18 - 2020/21Departmental receipts 2 527 3 486 2 579 2 712 2 712 2.4% 100.0% 2 625 2 745 2 896 2.2% 100.0%Sales of goods and services produced by department
381 12 61 74 74 -42.1% 4.7% 88 92 97 9.4% 3.2%
Sales by market establishments 374 5 50 62 62 -45.1% 4.3% 73 76 80 8.9% 2.7%of which: Market Establishment: Rental parking (covered and open)
374 5 50 62 62 -45.1% 4.3% 73 76 80 8.9% 2.7%
Other sales 7 7 11 12 12 19.7% 0.3% 15 16 17 12.3% 0.5%of which: Commission on insurance 7 7 11 12 12 19.7% 0.3% 15 16 17 12.3% 0.5%Interest, dividends and rent on land 1 885 3 406 2 239 2 462 2 462 9.3% 88.4% 2 352 2 458 2 593 1.7% 89.9%Interest 1 885 3 406 2 239 2 462 2 462 9.3% 88.4% 2 352 2 458 2 593 1.7% 89.9%Transactions in financial assets and liabilities 261 68 279 176 176 -12.3% 6.9% 185 195 206 5.4% 6.9%Total 2 527 3 486 2 579 2 712 2 712 2.4% 100.0% 2 625 2 745 2 896 2.2% 100.0%
Programme 1: Administration Programme purpose Provide strategic leadership, management and support services to the department.
Expenditure trends and estimates Table 3.9 Administration expenditure trends and estimates by subprogramme and economic classificationSubprogramme
Audited outcome Adjusted
appropriation
Averagegrowth
rate(%)
Average: Expen-diture/
Total(%)
Medium-term expenditure estimate
Averagegrowth
rate(%)
Average:Expen-diture/
Total(%)
R million 2014/15 2015/16 2016/17 2017/18 2014/15 - 2017/18 2018/19 2019/20 2020/21 2017/18 - 2020/21 Ministry 12.0 12.0 8.4 10.4 -4.7% 21.7% 10.0 10.7 11.4 3.2% 15.3%Departmental Management 0.9 28.7 31.6 34.0 239.8% 48.3% 27.2 26.7 27.0 -7.4% 41.5%Internal Audit – – 0.9 1.0 – 0.9% 0.8 2.4 2.6 39.2% 2.5%Corporate Services 6.8 4.9 9.9 12.0 20.9% 17.0% 15.7 17.2 18.5 15.5% 22.9%Financial Management 4.8 2.6 6.5 10.0 28.0% 12.1% 10.9 13.7 14.7 13.5% 17.8%Total 24.4 48.2 57.3 67.4 40.2% 100.0% 64.6 70.8 74.2 3.3% 100.0%Change to 2017 Budget estimate
67.4 64.6 70.8 74.2
Economic classification
Current payments 24.4 47.3 56.0 65.2 38.7% 97.8% 64.6 70.8 74.2 4.4% 99.2%Compensation of employees 24.4 29.3 42.6 46.6 24.1% 72.5% 49.9 53.0 55.4 5.9% 74.0%Goods and services1 0.0 18.0 13.3 18.6 771.8% 25.3% 14.8 17.8 18.8 0.5% 25.2%of which: Audit costs: External – – 0.8 0.9 – 0.8% 0.8 0.8 0.8 -1.8% 1.2%Communication 0.0 1.1 1.2 1.0 226.4% 1.7% 1.2 1.5 1.6 16.8% 1.9%Legal services – 0.6 0.2 1.7 – 1.2% 1.5 1.5 1.6 -1.2% 2.3%Fleet services (including government motor transport)
– 2.3 3.3 2.7 – 4.2% 2.2 2.6 2.8 0.7% 3.7%
Property payments – – – – – – 2.8 3.0 3.2 – 3.3%Travel and subsistence – 11.7 6.1 9.9 – 14.1% 4.5 6.7 6.8 -11.8% 10.1%Transfers and subsidies1 – 0.0 – 0.6 – 0.3% – – – -100.0% 0.2%Households – 0.0 – 0.6 – 0.3% – – – -100.0% 0.2%Payments for capital assets 0.0 0.8 1.3 1.6 462.2% 1.9% – – – -100.0% 0.6%Machinery and equipment 0.0 0.8 1.3 1.6 462.2% 1.9% – – – -100.0% 0.6%Total 24.4 48.2 57.3 67.4 40.2% 100.0% 64.6 70.8 74.2 3.3% 100.0%Proportion of total programme expenditure to vote expenditure
1.9% 3.7% 4.3% 4.7% – – 4.3% 4.5% 4.4% – –
Details of selected transfers and subsidies
Households Social benefits Current – 0.0 – 0.6 – 0.3% – – – -100.0% 0.2%Households – 0.0 – 0.6 – 0.3% – – – -100.0% 0.2%1. Estimates of National Expenditure data tables are available and can be downloaded from www.treasury.gov.za. These data tables contain detailed information by goods
and services, and transfers and subsidies item by programme.
2018 Estimates of National Expenditure
18
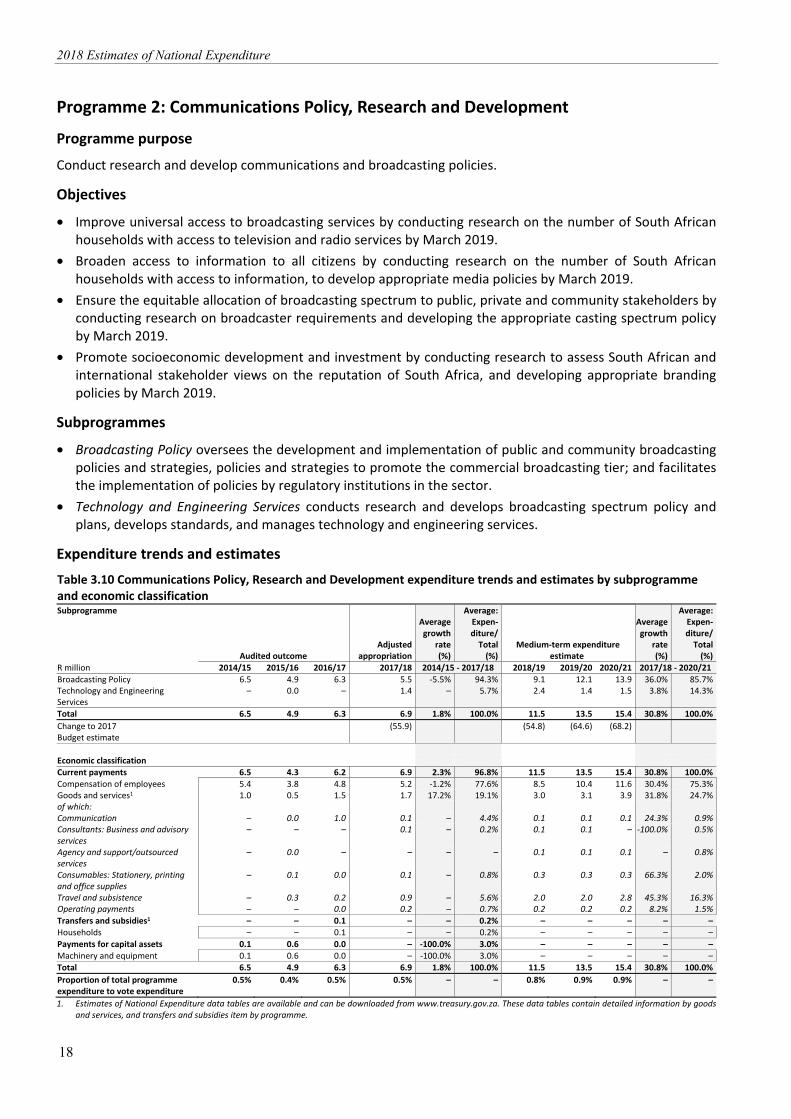
Programme 2: Communications Policy, Research and Development Programme purpose Conduct research and develop communications and broadcasting policies.
Objectives
• Improve universal access to broadcasting services by conducting research on the number of South African households with access to television and radio services by March 2019.
• Broaden access to information to all citizens by conducting research on the number of South African households with access to information, to develop appropriate media policies by March 2019.
• Ensure the equitable allocation of broadcasting spectrum to public, private and community stakeholders by conducting research on broadcaster requirements and developing the appropriate casting spectrum policy by March 2019.
• Promote socioeconomic development and investment by conducting research to assess South African and international stakeholder views on the reputation of South Africa, and developing appropriate branding policies by March 2019.
Subprogrammes
• Broadcasting Policy oversees the development and implementation of public and community broadcasting policies and strategies, policies and strategies to promote the commercial broadcasting tier; and facilitates the implementation of policies by regulatory institutions in the sector.
• Technology and Engineering Services conducts research and develops broadcasting spectrum policy and plans, develops standards, and manages technology and engineering services.
Expenditure trends and estimates Table 3.10 Communications Policy, Research and Development expenditure trends and estimates by subprogramme and economic classification Subprogramme
Audited outcome Adjusted
appropriation
Averagegrowth
rate(%)
Average: Expen-diture/
Total(%)
Medium-term expenditure estimate
Averagegrowth
rate(%)
Average:Expen-diture/
Total(%)
R million 2014/15 2015/16 2016/17 2017/18 2014/15 - 2017/18 2018/19 2019/20 2020/21 2017/18 - 2020/21 Broadcasting Policy 6.5 4.9 6.3 5.5 -5.5% 94.3% 9.1 12.1 13.9 36.0% 85.7%Technology and Engineering Services
– 0.0 – 1.4 – 5.7% 2.4 1.4 1.5 3.8% 14.3%
Total 6.5 4.9 6.3 6.9 1.8% 100.0% 11.5 13.5 15.4 30.8% 100.0%Change to 2017 Budget estimate
(55.9) (54.8) (64.6) (68.2)
Economic classification Current payments 6.5 4.3 6.2 6.9 2.3% 96.8% 11.5 13.5 15.4 30.8% 100.0%Compensation of employees 5.4 3.8 4.8 5.2 -1.2% 77.6% 8.5 10.4 11.6 30.4% 75.3%Goods and services1 1.0 0.5 1.5 1.7 17.2% 19.1% 3.0 3.1 3.9 31.8% 24.7%of which: Communication – 0.0 1.0 0.1 – 4.4% 0.1 0.1 0.1 24.3% 0.9%Consultants: Business and advisory services
– – – 0.1 – 0.2% 0.1 0.1 – -100.0% 0.5%
Agency and support/outsourced services
– 0.0 – – – – 0.1 0.1 0.1 – 0.8%
Consumables: Stationery, printing and office supplies
– 0.1 0.0 0.1 – 0.8% 0.3 0.3 0.3 66.3% 2.0%
Travel and subsistence – 0.3 0.2 0.9 – 5.6% 2.0 2.0 2.8 45.3% 16.3%Operating payments – – 0.0 0.2 – 0.7% 0.2 0.2 0.2 8.2% 1.5%Transfers and subsidies1 – – 0.1 – – 0.2% – – – – – Households – – 0.1 – – 0.2% – – – – – Payments for capital assets 0.1 0.6 0.0 – -100.0% 3.0% – – – – – Machinery and equipment 0.1 0.6 0.0 – -100.0% 3.0% – – – – – Total 6.5 4.9 6.3 6.9 1.8% 100.0% 11.5 13.5 15.4 30.8% 100.0%Proportion of total programme expenditure to vote expenditure
0.5% 0.4% 0.5% 0.5% – – 0.8% 0.9% 0.9% – –
1. Estimates of National Expenditure data tables are available and can be downloaded from www.treasury.gov.za. These data tables contain detailed information by goods and services, and transfers and subsidies item by programme.
Vote 3: Communications
19
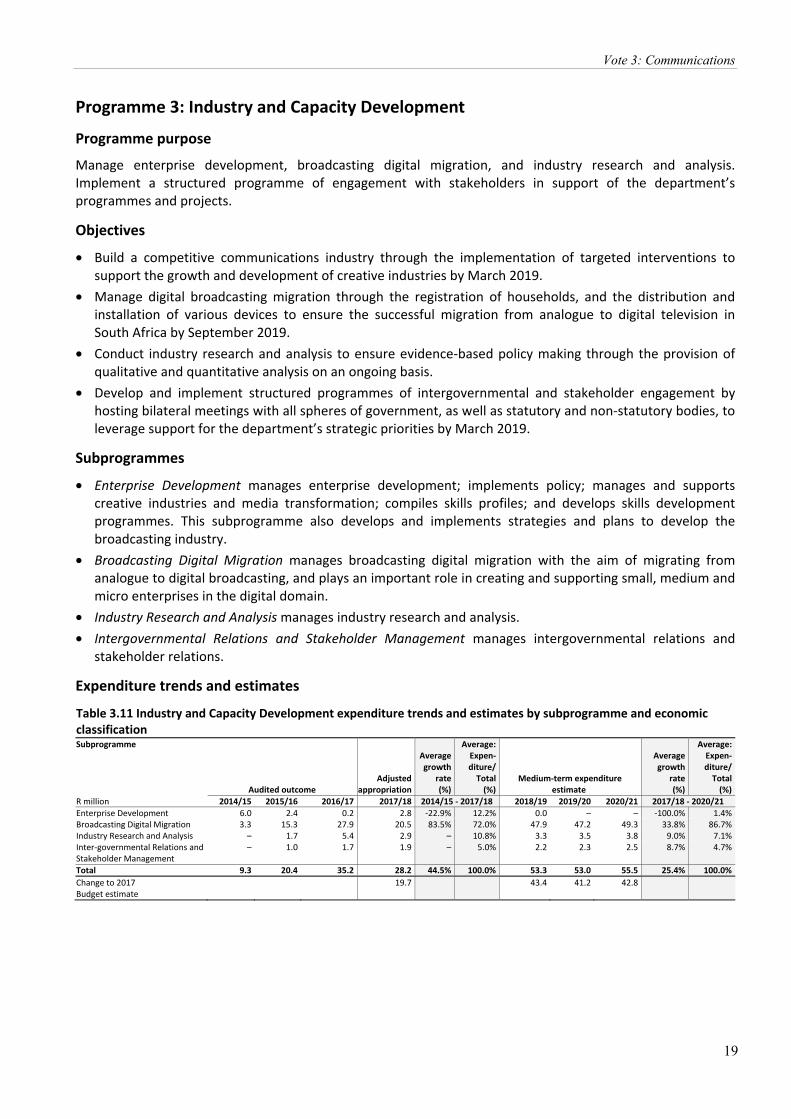
Programme 3: Industry and Capacity Development Programme purpose Manage enterprise development, broadcasting digital migration, and industry research and analysis. Implement a structured programme of engagement with stakeholders in support of the department’s programmes and projects.
Objectives
• Build a competitive communications industry through the implementation of targeted interventions to support the growth and development of creative industries by March 2019.
• Manage digital broadcasting migration through the registration of households, and the distribution and installation of various devices to ensure the successful migration from analogue to digital television in South Africa by September 2019.
• Conduct industry research and analysis to ensure evidence-based policy making through the provision of qualitative and quantitative analysis on an ongoing basis.
• Develop and implement structured programmes of intergovernmental and stakeholder engagement by hosting bilateral meetings with all spheres of government, as well as statutory and non-statutory bodies, to leverage support for the department’s strategic priorities by March 2019.
Subprogrammes
• Enterprise Development manages enterprise development; implements policy; manages and supports creative industries and media transformation; compiles skills profiles; and develops skills development programmes. This subprogramme also develops and implements strategies and plans to develop the broadcasting industry.
• Broadcasting Digital Migration manages broadcasting digital migration with the aim of migrating from analogue to digital broadcasting, and plays an important role in creating and supporting small, medium and micro enterprises in the digital domain.
• Industry Research and Analysis manages industry research and analysis. • Intergovernmental Relations and Stakeholder Management manages intergovernmental relations and
stakeholder relations.
Expenditure trends and estimates Table 3.11 Industry and Capacity Development expenditure trends and estimates by subprogramme and economic classification Subprogramme
Audited outcome Adjusted
appropriation
Averagegrowth
rate(%)
Average: Expen-diture/
Total(%)
Medium-term expenditure estimate
Averagegrowth
rate(%)
Average:Expen-diture/
Total(%)
R million 2014/15 2015/16 2016/17 2017/18 2014/15 - 2017/18 2018/19 2019/20 2020/21 2017/18 - 2020/21 Enterprise Development 6.0 2.4 0.2 2.8 -22.9% 12.2% 0.0 – – -100.0% 1.4%Broadcasting Digital Migration 3.3 15.3 27.9 20.5 83.5% 72.0% 47.9 47.2 49.3 33.8% 86.7%Industry Research and Analysis – 1.7 5.4 2.9 – 10.8% 3.3 3.5 3.8 9.0% 7.1%Inter-governmental Relations and Stakeholder Management
– 1.0 1.7 1.9 – 5.0% 2.2 2.3 2.5 8.7% 4.7%
Total 9.3 20.4 35.2 28.2 44.5% 100.0% 53.3 53.0 55.5 25.4% 100.0%Change to 2017 Budget estimate
19.7 43.4 41.2 42.8
2018 Estimates of National Expenditure
20
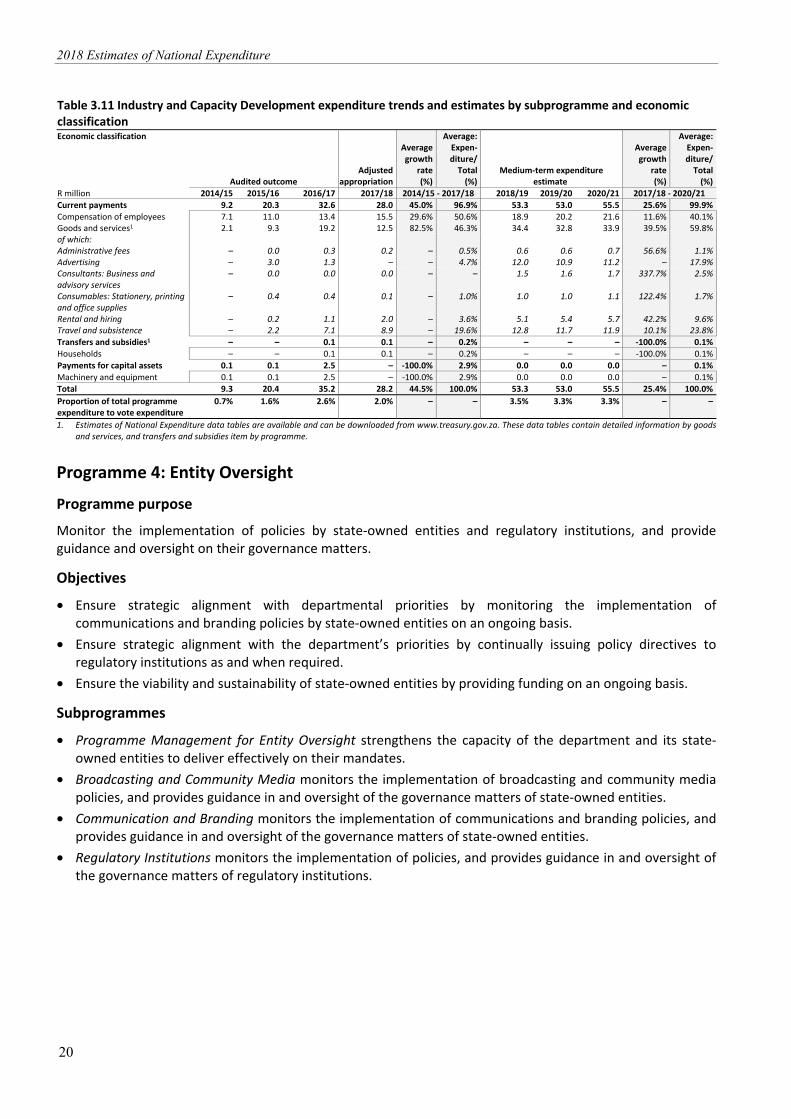
Table 3.11 Industry and Capacity Development expenditure trends and estimates by subprogramme and economic classification Economic classification
Audited outcome Adjusted
appropriation
Averagegrowth
rate(%)
Average: Expen-diture/
Total(%)
Medium-term expenditure estimate
Averagegrowth
rate(%)
Average:Expen-diture/
Total(%)
R million 2014/15 2015/16 2016/17 2017/18 2014/15 - 2017/18 2018/19 2019/20 2020/21 2017/18 - 2020/21 Current payments 9.2 20.3 32.6 28.0 45.0% 96.9% 53.3 53.0 55.5 25.6% 99.9%Compensation of employees 7.1 11.0 13.4 15.5 29.6% 50.6% 18.9 20.2 21.6 11.6% 40.1%Goods and services1 2.1 9.3 19.2 12.5 82.5% 46.3% 34.4 32.8 33.9 39.5% 59.8%of which: Administrative fees – 0.0 0.3 0.2 – 0.5% 0.6 0.6 0.7 56.6% 1.1%Advertising – 3.0 1.3 – – 4.7% 12.0 10.9 11.2 – 17.9%Consultants: Business and advisory services
– 0.0 0.0 0.0 – – 1.5 1.6 1.7 337.7% 2.5%
Consumables: Stationery, printing and office supplies
– 0.4 0.4 0.1 – 1.0% 1.0 1.0 1.1 122.4% 1.7%
Rental and hiring – 0.2 1.1 2.0 – 3.6% 5.1 5.4 5.7 42.2% 9.6%Travel and subsistence – 2.2 7.1 8.9 – 19.6% 12.8 11.7 11.9 10.1% 23.8%Transfers and subsidies1 – – 0.1 0.1 – 0.2% – – – -100.0% 0.1%Households – – 0.1 0.1 – 0.2% – – – -100.0% 0.1%Payments for capital assets 0.1 0.1 2.5 – -100.0% 2.9% 0.0 0.0 0.0 – 0.1%Machinery and equipment 0.1 0.1 2.5 – -100.0% 2.9% 0.0 0.0 0.0 – 0.1%Total 9.3 20.4 35.2 28.2 44.5% 100.0% 53.3 53.0 55.5 25.4% 100.0%Proportion of total programme expenditure to vote expenditure
0.7% 1.6% 2.6% 2.0% – – 3.5% 3.3% 3.3% – –
1. Estimates of National Expenditure data tables are available and can be downloaded from www.treasury.gov.za. These data tables contain detailed information by goods and services, and transfers and subsidies item by programme.
Programme 4: Entity Oversight Programme purpose Monitor the implementation of policies by state-owned entities and regulatory institutions, and provide guidance and oversight on their governance matters.
Objectives
• Ensure strategic alignment with departmental priorities by monitoring the implementation of communications and branding policies by state-owned entities on an ongoing basis.
• Ensure strategic alignment with the department’s priorities by continually issuing policy directives to regulatory institutions as and when required.
• Ensure the viability and sustainability of state-owned entities by providing funding on an ongoing basis.
Subprogrammes
• Programme Management for Entity Oversight strengthens the capacity of the department and its state-owned entities to deliver effectively on their mandates.
• Broadcasting and Community Media monitors the implementation of broadcasting and community media policies, and provides guidance in and oversight of the governance matters of state-owned entities.
• Communication and Branding monitors the implementation of communications and branding policies, and provides guidance in and oversight of the governance matters of state-owned entities.
• Regulatory Institutions monitors the implementation of policies, and provides guidance in and oversight of the governance matters of regulatory institutions.

Vote 3: Communications
21
Expenditure trends and estimates Table 3.12 Entity Oversight expenditure trends and estimates by subprogramme and economic classificationSubprogramme
Audited outcome Adjusted
appropriation
Averagegrowth
rate(%)
Average: Expen-diture/
Total(%)
Medium-term expenditure estimate
Averagegrowth
rate(%)
Average:Expen-diture/
Total(%)
R million 2014/15 2015/16 2016/17 2017/18 2014/15 - 2017/18 2018/19 2019/20 2020/21 2017/18 - 2020/21 Programme Management for Entity Oversight
– 2.6 4.1 1.5 – 0.2% 1.8 1.7 3.1 27.0% 0.1%
Broadcasting and Community Media
252.7 196.9 206.9 205.1 -6.7% 17.1% 219.9 232.9 245.8 6.2% 15.9%
Communication and Branding 539.1 539.1 566.4 595.8 3.4% 44.6% 621.4 653.9 695.3 5.3% 45.0%Regulatory Institutions 455.1 476.0 459.5 523.5 4.8% 38.1% 540.6 563.3 594.3 4.3% 39.0%Total 1 246.9 1 214.6 1 237.0 1 325.9 2.1% 100.0% 1 383.7 1 451.8 1 538.5 5.1% 100.0%Change to 2017 Budget estimate
1 303.6 1 354.4 1 429.6 1 514.9
Economic classification Current payments 3.6 4.4 5.0 4.3 5.5% 0.3% 6.1 6.3 8.0 23.3% 0.4%Compensation of employees 2.8 3.5 4.7 3.8 10.0% 0.3% 4.0 4.1 5.7 14.6% 0.3%Goods and services1 0.8 0.9 0.3 0.5 -14.8% 0.1% 2.1 2.2 2.3 67.0% 0.1%of which: Communication – 0.0 0.1 0.1 – – 0.3 0.3 0.3 44.9% – Consumables: Stationery, printing and office supplies
– 0.0 0.0 0.0 – – 0.3 0.3 0.3 182.7% –
Operating leases – – – 0.0 – – 0.1 0.2 0.2 60.1% – Travel and subsistence 0.8 0.3 0.2 0.2 -33.9% – 1.2 1.2 1.3 77.7% 0.1%Operating payments – – – 0.0 – – 0.1 0.1 0.1 143.3% – Transfers and subsidies1 1 243.2 1 210.2 1 232.0 1 321.6 2.1% 99.7% 1 377.5 1 445.5 1 530.5 5.0% 99.6%Departmental agencies and accounts
1 016.0 1 037.2 1 049.8 1 147.8 4.1% 84.6% 1 190.1 1 246.5 1 320.5 4.8% 86.1%
Public corporations and private enterprises
227.2 172.9 182.1 173.8 -8.5% 15.0% 187.4 199.0 210.0 6.5% 13.5%
Households – – 0.1 – – – – – – – – Payments for capital assets 0.1 0.0 – – -100.0% – – – – – – Machinery and equipment 0.1 0.0 – – -100.0% – – – – – – Total 1 246.9 1 214.6 1 237.0 1 325.9 2.1% 100.0% 1 383.7 1 451.8 1 538.5 5.1% 100.0%Proportion of total programme expenditure to vote expenditure
96.9% 94.3% 92.6% 92.8% – – 91.4% 91.4% 91.4% – –
Details of selected transfers and subsidies Departmental agencies and accounts
Departmental agencies (non-business entities)
Current 1 016.0 1 037.2 1 049.8 1 147.8 4.1% 84.6% 1 190.1 1 246.5 1 320.5 4.8% 86.1%Media Development and Diversity Agency
21.8 22.6 23.8 30.0 11.2% 2.0% 30.7 32.0 33.8 4.0% 2.2%
Brand South Africa 167.7 173.2 181.2 194.3 5.0% 14.3% 200.4 211.7 223.3 4.7% 14.6%Government Communication and Information System
371.4 365.5 385.3 401.5 2.6% 30.3% 420.5 441.7 471.4 5.5% 30.4%
Independent Communications Authority of South Africa
376.2 393.6 373.1 430.4 4.6% 31.3% 444.0 461.2 486.6 4.2% 32.0%
Film and Publication Board 78.9 82.4 86.5 91.7 5.1% 6.8% 94.6 99.9 105.4 4.7% 6.9%Public corporations and private enterprises
Public corporations Other transfers to public corporations
Current 227.2 172.9 182.1 173.8 -8.5% 15.0% 187.4 199.0 210.0 6.5% 13.5%South African Broadcasting Corporation: Channel Africa
47.4 49.6 52.3 54.9 5.0% 4.1% 58.1 61.3 64.7 5.6% 4.2%
South African Broadcasting Corporation: Public broadcaster
97.2 101.8 107.2 105.9 2.9% 8.2% 115.7 123.2 130.0 7.1% 8.3%
South African Broadcasting Corporation: Community radio stations
9.4 9.8 10.3 – -100.0% 0.6% – – – – –
South African Broadcasting Corporation: Programme productions
11.2 11.7 12.3 12.9 5.0% 1.0% 13.7 14.5 15.2 5.6% 1.0%
South African Broadcasting Corporation: Broadcasting digital migration
62.0 – – – -100.0% 1.2% – – – – –
1. Estimates of National Expenditure data tables are available and can be downloaded from www.treasury.gov.za. These data tables contain detailed information by goods and services, and transfers and subsidies item by programme.
2018 Estimates of National Expenditure
22
Other departments within the vote Government Communication and Information System Budget summary
2018/19 2019/20 2020/21
R million Total Current
paymentsTransfers and
subsidiesPayments forcapital assets Total Total
MTEF allocation Administration 164.2 163.4 0.0 0.7 171.9 182.4Content Processing and Dissemination 145.0 143.6 – 1.4 152.5 162.9Intergovernmental Coordination and Stakeholder Management
111.3 110.2 0.0 1.1 117.3 126.1
Total expenditure estimates 420.5 417.2 0.1 3.2 441.7 471.4Executive authority Minister of Communications Accounting officer Director General of Government Communication and Information System Website address www.gcis.gov.za The Estimates of National Expenditure e-publications for individual votes are available on www.treasury.gov.za. These publications provide more comprehensive coverage of vote specific information, particularly about goods and services, transfers and subsidies, personnel, entities, donor funding, public private partnerships, conditional grants to provinces and municipalities, and expenditure information at the level of service delivery, where appropriate.
Department purpose Provide a comprehensive communication service on behalf of government to facilitate the involvement of the majority of South Africans in governance, reconstruction and development, nation building, and reconciliation.
Mandate The mandate of the Government Communication and Information System is derived from section 195(g) of the Constitution, which stipulates that the public should be provided with information that is timely, accurate and accessible. This is in support of the constitutional principles of freedom of expression, transparency and openness of government. The department is responsible for providing strategic leadership and coordinating government communication to ensure that the public are informed and have access to government programmes and policies that benefit them.
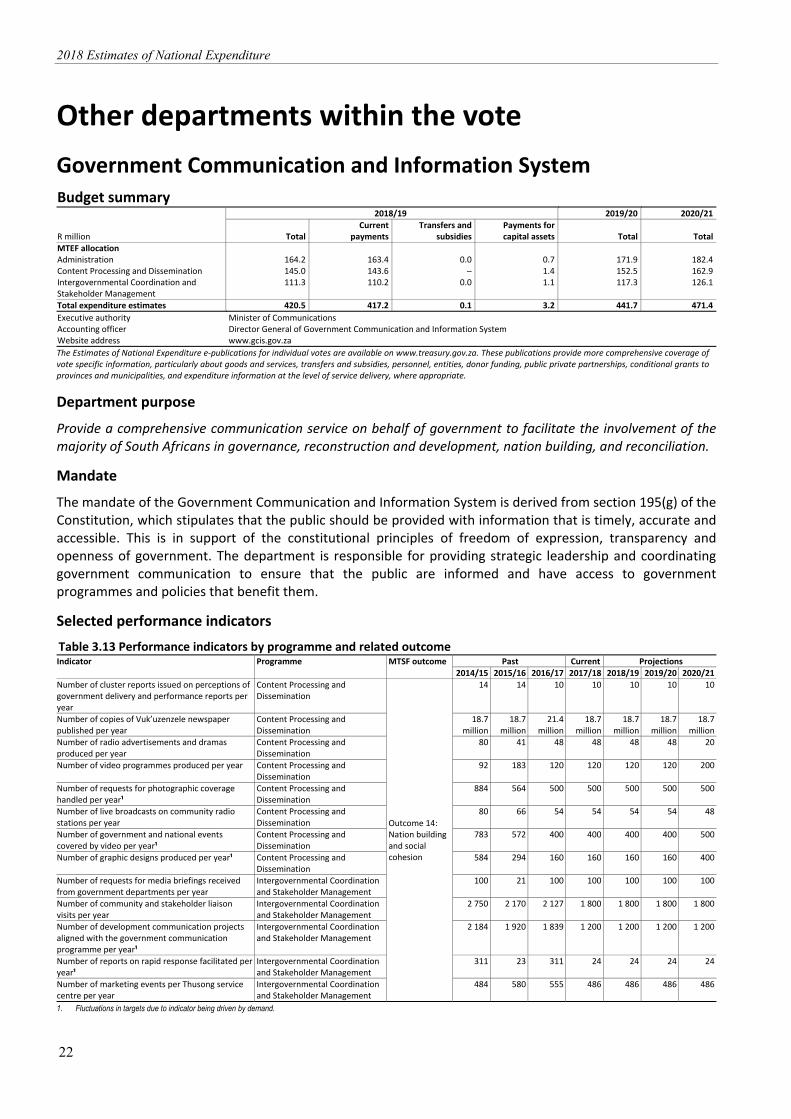
Selected performance indicators Table 3.13 Performance indicators by programme and related outcomeIndicator Programme MTSF outcome Past Current Projections 2014/15 2015/16 2016/17 2017/18 2018/19 2019/20 2020/21Number of cluster reports issued on perceptions of government delivery and performance reports per year
Content Processing and Dissemination
Outcome 14: Nation building and social cohesion
14 14 10 10 10 10 10
Number of copies of Vuk’uzenzele newspaper published per year
Content Processing and Dissemination
18.7 million
18.7 million
21.4 million
18.7 million
18.7 million
18.7 million
18.7 million
Number of radio advertisements and dramas produced per year
Content Processing and Dissemination
80 41 48 48 48 48 20
Number of video programmes produced per year Content Processing and Dissemination
92 183 120 120 120 120 200
Number of requests for photographic coverage handled per year¹
Content Processing and Dissemination
884 564 500 500 500 500 500
Number of live broadcasts on community radio stations per year
Content Processing and Dissemination
80 66 54 54 54 54 48
Number of government and national events covered by video per year¹
Content Processing and Dissemination
783 572 400 400 400 400 500
Number of graphic designs produced per year¹ Content Processing and Dissemination
584 294 160 160 160 160 400
Number of requests for media briefings received from government departments per year
Intergovernmental Coordination and Stakeholder Management
100 21 100 100 100 100 100
Number of community and stakeholder liaison visits per year
Intergovernmental Coordination and Stakeholder Management
2 750 2 170 2 127 1 800 1 800 1 800 1 800
Number of development communication projects aligned with the government communication programme per year¹
Intergovernmental Coordination and Stakeholder Management
2 184 1 920 1 839 1 200 1 200 1 200 1 200
Number of reports on rapid response facilitated per year¹
Intergovernmental Coordination and Stakeholder Management
311 23 311 24 24 24 24
Number of marketing events per Thusong service centre per year
Intergovernmental Coordination and Stakeholder Management
484 580 555 486 486 486 486
1. Fluctuations in targets due to indicator being driven by demand.
Vote 3: Communications
23
Expenditure analysis Chapter 15 of the NDP emphasises the need to unite all South Africans around a common goal, ensure that citizens are active in their own development, and build a capable and developmental state. This is given expression by outcome 12 (an efficient, effective and development oriented public service) and outcome 14 (nation building and social cohesion) of government’s 2014-2019 medium-term strategic framework, with which the work of the Government Communication and Information System is closely aligned. Over the medium term, the department will continue to focus on providing strategic communications and facilitating active citizen participation by conducting research on government communications strategies and compiling government communications products such as the Vuk’uzenzele newspaper.
Cabinet has approved budget reductions of R10.8 million in 2018/19, R18.8 million in 2019/20 and R19.8 million in 2020/21 in the department’s Administration programme in line with fiscal consolidation objectives. The department will accommodate these reductions by revising its operational outputs, projects and programmes. As the department’s work is labour intensive, spending on compensation of employees, for 441 personnel, is expected to account for 60.6 per cent of its total budget over the MTEF period.
Providing and facilitating strategic government communications The department is responsible for informing the public about government policies, plans, programmes and activities. Over the medium term, the department plans to publish 111 editions of communication products. This includes the production and distribution of 18.7 million copies of 24 editions of the Vuk’uzenzele newspaper in the 11 official languages, as well as 9 600 copies in braille each year. Information published in Vuk’uzenzele focuses on key government priorities, such as issues affecting the youth, service delivery, rural development and advertisements for vacancies in government. The production and distribution of the newspaper is funded through the Products and Platforms subprogramme in the Content Processing and Dissemination programme, with a budget allocation of R95.2 million over the medium term.
The department collects public opinion, research and analysis, and media content to understand the communications environment and inform government messages. As such, over the medium term, the department plans to facilitate a rapid response mechanism through its media engagement facility to hasten government’s response to issues arising in the media, as well as greater coordination with its parliamentary office. The media engagement facility also manages the interface between government and commercial and community media, and coordinates support across government departments for key communications projects of the president and the deputy president, as well as cluster media programmes. To foster and build relationships between government and the media, the department also plans to hold 33 engagements over the medium term between state officials and senior journalists.
The department plans to produce 90 research advisory reports over the MTEF period, including for various national departments and premiers’ offices, to aid government communicators in developing communication strategies. In partnership with the National School of Government, the department will continue to expand the coordination of the emerging in-house initiative to build capacity and professionalism among government communicators to equip them with skills and techniques for communicating government messages.
Other communications activities include compiling annual online editions of the South Africa Yearbook and Pocket Guide to South Africa, providing daily government news and updates on sanews.gov.za, updating content on government’s website (www.gov.za), and producing 12 annual reports on the performance of government’s social media accounts. These activities are expected to be funded through the Content Processing and Dissemination programme, which has a total budget of R460.4 million over the medium term. An estimated 38.9 per cent (R179.3 million) of the programme’s budget over the medium term will be spent on operational costs such as research (R18.6 million), and travel and subsistence for videographers and photographers to cover the domestic and foreign engagements of the president and deputy president (R24.4 million).
Over the MTEF period, the department plans to provide media production and bulk buying services for other government departments to reduce government’s advertising costs in mainstream media. The department

2018 Estimates of National Expenditure
24
aims to provide more than 2 000 communication services over the medium term. These include advertisements, the hosting of talk shows, the compilation of voiceovers, and video and photographic services to client departments and public entities. These services are funded through the communications budget allocation of client departments and entities.
The department expects to compile 30 cluster reports over the MTEF period to provide strategic communication advice, coordination and support to departments; and hold 4 engagements with national department heads of communications and 10 internal communicator forums to share best practices and content on government programmes.
To cater for the provision and facilitation of strategic government communications, the Intergovernmental Coordination and Stakeholder Management programme has a total budget of R354.7 million over the medium term. 83.5 per cent (R300.4 million) of this allocation is for spending on compensation of employees, while 15.3 per cent (R54.3 million) is for operational expenditure.
Facilitating active citizen participation The department will work to improve and strengthen campaign management, support project management practices, and improve the coherence and alignment of government messages over the medium term. This will enable the department to conduct a planned 10 458 outreach campaigns to improve public participation in the development and implementation of government policies, plans and programmes. The department also plans to conduct 1 200 development communication campaigns and 1 800 community and stakeholder liaison visits per year over the medium term. These initiatives are expected to deliver information to more than 1 million people per month through direct and indirect communication with citizens, community radio talk shows, community newspapers and awareness campaigns. R6 million has been allocated for communication development projects, R3 million for community and stakeholder liaison visits, and R2.5 million for the marketing of Thusong service centres per year in the Provincial and Local Liaison subprogramme in the Intergovernmental Coordination and Stakeholder Management programme. The department expects to spend a further R1 million per year over the MTEF period on the imbizo programme, which facilitates interactions between political principals and the public; and develop content for print and electronic communications products, including leaflets for the state of the nation address.
Expenditure trends Table 3.14 Departmental expenditure trends by programme and economic classification Programmes 1. Administration 2. Content Processing and Dissemination 3. Intergovernmental Coordination and Stakeholder Management Programme
Ann
ual b
udge
t
Adj
uste
d
appr
opria
tion
Aud
ited
ou
tcom
e
Ann
ual b
udge
t
Adj
uste
d
appr
opria
tion
Aud
ited
ou
tcom
e
Ann
ual b
udge
t
Adj
uste
d
appr
opria
tion
Aud
ited
ou
tcom
e
Ann
ual b
udge
t
Adj
uste
d
appr
opria
tion
Rev
ised
es
timat
e
Aver
age:
O
utco
me/
Annu
al
budg
et
(%)
Aver
age:
O
utco
me/
Adju
sted
ap
prop
riatio
n (%
)
R million 2014/15 2015/16 2016/17 2017/18 2014/15 - 2017/18 Programme 1 141.4 134.6 133.6 139.8 139.8 144.9 143.1 144.2 147.4 154.3 150.7 157.6 100.8% 102.5%Programme 2 150.0 145.6 137.3 130.9 130.9 126.9 133.6 136.1 134.8 140.4 143.6 139.3 97.0% 96.8%Programme 3 121.7 99.3 93.9 94.7 94.7 93.5 105.5 104.9 97.9 110.1 107.2 104.5 90.2% 96.0%Total 413.1 379.5 364.9 365.5 365.5 365.2 382.2 385.3 380.1 404.8 401.5 401.4 96.6% 98.7%Change to 2017 Budget estimate
(3.3)
Economic classification Current payments 388.0 374.8 356.2 364.5 363.9 362.9 381.0 384.1 377.0 403.5 399.7 399.6 97.3% 98.2%Compensation of employees 200.1 188.3 181.6 210.0 209.4 202.5 222.8 222.8 216.5 236.8 229.9 229.9 95.5% 97.7%Goods and services 187.9 186.5 174.6 154.5 154.5 160.4 158.2 161.3 160.4 166.7 169.8 169.8 99.7% 99.0%Transfers and subsidies 21.8 0.6 1.0 0.1 0.7 1.0 0.1 0.1 1.2 0.1 0.5 0.5 17.0% 195.2%Departmental agencies and accounts
21.8 0.6 0.6 0.1 0.1 0.1 0.1 0.1 0.0 0.1 0.1 0.1 – –
Households – 0.0 0.4 – 0.6 1.0 – – 1.2 – 0.5 0.5 – 256.3%

Vote 3: Communications
25
Table 3.14 Departmental expenditure trends by programme and economic classification
Ann
ual b
udge
t
Adj
uste
d
appr
opria
tion
Aud
ited
ou
tcom
e
Ann
ual b
udge
t
Adj
uste
d
appr
opria
tion
Aud
ited
ou
tcom
e
Ann
ual b
udge
t
Adj
uste
d
appr
opria
tion
Aud
ited
ou
tcom
e
Ann
ual b
udge
t
Adj
uste
d
appr
opria
tion
Rev
ised
es
timat
e
Aver
age:
O
utco
me/
Annu
al
budg
et
(%)
Aver
age:
O
utco
me/
Adju
sted
ap
prop
riatio
n (%
)
R million 2014/15 2015/16 2016/17 2017/18 2014/15 - 2017/18 Payments for capital assets 3.3 4.0 7.6 0.9 0.9 1.2 1.1 1.1 1.6 1.2 1.2 1.2 180.1% 160.9%Buildings and other fixed structures
– – 0.5 – – 0.1 – – 0.0 – – – – –
Machinery and equipment 3.0 3.8 7.1 0.7 0.7 1.1 0.9 0.9 1.5 1.2 1.2 1.2 190.8% 168.3%Software and other intangible assets
0.3 0.3 – 0.2 0.2 – 0.3 0.3 0.1 (0.0) (0.0) (0.0) 7.4% 7.4%
Payments for financial assets
– – 0.0 – – 0.2 – – 0.3 – – – – –
Total 413.1 379.5 364.9 365.5 365.5 365.2 382.2 385.3 380.1 404.8 401.5 401.4 96.6% 98.7%
Expenditure estimates Table 3.15 Departmental expenditure estimates by programme and economic classification Programmes 1. Administration 2. Content Processing and Dissemination 3. Intergovernmental Coordination and Stakeholder Management Programme
Revised estimate
Averagegrowth
rate(%)
Average:Expenditure/
Total(%) Medium-term expenditure estimate
Averagegrowth
rate(%)
Average:Expenditure/
Total(%)
R million 2017/18 2014/15 - 2017/18 2018/19 2019/20 2020/21 2017/18 - 2020/21 Programme 1 157.6 5.4% 38.6% 164.2 171.9 182.4 5.0% 39.0%Programme 2 139.3 -1.5% 35.6% 145.0 152.5 162.9 5.4% 34.6%Programme 3 104.5 1.7% 25.8% 111.3 117.3 126.1 6.4% 26.5%Total 401.4 1.9% 100.0% 420.5 441.7 471.4 5.5% 100.0%Change to 2017 Budget estimate
(10.8) (18.8) (19.8)
Economic classification
Current payments 399.6 2.2% 98.9% 417.2 439.4 469.1 5.5% 99.4%Compensation of employees 229.9 6.9% 54.9% 254.0 273.3 293.8 8.5% 60.6%Goods and services 169.8 -3.1% 44.0% 163.2 166.1 175.3 1.1% 38.9%Transfers and subsidies 0.5 -4.1% 0.2% 0.1 0.1 0.1 -50.1% 0.0%Departmental agencies and accounts
0.1 -52.9% 0.0% 0.1 0.1 0.1 4.3% 0.0%
Households 0.5 121.0% 0.2% – – – -100.0% 0.0%Payments for capital assets 1.2 -33.3% 0.8% 3.2 2.2 2.2 23.2% 0.5%Machinery and equipment 1.2 -31.8% 0.7% 3.2 2.2 2.2 23.2% 0.5%Software and other intangible assets
(0.0) -115.9% 0.0% – – – -100.0% 0.0%
Total 401.4 1.9% 100.0% 420.5 441.7 471.4 5.5% 100.0%
Expenditure trends and estimates for significant spending items Table 3.16 Expenditure trends and estimates for significant spending items
Audited outcome Adjusted
appropriation
Averagegrowth
rate(%)
Average: Expen-diture/
Total Vote
(%) Medium-term expenditure
estimate
Averagegrowth
rate(%)
Average:Expen-diture/
Total Vote
(%)R thousand 2014/15 2015/16 2016/17 2017/18 2014/15 - 2017/18 2018/19 2019/20 2020/21 2017/18 - 2020/21 Compensation of employees 181 649 202 461 216 536 229 939 8.2% 54.9% 253 983 273 302 293 800 8.5% 60.6%Computer services 16 009 15 129 14 604 14 289 -3.7% 4.0% 16 013 17 129 18 149 8.3% 3.8%Operating leases 43 465 47 556 51 688 50 775 5.3% 12.8% 54 602 56 038 59 423 5.4% 12.7%Operating payments 35 808 30 833 36 811 39 352 3.2% 9.4% 34 156 34 937 36 971 -2.1% 8.4%Travel and subsistence 20 577 21 137 17 486 18 671 -3.2% 5.2% 17 474 16 568 17 350 -2.4% 4.0%Total 297 508 317 116 337 125 353 026 9.8% 86.3% 376 228 397 974 425 693 17.7% 89.5%
2018 Estimates of National Expenditure
26
Goods and services expenditure trends and estimates Table 3.17 Departmental goods and services expenditure trends and estimates
Audited outcome Adjusted
appropriation
Averagegrowth
rate(%)
Average:Expen-diture/
Total(%)
Medium-term expenditure estimate
Averagegrowth
rate(%)
Average:Expen-diture/
Total(%)
R thousand 2014/15 2015/16 2016/17 2017/18 2014/15 - 2017/18 2018/19 2019/20 2020/21 2017/18 - 2020/21 Administrative fees 663 478 537 652 -0.6% 0.4% 641 668 681 1.5% 0.4%Advertising 7 827 5 078 2 645 5 529 -10.9% 3.2% 3 635 3 533 3 546 -13.8% 2.4%Minor assets 693 156 282 128 -43.1% 0.2% 99 38 31 -37.7% –Audit costs: External 2 077 2 349 2 467 2 030 -0.8% 1.3% 2 511 2 661 2 650 9.3% 1.5%Bursaries: Employees 350 460 702 450 8.7% 0.3% 450 450 450 – 0.3%Catering: Departmental activities 1 350 679 891 938 -11.4% 0.6% 460 340 367 -26.9% 0.3%Communication 12 550 9 988 8 628 8 927 -10.7% 6.0% 7 944 8 250 8 445 -1.8% 5.0%Computer services 16 009 15 129 14 604 14 289 -3.7% 9.0% 16 013 17 129 18 149 8.3% 9.7%Consultants: Business and advisory services
2 098 2 349 84 2 132 0.5% 1.0% 515 170 745 -29.6% 0.5%
Laboratory services 2 – 5 – -100.0% – – – – – –Legal services 945 740 796 432 -23.0% 0.4% 432 538 538 7.6% 0.3%Contractors 5 571 3 895 3 294 3 607 -13.5% 2.5% 2 526 2 195 2 574 -10.6% 1.6%Agency and support/outsourced services
6 323 3 460 4 718 6 616 1.5% 3.2% 5 796 6 250 6 628 0.1% 3.7%
Fleet services (including government motor transport)
2 505 2 000 1 423 1 129 -23.3% 1.1% 978 1 057 1 056 -2.2% 0.6%
Consumable supplies 986 709 523 649 -13.0% 0.4% 662 651 596 -2.8% 0.4%Consumables: Stationery, printing and office supplies
6 164 3 118 2 782 3 671 -15.9% 2.4% 3 379 3 576 3 684 0.1% 2.1%
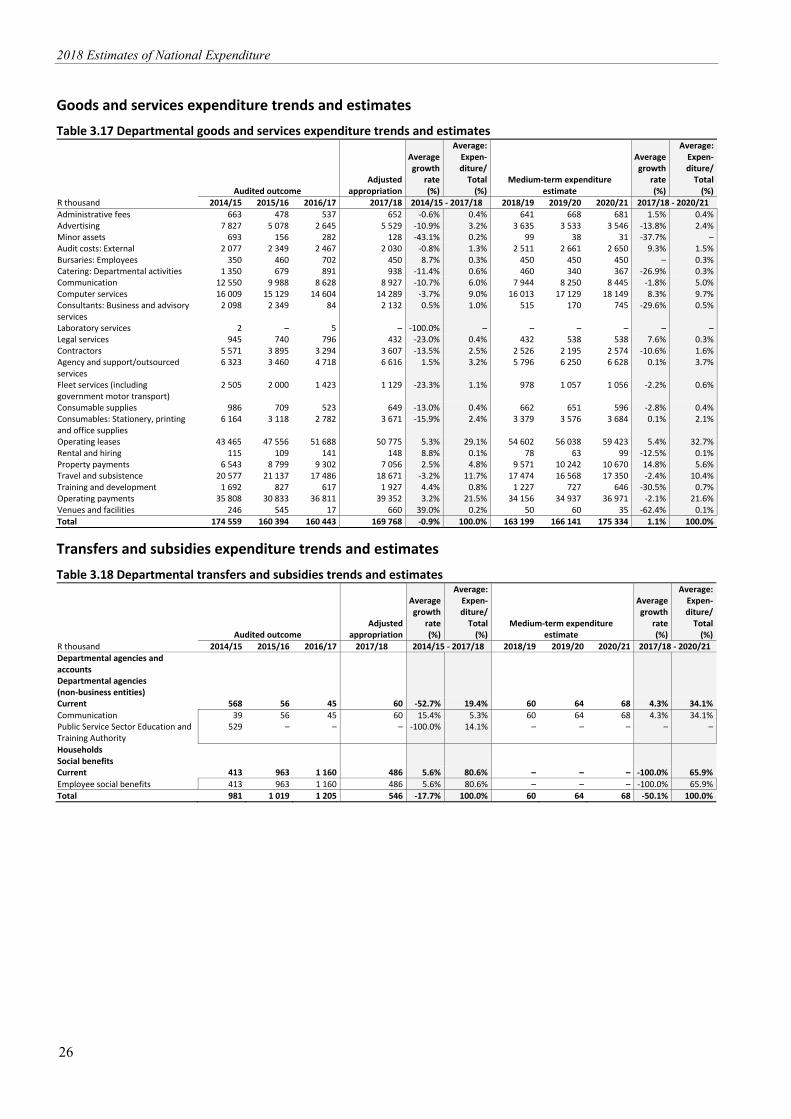
Operating leases 43 465 47 556 51 688 50 775 5.3% 29.1% 54 602 56 038 59 423 5.4% 32.7%Rental and hiring 115 109 141 148 8.8% 0.1% 78 63 99 -12.5% 0.1%Property payments 6 543 8 799 9 302 7 056 2.5% 4.8% 9 571 10 242 10 670 14.8% 5.6%Travel and subsistence 20 577 21 137 17 486 18 671 -3.2% 11.7% 17 474 16 568 17 350 -2.4% 10.4%Training and development 1 692 827 617 1 927 4.4% 0.8% 1 227 727 646 -30.5% 0.7%Operating payments 35 808 30 833 36 811 39 352 3.2% 21.5% 34 156 34 937 36 971 -2.1% 21.6%Venues and facilities 246 545 17 660 39.0% 0.2% 50 60 35 -62.4% 0.1%Total 174 559 160 394 160 443 169 768 -0.9% 100.0% 163 199 166 141 175 334 1.1% 100.0%
Transfers and subsidies expenditure trends and estimates Table 3.18 Departmental transfers and subsidies trends and estimates
Audited outcome Adjusted
appropriation
Averagegrowth
rate(%)
Average:Expen-diture/
Total(%)
Medium-term expenditure estimate
Averagegrowth
rate(%)
Average:Expen-diture/
Total(%)
R thousand 2014/15 2015/16 2016/17 2017/18 2014/15 - 2017/18 2018/19 2019/20 2020/21 2017/18 - 2020/21 Departmental agencies and accounts
Departmental agencies (non-business entities)
Current 568 56 45 60 -52.7% 19.4% 60 64 68 4.3% 34.1%Communication 39 56 45 60 15.4% 5.3% 60 64 68 4.3% 34.1%Public Service Sector Education and Training Authority
529 – – – -100.0% 14.1% – – – – –
Households Social benefits Current 413 963 1 160 486 5.6% 80.6% – – – -100.0% 65.9%Employee social benefits 413 963 1 160 486 5.6% 80.6% – – – -100.0% 65.9%Total 981 1 019 1 205 546 -17.7% 100.0% 60 64 68 -50.1% 100.0%
Vote 3: Communications
27
Personnel information Table 3.19 Departmental personnel numbers and cost by salary level and programme¹ Programmes 1. Administration 2. Content Processing and Dissemination 3. Intergovernmental Coordination and Stakeholder Management
Number of posts estimated for
31 March 2018 Number and cost2 of personnel posts filled / planned for on funded establishment Number
Number of
funded posts
Number of posts
additional to the
establishment Actual Revised estimate Medium-term expenditure estimate
Average growth
rate(%)
Average: Salary
level/Total(%)
2016/17 2017/18 2018/19 2019/20 2020/21 2017/18 - 2020/21 Government Communication and Information System Number Cost
Unit cost Number Cost
Unitcost Number Cost
Unitcost Number Cost
Unit cost Number Cost
Unitcost
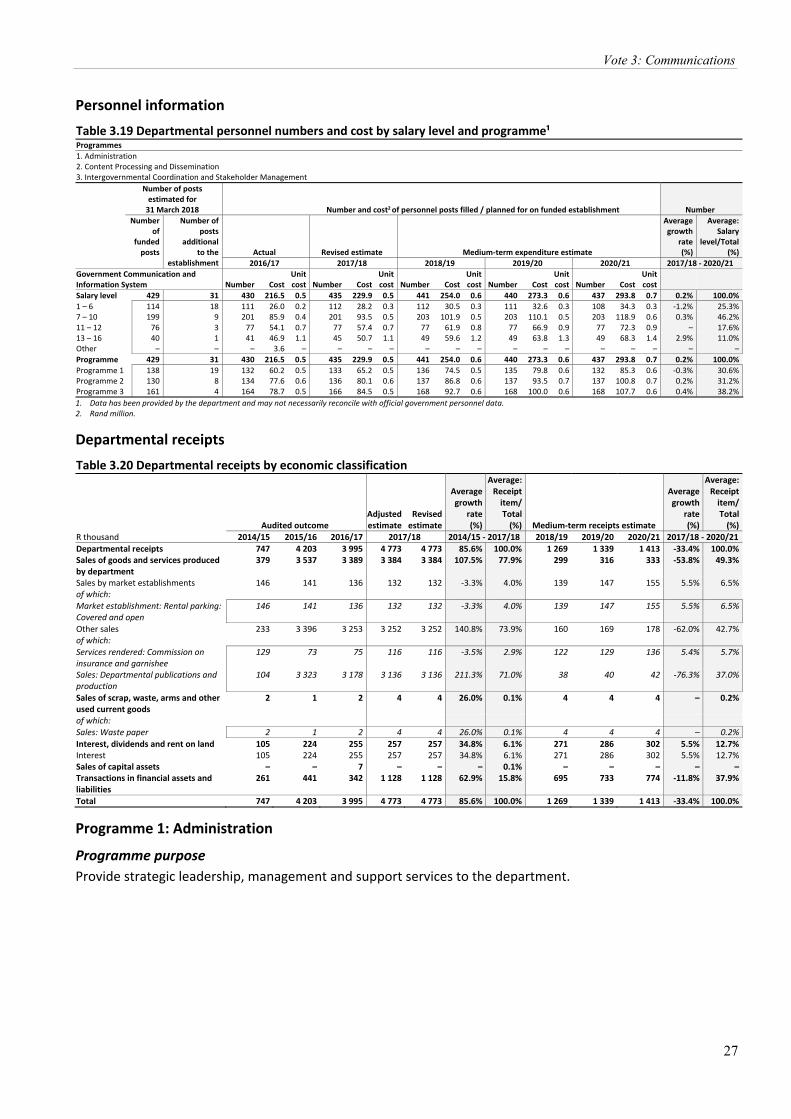
Salary level 429 31 430 216.5 0.5 435 229.9 0.5 441 254.0 0.6 440 273.3 0.6 437 293.8 0.7 0.2% 100.0%1 – 6 114 18 111 26.0 0.2 112 28.2 0.3 112 30.5 0.3 111 32.6 0.3 108 34.3 0.3 -1.2% 25.3%7 – 10 199 9 201 85.9 0.4 201 93.5 0.5 203 101.9 0.5 203 110.1 0.5 203 118.9 0.6 0.3% 46.2%11 – 12 76 3 77 54.1 0.7 77 57.4 0.7 77 61.9 0.8 77 66.9 0.9 77 72.3 0.9 – 17.6%13 – 16 40 1 41 46.9 1.1 45 50.7 1.1 49 59.6 1.2 49 63.8 1.3 49 68.3 1.4 2.9% 11.0%Other – – – 3.6 – – – – – – – – – – – – – – –Programme 429 31 430 216.5 0.5 435 229.9 0.5 441 254.0 0.6 440 273.3 0.6 437 293.8 0.7 0.2% 100.0%Programme 1 138 19 132 60.2 0.5 133 65.2 0.5 136 74.5 0.5 135 79.8 0.6 132 85.3 0.6 -0.3% 30.6%Programme 2 130 8 134 77.6 0.6 136 80.1 0.6 137 86.8 0.6 137 93.5 0.7 137 100.8 0.7 0.2% 31.2%Programme 3 161 4 164 78.7 0.5 166 84.5 0.5 168 92.7 0.6 168 100.0 0.6 168 107.7 0.6 0.4% 38.2%1. Data has been provided by the department and may not necessarily reconcile with official government personnel data. 2. Rand million.
Departmental receipts Table 3.20 Departmental receipts by economic classification
Audited outcome Adjustedestimate
Revisedestimate
Averagegrowth
rate(%)
Average:Receipt
item/Total
(%) Medium-term receipts estimate
Averagegrowth
rate(%)
Average:Receipt
item/Total
(%)R thousand 2014/15 2015/16 2016/17 2017/18 2014/15 - 2017/18 2018/19 2019/20 2020/21 2017/18 - 2020/21 Departmental receipts 747 4 203 3 995 4 773 4 773 85.6% 100.0% 1 269 1 339 1 413 -33.4% 100.0%Sales of goods and services produced by department
379 3 537 3 389 3 384 3 384 107.5% 77.9% 299 316 333 -53.8% 49.3%
Sales by market establishments 146 141 136 132 132 -3.3% 4.0% 139 147 155 5.5% 6.5%of which: Market establishment: Rental parking: Covered and open
146 141 136 132 132 -3.3% 4.0% 139 147 155 5.5% 6.5%
Other sales 233 3 396 3 253 3 252 3 252 140.8% 73.9% 160 169 178 -62.0% 42.7%of which: Services rendered: Commission on insurance and garnishee
129 73 75 116 116 -3.5% 2.9% 122 129 136 5.4% 5.7%
Sales: Departmental publications and production
104 3 323 3 178 3 136 3 136 211.3% 71.0% 38 40 42 -76.3% 37.0%
Sales of scrap, waste, arms and other used current goods
2 1 2 4 4 26.0% 0.1% 4 4 4 – 0.2%
of which: Sales: Waste paper 2 1 2 4 4 26.0% 0.1% 4 4 4 – 0.2%Interest, dividends and rent on land 105 224 255 257 257 34.8% 6.1% 271 286 302 5.5% 12.7%Interest 105 224 255 257 257 34.8% 6.1% 271 286 302 5.5% 12.7%Sales of capital assets – – 7 – – – 0.1% – – – – –Transactions in financial assets and liabilities
261 441 342 1 128 1 128 62.9% 15.8% 695 733 774 -11.8% 37.9%
Total 747 4 203 3 995 4 773 4 773 85.6% 100.0% 1 269 1 339 1 413 -33.4% 100.0%
Programme 1: Administration
Programme purpose Provide strategic leadership, management and support services to the department.
2018 Estimates of National Expenditure
28
Expenditure trends and estimates Table 3.21 Administration expenditure trends and estimates by subprogramme and economic classification Subprogramme
Audited outcome Adjusted
appropriation
Averagegrowth
rate(%)
Average: Expen-diture/
Total(%)
Medium-term expenditure estimate
Averagegrowth
rate(%)
Average:Expen-diture/
Total(%)
R million 2014/15 2015/16 2016/17 2017/18 2014/15 - 2017/18 2018/19 2019/20 2020/21 2017/18 - 2020/21 Departmental Management 5.4 6.5 5.6 6.6 7.2% 4.2% 8.2 8.8 9.4 12.3% 4.9%Corporate Services 49.1 50.8 47.2 52.4 2.2% 34.6% 54.2 57.3 60.4 4.9% 33.5%Financial Administration 26.6 29.8 32.3 31.8 6.2% 20.9% 37.5 39.6 42.2 10.0% 22.6%Internal Audit 7.0 7.7 7.9 8.1 4.7% 5.3% 8.6 9.3 9.9 7.0% 5.4%Office Accommodation 45.5 50.1 54.3 51.8 4.4% 35.0% 55.7 56.9 60.5 5.3% 33.6%Total 133.6 144.9 147.4 150.7 4.1% 100.0% 164.2 171.9 182.4 6.6% 100.0%Change to 2017 Budget estimate
(3.6) 0.7 (1.2) (1.7)
Economic classification Current payments 128.2 144.0 146.4 150.0 5.4% 98.6% 163.4 171.2 181.7 6.6% 99.6%Compensation of employees 51.0 59.5 60.2 65.2 8.6% 40.9% 74.5 79.8 85.3 9.3% 45.5%Goods and services1 77.2 84.5 86.2 84.8 3.2% 57.7% 88.9 91.3 96.4 4.4% 54.0%of which: Audit costs: External 2.1 2.3 2.5 2.0 -0.8% 1.5% 2.5 2.7 2.7 9.3% 1.5%Computer services 9.1 12.1 11.1 11.4 7.7% 7.6% 12.2 13.2 13.9 6.8% 7.6%Operating leases 42.8 46.7 50.9 49.7 5.2% 33.0% 53.5 54.9 58.2 5.4% 32.3%Property payments 6.5 8.7 9.2 6.9 2.4% 5.4% 9.5 10.1 10.5 14.9% 5.5%Travel and subsistence 3.3 3.7 2.2 2.7 -6.4% 2.0% 2.6 2.8 2.9 2.5% 1.6%Operating payments 2.6 3.0 3.1 3.2 7.2% 2.1% 1.8 1.4 1.7 -18.9% 1.2%Transfers and subsidies1 0.8 0.2 0.3 0.4 -23.9% 0.3% 0.0 0.1 0.1 -47.5% 0.1%Departmental agencies and accounts
0.6 0.0 0.0 0.0 -56.0% 0.1% 0.0 0.1 0.1 4.0% –
Households 0.3 0.1 0.2 0.3 5.0% 0.2% – – – -100.0% – Payments for capital assets 4.6 0.7 0.6 0.3 -58.4% 1.1% 0.7 0.7 0.7 30.3% 0.4%Buildings and other fixed structures
0.5 0.1 0.0 – -100.0% 0.1% – – – – –
Machinery and equipment 4.1 0.6 0.6 0.3 -56.9% 1.0% 0.7 0.7 0.7 30.3% 0.4%Payments for financial assets 0.0 0.0 0.0 – -100.0% – – – – – – Total 133.6 144.9 147.4 150.7 4.1% 100.0% 164.2 171.9 182.4 6.6% 100.0%Proportion of total programme expenditure to vote expenditure
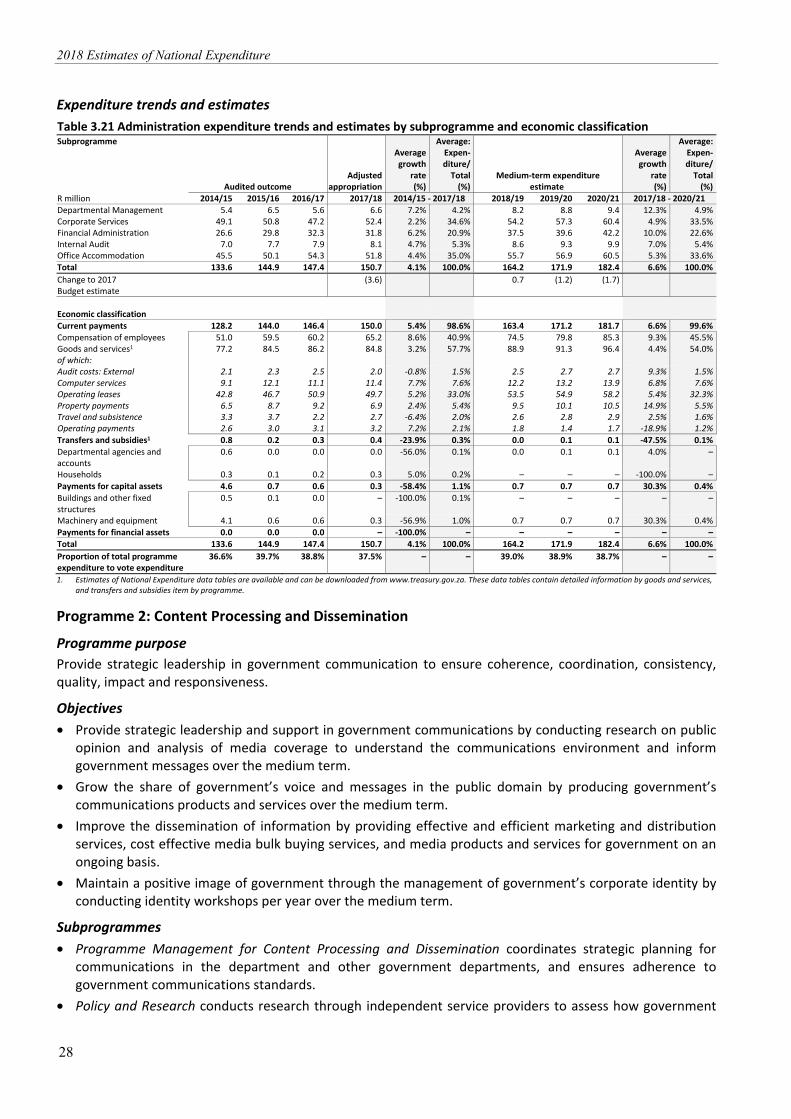
36.6% 39.7% 38.8% 37.5% – – 39.0% 38.9% 38.7% – –
1. Estimates of National Expenditure data tables are available and can be downloaded from www.treasury.gov.za. These data tables contain detailed information by goods and services, and transfers and subsidies item by programme.
Programme 2: Content Processing and Dissemination
Programme purpose Provide strategic leadership in government communication to ensure coherence, coordination, consistency, quality, impact and responsiveness.
Objectives • Provide strategic leadership and support in government communications by conducting research on public
opinion and analysis of media coverage to understand the communications environment and inform government messages over the medium term.
• Grow the share of government’s voice and messages in the public domain by producing government’s communications products and services over the medium term.
• Improve the dissemination of information by providing effective and efficient marketing and distribution services, cost effective media bulk buying services, and media products and services for government on an ongoing basis.
• Maintain a positive image of government through the management of government’s corporate identity by conducting identity workshops per year over the medium term.
Subprogrammes • Programme Management for Content Processing and Dissemination coordinates strategic planning for
communications in the department and other government departments, and ensures adherence to government communications standards.
• Policy and Research conducts research through independent service providers to assess how government
Vote 3: Communications
29
should address the public’s information needs; monitors media coverage of issues affecting government and the country; provides analyses on how the media interprets government policies and programmes; formulates policy proposals where they are required; and assesses public perceptions in relation to government performance.
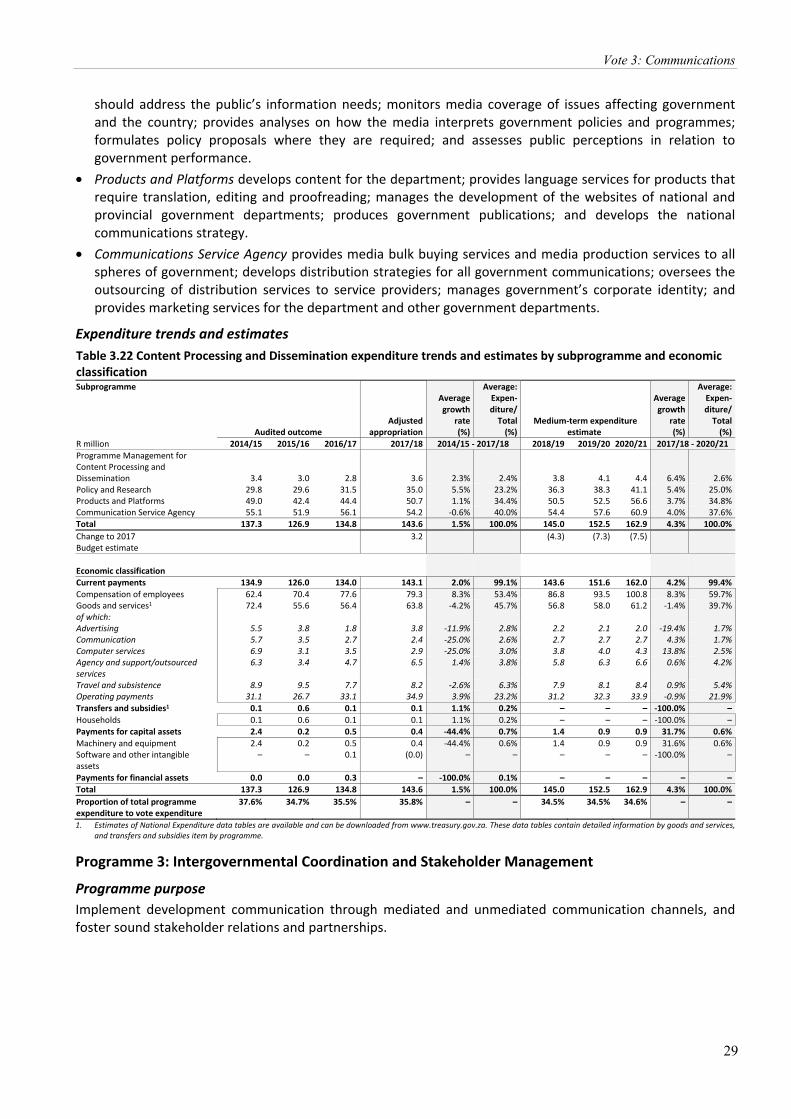
• Products and Platforms develops content for the department; provides language services for products that require translation, editing and proofreading; manages the development of the websites of national and provincial government departments; produces government publications; and develops the national communications strategy.
• Communications Service Agency provides media bulk buying services and media production services to all spheres of government; develops distribution strategies for all government communications; oversees the outsourcing of distribution services to service providers; manages government’s corporate identity; and provides marketing services for the department and other government departments.
Expenditure trends and estimates Table 3.22 Content Processing and Dissemination expenditure trends and estimates by subprogramme and economic classification Subprogramme
Audited outcome Adjusted
appropriation
Averagegrowth
rate(%)
Average: Expen-diture/
Total(%)
Medium-term expenditure estimate
Averagegrowth
rate(%)
Average:Expen-diture/
Total(%)
R million 2014/15 2015/16 2016/17 2017/18 2014/15 - 2017/18 2018/19 2019/20 2020/21 2017/18 - 2020/21 Programme Management for Content Processing and Dissemination 3.4 3.0 2.8 3.6 2.3% 2.4% 3.8 4.1 4.4 6.4% 2.6%Policy and Research 29.8 29.6 31.5 35.0 5.5% 23.2% 36.3 38.3 41.1 5.4% 25.0%Products and Platforms 49.0 42.4 44.4 50.7 1.1% 34.4% 50.5 52.5 56.6 3.7% 34.8%Communication Service Agency 55.1 51.9 56.1 54.2 -0.6% 40.0% 54.4 57.6 60.9 4.0% 37.6%Total 137.3 126.9 134.8 143.6 1.5% 100.0% 145.0 152.5 162.9 4.3% 100.0%Change to 2017 Budget estimate
3.2 (4.3) (7.3) (7.5)
Economic classification Current payments 134.9 126.0 134.0 143.1 2.0% 99.1% 143.6 151.6 162.0 4.2% 99.4%Compensation of employees 62.4 70.4 77.6 79.3 8.3% 53.4% 86.8 93.5 100.8 8.3% 59.7%Goods and services1 72.4 55.6 56.4 63.8 -4.2% 45.7% 56.8 58.0 61.2 -1.4% 39.7%of which: Advertising 5.5 3.8 1.8 3.8 -11.9% 2.8% 2.2 2.1 2.0 -19.4% 1.7%Communication 5.7 3.5 2.7 2.4 -25.0% 2.6% 2.7 2.7 2.7 4.3% 1.7%Computer services 6.9 3.1 3.5 2.9 -25.0% 3.0% 3.8 4.0 4.3 13.8% 2.5%Agency and support/outsourced services
6.3 3.4 4.7 6.5 1.4% 3.8% 5.8 6.3 6.6 0.6% 4.2%
Travel and subsistence 8.9 9.5 7.7 8.2 -2.6% 6.3% 7.9 8.1 8.4 0.9% 5.4%Operating payments 31.1 26.7 33.1 34.9 3.9% 23.2% 31.2 32.3 33.9 -0.9% 21.9%Transfers and subsidies1 0.1 0.6 0.1 0.1 1.1% 0.2% – – – -100.0% – Households 0.1 0.6 0.1 0.1 1.1% 0.2% – – – -100.0% – Payments for capital assets 2.4 0.2 0.5 0.4 -44.4% 0.7% 1.4 0.9 0.9 31.7% 0.6%Machinery and equipment 2.4 0.2 0.5 0.4 -44.4% 0.6% 1.4 0.9 0.9 31.6% 0.6%Software and other intangible assets
– – 0.1 (0.0) – – – – – -100.0% –
Payments for financial assets 0.0 0.0 0.3 – -100.0% 0.1% – – – – – Total 137.3 126.9 134.8 143.6 1.5% 100.0% 145.0 152.5 162.9 4.3% 100.0%Proportion of total programme expenditure to vote expenditure
37.6% 34.7% 35.5% 35.8% – – 34.5% 34.5% 34.6% – –
1. Estimates of National Expenditure data tables are available and can be downloaded from www.treasury.gov.za. These data tables contain detailed information by goods and services, and transfers and subsidies item by programme.
Programme 3: Intergovernmental Coordination and Stakeholder Management Programme purpose Implement development communication through mediated and unmediated communication channels, and foster sound stakeholder relations and partnerships.

2018 Estimates of National Expenditure
30
Objectives • Improve interdepartmental coordination to ensure that all government messages are coherent and aligned
by jointly planning and sharing communications messages across the three spheres of government over the medium term.
• Ensure an informed and empowered citizenry on government’s policies, plans, programmes and achievements; and increase public participation in government’s activities through engaging with stakeholders over the medium term.
• Implement a proactive and reactive media engagement system by building, maintaining and improving relations with the media, and driving government’s communications agenda over the medium term.
Subprogrammes • Programme Management for Intergovernmental Coordination and Stakeholder Management ensures a well
functioning communication system that proactively informs and engages the public, and manages and oversees roles regarding the implementation of development communication. It does this by building sound stakeholder relations and partnerships, and ensuring that the public is informed about government policies and programmes.
• Provincial and Local Liaison ensures that the national communications strategy framework is aligned with provincial and local communications strategies, procures time on media channels and platforms to promote government messages to the public at the local government level, promotes the Thusong service centres to the public, and coordinates the imbizo programme of government.
• Media Engagement leads and drives interaction and communication between government and the media; ensures effective liaison between ministers and the media; manages ongoing media liaison services to government by providing government information; establishes, strengthens and maintains relationships with foreign and independent media; and establishes relations with South African missions with the view of disseminating government information and key targeted messages.
• Cluster Supervision (Human Development, Social Protection and Governance and Administration) provides strategic cluster communications advice and support to national departments and leadership on key cluster communications issues and campaigns; and coordinates Cabinet cluster communications and the development of the government communications programme. This subprogramme also develops communications strategies and key messages for the campaigns of the departments in these clusters.
• Cluster Supervision (Economic and Infrastructure, Justice and International) provides strategic cluster communications advice and support to national departments and leadership on key cluster communications issues and campaigns; and coordinates Cabinet cluster communications and the development of the government communications programme. This subprogramme also develops communications strategies and key messages for the campaigns of the departments in these clusters.
Expenditure trends and estimates Table 3.23 Intergovernmental Coordination and Stakeholder Management expenditure trends and estimates by subprogramme and economic classification Subprogramme
Audited outcome Adjusted
appropriation
Averagegrowth
rate(%)
Average: Expen-diture/
Total(%)
Medium-term expenditure estimate
Averagegrowth
rate(%)
Average:Expen-diture/
Total(%)
R million 2014/15 2015/16 2016/17 2017/18 2014/15 - 2017/18 2018/19 2019/20 2020/21 2017/18 - 2020/21 Programme Management for Intergovernmental Coordination and Stakeholder Management 2.7 2.9 2.0 2.1 -7.2% 2.4% 3.0 3.2 3.5 17.9% 2.5%Provincial and Local Liaison 70.0 68.0 70.1 76.3 2.9% 72.5% 78.6 81.8 87.8 4.8% 70.3%Media Engagement 12.8 13.2 12.2 12.4 -1.2% 12.9% 13.3 14.6 15.8 8.4% 12.2%Cluster Supervision (Human Development, Social Protection and Governance and Administration)
4.6 5.5 6.6 8.7 23.9% 6.5% 8.7 9.3 10.0 4.9% 7.9%
Cluster Supervision (Economic and Infrastructure, Justice and International)
3.8 3.9 7.1 7.7 26.6% 5.7% 7.8 8.4 9.0 5.3% 7.1%
Total 93.9 93.5 97.9 107.2 4.5% 100.0% 111.3 117.3 126.1 5.6% 100.0%Change to 2017 Budget estimate
(2.9) (7.2) (10.2) (10.6)
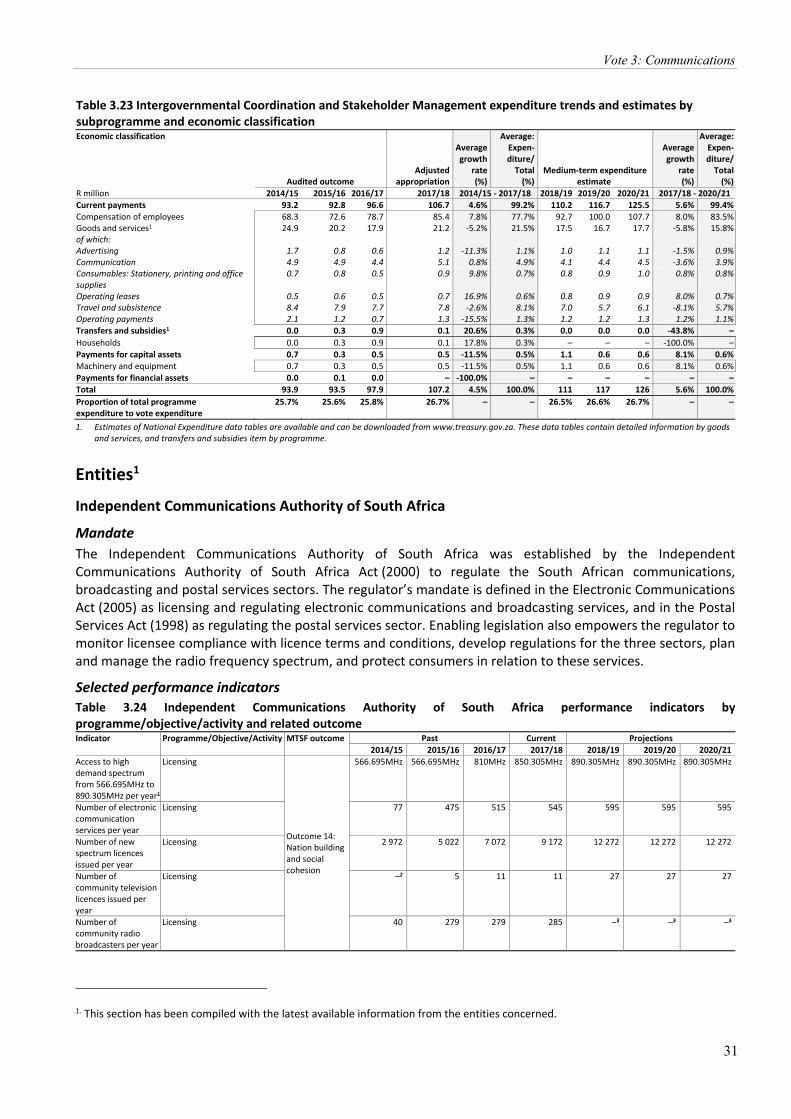
Vote 3: Communications
31
Table 3.23 Intergovernmental Coordination and Stakeholder Management expenditure trends and estimates by subprogramme and economic classification Economic classification
Audited outcome Adjusted
appropriation
Averagegrowth
rate(%)
Average: Expen-diture/
Total(%)
Medium-term expenditure estimate
Averagegrowth
rate(%)
Average:Expen-diture/
Total(%)
R million 2014/15 2015/16 2016/17 2017/18 2014/15 - 2017/18 2018/19 2019/20 2020/21 2017/18 - 2020/21 Current payments 93.2 92.8 96.6 106.7 4.6% 99.2% 110.2 116.7 125.5 5.6% 99.4%Compensation of employees 68.3 72.6 78.7 85.4 7.8% 77.7% 92.7 100.0 107.7 8.0% 83.5%Goods and services1 24.9 20.2 17.9 21.2 -5.2% 21.5% 17.5 16.7 17.7 -5.8% 15.8%of which: Advertising 1.7 0.8 0.6 1.2 -11.3% 1.1% 1.0 1.1 1.1 -1.5% 0.9%Communication 4.9 4.9 4.4 5.1 0.8% 4.9% 4.1 4.4 4.5 -3.6% 3.9%Consumables: Stationery, printing and office supplies
0.7 0.8 0.5 0.9 9.8% 0.7% 0.8 0.9 1.0 0.8% 0.8%
Operating leases 0.5 0.6 0.5 0.7 16.9% 0.6% 0.8 0.9 0.9 8.0% 0.7%Travel and subsistence 8.4 7.9 7.7 7.8 -2.6% 8.1% 7.0 5.7 6.1 -8.1% 5.7%Operating payments 2.1 1.2 0.7 1.3 -15.5% 1.3% 1.2 1.2 1.3 1.2% 1.1%Transfers and subsidies1 0.0 0.3 0.9 0.1 20.6% 0.3% 0.0 0.0 0.0 -43.8% –Households 0.0 0.3 0.9 0.1 17.8% 0.3% – – – -100.0% –Payments for capital assets 0.7 0.3 0.5 0.5 -11.5% 0.5% 1.1 0.6 0.6 8.1% 0.6%Machinery and equipment 0.7 0.3 0.5 0.5 -11.5% 0.5% 1.1 0.6 0.6 8.1% 0.6%Payments for financial assets 0.0 0.1 0.0 – -100.0% – – – – – –Total 93.9 93.5 97.9 107.2 4.5% 100.0% 111 117 126 5.6% 100.0%Proportion of total programme expenditure to vote expenditure
25.7% 25.6% 25.8% 26.7% – – 26.5% 26.6% 26.7% – –
1. Estimates of National Expenditure data tables are available and can be downloaded from www.treasury.gov.za. These data tables contain detailed information by goods and services, and transfers and subsidies item by programme.
Entities1 Independent Communications Authority of South Africa
Mandate The Independent Communications Authority of South Africa was established by the Independent Communications Authority of South Africa Act (2000) to regulate the South African communications, broadcasting and postal services sectors. The regulator’s mandate is defined in the Electronic Communications Act (2005) as licensing and regulating electronic communications and broadcasting services, and in the Postal Services Act (1998) as regulating the postal services sector. Enabling legislation also empowers the regulator to monitor licensee compliance with licence terms and conditions, develop regulations for the three sectors, plan and manage the radio frequency spectrum, and protect consumers in relation to these services.
Selected performance indicators Table 3.24 Independent Communications Authority of South Africa performance indicators by programme/objective/activity and related outcome Indicator Programme/Objective/Activity MTSF outcome Past Current Projections 2014/15 2015/16 2016/17 2017/18 2018/19 2019/20 2020/21Access to high demand spectrum from 566.695MHz to 890.305MHz per year1
Licensing
Outcome 14: Nation building and social cohesion
566.695MHz 566.695MHz 810MHz 850.305MHz 890.305MHz 890.305MHz 890.305MHz
Number of electronic communication services per year
Licensing 77 475 515 545 595 595 595
Number of new spectrum licences issued per year
Licensing 2 972 5 022 7 072 9 172 12 272 12 272 12 272
Number of community television licences issued per year
Licensing –2 5 11 11 27 27 27
Number of community radio broadcasters per year
Licensing 40 279 279 285 –3 –3 –3
1. This section has been compiled with the latest available information from the entities concerned.
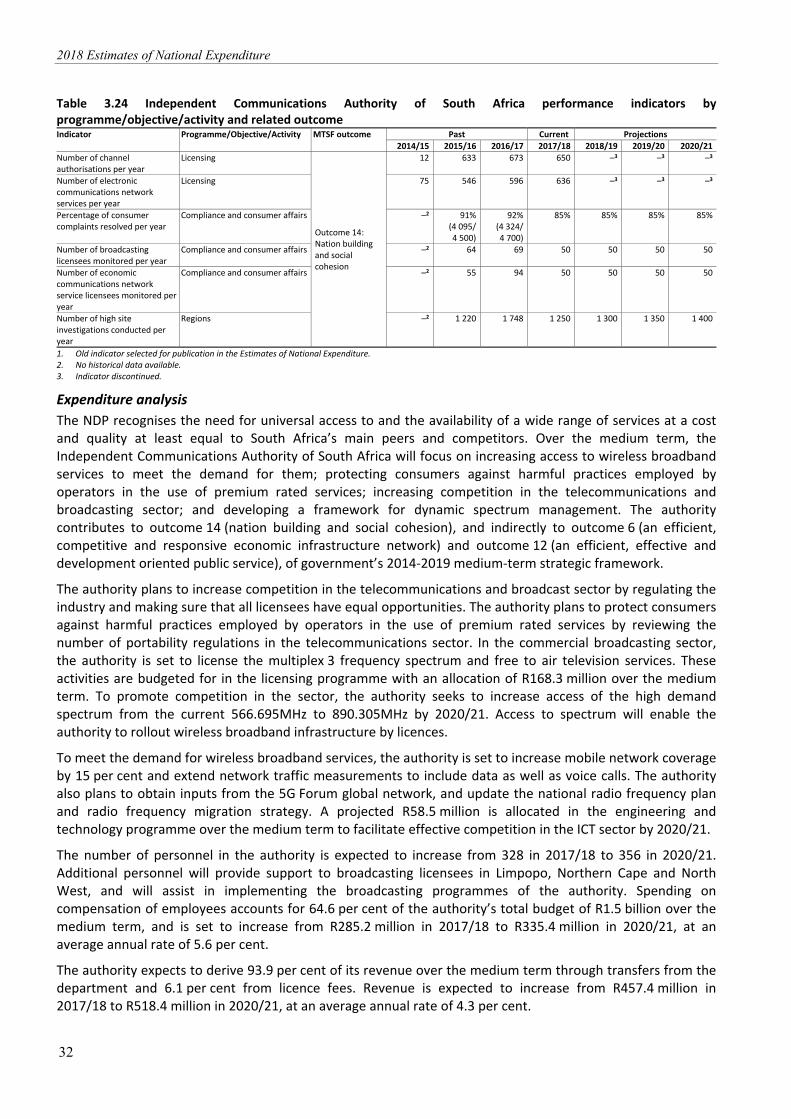
2018 Estimates of National Expenditure
32
Table 3.24 Independent Communications Authority of South Africa performance indicators by programme/objective/activity and related outcome Indicator Programme/Objective/Activity MTSF outcome Past Current Projections 2014/15 2015/16 2016/17 2017/18 2018/19 2019/20 2020/21Number of channel authorisations per year
Licensing
Outcome 14: Nation building and social cohesion
12 633 673 650 –3 –3 –3
Number of electronic communications network services per year
Licensing 75 546 596 636 –3 –3 –3
Percentage of consumer complaints resolved per year
Compliance and consumer affairs –2 91% (4 095/4 500)
92%(4 324/4 700)
85% 85% 85% 85%
Number of broadcasting licensees monitored per year
Compliance and consumer affairs –2 64 69 50 50 50 50
Number of economic communications network service licensees monitored per year
Compliance and consumer affairs –2 55 94 50 50 50 50
Number of high site investigations conducted per year
Regions –2 1 220 1 748 1 250 1 300 1 350 1 400
1. Old indicator selected for publication in the Estimates of National Expenditure. 2. No historical data available. 3. Indicator discontinued.
Expenditure analysis The NDP recognises the need for universal access to and the availability of a wide range of services at a cost and quality at least equal to South Africa’s main peers and competitors. Over the medium term, the Independent Communications Authority of South Africa will focus on increasing access to wireless broadband services to meet the demand for them; protecting consumers against harmful practices employed by operators in the use of premium rated services; increasing competition in the telecommunications and broadcasting sector; and developing a framework for dynamic spectrum management. The authority contributes to outcome 14 (nation building and social cohesion), and indirectly to outcome 6 (an efficient, competitive and responsive economic infrastructure network) and outcome 12 (an efficient, effective and development oriented public service), of government’s 2014-2019 medium-term strategic framework.
The authority plans to increase competition in the telecommunications and broadcast sector by regulating the industry and making sure that all licensees have equal opportunities. The authority plans to protect consumers against harmful practices employed by operators in the use of premium rated services by reviewing the number of portability regulations in the telecommunications sector. In the commercial broadcasting sector, the authority is set to license the multiplex 3 frequency spectrum and free to air television services. These activities are budgeted for in the licensing programme with an allocation of R168.3 million over the medium term. To promote competition in the sector, the authority seeks to increase access of the high demand spectrum from the current 566.695MHz to 890.305MHz by 2020/21. Access to spectrum will enable the authority to rollout wireless broadband infrastructure by licences.
To meet the demand for wireless broadband services, the authority is set to increase mobile network coverage by 15 per cent and extend network traffic measurements to include data as well as voice calls. The authority also plans to obtain inputs from the 5G Forum global network, and update the national radio frequency plan and radio frequency migration strategy. A projected R58.5 million is allocated in the engineering and technology programme over the medium term to facilitate effective competition in the ICT sector by 2020/21.
The number of personnel in the authority is expected to increase from 328 in 2017/18 to 356 in 2020/21. Additional personnel will provide support to broadcasting licensees in Limpopo, Northern Cape and North West, and will assist in implementing the broadcasting programmes of the authority. Spending on compensation of employees accounts for 64.6 per cent of the authority’s total budget of R1.5 billion over the medium term, and is set to increase from R285.2 million in 2017/18 to R335.4 million in 2020/21, at an average annual rate of 5.6 per cent.
The authority expects to derive 93.9 per cent of its revenue over the medium term through transfers from the department and 6.1 per cent from licence fees. Revenue is expected to increase from R457.4 million in 2017/18 to R518.4 million in 2020/21, at an average annual rate of 4.3 per cent.
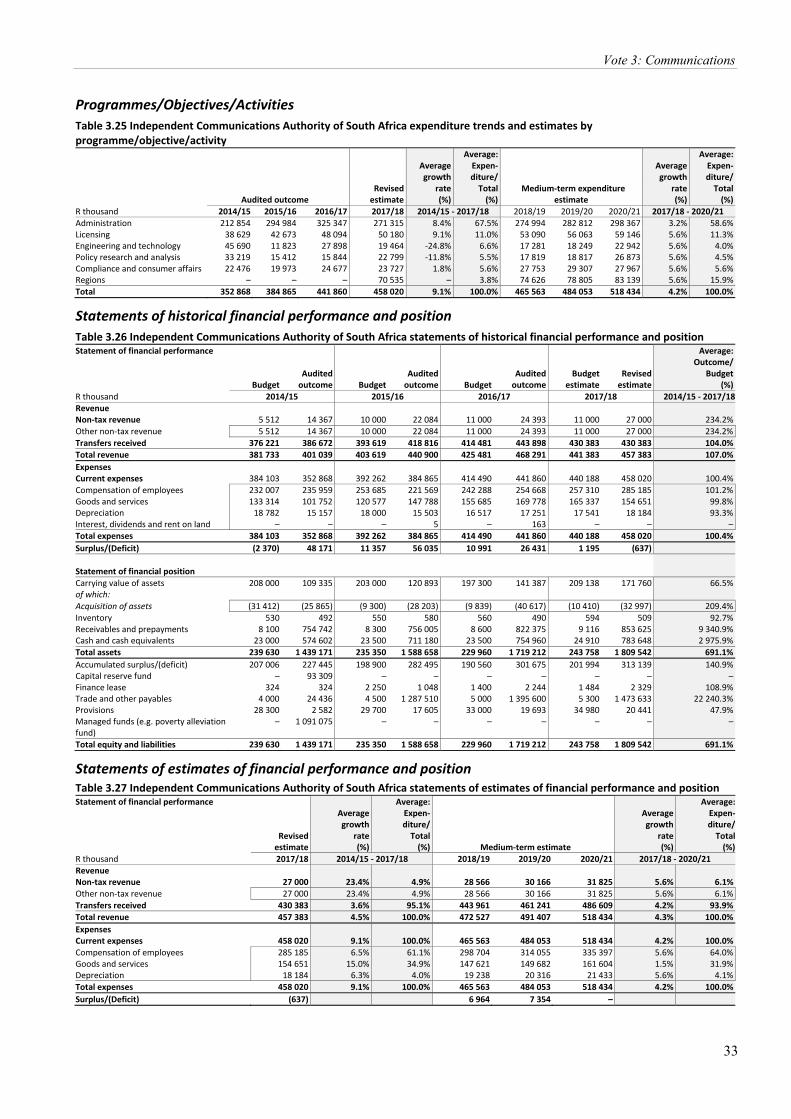
Vote 3: Communications
33
Programmes/Objectives/Activities Table 3.25 Independent Communications Authority of South Africa expenditure trends and estimates by programme/objective/activity
Audited outcome Revisedestimate
Averagegrowth
rate(%)
Average:Expen-diture/
Total(%)
Medium-term expenditure estimate
Averagegrowth
rate(%)
Average:Expen-diture/
Total(%)
R thousand 2014/15 2015/16 2016/17 2017/18 2014/15 - 2017/18 2018/19 2019/20 2020/21 2017/18 - 2020/21 Administration 212 854 294 984 325 347 271 315 8.4% 67.5% 274 994 282 812 298 367 3.2% 58.6%Licensing 38 629 42 673 48 094 50 180 9.1% 11.0% 53 090 56 063 59 146 5.6% 11.3%Engineering and technology 45 690 11 823 27 898 19 464 -24.8% 6.6% 17 281 18 249 22 942 5.6% 4.0%Policy research and analysis 33 219 15 412 15 844 22 799 -11.8% 5.5% 17 819 18 817 26 873 5.6% 4.5%Compliance and consumer affairs 22 476 19 973 24 677 23 727 1.8% 5.6% 27 753 29 307 27 967 5.6% 5.6%Regions – – – 70 535 – 3.8% 74 626 78 805 83 139 5.6% 15.9%Total 352 868 384 865 441 860 458 020 9.1% 100.0% 465 563 484 053 518 434 4.2% 100.0%
Statements of historical financial performance and position Table 3.26 Independent Communications Authority of South Africa statements of historical financial performance and position Statement of financial performance
Budget Audited outcome Budget
Audited outcome Budget
Audited outcome
Budget estimate
Revised estimate
Average:Outcome/
Budget (%)
R thousand 2014/15 2015/16 2016/17 2017/18 2014/15 - 2017/18 Revenue Non-tax revenue 5 512 14 367 10 000 22 084 11 000 24 393 11 000 27 000 234.2%Other non-tax revenue 5 512 14 367 10 000 22 084 11 000 24 393 11 000 27 000 234.2%Transfers received 376 221 386 672 393 619 418 816 414 481 443 898 430 383 430 383 104.0%Total revenue 381 733 401 039 403 619 440 900 425 481 468 291 441 383 457 383 107.0%Expenses Current expenses 384 103 352 868 392 262 384 865 414 490 441 860 440 188 458 020 100.4%Compensation of employees 232 007 235 959 253 685 221 569 242 288 254 668 257 310 285 185 101.2%Goods and services 133 314 101 752 120 577 147 788 155 685 169 778 165 337 154 651 99.8%Depreciation 18 782 15 157 18 000 15 503 16 517 17 251 17 541 18 184 93.3%Interest, dividends and rent on land – – – 5 – 163 – – –Total expenses 384 103 352 868 392 262 384 865 414 490 441 860 440 188 458 020 100.4%Surplus/(Deficit) (2 370) 48 171 11 357 56 035 10 991 26 431 1 195 (637) Statement of financial position Carrying value of assets 208 000 109 335 203 000 120 893 197 300 141 387 209 138 171 760 66.5%of which: Acquisition of assets (31 412) (25 865) (9 300) (28 203) (9 839) (40 617) (10 410) (32 997) 209.4%Inventory 530 492 550 580 560 490 594 509 92.7%Receivables and prepayments 8 100 754 742 8 300 756 005 8 600 822 375 9 116 853 625 9 340.9%Cash and cash equivalents 23 000 574 602 23 500 711 180 23 500 754 960 24 910 783 648 2 975.9%Total assets 239 630 1 439 171 235 350 1 588 658 229 960 1 719 212 243 758 1 809 542 691.1%Accumulated surplus/(deficit) 207 006 227 445 198 900 282 495 190 560 301 675 201 994 313 139 140.9%Capital reserve fund – 93 309 – – – – – – –Finance lease 324 324 2 250 1 048 1 400 2 244 1 484 2 329 108.9%Trade and other payables 4 000 24 436 4 500 1 287 510 5 000 1 395 600 5 300 1 473 633 22 240.3%Provisions 28 300 2 582 29 700 17 605 33 000 19 693 34 980 20 441 47.9%Managed funds (e.g. poverty alleviation fund)
– 1 091 075 – – – – – – –
Total equity and liabilities 239 630 1 439 171 235 350 1 588 658 229 960 1 719 212 243 758 1 809 542 691.1%
Statements of estimates of financial performance and position Table 3.27 Independent Communications Authority of South Africa statements of estimates of financial performance and position Statement of financial performance
Revised estimate
Averagegrowth
rate(%)
Average:Expen-diture/
Total(%) Medium-term estimate
Averagegrowth
rate(%)
Average:Expen-diture/
Total(%)
R thousand 2017/18 2014/15 - 2017/18 2018/19 2019/20 2020/21 2017/18 - 2020/21 Revenue Non-tax revenue 27 000 23.4% 4.9% 28 566 30 166 31 825 5.6% 6.1%Other non-tax revenue 27 000 23.4% 4.9% 28 566 30 166 31 825 5.6% 6.1%Transfers received 430 383 3.6% 95.1% 443 961 461 241 486 609 4.2% 93.9%Total revenue 457 383 4.5% 100.0% 472 527 491 407 518 434 4.3% 100.0%Expenses Current expenses 458 020 9.1% 100.0% 465 563 484 053 518 434 4.2% 100.0%Compensation of employees 285 185 6.5% 61.1% 298 704 314 055 335 397 5.6% 64.0%Goods and services 154 651 15.0% 34.9% 147 621 149 682 161 604 1.5% 31.9%Depreciation 18 184 6.3% 4.0% 19 238 20 316 21 433 5.6% 4.1%Total expenses 458 020 9.1% 100.0% 465 563 484 053 518 434 4.2% 100.0%Surplus/(Deficit) (637) 6 964 7 354 –
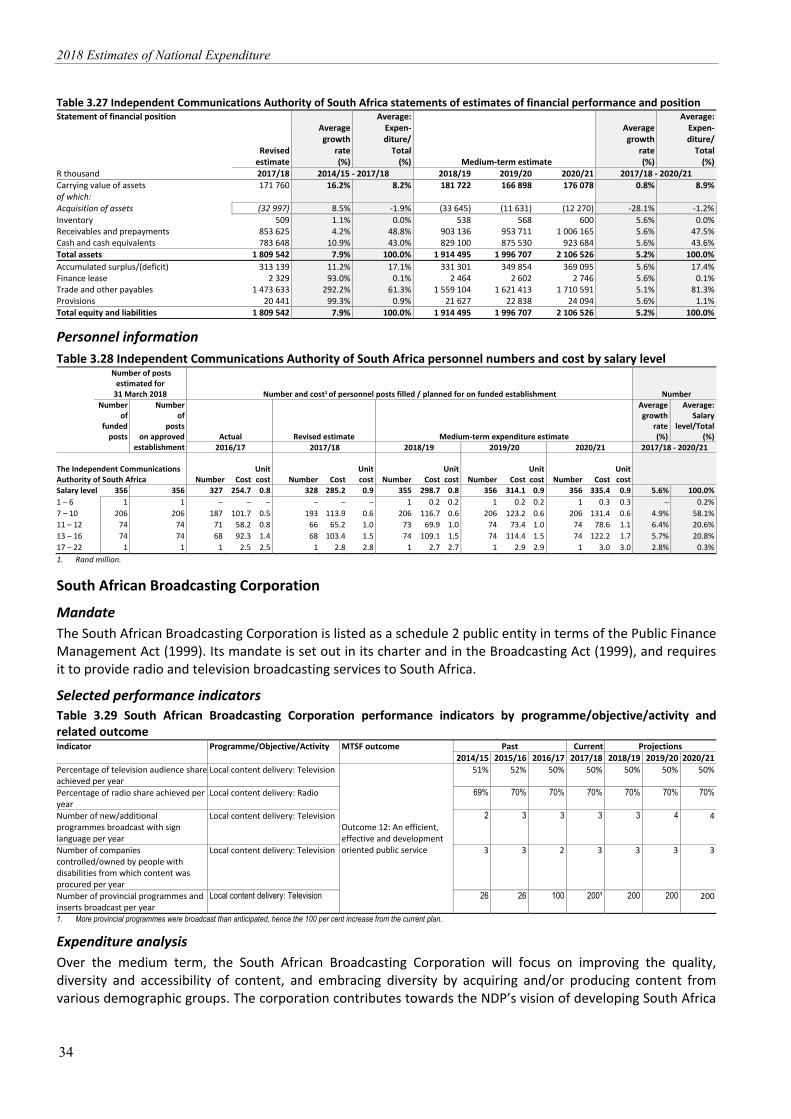
2018 Estimates of National Expenditure
34
Table 3.27 Independent Communications Authority of South Africa statements of estimates of financial performance and position Statement of financial position
Revised estimate
Averagegrowth
rate(%)
Average:Expen-diture/
Total(%) Medium-term estimate
Averagegrowth
rate(%)
Average:Expen-diture/
Total(%)
R thousand 2017/18 2014/15 - 2017/18 2018/19 2019/20 2020/21 2017/18 - 2020/21 Carrying value of assets 171 760 16.2% 8.2% 181 722 166 898 176 078 0.8% 8.9%of which: Acquisition of assets (32 997) 8.5% -1.9% (33 645) (11 631) (12 270) -28.1% -1.2%Inventory 509 1.1% 0.0% 538 568 600 5.6% 0.0%Receivables and prepayments 853 625 4.2% 48.8% 903 136 953 711 1 006 165 5.6% 47.5%Cash and cash equivalents 783 648 10.9% 43.0% 829 100 875 530 923 684 5.6% 43.6%Total assets 1 809 542 7.9% 100.0% 1 914 495 1 996 707 2 106 526 5.2% 100.0%Accumulated surplus/(deficit) 313 139 11.2% 17.1% 331 301 349 854 369 095 5.6% 17.4%Finance lease 2 329 93.0% 0.1% 2 464 2 602 2 746 5.6% 0.1%Trade and other payables 1 473 633 292.2% 61.3% 1 559 104 1 621 413 1 710 591 5.1% 81.3%Provisions 20 441 99.3% 0.9% 21 627 22 838 24 094 5.6% 1.1%Total equity and liabilities 1 809 542 7.9% 100.0% 1 914 495 1 996 707 2 106 526 5.2% 100.0%
Personnel information Table 3.28 Independent Communications Authority of South Africa personnel numbers and cost by salary level
Number of posts estimated for
31 March 2018 Number and cost1 of personnel posts filled / planned for on funded establishment Number Number
of funded
posts
Number of
posts on approved
establishment Actual Revised estimate
Medium-term expenditure estimate
Averagegrowth
rate(%)
Average:Salary
level/Total(%)
2016/17 2017/18 2018/19 2019/20 2020/21 2017/18 - 2020/21
The Independent Communications Authority of South Africa Number Cost
Unit cost Number Cost
Unit cost Number Cost
Unit cost Number Cost
Unit cost Number Cost
Unit cost
Salary level 356 356 327 254.7 0.8 328 285.2 0.9 355 298.7 0.8 356 314.1 0.9 356 335.4 0.9 5.6% 100.0%1 – 6 1 1 – – – – – – 1 0.2 0.2 1 0.2 0.2 1 0.3 0.3 – 0.2%7 – 10 206 206 187 101.7 0.5 193 113.9 0.6 206 116.7 0.6 206 123.2 0.6 206 131.4 0.6 4.9% 58.1%11 – 12 74 74 71 58.2 0.8 66 65.2 1.0 73 69.9 1.0 74 73.4 1.0 74 78.6 1.1 6.4% 20.6%13 – 16 74 74 68 92.3 1.4 68 103.4 1.5 74 109.1 1.5 74 114.4 1.5 74 122.2 1.7 5.7% 20.8%17 – 22 1 1 1 2.5 2.5 1 2.8 2.8 1 2.7 2.7 1 2.9 2.9 1 3.0 3.0 2.8% 0.3%1. Rand million.
South African Broadcasting Corporation Mandate The South African Broadcasting Corporation is listed as a schedule 2 public entity in terms of the Public Finance Management Act (1999). Its mandate is set out in its charter and in the Broadcasting Act (1999), and requires it to provide radio and television broadcasting services to South Africa.
Selected performance indicators Table 3.29 South African Broadcasting Corporation performance indicators by programme/objective/activity andrelated outcome Indicator Programme/Objective/Activity MTSF outcome Past Current Projections 2014/15 2015/16 2016/17 2017/18 2018/19 2019/20 2020/21Percentage of television audience share achieved per year
Local content delivery: Television
Outcome 12: An efficient, effective and development oriented public service
51% 52% 50% 50% 50% 50% 50%
Percentage of radio share achieved per year
Local content delivery: Radio 69% 70% 70% 70% 70% 70% 70%
Number of new/additional programmes broadcast with sign language per year
Local content delivery: Television 2 3 3 3 3 4 4
Number of companies controlled/owned by people with disabilities from which content was procured per year
Local content delivery: Television 3 3 2 3 3 3 3
Number of provincial programmes and inserts broadcast per year
Local content delivery: Television 26 26 100 200¹ 200 200 200
1. More provincial programmes were broadcast than anticipated, hence the 100 per cent increase from the current plan.
Expenditure analysis Over the medium term, the South African Broadcasting Corporation will focus on improving the quality, diversity and accessibility of content, and embracing diversity by acquiring and/or producing content from various demographic groups. The corporation contributes towards the NDP’s vision of developing South Africa
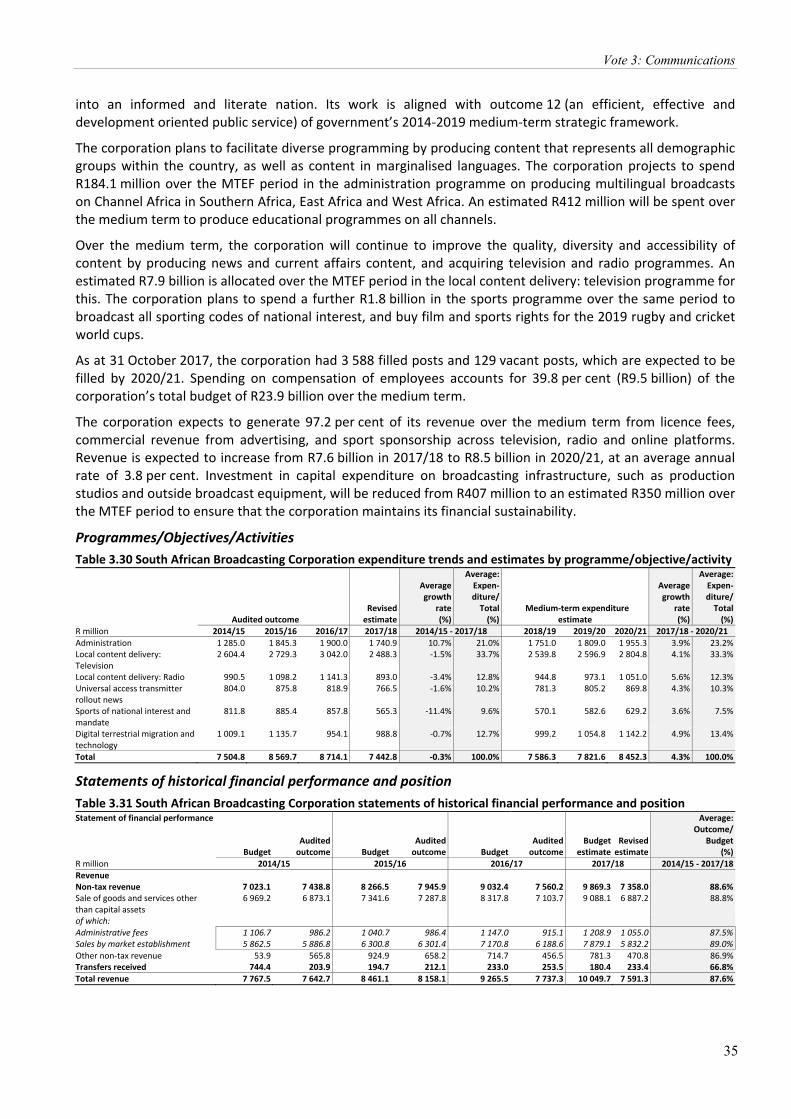
Vote 3: Communications
35
into an informed and literate nation. Its work is aligned with outcome 12 (an efficient, effective and development oriented public service) of government’s 2014-2019 medium-term strategic framework.
The corporation plans to facilitate diverse programming by producing content that represents all demographic groups within the country, as well as content in marginalised languages. The corporation projects to spend R184.1 million over the MTEF period in the administration programme on producing multilingual broadcasts on Channel Africa in Southern Africa, East Africa and West Africa. An estimated R412 million will be spent over the medium term to produce educational programmes on all channels.
Over the medium term, the corporation will continue to improve the quality, diversity and accessibility of content by producing news and current affairs content, and acquiring television and radio programmes. An estimated R7.9 billion is allocated over the MTEF period in the local content delivery: television programme for this. The corporation plans to spend a further R1.8 billion in the sports programme over the same period to broadcast all sporting codes of national interest, and buy film and sports rights for the 2019 rugby and cricket world cups.
As at 31 October 2017, the corporation had 3 588 filled posts and 129 vacant posts, which are expected to be filled by 2020/21. Spending on compensation of employees accounts for 39.8 per cent (R9.5 billion) of the corporation’s total budget of R23.9 billion over the medium term.
The corporation expects to generate 97.2 per cent of its revenue over the medium term from licence fees, commercial revenue from advertising, and sport sponsorship across television, radio and online platforms. Revenue is expected to increase from R7.6 billion in 2017/18 to R8.5 billion in 2020/21, at an average annual rate of 3.8 per cent. Investment in capital expenditure on broadcasting infrastructure, such as production studios and outside broadcast equipment, will be reduced from R407 million to an estimated R350 million over the MTEF period to ensure that the corporation maintains its financial sustainability.
Programmes/Objectives/Activities Table 3.30 South African Broadcasting Corporation expenditure trends and estimates by programme/objective/activity
Audited outcome Revisedestimate
Averagegrowth
rate(%)
Average:Expen-diture/
Total(%)
Medium-term expenditure estimate
Averagegrowth
rate(%)
Average:Expen-diture/
Total(%)
R million 2014/15 2015/16 2016/17 2017/18 2014/15 - 2017/18 2018/19 2019/20 2020/21 2017/18 - 2020/21 Administration 1 285.0 1 845.3 1 900.0 1 740.9 10.7% 21.0% 1 751.0 1 809.0 1 955.3 3.9% 23.2%Local content delivery: Television
2 604.4 2 729.3 3 042.0 2 488.3 -1.5% 33.7% 2 539.8 2 596.9 2 804.8 4.1% 33.3%
Local content delivery: Radio 990.5 1 098.2 1 141.3 893.0 -3.4% 12.8% 944.8 973.1 1 051.0 5.6% 12.3%Universal access transmitter rollout news
804.0 875.8 818.9 766.5 -1.6% 10.2% 781.3 805.2 869.8 4.3% 10.3%
Sports of national interest and mandate
811.8 885.4 857.8 565.3 -11.4% 9.6% 570.1 582.6 629.2 3.6% 7.5%
Digital terrestrial migration and technology
1 009.1 1 135.7 954.1 988.8 -0.7% 12.7% 999.2 1 054.8 1 142.2 4.9% 13.4%
Total 7 504.8 8 569.7 8 714.1 7 442.8 -0.3% 100.0% 7 586.3 7 821.6 8 452.3 4.3% 100.0%
Statements of historical financial performance and position Table 3.31 South African Broadcasting Corporation statements of historical financial performance and position Statement of financial performance
Budget Audited outcome Budget
Audited outcome Budget
Audited outcome
Budget estimate
Revised estimate
Average:Outcome/
Budget (%)
R million 2014/15 2015/16 2016/17 2017/18 2014/15 - 2017/18 Revenue Non-tax revenue 7 023.1 7 438.8 8 266.5 7 945.9 9 032.4 7 560.2 9 869.3 7 358.0 88.6%Sale of goods and services other than capital assets
6 969.2 6 873.1 7 341.6 7 287.8 8 317.8 7 103.7 9 088.1 6 887.2 88.8%
of which: Administrative fees 1 106.7 986.2 1 040.7 986.4 1 147.0 915.1 1 208.9 1 055.0 87.5%Sales by market establishment 5 862.5 5 886.8 6 300.8 6 301.4 7 170.8 6 188.6 7 879.1 5 832.2 89.0%Other non-tax revenue 53.9 565.8 924.9 658.2 714.7 456.5 781.3 470.8 86.9%Transfers received 744.4 203.9 194.7 212.1 233.0 253.5 180.4 233.4 66.8%Total revenue 7 767.5 7 642.7 8 461.1 8 158.1 9 265.5 7 737.3 10 049.7 7 591.3 87.6%
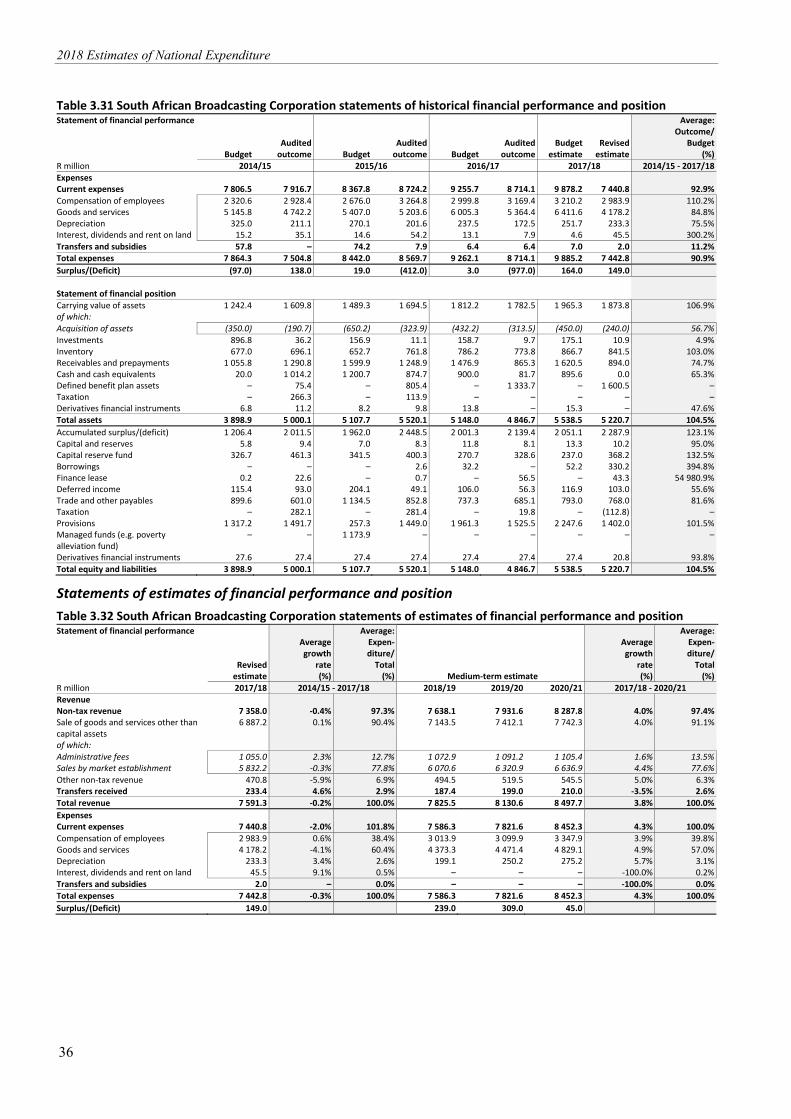
2018 Estimates of National Expenditure
36
Table 3.31 South African Broadcasting Corporation statements of historical financial performance and position Statement of financial performance
Budget Audited outcome Budget
Audited outcome Budget
Audited outcome
Budget estimate
Revised estimate
Average:Outcome/
Budget (%)
R million 2014/15 2015/16 2016/17 2017/18 2014/15 - 2017/18 Expenses Current expenses 7 806.5 7 916.7 8 367.8 8 724.2 9 255.7 8 714.1 9 878.2 7 440.8 92.9%Compensation of employees 2 320.6 2 928.4 2 676.0 3 264.8 2 999.8 3 169.4 3 210.2 2 983.9 110.2%Goods and services 5 145.8 4 742.2 5 407.0 5 203.6 6 005.3 5 364.4 6 411.6 4 178.2 84.8%Depreciation 325.0 211.1 270.1 201.6 237.5 172.5 251.7 233.3 75.5%Interest, dividends and rent on land 15.2 35.1 14.6 54.2 13.1 7.9 4.6 45.5 300.2%Transfers and subsidies 57.8 – 74.2 7.9 6.4 6.4 7.0 2.0 11.2%Total expenses 7 864.3 7 504.8 8 442.0 8 569.7 9 262.1 8 714.1 9 885.2 7 442.8 90.9%Surplus/(Deficit) (97.0) 138.0 19.0 (412.0) 3.0 (977.0) 164.0 149.0 Statement of financial position Carrying value of assets 1 242.4 1 609.8 1 489.3 1 694.5 1 812.2 1 782.5 1 965.3 1 873.8 106.9%of which: Acquisition of assets (350.0) (190.7) (650.2) (323.9) (432.2) (313.5) (450.0) (240.0) 56.7%Investments 896.8 36.2 156.9 11.1 158.7 9.7 175.1 10.9 4.9%Inventory 677.0 696.1 652.7 761.8 786.2 773.8 866.7 841.5 103.0%Receivables and prepayments 1 055.8 1 290.8 1 599.9 1 248.9 1 476.9 865.3 1 620.5 894.0 74.7%Cash and cash equivalents 20.0 1 014.2 1 200.7 874.7 900.0 81.7 895.6 0.0 65.3%Defined benefit plan assets – 75.4 – 805.4 – 1 333.7 – 1 600.5 –Taxation – 266.3 – 113.9 – – – – –Derivatives financial instruments 6.8 11.2 8.2 9.8 13.8 – 15.3 – 47.6%Total assets 3 898.9 5 000.1 5 107.7 5 520.1 5 148.0 4 846.7 5 538.5 5 220.7 104.5%Accumulated surplus/(deficit) 1 206.4 2 011.5 1 962.0 2 448.5 2 001.3 2 139.4 2 051.1 2 287.9 123.1%Capital and reserves 5.8 9.4 7.0 8.3 11.8 8.1 13.3 10.2 95.0%Capital reserve fund 326.7 461.3 341.5 400.3 270.7 328.6 237.0 368.2 132.5%Borrowings – – – 2.6 32.2 – 52.2 330.2 394.8%Finance lease 0.2 22.6 – 0.7 – 56.5 – 43.3 54 980.9%Deferred income 115.4 93.0 204.1 49.1 106.0 56.3 116.9 103.0 55.6%Trade and other payables 899.6 601.0 1 134.5 852.8 737.3 685.1 793.0 768.0 81.6%Taxation – 282.1 – 281.4 – 19.8 – (112.8) –Provisions 1 317.2 1 491.7 257.3 1 449.0 1 961.3 1 525.5 2 247.6 1 402.0 101.5%Managed funds (e.g. poverty alleviation fund)
– – 1 173.9 – – – – – –
Derivatives financial instruments 27.6 27.4 27.4 27.4 27.4 27.4 27.4 20.8 93.8%Total equity and liabilities 3 898.9 5 000.1 5 107.7 5 520.1 5 148.0 4 846.7 5 538.5 5 220.7 104.5%
Statements of estimates of financial performance and position Table 3.32 South African Broadcasting Corporation statements of estimates of financial performance and position Statement of financial performance
Revised estimate
Averagegrowth
rate(%)
Average:Expen-diture/
Total(%) Medium-term estimate
Average growth
rate (%)
Average:Expen-diture/
Total(%)
R million 2017/18 2014/15 - 2017/18 2018/19 2019/20 2020/21 2017/18 - 2020/21 Revenue Non-tax revenue 7 358.0 -0.4% 97.3% 7 638.1 7 931.6 8 287.8 4.0% 97.4%Sale of goods and services other than capital assets
6 887.2 0.1% 90.4% 7 143.5 7 412.1 7 742.3 4.0% 91.1%
of which: Administrative fees 1 055.0 2.3% 12.7% 1 072.9 1 091.2 1 105.4 1.6% 13.5%Sales by market establishment 5 832.2 -0.3% 77.8% 6 070.6 6 320.9 6 636.9 4.4% 77.6%Other non-tax revenue 470.8 -5.9% 6.9% 494.5 519.5 545.5 5.0% 6.3%Transfers received 233.4 4.6% 2.9% 187.4 199.0 210.0 -3.5% 2.6%Total revenue 7 591.3 -0.2% 100.0% 7 825.5 8 130.6 8 497.7 3.8% 100.0%Expenses Current expenses 7 440.8 -2.0% 101.8% 7 586.3 7 821.6 8 452.3 4.3% 100.0%Compensation of employees 2 983.9 0.6% 38.4% 3 013.9 3 099.9 3 347.9 3.9% 39.8%Goods and services 4 178.2 -4.1% 60.4% 4 373.3 4 471.4 4 829.1 4.9% 57.0%Depreciation 233.3 3.4% 2.6% 199.1 250.2 275.2 5.7% 3.1%Interest, dividends and rent on land 45.5 9.1% 0.5% – – – -100.0% 0.2%Transfers and subsidies 2.0 – 0.0% – – – -100.0% 0.0%Total expenses 7 442.8 -0.3% 100.0% 7 586.3 7 821.6 8 452.3 4.3% 100.0%Surplus/(Deficit) 149.0 239.0 309.0 45.0
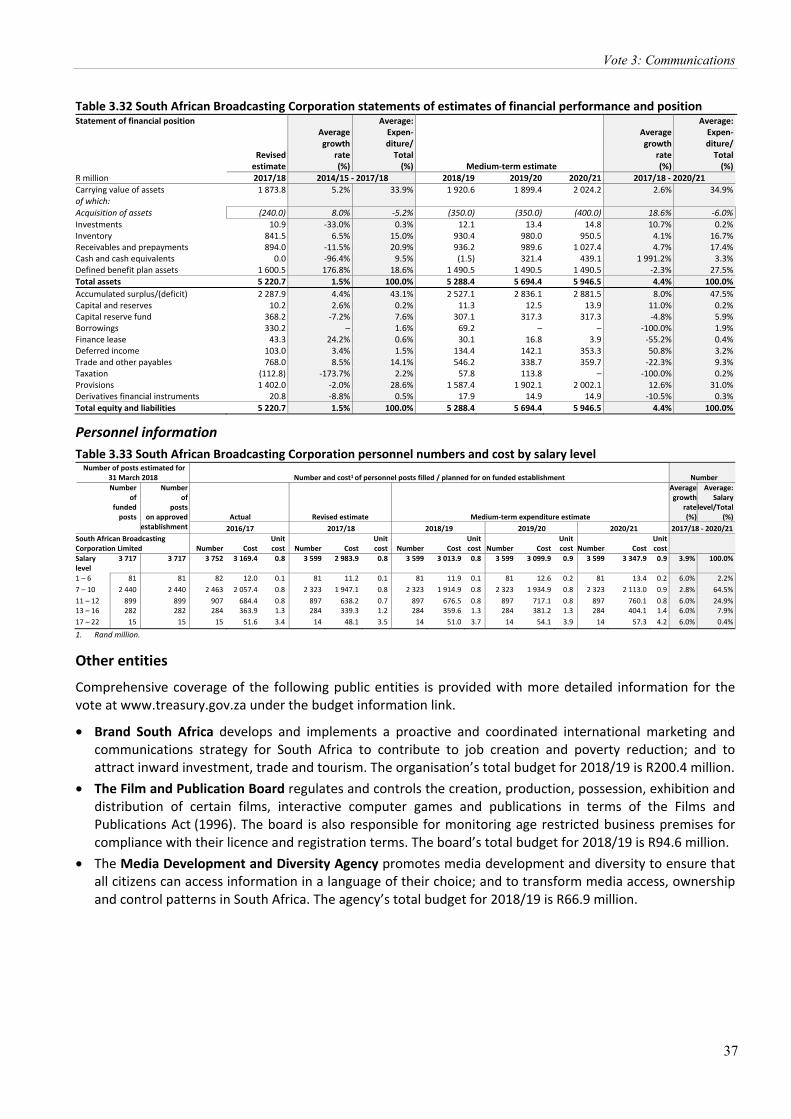
Vote 3: Communications
37
Table 3.32 South African Broadcasting Corporation statements of estimates of financial performance and position Statement of financial position
Revised estimate
Averagegrowth
rate(%)
Average:Expen-diture/
Total(%) Medium-term estimate
Averagegrowth
rate(%)
Average:Expen-diture/
Total(%)
R million 2017/18 2014/15 - 2017/18 2018/19 2019/20 2020/21 2017/18 - 2020/21 Carrying value of assets 1 873.8 5.2% 33.9% 1 920.6 1 899.4 2 024.2 2.6% 34.9%of which: Acquisition of assets (240.0) 8.0% -5.2% (350.0) (350.0) (400.0) 18.6% -6.0%Investments 10.9 -33.0% 0.3% 12.1 13.4 14.8 10.7% 0.2%Inventory 841.5 6.5% 15.0% 930.4 980.0 950.5 4.1% 16.7%Receivables and prepayments 894.0 -11.5% 20.9% 936.2 989.6 1 027.4 4.7% 17.4%Cash and cash equivalents 0.0 -96.4% 9.5% (1.5) 321.4 439.1 1 991.2% 3.3%Defined benefit plan assets 1 600.5 176.8% 18.6% 1 490.5 1 490.5 1 490.5 -2.3% 27.5%Total assets 5 220.7 1.5% 100.0% 5 288.4 5 694.4 5 946.5 4.4% 100.0%Accumulated surplus/(deficit) 2 287.9 4.4% 43.1% 2 527.1 2 836.1 2 881.5 8.0% 47.5%Capital and reserves 10.2 2.6% 0.2% 11.3 12.5 13.9 11.0% 0.2%Capital reserve fund 368.2 -7.2% 7.6% 307.1 317.3 317.3 -4.8% 5.9%Borrowings 330.2 – 1.6% 69.2 – – -100.0% 1.9%Finance lease 43.3 24.2% 0.6% 30.1 16.8 3.9 -55.2% 0.4%Deferred income 103.0 3.4% 1.5% 134.4 142.1 353.3 50.8% 3.2%Trade and other payables 768.0 8.5% 14.1% 546.2 338.7 359.7 -22.3% 9.3%Taxation (112.8) -173.7% 2.2% 57.8 113.8 – -100.0% 0.2%Provisions 1 402.0 -2.0% 28.6% 1 587.4 1 902.1 2 002.1 12.6% 31.0%Derivatives financial instruments 20.8 -8.8% 0.5% 17.9 14.9 14.9 -10.5% 0.3%Total equity and liabilities 5 220.7 1.5% 100.0% 5 288.4 5 694.4 5 946.5 4.4% 100.0%
Personnel information Table 3.33 South African Broadcasting Corporation personnel numbers and cost by salary level
Number of posts estimated for 31 March 2018 Number and cost1 of personnel posts filled / planned for on funded establishment Number
Number of
funded posts
Number of
posts on approved
establishment Actual Revised estimate Medium-term expenditure estimate
Averagegrowth
rate(%)
Average:Salary
level/Total(%)
2016/17 2017/18 2018/19 2019/20 2020/21 2017/18 - 2020/21South African Broadcasting Corporation Limited Number Cost
Unit cost Number Cost
Unit cost Number Cost
Unit cost Number Cost
Unit cost
Number Cost
Unit cost
Salary level
3 717 3 717 3 752 3 169.4 0.8 3 599 2 983.9 0.8 3 599 3 013.9 0.8 3 599 3 099.9 0.9 3 599 3 347.9 0.9 3.9% 100.0%
1 – 6 81 81 82 12.0 0.1 81 11.2 0.1 81 11.9 0.1 81 12.6 0.2 81 13.4 0.2 6.0% 2.2%7 – 10 2 440 2 440 2 463 2 057.4 0.8 2 323 1 947.1 0.8 2 323 1 914.9 0.8 2 323 1 934.9 0.8 2 323 2 113.0 0.9 2.8% 64.5%11 – 12 899 899 907 684.4 0.8 897 638.2 0.7 897 676.5 0.8 897 717.1 0.8 897 760.1 0.8 6.0% 24.9%13 – 16 282 282 284 363.9 1.3 284 339.3 1.2 284 359.6 1.3 284 381.2 1.3 284 404.1 1.4 6.0% 7.9%17 – 22 15 15 15 51.6 3.4 14 48.1 3.5 14 51.0 3.7 14 54.1 3.9 14 57.3 4.2 6.0% 0.4%1. Rand million.
Other entities Comprehensive coverage of the following public entities is provided with more detailed information for the vote at www.treasury.gov.za under the budget information link.
• Brand South Africa develops and implements a proactive and coordinated international marketing and communications strategy for South Africa to contribute to job creation and poverty reduction; and to attract inward investment, trade and tourism. The organisation’s total budget for 2018/19 is R200.4 million.
• The Film and Publication Board regulates and controls the creation, production, possession, exhibition and distribution of certain films, interactive computer games and publications in terms of the Films and Publications Act (1996). The board is also responsible for monitoring age restricted business premises for compliance with their licence and registration terms. The board’s total budget for 2018/19 is R94.6 million.
• The Media Development and Diversity Agency promotes media development and diversity to ensure that all citizens can access information in a language of their choice; and to transform media access, ownership and control patterns in South Africa. The agency’s total budget for 2018/19 is R66.9 million.
2018 Estimates of National Expenditure
38