Embed Size (px)
Citation preview
Vote 10
Department of Police, Roads and Transport To be appropriated by Vote in 2019/20 R 2 888 688 000
Responsible MEC MEC of Police, Roads and transport
Administrating Department Department of Police, Roads and Transport
Accounting Officer Head of Department: Police, Roads and Transport
1. Overview
1.1 Vision
Contribute towards the creation of a prosperous Free State through the facilitation of the
provision of sustainable community safety, mobility and road infrastructure.
1.2 Mission
To realise the aforesaid vision, we will:
Monitor ,oversee and assess police service delivery in the Free State
Promote integrated crime prevention initiatives
Ensure road safety and an integrated transport system and networks
1.3 Core function and responsibilities
Monitor police conduct and the implementation of visible policing
Oversee the effectiveness and efficiency of SAPS including receipt of reports on it;
Initiate, assist and co-ordinate social crime prevention activities and mobilisation of
resources;
Ensure that community policing structures mobilise communities to support and
participate in crime prevention activities;
Enhance the deterrent effect of the criminal justice system by facilitating efficiency of
the system;
Public education and awareness programmes about crime and its prevention;
Transport and traffic management.
Revenue collection including vehicle licenses
Maintenance and construction of the provincial road network
Security management for departmental buildings
1.4 Acts, rules and regulations
The following legislation and directives are key to the functioning of the department:
The National Road Traffic Act, 1996 (Act No. 93 of 1996)
Control of Access to Public Premises and Vehicles Act, 1985 (Act No. 53 of 1985)
Advertising on Roads and the Ribbons Development Act 1940 (Act No. 1 of 1940)
The National Land Transport Act, 2009 (Act No. 4 of 2009)
The Roads Ordinance,1968 (Ordinance No. 4 of 1968)
Free State Transport Act, 2005 (Act No. 4 of 2005)
The South African Police Services Act (68 of 1995 as Amended)
The Civilian Secretariat for Police Services Act (Act 2 of 2011)
The National Crime Prevention Strategy of 1996
1.5 Aligning departmental budgets to achieve government’s prescribed outcomes
Evaluate efficiency and effectiveness of the SAPS
To monitor police conduct in ensuring the accountability and transparency of the
SAPS in its service delivery to the community Create platform for dialogue with all
relevant role-players, stakeholders and communities around safety and security
issues
Facilitate and support initiatives aimed at reducing contact and priority crimes in the
Province and lead crime prevention programmes in line with the national crime
prevention strategy
Conduct public education and awareness campaigns on safety and related matters
to empower communities against crime
Improve Rural Mobility and promotion of non-motorized transport
Establishment of a Tracing Unit to enhance the collection of outstanding revenue
Strengthening of road safety campaign
Improve customer service delivery at testing stations, testing centres and
registering authorities
Reduction of overloading
Massification of Expanded Public Works Programme
Implementation of contractor development strategy - focus on CIDB grading
Facilitate the implementation and maintenance of road infrastructure information
systems
2. Review of the current financial year (2018/19)
Provincial Secretariat for Police Service
Monitoring and Evaluation:
A target of 110 was set for monitoring of police stations, 28 visits has been achieved for
the first quarter of 2018/19.
Social Crime Prevention
Through the CSP programme members from the community are recruited on a semi-
formal basis, trained, screened and deployed to specific crime hotspot areas identified by
the SAPS through crime information and threat analysis and in line with the peak periods
when such crime is normally taking place.
Target of 18 on social crime prevention, School safety and campaign (Youths, Women,
16 days and Safety month) was set for 2017/18 financial year, 6 of the set target was
achieved for the first quarter.
Roads
In the Free State, the Department of Police, Roads and Transport is still responsible for
the rehabilitation and maintenance of 6 647 km surfaced roads and the continuous
demand driven re-gravelling and blading of 22 213 km of gravel roads.
Deneysville-Heilbron and Schonkenville-Koppies are among the upgrade projects that will
be continuing in the 2019/20 financial year.
The Department successfully completed the following projects in the 2018/19 financial
year:
Trompsburg Transport Centre
Hoopstad – Bultfontein
Senekal – Marquard
Bethlem – Reitz (Phase 2)
Dewetsdorp – Wepener (Phase 1)
Bothaville - Kroonstad
The Several reseal projects were terminated at the end of 2018 and will recommence in
the New Year, ensuring connectivity and mobility between the towns of the Province.
These projects include the following:
Sasolburg – Heilbron
Kroonstad Steynsrus
Wesselsbron – Hoopstad
Bultfontein – Welkom
Bothaville – Viljoenskroon
Bultfontein – Wesselsbron
Jim Fouche – Deneysville
Ladybrand Transport Centre
The following projects will still continue to be implemented within the EPWP guidelines:
Thaba-Nchu Transport Route
Qwaqwa Transport Route
Cornelia Access Road
Contractor Development Program
Grass Cutting Program
Road Safety Improvement Program
Transport
Maluti Bus Services
The transformed Maluti Services shareholding structure is currently as follows:
Taxi Industry 60 percent
Employees 10 percent
Ripple Effect 30 percent
The Department is in the process of facilitating the buyout of the 30 percent shareholder.
Itumele Bus Lines T/A Interstate Bus Lines (IBL)
The IBL transformation is in the process of being finalised, towards that end the
Department in consultation with relevant stakeholders set out transformation objectives
that were practical to ensure the dilution of the White Management shareholding.
The Department ensured a pro rata contribution to assist the intended stakeholders
acquire the proposed equity interests without incurring substantial debt.
The under-mentioned variables were undertaken in the quest of fast-tracking the
transformation:
(i) Due diligence,
(ii) Shareholding structure and
(iii) Consultation with all relevant stakeholders.
Maluti A Phofung Special Economic Zone and the Logistic Hub (SEZ)
The Cabinet has declared the entire Maluti-a-Phofung precinct as a Special Economic
Zone (SEZ), the SEZ is inclusive of the Harrismith Logistic Hub.
The following reports have been completed by the Technical service providers as input
into the Options Analyses of the PPP feasibility study:
Assessment of existing infrastructure, Environmental Impact assessment, Geotechnical
assessment, Topographical assessment.
The Technical service providers are in the process of completing the following technical
reports:
Detailed designs for infrastructure, Develop CAD drawings , Public Transport Plan,
Infrastructure Plan, Development of a costing model
The preliminary feasibility study report was concluded.
The appointment of the legal service was concluded to ensure their inputs into the
feasibility study.
SANRAL has also committed to carry out traffic impact studies on behalf of the
Department for all major entrances to Hub and SEZ sites
N8 Corridor Rail Link
The appointment of the Transaction Advisors to conduct the feasibility for the project was
finalised. Inception meeting with all transaction advisors was held. The project plan was
completed and a public participation and industry transition model was finalised
A site visit of the existing railway facilities was conducted with the appointed Transaction
Advisors.
The need for an Integrated Public Transport Network (IPTN) for the Municipalities in Free
State Province was identified in the 2006 – 2011 Integrated Transport Plan (ITP). The
IPTN is intended to transform the public transport sector through the provision of a high-
quality and affordable public transport system in line with national policy.
The lack of quality public transport services in the Municipalities has an apparent impact
on the Provincial economic competitiveness, environmental well-being, and the
realization of social equity.
The planning process covered the following plans and activities for the IPTN:
Operational Plan,
Integrated Transport System and Fare System Plan,
Business Plan
Ladybrand Transport Centre
The consultant for this project was appointed in 2018/19 and submitted the relevant
designs. The contractor was also appointed, but the project had been terminated at the
end of November 2018, after taking into account the Auditor Generals concerns with
regard to irregular appointments.
Traffic Management
The following projects will be embarked on in 2019/2020 financial year, as a process of
road safety programmes;
500 youth matriculants to be trained to acquire driving licenses in the following
regions:
o Fezile Dabi : 100
o Xhariep : 150
o Lejweleputswa: 250
In this financial year the Department will ensure that the Back Office, to process
Section 56 notices is finally operational.
The Department will be embarking on upgrading and calibration of the following six
testing stations for roadworthy test:
o Villiers
o Frankfort
o Viljoenskroon
o Petrusburg
o Warden
o Bothaville
3. Outlook for the coming financial year (2019/20)
The Civilian Oversight budget will be utilised at the district level ensuring that the 110
Police Stations in the Province are visited at least once per annum to conduct monitoring
of police
Transport infrastructure
Number of projects are underway for 2018/19 in the form bus operations, learner
transport, non-motorised (bicycles), the grant to Provincial Taxi Council (PTC) and also
the establishment of Inter-grated Public Transport Network (IPTN)
A budget in excess of R 125 million is also set aside in the 2019/20 financial year, for the
Contractor Development Programme. A budget of approximately R 20 million for 2019/20
is set aside for grass cutting SMME’s.
It is expected that the above EPWP projects will create more than 2800 job opportunities.
A number of new rehabilitation projects are also planned for implementation in the
2019/20 financial year. Those include:
Ventersburg – Senekal
Windburg – Marquard
Hoopstad – Bloemhof
Kroonstad – Viljoenskroon
N8: Bram Fischer Airport Road
Reitz – Tweeling - Frankfort
4. Reprioritisation
The Department of Police, Roads and Transport undertook a vigorous budget
restructurings in effort to address areas of concerns emanating from the 2018/19 financial
in a continued effort to address the huddle of accruals and the deficit encountered in the
allocation towards the compensation of employees.
5. Procurement
The three year contract for supplies of road building equipment has expired in December
2017. The Department is in the process of appointing new suppliers for a new tem of 36
months.
6. Receipts and financing
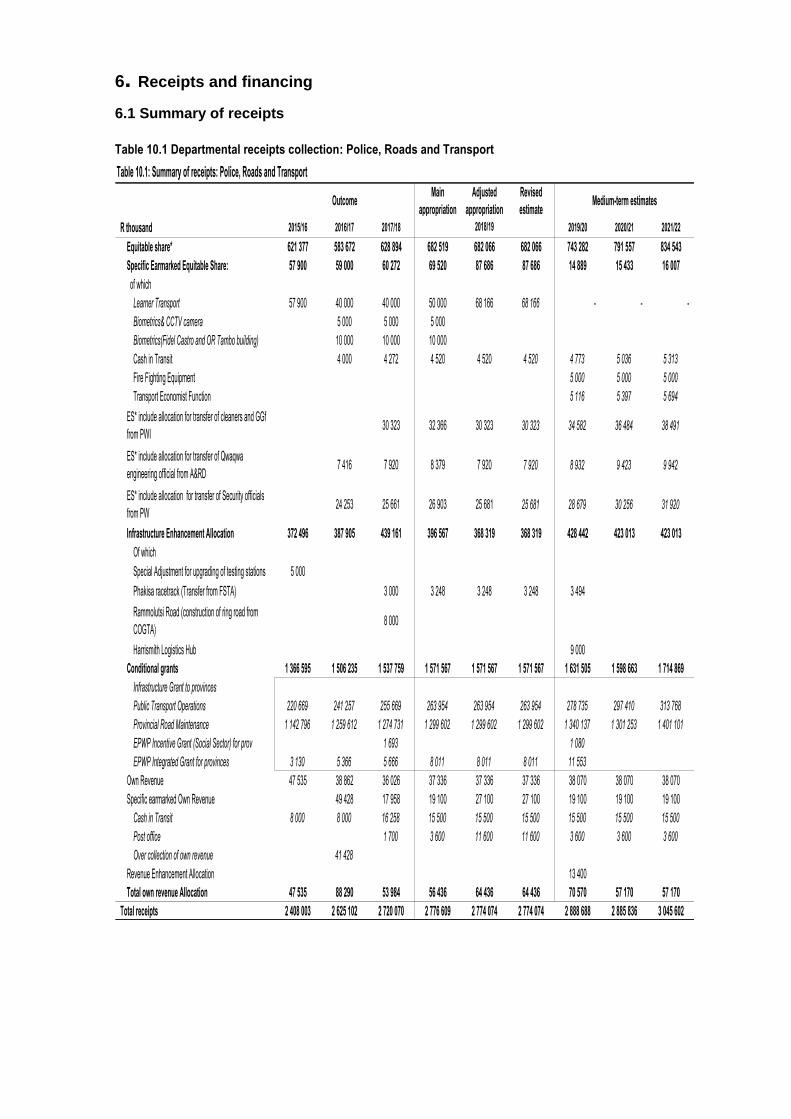
6.1 Summary of receipts
Table 10.1 Departmental receipts collection: Police, Roads and Transport
Table 10.1: Summary of receipts: Police, Roads and Transport
OutcomeMain
appropriation
Adjusted
appropriation
Revised
estimateMedium-term estimates
R thousand 2015/16 2016/17 2017/18 2019/20 2020/21 2021/22
Equitable share* 621 377 583 672 628 894 682 519 682 066 682 066 743 282 791 557 834 543
Specific Earmarked Equitable Share: 57 900 59 000 60 272 69 520 87 686 87 686 14 889 15 433 16 007
of which
Learner Transport 57 900 40 000 40 000 50 000 68 166 68 166 - - -
Biometrics& CCTV camera 5 000 5 000 5 000
Biometrics(Fidel Castro and OR Tambo building) 10 000 10 000 10 000
Cash in Transit 4 000 4 272 4 520 4 520 4 520 4 773 5 036 5 313
Fire Fighting Equipment 5 000 5 000 5 000
Transport Economist Function 5 116 5 397 5 694
ES* include allocation for transfer of cleaners and GGf
from PWI30 323 32 366 30 323 30 323 34 582 36 484 38 491
ES* include allocation for transfer of Qwaqwa
engineering official from A&RD7 416 7 920 8 379 7 920 7 920 8 932 9 423 9 942
ES* include allocation for transfer of Security officials
from PW24 253 25 661 26 903 25 681 25 681 28 679 30 256 31 920
Infrastructure Enhancement Allocation 372 496 387 905 439 161 396 567 368 319 368 319 428 442 423 013 423 013
Of which
Special Adjustment for upgrading of testing stations 5 000
Phakisa racetrack (Transfer from FSTA) 3 000 3 248 3 248 3 248 3 494
Rammolutsi Road (construction of ring road from
COGTA)8 000
Harrismith Logistics Hub 9 000
Conditional grants 1 366 595 1 506 235 1 537 759 1 571 567 1 571 567 1 571 567 1 631 505 1 598 663 1 714 869
Infrastructure Grant to provinces
Public Transport Operations 220 669 241 257 255 669 263 954 263 954 263 954 278 735 297 410 313 768
Provincial Road Maintenance 1 142 796 1 259 612 1 274 731 1 299 602 1 299 602 1 299 602 1 340 137 1 301 253 1 401 101
EPWP Incentive Grant (Social Sector) for prov 1 693 1 080
EPWP Integrated Grant for provinces 3 130 5 366 5 666 8 011 8 011 8 011 11 553
Own Revenue 47 535 38 862 36 026 37 336 37 336 37 336 38 070 38 070 38 070
Specific eamarked Own RevenueSpecific earmarked Own Revenue 49 428 17 958 19 100 27 100 27 100 19 100 19 100 19 100
Cash in Transit 8 000 8 000 16 258 15 500 15 500 15 500 15 500 15 500 15 500
Post office 1 700 3 600 11 600 11 600 3 600 3 600 3 600
Over collection of own revenue 41 428
Revenue Enhancement Allocation 13 400
Total own revenue Allocation 47 535 88 290 53 984 56 436 64 436 64 436 70 570 57 170 57 170
Total receipts 2 408 003 2 625 102 2 720 070 2 776 609 2 774 074 2 774 074 2 888 688 2 885 836 3 045 602
2018/19
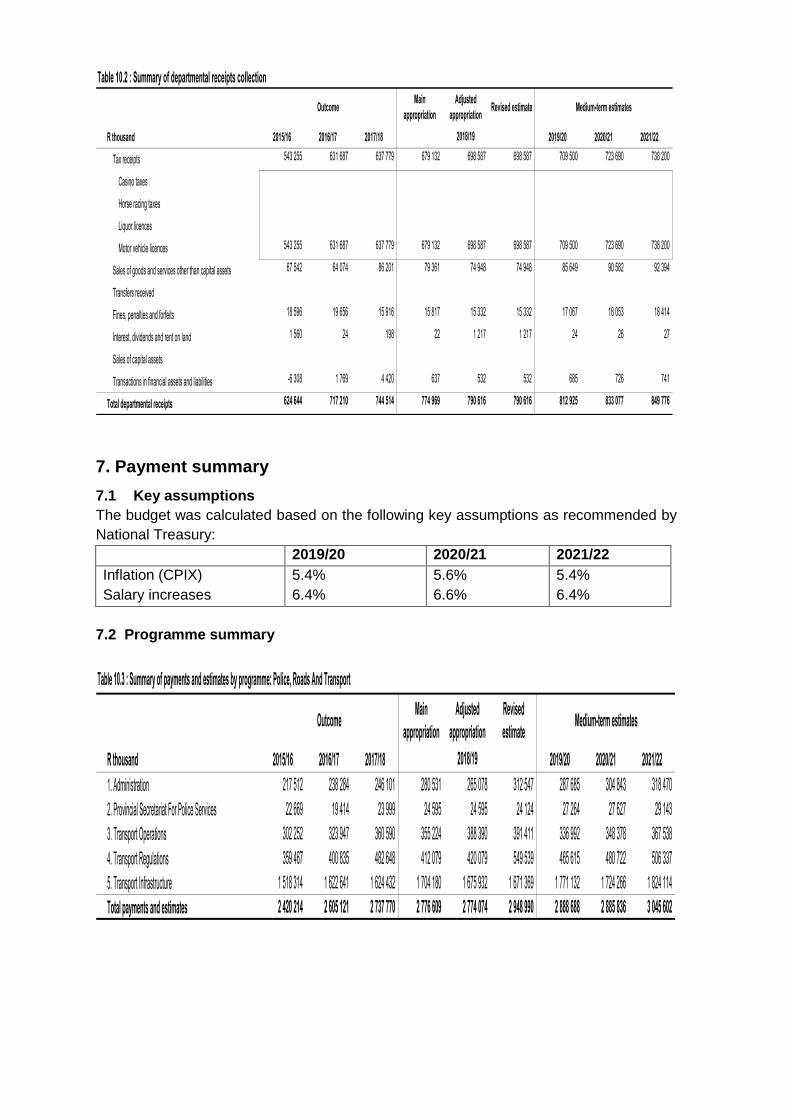
Table 10.2 : Summary of departmental receipts collection
OutcomeMain
appropriation
Adjusted
appropriationRevised estimate Medium-term estimates
R thousand 2015/16 2016/17 2017/18 2019/20 2020/21 2021/22
Tax receipts 543 255 631 687 637 779 679 132 698 587 698 587 709 500 723 690 738 200
Casino taxes
Horse racing taxes
Liquor licences
Motor vehicle licences 543 255 631 687 637 779 679 132 698 587 698 587 709 500 723 690 738 200
Sales of goods and services other than capital assets 67 542 64 074 86 201 79 361 74 948 74 948 85 649 90 582 92 394
Transfers received
Fines, penalties and forfeits 18 596 19 656 15 916 15 817 15 332 15 332 17 067 18 053 18 414
Interest, dividends and rent on land 1 560 24 198 22 1 217 1 217 24 26 27
Sales of capital assets
Transactions in financial assets and liabilities -6 308 1 769 4 420 637 532 532 685 726 741
Total departmental receipts 624 644 717 210 744 514 774 969 790 616 790 616 812 925 833 077 849 776
2018/19
7. Payment summary
7.1 Key assumptions
The budget was calculated based on the following key assumptions as recommended by
National Treasury:
2019/20 2020/21 2021/22
Inflation (CPIX) 5.4% 5.6% 5.4%
Salary increases 6.4% 6.6% 6.4%
7.2 Programme summary
Table 10.3 : Summary of payments and estimates by programme: Police, Roads And Transport
OutcomeMain
appropriation
Adjusted
appropriation
Revised
estimateMedium-term estimates
R thousand 2015/16 2016/17 2017/18 2019/20 2020/21 2021/22
1. Administration 217 512 238 284 246 101 280 531 265 078 312 547 287 685 304 843 318 470
2. Provincial Secretariat For Police Services 22 669 19 414 23 999 24 595 24 595 24 124 27 264 27 627 29 143
3. Transport Operations 302 252 323 947 360 590 355 224 388 390 391 411 336 992 348 378 367 538
4. Transport Regulations 359 467 400 835 482 648 412 079 420 079 549 539 465 615 480 722 506 337
5. Transport Infrastructure 1 518 314 1 622 641 1 624 432 1 704 180 1 675 932 1 671 369 1 771 132 1 724 266 1 824 114
Total payments and estimates 2 420 214 2 605 121 2 737 770 2 776 609 2 774 074 2 948 990 2 888 688 2 885 836 3 045 602
2018/19
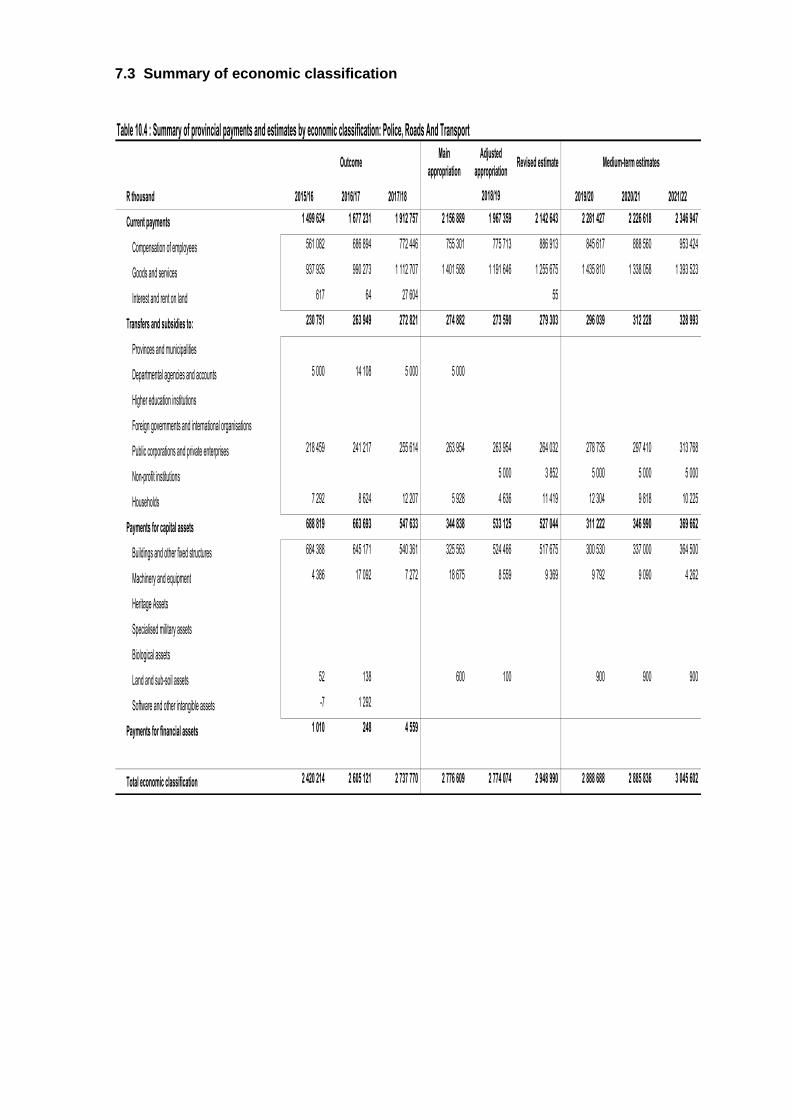
7.3 Summary of economic classification
Table 10.4 : Summary of provincial payments and estimates by economic classification: Police, Roads And Transport
OutcomeMain
appropriation
Adjusted
appropriationRevised estimate Medium-term estimates
R thousand 2015/16 2016/17 2017/18 2019/20 2020/21 2021/22
Current payments 1 499 634 1 677 231 1 912 757 2 156 889 1 967 359 2 142 643 2 281 427 2 226 618 2 346 947
Compensation of employees 561 082 686 894 772 446 755 301 775 713 886 913 845 617 888 560 953 424
Goods and services 937 935 990 273 1 112 707 1 401 588 1 191 646 1 255 675 1 435 810 1 338 058 1 393 523
Interest and rent on land 617 64 27 604 55
Transfers and subsidies to: 230 751 263 949 272 821 274 882 273 590 279 303 296 039 312 228 328 993
Provinces and municipalities
Departmental agencies and accounts 5 000 14 108 5 000 5 000
Higher education institutions
Foreign governments and international organisations
Public corporations and private enterprises 218 459 241 217 255 614 263 954 263 954 264 032 278 735 297 410 313 768
Non-profit institutions 5 000 3 852 5 000 5 000 5 000
Households 7 292 8 624 12 207 5 928 4 636 11 419 12 304 9 818 10 225
Payments for capital assets 688 819 663 693 547 633 344 838 533 125 527 044 311 222 346 990 369 662
Buildings and other fixed structures 684 388 645 171 540 361 325 563 524 466 517 675 300 530 337 000 364 500
Machinery and equipment 4 386 17 092 7 272 18 675 8 559 9 369 9 792 9 090 4 262
Heritage Assets
Specialised military assets
Biological assets
Land and sub-soil assets 52 138 600 100 900 900 900
Software and other intangible assets -7 1 292
Payments for financial assets 1 010 248 4 559
Total economic classification 2 420 214 2 605 121 2 737 770 2 776 609 2 774 074 2 948 990 2 888 688 2 885 836 3 045 602
2018/19
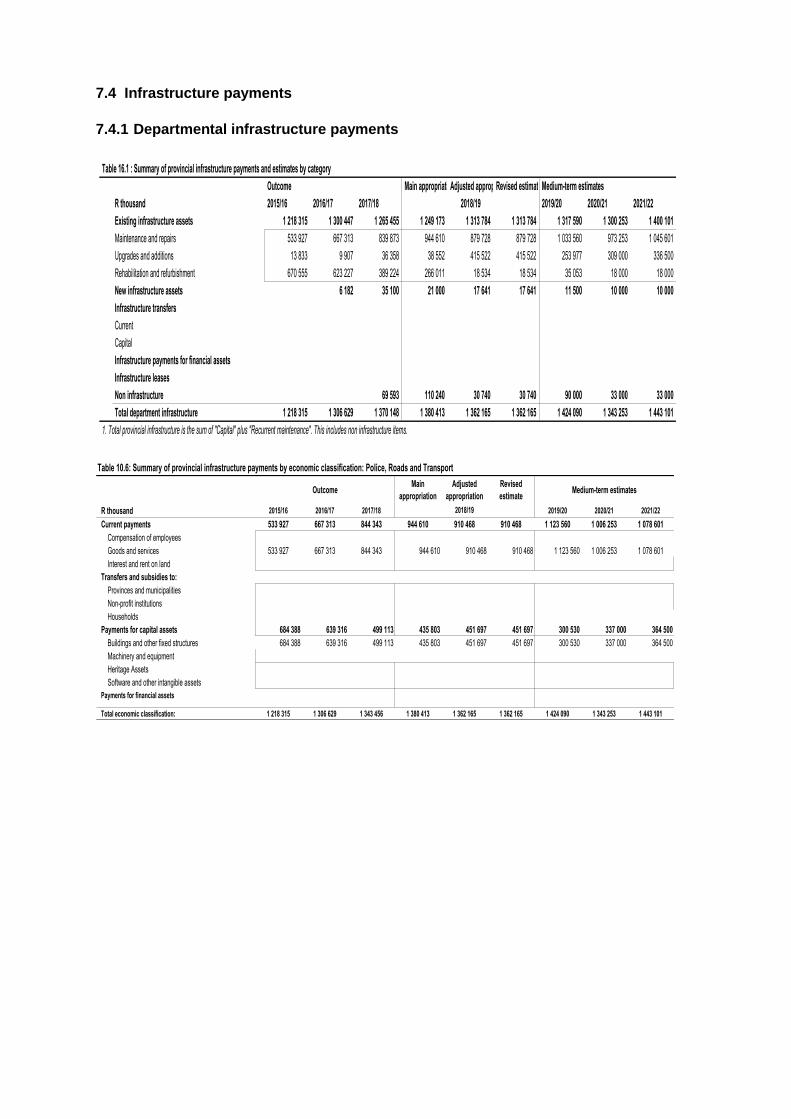
7.4 Infrastructure payments
7.4.1 Departmental infrastructure payments
Table 16.1 : Summary of provincial infrastructure payments and estimates by category
Outcome Main appropriationAdjusted appropriationRevised estimateMedium-term estimates
R thousand 2015/16 2016/17 2017/18 2019/20 2020/21 2021/22
Existing infrastructure assets 1 218 315 1 300 447 1 265 455 1 249 173 1 313 784 1 313 784 1 317 590 1 300 253 1 400 101
Maintenance and repairs 533 927 667 313 839 873 944 610 879 728 879 728 1 033 560 973 253 1 045 601
Upgrades and additions 13 833 9 907 36 358 38 552 415 522 415 522 253 977 309 000 336 500
Rehabilitation and refurbishment 670 555 623 227 389 224 266 011 18 534 18 534 35 053 18 000 18 000
New infrastructure assets 6 182 35 100 21 000 17 641 17 641 11 500 10 000 10 000
Infrastructure transfers
Current
Capital
Infrastructure payments for financial assets
Infrastructure leases
Non infrastructure 69 593 110 240 30 740 30 740 90 000 33 000 33 000
Total department infrastructure 1 218 315 1 306 629 1 370 148 1 380 413 1 362 165 1 362 165 1 424 090 1 343 253 1 443 101
1. Total provincial infrastructure is the sum of "Capital" plus "Recurrent maintenance". This includes non infrastructure items.
2018/19
Table 10.6: Summary of provincial infrastructure payments by economic classification: Police, Roads and Transport
OutcomeMain
appropriation
Adjusted
appropriation
Revised
estimateMedium-term estimates
R thousand 2015/16 2016/17 2017/18 2019/20 2020/21 2021/22
Current payments 533 927 667 313 844 343 944 610 910 468 910 468 1 123 560 1 006 253 1 078 601
Compensation of employees
Goods and services 533 927 667 313 844 343 944 610 910 468 910 468 1 123 560 1 006 253 1 078 601
Interest and rent on land
Transfers and subsidies to: 0 0 0 0 0 0 0 0 0
Provinces and municipalities
Non-profit institutions
Households
Payments for capital assets 684 388 639 316 499 113 435 803 451 697 451 697 300 530 337 000 364 500
Buildings and other fixed structures 684 388 639 316 499 113 435 803 451 697 451 697 300 530 337 000 364 500
Machinery and equipment
Heritage Assets
Software and other intangible assets
Payments for financial assets
Total economic classification: 1 218 315 1 306 629 1 343 456 1 380 413 1 362 165 1 362 165 1 424 090 1 343 253 1 443 101
2018/19
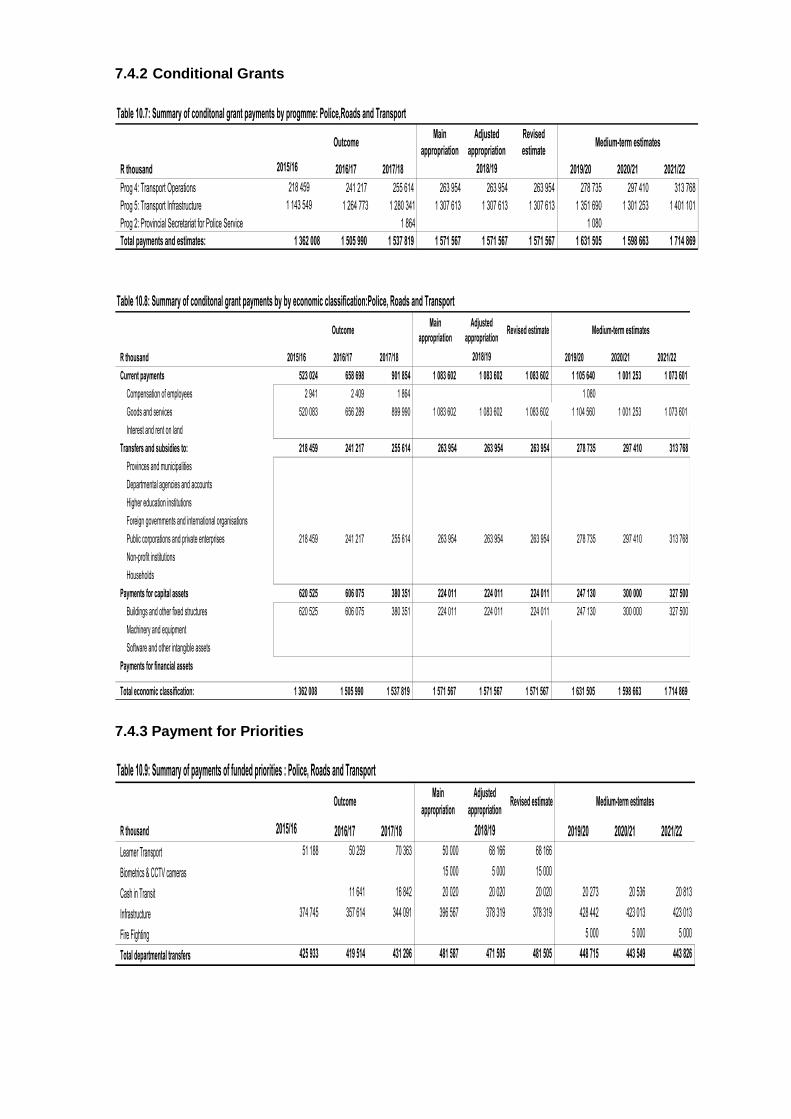
7.4.2 Conditional Grants
Table 10.7: Summary of conditonal grant payments by progmme: Police,Roads and Transport
OutcomeMain
appropriation
Adjusted
appropriation
Revised
estimateMedium-term estimates
R thousand 2015/16 2016/17 2017/18 2019/20 2020/21 2021/22
Prog 4: Transport Operations 218 459 241 217 255 614 263 954 263 954 263 954 278 735 297 410 313 768
Prog 5: Transport Infrastructure 1 143 549 1 264 773 1 280 341 1 307 613 1 307 613 1 307 613 1 351 690 1 301 253 1 401 101
Prog 2: Provincial Secretariat for Police Service 1 864 1 080
Total payments and estimates: 1 362 008 1 505 990 1 537 819 1 571 567 1 571 567 1 571 567 1 631 505 1 598 663 1 714 869
2018/19
Table 10.8: Summary of conditonal grant payments by by economic classification:Police, Roads and Transport
OutcomeMain
appropriation
Adjusted
appropriationRevised estimate Medium-term estimates
R thousand 2015/16 2016/17 2017/18 2019/20 2020/21 2021/22
Current payments 523 024 658 698 901 854 1 083 602 1 083 602 1 083 602 1 105 640 1 001 253 1 073 601
Compensation of employees 2 941 2 409 1 864 1 080
Goods and services 520 083 656 289 899 990 1 083 602 1 083 602 1 083 602 1 104 560 1 001 253 1 073 601
Interest and rent on land
Transfers and subsidies to: 218 459 241 217 255 614 263 954 263 954 263 954 278 735 297 410 313 768
Provinces and municipalities
Departmental agencies and accounts
Higher education institutions
Foreign governments and international organisations
Public corporations and private enterprises 218 459 241 217 255 614 263 954 263 954 263 954 278 735 297 410 313 768
Non-profit institutions
Households
Payments for capital assets 620 525 606 075 380 351 224 011 224 011 224 011 247 130 300 000 327 500
Buildings and other fixed structures 620 525 606 075 380 351 224 011 224 011 224 011 247 130 300 000 327 500
Machinery and equipment
Software and other intangible assets
Payments for financial assets
Total economic classification: 1 362 008 1 505 990 1 537 819 1 571 567 1 571 567 1 571 567 1 631 505 1 598 663 1 714 869
2018/19
7.4.3 Payment for Priorities
Table 10.9: Summary of payments of funded priorities : Police, Roads and Transport
OutcomeMain
appropriation
Adjusted
appropriationRevised estimate Medium-term estimates
R thousand 2015/16 2016/17 2017/18 2019/20 2020/21 2021/22
Learner Transport 51 188 50 259 70 363 50 000 68 166 68 166
Biometrics & CCTV cameras – – 15 000 5 000 15 000
Cash in Transit 11 641 16 842 20 020 20 020 20 020 20 273 20 536 20 813
Infrastructure 374 745 357 614 344 091 396 567 378 319 378 319 428 442 423 013 423 013
Fire Fighting 5 000 5 000 5 000
Total departmental transfers 425 933 419 514 431 296 481 587 471 505 481 505 448 715 443 549 443 826
2018/19
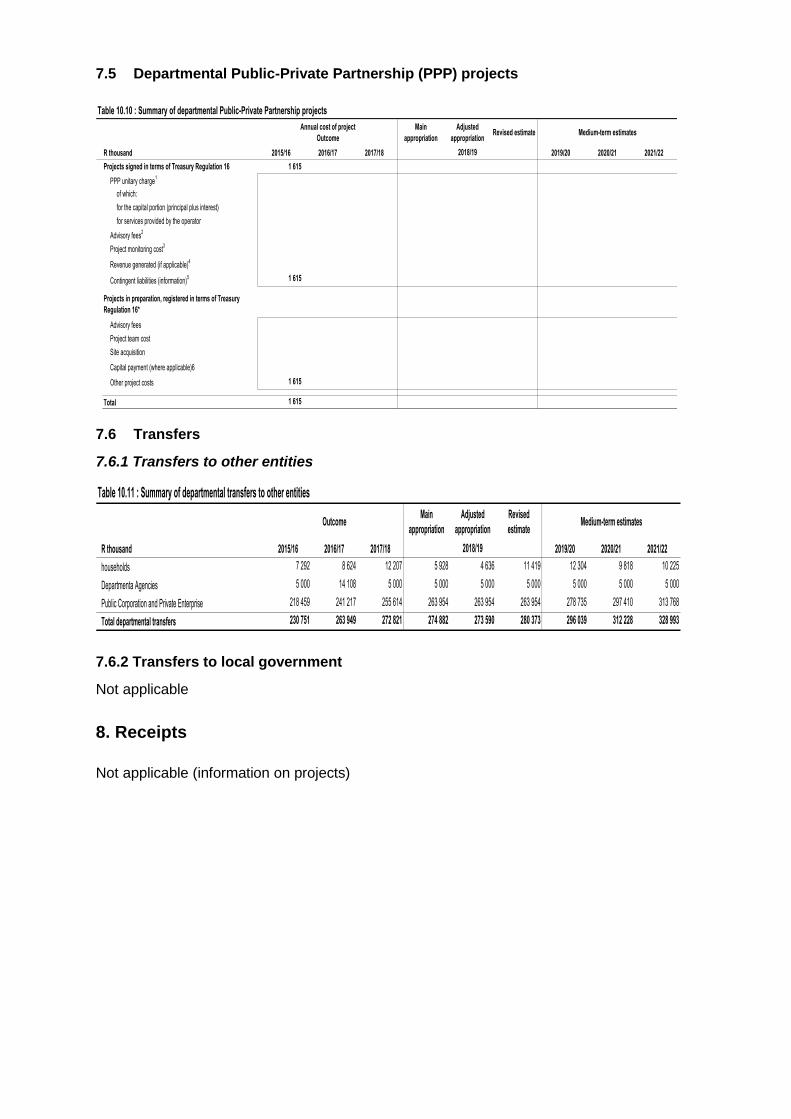
7.5 Departmental Public-Private Partnership (PPP) projects
Table 10.10 : Summary of departmental Public-Private Partnership projects
Annual cost of project
Outcome
Main
appropriation
Adjusted
appropriationRevised estimate Medium-term estimates
R thousand 2015/16 2016/17 2017/18 2019/20 2020/21 2021/22
Projects signed in terms of Treasury Regulation 16 1 615 – – – – – – – –
PPP unitary charge1 – – – – – – – – –
of which:
for the capital portion (principal plus interest) – – – – – – – – –
for services provided by the operator – – – – – – – – –
Advisory fees2 – – – – – – – – –
Project monitoring cost3 – – – – – – – – –
Revenue generated (if applicable)4 – – – – – – – – –
Contingent liabilities (information)5 1 615 – – – – – – – –
Projects in preparation, registered in terms of Treasury
Regulation 16*– – – – – – – – –
Advisory fees – – – – – – – – –
Project team cost – – – – – – – – –
Site acquisition – – – – – – – – –
Capital payment (where applicable)6 – – – – – – – – –
Other project costs 1 615 – – – – – – – –
Total 1 615 – – – – – – – –
2018/19
7.6 Transfers
7.6.1 Transfers to other entities
Table 10.11 : Summary of departmental transfers to other entities
OutcomeMain
appropriation
Adjusted
appropriation
Revised
estimateMedium-term estimates
R thousand 2015/16 2016/17 2017/18 2019/20 2020/21 2021/22
households 7 292 8 624 12 207 5 928 4 636 11 419 12 304 9 818 10 225
Departmenta Agencies 5 000 14 108 5 000 5 000 5 000 5 000 5 000 5 000 5 000
Public Corporation and Private Enterprise 218 459 241 217 255 614 263 954 263 954 263 954 278 735 297 410 313 768
Total departmental transfers 230 751 263 949 272 821 274 882 273 590 280 373 296 039 312 228 328 993
2018/19
7.6.2 Transfers to local government
Not applicable
8. Receipts
Not applicable (information on projects)
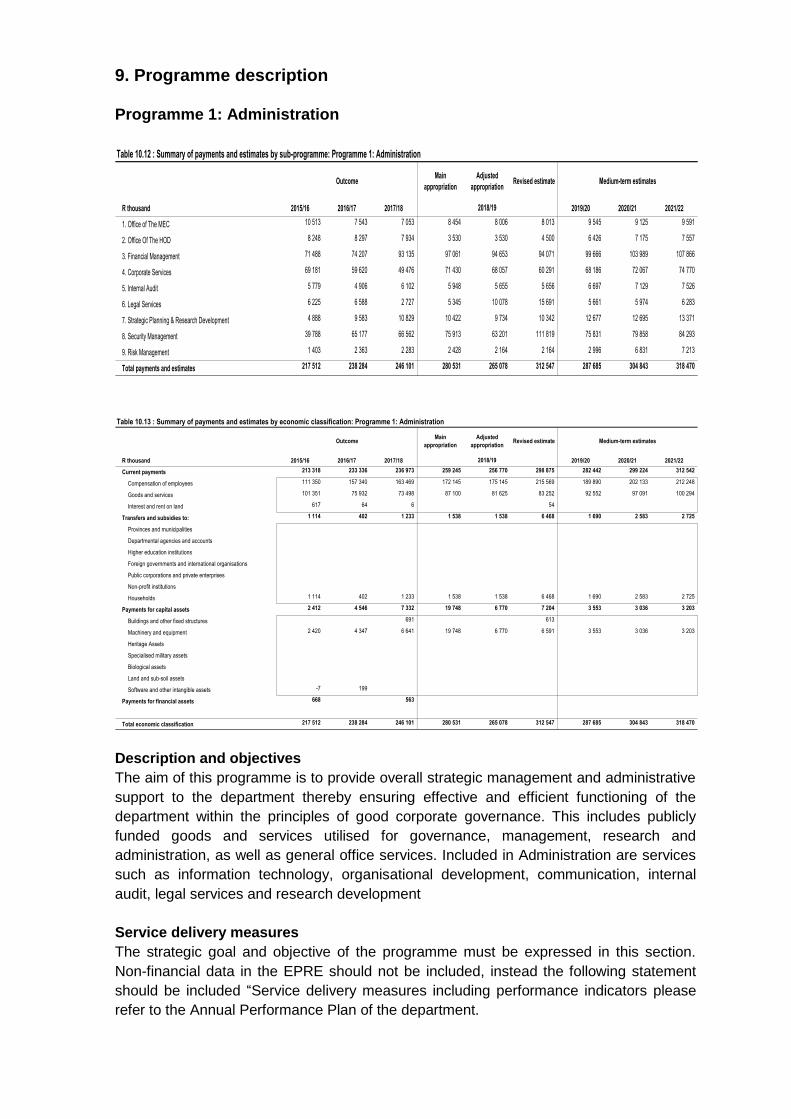
9. Programme description
Programme 1: Administration
Table 10.12 : Summary of payments and estimates by sub-programme: Programme 1: Administration
OutcomeMain
appropriation
Adjusted
appropriationRevised estimate Medium-term estimates
R thousand 2015/16 2016/17 2017/18 2019/20 2020/21 2021/22
1. Office of The MEC 10 513 7 543 7 053 8 454 8 006 8 013 9 545 9 125 9 591
2. Office Of The HOD 8 248 8 297 7 934 3 530 3 530 4 500 6 426 7 175 7 557
3. Financial Management 71 488 74 207 93 135 97 061 94 653 94 071 99 666 103 989 107 866
4. Corporate Services 69 181 59 620 49 476 71 430 68 057 60 291 68 186 72 067 74 770
5. Internal Audit 5 779 4 906 6 102 5 948 5 655 5 656 6 697 7 129 7 526
6. Legal Services 6 225 6 588 2 727 5 345 10 078 15 691 5 661 5 974 6 283
7. Strategic Planning & Research Development 4 888 9 583 10 829 10 422 9 734 10 342 12 677 12 695 13 371
8. Security Management 39 788 65 177 66 562 75 913 63 201 111 819 75 831 79 858 84 293
9. Risk Management 1 403 2 363 2 283 2 428 2 164 2 164 2 996 6 831 7 213
Total payments and estimates 217 512 238 284 246 101 280 531 265 078 312 547 287 685 304 843 318 470
2018/19
Table 10.13 : Summary of payments and estimates by economic classification: Programme 1: Administration
OutcomeMain
appropriation
Adjusted
appropriationRevised estimate Medium-term estimates
R thousand 2015/16 2016/17 2017/18 2019/20 2020/21 2021/22
Current payments 213 318 233 336 236 973 259 245 256 770 298 875 282 442 299 224 312 542
Compensation of employees 111 350 157 340 163 469 172 145 175 145 215 569 189 890 202 133 212 248
Goods and services 101 351 75 932 73 498 87 100 81 625 83 252 92 552 97 091 100 294
Interest and rent on land 617 64 6 54
Transfers and subsidies to: 1 114 402 1 233 1 538 1 538 6 468 1 690 2 583 2 725
Provinces and municipalities
Departmental agencies and accounts
Higher education institutions
Foreign governments and international organisations
Public corporations and private enterprises
Non-profit institutions
Households 1 114 402 1 233 1 538 1 538 6 468 1 690 2 583 2 725
Payments for capital assets 2 412 4 546 7 332 19 748 6 770 7 204 3 553 3 036 3 203
Buildings and other fixed structures 691 613
Machinery and equipment 2 420 4 347 6 641 19 748 6 770 6 591 3 553 3 036 3 203
Heritage Assets
Specialised military assets
Biological assets
Land and sub-soil assets
Software and other intangible assets -7 199
Payments for financial assets 668 563
Total economic classification 217 512 238 284 246 101 280 531 265 078 312 547 287 685 304 843 318 470
2018/19
Description and objectives
The aim of this programme is to provide overall strategic management and administrative
support to the department thereby ensuring effective and efficient functioning of the
department within the principles of good corporate governance. This includes publicly
funded goods and services utilised for governance, management, research and
administration, as well as general office services. Included in Administration are services
such as information technology, organisational development, communication, internal
audit, legal services and research development
Service delivery measures
The strategic goal and objective of the programme must be expressed in this section.
Non-financial data in the EPRE should not be included, instead the following statement
should be included “Service delivery measures including performance indicators please
refer to the Annual Performance Plan of the department.
Sub-programmes Description
Office of the MEC
To render advisory, secretarial, administrative and office support services as well as
secretarial support. The office also deals with the rendering of administrative support,
public relations/communication support and parliamentary support services
Office of the HOD
The sub-programme deals with the overall management of the department and overall
project monitoring.
Financial Management
To support the operational functioning of the department by ensuring compliance with the
Public Finance Management Act, 1999 (Act No. 1of 1999), Treasury Regulation and the
provision of financial and administrative management services.
Corporate Support
The functions of this sub-programme are to manage personnel, administration and
related support services. The section also deals with operational support in terms of
strategic management, human resource, legal issues, information technology and
auxiliary services.
Internal Audit
This Sub-programme deals with operational support in terms of compliance to legislative
issues related to PFMA.
Legal Services
The function of this Sub-programme is to advice the management of the department with
regard to legislative issues.
Strategic Planning and Research Development
The function of this Sub-programme is to provide operational support in terms of strategic
management, strategic planning, Monitoring and Evaluation, integrated planning and
coordination across all spheres of government, departments including research and
policy development and co-ordination.
Security Management
This Sub-programme deals with total security of departmental buildings and safety of
Personnel.
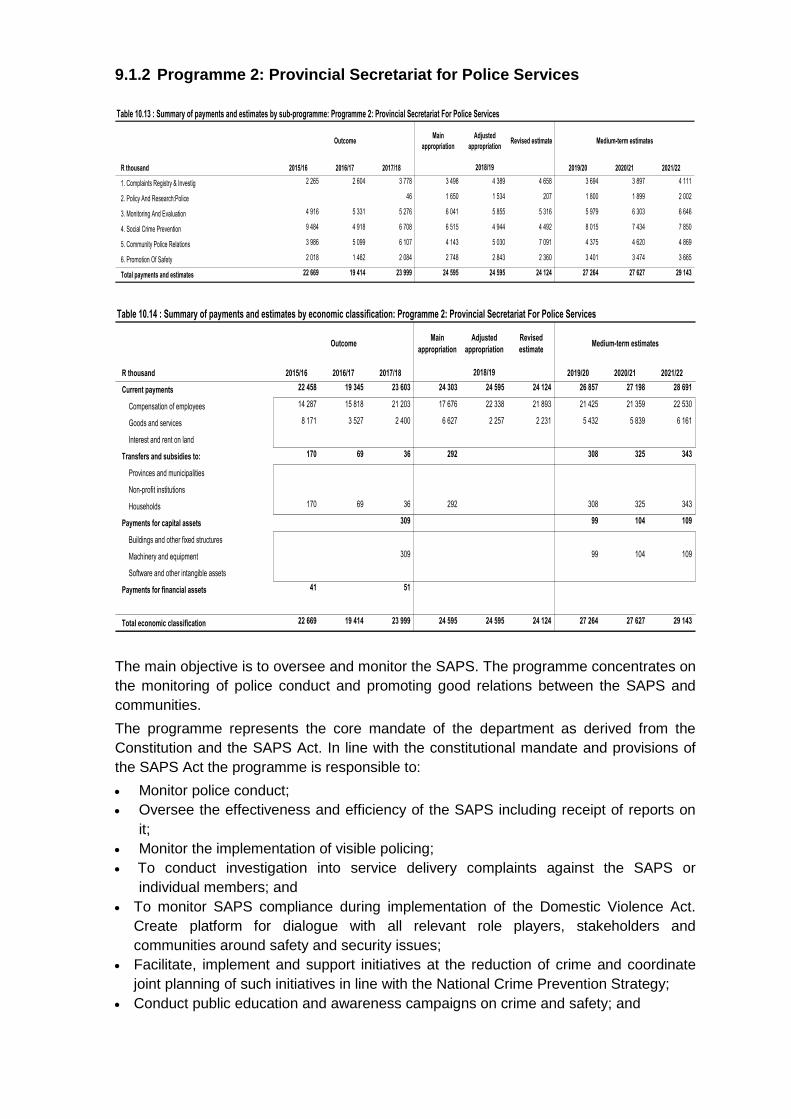
9.1.2 Programme 2: Provincial Secretariat for Police Services
Table 10.13 : Summary of payments and estimates by sub-programme: Programme 2: Provincial Secretariat For Police Services
OutcomeMain
appropriation
Adjusted
appropriationRevised estimate Medium-term estimates
R thousand 2015/16 2016/17 2017/18 2019/20 2020/21 2021/22
1. Complaints Registry & Investig 2 265 2 604 3 778 3 498 4 389 4 658 3 694 3 897 4 111
2. Policy And Research:Police 46 1 650 1 534 207 1 800 1 899 2 002
3. Monitoring And Evaluation 4 916 5 331 5 276 6 041 5 855 5 316 5 979 6 303 6 646
4. Social Crime Prevention 9 484 4 918 6 708 6 515 4 944 4 492 8 015 7 434 7 850
5. Community Police Relations 3 986 5 099 6 107 4 143 5 030 7 091 4 375 4 620 4 869
6. Promotion Of Safety 2 018 1 462 2 084 2 748 2 843 2 360 3 401 3 474 3 665
Total payments and estimates 22 669 19 414 23 999 24 595 24 595 24 124 27 264 27 627 29 143
2018/19
Table 10.14 : Summary of payments and estimates by economic classification: Programme 2: Provincial Secretariat For Police Services
OutcomeMain
appropriation
Adjusted
appropriation
Revised
estimateMedium-term estimates
R thousand 2015/16 2016/17 2017/18 2019/20 2020/21 2021/22
Current payments 22 458 19 345 23 603 24 303 24 595 24 124 26 857 27 198 28 691
Compensation of employees 14 287 15 818 21 203 17 676 22 338 21 893 21 425 21 359 22 530
Goods and services 8 171 3 527 2 400 6 627 2 257 2 231 5 432 5 839 6 161
Interest and rent on land
Transfers and subsidies to: 170 69 36 292 308 325 343
Provinces and municipalities
Non-profit institutions
Households 170 69 36 292 308 325 343
Payments for capital assets 309 99 104 109
Buildings and other fixed structures
Machinery and equipment 309 99 104 109
Software and other intangible assets
Payments for financial assets 41 51
Total economic classification 22 669 19 414 23 999 24 595 24 595 24 124 27 264 27 627 29 143
2018/19
The main objective is to oversee and monitor the SAPS. The programme concentrates on
the monitoring of police conduct and promoting good relations between the SAPS and
communities.
The programme represents the core mandate of the department as derived from the
Constitution and the SAPS Act. In line with the constitutional mandate and provisions of
the SAPS Act the programme is responsible to:
Monitor police conduct;
Oversee the effectiveness and efficiency of the SAPS including receipt of reports on
it;
Monitor the implementation of visible policing;
To conduct investigation into service delivery complaints against the SAPS or
individual members; and
To monitor SAPS compliance during implementation of the Domestic Violence Act.
Create platform for dialogue with all relevant role players, stakeholders and
communities around safety and security issues;
Facilitate, implement and support initiatives at the reduction of crime and coordinate
joint planning of such initiatives in line with the National Crime Prevention Strategy;
Conduct public education and awareness campaigns on crime and safety; and
Facilitate and sustain functionality of community Policing Structures (Problem-solving,
Problem identification despite resolution and conflict management) structures include
CPF’s, CSF’s, Sector, etc.).
Sub-Programme Description
Complaints Registry and Investigations
The sub-programme is responsible for addressing service delivery complaints against the
Police in order to meet service delivery standards.
Policy and research
The sub programme is responsible to conduct research into policing matters relative to
civilian oversight and develop policy interventions.
Monitoring and Evaluation
The sub programme is responsible for monitoring of police conduct and monitoring of the
implementation of visible policing.
Social crime prevention
The Social Crime Prevention sub-programme is responsible for the initiation and
coordination of the prevention and reduction of social upliftment programmes in the
province.
Community Policing and Liaison
The Community Policing and Liaison sub-programme is responsible for the multi-
stakeholder involvement and participation in crime prevention and community policing.
Promotion of Safety
The promotion of safety sub-programme is responsible for providing public education to
communities.
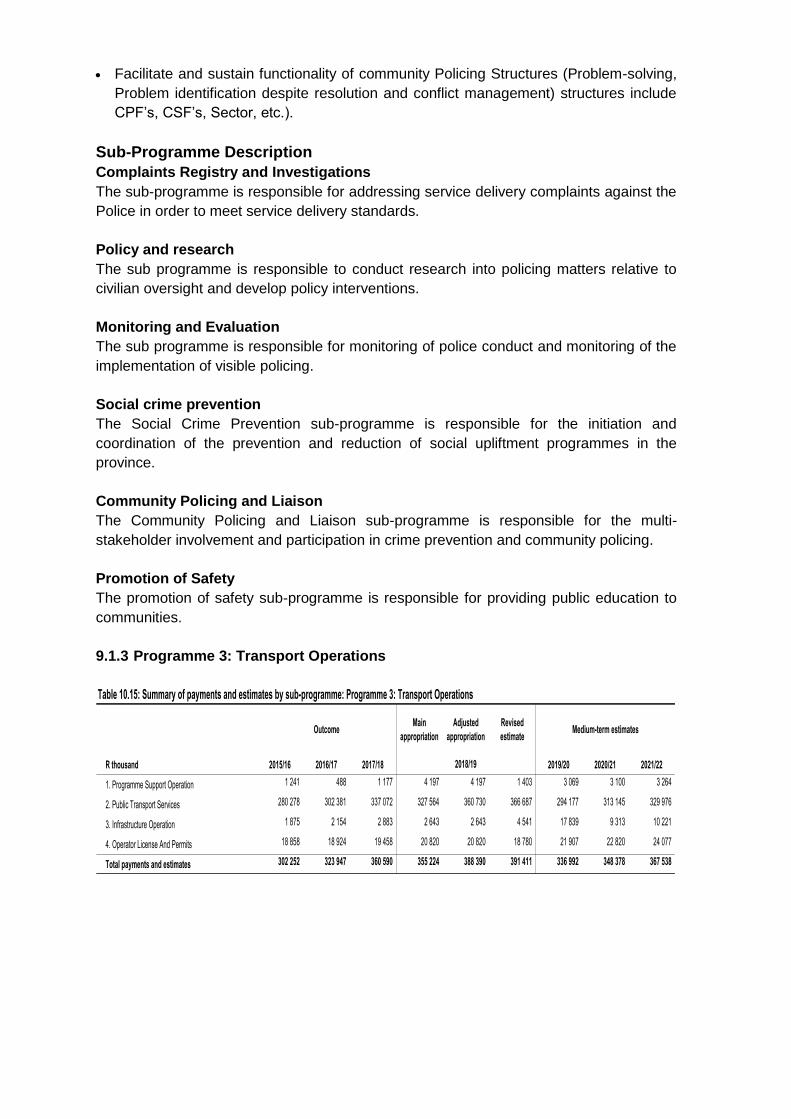
9.1.3 Programme 3: Transport Operations
Table 10.15: Summary of payments and estimates by sub-programme: Programme 3: Transport Operations
OutcomeMain
appropriation
Adjusted
appropriation
Revised
estimateMedium-term estimates
R thousand 2015/16 2016/17 2017/18 2019/20 2020/21 2021/22
1. Programme Support Operation 1 241 488 1 177 4 197 4 197 1 403 3 069 3 100 3 264
2. Public Transport Services 280 278 302 381 337 072 327 564 360 730 366 687 294 177 313 145 329 976
3. Infrastructure Operation 1 875 2 154 2 883 2 643 2 643 4 541 17 839 9 313 10 221
4. Operator License And Permits 18 858 18 924 19 458 20 820 20 820 18 780 21 907 22 820 24 077
Total payments and estimates 302 252 323 947 360 590 355 224 388 390 391 411 336 992 348 378 367 538
2018/19
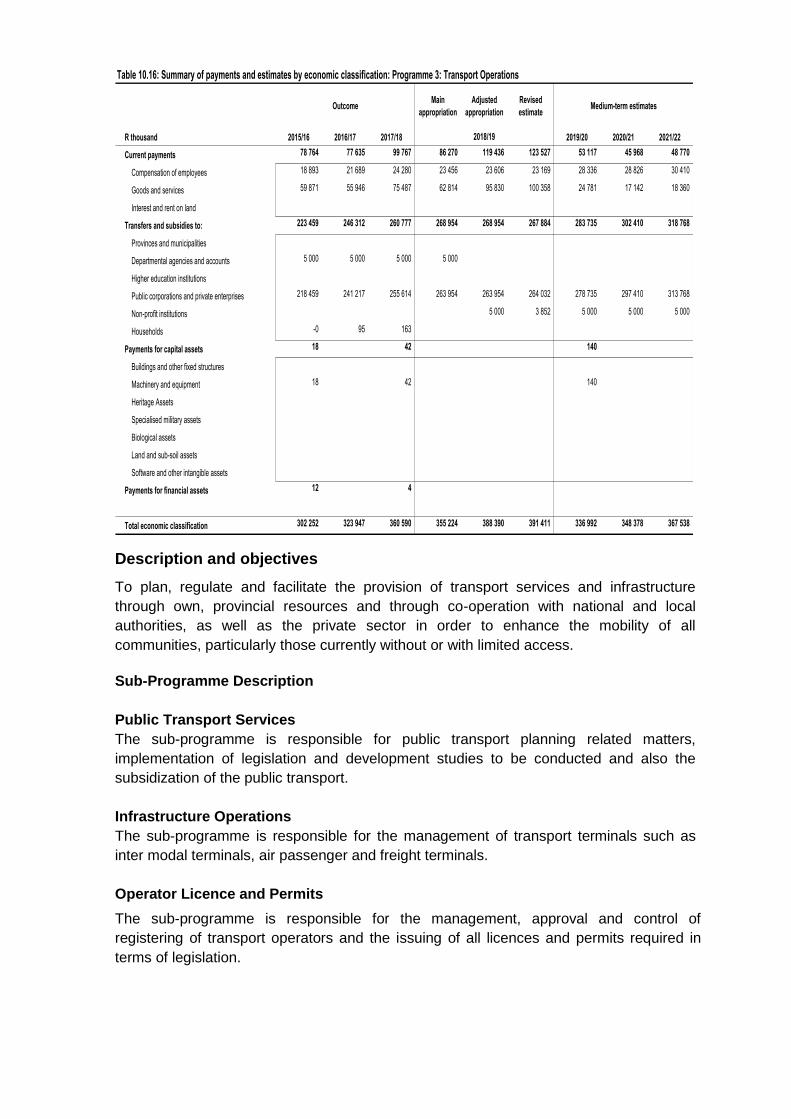
Table 10.16: Summary of payments and estimates by economic classification: Programme 3: Transport Operations
OutcomeMain
appropriation
Adjusted
appropriation
Revised
estimateMedium-term estimates
R thousand 2015/16 2016/17 2017/18 2019/20 2020/21 2021/22
Current payments 78 764 77 635 99 767 86 270 119 436 123 527 53 117 45 968 48 770
Compensation of employees 18 893 21 689 24 280 23 456 23 606 23 169 28 336 28 826 30 410
Goods and services 59 871 55 946 75 487 62 814 95 830 100 358 24 781 17 142 18 360
Interest and rent on land
Transfers and subsidies to: 223 459 246 312 260 777 268 954 268 954 267 884 283 735 302 410 318 768
Provinces and municipalities
Departmental agencies and accounts 5 000 5 000 5 000 5 000
Higher education institutions
Public corporations and private enterprises 218 459 241 217 255 614 263 954 263 954 264 032 278 735 297 410 313 768
Non-profit institutions 5 000 3 852 5 000 5 000 5 000
Households -0 95 163
Payments for capital assets 18 42 140
Buildings and other fixed structures
Machinery and equipment 18 42 140
Heritage Assets
Specialised military assets
Biological assets
Land and sub-soil assets
Software and other intangible assets
Payments for financial assets 12 4
Total economic classification 302 252 323 947 360 590 355 224 388 390 391 411 336 992 348 378 367 538
2018/19
Description and objectives
To plan, regulate and facilitate the provision of transport services and infrastructure
through own, provincial resources and through co-operation with national and local
authorities, as well as the private sector in order to enhance the mobility of all
communities, particularly those currently without or with limited access.
Sub-Programme Description
Public Transport Services
The sub-programme is responsible for public transport planning related matters,
implementation of legislation and development studies to be conducted and also the
subsidization of the public transport.
Infrastructure Operations
The sub-programme is responsible for the management of transport terminals such as
inter modal terminals, air passenger and freight terminals.
Operator Licence and Permits
The sub-programme is responsible for the management, approval and control of
registering of transport operators and the issuing of all licences and permits required in
terms of legislation.
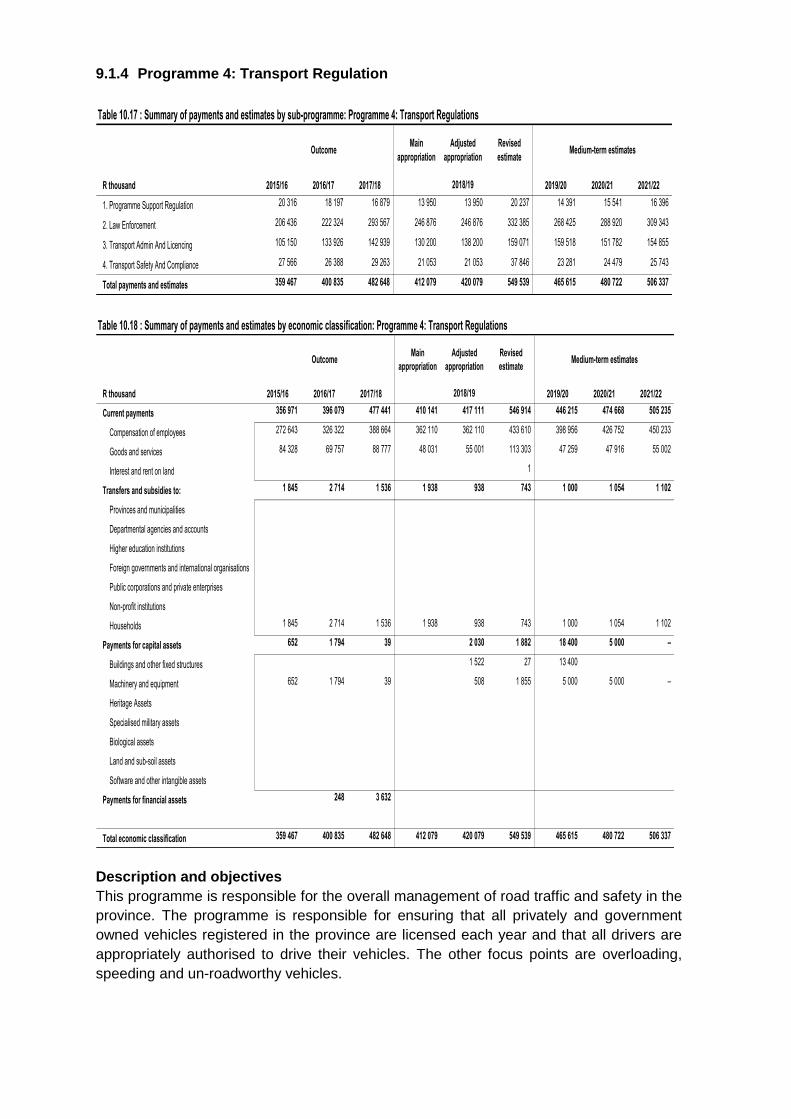
9.1.4 Programme 4: Transport Regulation
Table 10.17 : Summary of payments and estimates by sub-programme: Programme 4: Transport Regulations
OutcomeMain
appropriation
Adjusted
appropriation
Revised
estimateMedium-term estimates
R thousand 2015/16 2016/17 2017/18 2019/20 2020/21 2021/22
1. Programme Support Regulation 20 316 18 197 16 879 13 950 13 950 20 237 14 391 15 541 16 396
2. Law Enforcement 206 436 222 324 293 567 246 876 246 876 332 385 268 425 288 920 309 343
3. Transport Admin And Licencing 105 150 133 926 142 939 130 200 138 200 159 071 159 518 151 782 154 855
4. Transport Safety And Compliance 27 566 26 388 29 263 21 053 21 053 37 846 23 281 24 479 25 743
Total payments and estimates 359 467 400 835 482 648 412 079 420 079 549 539 465 615 480 722 506 337
2018/19
Table 10.18 : Summary of payments and estimates by economic classification: Programme 4: Transport Regulations
OutcomeMain
appropriation
Adjusted
appropriation
Revised
estimateMedium-term estimates
R thousand 2015/16 2016/17 2017/18 2019/20 2020/21 2021/22
Current payments 356 971 396 079 477 441 410 141 417 111 546 914 446 215 474 668 505 235
Compensation of employees 272 643 326 322 388 664 362 110 362 110 433 610 398 956 426 752 450 233
Goods and services 84 328 69 757 88 777 48 031 55 001 113 303 47 259 47 916 55 002
Interest and rent on land 1
Transfers and subsidies to: 1 845 2 714 1 536 1 938 938 743 1 000 1 054 1 102
Provinces and municipalities
Departmental agencies and accounts
Higher education institutions
Foreign governments and international organisations
Public corporations and private enterprises
Non-profit institutions
Households 1 845 2 714 1 536 1 938 938 743 1 000 1 054 1 102
Payments for capital assets 652 1 794 39 2 030 1 882 18 400 5 000 –
Buildings and other fixed structures 1 522 27 13 400
Machinery and equipment 652 1 794 39 508 1 855 5 000 5 000 –
Heritage Assets
Specialised military assets
Biological assets
Land and sub-soil assets
Software and other intangible assets
Payments for financial assets 248 3 632
Total economic classification 359 467 400 835 482 648 412 079 420 079 549 539 465 615 480 722 506 337
2018/19
Description and objectives
This programme is responsible for the overall management of road traffic and safety in the
province. The programme is responsible for ensuring that all privately and government
owned vehicles registered in the province are licensed each year and that all drivers are
appropriately authorised to drive their vehicles. The other focus points are overloading,
speeding and un-roadworthy vehicles.
Sub-Programme Description
Law Enforcement
The function of this section is to maintain law and order on the roads and to provide quality
traffic policing (law enforcement) services.
Transport administration and licensing
The function of this section is to monitor and control all aspects related to the collection of
motor vehicle license and registration fees; to render services regarding the administration
of applications in terms of the National Road Traffic Act, 1996, (Act 93 of 1996); and to
augment capital in trading account. The section also deals with NATIS expenditure and
expenditure related to motor vehicle registration and licensing.
Transport Safety and Compliance
The sub-programme is responsible to manage / co-ordinate and facilitate the transport
safety and compliance in all modes of transport, with related legislation, regulations and
policies through pro-active and reactive strategies.
This includes the monitoring of public transport operators in terms of national and
provincial legislation to ensure safety of Commuters, as well as the provision of safety
education, awareness, training and development of operators, to enable them to provide
acceptable levels of service delivery.
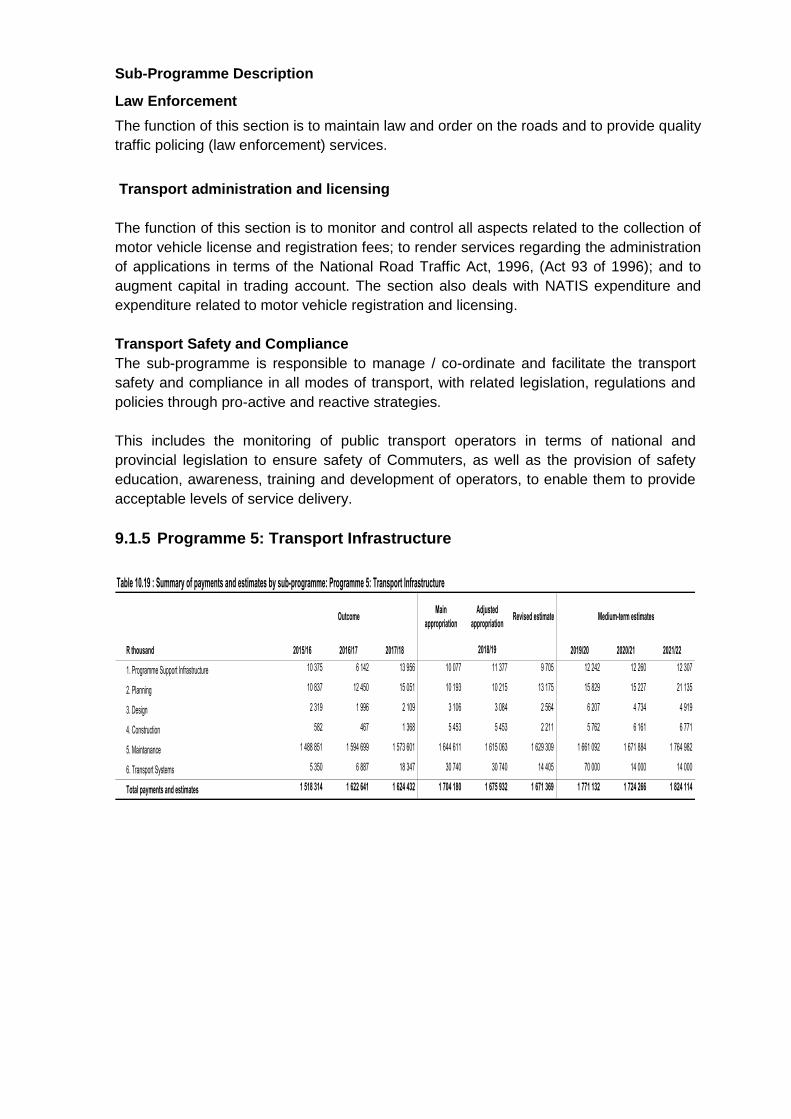
9.1.5 Programme 5: Transport Infrastructure
Table 10.19 : Summary of payments and estimates by sub-programme: Programme 5: Transport Infrastructure
OutcomeMain
appropriation
Adjusted
appropriationRevised estimate Medium-term estimates
R thousand 2015/16 2016/17 2017/18 2019/20 2020/21 2021/22
1. Programme Support Infrastructure 10 375 6 142 13 956 10 077 11 377 9 705 12 242 12 260 12 307
2. Planning 10 837 12 450 15 051 10 193 10 215 13 175 15 829 15 227 21 135
3. Design 2 319 1 996 2 109 3 106 3 084 2 564 6 207 4 734 4 919
4. Construction 582 467 1 368 5 453 5 453 2 211 5 762 6 161 6 771
5. Maintanance 1 488 851 1 594 699 1 573 601 1 644 611 1 615 063 1 629 309 1 661 092 1 671 884 1 764 982
6. Transport Systems 5 350 6 887 18 347 30 740 30 740 14 405 70 000 14 000 14 000
Total payments and estimates 1 518 314 1 622 641 1 624 432 1 704 180 1 675 932 1 671 369 1 771 132 1 724 266 1 824 114
2018/19
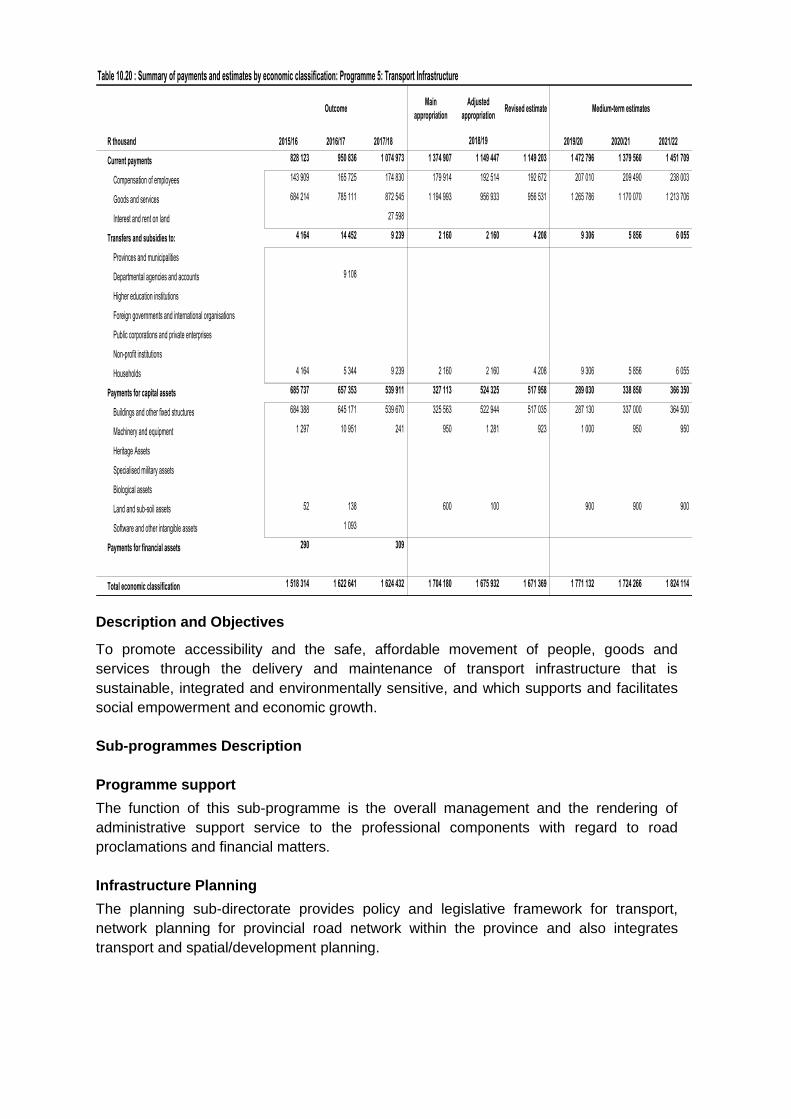
Table 10.20 : Summary of payments and estimates by economic classification: Programme 5: Transport Infrastructure
OutcomeMain
appropriation
Adjusted
appropriationRevised estimate Medium-term estimates
R thousand 2015/16 2016/17 2017/18 2019/20 2020/21 2021/22
Current payments 828 123 950 836 1 074 973 1 374 907 1 149 447 1 149 203 1 472 796 1 379 560 1 451 709
Compensation of employees 143 909 165 725 174 830 179 914 192 514 192 672 207 010 209 490 238 003
Goods and services 684 214 785 111 872 545 1 194 993 956 933 956 531 1 265 786 1 170 070 1 213 706
Interest and rent on land 27 598
Transfers and subsidies to: 4 164 14 452 9 239 2 160 2 160 4 208 9 306 5 856 6 055
Provinces and municipalities
Departmental agencies and accounts 9 108
Higher education institutions
Foreign governments and international organisations
Public corporations and private enterprises
Non-profit institutions
Households 4 164 5 344 9 239 2 160 2 160 4 208 9 306 5 856 6 055
Payments for capital assets 685 737 657 353 539 911 327 113 524 325 517 958 289 030 338 850 366 350
Buildings and other fixed structures 684 388 645 171 539 670 325 563 522 944 517 035 287 130 337 000 364 500
Machinery and equipment 1 297 10 951 241 950 1 281 923 1 000 950 950
Heritage Assets
Specialised military assets
Biological assets
Land and sub-soil assets 52 138 600 100 900 900 900
Software and other intangible assets 1 093
Payments for financial assets 290 309
Total economic classification 1 518 314 1 622 641 1 624 432 1 704 180 1 675 932 1 671 369 1 771 132 1 724 266 1 824 114
2018/19
Description and Objectives
To promote accessibility and the safe, affordable movement of people, goods and
services through the delivery and maintenance of transport infrastructure that is
sustainable, integrated and environmentally sensitive, and which supports and facilitates
social empowerment and economic growth.
Sub-programmes Description
Programme support
The function of this sub-programme is the overall management and the rendering of
administrative support service to the professional components with regard to road
proclamations and financial matters.
Infrastructure Planning
The planning sub-directorate provides policy and legislative framework for transport,
network planning for provincial road network within the province and also integrates
transport and spatial/development planning.
Infrastructure Design
The function of this sub-programme is to provide geometric, material, structural and traffic
engineering designs of provincial road network within the province. It also provides
laboratory, survey, drafting, expropriation, computer and road accident data services as
well as management information systems for the provincial road network.
To determine appropriate standards for the provision and upgrading of essential
infrastructure and ensure adherence to environmental impact assessment on transport
infrastructure projects, route identification and co-ordination of the design of transport
infrastructure facilities. This sub-programme also deals with services which are provided
by the drawing office, survey section, design, land acquisition, expropriation and technical
support.
Construction
To construct and rehabilitate provincial the provincial road network within the Province
through contracts. This sub programme provides the reconstruction, rehabilitation, capacity
increases and geometric improvements, road safety improvements, accessibility and
development projects, public transport facilities, as well as technical support.
Maintenance
To maintain the provincial road network within the Province; the augmentation of roads
capital account (Ordinance 3 of 1962), as well as provide technical support and training.
This sub-programme provides routine maintenance, resealing, bridge maintenance, re-
gravelling, capacity building, laboratory, and the augmentation of the Roads Capital
Account.
Transport Systems
The sub programme is responsible for the management and operations of public transport
systems and the support services required such as Mass Movement system, Intelligent
traffic system etc.
Projects
The list of the roads projects for the MTEF period is reflected in Annexure B.5.
9.3 The programme information
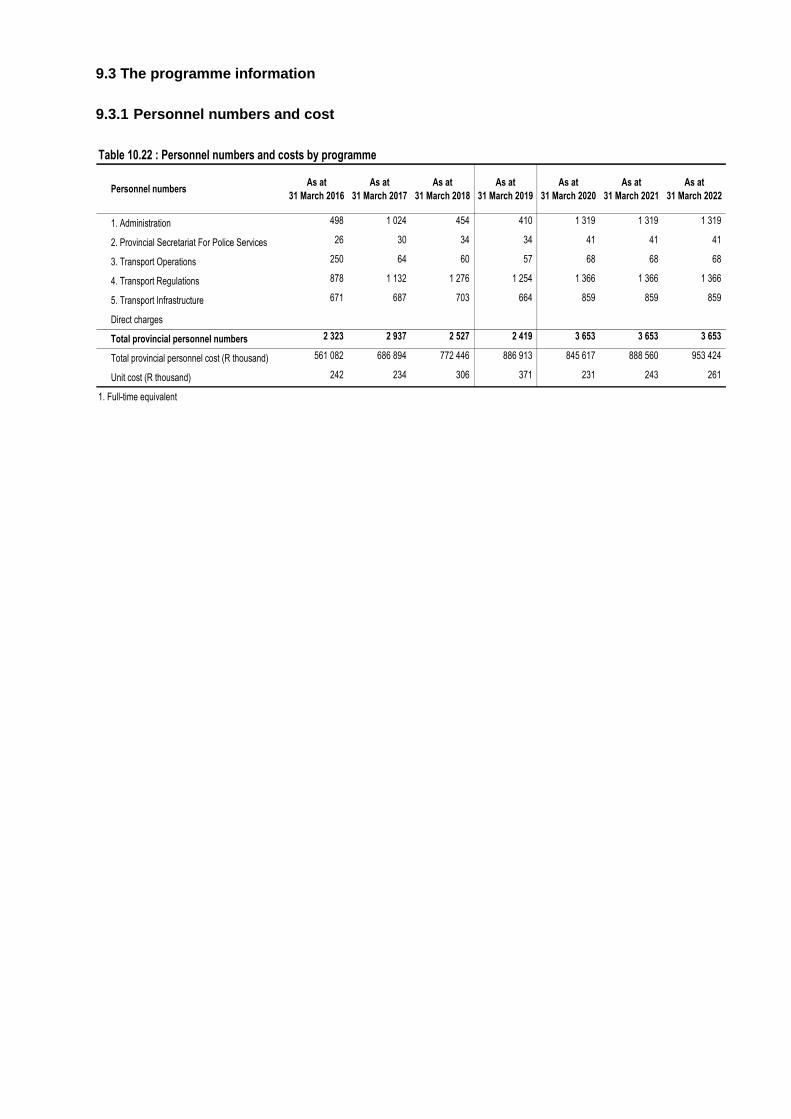
9.3.1 Personnel numbers and cost
Table 10.22 : Personnel numbers and costs by programme
Personnel numbersAs at
31 March 2016
As at
31 March 2017
As at
31 March 2018
As at
31 March 2019
As at
31 March 2020
As at
31 March 2021
As at
31 March 2022
1. Administration 498 1 024 454 410 1 319 1 319 1 319
2. Provincial Secretariat For Police Services 26 30 34 34 41 41 41
3. Transport Operations 250 64 60 57 68 68 68
4. Transport Regulations 878 1 132 1 276 1 254 1 366 1 366 1 366
5. Transport Infrastructure 671 687 703 664 859 859 859
Direct charges
Total provincial personnel numbers 2 323 2 937 2 527 2 419 3 653 3 653 3 653
Total provincial personnel cost (R thousand) 561 082 686 894 772 446 886 913 845 617 888 560 953 424
Unit cost (R thousand) 242 234 306 371 231 243 261
1. Full-time equivalent

Table 10.23 : Summary of departmental personnel numbers and costs by component
Actual Revised estimate Average annual growth over MTEF
R thousands
Personnel
numbers Costs
Personnel
numbers Costs
Personnel
numbers Costs
Filled
posts
Additional
posts
Personnel
numbers Costs
Personnel
numbers Costs
Personnel
numbers Costs
Personnel
numbers Costs
Personnel
Costs
growth
% Costs
of
Salary level
1 – 6 1 421 266 801 1 705 315 761 1 908 318 179 1 506 281 1 787 444 388 2 633 498 570 2 633 530 977 2 633 560 181 14% 8% 55%
7 – 10 476 171 412 526 202 601 517 216 754 524 524 169 826 654 301 742 654 321 355 654 339 031 8% 26% 30%
11 – 12 63 41 972 82 55 818 75 66 363 76 1 77 62 667 94 79 782 94 84 968 94 89 642 7% 13% 9%
13 – 16 29 29 613 29 36 944 27 37 656 31 31 36 014 39 46 112 39 49 110 39 51 812 8% 13% 5%
Other 334 11 128 595 11 202 233 12 741 233 13 569 233 14 315 0% 0% 1%
Total 2 323 520 926 2 937 611 124 2 527 650 154 2 137 282 2 419 712 895 3 653 938 948 3 653 999 979 3 653 1 054 981 15% 14% 100%
Programme
1. Administration 498 111 350 1 024 157 340 454 163 469 129 281 410 251 707 1 319 200 400 1 319 213 426 1 319 225 165 48% -4% 25%
2. Provincial Secretariat For Police Services 26 14 287 30 15 818 34 21 203 34 34 18 392 41 29 009 41 30 894 41 32 595 6% 21% 3%
3. Transport Operations 250 18 893 64 21 689 60 24 280 57 57 18 226 68 29 502 68 31 420 68 33 149 6% 22% 3%
4. Transport Regulations 878 272 643 1 132 326 322 1 276 388 664 1 253 1 1 254 285 204 1 366 446 440 1 366 475 459 1 366 501 609 3% 21% 46%
5. Transport Infrastructure 671 143 909 687 165 725 703 174 830 664 664 139 366 859 233 596 859 248 779 859 262 463 9% 23% 24%
Direct charges 0% 0% 0%
Total 2 323 561 082 2 937 686 894 2 527 772 446 2 137 282 2 419 712 895 3 653 938 948 3 653 999 979 3 653 1 054 981 15% 14% 100%
Employee dispensation classification
Public Service Act appointees not covered by OSDs 2 377 587 065 2 911 723 827 3 033 3 033 508 599 3 033 902 002 3 033 960 632 3 033 1 013 470 0% 26% 96%
Public Service Act appointees still to be covered by OSDs 0% 0% 0%
Professional Nurses, Staff Nurses and Nursing Assistants 0% 0% 0%
Legal Professionals 0% 0% 0%
Social Services Professions 0% 0% 0%
Engineering Professions and related occupations 17 297 41 24 059 271 31 993 58 58 34 659 58 36 946 58 39 347 58 41 511 0% 6% 4%
Medical and related professionals 0% 0% 0%
Therapeutic, Diagnostic and other related Allied Health Professionals 0% 0% 0%
Educators and related professionals 0% 0% 0%
Others such as interns, EPWP, learnerships, etc 0% 0% 0%
Total 17 297 2 418 611 124 3 182 755 820 3 091 3 091 543 258 3 091 938 948 3 091 999 979 3 091 1 054 981 0% 25% 100%
2020/21 2021/22 2018/19 - 2021/22
Medium-term expenditure estimate
2015/16 2016/17 2017/18 2018/19 2019/20
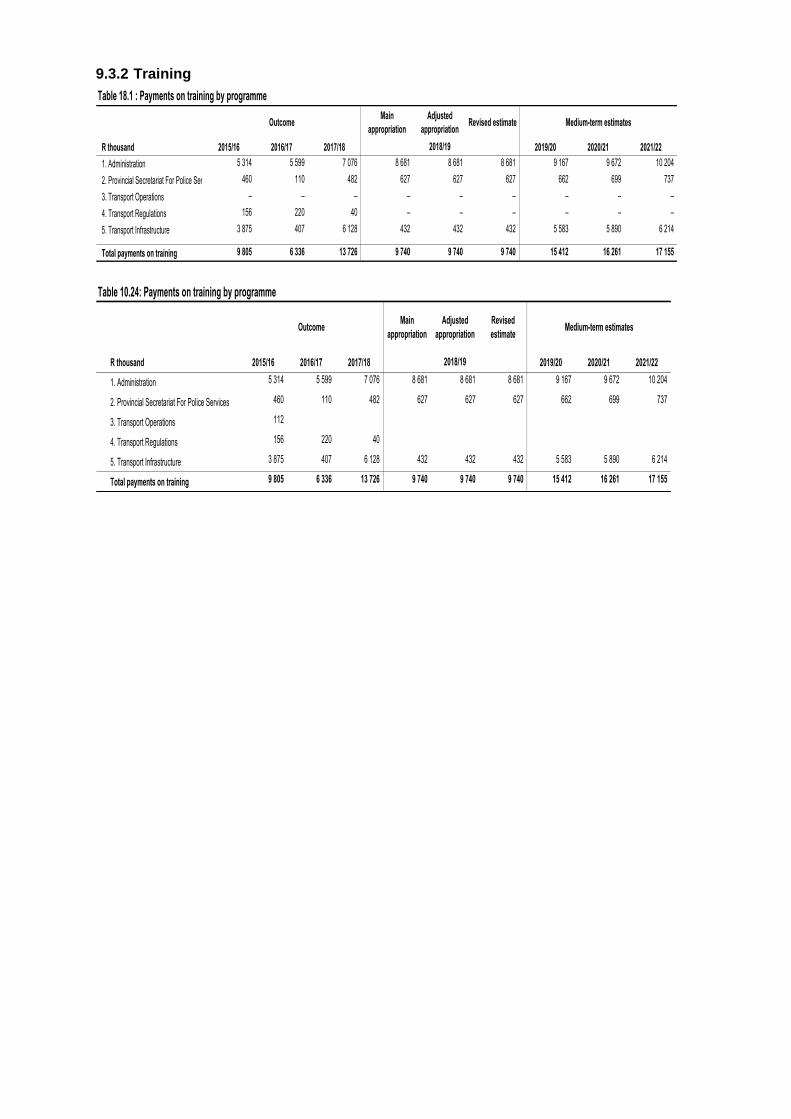
9.3.2 Training
Table 18.1 : Payments on training by programme
OutcomeMain
appropriation
Adjusted
appropriationRevised estimate Medium-term estimates
R thousand 2015/16 2016/17 2017/18 2019/20 2020/21 2021/22
1. Administration 5 314 5 599 7 076 8 681 8 681 8 681 9 167 9 672 10 204
2. Provincial Secretariat For Police Services 460 110 482 627 627 627 662 699 737
3. Transport Operations – – – – – – – – –
4. Transport Regulations 156 220 40 – – – – – –
5. Transport Infrastructure 3 875 407 6 128 432 432 432 5 583 5 890 6 214
Total payments on training 9 805 6 336 13 726 9 740 9 740 9 740 15 412 16 261 17 155
2018/19
Table 10.24: Payments on training by programme
OutcomeMain
appropriation
Adjusted
appropriation
Revised
estimateMedium-term estimates
R thousand 2015/16 2016/17 2017/18 2019/20 2020/21 2021/22
1. Administration 5 314 5 599 7 076 8 681 8 681 8 681 9 167 9 672 10 204
2. Provincial Secretariat For Police Services 460 110 482 627 627 627 662 699 737
3. Transport Operations 112
4. Transport Regulations 156 220 40
5. Transport Infrastructure 3 875 407 6 128 432 432 432 5 583 5 890 6 214
Total payments on training 9 805 6 336 13 726 9 740 9 740 9 740 15 412 16 261 17 155
2018/19
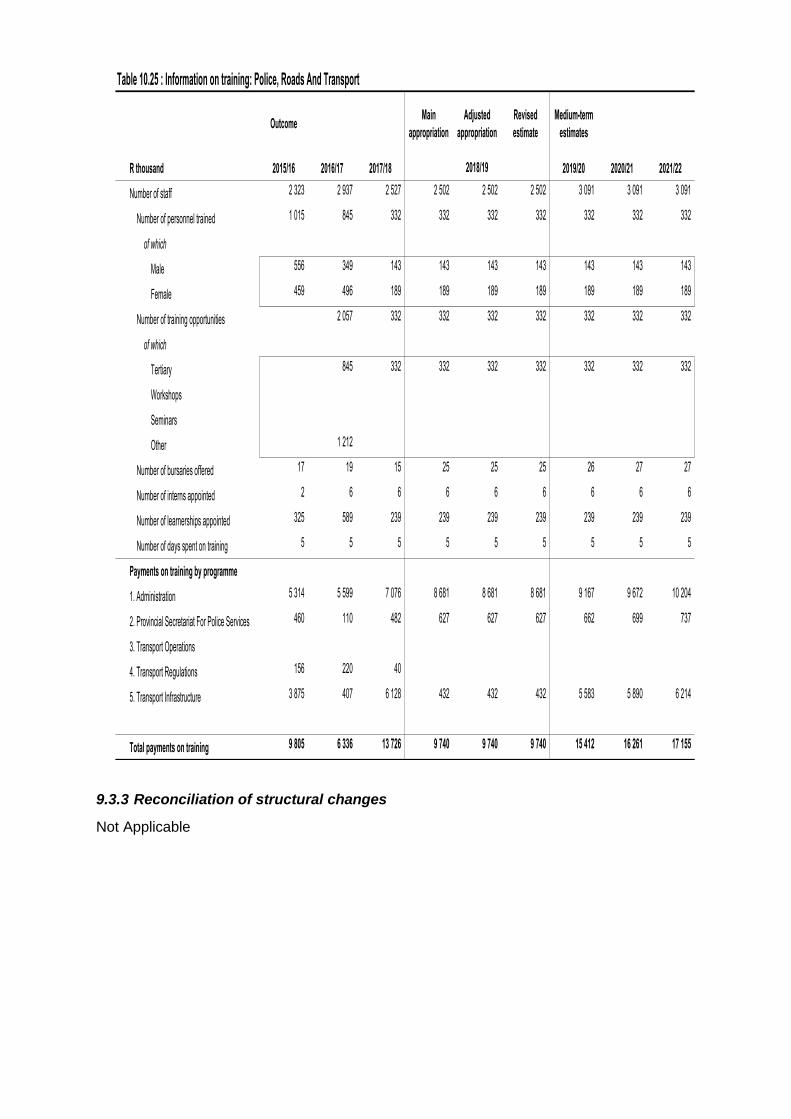
Table 10.25 : Information on training: Police, Roads And Transport
OutcomeMain
appropriation
Adjusted
appropriation
Revised
estimate
Medium-term
estimates
R thousand 2015/16 2016/17 2017/18 2019/20 2020/21 2021/22
Number of staff 2 323 2 937 2 527 2 502 2 502 2 502 3 091 3 091 3 091
Number of personnel trained 1 015 845 332 332 332 332 332 332 332
of which
Male 556 349 143 143 143 143 143 143 143
Female 459 496 189 189 189 189 189 189 189
Number of training opportunities 2 057 332 332 332 332 332 332 332
of which
Tertiary 845 332 332 332 332 332 332 332
Workshops
Seminars
Other 1 212
Number of bursaries offered 17 19 15 25 25 25 26 27 27
Number of interns appointed 2 6 6 6 6 6 6 6 6
Number of learnerships appointed 325 589 239 239 239 239 239 239 239
Number of days spent on training 5 5 5 5 5 5 5 5 5
Payments on training by programme
1. Administration 5 314 5 599 7 076 8 681 8 681 8 681 9 167 9 672 10 204
2. Provincial Secretariat For Police Services 460 110 482 627 627 627 662 699 737
3. Transport Operations
4. Transport Regulations 156 220 40
5. Transport Infrastructure 3 875 407 6 128 432 432 432 5 583 5 890 6 214
Total payments on training 9 805 6 336 13 726 9 740 9 740 9 740 15 412 16 261 17 155
2018/19
9.3.3 Reconciliation of structural changes
Not Applicable
Annexure to the Estimates of Provincial
Revenue and Expenditure
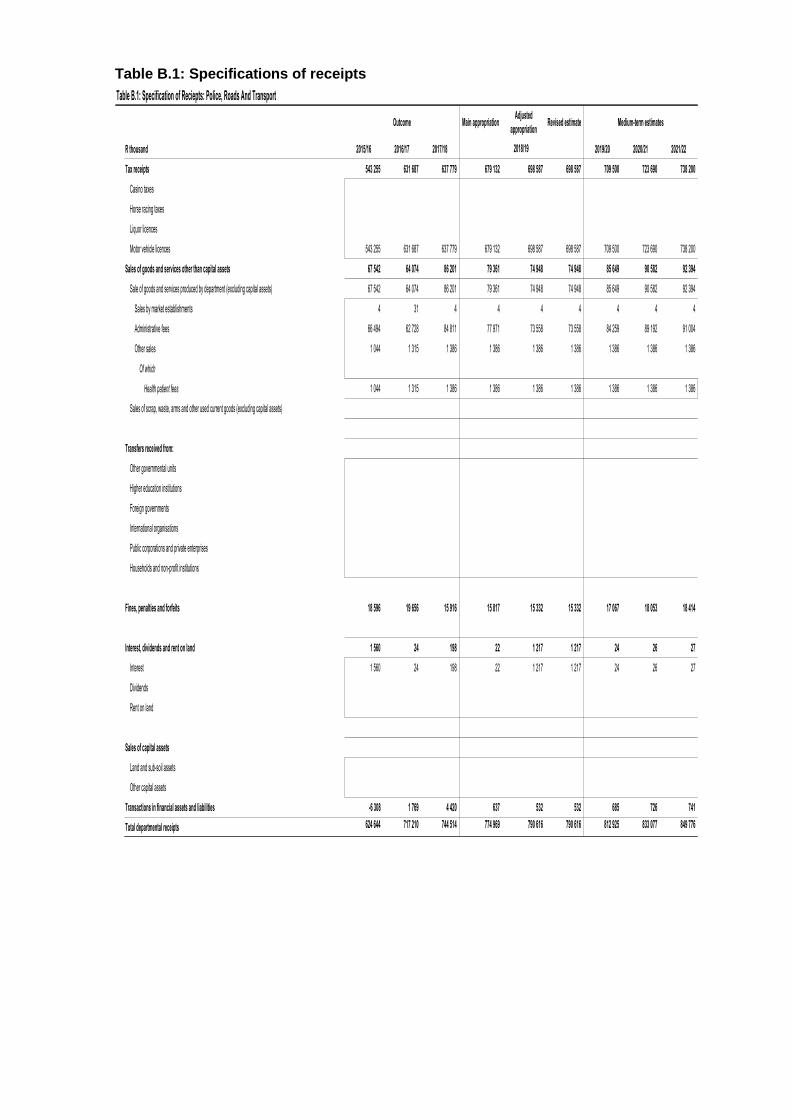
Table B.1: Specifications of receipts
Table B.1: Specification of Reciepts: Police, Roads And Transport
Outcome Main appropriationAdjusted
appropriationRevised estimate Medium-term estimates
R thousand 2015/16 2016/17 2017/18 2019/20 2020/21 2021/22
Tax receipts 543 255 631 687 637 779 679 132 698 587 698 587 709 500 723 690 738 200
Casino taxes
Horse racing taxes
Liquor licences
Motor vehicle licences 543 255 631 687 637 779 679 132 698 587 698 587 709 500 723 690 738 200
Sales of goods and services other than capital assets 67 542 64 074 86 201 79 361 74 948 74 948 85 649 90 582 92 394
Sale of goods and services produced by department (excluding capital assets) 67 542 64 074 86 201 79 361 74 948 74 948 85 649 90 582 92 394
Sales by market establishments 4 31 4 4 4 4 4 4 4
Administrative fees 66 494 62 728 84 811 77 971 73 558 73 558 84 259 89 192 91 004
Other sales 1 044 1 315 1 386 1 386 1 386 1 386 1 386 1 386 1 386
Of which
Health patient fees 1 044 1 315 1 386 1 386 1 386 1 386 1 386 1 386 1 386
Sales of scrap, waste, arms and other used current goods (excluding capital assets)
Transfers received from:
Other governmental units
Higher education institutions
Foreign governments
International organisations
Public corporations and private enterprises
Households and non-profit institutions
Fines, penalties and forfeits 18 596 19 656 15 916 15 817 15 332 15 332 17 067 18 053 18 414
Interest, dividends and rent on land 1 560 24 198 22 1 217 1 217 24 26 27
Interest 1 560 24 198 22 1 217 1 217 24 26 27
Dividends
Rent on land
Sales of capital assets
Land and sub-soil assets
Other capital assets
Transactions in financial assets and liabilities -6 308 1 769 4 420 637 532 532 685 726 741
Total departmental receipts 624 644 717 210 744 514 774 969 790 616 790 616 812 925 833 077 849 776
2018/19
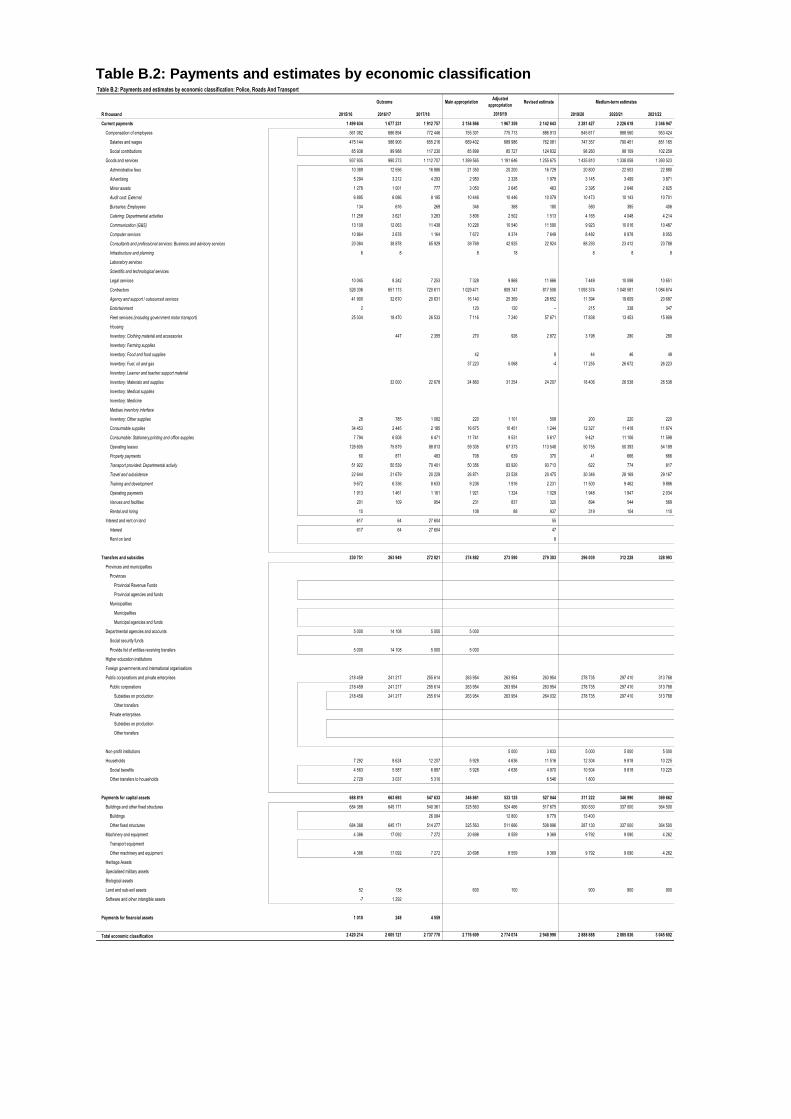
Table B.2: Payments and estimates by economic classification Table B.2: Payments and estimates by economic classification: Police, Roads And Transport
Outcome Main appropriationAdjusted
appropriationRevised estimate Medium-term estimates
R thousand 2015/16 2016/17 2017/18 2019/20 2020/21 2021/22
Current payments 1 499 634 1 677 231 1 912 757 2 154 866 1 967 359 2 142 643 2 281 427 2 226 618 2 346 947
Compensation of employees 561 082 686 894 772 446 755 301 775 713 886 913 845 617 888 560 953 424
Salaries and wages 475 144 586 906 655 216 669 402 689 986 762 081 747 357 790 451 851 165
Social contributions 85 938 99 988 117 230 85 899 85 727 124 832 98 260 98 109 102 259
Goods and services 937 935 990 273 1 112 707 1 399 565 1 191 646 1 255 675 1 435 810 1 338 058 1 393 523
Administrative fees 10 389 12 556 16 886 21 350 20 200 16 729 20 800 22 503 22 880
Advertising 5 294 3 212 4 293 2 950 2 328 1 978 3 145 3 499 3 871
Minor assets 1 278 1 001 777 3 050 2 645 463 2 395 2 648 2 825
Audit cost: External 6 895 6 086 8 195 10 446 10 446 10 079 10 473 10 143 10 701
Bursaries: Employees 134 616 269 346 368 180 580 385 406
Catering: Departmental activities 11 259 3 621 3 283 3 806 2 502 1 513 4 165 4 048 4 214
Communication (G&S) 13 109 12 063 11 438 10 226 10 540 11 590 9 923 10 016 10 487
Computer services 10 864 2 678 1 164 7 672 9 374 7 649 8 482 8 978 8 055
Consultants and professional services: Business and advisory services 20 084 38 878 65 929 39 769 42 925 22 924 88 293 23 412 23 788
Infrastructure and planning 6 8 8 18 8 8 8
Laboratory services
Scientific and technological services
Legal services 10 045 8 242 7 253 7 328 9 868 11 666 7 449 10 098 10 651
Contractors 526 336 651 113 720 611 1 029 471 809 747 817 506 1 093 374 1 040 581 1 084 674
Agency and support / outsourced services 41 900 32 670 20 631 16 140 25 369 28 652 11 394 19 609 20 687
Entertainment 2 120 120 – 215 338 347
Fleet services (including government motor transport) 25 034 18 470 26 533 7 116 7 240 57 671 17 838 13 453 15 909
Housing
Inventory: Clothing material and accessories 447 2 355 270 926 2 872 3 198 280 280
Inventory: Farming supplies
Inventory: Food and food supplies 42 8 44 46 49
Inventory: Fuel, oil and gas 37 223 5 068 -4 17 255 26 672 26 223
Inventory: Learner and teacher support material
Inventory: Materials and supplies 32 000 22 678 24 860 31 254 24 207 18 406 26 538 26 538
Inventory: Medical supplies
Inventory: Medicine
Medsas inventory interface
Inventory: Other supplies 26 785 1 082 220 1 101 508 200 220 220
Consumable supplies 34 453 2 445 2 185 16 675 10 451 1 244 12 327 11 418 11 674
Consumable: Stationery,printing and office supplies 7 794 6 508 6 471 11 741 9 531 5 617 9 421 11 106 11 598
Operating leases 126 605 75 879 88 813 59 305 67 373 113 548 50 755 50 393 54 189
Property payments 60 871 483 708 639 370 41 666 666
Transport provided: Departmental activity 51 922 50 539 70 401 50 356 83 920 93 713 622 774 817
Travel and subsistence 22 644 21 679 20 229 26 871 23 528 20 475 30 346 28 169 29 167
Training and development 9 672 6 336 8 633 9 236 1 916 2 231 11 500 9 462 9 886
Operating payments 1 913 1 461 1 161 1 921 1 324 1 029 1 948 1 947 2 034
Venues and facilities 201 109 954 231 837 320 894 544 569
Rental and hiring 15 108 88 937 319 104 110
Interest and rent on land 617 64 27 604 55
Interest 617 64 27 604 47
Rent on land 8
Transfers and subsidies 230 751 263 949 272 821 274 882 273 590 279 303 296 039 312 228 328 993
Provinces and municipalities
Provinces
Provincial Revenue Funds
Provincial agencies and funds
Municipalities
Municipalities
Municipal agencies and funds
Departmental agencies and accounts 5 000 14 108 5 000 5 000
Social security funds
Provide list of entities receiving transfers 5 000 14 108 5 000 5 000
Higher education institutions
Foreign governments and international organisations
Public corporations and private enterprises 218 459 241 217 255 614 263 954 263 954 263 954 278 735 297 410 313 768
Public corporations 218 459 241 217 255 614 263 954 263 954 263 954 278 735 297 410 313 768
Subsidies on production 218 459 241 217 255 614 263 954 263 954 264 032 278 735 297 410 313 768
Other transfers
Private enterprises
Subsidies on production
Other transfers
Non-profit institutions 5 000 3 833 5 000 5 000 5 000
Households 7 292 8 624 12 207 5 928 4 636 11 516 12 304 9 818 10 225
Social benefits 4 563 5 587 6 897 5 928 4 636 4 970 10 504 9 818 10 225
Other transfers to households 2 729 3 037 5 310 6 546 1 800
Payments for capital assets 688 819 663 693 547 633 346 861 533 125 527 044 311 222 346 990 369 662
Buildings and other fixed structures 684 388 645 171 540 361 325 563 524 466 517 675 300 530 337 000 364 500
Buildings 26 084 12 800 8 779 13 400
Other fixed structures 684 388 645 171 514 277 325 563 511 666 508 896 287 130 337 000 364 500
Machinery and equipment 4 386 17 092 7 272 20 698 8 559 9 369 9 792 9 090 4 262
Transport equipment
Other machinery and equipment 4 386 17 092 7 272 20 698 8 559 9 369 9 792 9 090 4 262
Heritage Assets
Specialised military assets
Biological assets
Land and sub-soil assets 52 138 600 100 900 900 900
Software and other intangible assets -7 1 292
Payments for financial assets 1 010 248 4 559
Total economic classification 2 420 214 2 605 121 2 737 770 2 776 609 2 774 074 2 948 990 2 888 688 2 885 836 3 045 602
2018/19
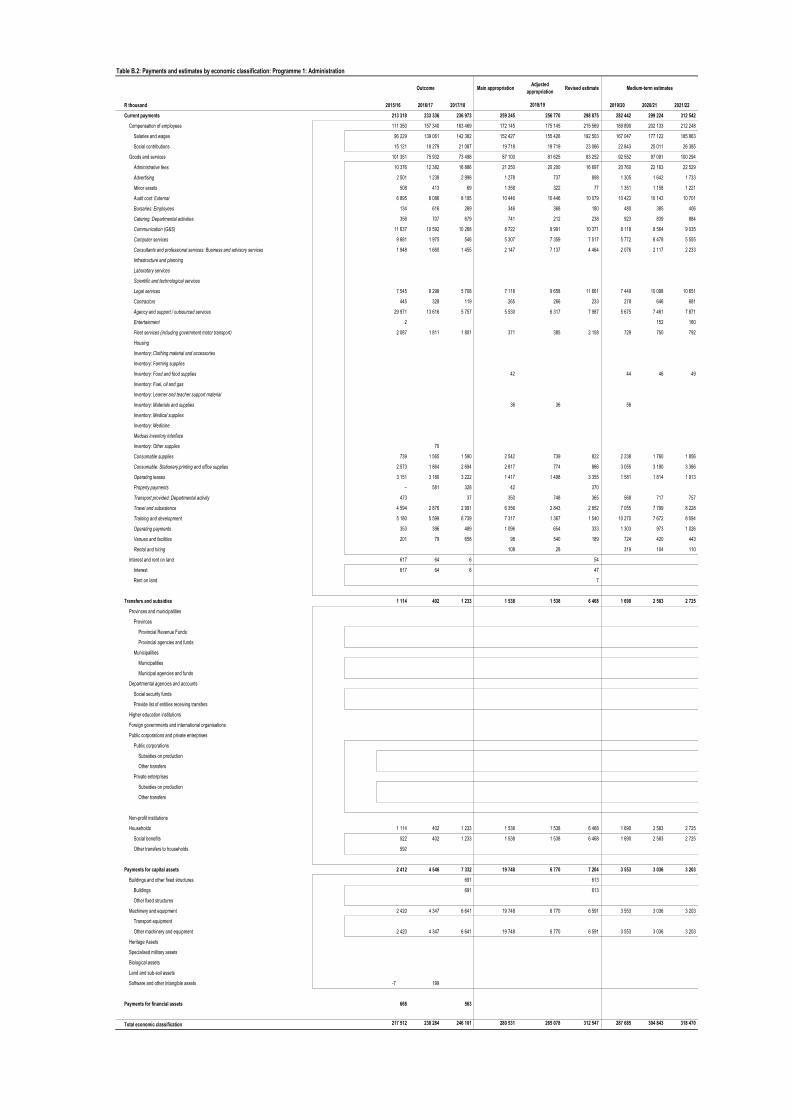
Table B.2: Payments and estimates by economic classification: Programme 1: Administration
Outcome Main appropriationAdjusted
appropriationRevised estimate Medium-term estimates
R thousand 2015/16 2016/17 2017/18 2019/20 2020/21 2021/22
Current payments 213 318 233 336 236 973 259 245 256 770 298 875 282 442 299 224 312 542
Compensation of employees 111 350 157 340 163 469 172 145 175 145 215 569 189 890 202 133 212 248
Salaries and wages 96 229 139 061 142 382 152 427 155 426 192 503 167 047 177 122 185 863
Social contributions 15 121 18 279 21 087 19 718 19 719 23 066 22 843 25 011 26 385
Goods and services 101 351 75 932 73 498 87 100 81 625 83 252 92 552 97 091 100 294
Administrative fees 10 376 12 382 16 886 21 250 20 200 16 697 20 760 22 163 22 529
Advertising 2 501 1 238 2 998 1 278 737 898 1 305 1 642 1 733
Minor assets 508 413 69 1 358 322 77 1 351 1 158 1 221
Audit cost: External 6 895 6 086 8 195 10 446 10 446 10 079 10 423 10 143 10 701
Bursaries: Employees 134 616 269 346 368 180 480 385 406
Catering: Departmental activities 356 707 679 741 212 238 923 839 884
Communication (G&S) 11 637 10 592 10 268 8 722 8 991 10 371 8 118 8 564 9 035
Computer services 9 681 1 975 546 5 307 7 359 7 517 5 772 6 478 5 555
Consultants and professional services: Business and advisory services 1 948 1 660 1 455 2 147 7 137 4 464 2 076 2 117 2 233
Infrastructure and planning
Laboratory services
Scientific and technological services
Legal services 7 545 8 298 5 708 7 118 9 658 11 661 7 449 10 098 10 651
Contractors 445 328 119 265 266 233 278 646 681
Agency and support / outsourced services 29 971 13 616 5 757 5 530 6 317 7 987 5 675 7 461 7 871
Entertainment 2 152 160
Fleet services (including government motor transport) 2 087 1 811 1 801 371 385 2 158 729 750 792
Housing
Inventory: Clothing material and accessories
Inventory: Farming supplies
Inventory: Food and food supplies 42 44 46 49
Inventory: Fuel, oil and gas
Inventory: Learner and teacher support material
Inventory: Materials and supplies 36 36 56
Inventory: Medical supplies
Inventory: Medicine
Medsas inventory interface
Inventory: Other supplies 70
Consumable supplies 739 1 565 1 590 2 542 739 822 2 238 1 760 1 856
Consumable: Stationery,printing and office supplies 2 573 1 864 2 694 2 817 774 866 3 055 3 190 3 366
Operating leases 3 151 3 180 3 222 1 417 1 498 3 355 1 581 1 814 1 913
Property payments – 581 328 42 370
Transport provided: Departmental activity 473 37 350 748 365 568 717 757
Travel and subsistence 4 594 2 876 2 991 6 356 2 843 2 852 7 055 7 799 8 228
Training and development 5 180 5 599 6 739 7 317 1 367 1 540 10 270 7 672 8 094
Operating payments 353 396 489 1 096 654 333 1 303 973 1 026
Venues and facilities 201 79 658 98 540 189 724 420 443
Rental and hiring 108 28 319 104 110
Interest and rent on land 617 64 6 54
Interest 617 64 6 47
Rent on land 7
Transfers and subsidies 1 114 402 1 233 1 538 1 538 6 468 1 690 2 583 2 725
Provinces and municipalities
Provinces
Provincial Revenue Funds
Provincial agencies and funds
Municipalities
Municipalities
Municipal agencies and funds
Departmental agencies and accounts
Social security funds
Provide list of entities receiving transfers
Higher education institutions
Foreign governments and international organisations
Public corporations and private enterprises
Public corporations
Subsidies on production
Other transfers
Private enterprises
Subsidies on production
Other transfers
Non-profit institutions
Households 1 114 402 1 233 1 538 1 538 6 468 1 690 2 583 2 725
Social benefits 522 402 1 233 1 538 1 538 6 468 1 690 2 583 2 725
Other transfers to households 592
Payments for capital assets 2 412 4 546 7 332 19 748 6 770 7 204 3 553 3 036 3 203
Buildings and other fixed structures 691 613
Buildings 691 613
Other fixed structures
Machinery and equipment 2 420 4 347 6 641 19 748 6 770 6 591 3 553 3 036 3 203
Transport equipment
Other machinery and equipment 2 420 4 347 6 641 19 748 6 770 6 591 3 553 3 036 3 203
Heritage Assets
Specialised military assets
Biological assets
Land and sub-soil assets
Software and other intangible assets -7 199
Payments for financial assets 668 563
Total economic classification 217 512 238 284 246 101 280 531 265 078 312 547 287 685 304 843 318 470
2018/19
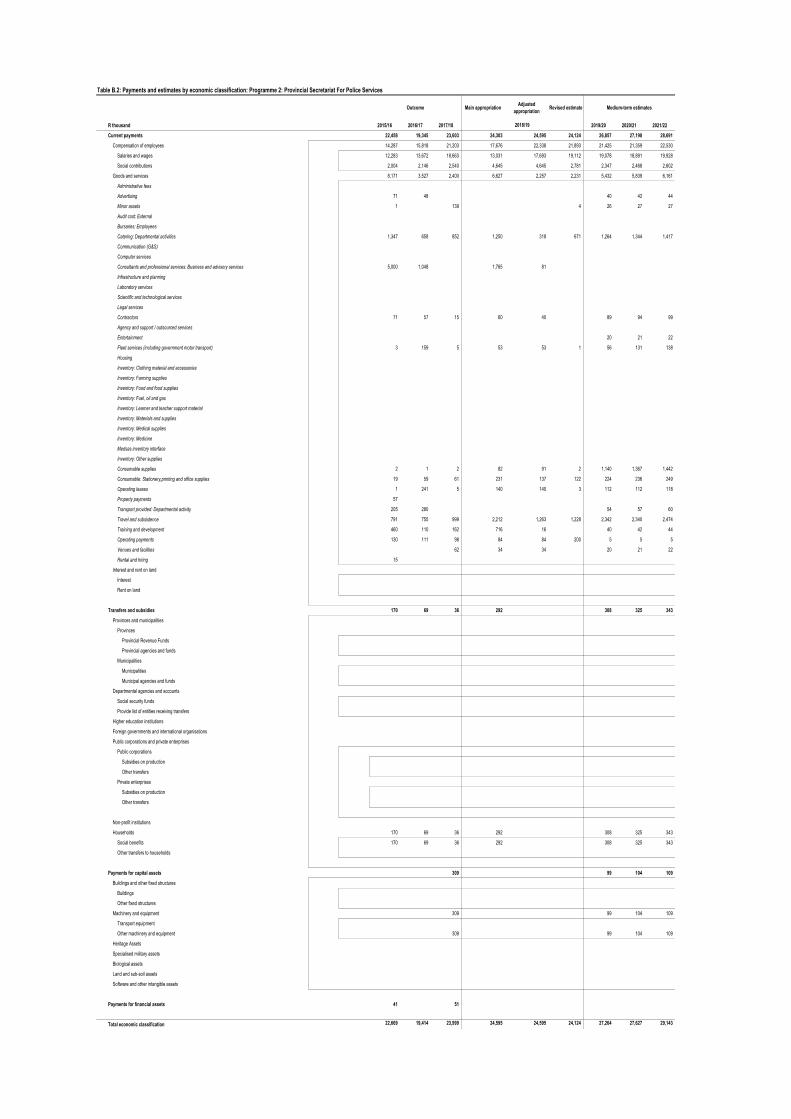
Table B.2: Payments and estimates by economic classification: Programme 2: Provincial Secretariat For Police Services
Outcome Main appropriationAdjusted
appropriationRevised estimate Medium-term estimates
R thousand 2015/16 2016/17 2017/18 2019/20 2020/21 2021/22
Current payments 22,458 19,345 23,603 24,303 24,595 24,124 26,857 27,198 28,691
Compensation of employees 14,287 15,818 21,203 17,676 22,338 21,893 21,425 21,359 22,530
Salaries and wages 12,283 13,672 18,663 13,031 17,693 19,112 19,078 18,891 19,928
Social contributions 2,004 2,146 2,540 4,645 4,645 2,781 2,347 2,468 2,602
Goods and services 8,171 3,527 2,400 6,627 2,257 2,231 5,432 5,839 6,161
Administrative fees
Advertising 71 48 40 42 44
Minor assets 1 139 4 26 27 27
Audit cost: External
Bursaries: Employees
Catering: Departmental activities 1,347 658 852 1,250 318 671 1,264 1,344 1,417
Communication (G&S)
Computer services
Consultants and professional services: Business and advisory services 5,000 1,048 1,765 81
Infrastructure and planning
Laboratory services
Scientific and technological services
Legal services
Contractors 71 57 15 60 40 89 94 99
Agency and support / outsourced services
Entertainment 20 21 22
Fleet services (including government motor transport) 3 159 5 53 53 1 56 131 138
Housing
Inventory: Clothing material and accessories
Inventory: Farming supplies
Inventory: Food and food supplies
Inventory: Fuel, oil and gas
Inventory: Learner and teacher support material
Inventory: Materials and supplies
Inventory: Medical supplies
Inventory: Medicine
Medsas inventory interface
Inventory: Other supplies
Consumable supplies 2 1 2 82 91 2 1,140 1,367 1,442
Consumable: Stationery,printing and office supplies 19 59 61 231 137 122 224 236 249
Operating leases 1 241 5 140 140 3 112 112 118
Property payments 57
Transport provided: Departmental activity 205 280 54 57 60
Travel and subsistence 791 755 999 2,212 1,263 1,228 2,342 2,340 2,474
Training and development 460 110 162 716 16 40 42 44
Operating payments 130 111 98 84 84 200 5 5 5
Venues and facilities 62 34 34 20 21 22
Rental and hiring 15
Interest and rent on land
Interest
Rent on land
Transfers and subsidies 170 69 36 292 308 325 343
Provinces and municipalities
Provinces
Provincial Revenue Funds
Provincial agencies and funds
Municipalities
Municipalities
Municipal agencies and funds
Departmental agencies and accounts
Social security funds
Provide list of entities receiving transfers
Higher education institutions
Foreign governments and international organisations
Public corporations and private enterprises
Public corporations
Subsidies on production
Other transfers
Private enterprises
Subsidies on production
Other transfers
Non-profit institutions
Households 170 69 36 292 308 325 343
Social benefits 170 69 36 292 308 325 343
Other transfers to households
Payments for capital assets 309 99 104 109
Buildings and other fixed structures
Buildings
Other fixed structures
Machinery and equipment 309 99 104 109
Transport equipment
Other machinery and equipment 309 99 104 109
Heritage Assets
Specialised military assets
Biological assets
Land and sub-soil assets
Software and other intangible assets
Payments for financial assets 41 51
Total economic classification 22,669 19,414 23,999 24,595 24,595 24,124 27,264 27,627 29,143
2018/19
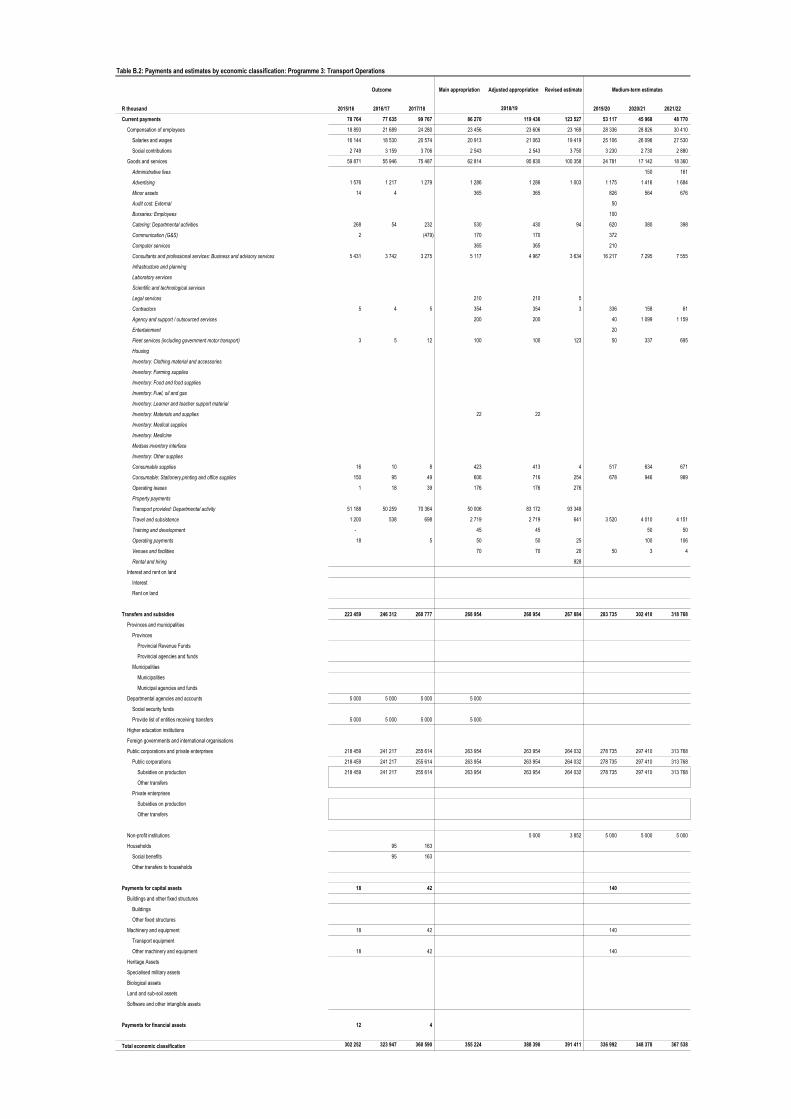
Table B.2: Payments and estimates by economic classification: Programme 3: Transport Operations
Outcome Main appropriation Adjusted appropriation Revised estimate Medium-term estimates
R thousand 2015/16 2016/17 2017/18 2019/20 2020/21 2021/22
Current payments 78 764 77 635 99 767 86 270 119 436 123 527 53 117 45 968 48 770
Compensation of employees 18 893 21 689 24 280 23 456 23 606 23 169 28 336 28 826 30 410
Salaries and wages 16 144 18 530 20 574 20 913 21 063 19 419 25 106 26 096 27 530
Social contributions 2 749 3 159 3 706 2 543 2 543 3 750 3 230 2 730 2 880
Goods and services 59 871 55 946 75 487 62 814 95 830 100 358 24 781 17 142 18 360
Administrative fees 150 161
Advertising 1 576 1 217 1 279 1 286 1 286 1 003 1 175 1 416 1 684
Minor assets 14 4 365 365 826 564 676
Audit cost: External 50
Bursaries: Employees 100
Catering: Departmental activities 268 54 232 530 430 94 620 380 398
Communication (G&S) 2 (479) 170 170 372
Computer services 365 365 210
Consultants and professional services: Business and advisory services 5 431 3 742 3 275 5 117 4 967 3 634 16 217 7 295 7 555
Infrastructure and planning
Laboratory services
Scientific and technological services
Legal services 210 210 5
Contractors 5 4 5 354 354 3 336 158 61
Agency and support / outsourced services 200 200 40 1 099 1 159
Entertainment 20
Fleet services (including government motor transport) 3 5 12 100 100 123 50 337 695
Housing
Inventory: Clothing material and accessories
Inventory: Farming supplies
Inventory: Food and food supplies
Inventory: Fuel, oil and gas
Inventory: Learner and teacher support material
Inventory: Materials and supplies 22 22
Inventory: Medical supplies
Inventory: Medicine
Medsas inventory interface
Inventory: Other supplies
Consumable supplies 16 10 8 423 413 4 517 634 671
Consumable: Stationery,printing and office supplies 150 95 49 606 716 254 678 946 989
Operating leases 1 18 39 176 176 276
Property payments
Transport provided: Departmental activity 51 188 50 259 70 364 50 006 83 172 93 348
Travel and subsistence 1 200 538 698 2 719 2 719 641 3 520 4 010 4 151
Training and development - 45 45 50 50
Operating payments 18 5 50 50 25 100 106
Venues and facilities 70 70 20 50 3 4
Rental and hiring 928
Interest and rent on land
Interest
Rent on land
Transfers and subsidies 223 459 246 312 260 777 268 954 268 954 267 884 283 735 302 410 318 768
Provinces and municipalities
Provinces
Provincial Revenue Funds
Provincial agencies and funds
Municipalities
Municipalities
Municipal agencies and funds
Departmental agencies and accounts 5 000 5 000 5 000 5 000
Social security funds
Provide list of entities receiving transfers 5 000 5 000 5 000 5 000
Higher education institutions
Foreign governments and international organisations
Public corporations and private enterprises 218 459 241 217 255 614 263 954 263 954 264 032 278 735 297 410 313 768
Public corporations 218 459 241 217 255 614 263 954 263 954 264 032 278 735 297 410 313 768
Subsidies on production 218 459 241 217 255 614 263 954 263 954 264 032 278 735 297 410 313 768
Other transfers
Private enterprises
Subsidies on production
Other transfers
Non-profit institutions 5 000 3 852 5 000 5 000 5 000
Households 95 163
Social benefits 95 163
Other transfers to households
Payments for capital assets 18 42 140
Buildings and other fixed structures
Buildings
Other fixed structures
Machinery and equipment 18 42 140
Transport equipment
Other machinery and equipment 18 42 140
Heritage Assets
Specialised military assets
Biological assets
Land and sub-soil assets
Software and other intangible assets
Payments for financial assets 12 4
Total economic classification 302 252 323 947 360 590 355 224 388 390 391 411 336 992 348 378 367 538
2018/19
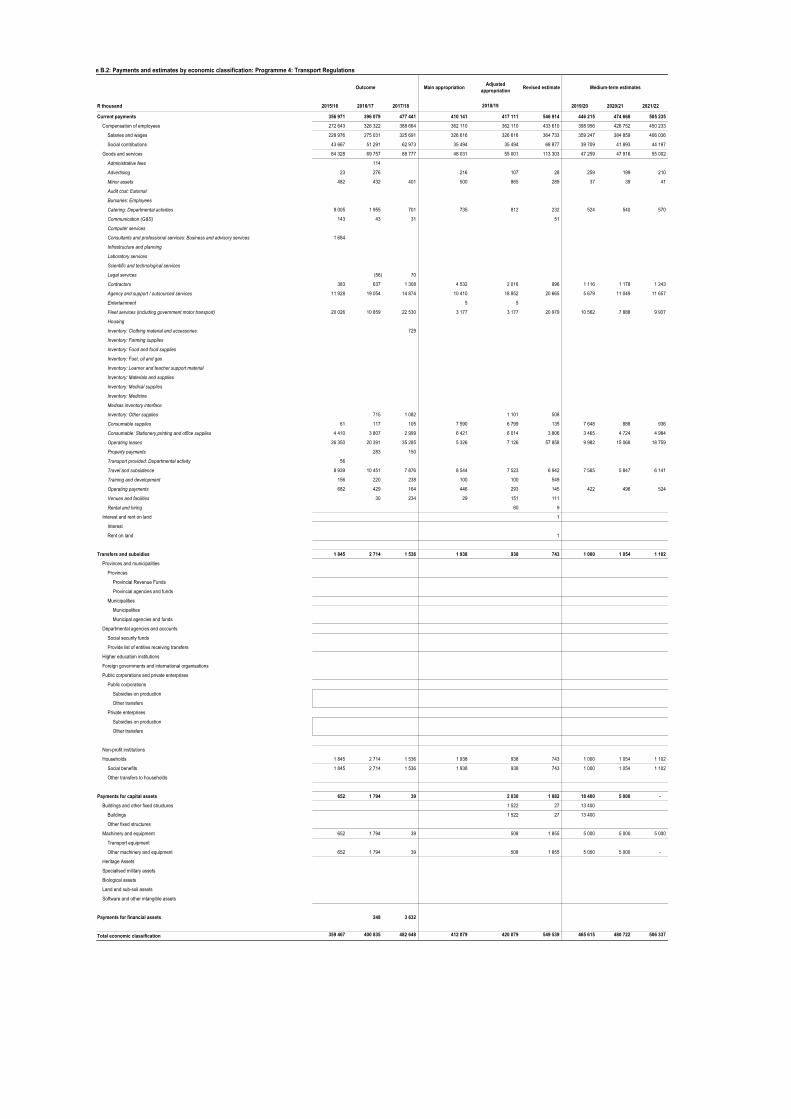
Table B.2: Payments and estimates by economic classification: Programme 4: Transport Regulations
Outcome Main appropriationAdjusted
appropriationRevised estimate Medium-term estimates
R thousand 2015/16 2016/17 2017/18 2019/20 2020/21 2021/22
Current payments 356 971 396 079 477 441 410 141 417 111 546 914 446 215 474 668 505 235
Compensation of employees 272 643 326 322 388 664 362 110 362 110 433 610 398 956 426 752 450 233
Salaries and wages 228 976 275 031 325 691 326 616 326 616 364 733 359 247 384 859 406 036
Social contributions 43 667 51 291 62 973 35 494 35 494 68 877 39 709 41 893 44 197
Goods and services 84 328 69 757 88 777 48 031 55 001 113 303 47 259 47 916 55 002
Administrative fees 114
Advertising 23 276 216 107 28 259 199 210
Minor assets 482 432 401 500 865 289 37 39 41
Audit cost: External
Bursaries: Employees
Catering: Departmental activities 9 005 1 955 701 735 812 232 524 540 570
Communication (G&S) 143 43 31 51
Computer services
Consultants and professional services: Business and advisory services 1 684
Infrastructure and planning
Laboratory services
Scientific and technological services
Legal services (56) 70
Contractors 383 637 1 308 4 532 2 016 996 1 116 1 178 1 243
Agency and support / outsourced services 11 928 19 054 14 874 10 410 18 852 20 665 5 679 11 049 11 657
Entertainment 5 5
Fleet services (including government motor transport) 20 026 10 859 22 530 3 177 3 177 20 979 10 562 7 888 9 937
Housing
Inventory: Clothing material and accessories 729
Inventory: Farming supplies
Inventory: Food and food supplies
Inventory: Fuel, oil and gas
Inventory: Learner and teacher support material
Inventory: Materials and supplies
Inventory: Medical supplies
Inventory: Medicine
Medsas inventory interface
Inventory: Other supplies 715 1 082 1 101 508
Consumable supplies 61 117 105 7 590 6 799 135 7 648 888 936
Consumable: Stationery,printing and office supplies 4 410 3 807 2 999 6 421 6 014 3 806 3 465 4 724 4 984
Operating leases 26 350 20 391 35 285 5 326 7 126 57 858 9 982 15 068 18 759
Property payments 283 150
Transport provided: Departmental activity 56
Travel and subsistence 8 939 10 451 7 876 8 544 7 523 6 942 7 565 5 847 6 141
Training and development 156 220 238 100 100 549
Operating payments 682 429 164 446 293 145 422 496 524
Venues and facilities 30 234 29 151 111
Rental and hiring 60 9
Interest and rent on land 1
Interest
Rent on land 1
Transfers and subsidies 1 845 2 714 1 536 1 938 938 743 1 000 1 054 1 102
Provinces and municipalities
Provinces
Provincial Revenue Funds
Provincial agencies and funds
Municipalities
Municipalities
Municipal agencies and funds
Departmental agencies and accounts
Social security funds
Provide list of entities receiving transfers
Higher education institutions
Foreign governments and international organisations
Public corporations and private enterprises
Public corporations
Subsidies on production
Other transfers
Private enterprises
Subsidies on production
Other transfers
Non-profit institutions
Households 1 845 2 714 1 536 1 938 938 743 1 000 1 054 1 102
Social benefits 1 845 2 714 1 536 1 938 938 743 1 000 1 054 1 102
Other transfers to households
Payments for capital assets 652 1 794 39 2 030 1 882 18 400 5 000 -
Buildings and other fixed structures 1 522 27 13 400
Buildings 1 522 27 13 400
Other fixed structures
Machinery and equipment 652 1 794 39 508 1 855 5 000 5 000 5 000
Transport equipment
Other machinery and equipment 652 1 794 39 508 1 855 5 000 5 000 -
Heritage Assets
Specialised military assets
Biological assets
Land and sub-soil assets
Software and other intangible assets
Payments for financial assets 248 3 632
Total economic classification 359 467 400 835 482 648 412 079 420 079 549 539 465 615 480 722 506 337
2018/19
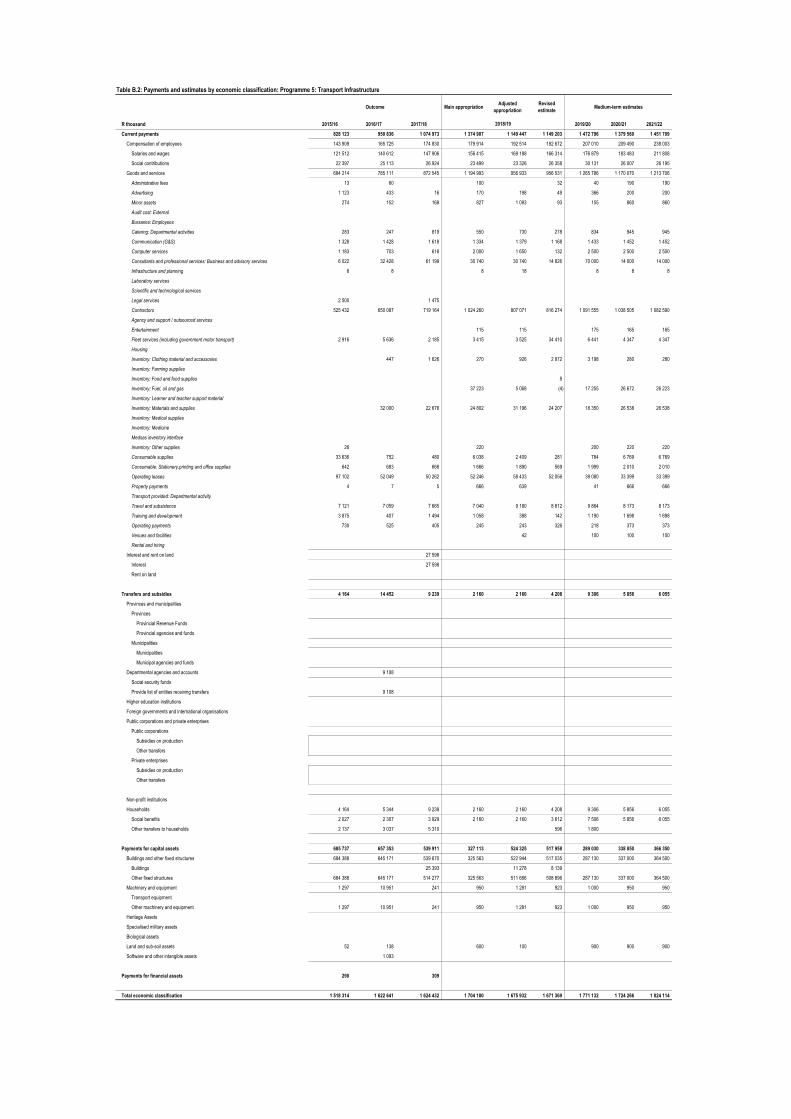
Table B.2: Payments and estimates by economic classification: Programme 5: Transport Infrastructure
Outcome Main appropriationAdjusted
appropriation
Revised
estimateMedium-term estimates
R thousand 2015/16 2016/17 2017/18 2019/20 2020/21 2021/22
Current payments 828 123 950 836 1 074 973 1 374 907 1 149 447 1 149 203 1 472 796 1 379 560 1 451 709
Compensation of employees 143 909 165 725 174 830 179 914 192 514 192 672 207 010 209 490 238 003
Salaries and wages 121 512 140 612 147 906 156 415 169 188 166 314 176 879 183 483 211 808
Social contributions 22 397 25 113 26 924 23 499 23 326 26 358 30 131 26 007 26 195
Goods and services 684 214 785 111 872 545 1 194 993 956 933 956 531 1 265 786 1 170 070 1 213 706
Administrative fees 13 60 100 32 40 190 190
Advertising 1 123 433 16 170 198 49 366 200 200
Minor assets 274 152 168 827 1 093 93 155 860 860
Audit cost: External
Bursaries: Employees
Catering: Departmental activities 283 247 819 550 730 278 834 945 945
Communication (G&S) 1 328 1 428 1 618 1 334 1 379 1 168 1 433 1 452 1 452
Computer services 1 183 703 618 2 000 1 650 132 2 500 2 500 2 500
Consultants and professional services: Business and advisory services 6 022 32 428 61 199 30 740 30 740 14 826 70 000 14 000 14 000
Infrastructure and planning 6 8 8 18 8 8 8
Laboratory services
Scientific and technological services
Legal services 2 500 1 475
Contractors 525 432 650 087 719 164 1 024 260 807 071 816 274 1 091 555 1 038 505 1 082 590
Agency and support / outsourced services
Entertainment 115 115 175 165 165
Fleet services (including government motor transport) 2 916 5 636 2 185 3 415 3 525 34 410 6 441 4 347 4 347
Housing
Inventory: Clothing material and accessories 447 1 626 270 926 2 872 3 198 280 280
Inventory: Farming supplies
Inventory: Food and food supplies 8
Inventory: Fuel, oil and gas 37 223 5 068 (4) 17 255 26 672 26 223
Inventory: Learner and teacher support material
Inventory: Materials and supplies 32 000 22 678 24 802 31 196 24 207 18 350 26 538 26 538
Inventory: Medical supplies
Inventory: Medicine
Medsas inventory interface
Inventory: Other supplies 26 220 200 220 220
Consumable supplies 33 636 752 480 6 038 2 409 281 784 6 769 6 769
Consumable: Stationery,printing and office supplies 642 683 668 1 666 1 890 569 1 999 2 010 2 010
Operating leases 97 102 52 049 50 262 52 246 58 433 52 056 39 080 33 399 33 399
Property payments 4 7 5 666 639 41 666 666
Transport provided: Departmental activity
Travel and subsistence 7 121 7 059 7 665 7 040 9 180 8 812 9 864 8 173 8 173
Training and development 3 875 407 1 494 1 058 388 142 1 190 1 698 1 698
Operating payments 730 525 405 245 243 326 218 373 373
Venues and facilities 42 100 100 100
Rental and hiring
Interest and rent on land 27 598
Interest 27 598
Rent on land
Transfers and subsidies 4 164 14 452 9 239 2 160 2 160 4 208 9 306 5 856 6 055
Provinces and municipalities
Provinces
Provincial Revenue Funds
Provincial agencies and funds
Municipalities
Municipalities
Municipal agencies and funds
Departmental agencies and accounts 9 108
Social security funds
Provide list of entities receiving transfers 9 108
Higher education institutions
Foreign governments and international organisations
Public corporations and private enterprises
Public corporations
Subsidies on production
Other transfers
Private enterprises
Subsidies on production
Other transfers
Non-profit institutions
Households 4 164 5 344 9 239 2 160 2 160 4 208 9 306 5 856 6 055
Social benefits 2 027 2 307 3 929 2 160 2 160 3 612 7 506 5 856 6 055
Other transfers to households 2 137 3 037 5 310 596 1 800
Payments for capital assets 685 737 657 353 539 911 327 113 524 325 517 958 289 030 338 850 366 350
Buildings and other fixed structures 684 388 645 171 539 670 325 563 522 944 517 035 287 130 337 000 364 500
Buildings 25 393 11 278 8 139
Other fixed structures 684 388 645 171 514 277 325 563 511 666 508 896 287 130 337 000 364 500
Machinery and equipment 1 297 10 951 241 950 1 281 923 1 000 950 950
Transport equipment
Other machinery and equipment 1 297 10 951 241 950 1 281 923 1 000 950 950
Heritage Assets
Specialised military assets
Biological assets
Land and sub-soil assets 52 138 600 100 900 900 900
Software and other intangible assets 1 093
Payments for financial assets 290 309
Total economic classification 1 518 314 1 622 641 1 624 432 1 704 180 1 675 932 1 671 369 1 771 132 1 724 266 1 824 114
2018/19
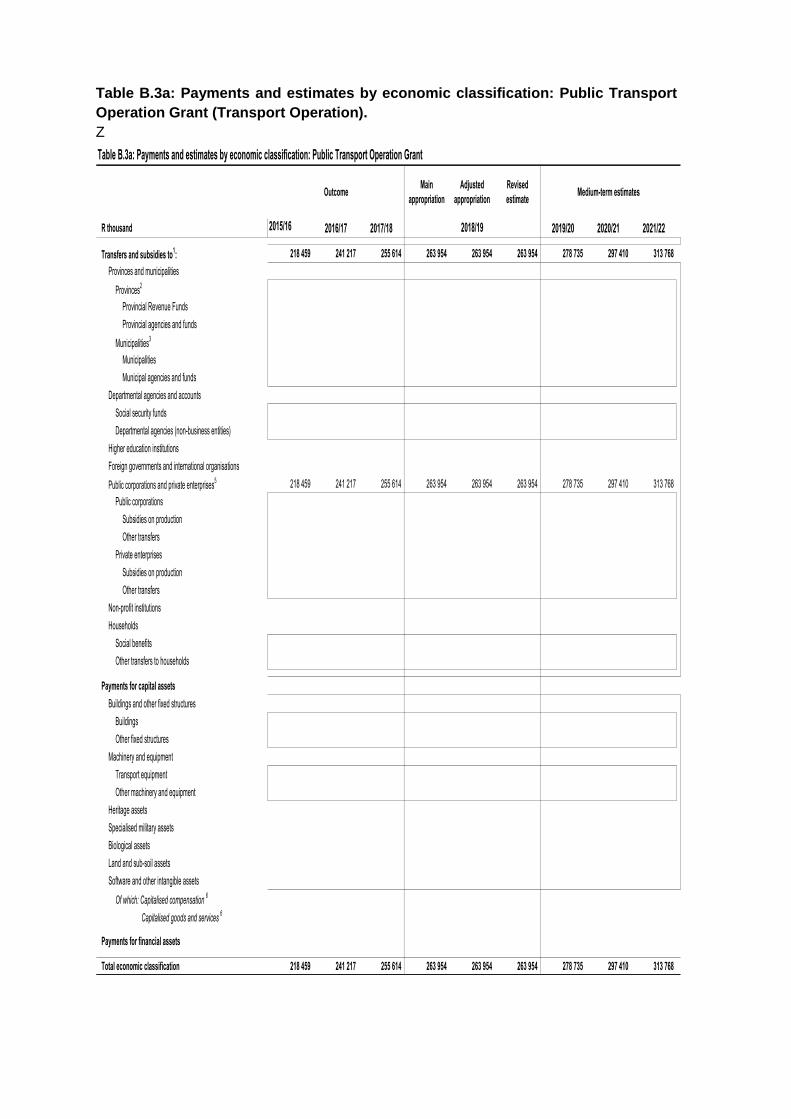
Table B.3a: Payments and estimates by economic classification: Public Transport
Operation Grant (Transport Operation).
Z
Table B.3a: Payments and estimates by economic classification: Public Transport Operation Grant
OutcomeMain
appropriation
Adjusted
appropriation
Revised
estimateMedium-term estimates
R thousand 2015/16 2016/17 2017/18 2019/20 2020/21 2021/22
Transfers and subsidies to1: 218 459 241 217 255 614 263 954 263 954 263 954 278 735 297 410 313 768
Provinces and municipalities
Provinces2
Provincial Revenue Funds
Provincial agencies and funds
Municipalities3
Municipalities
Municipal agencies and funds
Departmental agencies and accounts
Social security funds
Departmental agencies (non-business entities)
Higher education institutions
Foreign governments and international organisations
Public corporations and private enterprises5 218 459 241 217 255 614 263 954 263 954 263 954 278 735 297 410 313 768
Public corporations
Subsidies on production
Other transfers
Private enterprises
Subsidies on production
Other transfers
Non-profit institutions
Households
Social benefits
Other transfers to households
Payments for capital assets
Buildings and other fixed structures
Buildings
Other fixed structures
Machinery and equipment
Transport equipment
Other machinery and equipment
Heritage assets
Specialised military assets
Biological assets
Land and sub-soil assets
Software and other intangible assets
Of which: Capitalised compensation6
Of which: Capitalised goods and services6
Payments for financial assets
Total economic classification 218 459 241 217 255 614 263 954 263 954 263 954 278 735 297 410 313 768
2018/19
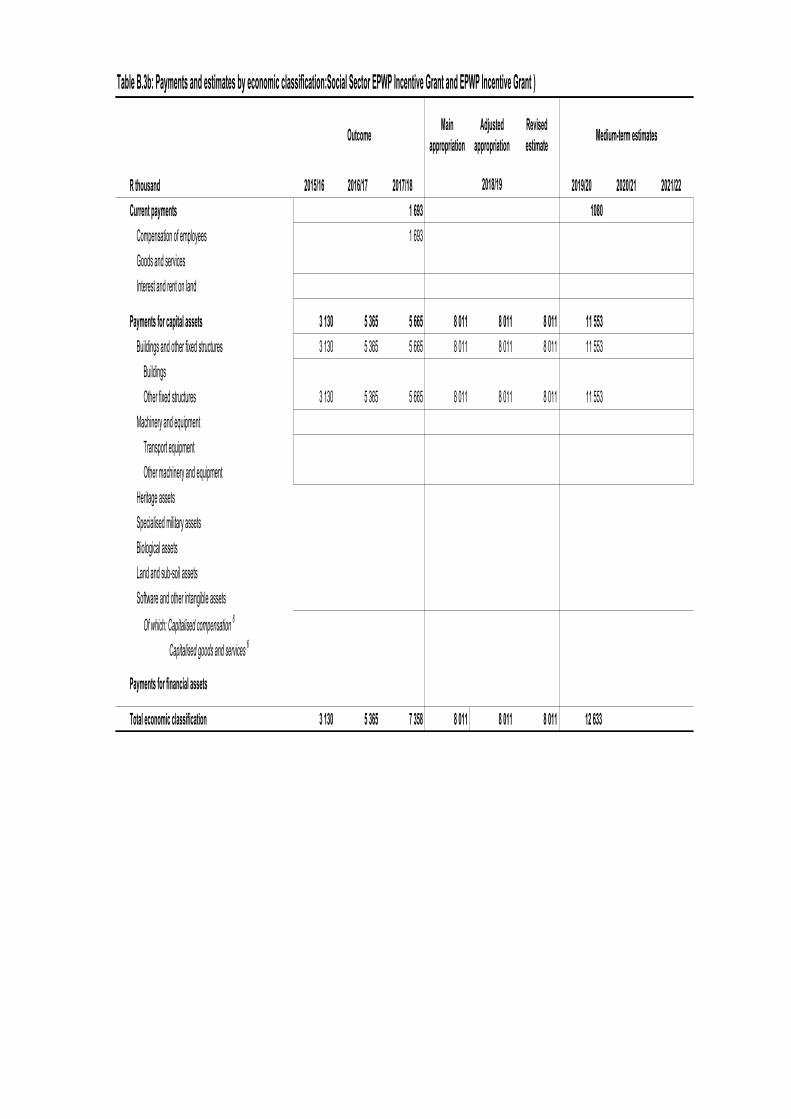
Table B.3b: Payments and estimates by economic classification:Social Sector EPWP Incentive Grant and EPWP Incentive Grant )
OutcomeMain
appropriation
Adjusted
appropriation
Revised
estimateMedium-term estimates
R thousand 2015/16 2016/17 2017/18 2019/20 2020/21 2021/22
Current payments 0 0 1 693 - 0 0 1080 0 0
Compensation of employees 1 693
Goods and services
Interest and rent on land
Payments for capital assets 3 130 5 365 5 665 8 011 8 011 8 011 11 553 0 0
Buildings and other fixed structures 3 130 5 365 5 665 8 011 8 011 8 011 11 553
Buildings
Other fixed structures 3 130 5 365 5 665 8 011 8 011 8 011 11 553
Machinery and equipment - - - - - - - 0 0
Transport equipment
Other machinery and equipment
Heritage assets
Specialised military assets
Biological assets
Land and sub-soil assets
Software and other intangible assets
Of which: Capitalised compensation6
Of which: Capitalised goods and services6
Payments for financial assets
Total economic classification 3 130 5 365 7 358 8 011 8 011 8 011 12 633 0 0
2018/19
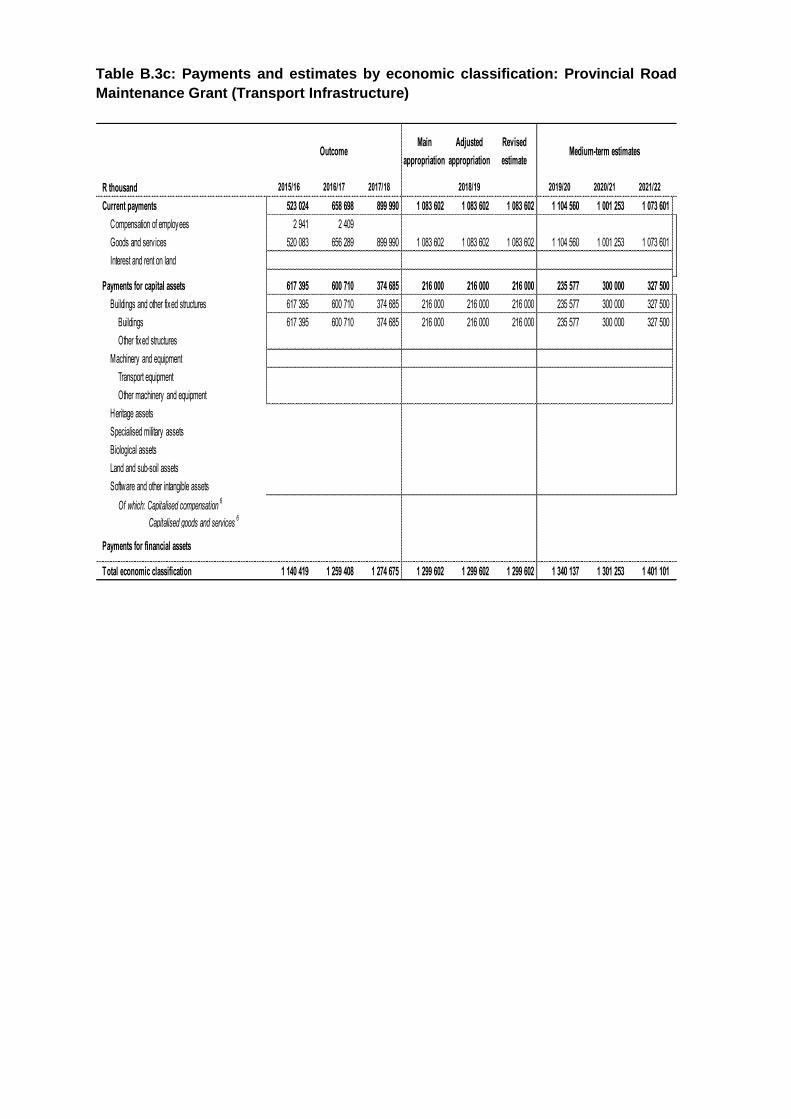
Table B.3c: Payments and estimates by economic classification: Provincial Road
Maintenance Grant (Transport Infrastructure)
OutcomeMain
appropriation
Adjusted
appropriation
Revised
estimateMedium-term estimates
R thousand 2015/16 2016/17 2017/18 2019/20 2020/21 2021/22
Current payments 523 024 658 698 899 990 1 083 602 1 083 602 1 083 602 1 104 560 1 001 253 1 073 601
Compensation of employees 2 941 2 409
Goods and serv ices 520 083 656 289 899 990 1 083 602 1 083 602 1 083 602 1 104 560 1 001 253 1 073 601
Interest and rent on land
Payments for capital assets 617 395 600 710 374 685 216 000 216 000 216 000 235 577 300 000 327 500
Buildings and other fixed structures 617 395 600 710 374 685 216 000 216 000 216 000 235 577 300 000 327 500
Buildings 617 395 600 710 374 685 216 000 216 000 216 000 235 577 300 000 327 500
Other fixed structures
Machinery and equipment -
Transport equipment
Other machinery and equipment
Heritage assets
Specialised military assets
Biological assets
Land and sub-soil assets
Software and other intangible assets
Of which: Capitalised compensation6
Of which: Capitalised goods and services6
Payments for financial assets
Total economic classification 1 140 419 1 259 408 1 274 675 1 299 602 1 299 602 1 299 602 1 340 137 1 301 253 1 401 101
2018/19
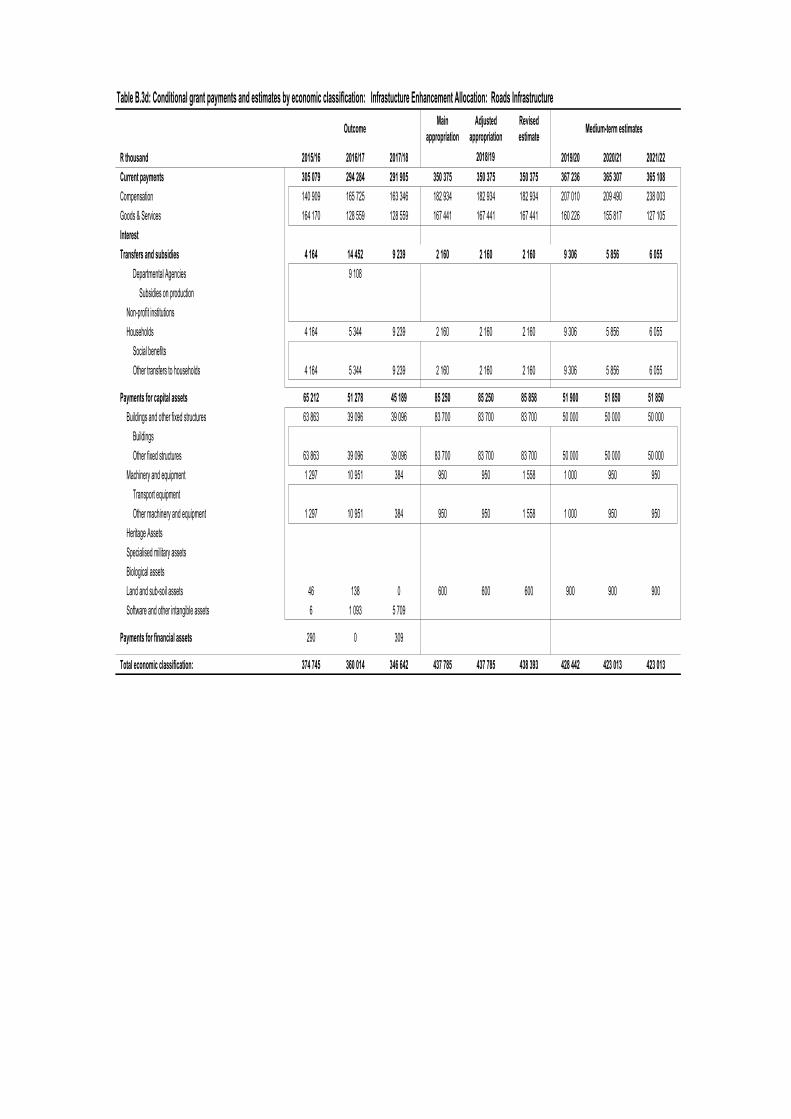
Table B.3d: Conditional grant payments and estimates by economic classification: Infrastucture Enhancement Allocation: Roads Infrastructure
OutcomeMain
appropriation
Adjusted
appropriation
Revised
estimateMedium-term estimates
R thousand 2015/16 2016/17 2017/18 2019/20 2020/21 2021/22
Current payments 305 079 294 284 291 905 350 375 350 375 350 375 367 236 365 307 365 108
Compensation 140 909 165 725 163 346 182 934 182 934 182 934 207 010 209 490 238 003
Goods & Services 164 170 128 559 128 559 167 441 167 441 167 441 160 226 155 817 127 105
Interest
Transfers and subsidies 4 164 14 452 9 239 2 160 2 160 2 160 9 306 5 856 6 055
Departmental Agencies 9 108
Subsidies on production
Non-profit institutions
Households 4 164 5 344 9 239 2 160 2 160 2 160 9 306 5 856 6 055
Social benefits
Other transfers to households 4 164 5 344 9 239 2 160 2 160 2 160 9 306 5 856 6 055
Payments for capital assets 65 212 51 278 45 189 85 250 85 250 85 858 51 900 51 850 51 850
Buildings and other fixed structures 63 863 39 096 39 096 83 700 83 700 83 700 50 000 50 000 50 000
Buildings
Other fixed structures 63 863 39 096 39 096 83 700 83 700 83 700 50 000 50 000 50 000
Machinery and equipment 1 297 10 951 384 950 950 1 558 1 000 950 950
Transport equipment
Other machinery and equipment 1 297 10 951 384 950 950 1 558 1 000 950 950
Heritage Assets
Specialised military assets
Biological assets
Land and sub-soil assets 46 138 0 600 600 600 900 900 900
Software and other intangible assets 6 1 093 5 709
Payments for financial assets 290 0 309
Total economic classification: 374 745 360 014 346 642 437 785 437 785 438 393 428 442 423 013 423 013
2018/19
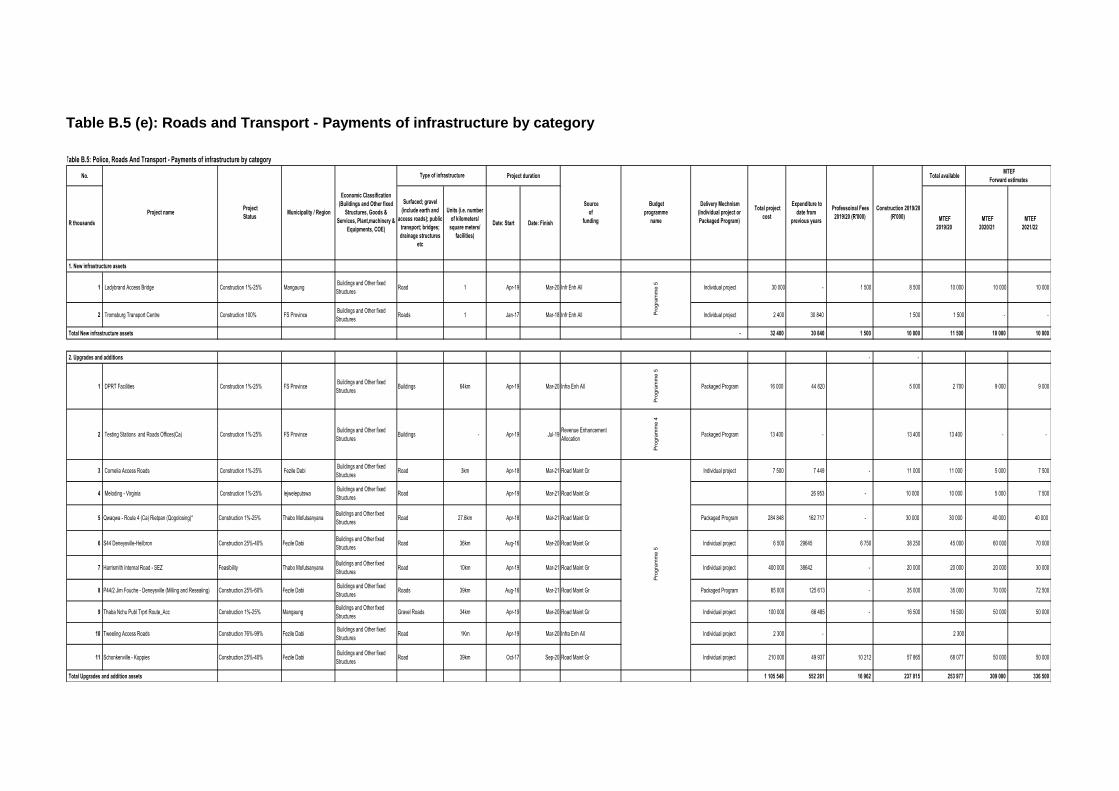
Table B.5 (e): Roads and Transport - Payments of infrastructure by category
Table B.5: Police, Roads And Transport - Payments of infrastructure by category
No. Project duration Total available MTEF
Forward estimates
R thousands
Surfaced; gravel
(include earth and
access roads); public
transport; bridges;
drainage structures
etc
Units (i.e. number
of kilometers/
square meters/
facilities)
Date: Start Date: Finish MTEF
2019/20
MTEF
2020/21
MTEF
2021/22
1. New infrastructure assets
1 Ladybrand Access Bridge Construction 1%-25% Mangaung Buildings and Other fixed
Structures Road 1 Apr-19 Mar-20 Infr Enh All Individual project 30 000 - 1 500 8 500 10 000 10 000 10 000
2 Tromsburg Transport Centre Construction 100% FS Province Buildings and Other fixed
Structures Roads 1 Jan-17 Mar-18 Infr Enh All Individual project 2 400 30 840 1 500 1 500 - -
Total New infrastructure assets - 32 400 30 840 1 500 10 000 11 500 10 000 10 000
2. Upgrades and additions - -
1 DPRT Facilities Construction 1%-25% FS Province Buildings and Other fixed
Structures Buildings 64km Apr-19 Mar-20 Infra Enh All
Pro
gra
mm
e 5
Packaged Program 16 000 44 820 5 000 2 700 9 000 9 000
2 Testing Stations and Roads Offices(Ca) Construction 1%-25% FS Province Buildings and Other fixed
Structures Buildings - Apr-19 Jul-19
Revenue Enhancement
Allocation
Pro
gra
mm
e 4
Packaged Program 13 400 - 13 400 13 400 - -
3 Cornelia Access Roads Construction 1%-25% Fezile Dabi Buildings and Other fixed
Structures Road 3km Apr-18 Mar-21 Road Maint Gr Individual project 7 500 7 449 - 11 000 11 000 5 000 7 500
4 Meloding - Virginia Construction 1%-25% lejweleputswa Buildings and Other fixed
Structures Road Apr-19 Mar-21 Road Maint Gr 26 953 - 10 000 10 000 5 000 7 500
5 Qwaqwa - Route 4 (Ca) Rietpan (Qogolosing)* Construction 1%-25% Thabo MofutsanyanaBuildings and Other fixed
StructuresRoad 27.6km Apr-18 Mar-21 Road Maint Gr Packaged Program 284 848 162 717 - 30 000 30 000 40 000 40 000
6 S44 Deneysville-Heilbron Construction 25%-40% Fezile DabiBuildings and Other fixed
StructuresRoad 36km Aug-16 Mar-20 Road Maint Gr Individual project 6 500 29645 6 750 38 250 45 000 60 000 70 000
7 Harrismith Internal Road - SEZ Feasibility Thabo MofutsanyanaBuildings and Other fixed
StructuresRoad 10km Apr-19 Mar-21 Road Maint Gr Individual project 400 000 38642 - 20 000 20 000 20 000 30 000
8 P44/2 Jim Fouche - Deneysville (Milling and Resealing) Construction 25%-60% Fezile Dabi Buildings and Other fixed
Structures Roads 39km Aug-16 Mar-21 Road Maint Gr Packaged Program 65 000 125 613 - 35 000 35 000 70 000 72 500
9 Thaba Nchu Publ Trprt Route_Acc Construction 1%-25% MangaungBuildings and Other fixed
StructuresGravel Roads 34km Apr-19 Mar-20 Road Maint Gr Individual project 100 000 66 485 - 16 500 16 500 50 000 50 000
10 Tweeling Access Roads Construction 76%-99% Fezile Dabi Buildings and Other fixed
Structures Road 1Km Apr-19 Mar-20 Infra Enh All Individual project 2 300 - 2 300
11 Schonkenville - Koppies Construction 25%-40% Fezile Dabi Buildings and Other fixed
Structures Road 39km Oct-17 Sep-20 Road Maint Gr Individual project 210 000 49 937 10 212 57 865 68 077 50 000 50 000
Total Upgrades and addition assets 1 105 548 552 261 16 962 237 015 253 977 309 000 336 500
Pro
gra
mm
e 5
Professoinal Fees
2019/20 (R'000)
Construction 2019/20
(R'000)
Delivery Mechnism
(Individual project or
Packaged Program)
Total project
cost
Expenditure to
date from
previous years
Project name Project
Status Municipality / Region
Source
of
funding
Budget
programme
name
Economic Classification
(Buildings and Other fixed
Structures, Goods &
Services, Plant,machinery &
Equipments, COE)
Type of infrastructure
Pro
gra
mm
e 5
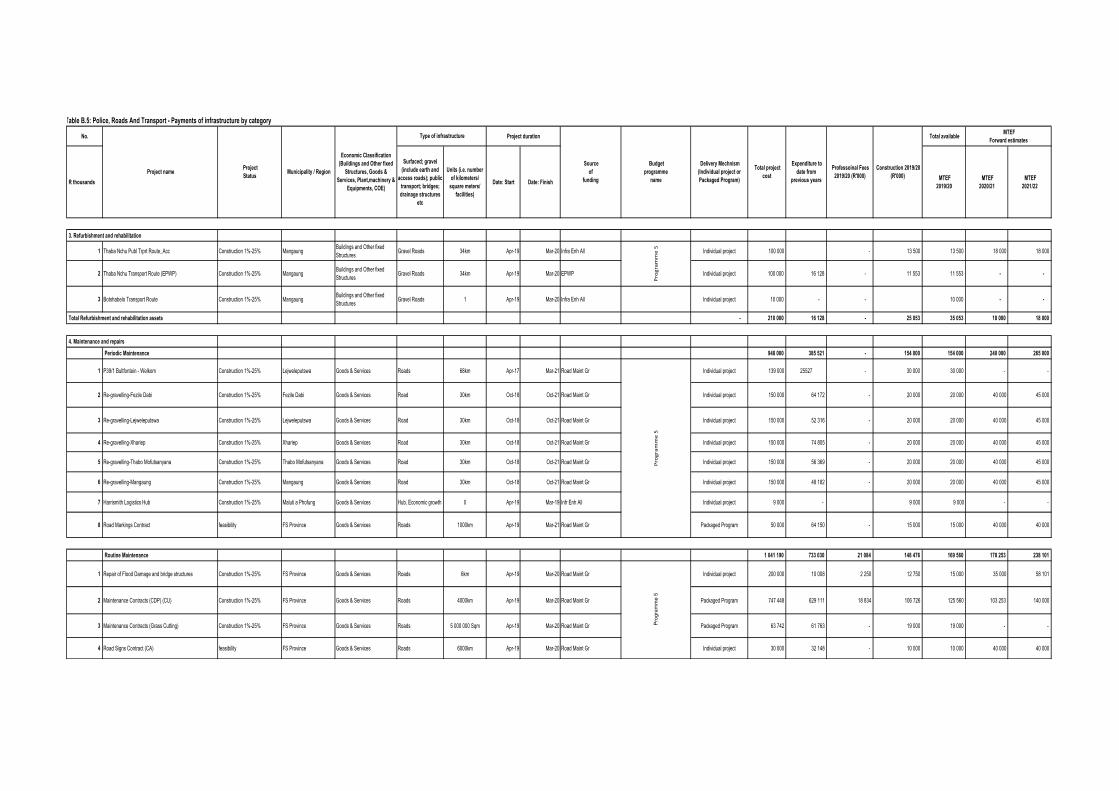
Table B.5: Police, Roads And Transport - Payments of infrastructure by category
No. Project duration Total available MTEF
Forward estimates
R thousands
Surfaced; gravel
(include earth and
access roads); public
transport; bridges;
drainage structures
etc
Units (i.e. number
of kilometers/
square meters/
facilities)
Date: Start Date: Finish MTEF
2019/20
MTEF
2020/21
MTEF
2021/22
3. Refurbishment and rehabilitation
1 Thaba Nchu Publ Trprt Route_Acc Construction 1%-25% MangaungBuildings and Other fixed
StructuresGravel Roads 34km Apr-19 Mar-20 Infra Enh All Individual project 100 000 - 13 500 13 500 18 000 18 000
2 Thaba Nchu Transport Route (EPWP) Construction 1%-25% MangaungBuildings and Other fixed
StructuresGravel Roads 34km Apr-19 Mar-20 EPWP Individual project 100 000 16 128 - 11 553 11 553 - -
3 Botshabelo Transport Route Construction 1%-25% MangaungBuildings and Other fixed
StructuresGravel Roads 1 Apr-19 Mar-20 Infra Enh All Individual project 10 000 - - 10 000 - -
Total Refurbishment and rehabilitation assets - 210 000 16 128 - 25 053 35 053 18 000 18 000
4. Maintenance and repairs
Periodic Maintenance 948 000 385 521 - 154 000 154 000 240 000 265 000
1 P39/1 Bultfontein - Welkom Construction 1%-25% Lejweleputswa Goods & Services Roads 68km Apr-17 Mar-21 Road Maint Gr Individual project 139 000 25527 - 30 000 30 000 - -
2 Re-gravelling-Fezile Dabi Construction 1%-25% Fezile Dabi Goods & Services Road 30km Oct-18 Oct-21 Road Maint Gr Individual project 150 000 64 172 - 20 000 20 000 40 000 45 000
3 Re-gravelling-Lejweleputswa Construction 1%-25% Lejweleputswa Goods & Services Road 30km Oct-18 Oct-21 Road Maint Gr Individual project 150 000 52 316 - 20 000 20 000 40 000 45 000
4 Re-gravelling-Xhariep Construction 1%-25% Xhariep Goods & Services Road 30km Oct-18 Oct-21 Road Maint Gr Individual project 150 000 74 805 - 20 000 20 000 40 000 45 000
5 Re-gravelling-Thabo Mofutsanyana Construction 1%-25% Thabo Mofutsanyana Goods & Services Road 30km Oct-18 Oct-21 Road Maint Gr Individual project 150 000 56 369 - 20 000 20 000 40 000 45 000
6 Re-gravelling-Mangaung Construction 1%-25% Mangaung Goods & Services Road 30km Oct-18 Oct-21 Road Maint Gr Individual project 150 000 48 182 - 20 000 20 000 40 000 45 000
7 Harrismith Logistics Hub Construction 1%-25% Maluti a Phofung Goods & Services Hub, Economic growth 0 Apr-19 Mar-19 Infr Enh All Individual project 9 000 - 9 000 9 000 - -
8 Road Markings Contract feasibility FS Province Goods & Services Roads 1000km Apr-19 Mar-21 Road Maint Gr Packaged Program 50 000 64 150 - 15 000 15 000 40 000 40 000
Routine Maintenance 1 041 190 733 030 21 084 148 476 169 560 178 253 238 101
1 Repair of Flood Damage and bridge structures Construction 1%-25% FS Province Goods & Services Roads 6km Apr-19 Mar-20 Road Maint Gr Individual project 200 000 10 008 2 250 12 750 15 000 35 000 58 101
2 Maintenance Contracts (CDP) (CU) Construction 1%-25% FS Province Goods & Services Roads 4000km Apr-19 Mar-20 Road Maint Gr Packaged Program 747 448 629 111 18 834 106 726 125 560 103 253 140 000
3 Maintenance Contracts (Grass Cutting) Construction 1%-25% FS Province Goods & Services Roads 5 000 000 Sqm Apr-19 Mar-20 Road Maint Gr Packaged Program 63 742 61 763 - 19 000 19 000 - -
4 Road Signs Contract (CA) feasibility FS Province Goods & Services Roads 6000km Apr-19 Mar-20 Road Maint Gr Individual project 30 000 32 148 - 10 000 10 000 40 000 40 000
Professoinal Fees
2019/20 (R'000)
Construction 2019/20
(R'000)
Delivery Mechnism
(Individual project or
Packaged Program)
Total project
cost
Expenditure to
date from
previous years
Project name Project
Status Municipality / Region
Source
of
funding
Budget
programme
name
Economic Classification
(Buildings and Other fixed
Structures, Goods &
Services, Plant,machinery &
Equipments, COE)
Type of infrastructure
Pro
gra
mm
e 5
Pro
gra
mm
e 5
Pro
gra
mm
e 5
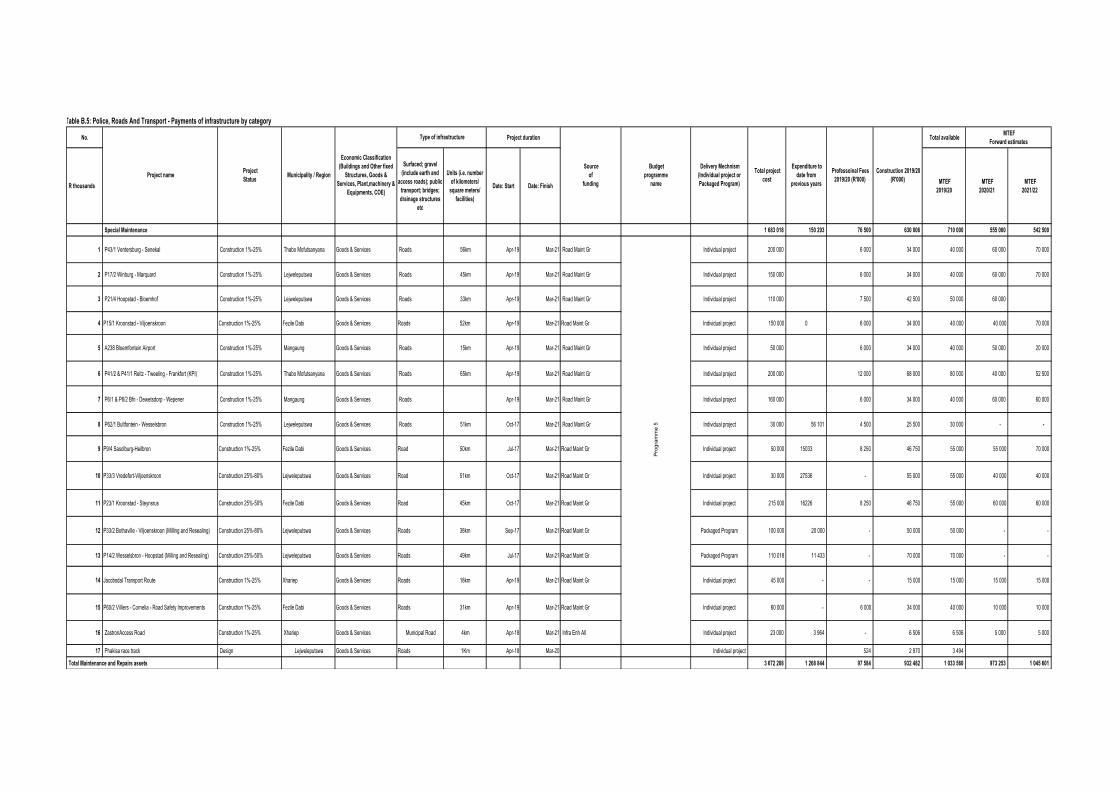
Table B.5: Police, Roads And Transport - Payments of infrastructure by category
No. Project duration Total available MTEF
Forward estimates
R thousands
Surfaced; gravel
(include earth and
access roads); public
transport; bridges;
drainage structures
etc
Units (i.e. number
of kilometers/
square meters/
facilities)
Date: Start Date: Finish MTEF
2019/20
MTEF
2020/21
MTEF
2021/22
Special Maintenance 1 683 018 150 293 76 500 630 006 710 000 555 000 542 500
1 P43/1 Ventersburg - Senekal Construction 1%-25% Thabo Mofutsanyana Goods & Services Roads 56km Apr-19 Mar-21 Road Maint Gr Individual project 200 000 6 000 34 000 40 000 60 000 70 000
2 P17/2 Winburg - Marquard Construction 1%-25% Lejweleputswa Goods & Services Roads 45km Apr-19 Mar-21 Road Maint Gr Individual project 150 000 6 000 34 000 40 000 60 000 70 000
3 P21/4 Hoopstad - Bloemhof Construction 1%-25% Lejweleputswa Goods & Services Roads 33km Apr-19 Mar-21 Road Maint Gr Individual project 110 000 7 500 42 500 50 000 60 000
4 P15/1 Kroonstad - Viljoenskroon Construction 1%-25% Fezile Dabi Goods & Services Roads 52km Apr-19 Mar-21 Road Maint Gr Individual project 150 000 0 6 000 34 000 40 000 40 000 70 000
5 A238 Bloemfontein Airport Construction 1%-25% Mangaung Goods & Services Roads 15km Apr-19 Mar-21 Road Maint Gr Individual project 50 000 6 000 34 000 40 000 50 000 20 000
6 P41/2 & P41/1 Reitz - Tweeling - Frankfort (KPI) Construction 1%-25% Thabo Mofutsanyana Goods & Services Roads 65km Apr-19 Mar-21 Road Maint Gr Individual project 200 000 12 000 68 000 80 000 40 000 52 500
7 P6/1 & P6/2 Bfn - Dewetsdorp - Wepener Construction 1%-25% Mangaung Goods & Services Roads Apr-19 Mar-21 Road Maint Gr Individual project 160 000 6 000 34 000 40 000 60 000 60 000
8 P62/1 Bultfontein - Wesselsbron Construction 1%-25% Lejweleputswa Goods & Services Roads 51km Oct-17 Mar-21 Road Maint Gr Individual project 30 000 56 101 4 500 25 500 30 000 - -
9 P9/4 Sasolburg-Heilbron Construction 1%-25% Fezile Dabi Goods & Services Road 50km Jul-17 Mar-21 Road Maint Gr Individual project 50 000 15033 8 250 46 750 55 000 55 000 70 000
10 P33/3 Vredefort-Viljoenskroon Construction 25%-80% Lejweleputswa Goods & Services Road 51km Oct-17 Mar-21 Road Maint Gr Individual project 30 000 27536 - 55 000 55 000 40 000 40 000
11 P23/1 Kroonstad - Steynsrus Construction 25%-50% Fezile Dabi Goods & Services Road 45km Oct-17 Mar-21 Road Maint Gr Individual project 215 000 16226 8 250 46 750 55 000 60 000 60 000
12 P33/2 Bothaville - Viljoenskroon (Milling and Resealing) Construction 25%-80% Lejweleputswa Goods & Services Roads 38km Sep-17 Mar-21 Road Maint Gr Packaged Program 100 000 20 000 - 50 000 50 000 - -
13 P14/2 Wesselsbron - Hoopstad (Milling and Resealing) Construction 25%-50% Lejweleputswa Goods & Services Roads 49km Jul-17 Mar-21 Road Maint Gr Packaged Program 110 018 11 433 - 70 000 70 000 - -
14 Jacobsdal Transport Route Construction 1%-25% Xhariep Goods & Services Roads 18km Apr-19 Mar-21 Road Maint Gr Individual project 45 000 - - 15 000 15 000 15 000 15 000
15 P60/2 Villiers - Cornelia - Road Safety Improvements Construction 1%-25% Fezile Dabi Goods & Services Roads 31km Apr-19 Mar-21 Road Maint Gr Individual project 60 000 - 6 000 34 000 40 000 10 000 10 000
16 ZastronAccess Road Construction 1%-25% Xhariep Goods & Services Municipal Road 4km Apr-18 Mar-21 Infra Enh All Individual project 23 000 3 964 - 6 506 6 506 5 000 5 000
17 Phakisa race track Design Lejweleputswa Goods & Services Roads 1Km Apr-18 Mar-20 Individual project 524 2 970 3 494
Total Maintenance and Repairs assets 3 672 208 1 268 844 97 584 932 482 1 033 560 973 253 1 045 601
Professoinal Fees
2019/20 (R'000)
Construction 2019/20
(R'000)
Delivery Mechnism
(Individual project or
Packaged Program)
Total project
cost
Expenditure to
date from
previous years
Project name Project
Status Municipality / Region
Source
of
funding
Budget
programme
name
Economic Classification
(Buildings and Other fixed
Structures, Goods &
Services, Plant,machinery &
Equipments, COE)
Type of infrastructure
Pro
gra
mm
e 5
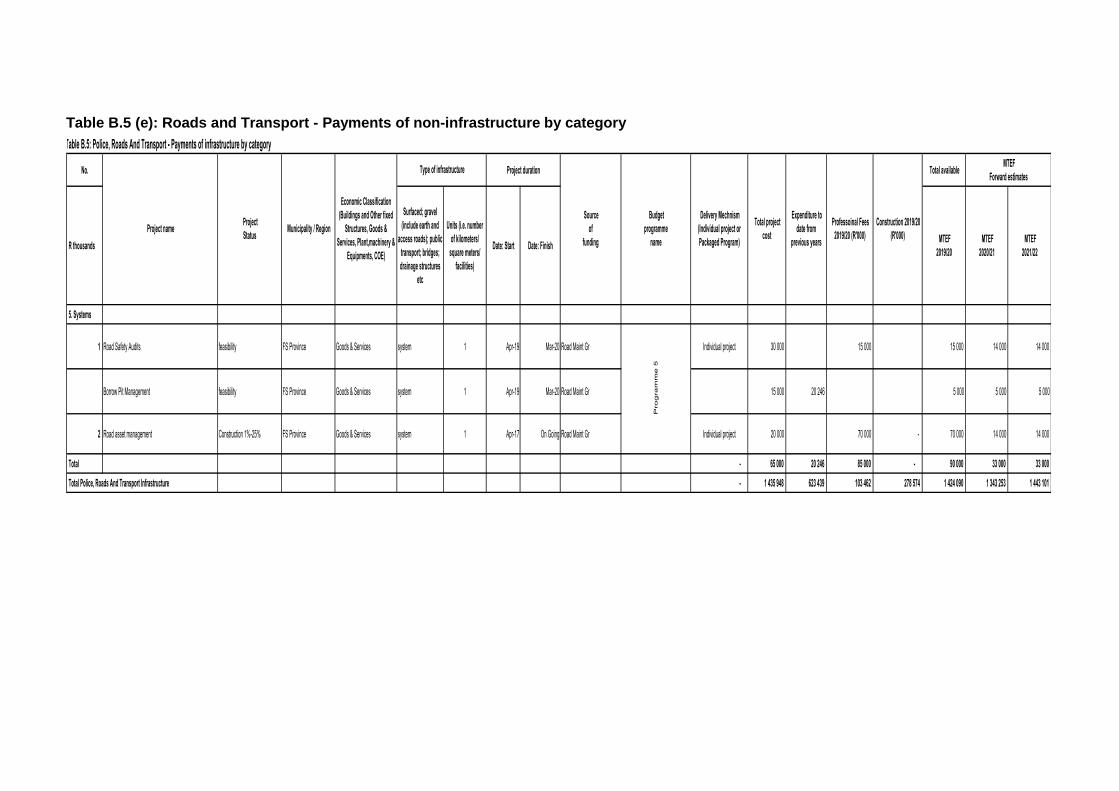
Table B.5 (e): Roads and Transport - Payments of non-infrastructure by category
Table B.5: Police, Roads And Transport - Payments of infrastructure by category
No. Project duration Total available MTEF
Forward estimates
R thousands
Surfaced; gravel
(include earth and
access roads); public
transport; bridges;
drainage structures
etc
Units (i.e. number
of kilometers/
square meters/
facilities)
Date: Start Date: Finish MTEF
2019/20
MTEF
2020/21
MTEF
2021/22
5. Systems
1 Road Safety Audits feasibility FS Province Goods & Services system 1 Apr-19 Mar-20 Road Maint Gr Individual project 30 000 15 000 15 000 14 000 14 000
Borrow Pit Management feasibility FS Province Goods & Services system 1 Apr-19 Mar-20 Road Maint Gr 15 000 20 246 5 000 5 000 5 000
2 Road asset management Construction 1%-25% FS Province Goods & Services system 1 Apr-17 On Going Road Maint Gr Individual project 20 000 70 000 - 70 000 14 000 14 000
Total - 65 000 20 246 85 000 - 90 000 33 000 33 000
Total Police, Roads And Transport Infrastructure - 1 435 948 623 439 103 462 278 574 1 424 090 1 343 253 1 443 101
Professoinal Fees
2019/20 (R'000)
Construction 2019/20
(R'000)
Delivery Mechnism
(Individual project or
Packaged Program)
Total project
cost
Expenditure to
date from
previous years
Project name Project
Status Municipality / Region
Source
of
funding
Budget
programme
name
Economic Classification
(Buildings and Other fixed
Structures, Goods &
Services, Plant,machinery &
Equipments, COE)
Type of infrastructure
Pro
gra
mm
e 5