Embed Size (px)
Citation preview
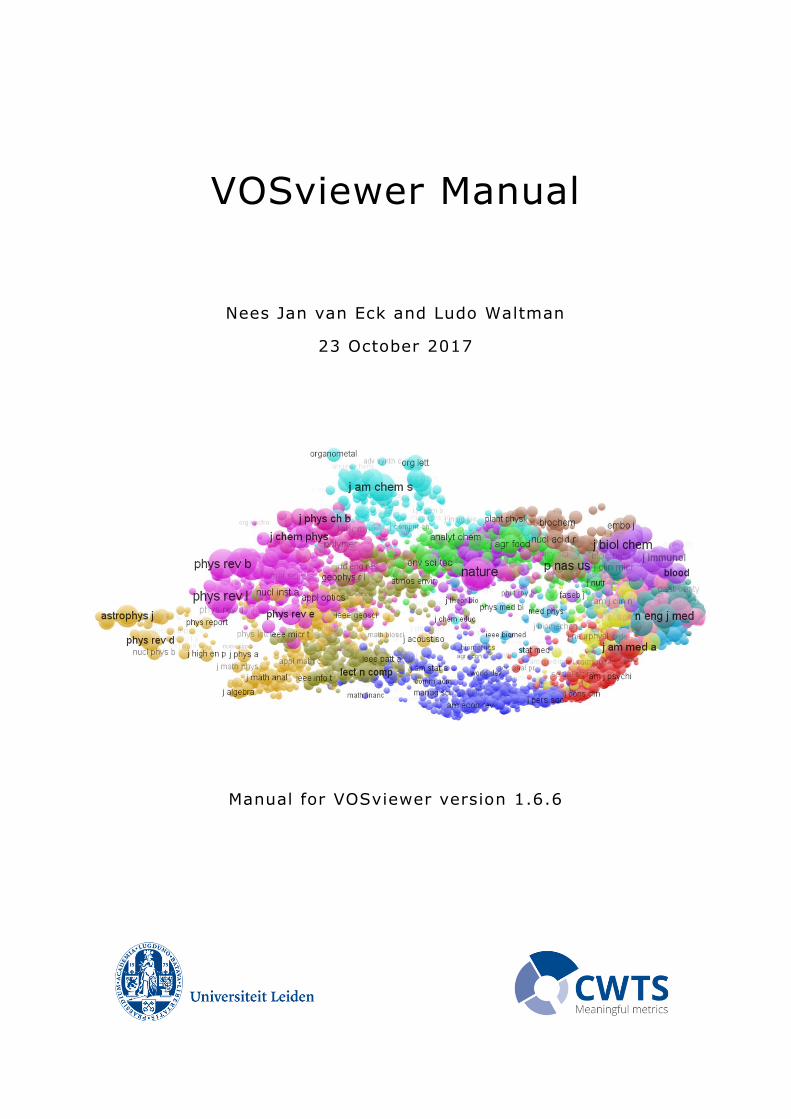
VOSviewer Manual
Nees Jan van Eck and Ludo Waltman
23 October 2017
Manual for VOSviewer version 1.6.6
1
Table of contents
1 Introduction ........................................................................................... 3
2 Terminology ........................................................................................... 4
3 User interface ........................................................................................ 6
3.1 Main panel ...................................................................................... 7
3.1.1 Network visualization ................................................................. 8
3.1.2 Overlay visualization .................................................................. 8
3.1.3 Density visualization ................................................................ 10
3.1.4 Zooming and scrolling .............................................................. 11
3.2 Options panel ................................................................................ 12
3.3 Information panel .......................................................................... 16
3.4 Overview panel .............................................................................. 16
3.5 Action panel .................................................................................. 17
3.5.1 File tab .................................................................................. 17
3.5.2 Items tab ............................................................................... 19
3.5.3 Analysis tab ............................................................................ 19
3.5.4 Create Map wizard ................................................................... 23
4 File types............................................................................................. 34
4.1 Map and network files .................................................................... 34
4.1.1 Map files ................................................................................ 34
4.1.2 Network files .......................................................................... 36
4.2 Corpus and scores files ................................................................... 37
4.2.1 Corpus files ............................................................................ 37
4.2.2 Scores files ............................................................................. 37
4.3 Thesaurus files .............................................................................. 38
4.4 Cluster colors, overlay colors, and density colors files ......................... 38
4.4.1 Cluster colors files ................................................................... 38
4.4.2 Overlay colors files .................................................................. 39
2
4.4.3 Density colors files .................................................................. 39
5 Advanced topics ................................................................................... 40
5.1 Using command line parameters ...................................................... 40
5.2 Making a map available online ......................................................... 45
5.3 Increasing the availability of memory ............................................... 45
References ................................................................................................. 47
3
1 Introduction
VOSviewer is a software tool for creating maps based on network data and for
visualizing and exploring these maps. The functionality of VOSviewer can be
summarized as follows:
Creating maps based on network data. A map can be created based on a
network that is already available, but it is also possible to first construct a
network. VOSviewer can be used to construct networks of scientific publications,
scientific journals, researchers, research organizations, countries, keywords, or
terms. Items in these networks can be connected by co-authorship, co-
occurrence, citation, bibliographic coupling, or co-citation links. To construct a
network, data from Web of Science, Scopus, PubMed, RIS, or Crossref JSON
files can be used.
Visualizing and exploring maps. VOSviewer provides three visualizations of a
map: The network visualization, the overlay visualization, and the density
visualization. Zooming and scrolling functionality allows a map to be explored in
full detail, which is essential when working with large maps containing
thousands of items.
Although VOSviewer is intended primarily for analyzing bibliometric networks, it
can in fact be used to create, visualize, and explore maps based on any type of
network data.
VOSviewer has been developed in the Java programming language. Because Java
is platform-independent, VOSviewer runs on most hardware and operating system
platforms. VOSviewer can be downloaded from www.vosviewer.com. It can be
used freely for any purpose.
This manual pertains to version 1.6.6 of VOSviewer. The manual is organized as
follows. We first introduce some terminology in Chapter 2. We then discuss the
user interface of VOSviewer in Chapter 3, and we explain the file types used by
VOSviewer in Chapter 4. Finally, we consider a number of advanced topics in
Chapter 5.
For additional information about VOSviewer, we refer to a paper that we have
written (Van Eck & Waltman, 2010). This paper provides a general introduction to
VOSviewer. It also discusses in considerable detail the technical implementation of
specific elements of the software. Similar information, including a step-by-step
tutorial, can also be found in a more recent book chapter (Van Eck & Waltman,
2014).
4
2 Terminology
When working with VOSviewer, it is important to understand the terminology used
by the software. We now introduce this terminology.
Maps created, visualized, and explored using VOSviewer include items. Items are
the objects of interest. Items may for example be publications, researchers, or
terms. A map normally includes only one type of item. It is for example uncommon
to have a map that includes both publications and terms. Between any pair of
items there can be a link. A link is a connection or a relation between two items.
Examples of links are bibliographic coupling links between publications, co-
authorship links between researchers, and co-occurrence links between terms. A
map normally includes only one type of link. Also, between any pair of items, there
can be no more than one link. Each link has a strength, represented by a positive
numerical value. The higher this value, the stronger the link. The strength of a link
may for example indicate the number of cited references two publications have in
common (in the case of bibliographic coupling links), the number of publications
two researchers have co-authored (in the case of co-authorship links), or the
number of publications in which two terms occur together (in the case of co-
occurrence links). Sometimes the links between items all have a strength of one.
VOSviewer then does not show the strength of a link. Items and links together
constitute a network. Hence, a network is a set of items together with the links
between the items.1
Items may be grouped into clusters. A cluster is a set of items included in a map.2
Clusters are non-overlapping in VOSviewer. In other words, an item may belong to
only one cluster. Clusters do not need to exhaustively cover all items in a map.
Hence, there may be items that do not belong to any cluster. Clusters are labeled
using cluster numbers. If there is only one cluster, this cluster usually has cluster
number 1, if there are two clusters, these clusters usually have cluster numbers 1
and 2, and so on.
1 In the literature, a network is sometimes referred to as a graph. Likewise, an item is sometimes called
a node or a vertex, a link is sometimes called an edge, and the strength of a link is sometimes called an
edge weight. These terms are not used by VOSviewer, but they may be used by other software tools for
network analysis and network visualization.
2 In the literature, a cluster is sometimes referred to as a community, but this term is not used by
VOSviewer.
5
Items may have various attributes in VOSviewer. If items have been assigned to
clusters, cluster numbers are an example of an attribute. Of special importance are
the weight and score attributes. These attributes are represented by numerical
values. Weight attributes are restricted to non-negative values. Score attributes do
not have this restriction. A weight of an item should in some way indicate the
importance of the item. An item with a higher weight is regarded as more
important than an item with a lower weight.3 In the visualization of a map, items
with a higher weight are shown more prominently than items with a lower weight.
A score attribute may indicate any numerical property of items.4 However, since
weight attributes are already used to indicate the importance of items, it is
recommended to use score attributes to indicate other properties. Score attributes
are considered only in the overlay visualization of a map (see Subsection 3.1.2),
not in the network visualization and the density visualization. Items may have
multiple weight and multiple score attributes. The weight and score attributes that
are used in the visualization of a map can then be selected in the options panel of
VOSviewer (see Section 3.2).
There are two standard weight attributes, referred to as the Links attribute and the
Total link strength attribute. For a given item, the Links and Total link strength
attributes indicate, respectively, the number of links of an item with other items
and the total strength of the links of an item with other items. For example, in the
case of co-authorship links between researchers, the Links attribute indicates the
number of co-authorship links of a given researcher with other researchers. The
Total link strength attribute indicates the total strength of the co-authorship links
of a given researcher with other researchers.
In addition to the standard Links and Total link strength attributes, items may also
have custom weight attributes. Custom weight attributes are discussed in
Subsection 3.5.4.
3 More precisely, VOSviewer assumes weight attributes to have a ratio scale. In other words, if an item
has a weight that is twice as high as the weight of another item, the former item is regarded as twice as
important as the latter item.
4 Unlike weight attributes, score attributes are not assumed to have a ratio scale. Score attributes may
also have an interval or an ordinal scale. In other words, the minimum requirement for score attributes
is that it makes sense to compare two items based on whether one item has a higher score than the
other item.
6
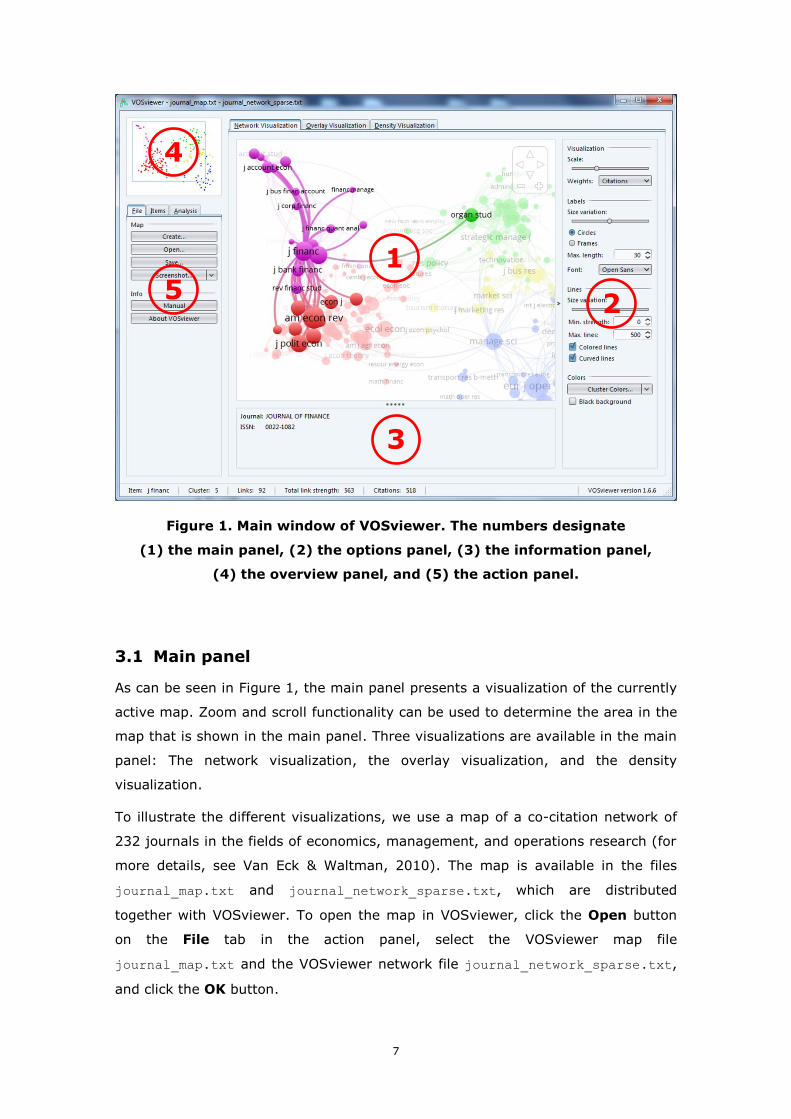
3 User interface
The main window of VOSviewer is shown in Figure 1. It consists of the following
five panels:
Main panel. This panel presents a visualization of the currently active map.
Zoom and scroll functionality can be used to explore the map in full detail.
Options panel. This panel can be used to make adjustments to the visualization
of the currently active map presented in the main panel.
Information panel. This panel presents descriptions of items in the currently
active map.
Overview panel. This panel presents an overview of the currently active map. A
rectangular frame indicates the area in the map that is shown in the main panel.
Action panel. This panel can be used to perform different kinds of actions, such
as creating a new map, opening or saving an existing map, making a
screenshot, and updating the layout or the clustering of a map.
VOSviewer provides three visualizations, referred to as the network visualization,
the overlay visualization, and the density visualization. As can be seen in Figure 1,
the Network Visualization, Overlay Visualization, and Density Visualization
tabs in the main window of VOSviewer can be used to switch between the
visualizations.
A status bar is available at the bottom of the main window of VOSviewer. The
status bar provides information about the currently active map. It shows the
number of items in the map, the number of clusters to which the items have been
assigned, the number of links between the items, and the total strength of the
links. Moreover, when the mouse pointer is moved over an item in the main panel,
the status bar provides information about this item. Likewise, when the mouse
pointer is moved over a link between two items, the status bar provides
information about this link.
In the next sections, the five panels in the main window of VOSviewer are
discussed in more detail.
7
Figure 1. Main window of VOSviewer. The numbers designate
(1) the main panel, (2) the options panel, (3) the information panel,
(4) the overview panel, and (5) the action panel.
3.1 Main panel
As can be seen in Figure 1, the main panel presents a visualization of the currently
active map. Zoom and scroll functionality can be used to determine the area in the
map that is shown in the main panel. Three visualizations are available in the main
panel: The network visualization, the overlay visualization, and the density
visualization.
To illustrate the different visualizations, we use a map of a co-citation network of
232 journals in the fields of economics, management, and operations research (for
more details, see Van Eck & Waltman, 2010). The map is available in the files
journal_map.txt and journal_network_sparse.txt, which are distributed
together with VOSviewer. To open the map in VOSviewer, click the Open button
on the File tab in the action panel, select the VOSviewer map file
journal_map.txt and the VOSviewer network file journal_network_sparse.txt,
and click the OK button.
1
4
4
3
2
4
5
4
8
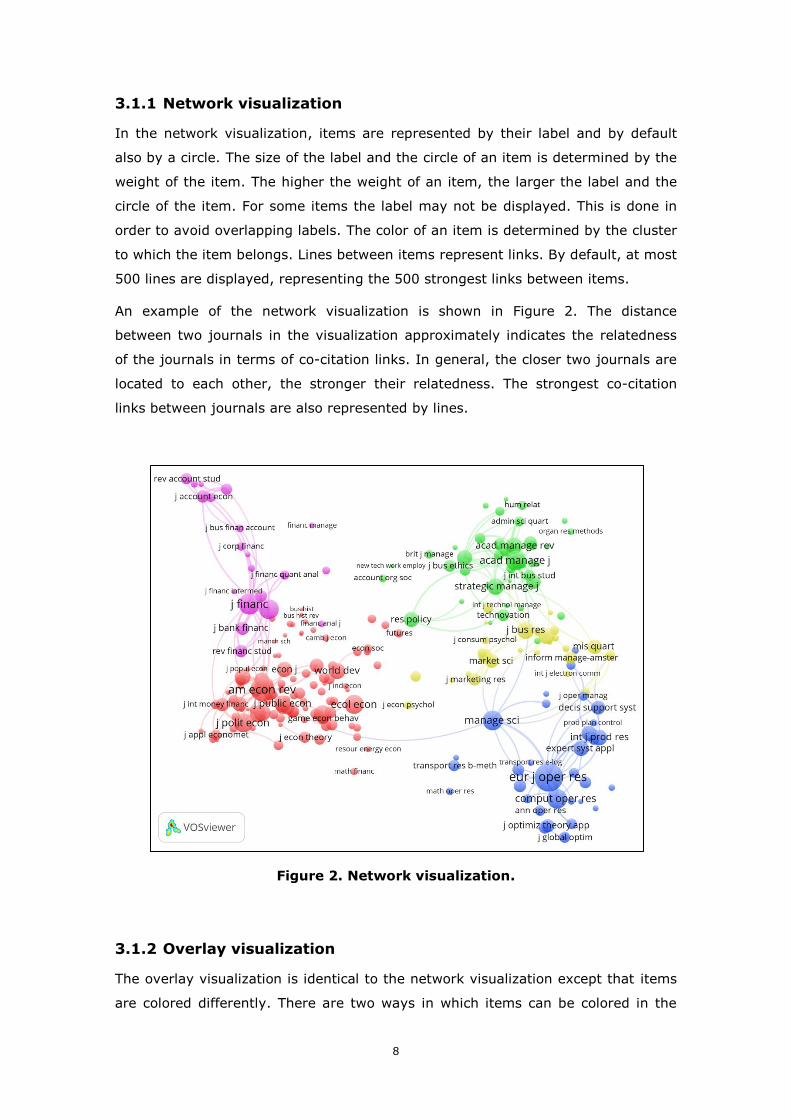
3.1.1 Network visualization
In the network visualization, items are represented by their label and by default
also by a circle. The size of the label and the circle of an item is determined by the
weight of the item. The higher the weight of an item, the larger the label and the
circle of the item. For some items the label may not be displayed. This is done in
order to avoid overlapping labels. The color of an item is determined by the cluster
to which the item belongs. Lines between items represent links. By default, at most
500 lines are displayed, representing the 500 strongest links between items.
An example of the network visualization is shown in Figure 2. The distance
between two journals in the visualization approximately indicates the relatedness
of the journals in terms of co-citation links. In general, the closer two journals are
located to each other, the stronger their relatedness. The strongest co-citation
links between journals are also represented by lines.
Figure 2. Network visualization.
3.1.2 Overlay visualization
The overlay visualization is identical to the network visualization except that items
are colored differently. There are two ways in which items can be colored in the
9
overlay visualization. If items have scores, the color of an item is determined by
the score of the item, where by default colors range from blue (low score) to green
(average score) to red (high score). On the other hand, if items have user-defined
colors (specified using the red, green, and blue columns in a VOSviewer map file;
see Subsection 4.1.1), the color of an item is determined by the user-defined color
of the item. If items have neither scores nor user-defined colors, the overlay
visualization is not available.
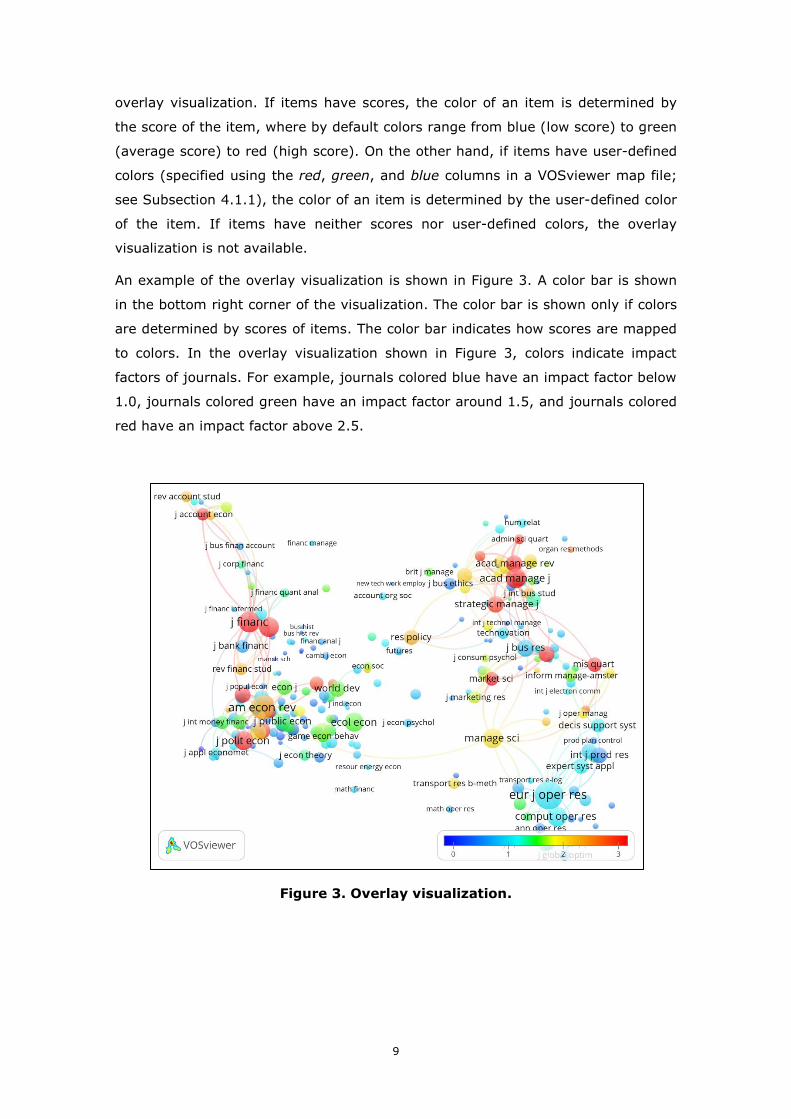
An example of the overlay visualization is shown in Figure 3. A color bar is shown
in the bottom right corner of the visualization. The color bar is shown only if colors
are determined by scores of items. The color bar indicates how scores are mapped
to colors. In the overlay visualization shown in Figure 3, colors indicate impact
factors of journals. For example, journals colored blue have an impact factor below
1.0, journals colored green have an impact factor around 1.5, and journals colored
red have an impact factor above 2.5.
Figure 3. Overlay visualization.
10
3.1.3 Density visualization
There are two variants of the density visualization. We first discuss the item
density visualization, followed by the cluster density visualization. The Item
density and Cluster density radio buttons in the options panel can be used to
switch between the two variants of the density visualization. We refer to Van Eck
and Waltman (2010) for a discussion of the technical implementation of the density
visualization.
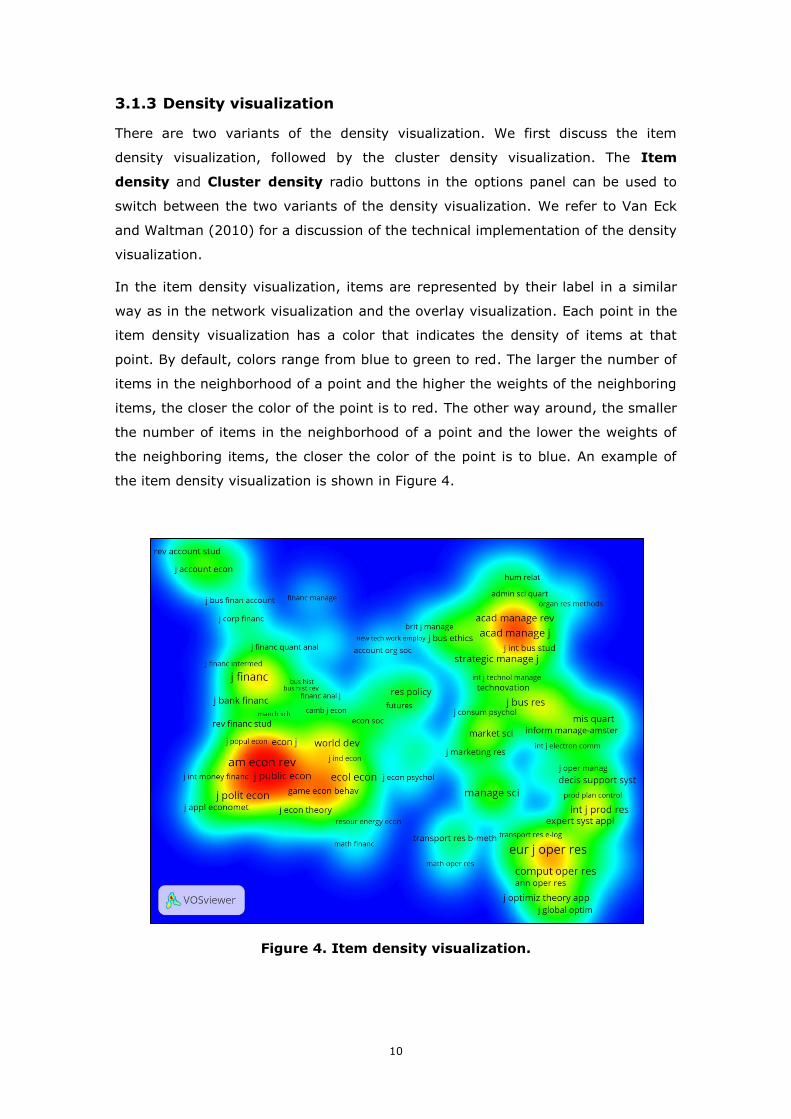
In the item density visualization, items are represented by their label in a similar
way as in the network visualization and the overlay visualization. Each point in the
item density visualization has a color that indicates the density of items at that
point. By default, colors range from blue to green to red. The larger the number of
items in the neighborhood of a point and the higher the weights of the neighboring
items, the closer the color of the point is to red. The other way around, the smaller
the number of items in the neighborhood of a point and the lower the weights of
the neighboring items, the closer the color of the point is to blue. An example of
the item density visualization is shown in Figure 4.
Figure 4. Item density visualization.
11
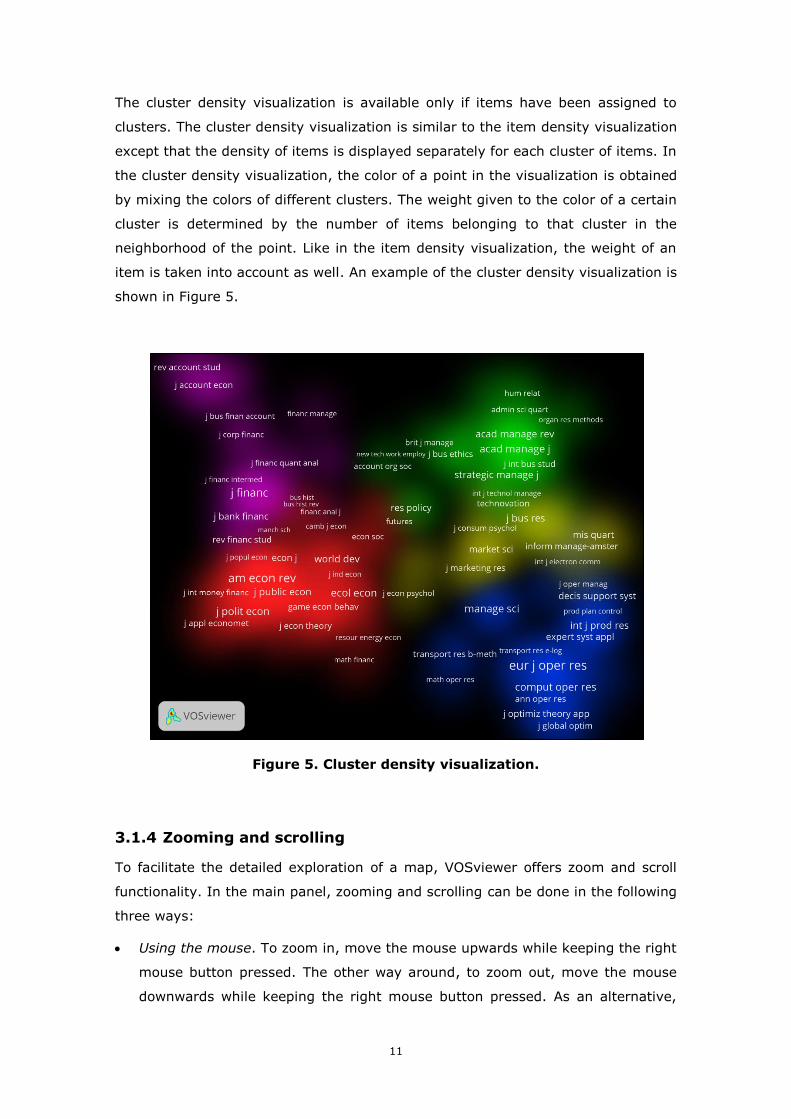
The cluster density visualization is available only if items have been assigned to
clusters. The cluster density visualization is similar to the item density visualization
except that the density of items is displayed separately for each cluster of items. In
the cluster density visualization, the color of a point in the visualization is obtained
by mixing the colors of different clusters. The weight given to the color of a certain
cluster is determined by the number of items belonging to that cluster in the
neighborhood of the point. Like in the item density visualization, the weight of an
item is taken into account as well. An example of the cluster density visualization is
shown in Figure 5.
Figure 5. Cluster density visualization.
3.1.4 Zooming and scrolling
To facilitate the detailed exploration of a map, VOSviewer offers zoom and scroll
functionality. In the main panel, zooming and scrolling can be done in the following
three ways:
Using the mouse. To zoom in, move the mouse upwards while keeping the right
mouse button pressed. The other way around, to zoom out, move the mouse
downwards while keeping the right mouse button pressed. As an alternative,
12
the mouse wheel can be used to zoom in and out. To scroll through a map,
move the mouse while keeping the left mouse button pressed.
Using the navigation buttons in the top right corner of the main panel (see
Figure 1). Use the plus and minus buttons to zoom in and out. Use the arrow
buttons to scroll through a map.
Using the keyboard. Use the plus and minus keys to zoom in and out. Use the
arrow keys to scroll through a map.
3.2 Options panel
The options panel can be used to make adjustments to the visualization of the
currently active map presented in the main panel. The network visualization, the
overlay visualization, and the density visualization each provide somewhat different
options. Some of the options are not always available. The options panel shows
only the options that are relevant for the currently active map.
When the network visualization or the overlay visualization is selected, the
following options may be available:
Visualization.
o Scale. This slider determines the size of the labels of items in the
visualization of the currently active map. It also determines the thickness of
the lines used to display links between items.
o Weights. When items have multiple weight attributes, the Weights drop
down list determines the currently selected weight attribute. This weight
attribute then determines how prominently items are shown in the
visualization of the currently active map. The higher the weight of an item,
the larger the label of the item in the visualization.
o Scores. This drop down list is available only if the overlay visualization is
selected. When items have multiple score attributes, the Scores drop down
list determines the currently selected score attribute. This score attribute
then determines the coloring of items in the visualization of the currently
active map. By default, the higher (lower) the score of an item, the closer
the color of the item is to red (blue).
Labels.
o Size variation. The higher the weight of an item, the larger the label of the
item in the visualization of the currently active map. The Size variation
slider determines the strength of this effect.
13
o Circles and Frames. These radio buttons determine how items are
represented in the visualization of the currently active map. If the Circles
radio button is selected, items are represented by their label and by a circle.
If the Frames radio button is selected, items are represented by their label
displayed within a rectangular frame.
o Max. length. This text box determines the maximum length of a label
displayed in the visualization of the currently active map. If the length of
the label of an item exceeds the maximum length, only the first part of the
label is displayed.
o Font. This drop down list determines the font that is used to display the
labels of items in the visualization of the currently active map. The
availability of fonts in the Font drop down list depends on the use of CJKV
(Chinese, Japanese, Korean, and Vietnamese) characters in the labels of
items. If the labels of items do not include CJKV characters, a number of
fonts are available, with the Open Sans font being selected by default. If
the labels of items do include CJKV characters, only the SansSerif font is
available. The SansSerif font ensures that CJKV characters are displayed
correctly.
Lines.
o Size variation. The stronger the link between two items, the thicker the
line that is used to display the link in the visualization of the currently active
map. The Size variation slider determines the strength of this effect.
o Min. strength and Max. lines. In the visualization of the currently active
map, links between items can be displayed using lines. The Min. strength
and Max. lines text boxes determine, respectively, the minimum strength
of links displayed in the visualization and the maximum number of links
displayed in the visualization. If the number of links that have the required
minimum strength exceeds the maximum number of links, only the
strongest links are displayed.
o Colored lines. This check box determines whether links are displayed using
gray lines or colored lines.
o Curved lines. This check box determines whether links are displayed using
straight lines or curved lines.
14
Colors.
o Cluster Colors. This button is available only if the network visualization is
selected. The button offers four options:
Edit. This option is the default choice. Choose this option to edit the
current cluster colors in the Edit Cluster Colors dialog box.
Import. Choose this option to import cluster colors from a cluster colors
file (see Subsection 4.4.14.4).
Export. Choose this option to export the current cluster colors to a
cluster colors file (see Subsection 4.4.1).
Restore original. Choose this option to restore the original cluster
colors.
o Overlay Colors. This button is available only if the overlay visualization is
selected and if items have scores. The button offers four options:
Set range. This option is the default choice. Choose this option to bring
up the Set Overlay Colors Range dialog box. This dialog box can be
used to change the minimum and the maximum score that determine
how the scores of items are mapped to colors. By default, scores less
than or equal to the minimum score are mapped to blue, scores equal to
the average of the minimum and the maximum score are mapped to
green, and scores greater than or equal to the maximum score are
mapped to red.
The Set Overlay Colors Range dialog box can also be used to
determine how the scores of items are normalized. By default, no
normalization is applied. If the Divide by mean option is selected in the
Normalize scores drop down list, the scores of items are normalized
by dividing each score by the mean score of all items.5 If the Subtract
mean option is selected, the scores of items are normalized by
subtracting from each score the mean score of all items. Finally, if the
Subtract mean and divide by st. dev. option is selected, the scores of
items are normalized by first subtracting from each score the mean
score of all items and by then dividing by the standard deviation of the
scores of all items (i.e., a z-score normalization). Working with
5 This option is available only if the scores of items all have the same sign. In other words, the scores of
items must either all be non-negative or all be non-positive.
15
normalized scores is an advanced feature of VOSviewer that should be
used only in special cases. For most purposes, we recommend not to
normalize scores.
Import. Choose this option to import overlay colors from an overlay
colors file (see Subsection 4.44.4.2).
Export. Choose this option to export the current overlay colors to an
overlay colors file (see Subsection 4.4.2).
Restore original. Choose this option to restore the original overlay
colors.
o Black background. This check box determines whether the visualization of
the currently active map has a white or a black background color.
When the density visualization is selected, the following options may be available:
Visualization.
o Scale. This slider determines the size of the labels of items in the
visualization of the currently active map.
o Weights. When items have multiple weight attributes, the Weights drop
down list determines the currently selected weight attribute. This weight
attribute then determines how prominently items are shown in the
visualization of the currently active map. The higher the weight of an item,
the larger the label of the item in the visualization. The selected weight
attribute is also used in the calculation of the density of items.
Labels. These options are identical to the options provided when the network
visualization or the overlay visualization is selected (except that the Circles
and Frames radio buttons are not available).
Density.
o Kernel width. This slider determines the value of the kernel width
parameter. We refer to Van Eck and Waltman (2010) for more
information about this parameter.
o Item density and Cluster density. These radio buttons determine
whether the item density visualization or the cluster density visualization
is selected.
16
Colors.
o Density Colors. This button is available only if the item density
visualization is selected. The button offers three options:
Import. This option is the default choice. Choose this option to import
density colors from a density colors file (see Subsection 4.4.3).
Export. Choose this option to export the current density colors to a
density colors file (see Subsection 4.4.3).
Restore original. Choose this option to restore the original density
colors.
o Cluster Colors. This button is available only if the cluster density
visualization is selected. The button offers four options:
Edit. This option is the default choice. Choose this option to edit the
current cluster colors in the Edit Cluster Colors dialog box.
Import. Choose this option to import cluster colors from a cluster colors
file (see Subsection 4.4.1).
Export. Choose this option to export the current cluster colors to a
cluster colors file (see Subsection 4.4.1).
Restore original. Choose this option to restore the original cluster
colors.
o White background. This check box is available only if the cluster density
visualization is selected. The check box determines whether the cluster
density visualization has a black or a white background color.
3.3 Information panel
The information panel is available only if items have a description attribute.
Description attributes may for example have been made available using the
description column in a VOSviewer map file (see Subsection 4.1.1). The
information panel presents descriptions of items in the currently active map. When
the mouse pointer is moved over an item in the main panel, the description of the
item is shown in the information panel.
3.4 Overview panel
The overview panel presents an overview of the currently active map. Each item in
the map is represented by a small colored dot. A rectangular frame is displayed in
17
the overview panel to indicate the area in the currently active map that is shown in
the main panel. By left-clicking in the overview panel, it is possible to move to a
different area in the currently active map. This new area is then shown in the main
panel.
3.5 Action panel
The action panel can be used to perform different kinds of actions. The panel
consists of three tabs: The File tab, the Items tab, and the Analysis tab. These
tabs are discussed in Subsections 3.5.1, 3.5.2, and 3.5.3. The Create Map wizard,
which can be accessed from the File tab, plays an important role in VOSviewer.
This wizard is discussed separately in Subsection 3.5.4.
3.5.1 File tab
The File tab can be used to perform a number of basic actions. The following
buttons are available on the File tab:
Map.
o Create. Use this button to create a new map. The button brings up the
Create Map wizard. This wizard is discussed in detail in Subsection 3.5.4.
o Open. Use this button to open an existing map. The button brings up the
Open Map dialog box. To open a map, a VOSviewer map file and optionally
also a VOSviewer network file (see Section 4.1) can be provided.
Alternatively, a GML file or Pajek files can be provided.6
o Save. Use this button to save the currently active map. The button brings
up the Save Map dialog box. A map can be saved in a VOSviewer map file
and a VOSviewer network file (see Section 4.1). Alternatively, a map can be
saved in a GML file or in Pajek files.
o Screenshot. This button offers four options:
Save. This option is the default choice. Choose this option to save a
screenshot of the visualization of the currently active map presented in
the main panel. The screenshot resembles the visualization of the
6 GML (graph modeling language) files are supported by various software tools for network analysis and
network visualization, for example by Gephi, a popular software tool for network visualization available
at https://gephi.org. Pajek is a well-known software tool for social network analysis (De Nooy, Mrvar, &
Batagelj, 2011). It is available at http://pajek.imfm.si/doku.php. VOSviewer supports Pajek network,
matrix, partition, and vector files.
18
currently active map as closely as possible. However, if the Optimize
labeling check box in the Screenshot Options dialog box (see below)
is checked, the visibility of labels in the screenshot is optimized. This
means that some labels not visible in the visualization of the currently
active map may be visible in the screenshot. Screenshots can be saved
in a number of graphic file formats. For most purposes, we recommend
the PNG format. Some formats, such as EPS, PDF, and SVG, use vector
graphics to save a screenshot. This has the advantage that the
screenshot can be resized without loss of quality.
Print. Choose this option to print a screenshot of the visualization of the
currently active map presented in the main panel.
Copy to clipboard. Choose this option to copy a screenshot of the
visualization of the currently active map presented in the main panel.
The screenshot is copied to the clipboard and can for example be pasted
into a Word document or a PowerPoint presentation.
Options. Choose this option to bring up the Screenshot Options
dialog box. This dialog box can be used to change some settings related
to screenshots.
The Scaling drop down list determines the resolution (i.e., the number
of pixels) of a screenshot. The resolution is calculated relative to the
resolution of the main panel. Using a scaling of 100%, screenshots have
the same resolution as the main panel. Using the default scaling of
200%, screenshots have a resolution that is twice as high (i.e., twice as
many pixels horizontally and vertically) as the resolution of the main
panel. The Scaling drop down list has no effect on screenshots that are
saved in a file format that uses vector graphics.
The Optimize labeling check box determines whether the visibility of
labels in a screenshot is optimized. Optimizing the visibility of labels
means that some labels not visible in the visualization of the currently
active map presented in the main panel may be visible in a screenshot.
The Include border check box determines whether a border is included
around a screenshot.
Info.
o Manual. Use this button to open the VOSviewer manual. This requires an
internet connection.
19
o About VOSviewer. This button brings up the About VOSviewer dialog
box. This dialog box provides information about VOSviewer. It shows the
version number of VOSviewer, a copyright notice, a license text, a link to
the VOSviewer website, a list of software libraries used by VOSviewer, the
version number of Java, and the amount of memory that is used by
VOSviewer.
3.5.2 Items tab
The Items tab presents a list of items in the currently active map. By default, a list
of all items in the map is presented. However, a filter can be used to restrict the
list to a subset of the items in the map. To do so, enter a filter string in the Filter
text box. This yields a list of all items with a label that contains the filter string.
The Group items by cluster check box determines how items are listed. If the
check box is unchecked, items are simply listed alphabetically. If the check box is
checked, items are first grouped by cluster and then listed alphabetically within
each cluster.
By double-clicking on an item on the Items tab, it is possible to zoom in on the
item in the visualization of the currently active map presented in the main panel.
3.5.3 Analysis tab
The Analysis tab can be used to update the layout and the clustering of the
currently active map. This is done using the VOS layout technique and the VOS
clustering technique. 7 The Analysis tab can also be used to change the
parameters of these techniques. The following options are available on the
Analysis tab:
Normalization. Use the normalization method drop down list to determine
how the strength of the links between items is normalized. Normalized link
strengths are used as input for the VOS layout technique and the VOS
clustering technique. The following options are available in the normalization
method drop down list:
o No normalization. If this option is selected, no normalization is performed.
We generally do not recommend this option.
7 Together these two techniques provide a unified framework for layout and clustering. We refer to Van
Eck, Waltman, Dekker, and Van den Berg (2010), Waltman, Van Eck, and Noyons (2010), Waltman and
Van Eck (2013), and Van Eck and Waltman (2014) for more information about these techniques.
20
o Association strength. If this option is selected, the association strength
method is used for normalizing the strength of the links between items.
Apart from a multiplicative constant, this method is identical to Eq. (6) in
Van Eck and Waltman (2009). This option is selected by default.
o Fractionalization. If this option is selected, the fractionalization method is
used for normalizing the strength of the links between items. Apart from a
multiplicative constant, this method is identical to Eq. (13) in Van Eck and
Waltman (2009).
o LinLog/modularity. If this option is selected, normalization is performed
in the same way as in the LinLog layout technique and the modularity
clustering technique. For more information about these techniques, we refer
to Newman (2004) and Noack (2007, 2009).
Layout.
o Attraction and Repulsion. These parameters influence the way in which
items are located in a map by the VOS layout technique. The Attraction
parameter must have an integer value between -9 and +10. The Repulsion
parameter must have an integer value between -10 and +9. The value of
the Repulsion parameter must be lower than the value of the Attraction
parameter. For most purposes, our recommendation is to set the
Attraction and Repulsion parameters to values of, respectively, 2 and 1.
Values of 2 and 0 or values of 1 and 0 sometimes also yield good results.
o Use default values. This check box determines whether default values of
the attraction and repulsion parameters are used when a new map is
created using the Create Map wizard (see Subsection 3.5.13.5.4). If the
check box is checked, default parameters values are used. These default
parameters values depend on the type of map that is created.8 If the check
box is not checked, the parameter values specified in the Attraction and
Repulsion text boxes are used.
o Advanced Parameters. This button brings up the Advanced Layout
Parameters dialog box. This dialog box can be used to change a number of
8 The repulsion parameter has a default value of -1 when creating a map of a co-authorship network of
authors. It has a default value of 0 when creating a map of a co-occurrence network of keywords or a
map of a citation network of documents. In all other cases, the repulsion parameter has a default value
of 1. The attraction parameter always has a default value of 2.
21
more advanced parameters of the VOS layout technique. The following
parameters are available:
Random starts. This parameter determines the number of times the
optimization algorithm of the VOS layout technique is run. Each time the
optimization algorithm is run, a different layout may be obtained. The
best layout obtained in all runs of the optimization algorithm is used as
the final layout. The higher the value of the Random starts parameter,
the higher the quality of the final layout that is obtained.
Max. iterations. This parameter determines the maximum number of
iterations performed by the optimization algorithm of the VOS layout
technique. The higher the value of the parameter, the higher the quality
of the layout that is obtained. In general, the default value of the
parameter works well and does not need to be changed.
Initial step size, Step size reduction, and Step size convergence.
These are technical parameters of the optimization algorithm of the VOS
layout technique. The parameters must have values between 0.000001
and 1. In general, the default values of the parameters work well and do
not need to be changed.
Random seed. This parameter determines the seed of the random
number generator used by the optimization algorithm of the VOS layout
technique. The seed must be a non-negative integer.
o Update Layout. This button is available only if information is available
about the links between the items in the currently active map. Use this
button to update the layout of the currently active map using the VOS
layout technique.
Clustering.
o Resolution. This parameter determines the level of detail of the clustering
produced by the VOS clustering technique. The parameter must have a non-
negative value. The higher the value of the parameter, the larger the
number of clusters produced by the VOS clustering technique. We
recommend to try out different values for the Resolution parameter and to
use the value that yields the most appropriate level of detail for one’s
purposes.
o Min. cluster size. This parameter determines the minimum size of clusters
produced by the VOS clustering technique. Each cluster produced by the
22
VOS clustering technique is expected to include at least the minimum
number of items specified by this parameter. The Min. cluster size
parameter can be used to simplify the clustering results obtained from the
VOS clustering technique by getting rid of small and uninteresting clusters.
o Merge small clusters. This check box determines how the VOS clustering
technique handles small clusters. Small clusters are clusters that do not
have the minimum cluster size specified by the Min. cluster size
parameter. If the check box is checked, small clusters are merged into
larger clusters. If the check box is not checked, small clusters are discarded
and their items have no cluster assignment.
o Advanced Parameters. This button brings up the Advanced Clustering
Parameters dialog box. This dialog box can be used to change a number of
more advanced parameters of the VOS clustering technique. The following
parameters are available:
Random starts. This parameter determines the number of times the
optimization algorithm of the VOS clustering technique is run. Each time
the optimization algorithm is run, a different clustering may be obtained.
The best clustering obtained in all runs of the optimization algorithm is
used as the final clustering. The higher the value of the Random starts
parameter, the higher the quality of the final clustering that is obtained.
Iterations. This parameter determines the number of iterations
performed by the optimization algorithm of the VOS clustering technique.
The higher the value of the parameter, the higher the quality of the
clustering that is obtained. In general, the default value of the
parameter works well and does not need to be changed.
Random seed. This parameter determines the seed of the random
number generator used by the optimization algorithm of the VOS
clustering technique. The seed must be a non-negative integer.
o Update Clustering. This button is available only if information is available
about the links between the items in the currently active map. Use this
button to update the clustering of the currently active map using the VOS
clustering technique.
23
Rotate/flip.
o Rotate. Use this button to rotate the currently active map. The Degrees to
rotate parameter determines the number of degrees by which the map is
rotated.
o Flip Horizontally. Use this button to flip the currently active map in
horizontal direction.
o Flip Vertically. Use this button to flip the currently active map in vertical
direction.
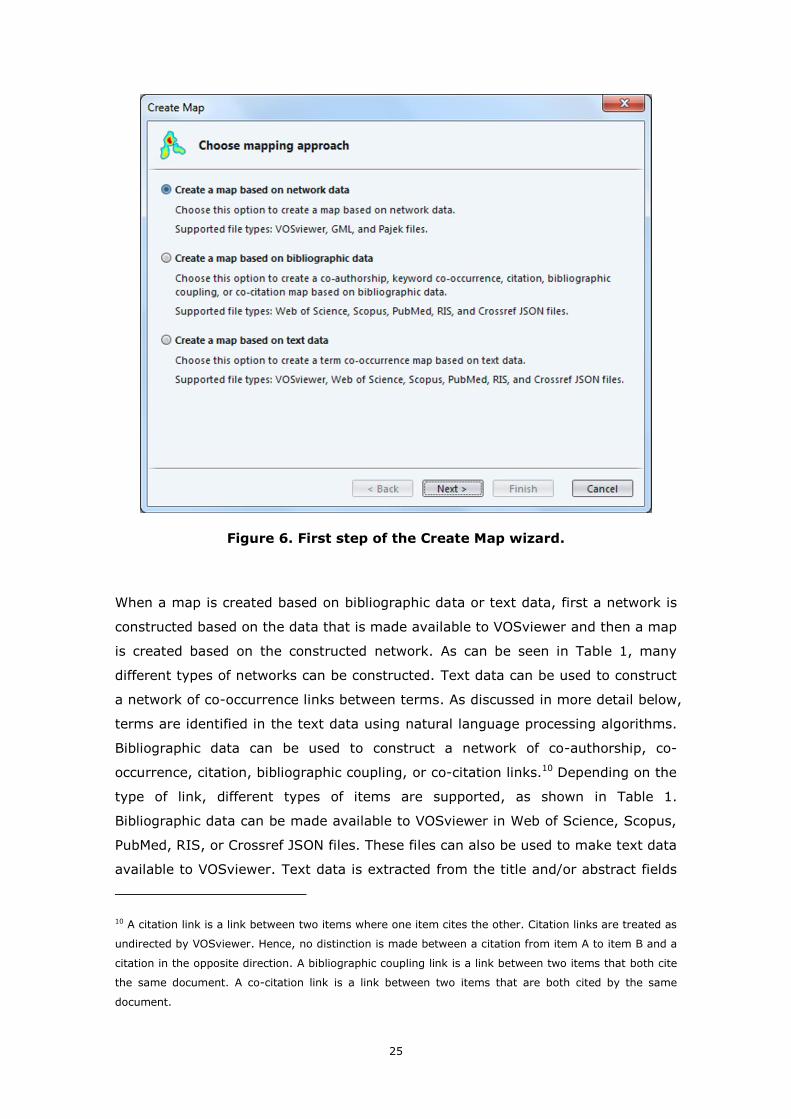
3.5.4 Create Map wizard
The Create Map wizard can be used to create a new map. There are a number of
ways in which a new map can be created. The Create Map wizard offers a guide
through the various options in a number of steps. A summary of the main options
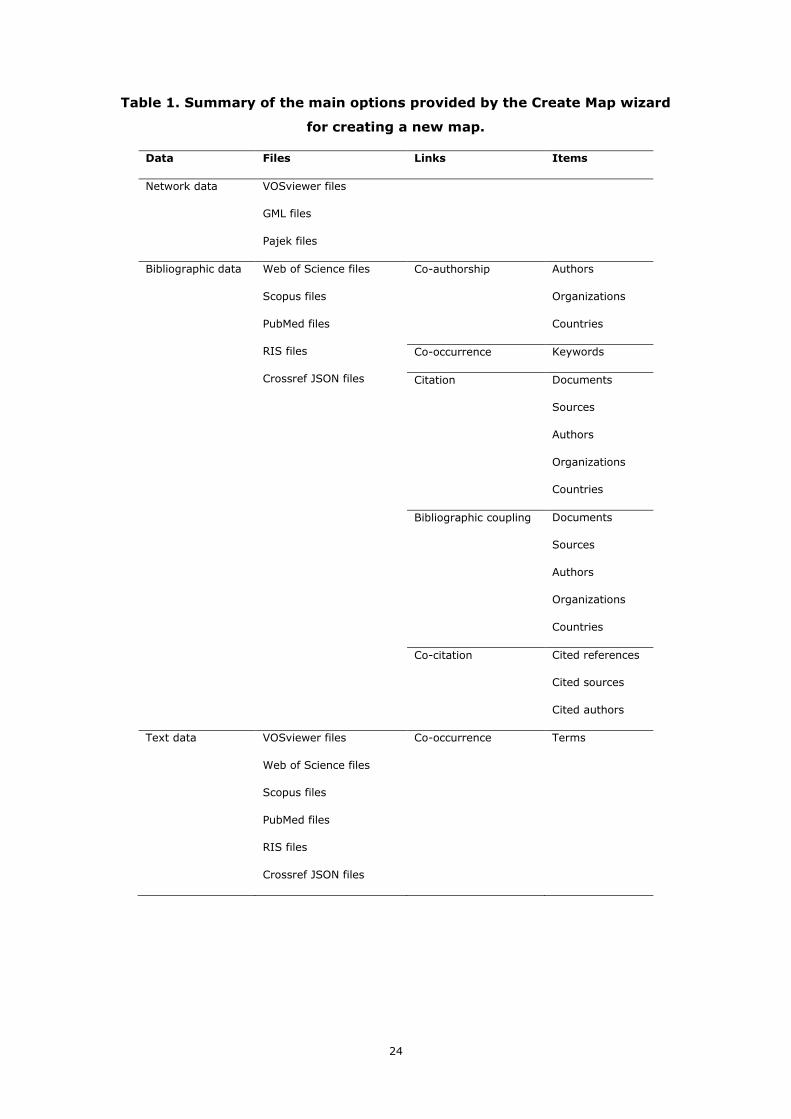
provided by the wizard is presented in Table 1.9
As can be seen in Table 1, a map can be created based on network data,
bibliographic data, or text data. The choice between these three types of data is
made in the first step of the Create Map wizard, as shown in Figure 6. When a
map is created based on network data, VOSviewer needs to be provided with
information about the items in the network and the links between the items. This
information can be made available in a VOSviewer network file, possibly
complemented with a VOSviewer map file (see Section 4.1). Alternatively, the
information can be made available in a GML file or in Pajek files. There are no
restrictions on the nature of the items and the links in a network. The items and
the links will typically be of a bibliometric nature, but this is not a requirement.
9 The terminology used in Table 1 is identical to the terminology that is used in the Create Map wizard.
Elsewhere in this manual, we sometimes use a different terminology. Documents may be referred to as
publications, sources as journals, and authors as researchers.
24
Table 1. Summary of the main options provided by the Create Map wizard
for creating a new map.
Data Files Links Items
Network data VOSviewer files
GML files
Pajek files
Bibliographic data Web of Science files
Scopus files
PubMed files
RIS files
Crossref JSON files
Co-authorship Authors
Organizations
Countries
Co-occurrence Keywords
Citation Documents
Sources
Authors
Organizations
Countries
Bibliographic coupling Documents
Sources
Authors
Organizations
Countries
Co-citation Cited references
Cited sources
Cited authors
Text data VOSviewer files
Web of Science files
Scopus files
PubMed files
RIS files
Crossref JSON files
Co-occurrence Terms
25
Figure 6. First step of the Create Map wizard.
When a map is created based on bibliographic data or text data, first a network is
constructed based on the data that is made available to VOSviewer and then a map
is created based on the constructed network. As can be seen in Table 1, many
different types of networks can be constructed. Text data can be used to construct
a network of co-occurrence links between terms. As discussed in more detail below,
terms are identified in the text data using natural language processing algorithms.
Bibliographic data can be used to construct a network of co-authorship, co-
occurrence, citation, bibliographic coupling, or co-citation links.10 Depending on the
type of link, different types of items are supported, as shown in Table 1.
Bibliographic data can be made available to VOSviewer in Web of Science, Scopus,
PubMed, RIS, or Crossref JSON files. These files can also be used to make text data
available to VOSviewer. Text data is extracted from the title and/or abstract fields
10 A citation link is a link between two items where one item cites the other. Citation links are treated as
undirected by VOSviewer. Hence, no distinction is made between a citation from item A to item B and a
citation in the opposite direction. A bibliographic coupling link is a link between two items that both cite
the same document. A co-citation link is a link between two items that are both cited by the same
document.
26
in these files. Alternatively, text data can be made available in a VOSviewer corpus
file, possibly complemented with a VOSviewer scores file (see Section 4.2).
Below, a number of topics related to the Create Map wizard are discussed in more
detail.
File types for bibliographic data
VOSviewer supports five file types for bibliographic data: Web of Science files,
Scopus files, PubMed files, RIS files, and Crossref JSON files. We now discuss the
use of each of these file types in more detail.
Web of Science can be accessed at www.webofscience.com. A subscription is
required. When downloading data from Web of Science, make sure that the Web
of Science Core Collection database is selected. Choose the Save to Other File
Formats option, and choose either the Plain Text or the Tab-delimited file
format. Although VOSviewer supports both file formats, we recommend the use of
the tab-delimited format. When asked which data elements to download, choose
the Full Record and Cited References option. Downloading cited reference data
is necessary for identifying citation, bibliographic coupling, and co-citation links
between items.
Scopus can be accessed at www.scopus.com. A subscription is required. To
download data from Scopus, choose the CSV export option. (Do not choose the
Download option!) Make sure that the data is downloaded in a CSV file and that
all data elements are included.
PubMed can be accessed at www.ncbi.nlm.nih.gov/pubmed/. To download data
from PubMed, choose the Send to option, choose File as the destination, and
choose MEDLINE as the file format. Data downloaded from PubMed cannot be
used for identifying citation, bibliographic coupling, and co-citation links between
items. Hence, when working with PubMed data, some options in the Create Map
wizard will not be available.
The RIS file format is a general file format for bibliographic data. It is supported by
a large number of software tools, such as EndNote, Mendeley, and Publish or
Perish. Like PubMed data, data in a RIS file cannot be used for identifying citation,
bibliographic coupling, and co-citation links between items.
Crossref can be accessed through an application programming interface (API). The
documentation of this API is available at https://github.com/CrossRef/rest-api-doc.
Data can be downloaded through the API in a Crossref JSON file. Instead of
working directly with the Crossref API, it is also possible to provide a set of DOIs to
27
VOSviewer. VOSviewer will then use these DOIs to download data for the
corresponding documents through the Crossref API. An example of the use of
Crossref data in VOSviewer is presented in a blog post available at
www.cwts.nl/blog?article=n-r2r294. This blog post also highlights some limitations
of Crossref data.
Finally, we note that Web of Science and Scopus impose download restrictions.
Files downloaded from Web of Science and Scopus may contain data for at most
500 and 2000 documents, respectively. In order to work with data for a larger
number of documents, the data needs to be downloaded in multiple batches. Each
batch is saved in a separate file. To facilitate working with data downloaded in
multiple batches, VOSviewer is able to handle multiple Web of Science files or
multiple Scopus files when creating a map. Similarly, VOSviewer is also able to
handle multiple Crossref JSON files. This is convenient because in a single call to
the Crossref API data can be downloaded for at most 1000 documents.
Thesaurus files
When a map is created based on bibliographic data or text data, there often is a
need to perform data cleaning. A VOSviewer thesaurus file can be used for this
purpose.
When creating a map based on bibliographic data, a VOSviewer thesaurus file can
be used to merge different variants of a source title, an author name, an
organization name, a country name, or a cited reference. This may for example be
useful when the name of a researcher is written in different ways in different
documents (e.g., with the first initial only or with all initials). A VOSviewer
thesaurus file can then be used to indicate that different names in fact refer to the
same researcher.
When creating a map based on text data, a VOSviewer thesaurus file can be used
to merge terms. This may be useful not only for merging synonyms (e.g., ‘h-index’
and ‘Hirsch index’), but also for correcting spelling differences (e.g., ‘behavior’ and
‘behaviour’). In addition, it may also be useful for merging abbreviated terms with
full terms (e.g., ‘JIF’ and ‘journal impact factor’). A thesaurus file can also be used
to ignore terms. For example, when working with titles and abstracts of scientific
publications, one may want to ignore general terms such as ‘conclusion’, ‘method’,
and ‘result’.
We refer to Section 4.3 for a technical discussion of VOSviewer thesaurus files.
28
Full counting vs. fractional counting
When a map is created based on bibliographic data, the Create Map wizard offers
a choice between two counting methods. By default, full counting is used. The
alternative is to use fractional counting.
To illustrate the difference between the two counting methods, we consider an
example in which a co-authorship network is constructed. As shown in Figure 7, we
have four authors, labeled A1, A2, A3, and A4, and three documents, labeled D1,
D2, and D3. D1 is authored by A1, A2, and A3, D2 is authored by A1 and A3, and
D3 is authored by A2 and A4. The networks constructed using full and fractional
counting are presented in Figure 8. We note that the only difference between the
two networks is in the strength of the links.
Figure 7. Authorship links between four authors and three documents.
Figure 8. Co-authorship network constructed using full (left) or fractional
(right) counting.
In the full counting network, the link between A1 and A3 has a strength of 2. This
indicates that A1 and A3 have co-authored two documents, namely D1 and D2.
29
The other links have a strength of 1, indicating that for each of these links the
associated authors have co-authored one document.
The idea of fractional counting is to reduce the influence of documents with many
authors. When fractional counting is used, the strength of a co-authorship link
between two authors is determined not only by the number of documents co-
authored by the authors but also by the total number of authors of each of the co-
authored documents. In the case of fractional counting, when an author has co-
authored a document with n other authors, this yields a strength of 1 / n for each
of the n co-authorship links. The total strength of the n co-authorship links then
equals 1. This is different from the full counting case, in which each of the n co-
authorship links has a strength of 1, resulting in a total strength of the n co-
authorship links of n.
As can be seen in Figure 8, in the fractional counting case, the link between A2 and
A4 has a strength of 1.0. A2 has co-authored D3 with A4. Because there are no
other authors involved, this results in a co-authorship link with a strength of 1 / 1
= 1.0. A2 has co-authored D1 with A1 and A3. In this case, A2 has two co-authors,
which results in two co-authorship links with a strength of 1 / 2 = 0.5 each. The
link between A1 and A3 has a strength of 1.5. A1 and A3 have co-authored D1 and
D2, resulting in co-authorship links with strengths of 0.5 and 1.0, respectively,
which yields a total strength of 1.5.
We have now explained the difference between full and fractional counting in the
calculation of the strength of co-authorship links. There are similar differences
between the two counting methods in the calculation of the strength of co-
occurrence, bibliographic coupling, and co-citation links. We refer to Perianes-
Rodriguez, Waltman, and Van Eck (2016) for a more in-depth discussion of the
differences between full and fractional counting, including a discussion of the
advantages and disadvantages of each counting method.
Identification and selection of terms
When a map is created based on text data, terms first need to be identified in the
text data and the terms to be included in the map then need to be selected.
The natural language processing algorithms used in the term identification stage
assume the text data made available to VOSviewer to be in English. Other
languages are not supported. The term identification stage consists of the following
five steps:
Removal of copyright statements. In many cases, text data provided to
VOSviewer consists of titles and abstracts of scientific publications. Abstracts
30
may include a copyright statement. VOSviewer removes these copyright
statements. We note that this step is carried out only if the Ignore copyright
statements check box in the Create Map wizard is checked.
Sentence detection. A sentence detection algorithm is applied to the text data.
Using this algorithm, the text data is split up into sentences. VOSviewer uses
the sentence detection algorithm provided by the Apache OpenNLP library.
Part-of-speech tagging. A part-of-speech tagging algorithm is applied to the
text data. Using this algorithm, each word is assigned a part of speech, such as
verb, noun, adjective, preposition, and so on. VOSviewer uses the part-of-
speech tagging algorithm provided by the Apache OpenNLP library.
Noun phrase identification. Noun phrases are identified in the text data.
VOSviewer defines a noun phrase as a sequence of one or more consecutive
words within a sentence such that the last word in the sequence is a noun and
each of the other words is either a noun or an adjective. To identify noun
phrases, VOSviewer considers only the longest possible noun phrases that can
be found in a sentence. Shorter noun phrases embedded within longer ones are
not considered. For example, in the sentence ‘The artificial neural network is
highly accurate’, VOSviewer identifies ‘artificial neural network’ as a noun
phrase, while it does not identify ‘neural network’ and ‘network’ as noun
phrases. We note that in VOSviewer a noun phrase cannot include a preposition.
This for example means that ‘degrees of freedom’ and ‘United States of
America’ are not identified as noun phrases.
Noun phrase unification. Unification of noun phrases is accomplished by
removing most non-alphanumeric characters, by removing accents from
characters, by converting upper case characters to lower case, and by
converting plural noun phrases to singular. Plural to singular conversion is done
by examining the last word in a noun phrase. If the last word is a plural noun,
it is converted to singular.
The term identification stage described above yields a set of noun phrases, or
terms, that have been identified in the text data made available to VOSviewer. In
the second stage, starting from the set of identified terms, a selection of terms is
made. The selection is made by excluding terms with a small number of
occurrences (e.g., by default, terms with fewer than 10 occurrences are excluded),
by excluding terms with a low relevance score, and possibly also by manually
excluding certain terms. The selected terms are included in the map that is created.
The use of relevance scores to select terms requires some further explanation.
When a map is created based on text data, one typically does not want to include
31
general terms, for example terms such as ‘conclusion’, ‘new method’, and
‘interesting result’. These terms provide very little information, and the usefulness
of a map tends to increase when these terms are excluded. To exclude general
terms, VOSviewer calculates for each term a relevance score.11 Terms with a high
relevance score tend to represent specific topics covered by the text data, while
terms with a low relevance score tend to be of a general nature and tend not to be
representative of any specific topic. By excluding terms with a low relevance score,
general terms are filtered out and the focus shifts to more specific and more
informative terms. By default, 40% of the terms are excluded based on their
relevance score. However, we recommend to also explore the effect of excluding a
lower or a higher percentage of terms.
Finally, we need to discuss the consequences of excluding a term. In the term
selection stage, when one chooses to exclude a multi-word term, occurrences of
this term may be counted as occurrences of a shorter term. To illustrate this,
suppose that ‘network’, ‘neural network’, and ‘artificial neural network’ are among
the terms identified in the text data made available to VOSviewer. Suppose further
that one of the sentences in the text data is the sentence ‘The artificial neural
network is highly accurate’. As discussed above, only the term ‘artificial neural
network’ is identified in this sentence, not the terms ‘neural network’ and ‘network’.
However, suppose now that in the term selection stage one chooses to exclude the
term ‘artificial neural network’. VOSviewer will then search for a shorter term in the
sentence ‘The artificial neural network is highly accurate’, and it will find the term
‘neural network’. If one chooses to exclude this term as well, VOSviewer will search
for an even shorter term, in which case it will find the term ‘network’. This shows
how excluding a multi-word term may cause occurrences of this term to be
counted as occurrences of a shorter term.
Custom weight and score attributes
When a map is created based on bibliographic data or text data, custom weight
and score attributes may be made available. Which custom weight and score
attributes are made available depends on the choice of the type of link and the
type of item. It also depends on the data that is provided to VOSviewer. Citation-
related attributes are made available only when VOSviewer is provided with Web of
Science, Scopus, or Crossref data.
11 We refer to Van Eck and Waltman (2011) for a brief explanation of the calculation of relevance scores.
32
The following custom weight attributes may be made available:
Occurrences. When working with keywords, the Occurrences attribute indicates
the number of documents in which a keyword occurs. When working with terms,
the definition of the Occurrences attribute depends on the counting method
that is chosen in the Create Map wizard. In the case of binary counting, the
Occurrences attribute indicates the number of documents in which a term
occurs at least once. In the case of full counting, the Occurrences attribute
indicates the total number of occurrences of a term in all documents.
Documents. The number of documents published by a source, an author, an
organization, or a country.
Citations. When working with co-authorship, citation, or bibliographic coupling
links, the Citations attribute indicates the number of citations received by a
document or the total number of citations received by all documents published
by a source, an author, an organization, or a country. When working with co-
citation links, the Citations attribute indicates the number of citations made to a
cited reference, a cited source, or a cited author.
Norm. citations. The normalized number of citations received by a document or
the total normalized number of citations received by all documents published
by a source, an author, an organization, or a country.12
The following custom score attributes may be made available:
Pub. year. The publication year of a document.
Avg. pub. year. The average publication year of the documents in which a
keyword or a term occurs or the average publication year of the documents
published by a source, an author, an organization, or a country.
Citations. The number of citations received by a document.
Avg. citations. The average number of citations received by the documents in
which a keyword or a term occurs or the average number of citations received
by the documents published by a source, an author, an organization, or a
country.
Norm. citations. The normalized number of citations received by a document.
Avg. norm. citations. The average normalized number of citations received by
the documents in which a keyword or a term occurs or the average normalized
12 The normalized number of citations of a document equals the number of citations of the document
divided by the average number of citations of all documents published in the same year and included in
the data that is provided to VOSviewer. The normalization corrects for the fact that older documents
have had more time to receive citations than more recent documents.
33
number of citations received by the documents published by a source, an
author, an organization, or a country.
When a map is created based on text data provided in a VOSviewer corpus file,
custom score attributes are made available only if a VOSviewer scores file is
provided as well (see Section 4.2 for a discussion of VOSviewer corpus and scores
files). In that case, for each score attribute, the score of a term is calculated as the
average score of the documents in which the term occurs.
34
4 File types
In this chapter, we discuss a number of file types supported by VOSviewer. These
file types have been designed specifically for VOSviewer. In principle, they are not
supported by other software tools.
The file types discussed in this chapter are simple text files that can be viewed and
edited using a text editor or a spreadsheet program (e.g., Excel). Files may have
multiple columns. Each line in a file then contains multiple fields separated from
each other by a comma, a semicolon, or a tab. If a field (e.g., the label of an item)
itself contains a comma or a semicolon, the field needs to be enclosed within
double quotes.
All example files referred to in this chapter are distributed together with VOSviewer.
4.1 Map and network files
In this section, we discuss map and network files.
4.1.1 Map files
A map file is a text file that contains information about the items in a map. Items
are characterized by a number of attributes. Each column in a map file corresponds
with an attribute. With the exception of the first line, each line in a map file
corresponds with an item. The first line in a map file is a header line that indicates
for each of the columns in the file the attribute that is represented by that column.
Below, we list the columns that can be included in a map file. For each column, we
provide the column header and we describe the corresponding attribute.
id The ID of an item. Items need to have an ID only if a map file is used in
combination with a network file.
label The label of an item.
sublabel The sublabel of an item. In the visualization of a map, the sublabel of an item is
displayed below the ordinary label of the item. Sublabels are displayed in a
smaller font.
description The description of an item. The description of an item is used to provide
information about the item in the information panel. This attribute has a string
value that may include HTML formatting.
url The URL of an item. This attribute can be used to associate a webpage with an
item. Clicking on an item in the visualization of a map will cause the webpage
associated with the item to be opened in a web browser.
x The horizontal coordinate of an item.
35
y The vertical coordinate of an item.
cluster The number of the cluster to which an item belongs. This attribute must have an
integer value between 1 and 1000.
weight The weight of an item. This attribute must have a non-negative numerical value.
The higher the weight of an item, the more prominently the item is shown in the
visualization of a map.
normalized weight The normalized weight of an item. This attribute must have a non-negative
numerical value. The higher the normalized weight of an item, the more
prominently the item is shown in the visualization of a map. The default
presentation of an item is obtained if the item has a normalized weight of 1. We
note that this attribute should be used only in special cases. For most purposes,
we recommend not to use it.
score The score of an item. In the overlay visualization of a map, items can be colored
based on their score.
red The red component of the user-defined color of an item. This attribute must have
an integer value between 0 and 255. In the overlay visualization of a map, items
can be colored based on their user-defined color.
green The green component of the user-defined color of an item. This attribute must
have an integer value between 0 and 255. In the overlay visualization of a map,
items can be colored based on their user-defined color.
blue The blue component of the user-defined color of an item. This attribute must have
an integer value between 0 and 255. In the overlay visualization of a map, items
can be colored based on their user-defined color.
A map file always includes only a subset of the above columns. There are a number
of restrictions on the columns that can be included in a map file:
There must be an id column or a label column. (If there is no label column, the
ID of an item is used as the label of the item.)
If there is a sublabel column, there must be a label column as well.
The x and y columns must be used together.
The weight column and the normalized weight column cannot be used together.
The score column and the red, green, and blue columns cannot be used
together.
The red, green, and blue columns must be used together.
It is possible to include multiple weight and multiple score columns in a map file.
Each weight or score column then represents a different weight of score attribute
with its own label. For example, a map file may have a weight<Links> column, a
weight<Documents> column, and a weight<Citations> column.
36
For an example of a map file, see the file journal_map.txt.
4.1.2 Network files
A network file is a text file that contains information about the links between the
items in a map. A network file specifies which pairs of items are connected by a
link. It also specifies the strength of each link. The strength of a link is indicated by
a positive numerical value.
A network file has either a sparse format or a full format:
Sparse format. In the case of the sparse format, each line in a network file
corresponds with a link. A network file has two or three columns. The first two
columns specify the IDs of pairs of items that are connected by a link. The third
column specifies the strength of a link. If there is no third column, all links have
a strength of 1.
In VOSviewer, there can be only one link between a pair of items. If a network
file specifies multiple links between the same pair of items, VOSviewer will
combine these links into a single link. The strength of the combined link will be
equal to the sum of the strengths of the individual links in the network file.
For an example of a network file in the sparse format, see the file
journal_network_sparse.txt.
Full format. In the case of the full format, a network file contains the entire
adjacency matrix of a network. The adjacency matrix of a network is a square
matrix that indicates for each pair of items in the network the strength of the
link between the items. If an element of the adjacency matrix equals 0, this
indicates that there is no link between the corresponding items. In the case of a
network consisting of n items, a network file has n lines and n + 1 columns.
The element in the ith row and the jth column of the adjacency matrix is
specified on the ith line and in the (j + 1)th column in the network file. The first
column in the network file contains IDs of items. This column specifies for each
row and column of the adjacency matrix the ID of the corresponding item.
Networks are required to be undirected in VOSviewer. An undirected network
has a symmetrical adjacency matrix. If a network file contains an asymmetrical
adjacency matrix, VOSviewer will average the values of corresponding elements
on both sides of the main diagonal of the matrix.
For an example of a network file in the full format, see the file
journal_network_full.txt.
37
In general, we recommend to use the sparse format. When information about the
links between the items in the currently active map is saved in a network file
(using the Save button on the File tab in the action panel; see Subsection 3.5.1),
VOSviewer also uses the sparse format.
A network file is usually used in combination with a map file. For each ID of an
item in the network file, there must then be a corresponding ID in the map file.
4.2 Corpus and scores files
In this section, we discuss corpus and scores files.
4.2.1 Corpus files
A corpus file is a text file that contains on each line the text of a document. The
text of a document must be in English, since the natural language processing
algorithms used by VOSviewer (see Subsection 3.5.4) do not support other
languages. If documents are scientific publications, the text of a document may for
example consist of the concatenation of the title and the abstract of a publication.
Unlike the other file types discussed in this chapter, a corpus file does not have
multiple columns.
For an example of a corpus file, see the file corpus.txt.
4.2.2 Scores files
A scores file is a text file that contains scores of documents.13 A scores file is used
in combination with a corpus file. The number of columns in a scores file equals the
number of score attributes. The number of lines in a scores file equals the number
of lines in the associated corpus file plus one. The first line in a scores file is a
header line. Each column has a header score<...>, where ... is replaced by the
label of a score attribute. Each of the remaining lines in a scores file corresponds
with a document. The second line in a scores file contains the scores of the first
document. It corresponds with the first line in the associated corpus file. The third
line in a scores file contains the scores of the second document. It corresponds
with the second line in the associated corpus file. And so on.
13 Score attributes in a scores file are assumed to have a ratio or an interval scale. Hence, if the
difference between the scores of items u and v equals the difference between the scores of items x and
y, the difference between items u and v is regarded as equally large as the difference between items x
and y.
38
If a scores file contains only one score attribute, the file does not need to have a
header line. The number of lines in the scores file then equals the number of lines
in the associated corpus file.
For an example of a scores file, see the file scores.txt.
4.3 Thesaurus files
A thesaurus file is a text file that can be used to perform data cleaning when
creating a map based on bibliographic data or text data (see Subsection 3.5.4). A
thesaurus file has two columns, a label column and a replace by column. The first
line in a thesaurus file is a header line containing column headers. With the
exception of the first line, each line in a thesaurus file specifies a label (in the label
column) and an alternative label (in the replace by column), indicating that the
label is to be replaced by the alternative label. The label may for example
represent a source title, an author name, a cited reference, or a term. If no
alternative label is specified (i.e., the replace by column is empty), the label will
not be replaced by an alternative label, but instead it will be ignored. When a map
is created based on text data, this for example allows a thesaurus file to be used to
ignore certain terms.
For examples of thesaurus files, see the files thesaurus_authors.txt and
thesaurus_terms.txt.
4.4 Cluster colors, overlay colors, and density colors files
In this section, we discuss cluster colors, overlay colors, and density colors files.
4.4.1 Cluster colors files
A cluster colors file is a text file that contains colors of clusters. With the exception
of the first line, each line in a cluster colors file corresponds with a cluster. The first
line in a cluster colors file is a header line containing column headers. A cluster
colors file has four columns, a cluster column, a red column, a green column, and a
blue column. The cluster column contains cluster numbers. A cluster number must
be an integer between 1 and 1000. The red, green, and blue columns contain the
red, green, and blue components of the colors of clusters. Each color component
must have an integer value between 0 and 255.
For an example of a cluster colors file, see the file cluster_colors.txt.
39
4.4.2 Overlay colors files
An overlay colors file is a text file that contains color values and colors. An overlay
colors file has the same format as a cluster colors file except that instead of a
cluster column it has a color value column, containing numerical values between 0
and 1.
In the overlay visualization of a map (see Subsection 3.1.2), items can be colored
based on their score. The color of an item is then determined in two steps. In the
first step, the score of an item is transformed into a color value. A score between
the minimum and maximum scores specified in the Set Overlay Colors Range
dialog box (see Section 3.2) is transformed linearly into a color value between 0
and 1. A score below the minimum score or above the maximum score is
transformed into a color value of 0 or 1, respectively. In the second step, the color
of an item is determined by matching the color value of the item with the color
values in an overlay colors file. Exact matching of color values usually is not
possible. The color of an item is then determined by interpolating between two
colors in an overlay colors file.
For an example of an overlay colors file, see the file overlay_colors.txt.
4.4.3 Density colors files
A density colors file is a text file that contains color values and colors. A density
colors file has the same format as an overlay colors file.
In the item density visualization of a map (see Subsection 3.1.3), the color of a
point in the visualization is determined by the density of items at that point. This is
done in two steps. In the first step, the density of items at a point is transformed
into a color value. The higher the density of items, the higher the color value. In
the second step, the color of a point is determined by matching the color value of
the point with the color values in a density colors file. Exact matching of color
values usually is not possible. The color of a point is then determined by
interpolating between two colors in a density colors file.
For an example of a density colors file, see the file density_colors.txt.
40
5 Advanced topics
In this chapter, a number of advanced topics are addressed. We first consider the
use of command line parameters (Section 5.1). We then discuss how a map can be
made available online (Section 5.2) and how the amount of memory available to
VOSviewer can be increased (Section 5.3).
5.1 Using command line parameters
VOSviewer supports a large number of command line parameters. These
parameters can for example be used to automatically open a map when VOSviewer
is started or to override some of the default settings of VOSviewer. The command
line parameters supported by VOSviewer are listed below.
Command line parameters for opening or creating a map
gml Use this parameter to specify a GML file. This file will be used to open or create
a map when VOSviewer is started.
map Use this parameter to specify a VOSviewer map file (see Subsection 4.1.1).
This file contains information about the items in a map. The file will be used to
open or create a map when VOSviewer is started.
network Use this parameter to specify a VOSviewer network file (see Subsection 4.1.2).
This file contains information about the links between the items in a map. The
file will be used to open or create a map when VOSviewer is started.
pajek_network Use this parameter to specify a Pajek network (or matrix) file. This file will be
used to open or create a map when VOSviewer is started.
pajek_partition Use this parameter to specify a Pajek partition file. This file contains cluster
numbers of the items in a map. The file will be used to open or create a map
when VOSviewer is started.
pajek_vector Use this parameter to specify a Pajek vector file. This file contains weights of
the items in a map. The file will be used to open or create a map when
VOSviewer is started.
Command line parameters for creating a term co-occurrence map based on a
corpus file
corpus Use this parameter to specify a VOSviewer corpus file (see Subsection 4.2.1).
This file will be used to create a term co-occurrence map when VOSviewer is
started.
counting_method Use this parameter to specify the counting method to be used to create a term
co-occurrence map (1 for binary counting and 2 for full counting).
min_n_occurrences Use this parameter to specify the minimum number of occurrences that a term
must have to be included in a term co-occurrence map.
41
n_terms Use this parameter to specify the number of terms to be included in a term co-
occurrence map. VOSviewer will select the terms that are considered most
relevant.
scores Use this parameter to specify a VOSviewer scores file (see Subsection 4.2.2).
When a term co-occurrence map is created when VOSviewer is started, this file
will be used to calculate scores of terms.
thesaurus Use this parameter to specify a VOSviewer thesaurus file (see Section 4.3).
When a term co-occurrence map is created when VOSviewer is started, this file
will be used to merge synonyms into a single term.
Command line parameters for saving a map
save_gml Use this parameter to specify a GML file. When a map is opened or created
when VOSviewer is started, the map will be saved in this file.
save_map Use this parameter to specify a VOSviewer map file (see Subsection 4.1.1).
When a map is opened or created when VOSviewer is started, information
about the items in the map will be saved in this file.
save_network Use this parameter to specify a VOSviewer network file (see Subsection 4.1.2).
When a map is opened or created when VOSviewer is started, information
about the links between the items in the map will be saved in this file.
save_pajek_network Use this parameter to specify a Pajek network (or matrix) file. When a map is
opened or created when VOSviewer is started, the map will be saved in this
file.
save_pajek_partition Use this parameter to specify a Pajek partition file. When a map is opened or
created when VOSviewer is started, the cluster numbers of the items in the
map will be saved in this file.
save_pajek_vector Use this parameter to specify a Pajek vector file. When a map is opened or
created when VOSviewer is started, the weights of the items in the map will be
saved in this file.
Command line parameters for saving a screenshot
save_screenshot_bmp Use this parameter to specify a BMP file. When a map is opened or created
when VOSviewer is started, a screenshot of the map will be saved in this file.
save_screenshot_emf Use this parameter to specify an EMF file. When a map is opened or created
when VOSviewer is started, a screenshot of the map will be saved in this file.
save_screenshot_eps Use this parameter to specify an EPS file. When a map is opened or created
when VOSviewer is started, a screenshot of the map will be saved in this file.
save_screenshot_gif Use this parameter to specify a GIF file. When a map is opened or created
when VOSviewer is started, a screenshot of the map will be saved in this file.
save_screenshot_jpg Use this parameter to specify a JPG file. When a map is opened or created
when VOSviewer is started, a screenshot of the map will be saved in this file.
save_screenshot_pdf Use this parameter to specify a PDF file. When a map is opened or created
when VOSviewer is started, a screenshot of the map will be saved in this file.
42
save_screenshot_png Use this parameter to specify a PNG file. When a map is opened or created
when VOSviewer is started, a screenshot of the map will be saved in this file.
save_screenshot_svg Use this parameter to specify an SVG file. When a map is opened or created
when VOSviewer is started, a screenshot of the map will be saved in this file.
save_screenshot_swf Use this parameter to specify an SWF file. When a map is opened or created
when VOSviewer is started, a screenshot of the map will be saved in this file.
Command line parameters related to the layout and clustering techniques
attraction Use this parameter to specify the initial value of the Attraction text box on the
Analysis tab in the action panel.
largest_component The network of links between items may consist of multiple components. Use
this parameter to indicate that only items included in the largest component
must be kept when the layout technique is run when VOSviewer is started.
merge_small_clusters Use this parameter to specify the initial value of the Merge small clusters
check box on the Analysis tab in the action panel (‘true’ for checked and ‘false’
for unchecked).
min_cluster_size Use this parameter to specify the initial value of the Min. cluster size text box
on the Analysis tab in the action panel.
repulsion Use this parameter to specify the initial value of the Repulsion text box on the
Analysis tab in the action panel.
resolution Use this parameter to specify the initial value of the Resolution text box on
the Analysis tab in the action panel.
run_clustering Use this parameter to indicate that the clustering technique must be run when
a map is opened or created when VOSviewer is started (even if a clustering is
already available).
run_layout Use this parameter to indicate that the layout technique must be run when a
map is opened or created when VOSviewer is started (even if a layout is
already available).
skip_clustering Use this parameter to indicate that the clustering technique must not be run
when a map is opened or created when VOSviewer is started.
Visualization-related command line parameters
black_background Use this parameter to specify the initial value of the Black background check
box in the options panel (‘true’ for checked and ‘false’ for unchecked).
circles_frames Use this parameter to specify how items are represented in the network
visualization and the overlay visualization (1 for circles and 2 for frames).
cluster_colors Use this parameter to specify a VOSviewer cluster colors file (see Subsection
4.4.1). Cluster colors will be imported from this file when VOSviewer is started.
colored_lines Use this parameter to specify the initial value of the Colored lines check box
in the options panel (‘true’ for checked and ‘false’ for unchecked).
43
curved_lines Use this parameter to specify the initial value of the Curved lines check box in
the options panel (‘true’ for checked and ‘false’ for unchecked).
density Use this parameter to specify whether the item density visualization or the
cluster density visualization is selected in the density visualization (1 for item
density visualization and 2 for cluster density visualization).
density_colors Use this parameter to specify a VOSviewer density colors file (see Subsection
4.4.3). Density colors will be imported from this file when VOSviewer is started.
density_visualization Use this parameter to select the density visualization when VOSviewer is
started.
kernel_width Use this parameter to specify the initial value of the Kernel width slider in the
options panel.
label_size_variation Use this parameter to specify the initial value of the Size variation slider for
labels in the options panel.
line_size_variation Use this parameter to specify the initial value of the Size variation slider for
lines in the options panel.
max_label_length Use this parameter to specify the initial value of the Max. length text box in
the options panel.
max_n_lines Use this parameter to specify the initial value of the Max. lines text box in the
options panel.
max_score Use this parameter to specify the initial value of the Max. score text box in the
Set Overlay Colors Range dialog box.
min_line_strength Use this parameter to specify the initial value of the Min. strength text box in
the options panel.
min_score Use this parameter to specify the initial value of the Min. score text box in the
Set Overlay Colors Range dialog box.
network_visualization Use this parameter to select the network visualization when VOSviewer is
started.
overlay_colors Use this parameter to specify a VOSviewer overlay colors file (see Subsection
4.4.2). Overlay colors will be imported from this file when VOSviewer is
started.
overlay_visualization Use this parameter to select the overlay visualization when VOSviewer is
started.
scale Use this parameter to specify the initial value of the Scale slider in the options
panel.
scores_normalization Use this parameter to specify the option that is initially selected in the
Normalize scores drop down list in the Set Overlay Colors Range dialog
box (1 for Do not normalize, 2 for Divide by mean, 3 for Subtract mean,
and 4 for Subtract mean and divide by st. dev.).
show_item Use this parameter to zoom in on a specific item when VOSviewer is started.
The item is indicated by its ID.
44
white_background Use this parameter to specify the initial value of the White background check
box in the options panel (‘true’ for checked and ‘false’ for unchecked).
zoom_level Use this parameter to specify the initial zoom level in the main panel. The
higher the zoom level, the more the main panel will be zoomed in on the center
of a map. The zoom level must have a value of at least 1. This is also the
default value.
Interaction-related command line parameters
pan_step_size Use this parameter to specify the step size for scrolling through a map in the
main panel using the navigation buttons or the keyboard. The default value is
0.25.
zoom_speed Use this parameter to specify the speed for zooming in and out in the main
panel using the right mouse button. The default value is 0.01.
zoom_step_size Use this parameter to specify the step size for zooming in and out in the main
panel using the mouse wheel, the navigation buttons, or the keyboard. The
default value is 0.2.
Miscellaneous command line parameters
encoding Use this parameter to specify the character encoding that is used by VOSviewer
to read and write text files. For a list of the available encodings, see
https://docs.oracle.com/javase/8/docs/technotes/guides/intl/encoding.doc.html.
If this parameter is not used, VOSviewer will attempt to automatically recognize
the correct encoding when reading a text file (which in some cases may result in
the use of an incorrect encoding).
file_location Use this parameter to specify the folder that is used by VOSviewer as the
default file location.
To use the above command line parameters, VOSviewer needs to be run from the
command line. When the Windows executable of VOSviewer is used, this can for
example be done as follows:
VOSviewer –map map.txt –density_visualization –zoom_level 2.5
Using these command line parameters, the map in the VOSviewer map file
map.txt will be opened when VOSviewer is started. Also, the density visualization
will be selected, and the main panel will be zoomed in on the center of the map.
When instead of the Windows executable of VOSviewer the VOSviewer JAR file is
used, VOSviewer can for example be run in the following way:
java –jar VOSviewer.jar –map map.txt –density_visualization
–zoom_level 2.5
We note that some command line parameters cannot be used together. For
example, the map and pajek_network parameters and the map and corpus
parameters cannot be used together. On the other hand, some parameters can be
45
used only in combination with other parameters. The pajek_partition parameter
for example can be used only in combination with the pajek_network parameter.
Similarly, the counting_method parameter can be used only in combination with
the corpus parameter.
5.2 Making a map available online
VOSviewer allows a map to be made available online. When a map is made
available online, a URL can be used to open the map in VOSviewer.
To make a map available online, a VOSviewer map file and a VOSviewer network
file (or only a VOSviewer map file) need to be made available at an online location.
Suppose these files are made available at
http://www.example.com/map.txt
and
http://www.example.com/network.txt
The following URL can then be used to open the map in VOSviewer:
http://www.vosviewer.com/vosviewer.php?map=http://www.example.com/map.
txt&network=http://www.example.com/network.txt
The command line parameters discussed in Section 5.1 can also be used in a URL.
For example, to open a map, to select the density visualization, and to zoom in on
the center of the map, the following URL can be used:
http://www.vosviewer.com/vosviewer.php?map=http://www.example.com/map.
txt&network=http://www.example.com/network.txt&density_visualizatio
n&zoom_level=2.5
URLs for opening a map in VOSviewer tend to be quite lengthy. It may therefore be
convenient to create simplified URLs using a URL shortener (e.g., https://bitly.com,
https://goo.gl, or http://tinyurl.com).
5.3 Increasing the availability of memory
When using VOSviewer with large amounts of data, the memory requirements may
be substantial. If there is not enough memory available, an out of memory error
will occur. However, it may be possible to increase the amount of memory that is
available to VOSviewer. This can be done by running the VOSviewer JAR file from
the command line and by specifying the amount of memory that one would like to
be available to VOSviewer. For example, if one would like 4000 MB of memory to
be available to VOSviewer, the VOSviewer JAR file can be run as follows:
46
java –Xmx4000m -jar VOSviewer.jar
We note that the About VOSviewer dialog box (see Subsection 3.5.1) shows both
the amount of memory that is used by VOSviewer and the amount of memory that
is available to VOSviewer.
When working with large amounts of data, it is also possible that a stack overflow
error will occur. The stack size then needs to be increased. This can be done by
running the VOSviewer JAR file from the command line in the following way:
java -Xss1000k -jar VOSviewer.jar
In this case, the stack size is set to 1000 KB, but other values are possible as well.
47
References
De Nooy, W., Mrvar, A., & Batagelj, V. (2011). Exploratory social network analysis
with Pajek (2nd ed.). Cambridge University Press.
Newman, M.E.J. (2004). Fast algorithm for detecting community structure in
networks. Physical Review E, 69, 066133.
Noack, A. (2007). Energy models for graph clustering. Journal of Graph Algorithms
and Applications, 11(2), 453–480.
Noack, A. (2009). Modularity clustering is force-directed layout. Physical Review E,
79, 026102.
Perianes-Rodriguez, A., Waltman, L., & Van Eck, N.J. (2016). Constructing
bibliometric networks: A comparison between full and fractional counting.
Journal of Informetrics, 10(4), 1178–1195.
Van Eck, N.J., & Waltman, L. (2009). How to normalize cooccurrence data? An
analysis of some well-known similarity measures. Journal of the American
Society for Information Science and Technology, 60(8), 1635–1651.
Van Eck, N.J., & Waltman, L. (2010). Software survey: VOSviewer, a computer
program for bibliometric mapping. Scientometrics, 84(2), 523–538.
Van Eck, N.J., & Waltman, L. (2011). Text mining and visualization using
VOSviewer. ISSI Newsletter, 7(3), 50–54.
Van Eck, N.J., & Waltman, L. (2014). Visualizing bibliometric networks. In Y. Ding,
R. Rousseau, & D. Wolfram (Eds.), Measuring scholarly impact: Methods and
practice (pp. 285–320). Springer.
Van Eck, N.J., Waltman, L., Dekker, R., & Van den Berg, J. (2010). A comparison
of two techniques for bibliometric mapping: Multidimensional scaling and VOS.
Journal of the American Society for Information Science and Technology,
61(12), 2405–2416.
Waltman, L., & Van Eck, N.J. (2013). A smart local moving algorithm for large-
scale modularity-based community detection. European Physical Journal B,
86(11), 471.
48
Waltman, L., Van Eck, N.J., & Noyons, E.C.M. (2010). A unified approach to
mapping and clustering of bibliometric networks. Journal of Informetrics, 4(4),
629–635.