Embed Size (px)
Citation preview

Photosynthetic performance of benthic microbial mats in Lake Hoare, Antarctica
Kay Vopel1National Institute of Water and Atmospheric Research, P.O. Box 11-115, Hamilton, New Zealand
Ian HawesWorld Fish Center, Nusa Tupe, P.O. Box 77, Western Province, Solomon Islands
Abstract
We measured in situ photosynthesis of benthic microbial mats at various depths in Lake Hoare, a permanentlyice-covered lake of the McMurdo Dry Valleys, Antarctica, using oxygen (O2) microelectrodes. We furtherinvestigated the vertical distribution and activity of pigments in the microbial mats using an imaging pulse-amplitude-modulated fluorometer. Microbial mats to at least 16.6-m water depth are net producers of O2 duringthe summer period. Net O2 production ranges from 100–500 mmol m22 h21 at incident downwelling irradiancesof photosynthetically active radiation (PAR) of 1.0–4.6 mmol quanta m22 s21. Photosynthesis of mat-formingcyanobacteria and diatoms occurs at all lake depths at or close to maximum efficiency. We measured absorptionby the pigment arrays at a single water depth and, by assuming that absorption is water-depth invariant, weestimated an area-specific maximum community quantum yield of 0.073 mol carbon per mol photons. Acommunity compensation irradiance of 0.1 mmol quanta m22 s21 was estimated, reflecting extreme shadeacclimation. These results confirm estimates previously derived from laboratory gas-exchange measurements andimply that even minor changes in the intensity of the incident downwelling irradiance of PAR caused by, forexample, changes in the transparency of the ice cover or the optical properties of the water column cansignificantly alter rates of benthic carbon fixation. In situ measurements were confined to mats with flat surfaces.Laboratory measurements at the surface of mats with pinnacled surfaces revealed a complex small-scale chemicalstructure at the mat–water interface.
The largest ice-free region of Antarctica, the Dry ValleyRegion of Southern Victoria Land, is among the coldestand driest deserts in the world (Heywood 1984). The dryvalley mean annual temperature ranges from 214.8uC to230.0uC (Doran et al. 2002a). The low mean annualtemperature allows perennial, 3–6-m-thick ice covers topersist on numerous meltwater lakes in the valley systems.The ice covers have profound effects on these lakes: theyeliminate turbulent mixing of the water column by wind-generated currents, reduce light penetration, and restrictgas exchange between the atmosphere and the watercolumn. Among the unique features of these lakes thathave developed as a consequence of ice cover is the oxygen(O2) supersaturation of the water column (Parker et al.1981; Craig et al. 1992). A second unusual feature is theoccurrence of modern and nascent stromatolites: laminatedphotosynthetic communities, dominated by cyanobacteria,which cover much of the lake floors (Wharton et al. 1983;Hawes and Schwarz 1999).
Whereas numerous studies of photosynthetic productionin the dry valley lakes have focused on planktonic
microbial communities (e.g., Vincent 1981; Priscu et al.1987; Dore and Priscu 2001), few studies have dealt withbenthic communities (Wharton et al. 1994; Hawes andSchwarz 1999, 2000; Hawes et al. 2001). The study ofWharton et al. (1994) revealed evidence for benthicphotosynthesis. These authors found significant differencesin pore water [O2] profiles measured in sediment corestaken from Lake Hoare in January and October; theysuggested that this difference is due to a seasonal cycleresulting from the long photoperiod and photosynthesis bymat-forming benthic microbial communities. Subsequentlaboratory gas-exchange measurements demonstrated thatmats taken in Lake Hoare from water depths of up to 22 mare capable of photosynthesizing at the low irradiance theywould experience under ambient conditions (Hawes andSchwarz 1999, 2000). Hawes and Schwarz (1999) suggestedthat, in this diffusion-dominated lake, benthic biomassaccumulation is favored by retention of nutrients in closeproximity to growing cells, with minimal expenditure ofenergy in swimming or loss to grazers. In a modelingexercise, Hawes et al. (2001) then used their experimentallyderived observations of mat photosynthesis and respira-tion, with data on incident downwelling irradiance ofphotosynthetically active radiation (PAR; see Table 1) andthe optical properties of the ice and water column(Howard-Williams et al. 1998), to predict net photosyn-thetic production from October to February, net respira-tion at other times, and a maximum annual rate of carbonfixation of 12 g carbon m22, equating to approximately0.1–4-mm vertical accumulation of mat each year. Finally,using the experimental observations of Hawes and Schwarz(1999, 2000) and a mathematical model, Moorhead et al.
1 Corresponding author ([email protected]).
AcknowledgmentsR. Ellwood assisted in the field. Two anonymous reviewers, the
Associate Editor R. N. Glud, P. Doran, C. Howard-Williams, J.Meadows, and A. Vopel commented on an earlier draft.
The New Zealand Foundation for Research, Science andTechnology (CO1605), Antarctica New Zealand, and theMcMurdo Dry Valley Long Term Ecological Research Programof the U.S. National Science Foundation (OPP–9814972) fundedand provided facilities and support for the research.
Limnol. Oceanogr., 51(4), 2006, 1801–1812
E 2006, by the American Society of Limnology and Oceanography, Inc.
1801
brought to you by COREView metadata, citation and similar papers at core.ac.uk
provided by AUT Scholarly Commons

(2005) simulated whole-lake, annual net primary pro-duction of benthic microbial mats in Lake Hoare andcompared these estimates to observed phytoplanktonproduction. These authors suggested that benthic microbialmats have the capacity to fix quantities of carbon that rivalor exceed carbon fixation by planktonic communities; onaverage, simulated benthic mat production represented.85% of the combined benthic and planktonic carbonfixation.
Moorhead et al. (2005) noted that 79–99% of theuncertainty in the behavior of their model was attributedto uncertainties in estimates of the maximum photosyn-thetic rate, the initial slope of photosynthetic-light re-sponse, and the maximum respiration rate. These param-eters were estimated from measurements of the rate ofevolution or consumption of O2 in laboratory matenclosures (Hawes and Schwarz 1999). Hawes and Schwarz(1999) discussed the limitations of this method and notedmethodological necessities that may have altered thenutrient supply of the mats and the mat–water O2
exchange. For example, incubating mat explants alteredthe thickness of the diffusive boundary layer (DBL)between the mat surface and the overlying lake water andenabled solute exchange across the cut side and bottom ofthe cores, which would not occur naturally. Thus, thephotosynthetic parameters require confirmation under insitu conditions.
The aims of this study are to estimate in situ, for the firsttime, the magnitude of benthic photosynthesis in a perma-nently ice-covered lake of the McMurdo Dry Valleys, toreassess photosynthetic parameters, and to resolve benthicphotosynthesis vertically. To do so, we measured, with theaid of surface-air-supply diving, O2 microprofiles across the
mat–water interface at various depths in Lake Hoare. Toobtain supplement data to help interpret O2 microprofiles,we investigated mat cross sections in the laboratory usingan imaging pulse-amplitude-modulated fluorometer (Im-aging-PAM).
Material and methods
Study site—Lake Hoare (77u389S, 162u539E) is a closed-basin lake near the eastern end of Taylor Valley in southernVictoria Land, Antarctica. The lake is 4.2-km long and 1-km wide, and has maximum and mean depths of 34 m and14 m. Lake Hoare is dammed to the northeast by theCanada Glacier, which provides an inflow of glacialmeltwater. Other inflow comes from Andersen Creekentering the northeast corner of Lake Hoare, and drainageis from Lake Chad in the southeast. No outflows fromLake Hoare exist, so water loss is restricted to sublimationof ice and evaporation of meltwater during summer. Theaverage mean annual temperature at Lake Hoare between1985 and 2000 was 217.7uC (Doran et al. 2002a). The icecover of this lake is perennial, except for small areas at thelake margin that melt during most summers. The thicknessof the ice cover was 3.5 m in 1983 (Wharton et al. 1993),,5 m in 2002 (Doran et al. 2002b), and ,4 m in 2004.There are 3 months of complete darkness during winterand 3 months of continuous light during summer. Nettransmission of solar radiation through the ice cover is,1–3%, with a spectral transmission peak at wave lengthsof 450–550 nm. Vertical extinction coefficients for PARwithin the water column from beneath the ice to a depth of33 m were typically 0.12–0.22 m21 (Howard-Williams et al.1998). The lake has a density-stabilized water column, with
Table 1. Abbreviations.
Symbol Definition
w Mat porositywp Quantum yield of charge separation in photosystem complex IIDF Variable fluorescence (the difference between F0 and Fm or F and F9m)AOI Area of interestD0 Free-solution diffusion coefficient (cm2 s21)DBL Diffusive boundary layerDS Sediment diffusion coefficient (cm2 s21)Ed Incident downwelling irradiance of photosynthetically active radiation (mol quanta m22 s21)Ek Irradiance above which photosynthesis is light saturated (mol quanta m22 s21)ETR Rate of photosynthetic electron transport between photosystem complex II and I (mol electrons m22 s21)F Current fluorescence yield of light-adapted sampleF0, Fm Minimal and maximal fluorescence yield of dark-adapted sample, respectivelyF9m Maximal fluorescence yield of light-adapted sampleJ Diffusive flux of O2 (mol m22 h21)KL Diffuse attenuation coefficient of scalar irradiance (mm21)LED Light-emitting diodePAR Photosynthetically active radiation (mol quanta m22 s21)PSI and PSII Photosystem complex I and IIrETRmax Maximum relative rate of photosynthetic electron transport between photosystem complex II and I (mol electrons
m22 s21)RLC Rapid light curveA Slope of irradiance versus rETR as irradiance approaches zero
([mol electrons m22 s21] 3 [mol quanta m22 s21]21)sa Absorption cross section of photosystem complex II
1802 Vopel and Hawes

a pronounced inflection in the density–depth profile at 13–15 m from the surface (the depth of the lake variestemporally), which divides the lake into upper and lowercompartments. The upper compartment is characterized bylower concentrations of dissolved nutrients, particularlynitrate (Lizotte and Priscu 1992), higher concentrations ofO2 (0.94–1.25 mmol L21 compared to 0.63–0.94 mmol L21
below, Wharton et al. 1986), lower bicarbonate, and higherpH (up to 8.6 compared to 7.9 below, Cathey et al. 1981).The lake is anoxic below 25–26 m depth.
Benthic microbial mats—Benthic microbial mats indifferent zones of Lake Hoare differ in structure andspecies composition; the quantity and quality of theincident downwelling irradiance of PAR are apparentlythe most important factors that regulate these differences(Wharton et al. 1983). Three mat morphologies arecommon: moat mats, columnar lift-off mats, and prostratemats; the surface of the last can be smooth (Fig. 1A) butsurface irregularities can occur in the form of pinnacles upto 3-cm high (Fig. 1B). Columnar lift-off mats andprostrate mats comprise a matrix of filamentous cyano-bacteria and pennate diatoms, whereas moat mats aredominated by cyanobacteria (Wharton et al. 1983). Lift-offmats occur in shallow under-ice environments, where bothN2 and O2 approach their saturation concentrations. Gasebullition within lift-off mats makes them buoyant; hencethey lift away from the underlying sediment until they riseup and freeze into the ice (Wharton et al. 1986). Prostratemats occur in deeper water where gas ebullition does notoccur. Moat mats, which freeze solid during winter andexperience high quantities of incident downwelling irradi-ance of PAR during the brief ice-free period in summer, aredifferent than the other types; they are ,3-cm thick, weaklystratified, and have smooth surfaces that follow thecontours of underlying sediments and rocks.
In situ measurements—In November 2004, a surface-supplied tethered diver measured a total of 10 in situ high-resolution [O2] profiles across the mat–water interface atfour depths along a transect away from a 1-m diameter holemelted through the ice (Table 2). The profiles weremeasured in areas devoid of pinnacles (e.g., see Fig. 1A).To do so, the diver attached a Clark-type underwater O2
microelectrode (Revsbech 1989, Unisense) to a manuallyoperated micromanipulator (Marzhauser Wetzlar)mounted on an aluminum post that had been driven intothe lake sediment. An underwater picoammeter PA 3000U(Unisense) placed onto the sediment surface provided thepolarization voltage for the O2 microelectrode, which hadan outside tip diameter of 50 mm, a 90% response time of,1 s, and a stirring sensitivity of ,2%. The diver used themicromanipulator to move the electrode in 0.2-mmincrements normal to the mat surface from a positionabove the DBL to a depth of 6–7 mm into the mat andfurther in 0.5-mm increments to a maximum depth of21 mm. After each depth interval the diver verbally relayedthe electrode reading to the support person at the surface ofthe ice, who recorded the data.
We determined the downwelling irradiance of PARincident to the surface of the microbial mat once beforeevery in situ profiling measurement using a newly cali-brated LI-COR LI 192 underwater quantum sensor and LI-189 light meter in a waterproof housing. A StowAwayTidbit miniature temperature data logger (Onset ComputerCooperation) placed onto the surface of a microbial mat at8-m water depth measured and logged the bottom watertemperature once every minute from 18 to 24 November2004.
Fig. 1. (A, B) Underwater photographs of prostrate micro-bial mats at ,8-m water depth. The surface of the mats can be(A) smooth or (B) structured by pinnacles. Scale bars, 10 mm, applyto the center of the photograph. (C) Chlorophyll fluorescence imageof a mat cross section. Areas of interest (AOI) were defined toprovide a continuous vertical transect through the cross section.
Benthic photosynthesis in Lake Hoare 1803

To estimate the mean spectral transmission of the icecover, on 22 November 2004 we measured spectraimmediately beneath the ice at seven random points, allwell clear of the anomalous light field close to the dive hole,using a hyperspectral irradiance sensor (RAMSES-ACC-UV/VIS, TriOS). The diver then deployed the sensor at4 m, 7 m, 10 m, and 13 m below the ice cover forestimation of spectral attenuation coefficients for down-welling irradiance by log-linear regression of irradiance-versus-depth profiles.
Sampling—To collect mats the diver cut a random seriesof core samples, 10 cm in diameter by 3-cm deep, of the‘‘active layer’’ (sensu Hawes and Schwarz 1999) ofmicrobial mats from within 3-m-diameter sampling areas,at water depths ranging from 8–16 m. These discs werecarefully separated from underlying materials and trans-ferred into an opaque polyethylene box with a watertightsealed lid. Additionally, five 150-mL water samples werecollected from ,3 cm above the surface of the microbialmats at water depths of 5 m, 8 m, 12 m, and 16 m, andunderwater photographs of the mat surface were takenusing a Sony Cyber-shot DSCP-8 digital camera. The matand water samples were moved to a dark tent–laboratorynext to the ice hole for chemical analyses or to a lakesidelaboratory for fluorescence measurements (see below).
Laboratory measurements—Salinity, pH, and [O2] of thebottom water were measured with two PortaMess 913 me-ters, the picoammeter PA 3000U, the conductivity sensorSE 204, the pH/Pt1000 electrode SE 102 (Knick), anda Clarke-type O2 microelectrode. Thereafter the O2
microelectrode was mounted on a motorized micromanip-ulator attached to a stand to record three [O2] microprofilesacross the mat–water interface of a pinnacle mat from 12-mwater depth at 200-mm resolution. The mat was fixed at thebottom of the sampling box to ensure a constant distancebetween micromanipulator and mat. Pieces of ice wereadded to the water surrounding the mat to controltemperature. The profiles were measured vertically andnormal to the mat surface starting at different verticaldistances from a fixed position in the overlying water. Theposition of the mat surface was determined visually as thedepth at which the tip of the microelectrode first penetratedthe mat. The PC Windows program PROFIX (Unisense)controlled the stepwise movement of the micromanipulatorvia a motor controller and read the data from themicrosensor amplifiers via an A/D converter (ADC-216USB, Unisense) that was connected to the parallel port
of a personal computer. The O2 microelectrode wascalibrated in 100% air-saturated lake water and in lakewater that had been deoxygenated with sodium sulfite.
Appropriate levels of PAR were supplied to the surfaceof the mat with battery-powered light-emitting diode(LED) at a previously determined distance from thesurface. This distance was determined by measuring thedownwelling irradiance of PAR supplied by the LED toa quantum sensor in a water-filled plastic tube so that 5 cmof water were above the sensor head. The spectrum of thisirradiance was measured by submerging the hyperspectralirradiance sensor in lake water and clamping it in placea similar distance from the LED source to that used duringprofiling measurements. The spectrum of the under-icedownwelling irradiance of PAR was compared with that ofthe LED by calculating the spectrum of downwellingirradiance of PAR for 8-m water depth from ice trans-mission and water-column attenuation. The under-icespectrum was dominated by a single peak spanning wavelengths of 450–570 nm. The spectrum of the LED showedtwo peaks within this range, at 460 nm and 560 nm,although both spectra tailed off above 600 nm (Fig. 2).
The attenuation of scalar irradiance through a microbialmat from 8-m water depth was measured by means ofa scalar fiber-optic microprobe connected to a spectrometer(S2000, Ocean Optics) fitted with a diffraction grating thatallowed coverage between 350 nm and 850 nm. Themicroprobe was constructed following Lassen et al.(1992), and the scalar detector at the tip of the probe hada diameter of 0.3 mm. The probe was inserted into the matwith the micromanipulator at an angle of 15 degrees fromvertical. A blue-enhanced quartz-halogen light sourceprovided PAR from above via a fiber-optic bundle. Spectrajust above the mat surface, just below the surface, and in 1-
Table 2. In situ profiling along a depth profile away from theice hole.
Date Depth (m)PAR (mmol quanta
m22 s21)Number of
profiles
21 Nov 2004 8.1 4.6 422 Nov 2004 9.2 3.5 223 Nov 2004 16.3 2.2 224 Nov 2004 16.6 1.0 2
Fig. 2. Under-ice PAR spectrum (solid line) and spectrum ofLED light source (dotted line).
1804 Vopel and Hawes

mm increments to a maximal depth of 9 mm were recorded.Data were integrated across four, 10-nm wavebands, 575–585, 625–635, 670–680, and 740–750 nm. The diffuseattenuation coefficient of scalar irradiance in each wave-band was calculated as the rate of change of log-transformed irradiance values with depth using KL 52d(ln L) 3 dz21 (Kirk 1983).
Imaging-PAM (Walz Mess- und Regeltechnik) and thesaturation pulse method were used to determine the two-dimensional (horizontal or vertical) distribution andactivity of pigments, measuring the minimal (F0) andmaximal (Fm) fluorescence yields of dark-adapted matsamples. For a detailed description of the saturation pulsemethod see, for example, Schreiber et al. (1996) or Kuhl etal. (2001) and literature cited therein. Use of the Imaging-PAM to obtain spatially resolved measures of fluorescenceis described by Ralph et al. (2005) and Grunwald and Kuhl(2004). Measurements of F0 were to obtain a proxy for thedistribution of chlorophyll. Comparing the distribution ofF0 with that of the maximal photochemical yield, (Fm – F0)3 Fm
21, gave us an index of chlorophyll connectivity tophotosystem complex II (PSII) electron transport chains.The primary goal of Fm measurements was to determinewhether F0 was attributable to pigments connected tocompetent electron transport systems. The Imaging-PAMoutput these two parameters as false-color images thatcould then be compared with photographic images of thesame section.
The Imaging-PAM was set up to image an area of30 mm 3 25 mm. A millimeter scale was imaged atintervals during sampling runs. Using a scalpel, we cut 2–3-mm-thick cross sections, running for the full thickness ofthe active layer and each approximately 40-mm long, fromfreshly collected material. These sections were then laid ontheir sides in a Petri dish and immersed in fresh lake water.At this thickness, the laminations in the mat could be easilyseen, while sufficient chlorophyll was still viewed in crosssection by the Imaging-PAM to obtain acceptable fluores-cence intensities (we aimed for at least 200 fluorescenceunits across the pigmented areas of the image) andreplicable measurements. Actinic light from the Imaging-PAM was provided by a bank of blue-white LEDs. Thespectrum of this light has two peaks, at 450 and 550 nm—blue and blue-green. Different absorption spectra fordiatoms, which can be expected to show strongestfluorescence in response to the blue peak, and thephycoerythrin-rich cyanobacteria from Lake Hoare, whichabsorb maximally close to the blue-green peak (Hawes andSchwarz 2000), will result in different fluorescenceresponses per unit biomass for the two groups ofphototrophs. Thus, while F0 will remain a proxy forchlorophyll fluorescence in the microbial mats, care mustbe taken in interpreting the false color images.
The Imaging-PAM facility for defining areas of interest(AOIs) was used to provide insight to the photoadaptedstatus of the microbial mats using rapid light curves(RLCs). First we defined AOI to provide a vertical transectthrough a mat cross section (Fig. 1C). The Imaging-PAMhad a restricted spatial resolution when used with AOI; thediameter of the circles in Fig. 1C is ,2 mm. The
instrument was therefore best suited to the thicker mats,where the size of AOI was similar to lamina thickness.Accordingly, only RLC data from mats from 12-m depthwere reported. RLCs for AOIs were recorded by exposingmat cross sections to a sequence of actinic irradiances in 14discrete PAR steps from 0 mmol quanta m22 s21 to52 mmol quanta m22 s21. To control for hysteresis effects,the order of PAR was not fully sequential, but ran 0, 3.6,6.9, 10.9, 3.6, 27.9, 38, 52, 3.6, 27.9, 19, 3.6, 6.8, 0 mmolquanta m22 s21. In practice, no hysteresis effects wereobserved. The incident downwelling irradiance of PARsupplied by blue-white LEDs (see above) was measuredusing a recently calibrated LI-COR 190 quantum sensorconnected to a LI-COR Li 1000 digital meter, set toaverage over 5-s intervals, positioned in place of the Petridish. Each period of actinic light lasted for 30 s, leading toa quasi-steady-state level of fluorescence, F. This period islonger than is commonly used for RLCs (10–15 s, see e.g.,Hawes et al. 2003, Ralph and Gademann 2005). We foundthat a slightly longer actinic exposure of microbial matsfrom Lake Hoare produced more repeatable measures ofvariable fluorescence, DF, and the absence of hysteresiseffects suggests that this exposure was not affecting thephotoadaptive state. At the end of each actinic period,a saturation pulse of white light (0.6 s at .500 mmolquanta m22 s21) was applied to determine the maximalfluorescence yield, F9m, and the quantum yield of chargeseparation in PSII, wp 5 (F9m 2 F) 3 F9m
21. We wereunable to measure the intensity of the saturation pulse withthe instrumentation available, but preliminary trials wereundertaken to ensure that the width and intensity of thissaturation pulse was adequate to attain maximum fluores-cence yield. The photosynthetic electron transport rate(ETR) between PSII and PSI can be estimated as ETR 5 wp
3 sa 3 Ed, where sa is the absorption cross section of PSII,and Ed is the incident downwelling irradiance of PAR.Assuming that sa is an unknown constant during themeasurements, the relative ETR was estimated as rETR 5wp 3 Ed (Hofstraat et al. 1994). A modification of theJassby and Platt (1976) equation was used to calculate theirradiance above which photosynthesis is light saturated,Ek, using least-squares regression (SigmaPlot 8.0, SPSSInc.), as rETR 5 rETRmax 3 tanh(Ed 3 Ek
21), where Ek 5rETRmax 3 a21 and a is the slope of the light-limitedportion of the PAR versus ETR relationship. To avoidbiasing the regression, repeat measures of wp at 3.6 mmolquanta m22 s21 in the actinic light sequence were excluded.
Analysis of in situ microprofiles—The diffusive flux (J) ofO2 from the microbial mat into the overlying bottom waterwas calculated from the measured steady-state O2 gradients(dC 3 dz21) in the DBL according to J 5 2D0 dC 3 dz21,where D0 is the free-solution diffusion coefficient of O2, Cis [O2], and z is depth. Values of D0 were taken fromBroecker and Peng (1974) and were recalculated to theexperimental temperature with the Stokes–Einstein relation(Li and Gregory 1974). The position of the mat surface wasdetermined by a break in the [O2] profile. This inflection isrequired for mass conservation in the diffusive flux,because of the shift in apparent diffusivity between the
Benthic photosynthesis in Lake Hoare 1805

DBL and the matrix of the mat. Vertical zones of metabolicactivity were detected with a numerical procedure for theinterpretation of steady-state microprofiles (Berg et al.1998). We used one in situ [O2] profile measured at 8.1-mand 16.6-m water depth to calculate depth profiles ofvolumetric net O2 production rates (unit: nmol cm23 s21)and area-specific depth-integrated net O2 production ratesfor each activity zone and for the upper 21 mm of the mats(unit: mmol m22 h21). Mat porosity, w 5 0.80 6 0.08 (n 57), was estimated following the approach described inEpping et al. (1999) assuming the sediment diffusioncoefficient DS 5 D0 (1 + 3 3 (1 – w))21 and conservationof O2 flux across the mat–water interface. We assumed wand DS to be depth invariant.
Results
Bottom water chemistry, attenuation of scalar irradiancewithin the mat, and benthic production—The bottom watersalinity increased with depth from 0.30 6 0.00 to 0.62 60.04, whereas the pH decreased from 8.97 6 0.03 to 7.59 60.09 (Fig. 3A,B). The [O2] of the bottom water was highestat 8-m depth (337 6 16% saturation) and lowest at 16-mdepth (134 6 5% saturation, Fig. 3C). The temperature ofthe bottom water at 8-m water depth was constant: 0.11uC.
The diffuse attenuation coefficients of scalar irradiance,KL, in four 10-nm wavebands (575–585, 625–635, 670–680,and 740–750 nm) were highest just below the surface ofa mat from 8-m water depth (4.72, 3.83, 5.54, and1.59 mm21) and decreased to a minimum at about 1.2-mm depth within the mat (0.005, 0.005, 0.010, and0.0004 mm21). Further down, KL increased asymptotical-ly, reaching its maxima at a depth of 4 mm at 0.76, 0.64,and 0.77 mm21 in the 575–585-nm, 625–635-nm, and 670–680-nm wavebands, respectively, and at 0.37 mm21 at wavelengths between 740 nm and 750 nm.
The incident downwelling irradiance of PAR (hereafterirradiance of PAR) reaching microbial mats at water depthsof 8.1, 9.2, 16.3, and 16.6 m varied between 1 mmol quantam22 s21 to 5 mmol quanta m22 s21 (Table 2). Low irradi-ance of PAR of 1.0 mmol quanta m22 s21 at 16.6-m waterdepth caused an average O2 efflux of 93 mmol m22 h21. Theefflux increased linearly with irradiance of PAR; the highestaverage efflux of 482 mmol m22 h21 was calculated fromprofiles measured at 8.1-m water depth under conditions ofirradiance of PAR 5 4.6 mmol quanta m22 s21 (Fig. 4).Note that estimates of O2 flux were on the basis of area,integrated across the depth of the photosynthetic active matplus the underlying organic material, which is different foreach water depth.
Analysis of a profile measured across the upper 21 mmof a mat from 8.1-m water depth under conditions ofirradiance of PAR 5 4.6 mmol quanta m22 s21 (Fig. 5A)revealed depth-integrated net O2 production of441 mmol m22 h21. Calculation of the O2 flux across theDBL revealed a similar value of 493 mmol m22 h21. Wefound three distinct zones of net O2 production/consump-tion: high production (399 mmol O2 m22 h21) in the upper3-mm-thick layer, low production (93 mmol O2 m22 h21)
between 3-mm and 6-mm depth, and consumption of51 mmol O2 m22 h21 between 6-mm and 21-mm depth.Note that rates in the production profiles shown in Fig. 5are given per volume of mat/sediment.
Fig. 3. (A) Bottom-water salinity, (B) pH, and (C) [O2]measured along a transect from beneath the ice hole to 16-mdepth. Symbols indicate the mean (n 5 5), and vertical linesindicate standard deviations.
1806 Vopel and Hawes
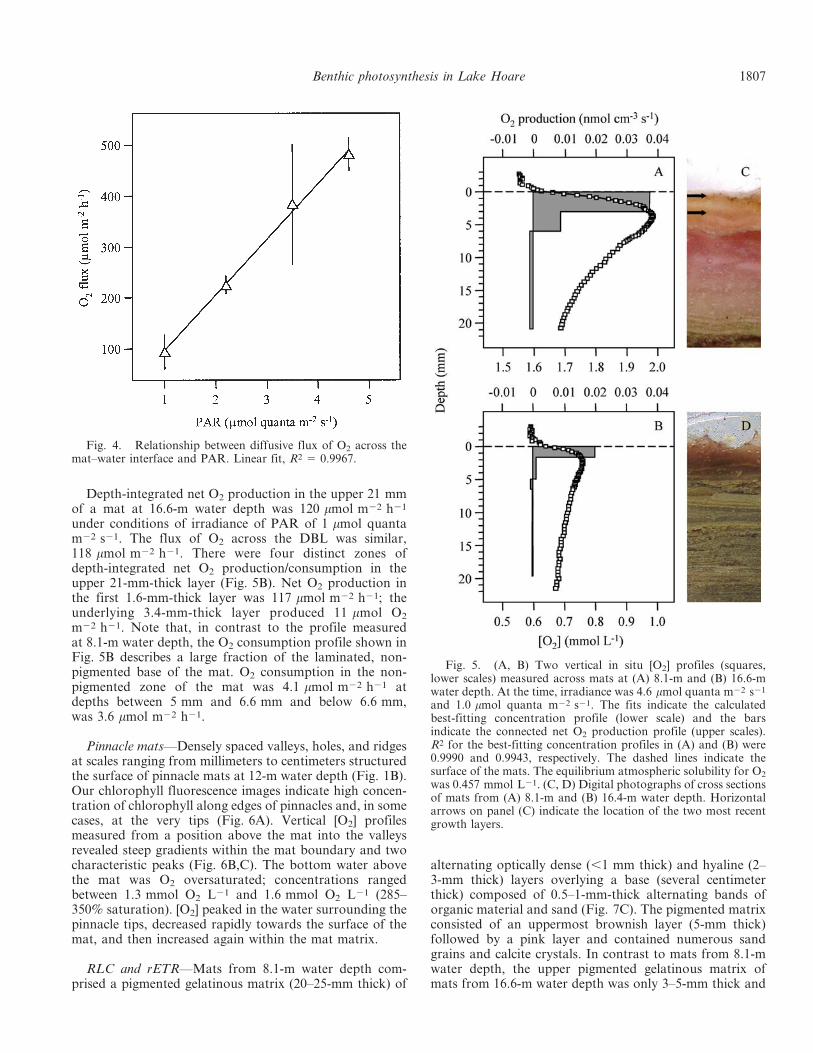
Depth-integrated net O2 production in the upper 21 mmof a mat at 16.6-m water depth was 120 mmol m22 h21
under conditions of irradiance of PAR of 1 mmol quantam22 s21. The flux of O2 across the DBL was similar,118 mmol m22 h21. There were four distinct zones ofdepth-integrated net O2 production/consumption in theupper 21-mm-thick layer (Fig. 5B). Net O2 production inthe first 1.6-mm-thick layer was 117 mmol m22 h21; theunderlying 3.4-mm-thick layer produced 11 mmol O2
m22 h21. Note that, in contrast to the profile measuredat 8.1-m water depth, the O2 consumption profile shown inFig. 5B describes a large fraction of the laminated, non-pigmented base of the mat. O2 consumption in the non-pigmented zone of the mat was 4.1 mmol m22 h21 atdepths between 5 mm and 6.6 mm and below 6.6 mm,was 3.6 mmol m22 h21.
Pinnacle mats—Densely spaced valleys, holes, and ridgesat scales ranging from millimeters to centimeters structuredthe surface of pinnacle mats at 12-m water depth (Fig. 1B).Our chlorophyll fluorescence images indicate high concen-tration of chlorophyll along edges of pinnacles and, in somecases, at the very tips (Fig. 6A). Vertical [O2] profilesmeasured from a position above the mat into the valleysrevealed steep gradients within the mat boundary and twocharacteristic peaks (Fig. 6B,C). The bottom water abovethe mat was O2 oversaturated; concentrations rangedbetween 1.3 mmol O2 L21 and 1.6 mmol O2 L21 (285–350% saturation). [O2] peaked in the water surrounding thepinnacle tips, decreased rapidly towards the surface of themat, and then increased again within the mat matrix.
RLC and rETR—Mats from 8.1-m water depth com-prised a pigmented gelatinous matrix (20–25-mm thick) of
alternating optically dense (,1 mm thick) and hyaline (2–3-mm thick) layers overlying a base (several centimeterthick) composed of 0.5–1-mm-thick alternating bands oforganic material and sand (Fig. 7C). The pigmented matrixconsisted of an uppermost brownish layer (5-mm thick)followed by a pink layer and contained numerous sandgrains and calcite crystals. In contrast to mats from 8.1-mwater depth, the upper pigmented gelatinous matrix ofmats from 16.6-m water depth was only 3–5-mm thick and
Fig. 4. Relationship between diffusive flux of O2 across themat–water interface and PAR. Linear fit, R2 5 0.9967.
Fig. 5. (A, B) Two vertical in situ [O2] profiles (squares,lower scales) measured across mats at (A) 8.1-m and (B) 16.6-mwater depth. At the time, irradiance was 4.6 mmol quanta m22 s21
and 1.0 mmol quanta m22 s21. The fits indicate the calculatedbest-fitting concentration profile (lower scale) and the barsindicate the connected net O2 production profile (upper scales).R2 for the best-fitting concentration profiles in (A) and (B) were0.9990 and 0.9943, respectively. The dashed lines indicate thesurface of the mats. The equilibrium atmospheric solubility for O2
was 0.457 mmol L21. (C, D) Digital photographs of cross sectionsof mats from (A) 8.1-m and (B) 16.4-m water depth. Horizontalarrows on panel (C) indicate the location of the two most recentgrowth layers.
Benthic photosynthesis in Lake Hoare 1807

alternating optically dense and hyaline layers were ,1-mmthick.
The two vertical panels in Fig. 7 illustrate the contrast-ing thickness of the chlorophyll-containing layer and thelamination of these layers at two depths. They show thesame field of view of cross sections of mats from 8.1 m and16.6 m, imaged with the PAM (as F0 and as wp) and witha digital camera. Inspection of the F0 images (Fig. 7A,D)revealed three laminae of pigments in the upper layer of themats from 16.6-m water depth, but at least six laminae inthe pigmented layer of mats from 8.1-m water depth.Chlorophyll fluorescence was maximal in the upperlaminae of the mat from 8.1-m water depth and, withincreasing depth into the mat, the chlorophyll fluorescencewas associated with the optically dense layers. Inspection ofthe false color images of wp in Fig. 7B,E revealed littlestructure to this parameter.
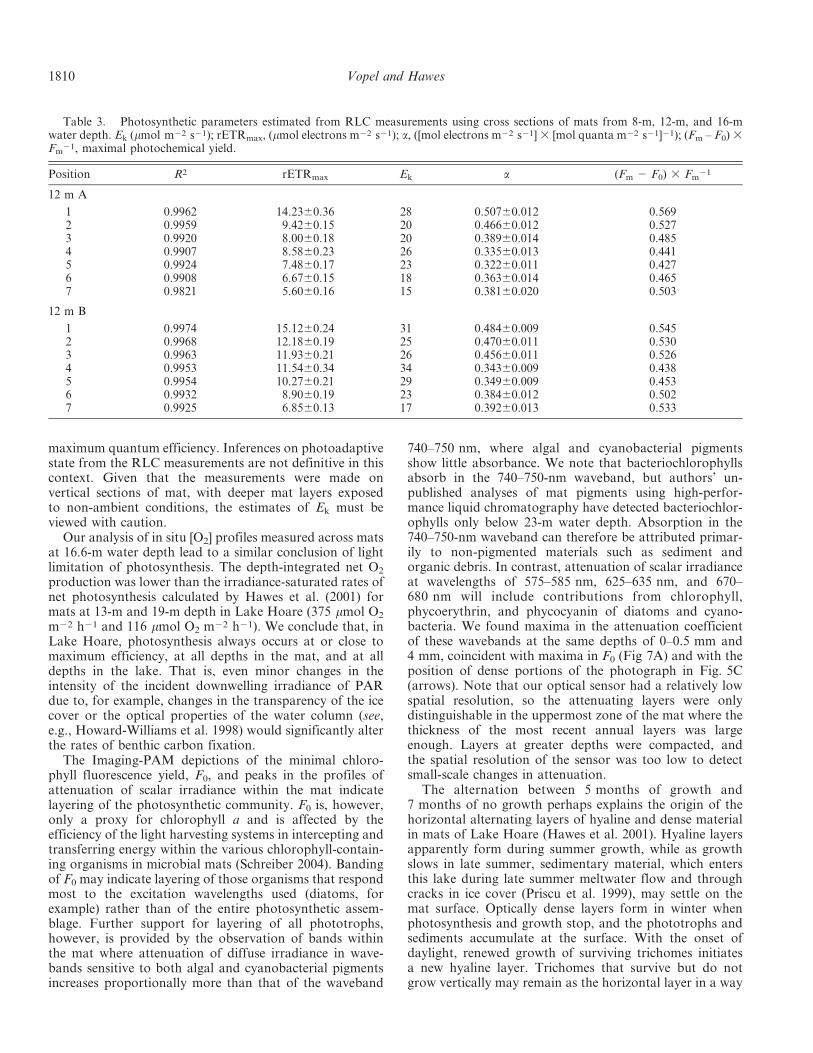
Our two profiling PAM measurements across the crosssections of the upper pigmented layer of mats from 12-mwater depth yielded similar values of all photosyntheticparameters, and showed a similar decline in Ek andrETRmax with increasing depth into the mat (Table 3).
Discussion
We have demonstrated, for the first time, in situ benthicphotosynthesis in a permanently ice-covered lake of theMcMurdo Dry Valleys. We showed that microbial mats inLake Hoare to at least 16.6-m water depth are netproducers of O2 during the summer period. To estimatethe rates of O2 evolution from in situ, steady-state [O2]profiles we used two different approaches: we calculatedthe efflux of O2 across the DBL from the [O2] gradient inthe DBL, and we used [O2] profiles in the upper 21-mm-thick layer of the mat to model the net O2 production rateprofile (Fig. 5) and the area-specific depth-integrated netO2 production. It should be noted that the net O2
production rate profiles were calculated assuming w andDs to be depth invariant, which may not be the case giventhe laminated structure of the mats, and that microelec-trodes can affect the DBL when introduced from aboveand, thereby, the derived solute exchange rates (Glud et al.1994). Furthermore, the calculation of net O2 productionrates and area-specific depth-integrated net O2 productiononly includes the metabolic activity within the upper21 mm of the mats, whereas estimates of the O2 flux fromthe concentration profiles in the DBL integrate the totalbenthic activity, including O2 consumption in the deeper(.21 mm depth) laminated sediment. General agreement
r
Fig. 6. (A) Chlorophyll fluorescence image showing theconcentration of pigments associated with the small pinnacles(1–2 cm high) in the center of the picture. The false-color imageshows low concentrations as red and higher concentrations asyellow, then green. (B) Three [O2] profiles across the surface ofa pinnacle mat taken from 12-m water depth. (C) Sketch showingan outline of a section of a pinnacle mat and the approximate pathof the microelectrode during measurements of the profiles shownin (B). Note the sketch is not in scale.
1808 Vopel and Hawes

between the two estimates, however, indicates that therespiration in the deeper unpigmented laminated zone ofthe mat must be negligible. The production profile inFig. 5B, which covers the upper part of the laminatedunpigmented zone of the mat, actually indicates a very lowvolume specific consumption (respiration) of 7.61 31025 nmol O2 cm23 s21 at depths below 6.6 mm. Assuminga 10-cm-thick column of unpigmented laminated sediment,the area specific consumption in this zone would be27.69 mmol m22 h21 (5 0.089 mg cm22 h21), which ismore than three times lower than the rates estimated formats in Lake Hoare by Hawes and Schwarz (2000) basedon the laboratory gas-exchange measurements. Such lowdecomposition rates, in combination with the lack ofgrazing and bioturbation by metazoans, the lack of stronginternal currents, the continuous influx of sedimentthrough the ice cover, and the accumulation of carbonates,may promote the formation and preservation of modernstromatolites that will eventually become lithified, resultingin lacustrine carbonate sedimentary deposits. This processmay contribute significantly to water-column O2 supersat-uration because it isolates fixed carbon from the lake’s
metabolism. Additional sources of O2 may come frommicrobial mats that leave Lake Hoare after freezing intothe ice cover (lift-off mats) and meltstreams carrying O2
into this lake that is exsolved when water freezes onto thebottom of the ice cover (Wharton et al. 1986).
For mats from 7-m and 10-m water depth in LakeHoare, Hawes et al. (2001) estimated rates of irradiance-saturated gross photosynthesis of 2.32 mg O2 cm22 h21 and2.06 mg O2 cm22 h21 and maximum respiration rates of0.58 mg O2 cm22 h21 and 0.34 mg O2 cm22 h21, respec-tively. Hence irradiance-saturated net photosynthesiswould be 1.74 mg O2 cm22 h21 and 1.72 mg O2 cm22 h21,which translates to 543.8 mmol O2 m22 h21 and 537.5 mmolO2 m22 h21. These rates are 22–23% higher than the O2
flux calculated from our in-situ measurements at 8.1-mwater depth. This suggests that benthic photosynthesis waslight-limited, and this was supported by our profiling RLCmeasurements. Phototrophs throughout the pigmentedlayer of the mat were photosynthetically competent, withEk values that indicated that, at all irradiances likely to beexperienced under ice, photosynthesis at all depths in themat was light-limited, therefore operating at or close to
Fig. 7. Representative images of (A, D) the minimal fluorescence, F0, and (B, E) maximal photochemical yield, (Fm – F0) 3 Fm21,
and (C, F) digital photograph of cross sections of the photosynthetic active zones. (A, B, C) Mat from 8.1-m water depth; (D, E, F) matfrom 16.6-m water depth. The color-gradient scale indicates the magnitude of the fluorescence signal. Bar, 10 mm.
Benthic photosynthesis in Lake Hoare 1809
maximum quantum efficiency. Inferences on photoadaptivestate from the RLC measurements are not definitive in thiscontext. Given that the measurements were made onvertical sections of mat, with deeper mat layers exposedto non-ambient conditions, the estimates of Ek must beviewed with caution.
Our analysis of in situ [O2] profiles measured across matsat 16.6-m water depth lead to a similar conclusion of lightlimitation of photosynthesis. The depth-integrated net O2
production was lower than the irradiance-saturated rates ofnet photosynthesis calculated by Hawes et al. (2001) formats at 13-m and 19-m depth in Lake Hoare (375 mmol O2
m22 h21 and 116 mmol O2 m22 h21). We conclude that, inLake Hoare, photosynthesis always occurs at or close tomaximum efficiency, at all depths in the mat, and at alldepths in the lake. That is, even minor changes in theintensity of the incident downwelling irradiance of PARdue to, for example, changes in the transparency of the icecover or the optical properties of the water column (see,e.g., Howard-Williams et al. 1998) would significantly alterthe rates of benthic carbon fixation.
The Imaging-PAM depictions of the minimal chloro-phyll fluorescence yield, F0, and peaks in the profiles ofattenuation of scalar irradiance within the mat indicatelayering of the photosynthetic community. F0 is, however,only a proxy for chlorophyll a and is affected by theefficiency of the light harvesting systems in intercepting andtransferring energy within the various chlorophyll-contain-ing organisms in microbial mats (Schreiber 2004). Bandingof F0 may indicate layering of those organisms that respondmost to the excitation wavelengths used (diatoms, forexample) rather than of the entire photosynthetic assem-blage. Further support for layering of all phototrophs,however, is provided by the observation of bands withinthe mat where attenuation of diffuse irradiance in wave-bands sensitive to both algal and cyanobacterial pigmentsincreases proportionally more than that of the waveband
740–750 nm, where algal and cyanobacterial pigmentsshow little absorbance. We note that bacteriochlorophyllsabsorb in the 740–750-nm waveband, but authors’ un-published analyses of mat pigments using high-perfor-mance liquid chromatography have detected bacteriochlor-ophylls only below 23-m water depth. Absorption in the740–750-nm waveband can therefore be attributed primar-ily to non-pigmented materials such as sediment andorganic debris. In contrast, attenuation of scalar irradianceat wavelengths of 575–585 nm, 625–635 nm, and 670–680 nm will include contributions from chlorophyll,phycoerythrin, and phycocyanin of diatoms and cyano-bacteria. We found maxima in the attenuation coefficientof these wavebands at the same depths of 0–0.5 mm and4 mm, coincident with maxima in F0 (Fig 7A) and with theposition of dense portions of the photograph in Fig. 5C(arrows). Note that our optical sensor had a relatively lowspatial resolution, so the attenuating layers were onlydistinguishable in the uppermost zone of the mat where thethickness of the most recent annual layers was largeenough. Layers at greater depths were compacted, andthe spatial resolution of the sensor was too low to detectsmall-scale changes in attenuation.
The alternation between 5 months of growth and7 months of no growth perhaps explains the origin of thehorizontal alternating layers of hyaline and dense materialin mats of Lake Hoare (Hawes et al. 2001). Hyaline layersapparently form during summer growth, while as growthslows in late summer, sedimentary material, which entersthis lake during late summer meltwater flow and throughcracks in ice cover (Priscu et al. 1999), may settle on themat surface. Optically dense layers form in winter whenphotosynthesis and growth stop, and the phototrophs andsediments accumulate at the surface. With the onset ofdaylight, renewed growth of surviving trichomes initiatesa new hyaline layer. Trichomes that survive but do notgrow vertically may remain as the horizontal layer in a way
Table 3. Photosynthetic parameters estimated from RLC measurements using cross sections of mats from 8-m, 12-m, and 16-mwater depth. Ek (mmol m22 s21); rETRmax, (mmol electrons m22 s21); a, ([mol electrons m22 s21] 3 [mol quanta m22 s21]21); (Fm – F0) 3Fm
21, maximal photochemical yield.
Position R2 rETRmax Ek a (Fm 2 F0) 3 Fm21
12 m A
1 0.9962 14.2360.36 28 0.50760.012 0.5692 0.9959 9.4260.15 20 0.46660.012 0.5273 0.9920 8.0060.18 20 0.38960.014 0.4854 0.9907 8.5860.23 26 0.33560.013 0.4415 0.9924 7.4860.17 23 0.32260.011 0.4276 0.9908 6.6760.15 18 0.36360.014 0.4657 0.9821 5.6060.16 15 0.38160.020 0.503
12 m B
1 0.9974 15.1260.24 31 0.48460.009 0.5452 0.9968 12.1860.19 25 0.47060.011 0.5303 0.9963 11.9360.21 26 0.45660.011 0.5264 0.9953 11.5460.34 34 0.34360.009 0.4385 0.9954 10.2760.21 29 0.34960.009 0.4536 0.9932 8.9060.19 23 0.38460.012 0.5027 0.9925 6.8560.13 17 0.39260.013 0.533
1810 Vopel and Hawes

analogous to that described by Doemel and Brock (1977)for warm-water laminated mats.
Hawes et al. (2001) estimated that the growth of mats inLake Hoare at water depth between 7 m and 19 m resultsin an annual increase in mat thickness between 2.5 mm and0.2 mm. Consequently, the uppermost zone of high netphotosynthesis shown in Fig. 5A,B (bars) likely constitutedthe recent (2004) annual layer, whereas photosynthesis inthe underlying zone would have been caused by the activityof the previous-year layers. Hence, photosynthesis, andpotentially therefore growth, in mats from 8–16-m waterdepth may not be confined to the most recent annual layer.The images in Fig. 7B,E revealed no vertical structure tothe parameter wp, which indicates that all of the fluorescingchlorophyll in the previous-year layers was connected tofully competent photosystems. As discussed above, slicingthe mat vertically and exposing the cross section to air-saturated water will have altered conditions for photosyn-thesis, and while these images do indicate the potential forhigh efficiency in the deeper mat layers, they do not showthis to occur in situ. Another experimental uncertainty isthe fact that the operational depth/volume from whichfluorescence signals are obtained rely on the optical densityof the mat. During the saturation, pulse fluorescence fromdeeper layers can contribute to the signal, while measure-ments of F-values, especially at low actinic irradiances,sample from shallower layers. Thus, yield measurementsrepresent averages over an unknown volume, which canlead to artifacts (see e.g., Grunwald and Kuhl 2004).
Assuming a molar ratio of C : O 5 1.2 : 1 and that theabsorption efficiency is the same for pigment arrays atdifferent water depths, we used the slope of our irradiance-versus-O2-flux curve (Fig. 4) to estimate an area-specificmaximum community quantum yield of 0.073 mol carbon(C) per mol photons incident to the mat surface (1 mol ofcarbon fixed for every 13.7 mol incident photons). Thisyield is similar to that calculated by Hawes and Schwarz(1999) for mats from 10-m water depth in Lake Hoare:0.06 mol C mol21 quanta. (Our calculation still under-estimates the actual yield because we do not partitionphoton absorption between pigments and other matter.)Extrapolation of the irradiance-versus-O2-flux curve inFig. 4 revealed a low compensation irradiance of 0.1 mmolquanta m22 s21, reflecting high shade acclimation. Again,this result supports the low compensation-irradianceestimates of ,0.5 mmol quanta m22 s21 for mats in LakeHoare from .13-m water depth published by Hawes andSchwarz (1999, 2000).
Our measurements within the boundary of pinnacle matsrevealed a complex small-scale chemical landscape. Thesemeasurements and the images in Figs. 1B and 6A indicatethat a one-dimensional approach to quantification of soluteexchange and reaction rates may not be a good approxi-mation for this type of mat (see also Jørgensen and DesMarais 1990, and Glud et al. 1999). We selected areasdevoid of pinnacles for measuring in situ O2 profiles (e.g.,see Fig. 1A) and this methodological necessity may haveresulted in an underestimation of areal production inheavily pinnacled areas. The origin and function of thepinnacles in such pinnacle mats is unknown, but may be
caused by positive phototaxis similar to that reported onpinnacle mats in hot springs (Walter 1977). However, theformation of pinnacles does not automatically implyphotomovement. In many low-flow or stagnant environ-ments, mats with pinnacle structures develop. This can insome cases be due to formation of internal gas bubbles thatare overgrown and in other cases be a strategy to overcomeor minimize diffusion limitation of solute exchange. Also,largely non-motile mats in other environments can developconspicuous pinnacles over time (Kuhl et al. 2003).
In conclusion, we have shown that microbial mats inLake Hoare to at least 16.6-m water depth are netproducers of O2 during the summer period. We confirmedkey parameters of benthic photosynthesis previously de-rived only from laboratory gas-exchange measurements,and we present evidence that photosynthesis in the matsoccurs, at all depths in the mat and at all lake depths, at orclose to maximum photosynthetic efficiency. This simplifiesmodeling simulations of benthic photosynthesis in the lake,and implies that annual production will be related to iceand water transparency, which vary from year to year(Howard-Williams et al. 1998). Our high-resolution labo-ratory measurements at the surface of pinnacle matsrevealed a complex small-scale chemical structure of themat–water interface. We propose manipulative in-situexperiments to understand the mechanisms that lead tothe formation of pinnacles and to reveal the implications ofsuch structures for light-limited growth in the diffusion-dominated permanently ice-covered lakes.
References
BERG, P., N. RISGAARD-PETERSEN, AND S. RYSGAARD. 1998.Interpretation of measured concentration profiles in sedimentpore water. Limnol. Oceanogr. 43: 1500–1510.
BROECKER, W. S., AND T.-H. PENG. 1974. Gas exchange ratesbetween air and sea. Tellus 26: 185–190.
CATHEY, D. D., B. C. PARKER, G. M. SIMMONS, W. H. YONGUE,AND M. R. VAN BRUNT. 1981. The microfauna of algal matsand artificial substrates in Southern Victoria Land lakes ofAntarctica. Hydrobiologia 85: 3–15.
CRAIG, H., R. A. WHARTON, JR., AND C. P. MCKAY. 1992. Oxygensupersaturation in ice-covered Antarctic lakes: Biologicalversus physical contributions. Science 255: 318–321.
DOEMEL, W. N., AND T. D. BROCK. 1977. Structure, growth, anddecomposition of laminated algal-bacterial mats in alkalinehot springs. Appl. Environ. Microbiol. 34: 433–452.
DORAN, P. T., C. P. MCKAY, G. D. CLOW, G. L. DANA, A. G.FOUNTAIN, T. NYLEN, AND W. B. LYONS. 2002a. Valley floorclimate observations from the McMurdo dry valleys, Antarc-tica, 1986–2000. J. Geophys. Res. 107: 4772.
———, AND oTHERS. 2002b. Recent climate cooling and ecosystemresponse in the McMurdo Dry Valleys, Antarctica. Nature415: 517–520.
DORE, J. E., AND J. C. PRISCU. 2001. Phytoplankton phosphorusdeficiency and alkaline phophatase activity in the McMurdoDry Valley lakes, Antarctica. Limnol. Oceanogr. 46:1331–1346.
EPPING, E. H. G., A. KHALILI, AND R. THAR. 1999. Photosynthesisand the dynamics of oxygen consumption in a microbial matas calculated from transient oxygen microprofiles. Limnol.Oceanogr. 44: 1936–1948.
Benthic photosynthesis in Lake Hoare 1811
GLUD, N. G., J. K. GUNDERSEN, N. P. REVSBECH, AND B. B.JøRGENSEN. 1994. Effects on the benthic diffusive boundarylayer imposed by microelectrodes. Limnol. Oceanogr. 39:462–467.
———, M. KUHL, O. KOHLS, AND N. B. RAMSING. 1999.Heterogeneity of oxygen production and consumption ina photosynthetic microbial mat as studied by planar optodes.J. Phycol. 35: 270–279.
GRUNWALD, B., AND M. KUHL. 2004. A system for imagingvariable chlorophyll fluorescence of aquatic phototrophs.Ophelia 58: 79–89.
HAWES, I., D. MOORHEAD, D. SUTHERLAND, J. SCHMELING, AND
A-M. SCHWARZ. 2001. Benthic primary production in twoperennially ice-covered Antarctic lakes: patterns of biomassaccumulation with a model of community metabolism.Antarctic Science 13: 18–27.
———, AND A.-M. SCHWARZ. 1999. Photosynthesis in an extremeshade environment: benthic microbial mats from Lake Hoare,a permanently ice-covered Antarctic lake. J. Phycol. 35:448–459.
———, AND ———. 2000. Absorption and utilization ofirradiance by cyanobacterial mats in two ice-covered Antarc-tic lakes with contrasting light climates. J. Phycol. 37: 5–15.
———, D. SUTHERLAND, AND D. HANELT. 2003. The use of pulseamplitude modulated fluorometry to determine fine-scaletemporal and spatial variation of in situ photosyntheticactivity within an Isoetes-dominated canopy. Aquat. Bot. 77:1–15.
HEYWOOD, R. B. 1984. Antarctic inland waters, p. 279–344. In R.M. Laws [ed.], Antarctic ecology, v. 1. Academic.
HOFSTRAAT, J. W., J. C. H. PEETERS, J. F. H. SNEL, AND C. GEEL.1994. Simple determination of photosynthetic efficiency andphotoinhibition of Dunaliella tertiolecta by saturating pulsefluorescence measurements. Mar. Ecol. Prog. Ser. 103:187–196.
HOWARD-WILLIAMS, C., A.-M. SCHWARZ, AND I. HAWES. 1998.Optical properties of the McMurdo Dry Valley Lakes,Antarctica. Antarctic Research Series 72: 189–203.
JASSBY, A. D., AND T. PLATT. 1976. Mathematical formulation ofthe relationship between photosynthesis and light for phyto-plankton. Limnol. Oceanogr. 21: 540–547.
JøRGENSEN, B. B., AND D. J. DES MARAIS. 1990. The diffusiveboundary layer of sediments: Oxygen microgradients overa microbial mat. Limnol. Oceanogr. 35: 1343–55.
KIRK, J. T. O. 1983. Light and photosynthesis in aquaticecosystems. Cambridge.
KUHL, M., T. FENCHEL, AND J. KAZMIERCZAK. 2003. Growth,structure and calcification potential of an artificial cyano-bacterial mat, p. 77–102. In W. E. Krumbein, D. Paterson,and G. Zavarzin [eds.], Fossil and recent biofilms, a naturalhistory of life on Earth. Kluwer.
———, R. N. GLUD, J. BORUM, R. ROBERTS, AND S. RYSGAARD.2001. Photosynthetic performance of surface-associated algaebelow sea ice measured with a pulse-amplitude-modulated(PAM) fluorometer and O2 microsensors. Mar. Ecol. Prog.Ser. 223: 1–14.
LASSEN, C., PLOUGH., AND B. B. JøRGENSEN. 1992. A fiber-opticscalar irradiance microsensor: Application for spectral lightmeasurements in sediments. FEMS Microbial Ecol. 86:247–254.
LI, Y.-H., AND S. GREGORY. 1974. Diffusion of ions in sea waterand in deep-sea sediments. Geochim. Cosmochim. Acta 38:703–714.
LIZOTTE, M. P., AND J. C. PRISCU. 1992. Photosynthesis-irradiancerelationship from the physically stable water column ofa perennially ice-covered lake (Lake Bonney, Antarctica). J.Phycol. 28: 179–185.
MOORHEAD, D., J. SCHMELING, AND I. HAWES. 2005. Modeling thecontribution of benthic microbial mats to net primaryproduction in Lake Hoare, McMurdo Dry Valleys. AntarcticScience 17: 33–45.
PARKER, B. C., G. M. SIMMONS, JR., F. G. LOVE, R. A. WHARTON,JR., AND K. G. SEABURG. 1981. Modern stromatolites inAntarctic dry valley lakes. BioScience 31: 656–661.
PRISCU, J. C., L. R. PRISCU, W. F. VINCENT, AND C. HOWARD-WILLIAMS. 1987. Photosynthate distribution by microplank-ton in permanently ice-covered Antarctic desert lakes.Limnol. Oceanogr. 32: 260–270.
———, AND oTHERS. 1999. Carbon transformations in a perenni-ally ice-covered Antarctic lake. BioScience 49: 997–1007.
RALPH, P. J., AND R. GADEMANN. 2005. Rapid light curves: Apowerful tool to assess photosynthetic activity. Aquat. Bot.82: 222–237.
———, U. SCHREIBER, R. GADEMANN, M. KUHL, AND A. D. W.LARKUM. 2005. Coral photobiology studied with a newimaging pulse amplitude modulated fluorometer. J. Phycol.41: 335–342.
REVSBECH, N. P. 1989. An oxygen microelectrode with a guardcathode. Limnol. Oceanogr. 34: 474–478.
SCHREIBER, U. 2004. Pulse-amplitude (PAM) fluorometry andsaturation pulse method, p. 279–319. In G. Papageorgiou andGovindjee [eds.], Chlorophyll fluorescence: A signature ofphotosynthesis. Advances in photosynthesis and respirationseries, Kluwer.
———, M. KUHL, I. KLIMANT, AND H. REISING. 1996. Measure-ment of chlorophyll fluorescence within leaves using a mod-ified PAM fluorometer with a fiber-optic microprobe.Photosynth. Res. 47: 103–109.
VINCENT, W. F. 1981. Production strategies in Antarctic inlandwaters: Phytoplankton eco-physiology in a permanently ice-covered lake. Ecology 62: 1215–1224.
WALTER, M. R. 1977. Interpreting stromatolites. AmericanScientist 65: 563–571.
WHARTON, JR., R. A., W. B. LYONS, AND D. J. DES MARAIS. 1993.Stable isotopic biogeochemistry of carbon and nitrogen ina perennially ice-covered Antarctic lake. Chemical Geology(Isotope Geoscience Section) 107: 159–172.
———, C. P. MCKAY, G. M. SIMMONS, JR., AND B. C. PARKER.1986. Oxygen budget of a perennially ice-covered Antarcticlake. Limnol. Oceanogr. 31: 437–443.
———, M. A. MEYER, C. P. MCKAY, R. L. MANCINELLI, AND G.M. SIMMONS, JR. 1994. Sediment oxygen profiles in a super-oxygenated Antarctic lake. Limnol. Oceanogr. 39: 839–853.
———, B. C. PARKER, AND G. M. SIMMONS, JR. 1983. Distribu-tion, species composition and morphology of algal mats inAntarctic dry valley lakes. Phycologia 22: 355–365.
Received: 13 October 2005Accepted: 23 February 2006
Amended: 7 March 2006
1812 Vopel and Hawes