Embed Size (px)
Citation preview
VOLVO CAR GROUPINTERIM REPORT SECOND QUARTER AND FIRST SIX MONTHS 2019
Freedom to move in a personal, sustainable and safe way.

2 OF 26INTERIM REPORT SECOND QUARTER AND FIRST SIX MONTHS 2019 | GOTHENBURG JULY 17 TH 2019
Key figures (MSEK)Q2
2019Q2
2018 Change %
First six months
2019
First six months
2018 Change %Full year
2018
Net revenue 67,185 66,039 1.7 130,095 122,852 5.9 252,653
Research and development expenses –3,077 –2,824 9.0 –6,304 –4,894 28.8 –12,098
Operating income (EBIT) 2,600 4,226 –38.5 5,519 7,842 –29.6 14,185
Net income 1,393 2,996 –53.5 3,398 5,554 –38.8 9,781
EBITDA 6,537 7,573 –13.7 13,300 14,436 –7.9 28,593
Cash flow from operating and investing activities 1,581 3,636 –56.5 –2,759 850 –424.6 4,705
Net cash 12,521 14,460 –13.4 12,521 14,460 –13.4 18,029
Gross margin, % 19.4 19.8 19.2 19.9 20.0
EBIT margin, % 3.9 6.4 4.2 6.4 5.6
EBITDA margin, % 9.7 11.5 10.2 11.8 11.3
All amounts are in MSEK unless otherwise stated. Amounts in brackets refer to the same period for the preceding year, unless otherwise stated. All performance measures are further described on page 26.
Second Quarter 2019 First Six Months 2019
• Retail sales 179,506 (170,232) units
• Net revenue MSEK 67,185 (66,039)
• Operating income (EBIT) MSEK 2,600 (4,226)
• Net income MSEK 1,393 (2,996)
• Cash flow from operating and investing activities MSEK 1,581 (3,636)
• Battery sourcing agreements signed with
CATL and LG Chem
• Production ready base car for self-driving presented by Volvo Cars and Uber
• Retail sales 340,826 (317,639) units
• Net revenue MSEK 130,095 (122,852)
• Operating income (EBIT) MSEK 5,519 (7,842)
• Net income MSEK 3,398 (5,554)
• Cash flow from operating and investing activities MSEK –2,759 (850)
VOLVO CAR GROUP

3 OF 26INTERIM REPORT SECOND QUARTER AND FIRST SIX MONTHS 2019 | GOTHENBURG JULY 17 TH 2019
CEO Comment
For the full year, we forecast continued growth underpinned by our strong product portfolio and the increased production capacity. Despite the present challenges in the car industry which will put continued pressure on margins, our initiated actions and volume growth are expected to strengthen our profit in the second half of the year compared with the same period last year.
Our strong product offering will allow us to continue capitalis-ing on the opportunity we have to scale our business and to increase our brand awareness.
As announced, Hans Oscarsson will take up a new position within the Geely group during the summer. I would like to thank him for his almost 30 years of service to Volvo Cars. At the same time, I am very pleased to welcome Carla De Geyse-leer as CFO to Volvo Cars. She brings a wealth of financial experience from a range of different industries and I am confi-dent that she will be a great addition to our executive team.
Håkan SamuelssonChief Executive Officer
VOLVO CAR GROUP
The second quarter and first half year have demonstrated the attractiveness of our product portfolio. At a time when most markets in the world have stagnating car sales, we experi-enced strong growth, increasing the number of cars sold in the quarter by 5.4 per cent and in the half year by 7.3 per cent compared with the same periods last year, and we continued to take market share in all regions. In the German market, as an example, our sales grew over 30 per cent. This shows that we are now a real premium alternative in this demanding market.
The current operating environment of increased pricing pres-sure and new tariffs have decreased our operating profit. To counterbalance these effects, we have initiated additional cost measures within the company on top of already planned measures. By the end of second quarter, staffing has been reduced by more than 750, mainly consultants. Additionally, we are reducing costs for bought services. These actions will lower our fixed cost run rate by approximately 1 billion SEK as we enter the second half of the year. Further actions will lower cost with an additional billion as we enter 2020.
To increase capacity and to benefit from local production, we have started producing the XC40 in the Luqiao plant. The high demand for this car continues to exceed our expectations.
As we look to the future, we have also taken important strate-gic steps on our journey during the quarter. By signing global long-term agreements with two of the leading battery makers CATL and LG Chem, we have ensured sufficient supply of bat-teries for the next generation electric Volvo and Polestar cars. Additionally, we presented the first production ready base car, capable of autonomous drive developed together with Uber.
“We continued to take market share in
all regions.”

VOLVO CAR GROUP
4 OF 26INTERIM REPORT SECOND QUARTER AND FIRST SIX MONTHS 2019 | GOTHENBURG JULY 17 TH 2019
Volvo Cars’ growth momentum continued during the second quarter. Global retail sales increased 5.4 per cent year-over-year to 179,506 (170,232) units, with SUVs accounting for 61.1 (54.7) per cent of total retail sales. Wholesales increased by 0.8 per cent to 178,833 (177,398) units. All main markets reported growth with the exception of Sweden, which was largely a result of a strong push in the previous year prior to the introduction of the taxation scheme referred to as Bonus Malus. Germany regis-tered the strongest growth performance of 31.1 per cent on the back of strong demand for the XC40 and V60. China continued to be Volvo Cars’ largest market, followed by the US and Sweden.
Overall, demand for Volvo Cars’ XC line-up remained strong in all markets, mainly driven by a boost in sales of the XC40. The XC60 remained Volvo Cars’ bestseller with 50,946 (50,999) units sold. The small decline was mainly driven by lower sales in Sweden as well as the reallocation of XC60 production, which resulted in one-off delivery delays. The XC40 sold 32,961 (17,505) units and is now introduced in all main markets. Sales of the XC90 reached 25,745 (24,696) units, a growth of 4.2 per cent driven mainly by the US and China. Sales of the V60 reached 18,991 units, an increase of 29.7 per cent driven by European sales, in particular Sweden and Germany. Production of the V40 will cease during July of this year, as we end production on our legacy platforms and shift capacity to newer models, such as the XC40. As production is being ramped down, V40 sales declined by 14.7 per cent to 16,528 units. The 6.8 per cent decrease in S90 sales to 14,215 units, was mainly driven by higher import tariffs in the US and a decline in the overall segment in that market as well as in Europe. Sales of the V90 declined 32.5 per cent pri-marily driven by lower sales in Sweden and the launch of the new V60. Overall, sales of the S60 declined 20.9 per cent due to that the new model is still to be launched in China and Other markets.
Sales and Market DevelopmentSecond Quarter
Retail sales (units)Q2
2019Q2
2018 Change %
First six months
2019
First six months
2018 Change %
Europe 88,029 85,036 3.5 174,653 164,614 6.1
China 37,855 32,712 15.7 67,741 61,480 10.2
US 28,062 27,539 1.9 50,120 47,622 5.2
Other 25,560 24,945 2.5 48,312 43,923 10.0
Retail sales total 179,506 170,232 5.4 340,826 317,639 7.3
Whereof electrified vehicles 9,089 9,360 –2.9 21,015 19,170 9.6
Wholesales 178,833 177,398 0.8 345,186 332,670 3.8
Production volume 180,138 170,569 5.6 355,042 346,240 2.5
EUROPEMarketNew car registrations in Europe declined by 3.0 per cent, as all main markets recorded a decline with the exception of Ger-many which grew a slight 0.9 per cent. The Swedish car mar-ket declined by 32.0 per cent in registrations during the quar-ter, the main driver continued to be lagging effects of Bonus Malus.
Volvo CarsDespite a contraction in the region, Volvo Cars’ sales contin-ued to grow at 3.5 per cent in the second quarter, reaching 88,029 (85,036) units, with SUVs accounting for 53.3 (48.8) per cent of total retail sales in Europe. Growth was mainly driven by the full introduction of the XC40 which sold 20,656 (10,351) units in the quarter. All main markets in the region reported sales growth except for Sweden. The markets with the highest growth were Germany and the UK, where
units sold reached 14,440 (11,012) and 13,671 (11,673) respectively. In both markets, growth was mainly driven by the introduction of the XC40 as well as a boost in sales of the V60.
CHINAMarketThe passenger car market in China declined by 8.4 per cent in the second quarter of the year, as a slowing economy and trade tensions weigh on consumer sentiment and demand. However, the premium car market remained resilient, record-ing a 13.2 per cent growth driven by consumer appetite for vehicles in the middle sedan and SUV segment.
Volvo CarsDemand for Volvo cars in China continued to rise, resulting in retail sales growth of 15.7 per cent year-over-year to 37,855

5 OF 26INTERIM REPORT SECOND QUARTER AND FIRST SIX MONTHS 2019 | GOTHENBURG JULY 17 TH 2019
(32,712) units. Sales growth was driven by strong demand for Volvo Cars SUVs; our locally produced XC60 in particular. Also, the introduction of the XC40 helped drive demand, for which the ramp-up continues. This led to SUV sales growing 47.4 per cent to 22,147 (15,021) units sold, and a higher share SUVs, currently standing at 58.5 (45.9) per cent of total retail sales in China. The V and S line-ups both decreased in sales, the latter driven by lower demand for the classic S60 which is being phased out. Sales of the locally produced S90 grew 28.8 per cent, reaching 10,905 units; the 2020 model is cur-rently being launched in the country.
US MarketThe US vehicle sector recorded a decline of 1.5 per cent in the second quarter of the year driven by weak passenger car sales across the board, offset by a small increase in light truck sales, the latter being the main driver of demand in the US.
Volvo CarsIn the second quarter of the year, retail sales grew by 1.9 per cent to 28,062 (27,539) units. Growth was mainly driven by sales of the S60 which sold 4,621 (1,719) units, followed by an increase in XC40 and XC90 sales. The new US-produced
S60 only started reaching dealerships at the end of last year, with sales now accounting for 16.4 per cent of total retail sales. Growth was partly offset by declines in sales of the XC60, S90 and V line-up, mainly due to tariffs and realloca-tion of XC60 production which resulted in one-off delivery delay, as well as general declines in the segments where the S90 and the V line-up compete in. SUV sales amounted to 79.4 (77.6) per cent of total retail sales.
Other Volvo Cars MarketsIn other markets, Volvo Cars’ retail sales grew at 2.5 per cent to 25,560 (24,945) units with Japan, Russia, Canada and Korea remaining the biggest markets. SUV sales accounted for 71.8 (61.5) per cent of total retail sales, and growth was primarily triggered by demand for the XC40. Sales in Japan grew 6.3 per cent to 4,693 (4,415) units, mainly driven by the XC40 and the V60.
Europe China US Other
0
40
20
1401201008060
160180
200
Q4Q3 Q1 Q2 Q3 Q1 Q2Q4Q2
2017 2018 2019
Q1
Retail Sales by Market(k units)
XC V S
0
200
100
700600500400300
800900
1,000
0
20
10
7060504030
8090
100
2018 LTM Q1 2019
2017 LTM Q2 2019
ISO Q2 2019
Retail Sales by Carline(k units) %

VOLVO CAR GROUP
6 OF 26INTERIM REPORT SECOND QUARTER AND FIRST SIX MONTHS 2019 | GOTHENBURG JULY 17 TH 2019
Sales and Market DevelopmentFirst Six Months
Volvo Cars’ sold 340,826 (317,639) units, an increase of 7.3 per cent year-on-year, following double digit growth across six of our top ten markets. SUV sales accounted for 60.7 (51.5) per cent of total retail sales. Wholesales increased by 3.8 per cent to 345,186 (332,670) units. The best-selling model for the half year remained the XC60 which grew 7.1 per cent to 97,208 (90,784) units, mainly driven by China. Demand for the XC40 remained strong across the board with retail sales reaching 61,864 (23,741) units, while sales of the XC90 remained largely flat.
EUROPE MarketThe passenger car market in Europe recorded a decline in car registrations for the first half year of 3.1 per cent. Most of the main markets declined. The exception was Germany which posted a small 0.5 per cent growth in registrations.
Volvo CarsDespite slowing passenger car sales in Europe, Volvo Cars’ sales growth remained resilient at 6.1 per cent year-over-year to 174,653 (164,614) units. SUVs accounted for 54.1 (45.5) per cent of total retail sales and increased by 26.2 per cent to 94,567 units. This drove our growth in the market, following the full introduction of the Volvo XC40 during the year. Sales of the V60 also picked up and grew 50.3 per cent. This offset contractions in the remaining V cars as well as in the S line-up. Apart from a 26.4 per cent decline in Sweden, all main mar-kets reported growth mainly on the back of XC40 demand. CHINAMarketThe passenger car market in China declined by 9.3 per cent during the first half of the year. Despite this, the premium car market continued to grow, increasing 6.7 per cent during the period.
Volvo CarsStrong demand continued for Volvo cars in China, with retail sales growth of 10.2 per cent for the first half year to 67,741 (61,480) units. SUV sales accounted for 57.5 (43.4) per cent of total retail sales. Sales growth was mainly driven by the locally produced S90 and XC60, followed by the XC90.
USMarketTotal light vehicle sales in the US declined by 2.0 per cent in the first half year as a small growth in the light truck segment was offset by a decline in the passenger car segment.
Volvo CarsDespite a shrinking local market, retail sales in the US increased by 5.2 per cent in the first half year to 50,120 (47,622) units. SUV sales accounted for 78.1 (75.3) per cent of total retail sales. Growth was mainly driven by demand for the locally produced S60 with retail sales of 8,415 units, as cars reached dealerships only at the end of 2018. XC40 sales continued to grow reaching 8,553 (5,098) units. Growth was also supported by XC90 sales and somewhat offset by con-tractions in S90 and V line-up sales to 1,295 (3,984) and 1,241 (3,914) units, respectively.
Other Volvo Cars MarketsRetail sales growth in other markets grew 10.0 per cent to 48,312 (43,923) units, driven by strong demand for the XC40 and moderate sales growth of the XC60, V60 and XC90, off-set by declines in the S line-up as well as V40 and V90. SUV sales accounted for 71.0 (56.4) per cent of total retail sales. The largest markets were Japan, Russia and Canada. Sales in Japan grew 9.1 per cent to 9,268 (8,497) units driven by the XC40 and the V60.

VOLVO CAR GROUP
7 OF 26INTERIM REPORT SECOND QUARTER AND FIRST SIX MONTHS 2019 | GOTHENBURG JULY 17 TH 2019
Top 10Retail sales by market (units)
Q2 2019
Q2 2018 Change %
First six months
2019
First six months
2018 Change %
China 37,855 32,712 15.7 67,741 61,480 10.2
US 28,062 27,539 1.9 50,120 47,622 5.2
Sweden 17,572 23,008 –23.6 31,742 43,102 –26.4
Germany 14,440 11,012 31.1 26,142 19,799 32.0
UK 13,671 11,673 17.1 30,026 23,165 29.6
Belgium 6,399 5,195 23.2 12,872 11,157 15.4
France 5,226 4,667 12.0 10,428 9,293 12.2
Italy 5,174 4,875 6.1 10,888 9,039 20.5
Japan 4,693 4,415 6.3 9,268 8,497 9.1
Netherlands 4,609 4,048 13.9 9,841 8,963 9.8
Retail sales by model (units)Q2
2019Q2
2018 Change %
First six months
2019
First six months
2018 Change %
XC60/XC60 Classic 50,946 50,999 –0.1 97,208 90,784 7.1
XC40* 32,961 17,505 88.3 61,864 23,741 —
XC90 25,745 24,696 4.2 47,818 47,658 0.3
V60/V60 Cross Country 18,991 14,642 29.7 35,931 27,635 30.0
V40/V40 Cross Country 16,528 19,381 –14.7 33,247 41,588 –20.1
S90 14,215 15,259 –6.8 26,964 30,977 –13.0
V90/V90 Cross Country 10,623 15,743 –32.5 21,265 31,450 –32.4
S60/S60 Cross Country 9,497 12,007 –20.9 16,529 23,806 –30.6
Total 179,506 170,232 5.4 340,826 317,639 7.3
*The introduction of the new XC40 began end of 2017 only, explaining the relatively high increase in sales.

VOLVO CAR GROUP
8 OF 26INTERIM REPORT SECOND QUARTER AND FIRST SIX MONTHS 2019 | GOTHENBURG JULY 17 TH 2019
Events During the Second QuarterProduction ready base car for self-driving presented by Volvo Cars and UberA jointly developed base car ready for production was pre-sented which, when equipped with Uber’s self-driving sys-tems, is capable of driving by itself, and represents the next step in the strategic collaboration between the companies.
Battery sourcing agreements signed withCATL and LG ChemLong-term sourcing agreements with leading battery makers CATL and LG Chem were signed to ensure the supply of lithi-um-ion batteries over the coming decade for next generation Volvo car models.

VOLVO CAR GROUP
9 OF 26INTERIM REPORT SECOND QUARTER AND FIRST SIX MONTHS 2019 | GOTHENBURG JULY 17 TH 2019
Financial Summary
Research and development (MSEK)Q2
2019Q2
2018 Change %
Research and development spending –3,977 –3,751 6.0
Capitalised development costs 2,268 1,983 14.4
Amortisation and depreciation of Research and development –1,368 –1,056 29.5
Whereof additional amortisation related to technology sold to Polestar –121 — —
Research and development expenses –3,077 –2,824 9.0
Volvo Cars generated net revenue of MSEK 67,185 (66,039), an increase of 1.7 per cent. Wholesales increased by 0.8 per cent to 178,833 (177,398) units, mainly driven by the XC40. Volume, sales mix and pricing affected net revenue with MSEK –2,638, mainly related to increased price competition. Compared to prior year, license sales increased with MSEK 623 and other revenue, such as sales of used cars, parts and accessories, with MSEK 1,521. The exchange rate effect in net revenue amounted to MSEK 1,640.
Gross income amounted to MSEK 13,015 (13,061), result-ing in a gross margin of 19.4 (19.8) per cent. Cost of sales increased to MSEK –54,170 (–52,978), mainly due to higher sales volume and custom duties, as well as foreign exchange rate effects of MSEK –1,693. The net effect of foreign exchange rate movements in gross income was MSEK –53. The decrease in gross margin compared to second quarter last year was driven by the increase in duties and continuous price competition in certain markets, partly offset by license sales.
Research and development expenses increased to MSEK –3,077 (–2,824). The increase was driven by amortisations of previously capitalized product development as well as increased research expenses as Volvo Cars continues to invest in technology to drive long-term growth. Furthermore, expenses increased due to additional amortisation related to technology sold to Polestar. For details regarding research and development expenses, see table below.
SECOND QUAR TER 2019 – INCOME AND RESULTThe comparative figures refer to the consolidated income statement of the second quarter 2018 if not otherwise stated.
Selling and administrative expenses increased slightly to MSEK –6,607 (–6,424). The increase was mainly driven by administrative expenses that increased to MSEK –2,323 (–1,998) related to personnel and consultants. The increase in administrative expenses was partly offset by lower selling expenses of MSEK 4,284 (4,426), driven by a decrease in advertising and sales promotion.
Other operating income and expense, net, amounted to MSEK –703 (285). The decrease was mainly due to expenses related to early phase-out of certain components and a decrease in government grants to MSEK 53 (143). Foreign exchange rate effects on operating assets and liabilities amounted to MSEK –225 (134).
Operating income (EBIT) decreased to MSEK 2,600 (4,226). EBIT margin decreased to 3.9 (6.4) per cent, mainly as a result of the decrease in gross margin and in received government grants of MSEK –520, offset by a net effect of MSEK 510 related to sold licences. The net effect of foreign exchange rate in EBIT was MSEK –595.
Net financial items amounted to MSEK –339 (–339). The effective tax rate increased to 38.4 (22.9) per cent
mainly due to tax adjustments related to prior years. Net income amounted to MSEK 1,393 (2,996). Net income in relation to net revenue was 2.1 (4.5) per cent.

VOLVO CAR GROUP
10 OF 26INTERIM REPORT SECOND QUARTER AND FIRST SIX MONTHS 2019 | GOTHENBURG JULY 17 TH 2019
Changes to Net revenue (MSEK)
Net revenue Q2 2018 66,039
Volume, sales mix and pricing –2,638
Sale of licences 623
Foreign exchange rates 1,640
Other 1,521
Net revenue Q2 2019 67,185
Change % 1.7
Net revenue, MSEK
Net Revenue & Gross Margin
0
40,000
30,000
20,000
10,000
50,000
60,000
80,000
70,000
30%
35%
40%
25%
20%
15%
10%
5%
0%Q4Q3 Q1 Q2Q2
2016 2017 2018 2019
Q1 Q3 Q4 Q1 Q2 Q3 Q4 Q1 Q2
Gross margin, % Operating income (EBIT), MSEK
Operating Income & EBIT Margin
0
3,000
2,500
2,000
1,500
1,000
500
3,500
4,000
4,500
8%
9%
7%
6%
5%
4%
3%
2%
1%
0%
EBIT margin, %
Q4Q3 Q1 Q2Q2
2016 2017 2018 2019
Q1 Q3 Q4 Q1 Q2 Q3 Q4 Q1 Q2
Changes to Operating income (EBIT) (MSEK)
EBIT Q2 2018 4,226
Volume, sales mix and pricing –1,115
Sale of licenses 510
Government grants –520
Foreign exchange rates –595
Other 94
EBIT Q2 2019 2,600
Change % –38.5

VOLVO CAR GROUP
11 OF 26INTERIM REPORT SECOND QUARTER AND FIRST SIX MONTHS 2019 | GOTHENBURG JULY 17 TH 2019
Research and development (MSEK)
First six months
2019
First six months
2018 Change %
Research and development spending –8,120 –6,592 23.2
Capitalised development costs 4,662 3,830 21.7
Amortisation and depreciation of Research and development –2,846 –2,132 33.5
Whereof additional amortisation related to technology sold to Polestar –362 — —
Research and development expenses –6,304 –4,894 28.8
Volvo Cars net revenue increased by 5.9 percent to MSEK 130,095 (122,852), mainly driven by sales in China, UK and Germany. Wholesales increased by 3.8 per cent to 345,186 (332,670) units, mainly driven by the XC40. Volume, sales mix and pricing contributed to net revenue of MSEK 350, reflecting the positive sales development, but with continu-ous price competition in certain markets. Compared to prior year, sold licenses increased with MSEK 871, and other reve-nue, such as sales of used cars, parts and accessories, increased with MSEK 2,032. The exchange rate effect in net revenue amounted to MSEK 3,990.
Gross income increased to MSEK 25,007 (24,487), result-ing in gross margin of 19.2 (19.9) per cent. The cost of sales increased to MSEK –105,088 (–98,365), mainly due to higher sales volume, and custom duties, as well as foreign exchange rate effects of MSEK –4,011. The net effect of for-eign exchange rate in gross income was MSEK –21. The decrease in gross margin compared to first six months last year was mainly due to the increase in duties and continuous price competition in certain markets, offset by sale of licenses of MSEK 871.
Research and development expenses increased to MSEK –6,304 (–4,894). The increase was driven by amortisation of previously capitalized product development as well as increased research expenses as Volvo Cars continues to invest in technology to drive long-term growth. Furthermore, expenses increased due to additional amortisation related to technology sold to Polestar. For details regarding research and development expenses, see table below.
Selling and administrative expenses increased to MSEK –12,775 (–12,153). The increase was mainly driven by admin-
FIRST SIX MONTHS 2019 – INCOME AND RESULTThe comparative figures refer to the consolidated income statement of the first six months 2018 if not otherwise stated.
istrative expenses of MSEK –4,702 (–3,723) related to per-sonnel and consultants. The increase in administrative expenses was partly offset by lower selling expenses of MSEK –8,073 (–8,430), driven by a decrease in advertising and sales promotion.
Other operating income and expense, net, amounted to MSEK –356 (242). The decrease was mainly related to expenses for early phase-out of certain components. Foreign exchange rate effects on operating assets and liabilities amounted to MSEK 188 (198).
Operating income (EBIT) decreased to MSEK 5,519 (7,842). EBIT margin decreased to 4.2 (6.4) per cent, mainly as a result of the decrease in gross margin and in received government grants of MSEK –1,390, offset by a net effect of MSEK 510 related to sold licences. The net effect of foreign exchange rate in EBIT was MSEK –470.
Net financial items amounted to MSEK –555 (–517). The effective tax rate increased to 31.5 (24.2) per cent
mainly due to tax adjustments related to prior years. Net income amounted to MSEK 3,398 (5,554). Net income in relation to net revenue was 2.6 (4.5) per cent.
Changes to Net revenue (MSEK)
Net revenue First six months 2018 122,852
Volume, sales mix and pricing 350
Sale of licences 871
Foreign exchange rates 3,990
Other 2,032
Net revenue First six months 2019 130,095
Change % 5.9
Changes to Operating income (EBIT) (MSEK)
EBIT First six months 2018 7,842
Volume, sales mix and pricing –480
Sale of licenses 510
Government grants –1,390
Foreign exchange rates –470
Other –493
EBIT First six months 2019 5,519
Change % –29.6

VOLVO CAR GROUP
12 OF 26INTERIM REPORT SECOND QUARTER AND FIRST SIX MONTHS 2019 | GOTHENBURG JULY 17 TH 2019
CASH FLOWCash flow from operating and investing activities amounted to MSEK 1,581 (3,636).
Cash flow from operating activities amounted to MSEK 7,073 (8,809). The positive cash flow from operating activi-ties consists of positive operating income of MSEK 2,600 (4,226), adjusted for depreciation and amortisation of MSEK 3,937 (3,347) together with income tax paid of MSEK –1,775 (–1,732), and a positive change in working capital of MSEK 2,708 (4,315).
The positive effect in cash flow from working capital was mainly related to increased current liabilities, reflecting increased volumes of cars held under operating leases . The positive effect was partly offset by increased inventory and an increase in receivables, mainly related to sold licenses.
Cash flow from investing activities amounted to MSEK –5,492 (–5,173). Investments in property, plant and equip-ment amounted to MSEK –3,131 (–3,510), mainly driven by investments in car and engine production capacity as well as tooling. Investments in intangible assets amounted to MSEK –2,379 (–2,152) as a result of continuous investments in new and upcoming car models and new technology.
Cash flow from financing activities amounted to MSEK 3,698 (5,405) and is mainly related to bond issuances, which had a positive cash flow effect of MSEK 6,224 (—). This has been partly offset by repayments of liabilities to credit institu-tions of MSEK –930 (–476) and investments in marketable securities of MSEK –1,603 (2,467).
SECOND QUAR TER 2019 – CASH FLOWThe presented figures refer to the consolidated figures for the second quarter 2019 if not otherwise stated. The comparative figures for the cash flow items refer to the consolidated cash flow statement for the second quarter 2018 if not otherwise stated. The comparative figures for the balance sheet items refer to the consolidated balance sheets of December 31, 2018 if not otherwise stated.
Cash flow statement (MSEK)Q2
2019Q2
2018 Change %
Cash flow from operating activities 7,073 8,809 –19.7
Cash flow from investing activities –5,492 –5,173 –6.2
Cash flow from operating and investing activities 1,581 3,636 –56.5
Cash flow from financing activities 3,698 5,405 –31.6
Cash flow for the period 5,279 9,041 –41.6

VOLVO CAR GROUP
13 OF 26INTERIM REPORT SECOND QUARTER AND FIRST SIX MONTHS 2019 | GOTHENBURG JULY 17 TH 2019
CASH FLOWCash flow from operating and investing activities amounted to MSEK –2,759 (850). Cash flow from operating activities amounted to MSEK 8,331 (11,392). The change is due to the positive operating income of MSEK 5,519 (7,842), adjusted for depreciation and amortisation of MSEK 7,781 (6,594) together with tax paid of MSEK –2,673 (–2,733), and a neg-ative working capital development of MSEK –957 (366).
Cash flow from working capital includes increased inven-tory of MSEK –5,240 (–6,005), as the Group continues to increase sales volumes. A change in logistics flows has also led to increased inventory turnover. Further, increased accounts receivable has a negative effect of MSEK –1,931 (–1,816) due to increased sales and sold licenses to Polestar. Increase of contract liabilities has generated a positive work-ing capital of MSEK 3,889 (3,661) reflecting increased sales generated obligations and increased volumes of sales under operating lease. Other working capital assets and liabilities have a net positive effect on working capital with MSEK 2,571 (3,543) mainly related to increased personnel related liabilities.
Cash flow from investing activities amounted to MSEK –11,090 (–10,542). Investments in tangible assets amounted to MSEK –5,998 (–6,842) and is mainly driven by invest-ments related to the launch and ramp up of production of new car models, such as the XC40 and the S60 as well as engines. Investments in intangible assets amounted to MSEK –5,207 (–4,306) as a result of continuous investments in new and upcoming car models and new technology.
Cash flow from financing activities amounted to MSEK 1,565 (974) mainly related to proceeds from bonds issued of MSEK 8,221 (—). This has been partly offset by repayments of liabilities to credit institutions and other interest bearing liabilities of MSEK –2,154 (–6,410), dividends paid to share-holders of MSEK –2,894 (–63) and investments in marketa-ble securities (net) of –2,705 (3,724).
Total cash and cash equivalents including marketable secu-rities have increased to MSEK 44,496 (41,747). Net cash decreased to MSEK 12,521 (18,029). Including undrawn credit facilities of MSEK 13,730 (13,328), liquidity is at MSEK 58,226 (55,075).
FIRST SIX MONTHS 2019 – CASH FLOW AND EQUIT YThe presented figures refer to the consolidated figures for the six first months 2019 if not otherwise stated. The comparative figures for the cash flow items refer to the consolidated cash flow statement for the first six months 2018 if not otherwise stated. The comparative figures for the balance sheet items refer to the consolidated balance sheets of December 31, 2018 if not otherwise stated.
Cash flow statement (MSEK)
First six months
2019
First six months
2018 Change %
Cash flow from operating activities 8,331 11,392 –26.9
Cash flow from investing activities –11,090 –10,542 5.2
Cash flow from operating and investing activities –2,759 850 –424.6
Cash flow from financing activities 1,565 974 60.7
Cash flow for the period –1,194 1,824 –165.5
EQUIT YTotal equity decreased to MSEK 59,470 (61,251), resulting in an equity ratio of 25.4 (29.0) per cent. The change is attribut-able to the positive net income of MSEK 3,398 and capital injection into joint venture under common control of MSEK 606, partly offset by negative effects in other comprehensive income. The latter is related to change in cash flow hedge reserve of MSEK –2,434 (net of tax), mainly due to a weak-ened SEK against USD and GBP, and re-measurements of provisions for post-employment benefits of MSEK –1,626 (net of tax) due to changes in actuarial assumptions. This has partly been offset by a positive foreign exchange translation effect, including hedges of net investments in foreign opera-tions of MSEK 1,169 (net of tax).
Dividend of MSEK 2,894 has been paid to shareholders, whereof MSEK 125 was distributed to the holders of prefer-ence shares.

VOLVO CAR GROUP
14 OF 26INTERIM REPORT SECOND QUARTER AND FIRST SIX MONTHS 2019 | GOTHENBURG JULY 17 TH 2019
SIGNIFICANT EVENTS AF TER THE REPOR TING PERIOD
Changes to the Executive Management TeamVolvo Cars announced that effective October 1st 2019, Carla De Geyseleer will succeed Hans Oscarsson as CFO and Sen-ior Vice President Finance.
RISKS AND UNCER TAINT Y FAC TORSRisks are a natural element in all business activities, risk miti-gation is as well. As an example, our reaction to higher tariffs is to adjust prices in certain markets, reallocate vehicles to other markets, as well as reallocate production. In order to achieve Volvo Cars’ short- and long-term objectives, enterprise risk management is part of the daily activities at Volvo Cars. For a more in-depth analysis of risks, see the Volvo Car Group Annual Report 2018 page 82.
Volvo Cars is continuously considering various capital mar-ket options.
OUTLOOK 2019
We expect continued growth in sales and revenue, as we benefit from a fully renewed product portfolio and increased production capacity. We expect market conditions to put continued pressure on margins. Volume growth and initiated cost actions are expected to strengthen the profit in the second half of the year compared with the same period last year. After an intense period of investments in our global footprint and new technol-ogies, we foresee a slightly lower level of capital expenditure.
This report contains statements concerning, among other things, Volvo Car Group’s financial condition and results of operations that are forward-looking in nature. Such statements are not historical facts but, rather, represent Volvo Car Group’s future expectations. Volvo Car Group believes that the expec-tations reflected in these forward-looking statements are based on reasonable assumptions, however, forward-looking statements involve inherent risks and uncertainties, and a number of important factors could cause actual results or out-comes to differ materially from those expressed in any
EMPLOYEESDuring the second quarter, Volvo Car Group employed on average 42,100 (41,700) full-time employees. Furthermore, the Group employed on average 4,600 (4,300) consultants. Volvo Car Group continues the development of future tech-nologies such as electrification and autonomous driving, as well as development of current and future car models.
PARENT COMPANYThe parent company conducts no operations and has no employees. The income statements and balance sheets for the parent company are presented on page 21.
forward-looking statement. Such important factors include, but may not be limited to: Volvo Car Group’s market position, growth in the automotive industry, and the effects of competi-tion and other economic, business, competitive and/or regula-tory factors affecting the business of Volvo Car Group, its asso-ciated companies and joint ventures, and the automotive industry in general. Forward-looking statements speak only as of the date they were made and, other than as required by applicable law, Volvo Car Group undertakes no obligation to update any of them in light of new information or future events.

15 OF 26INTERIM REPORT SECOND QUARTER AND FIRST SIX MONTHS 2019 | GOTHENBURG JULY 17 TH 2019

16 OF 26INTERIM REPORT SECOND QUARTER AND FIRST SIX MONTHS 2019 | GOTHENBURG JULY 17 TH 2019
VOLVO CAR GROUP
Consolidated Income Statements
MSEK Note Q2
2019Q2
2018
First six months
2019
First six months
2018Full year
2018
Net revenue 2 67,185 66,039 130,095 122,852 252,653
Cost of sales –54,170 –52,978 –105,088 –98,365 –202,127
Gross income 13,015 13,061 25,007 24,487 50,526
Research and development expenses –3,077 –2,824 –6,304 –4,894 –12,098
Selling expenses –4,284 –4,426 –8,073 –8,430 –17,371
Administrative expenses –2,323 –1,998 –4,702 –3,723 –8,001
Other operating income 386 790 1,453 1,345 3,386
Other operating expenses –1,089 –505 –1,809 –1,103 –2,324
Share of income in joint ventures and associates –28 128 –53 160 67
Operating income 2,600 4,226 5,519 7,842 14,185
Financial income 108 54 255 167 407
Financial expenses –447 –393 –810 –684 –1,675
Income before tax 2,261 3,887 4,964 7,325 12,917
Income tax –868 –891 –1,566 –1,771 –3,136
Net income 1,393 2,996 3,398 5,554 9,781
Net income attributable to
Owners of the parent company 739 2,161 2,166 4,242 6,840
Non-controlling interests 654 835 1,232 1,312 2,941
1,393 2,996 3,398 5,554 9,781

17 OF 26INTERIM REPORT SECOND QUARTER AND FIRST SIX MONTHS 2019 | GOTHENBURG JULY 17 TH 2019
VOLVO CAR GROUP
MSEKQ2
2019Q2
2018
First six months
2019
First six months
2018Full year
2018
Net income for the period 1,393 2,996 3,398 5,554 9,781
Other comprehensive income
Items that will not be reclassified subsequently to income statement:
Remeasurements of provisions for post-employment benefits –1,110 –1,871 –2,069 –1,378 –1,925
Tax on items that will not be reclassified to income statement 219 403 443 284 404
Items that may be reclassified subsequently to income statement:
Translation difference on foreign operations –421 567 1,298 1,847 805
Translation difference of hedge instruments of net investments in foreign operations –50 81 –165 –102 –16
Change in fair value of cash flow hedge related to currency and electricity risks 457 –3,896 –3,559 –4,912 –3,236
Currency and electricity risk hedge contracts recycled to income statement 210 –163 497 –251 –603
Tax on items that may be reclassified to income statement –122 824 664 1,106 815
Other comprehensive income, net of income tax –817 –4,055 –2,891 –3,406 –3,756
Total comprehensive income for the period 576 –1,059 507 2,148 6,025
Total comprehensive income attributable to
Owners of the parent company 114 –2,032 –1,056 353 2,965
Non-controlling interests 462 973 1,563 1,795 3,060
576 –1,059 507 2,148 6,025
Consolidated Comprehensive Income

18 OF 26INTERIM REPORT SECOND QUARTER AND FIRST SIX MONTHS 2019 | GOTHENBURG JULY 17 TH 2019
VOLVO CAR GROUP
Consolidated Balance Sheets
MSEK NoteJune 30,
2019Dec 31,
2018
ASSETSNon-current assets
Intangible assets 31,038 29,626
Property, plant and equipment 1 69,879 61,208
Assets held under operating leases 2,829 2,523
Receivables on parent company 54 54
Investments in joint ventures and associates 7,442 7,003
Other long-term securities holdings 250 190
Deferred tax assets 7,209 6,586
Other non-current assets 3 2,779 2,982
Total non-current assets 121,480 110,172
Current assets
Inventories 41,397 35,163
Accounts receivable 4 15,903 13,704
Current tax assets 1,207 573
Other current assets 3 9,552 9,875
Marketable securities 3 4,235 1,577
Cash and cash equivalents 3 40,261 40,170
Total current assets 112,555 101,062
TOTAL ASSETS 234,035 211,234
EQUITY & LIABILITIESEquity
Equity attributable to owners of the parent company 50,895 52,873
Non-controlling interests 8,575 8,378
Total equity 59,470 61,251
Non-current liabilities
Provisions for post-employment benefits 10,704 8,425
Deferred tax liabilities 1,253 1,688
Other non-current provisions 6,845 6,189
Liabilities to credit institutions 3 7,536 8,273
Bonds 3 21,836 13,200
Non-current contract liabilities to customers 4,908 4,184
Other non-current interest bearing liabilities 1 5,297 —
Other non-current liabilities 3 5,581 4,609
Total non-current liabilities 63,960 46,568
Current liabilities
Current provisions 6,641 6,936
Liabilities to credit institutions 3 2,555 2,175
Current contract liabilities to customers 19,636 17,511
Accounts payable 4 43,510 43,633
Current tax liabilities 929 1,645
Other current interest bearing liabilities 1 1,046 —
Other current liabilities 3, 4 36,288 31,515
Total current liabilities 110,605 103,415
TOTAL EQUITY & LIABILITIES 234,035 211,234

19 OF 26INTERIM REPORT SECOND QUARTER AND FIRST SIX MONTHS 2019 | GOTHENBURG JULY 17 TH 2019
VOLVO CAR GROUP
Condensed Changes in Consolidated Equity
MSEKJune 30,
2019June 30,
2018Dec 31,
2018
Opening balance 61,251 54,660 54,660
Net income for the period 3,398 5,554 9,781
Other comprehensive income, net of income tax –2,891 –3,406 –3,756
Total comprehensive income 507 2,148 6,025
Group contributions — — 418
Capital contribution from non-controlling interests — 662 662
Divestment of non-controlling interests — — –1,288
Change in the Group’s composition — — –5
Capital injection into joint venture under common control1) 606 — 846
Dividend to shareholders –2,894 –63 –67
Transactions with owners –2,288 599 566
Closing balance 59,470 57,407 61,251
Attributable to
Owners of the parent company 50,895 49,019 52,873
Non-controlling interests 8,575 8,388 8,378
Closing balance 59,470 57,407 61,251
1) Refers to the effect of Geely’s capital injection into Polestar, see Note 4 – Related party transactions.

20 OF 26INTERIM REPORT SECOND QUARTER AND FIRST SIX MONTHS 2019 | GOTHENBURG JULY 17 TH 2019
VOLVO CAR GROUP
Consolidated Statement of Cash Flows
MSEKQ2
2019Q2
2018
First six months
2019
First six months
2018Full year
2018
OPERATING ACTIVITIESOperating income 2,600 4,226 5,519 7,842 14,185
Depreciation and amortisation of non-current assets 3,937 3,347 7,781 6,594 14,408
Interest and similar items received 106 90 255 167 408
Interest and similar items paid –219 –269 –465 –315 –818
Other financial items –223 –5 –250 19 –203
Income tax paid –1,775 –1,732 –2,673 –2,733 –4,132
Adjustments for other items not affecting cash flow –61 –1,163 –879 –548 –1,127
4,365 4,494 9,288 11,026 22,721
Movements in working capital
Change in inventories –2,158 170 –5,240 –6,005 –3,706
Change in accounts receivable –731 –1,038 –1,931 –1,816 –2,627
Change in accounts payable –59 607 –284 2,257 4,372
Change in provisions 789 –672 38 –1,274 –608
Change in contract liabilities to customers 2,388 2,802 3,889 3,661 6,093
Change in other working capital assets/liabilities 2,479 2,446 2,571 3,543 1,724
Cash flow from movements in working capital 2,708 4,315 –957 366 5,248
Cash flow from operating activities 7,073 8,809 8,331 11,392 27,969
INVESTING ACTIVITIESInvestments in shares and participations, net* –31 240 55 271 –1,565
Dividend received from joint ventures and associates 49 240 49 240 240
Investments in intangible assets –2,379 –2,152 –5,207 –4,306 –8,487
Investments in property, plant and equipment –3,131 –3,510 –5,998 –6,842 –13,574
Disposal of property, plant and equipment — 9 11 95 122
Cash flow from investing activities –5,492 –5,173 –11,090 –10,542 –23,264
Cash flow from operating and investing activities 1,581 3,636 –2,759 850 4,705
FINANCING ACTIVITIESProceeds from credit institutions 507 3,018 842 3,070 3,087
Proceeds from bond issuance 6,224 — 8,221 — —
Repayment of liabilities to credit institutions –930 –476 –1,525 –6,410 –7,354
Repayment of interest bearing liabilities –332 — –629 — —
Dividend paid to shareholders — –63 –2,894 –63 –67
Investments in marketable securities, net –1,603 2,467 –2,705 3,724 2,558
Other –168 459 255 653 1,033
Cash flow from financing activities 3,698 5,405 1,565 974 –743
Cash flow for the period 5,279 9,041 –1,194 1,824 3,962
Cash and cash equivalents at beginning of period 35,038 29,108 40,170 35,402 35,402
Exchange rate difference on cash and cash equivalents –56 732 1,285 1,655 806
Cash and cash equivalents at end of period 40,261 38,881 40,261 38,881 40,170
* Investments in shares and participations, net includes; investments in shares and participations and effects from loss of control of Polestar Group in the third quarter 2018.

21 OF 26INTERIM REPORT SECOND QUARTER AND FIRST SIX MONTHS 2019 | GOTHENBURG JULY 17 TH 2019
VOLVO CAR GROUP
Condensed Parent Company Income Statements
Condensed Parent CompanyBalance Sheets
MSEKQ2
2019Q2
2018
First six months
2019
First six months
2018Full year
2018
Administrative expenses –4 — –8 — –12
Other operating income and expense — 7 — –7 —
Operating income –4 7 –8 –7 –12
Financial income 139 87 1,746* 170 345
Financial expenses –145 –176 –246 –296 –770
Income before tax –10 –82 1,492 –133 –437
Income tax 2 –131 4 –120 –80
Net income –8 –213 1,496 –253 –517
Other comprehensive income and net income are consistent since there are no items in other comprehensive income.
* Received dividend of MSEK 1,512.
MSEK June 30,
2019Dec 31,
2018
ASSETSNon-current assets 34,157 25,543
Current assets 4,487 4,709
TOTAL ASSETS 38,644 30,252
EQUITY & LIABILITIESEquity
Restricted equity 51 51
Non-restricted equity 6,848 6,864
Total equity 6,899 6,915
Non-current liabilities 31,619 23,165
Current liabilities 126 172
Total liabilities 31,745 23,337
TOTAL EQUITY & LIABILITIES 38,644 30,252
Total assets and total equity and liabilities amounted to MSEK 38,644 (30,352). The increase is due to issued bonds of SEK 2bn and EUR 600m, listed on the Luxembourg Stock Exchange.
22 OF 26INTERIM REPORT SECOND QUARTER AND FIRST SIX MONTHS 2019 | GOTHENBURG JULY 17 TH 2019
VOLVO CAR GROUP
NOTE 1 – Accounting principles
The interim report has been prepared in accordance with IAS 34 – Interim Financial Reporting and the Swedish Annual Accounts Act. The Volvo Car Group applies International Reporting Standards (IFRS) as endorsed by the European Union. The parent company applies RFR 2 – Reporting for legal entities and the Swedish Annual Accounts Act. The accounting Principles for Volvo Car Group are, in all material aspects, consistent with those described in the Volvo Car Group Annual Report 2018 Note 1 – Accounting Principles for Volvo Car Group and the parent company respectively (available at www.volvocars.com), together with the addition in below paragraphs.
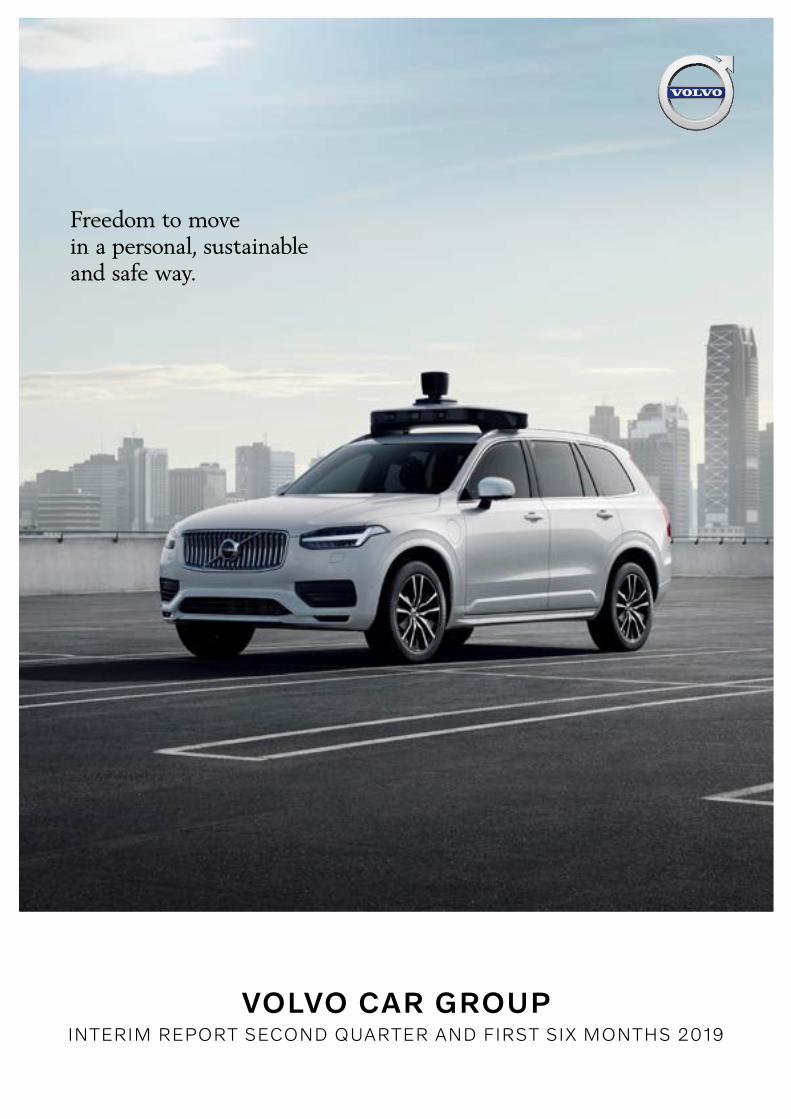
On January 1, 2019, IFRS 16 – Leasing were being applied. Accounting principles adopted are, in all material aspects, consist-ent with those described in the Volvo Car Group Annual Report 2018 Note 34 – New accounting standard implemented on January 1, 2019. As described in Note 34, IFRS 16 mainly affects the lessee and introduces a single lessee accounting model which requires a lessee to recognise assets and liabilities for all lease contracts with a term of more than 12 months, unless the underlying asset is of low value. The lessee is required to recognise a right-of-use asset representing its right to use the underly-ing leased asset and a lease liability representing its obligation to make lease payments. As described in note 34, the adoption to IFRS 16 have resulted in an increase in assets of MSEK 6,978 (as of Q2 6,473) and an increase in liabilities of MSEK 6,698 (as of Q2 6,343) from January 1, 2019. The difference is due to the land-used-rights in China that are prepaid and therefore not included as a liability. Volvo Car Group has decided to present the right-of-use asset as a part of property, plant and equipment and in Q2 2019 the right-of-use assets amounts MSEK 6,473. Please see specification below:
MSEK Whereof right-
of-use assets
Whereof adjustments to property, plant and equipment
June 30, 2019
Dec 31,2018
Property, plant and equipment 6,473 2,198 69,879 61,208
The lease liabilities related to the leasing contracts are presented as other interest bearing liabilities, as non-current and current liabilities respectively.

23 OF 26INTERIM REPORT SECOND QUARTER AND FIRST SIX MONTHS 2019 | GOTHENBURG JULY 17 TH 2019
VOLVO CAR GROUP
NOTE 2 – Net revenueNet revenue allocated to geographical regions:
MSEKQ2
2019Q2
2018
First six months
2019
First six months
2018Full year
2018
China 15,883 14,822 27,174 26,712 54,653
US 10,501 10,958 20,031 19,454 39,366
Europe 30,605 30,404 63,208 59,452 121,671
of which Sweden 6,066 7,455 12,632 14,604 28,034
of which United Kingdom 4,265 3,266 9,000 6,437 14,993
of which Germany 5,216 4,501 9,743 8,282 18,366
Other markets 10,196 9,855 19,682 17,234 36,963
of which Japan 2,006 1,724 3,759 3,059 6,593
of which Russia 982 1,021 1,619 1,499 3,554
Total 67,185 66,039 130,095 122,852 252,653
Net revenue allocated to category:
MSEKQ2
2019Q2
2018
First six months
2019
First six months
2018Full year
2018
Sales of products and related goods and services 1) 63,093 63,835 122,559 117,442 237,934
Revenue from subscription, leasing and rental busi-ness 619 679 1,120 1,165 2,087
Sales of licenses 644 21 919 48 2,542
Other Net revenue 2) 2,829 1,504 5,497 4,197 10,090
Total 67,185 66,039 130,095 122,852 252,653
1) Includes realised effect of cash flow hedge contracts amounting to MSEK –958 (–561) in the second quarter and MSEK –1,734 (–556) for the first six months.2) Other revenue mainly consists of sale of used cars and income from financial services.
NOTE 3 – Fair value of financial instruments
Valuation principles for financial instruments as described in Volvo Car Group Annual Report 2018 Note 21 – Financial risks and financial instruments, have been consistently applied throughout the reporting period. The comparative figures in this note refer to December 31, 2018.
In Volvo Car Group’s balance sheet, financial instruments reported at fair value through the income statement consist of deriv-atives, equity investments as well as commercial papers, see table ‘Financial instruments recorded at fair value through the income statement’ in this note. Fair value of financial instruments is established according to three levels, depending on market information available. All derivative financial instruments and commercial papers that Volvo Car Group holds as of June 30, 2019 belong to level 2. In level 3, the amount invested in other long-term securities holdings of MSEK 250 (190) is valued at cost, being the best approximate of fair value. No transfers between the levels of the fair value hierarchy have occurred. Valuation of financial instruments at fair value, belonging to level 2, is based on prevailing market data and on a discounting of estimated cash flows using the deposit/swap curve of the cash flow currency and include risk assumptions. For currency option instruments, the valuation is based on Black & Scholes formula. Fair value of commodity contracts is calculated by discounting the difference between the contracted forward price and the contracted forward price that can be obtained on the balance sheet date for the remaining contract period.
The total fair value of the derivative portfolio as of June 30, 2019, amounted to MSEK –5,261 (–2,235). The major part is related to cash flow hedging of currency risk. The table below shows the percentage of the forecasted cash flows that were hedged expressed in nominal terms and in Cash Flow at Risk (CFaR), which is the maximum loss at a 95 per cent confidence level in one year. The CFaR is based on the cash flow forecast, market volatility and correlations.
0–24 months 25–48 months
June 30, 2019
Dec 31,2018
June 30, 2019
Dec 31,2018
Nominal hedge % 30 33 7 8
CFaR incl. hedges % 47 51 16 19
24 OF 26INTERIM REPORT SECOND QUARTER AND FIRST SIX MONTHS 2019 | GOTHENBURG JULY 17 TH 2019
VOLVO CAR GROUP
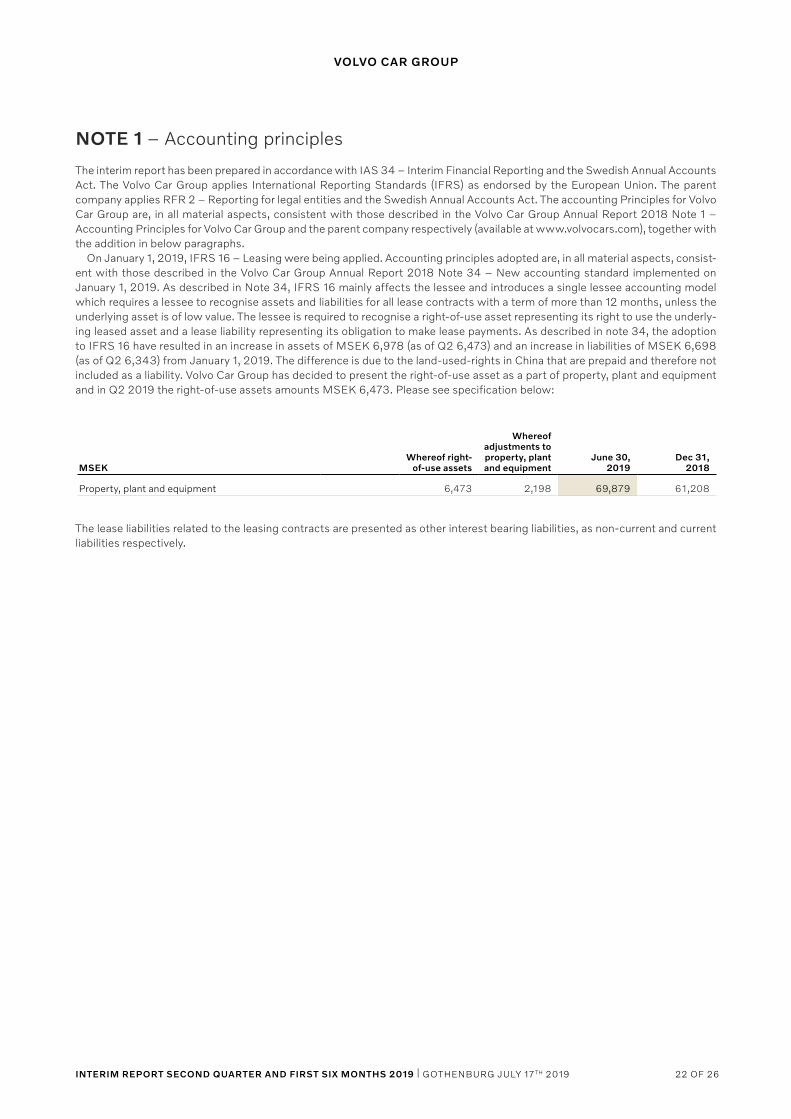
NOTE 3 – Fair value of financial instruments – continued
Financial instruments recorded at fair value through the income statement
MSEKJune 30,
2019Dec 31,
2018
Other non-current assets
Derivative assets 132 310
Other long-term securities holdings 250 190
Other current assets
Derivative assets 333 906
Marketable securities
Commercial papers 1,828 1,064
Cash and cash equivalents
Commercial papers 675 1,088
Total assets 3,218 3,558
Other non-current liabilities
Derivative liabilities 2,713 1,610
Other current liabilities
Derivative liabilities 3,013 1,841
Total liabilities 5,726 3,451
For financial liabilities valued at amortised cost, reported as current and non-current liabilities to credit institutions and as bonds, the carrying amount totalled MSEK 31,926 (23,648), see table below.
Financial liabilities valued at amortised cost Carrying amount Fair value
Carrying amount Fair value
MSEK June 30, 2019 Dec 31, 2018
Bonds and liabilities to credit institutions 31,927 32,698 23,648 23,687
Total 31,926 32,698 23,648 23,687
Carrying amount of financial liabilities recorded at amortised cost, as stated in the table above, includes the MEUR 500 bond issued in May 2016. Carrying amount of the bond is MSEK 5,289 (5,105). A fair value adjustment related to the interest compo-nent of the bond is included in the carrying amount of the bond. The fair value component of the carrying value amounts to MSEK 36 (14). Changes to fair value of the interest component of the bond is hedged through a fair value hedge by means of interest rate swaps. The interest rate component of the issued bond, level 2, is calculated by discounting the future coupon payments and face value of the bond, using the deposit/swap curve of the cash flow. The remaining bonds are recorded at amortised cost and are not subject to hedge accounting.

25 OF 26INTERIM REPORT SECOND QUARTER AND FIRST SIX MONTHS 2019 | GOTHENBURG JULY 17 TH 2019
VOLVO CAR GROUP
NOTE 4 – Related party transactions
Group companies entered into the following transactions with related parties which are not consolidated in the Group. The information in the table below includes all current assets and liabilities to related parties.
Sales of goods, services and other
MSEKQ2
2019Q2
2018
First six months
2019
First six months
2018Full year
2018
Related companies 1) 3) 4) 1,255 901 2,209 1,345 5,715
Associated companies and joint ventures 2) 244 243 499 476 981
Purchases of goods, services and other
MSEKQ2
2019Q2
2018
First six months
2019
First six months
2018Full year
2018
Related companies 1) 4) –402 –49 –673 –81 –217
Associated companies and joint ventures 2) –408 –409 –920 –899 –1,659
Receivables Payables
June 30, 2019
Dec 31,2018
June 30, 2019
Dec 31,2018
Related companies 1) 4) 8,769 7,999 3,494 4,145
Associated companies and joint ventures 2) 605 465 293 271
1) Related companies are companies within the Geely sphere of companies. 2) Associated companies and joint ventures are companies in which Volvo Car Group has a significant but not controlling influence, which generally is when Volvo Car Group holds between 20 and 50 per cent of the shares. Joint ventures within the Geely sphere of companies are reported as related companies.3) License revenue represent a value of MSEK 630 (4) in the second quarter and MSEK 884 (10) for the first six months, whereof a value of 630 (—) in
the second quarter and MSEK 871 (—) for the first six months refer to the Polestar Group. 4) Transactions with Polestar and other joint ventures within the Geely sphere, are presented as Related companies.
Investments in Polestar Group, by Geely, amounted to MRMB 900 for the first six months 2019. 50 per cent of these investments has had an effect on equity in Volvo Car Group.

26 OF 26INTERIM REPORT SECOND QUARTER AND FIRST SIX MONTHS 2019 | GOTHENBURG JULY 17 TH 2019
VOLVO CAR GROUP
GENER AL DEFINITIONS
Volvo Car Group and Volvo CarsVolvo Car AB (publ.), Volvo Car Corporation and all its subsidiaries.
Volvo Car AB (publ.), with its registered office in Gothen-burg, is majority owned (99 per cent) by Geely Sweden Hold-ings AB, owned by Shanghai Geely Zhaoyuan International Investment Co., Ltd., registered in Shanghai, China, ultimately owned by Zhejiang Geely Holding Group Ltd., registered in Hangzhou, China.
Volvo Car AB (publ.) holds shares in its subsidiary Volvo Car Corporation and provides the Group with certain financing solutions. Volvo Car AB (publ.) indirectly, through Volvo Car Corporation and its subsidiaries, operates in the automotive industry with business relating to the design, development, manufacturing, marketing and sales of cars and thereto related services. Volvo Car Group and its global operations are referred to as “Volvo Cars”.
Joint venture companiesJoint ventures refer to companies in which Volvo Car Group, through contractual cooperation together with one or more parties, has a joint control over the operational and financial management.
Gross marginGross margin is Gross income as a percentage of Net revenue and represents the per cent of total Net revenue that Volvo Cars retains after incurring the direct costs associated with producing the goods and services sold.
EBITEBIT represents earnings before interest and taxes. EBIT is synonymous with operating income which measures the profit Volvo Car Group generates from its operations.
EBIT marginEBIT margin is EBIT as a percentage of Net revenue and measures Volvo Car Group’s operating efficiency.
EBITDAEBITDA represents earnings before interest, taxes, deprecia-tions and amortisation, and is another measurement of the operating performance. It measures the profit Volvo Car Group generate from its operations without effect from previ-ous periods’ capitalisation levels.
EBITDA marginEBITDA margin is EBITDA in percentage of Net revenue.
Equity ratioTotal equity divided by total assets, is a measurement of Volvo Car Group’s long-term solvency and financial leverage.
Net cashNet cash is an indicator of Volvo Car Group’s ability to meet its financial obligations. It is represented by cash and cash equiv-alents and marketable securities less liabilities to credit institu-tions, bonds and other interest-bearing non- current liabilities.
LiquidityLiquidity consists of cash and cash equivalents, undrawn credit facilities and marketable securities.
Retail salesRetail sales refers to sales to end customers (including a por-tion of cars used as customer loaner and demo cars) and is a relevant measure of the demand for Volvo Cars from an end customer point of view.
WholesalesWholesales refers to new car sales to dealers and other cus-tomers including rentals.
EuropeEurope is defined as EU28+EFTA.
Passenger carsPassenger cars are vehicles with at least four wheels, used for the transport of passengers, and comprising no more than eight seats in addition to the driver’s seat.
Electrified vehiclesElectrified vehicles are defined as plug-in hybrids and fully elec-tric vehicles.
Performance measures disclosed in the interim report are those that are deemed to give a relevant view of Volvo Car Group’s financial performance for a reader of the interim report. For a reconciliation of performance measures, refer to page 27.
DEFINITIONS OF PERFORMANCE ME ASURES

27 OF 26INTERIM REPORT SECOND QUARTER AND FIRST SIX MONTHS 2019 | GOTHENBURG JULY 17 TH 2019
VOLVO CAR GROUP
RECONCILIATION TABLES OF PERFORMANCE ME ASURES
Gross MarginQ2
2019Q2
2018June 30,
2019June 30,
2018Full year
2018
Gross income in % of Net revenue 19.4 19.8 19.2 19.9 20.0
EBIT MarginQ2
2019Q2
2018June 30,
2019June 30,
2018Full year
2018
Operating income (EBIT) in % of Net revenue 3.9 6.4 4.2 6.4 5.6
EBITDA/EBITDA MarginQ2
2019Q2
2018June 30,
2019June 30,
2018Full year
2018
Operating income 2,600 4,226 5,519 7,842 14,185
Depreciation and amortisation of non-current assets 3,937 3,347 7,781 6,594 14,408
EBITDA 6,537 7,573 13,300 14,436 28,593
EBITDA in % of Net revenue 9.7 11.5 10.2 11.8 11.3
EQUITY RATIOJune 30,
2019Dec 31,
2018
Total equity 59,470 61,251
Total assets 234,035 211,234
Equity in % total assets 25.4 29.0
NET CASH June 30,
2019Dec 31,
2018
Cash and cash equivalents 40,261 40,170
Marketable securities 4,235 1,577
Liabilities to credit institutions (non-current) –7,536 –8,273
Bonds 1) –21,800 –13,186
Other interest-bearing non-current liabilities –84 –84
Liabilities to credit institutions (current) –2,555 –2,175
Net cash 2) 12,521 18,029
1) The bonds are presented above at amortised cost. The MEUR 500 bond is recognised in the balance sheet with a fair value adjustment and the fair value component amounted to MSEK 36 (14).
2) The net cash calculation excludes financial liabilities related to the new leasing standard IFRS 16 amounting to MSEK –6,259.
LIQUIDITYJune 30,
2019Dec 31,
2018
Cash and cash equivalents 40,261 40,170
Marketable securities 4,235 1,577
Undrawn credit facilities 13,730 13,328
Liquidity 58,226 55,075

28 OF 26INTERIM REPORT SECOND QUARTER AND FIRST SIX MONTHS 2019 | GOTHENBURG JULY 17 TH 2019
VOLVO CAR GROUP
CONTAC T
Therese Odén JandérHead of Investor [email protected]
Volvo Car Group HeadquartersSE-405 31 Gothenburgwww.volvocars.com
The President and Chief Executive Officer certifies that the interim report gives a fair view of the performance of the business, position and income statements of Volvo Car AB (publ.) and Volvo Car Group, and describes the principal risks and uncertainties to which Volvo Car AB (publ.) and the Volvo Car Group is exposed.
Gothenburg July 17th 2019
Håkan SamuelssonPresident and Chief Executive Officer
This report has not been subject to review by Volvo Car AB’s auditors.
The Volvo Car Group interim report on the third quarter 2019 will be published on October 24th 2019.
29 OF 26INTERIM REPORT SECOND QUARTER AND FIRST SIX MONTHS 2019 | GOTHENBURG JULY 17 TH 2019